
GoodHaven 2014 Semi-Annual Report
40
Semi-Annual Report May 31, 2014 GoodHaven Fund Ticker: GOODX GoodHaven Capital Management, LLC
-
Upload
canadianvalue -
Category
Documents
-
view
300 -
download
2
description
GoodHaven 2014 Semi - Annual Report
Transcript of GoodHaven 2014 Semi-Annual Report
Semi-Annual ReportMay 31, 2014
GoodHaven FundTicker: GOODX
GoodHaven Capital Management, LLC

Table of Contents
Shareholder Letter . . . . . . . . . . . . . . . . . . . . . . . . . . . . . . . . . . . . . . . . . . . . . . . . . 1
Portfolio Management Discussion and Analysis . . . . . . . . . . . . . . . . . . . . . . . . . . 11
Schedule of Investments . . . . . . . . . . . . . . . . . . . . . . . . . . . . . . . . . . . . . . . . . . . . . 16
Statement of Assets and Liabilities . . . . . . . . . . . . . . . . . . . . . . . . . . . . . . . . . . . . . 19
Statement of Operations . . . . . . . . . . . . . . . . . . . . . . . . . . . . . . . . . . . . . . . . . . . . . 20
Statements of Changes in Net Assets . . . . . . . . . . . . . . . . . . . . . . . . . . . . . . . . . . . 21
Financial Highlights . . . . . . . . . . . . . . . . . . . . . . . . . . . . . . . . . . . . . . . . . . . . . . . . 22
Notes to Financial Statements . . . . . . . . . . . . . . . . . . . . . . . . . . . . . . . . . . . . . . . . 23
Expense Example . . . . . . . . . . . . . . . . . . . . . . . . . . . . . . . . . . . . . . . . . . . . . . . . . . 32
Additional Information . . . . . . . . . . . . . . . . . . . . . . . . . . . . . . . . . . . . . . . . . . . . . . 34
Privacy Notice . . . . . . . . . . . . . . . . . . . . . . . . . . . . . . . . . . . . . . . . . . . . . . . . . . . . 35
GoodHaven Fund

6 Months 12 Months Cumulative AnnualizedEnded Ended Since Since
5/31/2014 5/31/2014 Inception* Inception*________ ________ _________ _________The GoodHaven Fund 3.32% 5.56% 48.62% 13.43%S&P 500 Index Total Return 7.62% 20.45% 55.04% 14.96%* Inception date is 4/8/2011
Performance data quoted represents past performance; past performance doesnot guarantee future results. The investment return and principal value of aninvestment will fluctuate so that an investor’s shares, when redeemed, may be worthmore or less than their original cost. Current performance of the Fund may be loweror higher than the performance quoted. Performance data current to the most recentmonth-end may be obtained by calling (855) OK-GOODX or (855) 654-6639. TheFund imposes a 2.00% redemption fee on shares redeemed within 60 days ofpurchase. Performance data for an individual shareholder will be reduced byredemption fees that apply, if any. Redemption fees are paid directly into the Fundand do not reduce overall performance of the Fund. The annualized gross expenseratio of the GoodHaven Fund is 1.10%.
June 23, 2014
Dear Fellow Shareholders of the GoodHaven Fund (the “Fund”):
In the six months ended May 31, 2014, the Fund gained approximately 3.32%but underperformed the S&P 500 Index, which gained about 7.62%. Since inceptionand through May 31, 2014, the Fund has gained approximately 48.62% compared to55.04% for the S&P 500 (roughly 13.43% on an annualized basis compared to14.96% for the index) – a period in which significant liquidity in the Fund moderatedoverall risk but also reduced returns. Given near-zero yields on “safe” securitiessuch as short-term government notes, we consider these results to be attractive on anabsolute basis and reasonable on a relative basis, particularly given the performancedrag of sizeable cash inflows last year.
Notwithstanding positive results since inception, we have been out of sync withrecent market conditions and have materially underperformed the S&P 500 Indexover the last twelve months or so – although we did make money. During thisperiod, rapidly rising stock prices coincided with a historic stretch of low volatility –making it more difficult to take advantage of mispriced securities. In addition,significant cash inflows from new shareholder subscriptions made keeping up with asteadily rising market tougher. We have made no unforced errors lately, but were, inthe aggregate, unable to capitalize on enough opportunities to outpace general indexgains, which were robust. Although never pleasant to see relative returns lag, weexpect significant variance with indexes from time-to-time and believe we are wellpositioned given today’s valuations and conditions.
1
GoodHaven Fund

Certainly, we can be criticized over the past year for being slow to reinvest cashinflows, missing one or two chances to increase the size of existing investments, andnot swinging at a couple of hittable pitches.1 Nevertheless, it seems more sensible tobe positioned to be opportunistic after indexes have nearly tripled from crisis lowsrather than attempt to chase performance by fully investing our portfolio in fairlyvalued or overpriced securities.
Moreover, there are indications of speculative behavior – about 80% of recentInitial Public Offerings (IPOs) are unprofitable companies – a level historically onlyexceeded by 1999 during the tech bubble. To paraphrase the mechanic in the FRAMoil filter ads of years past, we can look a little foolish now (by remaining disciplined),or a lot foolish later (by capitulating to the crowd).2 For us, that’s an easy choice.
As a brief digression, and with a nod of welcome to our new fellow shareholders,it’s worth a short review of what we are trying to accomplish. Both of us manage theFund with an understanding that your money is important to you and that it mayrepresent a significant part of your net worth – as it does ours. Accordingly we areconstantly trying to: 1) keep what we have; and 2) earn a reasonable return on whatwe have kept, which we believe we have accomplished to-date.
Our strategy is not to bet on the long-shot at 30-1 odds, but to bet when the oddsare heavily in our favor and the competition is hobbled. Sometimes that meanscarrying liquid reserves for an extended period of time – where criticism often risesproportionately to the bragging of one’s neighbors about recent investment prowess.In the mutual fund world, leaning into the wind is not an easy strategy and wedepend on rational shareholders who do not easily succumb to either panic oreuphoria. In other words, we are glad to have you as our investment partners.
In our view, it often pays to avoid crowd behavior and to question conventionalwisdom, although in doing so we must be vigilant that our logic is neither flawed norarrogant. We are attracted to stress and securities under pressure, usuallyaccompanied by negative headlines and someone telling us we are stupid. Too muchexuberance or too few securities under pressure means that patience should rule theday. When pessimism is rampant and business valuations offer high returns, we wantto be greedy.
By a number of measures, equity indexes today appear to be somewherebetween fairly valued and expensive. This does not mean that opportunities don’texist or that new ones won’t appear, just that investors should be acting more like a__________1 There is no such thing as investment perfection over time – and it feels unseemly to complain aboutdouble digit absolute returns since inception regardless of index performance. Nevertheless, some self-flagellation is always appropriate and a good exercise in avoiding hubris. Looking in the rear viewmirror, we could have done better.
2 From FRAM Corporation’s “pay now or pay later” ads, see: http://youtu.be/FNAt3n5pLh8 orhttp://youtu.be/tROR9wmupRk
2
GoodHaven Fund

spry and experienced octogenarian who has been knocked around a few times ratherthan an exuberant teenager with lots of energy but limited knowledge and experience.For example, Warren Buffett has previously discussed comparing the overall value ofpublicly-traded equities to Gross Domestic Product (GDP) as a good but imperfectguide to value. In a Fortune magazine interview in 2001, Buffett said “…the marketvalue of all publicly traded securities as a percentage of the country’s business–thatis, as a percentage of Gross National Product (GNP)… has certain limitations intelling you what you need to know. Still, it is probably the best single measure ofwhere valuations stand at any given moment.”
Below is a chart comparing the Corporate Equity Valuations to GDP (essentiallyequivalent to Buffett’s GNP), one measure of the sort that Buffett was discussing:3
This chart, which ends as of the first quarter of 2014, shows the aggregate valueof Corporate Equities at a higher valuation compared to nominal GDP than at anytime in the last forty years with the exception of the valuation extreme which peakedin early 2000. The forty-year mean, a period with both sky-high and ultra-lowinterest rates, is nearly 40% below recent levels. Other valuation indicators are alsosuggesting caution.__________3 Chart courtesy of dshort.com, reprinted with permission. SD refers to standard deviation.
3
GoodHaven Fund

Notwithstanding broad measures, no single indicator ever suggests that a stockmarket decline is imminent – we have no crystal ball and make no prediction. It ispossible that current valuations are supported by a combination of very strongcorporate profits and low interest rates as far as the Fed can see. It is also possiblethat corporate stock buybacks will continue at their recently ferocious pace or thatObamacare will relieve large corporations of significant operating expenses.Nevertheless, we are skeptical. Record profit margins tend to be means-reverting inour modified capitalist system, suggesting that “normalized” corporate earnings maybe well below recently reported levels. Any impact on corporate profits or cashflows would likely reduce repurchases as would a stock market decline, which tendsto freeze corporate managers. Either would create opportunities for us.
Central banks around the world have been engaged for nearly six years in amassive and unprecedented effort to pull economic activity forward by encouragingborrowing and spending while punishing savers with near-zero returns.4 Thequestion that nobody seems to ask is “but what happens tomorrow?” One effect ofultra-low rates we have not discussed previously is how they tend to depress profitmargins over time. When an industry’s weakest competitors can borrow largeamounts of near-costless capital, how can any profitable business expect to maintainmargins over time? Near-zero rates are not without costs.
Although profit margin erosion may not yet be obvious – perhaps blunted bycorporate mergers and repurchases of stock rather than expansion of productivecapacity – we believe the result over time is likely to be a sort of Gresham’s law forprofitability.5 Weak competitors hang on longer than they deserve, industry capacityexpands, pricing stays depressed for longer than it should, all participants areencouraged to add leverage, and the Darwinian aspects of capitalism are preventedfrom reallocating capital from bad managers and lousy investors to those who canemploy it more sensibly. Should such developments become widespread, the valueof public companies is likely to erode.
Another negative side effect of low interest rates is further accumulation of debtby both governments and corporations. It’s hard to believe, but today’s debt levelsare now significantly higher than before the most recent financial crisis – there hasbeen no deleveraging except in a few narrow categories. Many corporations and__________4 Not satisfied with interest rate manipulation and the outright purchase of trillions of government debt,government agency debt, and mortgage debt, some central banks have become major holders ofcorporate equities. See the Financial Times: Central Banks Shift Into Shares As Low Rates HitRevenues. http://www.ft.com/cms/s/0/d9dfad02-f462-11e3-a143-00144feabdc0.html
5 There are a large and increasing number of corporate stock buybacks that make little financial sense tous, and seem to exist only to assuage the conscience of management and boards that they are doing rightby their shareholders. It’s worth noting that in early 2009, near the bottom of the crisis when stockswere truly dirt cheap and the repurchase math compelling, stock buybacks were few and far between.
4
GoodHaven Fund

governments remain unusually sensitive to any possible rate increase.6 Central bankinterference has created a sort of Alice-in-Wonderland borrowing world where badcredits are good, good credits are bad, and nothing is as it seems.7 Junk bondissuance is at record highs, spreads are near record lows, and fixed income investorsseem to believe that bond covenants are no longer necessary. In addition, we arebeginning to see issuance of payment-in-kind bonds, a speculative security whereinterest is paid not in cash, but in additional debt.
Servicing large and growing debts has also caused government dependency onlow interest rates, with important implications for future budget constraints andpossible currency issues. Today it is increasingly difficult to identify the one–eyedking in the land of the sovereign blind. Many countries seem to desire lower fiatcurrency values in order to support exports and create inflation. It is tough todetermine which of these currencies, if any, are likely to prove a reasonable store ofvalue over time. If author Tom Wolfe were to pen a new financial novel, it might betitled, “The Bonfire of the Currencies.”
Perhaps the most pernicious (and unintended) consequence of recent Fed policyis the shaking of confidence in the U.S. dollar as the world’s reserve currency. Notonly have Russia and China moved to diversify dollar holdings and purchase largequantities of precious metals, obscure central authorities such as the Bank of Nigeriahave sold dollars to buy Chinese Yuan and other countries are implementing bilateraltrade agreements settling in currencies other than the greenback. Although we do notbelieve the dollar will be easily supplanted in the near term, it seems reasonable toexpect further erosion in the value of what it will purchase over time as the supply ofdollars increases while demand for trade dollars ebbs – engendering a form ofinflation or its kissing cousin – devaluation.8 These developments would appear tobe long-term negatives for most forms of low-yielding fixed income securities andbullish for currency alternatives.
As Buffett has said, the market exists to serve investors, not to guide them.9
Although there is much in today’s financial world to be concerned about, we remainbelievers that securities markets will give rational and intelligent investors sensible__________6 For brevity’s sake, we will not discuss derivatives here. However, we suspect that Warren Buffett’s“financial weapons of mass destruction” remain a systemic risk, given both notional and net valuescompared to the capital of the major derivative counterparties.
7 Around June 9, 2014, yields on long-term Spanish government bonds fell below those of U.S. long-termgovernment bonds. Pardon our ignorance, but we are at a loss to explain the relative credit dynamics.
8 Although there is debate as to the extent to which the dollar has depreciated since the formation of theFederal Reserve in 1913 (some argue 90+ percent, while others think the total far smaller), it is hard tofind anyone who believes there has been no depreciation. The Federal Reserve System of Banks is quitedependent on at least modest inflation – deflation tends to be corrosive to lenders with little capitalcompared to loans (or derivatives).
9 Berkshire Hathaway 1987 Annual Report: Letter to Shareholders.
5
GoodHaven Fund

investment opportunities if they search diligently and wait patiently for securitiesthey understand that seem priced right. Furthermore, we believe we own a numberof securities of businesses that are reasonably resistant to less robust businessactivity. In the aggregate, we remain confident that what we own today should beprofitable over time as we try to skate to where the puck will be rather than where ithas been.
In our view, it is risky for any investor to assume that expensive valuations willbecome more expensive, that record profit margins will persist for the foreseeablefuture, or that interest rates will remain permanently at rock-bottom levels. Morelikely, the 100-year flood will return to Wall Street as it seems to do every few years.In its wake, some juicy investment opportunities will appear as the water recedes,optimism fades, and volatility returns. Although we wish ill will on nobody, the bestopportunities usually show up after some segment of investors has suffered – and weare working hard to make sure that we’re not the ones in great pain.
Portfolio Activity
In recent months, our portfolio has continued to tilt somewhat toward businessesthat stand to benefit from price inflation or nominal currency weakness, though webelieve we paid little for those attributes. Instead, we continue to seek outundervalued businesses run by sensible people where we believe the business canprosper even if conditions do not further improve. Our portfolio does not resemblemost broad market indexes. Liquidity remains significant and we have ample abilityto behave opportunistically when conditions allow.
Our largest position – which has nearly doubled from our cost – remainsHewlett-Packard (HP). While it would be easy to take gains and call it a day withHP, we remain confident that the company and its very large cash flows are destinedfor better days. There is still significant uncertainty regarding some of HP’s endmarkets and the company’s size and worldwide presence make it vulnerable to broadeconomic downturns. However, important segments of the company seem to havestabilized with significant free cash flows. The parent company’s balance sheet isgreatly improved with zero net debt at the operating company level. We expect moreimprovement to come.
The opportunity in HP appeared not because it was a wonderful business withoutissues, but exactly because there were problems. Combined with a prior history ofmanagement and board missteps, HP became a magnet for adverse publicity after anoverpriced acquisition with poor due diligence and as growth in the market for tabletcomputers eroded purchases of laptops and desktops. Most investors becamedisgusted, feared that the entire business was rapidly eroding, and sold shares to thepoint where HP’s stock price declined by roughly 75% in about two years. Attractedby the smell of smoke, we investigated. Our conclusion: the market believed theproblems were fatal while research indicated they could be managed.
6
GoodHaven Fund

Our original thesis was that we were paying such a low price in relation to cashflow that we could earn significant profit if management could stabilize revenues atmaterially lower levels, and could earn far more if it resumed growth. The keytakeaway of our research was a conclusion that the company would continue to churnout an enormous amount of real cash flow which could be used to augment thesignificant value that remained in the customer base while also returning some cashto investors. After a period of retrenchment and greatly improved internal processes,growth now seems visible on the horizon, though the company is not quite there yet.Even modestly increasing revenues would result in a higher valuation for thecompany than seen recently. Thanks to date are due to Chief Executive MegWhitman, Chairman of the Board Ralph Whitworth, Chief Financial Officer CathyLesjak, and a host of other executives who have worked tirelessly to right the ship.
WPX Energy is a company that was spun out of Williams Companies in 2012and has now become a significant Fund holding in the energy space, along withBirchcliff Energy, Devon Energy, and Exco Resources. As a reminder, we createdour initial exposure to natural gas when prices plunged a couple of years ago. Sincethen, we believe there is ample evidence to suggest that another price plunge isunlikely in the near term. New environmental regulations, transportation changes,export terminals, and other factors are contributing to demand while harsh winterweather last year drew down storage reserves. In addition, oil and natural gas areresources that are consumed, requiring constant replenishment and replacement – apositive for pricing when demand increases. The trick for an owner of these assets isto replace reserves at a reasonable cost.
Primarily a natural gas producer, WPX also produces oil and natural gas liquids,mostly in the Piceance, Bakken, San Juan, and Williston basins. The company hasnearly five trillion cubic feet equivalent of proved reserves, about three-fourths ofwhich is natural gas with the balance split between crude oil and gas liquids – a sumthat places a significant amount of assets behind each of the company’s two hundredmillion shares outstanding. We were attracted to WPX because of its enormous butunder-developed and un-optimized asset base. The company’s primary issue was notfinding resources, but intelligently developing what it already owned. Recently, thecompany named a new CEO who we believe will be able to bring a reneweddiscipline to operations and unlock some of the value we see.
Birchcliff Energy, predominantly a natural gas producer in Canada, saw its stockprice almost double during the period. Strong production growth, efficient costcontrols, additions to reserves and higher Canadian natural gas prices have calledattention to this below the radar screen company. Despite the stock price increase, westill feel Birchcliff has more upside from recent levels.
Microsoft seems to be a bit more in favor amongst investors as of late. In ourMay 2012 semi-annual report when discussing Microsoft – which had then becomean important holding (at much lower prices than recently) we said “Microsoft has
7
GoodHaven Fund

8
GoodHaven Fund
enormous strength in enterprise software and still maintains a large market share inoperating systems worldwide…” Our views have not changed, though recently itseems the market has embraced some of our initial conclusions about Microsoft’sstrengths. In addition, we think the ascension of Satya Nadella as Microsoft’s newCEO is a positive development. Although not nearly as undervalued as it was whenwe made our purchases, we still think Microsoft’s valuation is reasonable givenprospects for both growth and cash flow.
Walter Investment’s stock has declined over the last twelve months, primarilydue to a combination of factors that we think overshadowed the company’s brightoutlook for future growth. Recent factors pressuring the stock prices of non-bankservicers include a slowing of HAMP and HARP mortgage applications, recentimprovement in home prices, particularly among less expensive properties (the high-end is now once more at record prices, thanks to the Federal Reserve), weak marketsfor new-originations, and significant regulatory actions which prevented one ofWalter’s competitors from closing a large transfer of servicing. This delay has halteda number of other transactions across the industry, pending a determination ofexactly what the regulator wants to see.
We expect that most of the issues will prove transitory, regulatory issues will beresolved, and intensified regulation of the larger non-bank servicers will prove anenormous competitive barrier to entry – we expect no new non-bank entrants into themortgage servicing space for quite some time to come. There is much evidence thatnon-bank servicers have done a better job than bank servicers and that regulatorychallenges will be overcome without incurring crippling costs. There remainshundreds of billions of dollars of servicing that we expect will flow from bank tonon-bank servicers over the next few years and Walter should get its share of newbusiness. The company is financially leveraged, but generates significant cash andhigh returns on capital deployed. Recently, Walter entered into a partner agreementto pursue new deals without employing its own balance sheet, which should allow forreduced balance sheet leverage. Walter remains a highly rated servicer of FannieMae and we believe the company’s common shares are worth well more than recentquotes. We added to our holdings in Walter while the shares were under pressureduring the period.
Since November 30, 2013, we increased our modest investment in HarbingerGroup, which was created initially when we participated in a private transaction froma forced seller. We think Harbinger’s management has done an excellent job buildingvalue. Moreover, we are deeply familiar with their largest single investment –Spectrum Brands. Accordingly, our long-term ownership of Spectrum gives uscomfort that we have some insight into valuation, which in our opinion, exceedsHarbinger’s recent public market value.
During the last six months and near 52-week lows, we initiated a meaningfulinvestment in Dundee Corporation, a Canadian company run by Ned Goodman, a

hugely successful entrepreneur. Ned and his management team have managed tocompound the share price at roughly 18% per annum over the last twenty yearsbefore a significant corporate reorganization which included the sale of one largedivision and the spin-off of another.10 Newly reconstituted, Dundee is pursuing amerchant banking strategy involving real estate, energy, precious metals, agriculture,and investment banking and management.
Dundee is a complicated company with many moving pieces, not dissimilar toLeucadia prior to its merger with Jefferies Group. In our opinion, consolidatedfinancials don’t tell the full tale and a shareholder must dig into subsidiaries anddeals – some of which have sizeable operating leverage or which representpotentially large optionality – in order to get a proper sense of valuation. Ned andhis team have a proven ability to create value and we believe our initial investmenthas been made at a discount to a conservatively calculated net asset value, which weexpect to grow. We believe an inflationary environment would certainly play to thecompany’s strengths. Our only regret so far is that we waited so long to becomepassive partners with the Goodmans and Dundee.
Although you may not have seen huge changes to our portfolio recently, we havelooked at many new and old ideas in our search for value. We are trying to findbusinesses where our confidence in operations and management suggest that we maybe able to own them for several years at a price that offers significant return. Tomake an analogy to the housing market, we are not looking for properties to flip, nothunting for “systems” offering easy money in fast transactions, and not seeking highleverage to provide an acceptable return. We are only looking for reasonably pricedhomes we can comfortably live in for the long-term or those that we can purchase fora price that should allow a fair rental return and good cash yield after all spendingnecessary to maintain the property and handle contingencies.
Not to belabor the obvious, but investing well is hard. Results are rarely smooth.Good ideas are often controversial. As Ben Graham once said, “The stock investor isneither right nor wrong because others agreed or disagreed with him; he is rightbecause his facts and analysis are right.” We continue to work hard at understandingand properly analyzing the facts. That is how we expect to continue to earn adequatereturns as well as your trust and respect.
Sincerely,
Larry Pitkowsky Keith Trauner__________10 Dundee Corporation 2013 Annual Report: Page 4.
9
GoodHaven Fund

Mutual fund investing involves risk. Principal loss is possible. The Fund is non-diversified, meaningit may concentrate its assets in fewer individual holdings than a diversified fund. Therefore, theFund is more exposed to individual stock volatility than a diversified fund. The Fund invests inmidcap and smaller capitalization companies, which involve additional risks such as limitedliquidity and greater volatility. The Fund may invest in foreign securities which involve political,economic and currency risks, greater volatility and differences in accounting methods. These risksare enhanced in emerging markets. The Fund may invest in REITs, which are subject to additionalrisks associated with direct ownership of real property including decline in value, economicconditions, operating expenses, and property taxes. Investments in debt securities typically decreasein value when interest rates rise. This risk is usually greater for longer-term debt securities.Investments in lower-rated, non-rated and distressed securities present a greater risk of loss toprincipal and interest than higher-rated securities.
Must be preceded or accompanied by a prospectus.
Cash flow is generally defined as the cash a company generates from its business operations, beforecapital or securities investments. Free cash flow is generally defined as cash revenues less all normaloperating expenses (including interest expense) and less an estimate of the capital spending necessary tomaintain the business in its current state.
The S&P 500 Index is a capitalization weighted index of 500 large capitalization stocks which is designedto measure broad domestic securities markets.
Standard deviation is generally defined in statistics and probability theory as the amount of variation ordispersion from the average.
It is not possible to invest directly in an index.
The opinions expressed are those of Larry Pitkowsky and/or Keith Trauner through the end of the periodfor this report, are subject to change, and are not intended to be a forecast of future events, a guarantee offuture results, nor investment advice. This material may include statements that constitute “forward-looking statements” under the U.S. securities laws. Forward-looking statements include, among otherthings, projections, estimates, and information about possible or future results related to the Fund, marketor regulatory developments. The views expressed herein are not guarantees of future performance oreconomic results and involve certain risks, uncertainties and assumptions that could cause actual outcomesand results to differ materially from the views expressed herein. The views expressed herein are subject tochange at any time based upon economic, market, or other conditions and GoodHaven undertakes noobligation to update the views expressed herein. While we have gathered this information from sourcesbelieved to be reliable, GoodHaven cannot guarantee the accuracy of the information provided. Anydiscussions of specific securities or sectors should not be considered a recommendation to buy or sellthose securities. The views expressed herein (including any forward-looking statement) may not be reliedupon as investment advice or as an indication of the Fund’s trading intent. Information included herein isnot an indication of the Fund’s future portfolio composition.
10
GoodHaven Fund

11
GoodHaven Fund
The unaudited Net Asset Value (“NAV”) of the GoodHaven Fund was $28.89 atMay 31, 2014, based on 21,085,468 shares outstanding. This compares to theFund’s NAV of $28.26 per share at November 30, 2013, an NAV of $24.00 atNovember 30, 2012, and an NAV of $20.00 at inception on April 8, 2011. Pleasenote that except where otherwise indicated, discussions in this MD&A relate to thesemi-annual period ended May 31, 2014. The Fund’s performance for the periodDecember 1, 2013 to May 31, 2014 was a gain of 3.32% compared to a gain of7.62% for the S&P 500 Index. For the one-year period ended May 31, 2014, theFund gained 5.56% compared to a rise of 20.45% for the S&P 500 Index. Sinceinception on April 8, 2011 and through May 31, 2014, the Fund’s cumulativeannualized performance is a gain of 48.62% (or 13.43% annualized) compared to anincrease of 55.04% (or 14.96% annualized) for the S&P 500 Index. Allcomparisons assume reinvested dividends.
The performance data quoted above represents past performance. Pastperformance does not guarantee future results. The investment return and principalvalue of an investment will fluctuate so that an investor’s shares, when redeemed,may be worth more or less than their original cost. Current performance of theFund may be lower or higher than the performance quoted. Performance datacurrent to the most recent month-end may be obtained by calling (855) OK-GOODXor (855) 654-6639. The fund imposes a 2.00% redemption fee on shares redeemedwithin 60 days of purchase. Performance data for an individual shareholder will bereduced by redemption fees that apply, if any. Redemption fees are paid directlyinto the Fund and do not reduce overall performance of the Fund.
The portfolio managers believe that short-term performance figures are lessmeaningful than a comparison of longer periods and that a long-term investmentstrategy should be properly judged over a period of years rather than weeks ormonths. Furthermore, the S&P 500 Index is an unmanaged index composedentirely of equity securities incurring no fees, expenses, or taxes and is shown solelyfor the purpose of comparing the Fund’s portfolio to an unmanaged and diversifiedindex of large companies. Below is a table of the Fund’s top ten holdings andcategories as of May 31, 2014.
PORTFOLIO MANAGEMENT DISCUSSION AND ANALYSIS (Unaudited)

12
GoodHaven Fund
Top 10 Holdings* % Top Categories** %______________ __ _____________ __Hewlett-Packard Co. 11.0% Cash and Equivalents 27.8%Walter Investment Computers &Management Corp. 5.9% Peripheral Equipment 11.9%Spectrum Brands Oil & Gas ExplorationHoldings, Inc. 5.2% & Production 10.8%Microsoft Corp. 5.2% Diversified Holding Companies 10.5%Dundee Corp. 3.9% Loan Servicing 8.2%WPX Energy, Inc. 3.9% Computer & Internet Software 7.5%Leucadia National Corp. 3.4% Consumer Products 5.2%Barrick Gold Corp. 3.3% Property/Casualty Insurance 4.8%Birchcliff Energy Ltd. 2.7% Metals & Mining 4.7%White Mountains Retailing 3.7%Insurance Group 2.6%______ ______Total 47.1% Total 95.1%______ ____________ ______* Top ten holdings excludes cash, money market funds and Government and Agency Obligations** Where applicable, includes money market funds and short-term Government and Agency Obligations
Shareholders should note that the Fund’s assets increased significantly in theprior fiscal year to approximately $553 million at November 30, 2013. In the sixmonths ended May 31, 2014, inflows continued at a much slower pace. Newsubscriptions and appreciation in the value of the Fund’s securities resulted in assetsof approximately $609 million at May 31, 2014. The amounts and rankings of theFund’s holdings today may vary significantly from the data disclosed above. Forexample, since the end of the last fiscal year, the Fund may have added to existinginvestments, sold investments, or made new investments that, in the aggregate, maybe considered material.
The Fund’s investments having the most positive impact on portfolioperformance for the six-month period ended May 31, 2014 were Hewlett-Packard,Birchcliff Energy, Spectrum Brands Holdings, WPX Energy, Microsoft, and DevonEnergy, with lesser but significant gains from a variety of other securities. Hewlett-Packard’s common shares continued to appreciate in value as the company seems tobe stabilizing with significant cash flows that are helping to fund dividends andshare repurchases as well as a larger research and development budget. BirchcliffEnergy, which declined in the prior period, rose significantly as the company wasable to increase its production at the same time that prices for Canadian natural gasincreased. Spectrum Brands rose as the company continued to generate growth infree cash flow. WPX Energy increased as the company initiated some asset sales,natural gas prices increased, and the company recruited a new CEO, who startedshortly before the end of the period. Microsoft gained as it replaced its CEO, anactivist gained a board seat, and the company attempted to broaden the base of its
PORTFOLIO MANAGEMENT DISCUSSION AND ANALYSIS (Unaudited) (Continued)

13
GoodHaven Fund
software offerings. Finally, Devon Energy increased as it was able to sell assets andreposition its activity in more desirable basins.
The Fund’s investments having the most negative impact on the portfolio forthe six-month period ended May 31, 2014 were Walter Investment Management,Staples, Sears Holdings, Leucadia National, and Dundee. Walter declined after acompetitor’s transfer of loan servicing was temporarily halted by a regulator,leading to concerns that industry growth would slow. Staples fell as the company’smargins were pressured by competition and expected benefits resulting from themerger of competitors have not yet materialized. Sears Holdings’ share pricedeclined, however the price included a significant spin-off of the shares of Land’sEnd, which were subsequently sold. Leucadia National declined but there was littlein the way of fundamental developments to offer a rational explanation. Dundeedeclined over concerns about Canadian real estate overheating as well as weaknessin precious metals.
Although management does not undertake or represent to mention all changesin positions occurring during the period except where required to do so by law orregulation, the Fund materially increased its investment in Walter InvestmentManagement, Ocwen Financial, and Dundee during the period. The Fund alsodisposed of positions in Republic Services and Seacor Holdings, and reducedholdings in Sprint during the period.
The Managers of the Fund caution shareholders that, although there are usuallysuccinct possible explanations for various price movements during the quarter,short-term price movements in various securities may occur for fundamentalreasons or may simply reflect short-term supply and demand issues independent offundamental developments. As such, we believe shareholders should be skepticalabout explanations regarding short-term price movement of any security.
Furthermore, the managers of the Fund do not believe that a decline in asecurity price necessarily means that the security is a less attractive investment. Theopposite may be the case in that price declines may represent significant investmentopportunities. We do not believe that volatility – or the bouncing around of stockprices – is the same thing as risk, which we define as the chance that an investorwill permanently lose money in an investment. It is worth noting that the managersof the Fund believe that a certain amount of volatility is desirable and allows forboth opportunistic purchases and sales of securities. Periods of low volatility, ashave occurred over the last twelve months, may be more difficult to navigate.
The Fund’s turnover rate, a measure of how frequently assets within a fund arebought and sold by the managers, remains at reasonably low levels and is consistentwith the strategies, generally long-term in nature, of GoodHaven CapitalManagement, the Fund’s investment advisor. Importantly, there may be times when
PORTFOLIO MANAGEMENT DISCUSSION AND ANALYSIS (Unaudited) (Continued)
14
GoodHaven Fund
turnover rates rise, however, we do not anticipate rapid turnover of the portfoliounder normal circumstances.
The portfolio managers believe that a significant liquidity position is animportant part of portfolio management. Since inception, the Fund has continued tohave significant liquidity available both in cash holdings as well as short-term fixedincome investments. Over time, we expect the Fund’s level of cash to varysignificantly and could be higher or lower than shown on the most recent Scheduleof Investments.
Currently, the Fund is operating with a substantial position in short-termgovernment securities, cash and equivalent investments. This position is larger thanwe would normally carry and is reflective of several factors. First, the Fundexperienced significant cash inflows due to new shareholder subscriptions duringthe prior fiscal year, much of which occurred after the stock market had alreadyexperienced a significant rally. Second, the rise in general stock prices has madebargains more difficult to find and slowed reinvestment. Third, for a variety offactors, we believe that having a cash cushion at a time of generally elevated pricesand investor ebullience is a strategic advantage. It is our intention to invest asignificant portion of current liquidity in an opportunistic manner when bargainsmeeting our investment criteria appear. However, it is possible that the Fund mayhave a significant cash position for an extended period of time if, in the opinion ofthe portfolio managers, market conditions are unfavorable. At times when liquidityis high and share prices generally seem expensive by historic indicators of value, asoccurred in the last twelve months, the Fund may underperform a strongly risingstock market. Furthermore, the portfolio managers believe that relative returns overshort periods are not a proper measurement of Fund performance. The goals of theFund remain unchanged, seeking capital appreciation without incurring outsizedrisks. To date, management believes the Fund’s overall returns since inception havebeen reasonable given liquidity and investor alternatives.
In addition, the Fund has begun to carry a portion of its cash and investments inshort-term government securities of countries other than the United States.Although under normal circumstances we would not expect any sort of default fromthe U.S. government, such defaults have been threatened on multiple occasions inrecent years. Though it is not our intention to avoid dollar denominated investmentsgenerally, we believe it is prudent to modestly diversify cash holdings. There are anumber of reasons we believe diversification is prudent, including, but not limitedto, a growing desire by non-U.S. countries to transact in currencies other than theU.S. Dollar, and central bank policies that seem explicitly designed to createinflation, which tends to reduce the value of the dollar relative to more stablealternatives. To-date, currency translation has resulted in modest losses from theseshort-term, non-U.S. holdings. Although we believe these losses will reverse over
PORTFOLIO MANAGEMENT DISCUSSION AND ANALYSIS (Unaudited) (Continued)

time, further currency translation loss is possible and a diversification of short-terminvestments does not assure a profit or protect against a loss in a declining market.Generally, we do not expect significant realized capital gain or loss from anyparticular short-term, non-U.S. investments when viewed over an extended period.
To reiterate our view on liquidity, the portfolio managers believe that a certainamount of liquidity may benefit shareholders in several ways – by preventingliquidation of securities to meet modest levels of redemptions, by providingammunition to purchase existing or new holdings in declining markets withoutbeing forced to sell existing holdings, and by lessening the chance that shareholderswill blindly seek liquidations during periods of market stress when they know thatthe Fund is less likely to be in a position where forced liquidation could adverselyimpact the net asset value of the Fund. That said, if bargains meeting our criteriaseem plentiful, we are likely to have significantly less liquidity under suchconditions than has been the case since inception.
The Fund is subject to certain risks as disclosed in the Prospectus andStatement of Additional Information, both of which may be obtained from theFund’s website at www.goodhavenfunds.com or by calling 1-855-654-6639. Someof these risks include, but are not limited to, adverse market conditions thatnegatively affect the price of securities owned by the Fund, a high level of cash,which may result in underperformance during periods of robust price appreciation,adverse movements in foreign currency relationships as a number of the Fund’sholdings have earnings resulting from operations outside the United States, and thefact that the Fund is non-diversified, meaning that its holdings are moreconcentrated than a diversified Fund and that adverse price movements in aparticular security may affect the Fund’s Net Asset Value more negatively thanwould occur in a more diversified fund.
As of May 31, 2014, the members, officers, and employees of GoodHavenCapital Management, LLC, the investment advisor to the GoodHaven Fund, ownedapproximately 182,096 shares of the Fund. It is management’s intention to disclosesuch holdings (in the aggregate) in this section of the Fund’s Annual and Semi-Annual reports on an ongoing basis.
15
GoodHaven Fund
PORTFOLIO MANAGEMENT DISCUSSION AND ANALYSIS (Unaudited) (Continued)

The accompanying notes are an integral part of these financial statements.
16
GoodHaven Fund
SCHEDULE OF INVESTMENTS at May 31, 2014 (Unaudited)
Shares COMMON STOCKS – 70.6% Value
Computer & Internet Software – 7.5%12,600 Google, Inc. – Class A1 . . . . . . . . . . . . . . . . . . . . . . . $ 7,202,79012,600 Google, Inc. – Class C1 . . . . . . . . . . . . . . . . . . . . . . . 7,068,348770,000 Microsoft Corp. . . . . . . . . . . . . . . . . . . . . . . . . . . . . 31,523,800___________
45,794,938___________
Computers & Peripheral Equipment – 11.9%2,005,400 Hewlett-Packard Co. . . . . . . . . . . . . . . . . . . . . . . . . . 67,180,900338,442 Systemax Inc.1,2 . . . . . . . . . . . . . . . . . . . . . . . . . . . . . 5,411,688___________
72,592,588___________
Consumer Products – 5.2%405,477 Spectrum Brands Holdings, Inc. . . . . . . . . . . . . . . . . 31,574,494___________
Diversified Holding Companies – 10.5%103,200 Berkshire Hathaway, Inc. – Class B1 . . . . . . . . . . . . . 13,244,688
1,597,520 Dundee Corp.1,2 . . . . . . . . . . . . . . . . . . . . . . . . . . . . . 23,823,571523,300 Harbinger Group, Inc.1 . . . . . . . . . . . . . . . . . . . . . . . 6,195,872814,082 Leucadia National Corp. . . . . . . . . . . . . . . . . . . . . . . 20,881,203___________
64,145,334___________
Financial Services – 1.3%290,300 Federated Investors, Inc. – Class B . . . . . . . . . . . . . . 8,206,781___________
Loan Servicing – 8.2%392,500 Ocwen Financial Corp.1 . . . . . . . . . . . . . . . . . . . . . . 13,764,975
1,247,756 Walter Investment Management Corp.1 . . . . . . . . . . . 36,072,626___________49,837,601___________
Marine Services & Equipment – 1.1%243,924 Stolt-Nielsen Ltd.2 . . . . . . . . . . . . . . . . . . . . . . . . . . . 6,712,307___________
Metals & Mining – 4.7%1,250,000 Barrick Gold Corp. . . . . . . . . . . . . . . . . . . . . . . . . . . 20,137,500360,000 Goldcorp, Inc. . . . . . . . . . . . . . . . . . . . . . . . . . . . . . . 8,413,200___________
28,550,700___________
Oil & Gas Exploration & Production – 10.8%1,304,700 Birchcliff Energy Ltd.1 . . . . . . . . . . . . . . . . . . . . . . . 16,183,911181,800 Devon Energy Corp . . . . . . . . . . . . . . . . . . . . . . . . . . 13,435,020
2,303,906 EXCO Resources, Inc. . . . . . . . . . . . . . . . . . . . . . . . 12,118,545

The accompanying notes are an integral part of these financial statements.
17
GoodHaven Fund
Shares COMMON STOCKS – 70.6% (Continued) Value
Oil & Gas Exploration &Production – 10.8% (Continued)
1,120,799 WPX Energy, Inc.1 . . . . . . . . . . . . . . . . . . . . . . . . . . $ 23,738,523___________65,475,999___________
Property/Casualty Insurance – 4.8%31,287 Alleghany Corp.1 . . . . . . . . . . . . . . . . . . . . . . . . . . . . 13,175,58226,962 White Mountains Insurance Group . . . . . . . . . . . . . . 15,921,600___________
29,097,182___________
Retailing – 3.7%224,900 Sears Holdings Corp.1 . . . . . . . . . . . . . . . . . . . . . . . . 9,458,170
1,145,000 Staples, Inc. . . . . . . . . . . . . . . . . . . . . . . . . . . . . . . . . 12,881,250___________22,339,420___________
Telecommunications – 0.9%580,799 Sprint Corp.1 . . . . . . . . . . . . . . . . . . . . . . . . . . . . . . . 5,546,630___________
TOTAL COMMON STOCKS(Cost $338,999,593) . . . . . . . . . . . . . . . . . . . . . . . . 429,873,974___________
GUERNSEY INVESTMENT FUND – 0.9%762,123 JZ Capital Partners Limited2 . . . . . . . . . . . . . . . . . . . 5,633,622___________
TOTAL GUERNSEY INVESTMENT FUND(Cost $4,201,658) . . . . . . . . . . . . . . . . . . . . . . . . . . 5,633,622___________
EXCHANGE TRADED NOTES – 0.7%136,387 PowerShares DB 3x Inverse
Japanese Govt Bond Futures ETN1 . . . . . . . . . . . . . 2,261,296101,074 PowerShares DB Inverse
Japanese Govt Bond Futures ETN1 . . . . . . . . . . . . . 1,893,116___________4,154,412___________
TOTAL EXCHANGE TRADED NOTES(Cost $4,439,246) . . . . . . . . . . . . . . . . . . . . . . . . . . 4,154,412___________
SCHEDULE OF INVESTMENTS at May 31, 2014 (Unaudited) (Continued)

The accompanying notes are an integral part of these financial statements.
18
GoodHaven Fund
PrincipalAmount FOREIGN GOVERNMENT SECURITIES – 8.0% Value
CAD 5,000,000 Canadian Treasury Bill,0.916%, due 6/19/20143 . . . . . . . . . . . . . . . . . $ 4,609,195
CAD 10,900,000 Canadian Treasury Bill,1.313%, due 7/3/20143 . . . . . . . . . . . . . . . . . . 10,041,066
CAD 10,000,000 Canadian Treasury Bill,1.583%, due 7/31/20143 . . . . . . . . . . . . . . . . . 9,208,337
CAD 11,000,000 Canadian Treasury Bill,1.226%, due 8/14/20143 . . . . . . . . . . . . . . . . . 10,125,621
NOK 90,000,000 Norwegian Treasury Bill,1.440%, due 9/17/20143 . . . . . . . . . . . . . . . . . 14,996,452___________
48,980,671___________TOTAL FOREIGNGOVERNMENT SECURITIES(Cost $48,480,199) . . . . . . . . . . . . . . . . . . . . . 48,980,671___________
U.S. GOVERNMENT SECURITIES – 8.2%
U.S. Treasury Bills – 8.2%$20,000,000 0.032%, due 10/09/20143 . . . . . . . . . . . . . . . . . . . . . 19,998,12020,000,000 0.028%, due 10/16/20143 . . . . . . . . . . . . . . . . . . . . . 19,997,26010,000,000 0.040%, due 11/28/20143 . . . . . . . . . . . . . . . . . . . . . 9,997,640___________
49,993,020___________TOTAL U.S. GOVERNMENT SECURITIES(Cost $49,993,736) . . . . . . . . . . . . . . . . . . . . . . . . . 49,993,020___________
Total Investments(Cost $446,114,432) – 88.4% . . . . . . . . . . . . . . . . . 538,635,699Cash and Other Assets inExcess of Liabilities – 11.6% . . . . . . . . . . . . . . . . . 70,625,179___________TOTAL NETASSETS – 100.0% . . . . . . . . . . . . . . . $609,260,878______________________
ETN Exchange Traded NoteCAD Canadian DollarNOK Norwegian Krone
1 Non-income producing security.2 A portion of these securities are considered illiquid. As of May 31, 2014, the total market value ofilliquid securities was $18,914,912 or 3.1% of net assets.
3 Coupon represents the yield to maturity from the purchase price.
SCHEDULE OF INVESTMENTS at May 31, 2014 (Unaudited) (Continued)
The accompanying notes are an integral part of these financial statements.
19
GoodHaven Fund
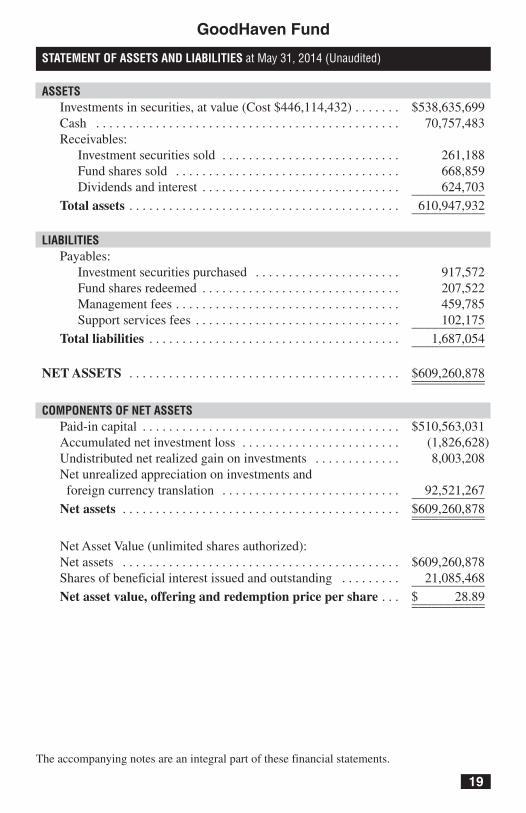
ASSETSInvestments in securities, at value (Cost $446,114,432) . . . . . . . $538,635,699Cash . . . . . . . . . . . . . . . . . . . . . . . . . . . . . . . . . . . . . . . . . . . . . . 70,757,483Receivables:Investment securities sold . . . . . . . . . . . . . . . . . . . . . . . . . . . 261,188Fund shares sold . . . . . . . . . . . . . . . . . . . . . . . . . . . . . . . . . . 668,859Dividends and interest . . . . . . . . . . . . . . . . . . . . . . . . . . . . . . 624,703___________
Total assets . . . . . . . . . . . . . . . . . . . . . . . . . . . . . . . . . . . . . . . . . 610,947,932___________
LIABILITIESPayables:Investment securities purchased . . . . . . . . . . . . . . . . . . . . . . 917,572Fund shares redeemed . . . . . . . . . . . . . . . . . . . . . . . . . . . . . . 207,522Management fees . . . . . . . . . . . . . . . . . . . . . . . . . . . . . . . . . . 459,785Support services fees . . . . . . . . . . . . . . . . . . . . . . . . . . . . . . . 102,175___________
Total liabilities . . . . . . . . . . . . . . . . . . . . . . . . . . . . . . . . . . . . . . 1,687,054___________
NETASSETS . . . . . . . . . . . . . . . . . . . . . . . . . . . . . . . . . . . . . . . . . $609,260,878______________________
COMPONENTS OF NET ASSETSPaid-in capital . . . . . . . . . . . . . . . . . . . . . . . . . . . . . . . . . . . . . . . $510,563,031Accumulated net investment loss . . . . . . . . . . . . . . . . . . . . . . . . (1,826,628)Undistributed net realized gain on investments . . . . . . . . . . . . . 8,003,208Net unrealized appreciation on investments andforeign currency translation . . . . . . . . . . . . . . . . . . . . . . . . . . . 92,521,267___________Net assets . . . . . . . . . . . . . . . . . . . . . . . . . . . . . . . . . . . . . . . . . . $609,260,878______________________
Net Asset Value (unlimited shares authorized):Net assets . . . . . . . . . . . . . . . . . . . . . . . . . . . . . . . . . . . . . . . . . . $609,260,878Shares of beneficial interest issued and outstanding . . . . . . . . . 21,085,468___________Net asset value, offering and redemption price per share . . . $ 28.89______________________
STATEMENT OF ASSETS AND LIABILITIES at May 31, 2014 (Unaudited)

The accompanying notes are an integral part of these financial statements.
20
GoodHaven Fund
INVESTMENT INCOMEDividends (net of $17,765 in foreign withholding taxes) . . . . . . . $ 2,638,294Interest . . . . . . . . . . . . . . . . . . . . . . . . . . . . . . . . . . . . . . . . . . . . . . 368,607__________Total investment income . . . . . . . . . . . . . . . . . . . . . . . . . . . . . . . 3,006,901__________
EXPENSESManagement fees . . . . . . . . . . . . . . . . . . . . . . . . . . . . . . . . . . . . . . 2,550,312Support services fees . . . . . . . . . . . . . . . . . . . . . . . . . . . . . . . . . . . 566,736__________Total expenses . . . . . . . . . . . . . . . . . . . . . . . . . . . . . . . . . . . . . 3,117,048__________
Net investment income . . . . . . . . . . . . . . . . . . . . . . . . . . . . . . . . (110,147)__________
REALIZED & UNREALIZED GAIN ON INVESTMENTSNet realized gain on investments and foreign currency . . . . . . . . 7,496,345Net realized gain on written options . . . . . . . . . . . . . . . . . . . . . . . 507,008Change in net unrealized appreciation on investments . . . . . . . . . 11,085,642Change in unrealized appreciation on foreigncurrency translation . . . . . . . . . . . . . . . . . . . . . . . . . . . . . . . . . . . 634__________Net realized and unrealized gain on investments . . . . . . . . . . . 19,089,629__________
Net increase in net assets resulting from operations . . . . . . . . $18,979,482____________________
STATEMENT OF OPERATIONS For the Six Months Ended May 31, 2014 (Unaudited)

The accompanying notes are an integral part of these financial statements.
21
GoodHaven Fund
Six Months EndedMay 31, 2014 Year Ended(Unaudited) November 30, 2013
INCREASE IN NET ASSETS FROMOPERATIONSNet investment income (loss) . . . . . . . . . . . . $ (110,147) $ 320,444Net realized gain on investments,foreign currency and written options . . . . . 8,003,353 5,348,918Change in net unrealizedappreciation on investmentsand foreign currency translation . . . . . . . . . 11,086,276 58,146,461___________ ___________Net increase in net assetsresulting from operations . . . . . . . . . . . . . 18,979,482 63,815,823___________ ___________
DISTRIBUTIONS TO SHAREHOLDERSFrom net investment income . . . . . . . . . . . . . — (3,013,445)From net realized gain on investments . . . . . (5,797,031) (838,692)___________ ___________Total distributions to shareholders . . . . . . (5,797,031) (3,852,137)___________ ___________
CAPITAL SHARE TRANSACTIONSNet increase in net assets derived fromnet change in outstanding shares (a) . . . . . . 42,534,279 269,851,241___________ ___________Total increase in net assets . . . . . . . . . . . . . 55,716,730 329,814,927___________ ___________
NET ASSETSBeginning of period/year . . . . . . . . . . . . . . . 553,544,148 223,729,221___________ ___________End of period/year . . . . . . . . . . . . . . . . . . . $609,260,878 $553,544,148___________ ______________________ ___________Accumulated net investment loss . . . . . . . . $ (1,826,628) $ (1,716,481)___________ ______________________ ___________
(a) Summary of capital share transactions is as follows:
Six Months Ended Year EndedMay 31, 2014 (Unaudited) November 30, 2013__________________________ __________________________Shares Value Shares Value________ __________ ________ __________
Shares sold 3,273,354 $ 92,177,474 13,049,069 $344,967,566Shares issued inreinvestment ofdistributions 204,863 5,668,550 155,776 3,746,428Shares redeemed (b) (1,976,957) (55,311,745) (2,942,351) (78,862,753)_________ ___________ _________ ___________Net increase 1,501,260 $ 42,534,279 10,262,494 $269,851,241_________ ___________ _________ ____________________ ___________ _________ ___________
(b) Net of redemption fees of $7,233 and $67,412, respectively.
STATEMENTS OF CHANGES IN NET ASSETS

The accompanying notes are an integral part of these financial statements.
22
GoodHaven Fund
Six MonthsEndedMay 31, Year Ended Year Ended Period Ended2014 November 30, November 30, November 30,
(Unaudited) 2013 2012 20111
Net asset value,beginning of period/year . . . . $28.26 $24.00 $20.52 $20.00______ ______ ______ ______
INCOME FROM INVESTMENT OPERATIONSNet investment income2 . . . . . . . (0.01) 0.02 0.21 0.02Net realized and unrealizedgain on investments . . . . . . . . . 0.93 4.65 3.29 0.49______ ______ ______ ______
Total frominvestment operations . . . . . . 0.92 4.67 3.50 0.51______ ______ ______ ______
LESS DISTRIBUTIONSFrom net investment income . . . — (0.32) (0.01) —From net realized gain . . . . . . . . (0.29) (0.09) (0.01) —______ ______ ______ ______Total distributions . . . . . . . . . . . . (0.29) (0.41) (0.02) —______ ______ ______ ______Paid-in capital fromredemption fees . . . . . . . . . . . . 0.003 0.003 0.003 0.01______ ______ ______ ______
Net asset value,end of period/year . . . . . . . . . . $28.89 $28.26 $24.00 $20.52______ ______ ______ ____________ ______ ______ ______
Total Return . . . . . . . . . . . . . . . . 3.32%4 19.74% 17.08% 2.60%4
Portfolio turnover rate . . . . . . . . 8%4 12% 11% 12%4
RATIOS/SUPPLEMENTAL DATANet assets at end ofperiod/year (millions) . . . . . . . . $609.3 $553.5 $223.7 $90.9
Ratio of expenses toaverage net assets . . . . . . . . . . . 1.10%5 1.10% 1.10% 1.10%5
Ratio of net investmentincome (loss) toaverage net assets . . . . . . . . . . . (0.04)%5 0.08% 0.92% 0.13%5
1 Commenced operations on April 8, 2011. The information presented is for the period from April 8,2011 to November 30, 2011.
2 Calculated using the average shares outstanding method.3 Amount is less than $0.01 per share.4 Not annualized.5 Annualized.
FINANCIAL HIGHLIGHTS For a capital share outstanding throughout each period/year

23
GoodHaven Fund
NOTE 1 – ORGANIZATION
The GoodHaven Fund (the “Fund”) is a non-diversified series of shares ofbeneficial interest of Professionally Managed Portfolios (the “Trust”), which isregistered under the Investment Company Act of 1940, as amended, (the “1940Act”) as an open-end management investment company. The Fund commencedoperations on April 8, 2011.
The Fund’s investment objective is to seek long-term growth of capital.
NOTE 2 – SIGNIFICANT ACCOUNTING POLICIES
The following is a summary of significant accounting policies consistentlyfollowed by the Fund. These policies are in conformity with accounting principlesgenerally accepted in the United States of America (“U.S. GAAP”).
A. Security Valuation. All equity securities that are traded on a nationalsecurities exchange, except those listed on the NASDAQ Global Market®
(“NASDAQ”), are valued at the last reported sale price on the exchange onwhich the security is principally traded. Securities traded on NASDAQ willbe valued at the NASDAQ Official Closing Price (“NOCP”). If, on aparticular day, an exchange-traded or NASDAQ security does not trade,then the mean between the most recent quoted bid and asked prices will beused. All equity securities that are not traded on a listed exchange are valuedat the last sale price in the over-the-counter market. If a non-exchangetraded security does not trade on a particular day, then the mean between thelast quoted closing bid and asked price will be used.
Debt securities are valued by using the mean between the closing bid andasked prices provided by an independent pricing service. If the closing bidand asked prices are not readily available, the independent pricing servicemay provide a price determined by a matrix pricing method. Thesetechniques generally consider such factors as yields or prices of bonds ofcomparable quality, type of issue, coupon, maturity, ratings and generalmarket conditions. In the absence of a price from a pricing service,securities are valued at their respective fair values as determined in goodfaith by the Board of Trustees.
Fixed income debt instruments, such as commercial paper, bankers’acceptances and U.S. Treasury Bills, having maturity of less than 60 days atthe time of purchase are valued at amortized cost. Any discount or premiumis accreted or amortized on a straight-line basis until maturity.
Exchange traded options are valued at the composite price, using theNational Best Bid and Offer quotes (“NBBO”). NBBO consists of thehighest bid price and lowest ask price across any of the exchanges on which
NOTES TO FINANCIAL STATEMENTS May 31, 2014 (Unaudited)
24
GoodHaven Fund
an option is quoted, thus providing a view across the entire U.S. optionsmarketplace. Composite option pricing calculates the mean of the highest bidprice and lowest ask price across the exchanges where the option is traded.
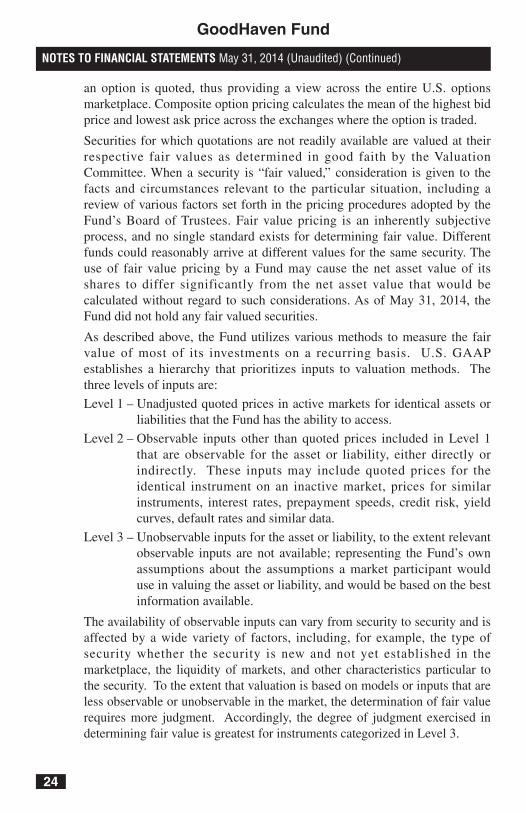
Securities for which quotations are not readily available are valued at theirrespective fair values as determined in good faith by the ValuationCommittee. When a security is “fair valued,” consideration is given to thefacts and circumstances relevant to the particular situation, including areview of various factors set forth in the pricing procedures adopted by theFund’s Board of Trustees. Fair value pricing is an inherently subjectiveprocess, and no single standard exists for determining fair value. Differentfunds could reasonably arrive at different values for the same security. Theuse of fair value pricing by a Fund may cause the net asset value of itsshares to differ significantly from the net asset value that would becalculated without regard to such considerations. As of May 31, 2014, theFund did not hold any fair valued securities.
As described above, the Fund utilizes various methods to measure the fairvalue of most of its investments on a recurring basis. U.S. GAAPestablishes a hierarchy that prioritizes inputs to valuation methods. Thethree levels of inputs are:
Level 1 – Unadjusted quoted prices in active markets for identical assets orliabilities that the Fund has the ability to access.
Level 2 – Observable inputs other than quoted prices included in Level 1that are observable for the asset or liability, either directly orindirectly. These inputs may include quoted prices for theidentical instrument on an inactive market, prices for similarinstruments, interest rates, prepayment speeds, credit risk, yieldcurves, default rates and similar data.
Level 3 – Unobservable inputs for the asset or liability, to the extent relevantobservable inputs are not available; representing the Fund’s ownassumptions about the assumptions a market participant woulduse in valuing the asset or liability, and would be based on the bestinformation available.
The availability of observable inputs can vary from security to security and isaffected by a wide variety of factors, including, for example, the type ofsecurity whether the security is new and not yet established in themarketplace, the liquidity of markets, and other characteristics particular tothe security. To the extent that valuation is based on models or inputs that areless observable or unobservable in the market, the determination of fair valuerequires more judgment. Accordingly, the degree of judgment exercised indetermining fair value is greatest for instruments categorized in Level 3.
NOTES TO FINANCIAL STATEMENTS May 31, 2014 (Unaudited) (Continued)

25
GoodHaven Fund
The inputs used to measure fair value may fall into different levels of thefair value hierarchy. In such cases, for disclosure purposes, the level in thefair value hierarchy within which the fair value measurement falls in itsentirety, is determined based on the lowest level input that is significant tothe fair value measurement in its entirety.
The following is a summary of the inputs used to value the Fund’sinvestments as of May 31, 2014. See the Schedule of Investments for theindustry breakouts.
Level 1 Level 2 Level 3 Total______ ______ ______ _____
Common Stocks $429,873,974 $ — $ — $429,873,974GuernseyInvestment Fund 5,633,622 — — 5,633,622ExchangeTraded Notes 4,154,412 — — 4,154,412Foreign GovernmentSecurities1 — 48,980,671 — 48,980,671U.S. GovernmentSecurities — 49,993,020 — 49,993,020___________ __________ __________ ___________
Total Investmentsin Securities $439,662,008 $98,973,691 $ — $538,635,699___________ __________ __________ ______________________ __________ __________ ___________1 There were three Foreign Government Securities with a total market value of $23,858,598and a maturity of less than 60 days that are valued at amortized cost.
There were no transfers into or out of Level 1, 2, or 3 during the six monthsended May 31, 2014 for the Fund.
B. Foreign Currency. Foreign currency amounts, other than the cost ofinvestments, are translated into U.S. dollar values based upon the spotexchange rate prior to the close of regular trading. The cost of investments istranslated at the rates of exchange prevailing on the dates the portfoliosecurities were acquired. The Fund includes foreign exchange gains andlosses from dividends receivable and other foreign currency denominatedpayables and receivables in realized and unrealized gain (loss) on investmentsand foreign currency. The Fund does not isolate that portion of realized gain(loss) and does isolate unrealized gain (loss) on investments resulting fromchanges in foreign exchange rates on investments from fluctuations arisingfrom changes in the market price of securities for financial reporting purposes.Fluctuations in foreign exchange rates on investments are thus included withnet realized gain (loss) on investments and foreign currency. Fluctuations inforeign exchange rates on investments are separated from unrealized gain(loss) on investments as foreign currency and currency translations.
NOTES TO FINANCIAL STATEMENTS May 31, 2014 (Unaudited) (Continued)

26
GoodHaven Fund
C. Federal Income Taxes. The Fund has elected to be taxed as a “regulatedinvestment company” and intends to distribute substantially all taxable incometo its shareholders and otherwise comply with the provisions of the InternalRevenue Code applicable to regulated investment companies. Therefore, noprovision for federal income taxes or excise taxes has been made.
In order to avoid imposition of the excise tax applicable to regulatedinvestment companies, the Fund intends to declare each year as dividends ineach calendar year at least 98.0% of its net investment income (earnedduring the calendar year) and at least 98.2% of its net realized capital gains(earned during the twelve months ended November 30) plus undistributedamounts, if any, from prior years.
Net capital losses incurred after November 30, within the taxable year aredeemed to arise on the first business day of the Fund’s next taxable year. AtNovember 30, 2013, the Fund did not have any capital loss carryovers.
The Fund recognizes the tax benefits of uncertain tax positions only wherethe position is “more likely than not” to be sustained assuming examinationby tax authorities.
As of May 31, 2014, the Fund did not have any tax positions that did notmeet the “more likely-than-not” threshold of being sustained by theapplicable tax authority. Generally, tax authorities can examine all the taxreturns filed for the tax years of 2011-2013. The Fund identifies their majortax jurisdiction as U.S. Federal and the Commonwealth of Massachusetts;however, the Fund is not aware of any tax positions for which it isreasonably possible that the total amounts of unrecognized tax benefits willchange materially in the next twelve months.
D. Security Transactions and Investment Income. Investment securitiestransactions are accounted for on the trade date. Gains and losses realizedon sales of securities are determined on a specific identification basis.Discounts/premiums on debt securities purchased are accreted/amortizedover the life of the respective securities using the effective interest method.Dividend income is recorded on the ex-dividend date. Interest income isrecorded on an accrual basis. Withholding taxes on foreign dividends havebeen provided for in accordance with the Trust’s understanding of theapplicable country’s tax rules and rates.
E. Distributions to Shareholders. Distributions to shareholders from netinvestment income and net realized gains on securities for the Fundnormally are declared and paid on an annual basis. Distributions arerecorded on the ex-dividend date.
NOTES TO FINANCIAL STATEMENTS May 31, 2014 (Unaudited) (Continued)
27
GoodHaven Fund
F. Use of Estimates. The preparation of financial statements in conformity withU.S. GAAP requires management to make estimates and assumptions thataffect the reported amounts of assets and liabilities at the date of thefinancial statements, as well as the reported amounts of revenues andexpenses during the period. Actual results could differ from those estimates.
G. Share Valuation. The net asset value (“NAV”) per share of the Fund iscalculated by dividing the sum of the value of the securities held by theFund, plus cash and other assets, minus all liabilities by the total number ofshares outstanding for the Fund, rounded to the nearest cent. The Fund’sshares will not be priced on the days on which the NYSE is closed fortrading. The offering and redemption price per share for the Fund is equalto the Fund’s net asset value per share. The Fund charges a 2.00%redemption fee on shares held less than 60 days. This fee is deducted fromthe redemption proceeds otherwise payable to the shareholder. The Fundwill retain the fee charged as paid-in capital and such fees become part ofthat Fund’s daily NAV calculation.
H. Guarantees and Indemnifications. In the normal course of business, theFund enters into contracts with service providers that contain generalindemnification clauses. The Fund’s maximum exposure under thesearrangements is unknown as this would involve future claims that may bemade against the Fund that have not yet occurred. However, based onexperience, the Fund expects the risk of loss to be remote.
I. Options Contracts. When the Fund purchases an option, an amount equal tothe premium paid by the Fund is recorded as an investment and issubsequently adjusted to the current value of the option purchased. If anoption expires on the stipulated expiration date or if the Fund enters into aclosing sale transaction, a gain or loss is realized. If a call option isexercised, the cost of the security acquired is increased by the premium paidfor the call. If a put option is exercised, a gain or loss is realized from thesale of the underlying security, and the proceeds from such sale aredecreased by the premium originally paid. Written and purchased optionsare non-income producing securities.
When the Fund writes an option, an amount equal to the premium receivedby the Fund is recorded as a liability and is subsequently adjusted to thecurrent fair value of the option written. Premiums received from writingoptions that expire unexercised are treated by the Fund on the expirationdate as realized gains from investments. The difference between thepremium and the amount paid on effecting a closing purchase transaction,including brokerage commissions, is also treated as a realized gain, or, if thepremium is less than the amount paid for the closing purchase transaction,
NOTES TO FINANCIAL STATEMENTS May 31, 2014 (Unaudited) (Continued)

28
GoodHaven Fund
as a realized loss. If a call option is exercised, the premium is added to theproceeds from the sale of the underlying security or currency in determiningwhether the Fund has realized a gain or loss. If a put option is exercised,the premium reduces the cost basis of the securities purchased by the Fund.The Fund as writer of an option bears the market risk of an unfavorablechange in the price of the security underlying the written option.
The Fund has adopted financial reporting rules and regulations that requireenhanced disclosure regarding derivatives and hedging activity intending toimprove financial reporting of derivative instruments by enabling investorsto understand how and why an entity uses derivatives, how derivatives areaccounted for, and how derivative instruments affect an entity’s results ofoperations and financial position.
The Fund may invest, at the time of purchase, up to 10% of the Fund’s netassets in options, which are a type of derivative and employ specializedtrading techniques such as options trading to increase the Fund’s exposure tocertain selected securities. The Fund may employ these techniques as hedgingtools as well as speculatively to enhance returns. Other than when used forhedging, these techniques may be riskier than many investment strategies andmay result in greater volatility for the Fund, particularly in periods of marketdeclines. As a hedging tool, options may help cushion the impact of marketdeclines, but may reduce the Fund’s participation in a market advance. AtMay 31, 2014, the Fund held no purchased options or written options.
Statement of Operations
The effect of Derivative Instruments on the Statement of Operations for thesix months ended May 31, 2014:
Realized Gain(Loss)
Location of Gain on DerivativesHedging (Loss) on Derivatives Recognized
Instruments Recognized in Income in Income___________ ____________________ ____________
Equity Contracts Realized & unrealizedgain on investments $507,008________
Total $507,008
NOTES TO FINANCIAL STATEMENTS May 31, 2014 (Unaudited) (Continued)

29
GoodHaven Fund
The activity in written options during the six months ended May 31, 2014, forthe Fund is as follows:
Amount of Number ofPremiums Contracts__________ _________
Outstanding at 11/30/13 $ — —Options written 967,171 6,000Options exercised (460,163) (1,000)Options expired (507,008) (5,000)___________ _________Outstanding at 5/31/14 $ — —___________ ____________________ _________
J. Subsequent Events. In preparing these financial statements, the Fund hasevaluated events and transactions for potential recognition or disclosurethrough date the financial statements were available to be issued. The Fundhas determined that there are no subsequent events that would need to bedisclosed in the Fund’s financial statements.
NOTE 3 – COMMITMENTS AND OTHER RELATED PARTY TRANSACTIONS
GoodHaven Capital Management, LLC (the “Advisor”) provides the Fund withinvestment management services under an Investment Advisory Agreement (the“Agreement”). Under the Agreement, the Advisor provides all investment advice,office space and certain administrative services, and most of the personnel neededby the Fund. Under the Advisory Agreement, the Advisor is entitled to receive amonthly management fee calculated daily and payable monthly equal to 0.90% ofthe Fund’s average daily net assets. For the six-months ended May 31, 2014, theFund incurred $2,550,312 in Management fees.
The Fund has also entered into a support services agreement with the Advisor.Under this agreement, the Advisor is responsible for paying all of the Fund’s othernormal day-to-day operational expenses, such as administrative, custody, transferagency, fund accounting, legal, audit, and acquired fund fees and expenses. Thesupport services fee does not cover the following other expenses: (a) any chargesassociated with the execution of portfolio transactions, such as brokeragecommissions, transaction charges or other transaction-related expenses (such asstamp taxes), (b) taxes, if any, imposed on the Fund, (c) interest, if any, on any Fundborrowings, or (d) extraordinary Fund legal expenses incurred outside of the normaloperation of the Fund, such as legal fees, arbitration fees, or related expenses inconnection with any actual or threatened arbitration, mediation, or litigation. Underthe Support Services Agreement, the Advisor is entitled to receive a monthly feecalculated daily and payable monthly equal to 0.20% of the Fund’s average dailynet assets. For the six-months ended May 31, 2014, the Fund incurred $566,736 inSupport services fees.
NOTES TO FINANCIAL STATEMENTS May 31, 2014 (Unaudited) (Continued)

30
GoodHaven Fund
U.S. Bancorp Fund Services, LLC (the “USBFS”), an indirect wholly-ownedsubsidiary of U.S. Bancorp, serves as the Fund’s Administrator (the“Administrator”) and, in that capacity, performs various administrative andaccounting services for the Fund. The Administrator prepares various federal andstate regulatory filings, reports and returns for the Fund; prepares reports andmaterials to be supplied to the trustees; monitors the activities of the Fund’scustodian, transfer agent and accountants; coordinates the preparation and paymentof Fund expenses and reviews the Fund’s expense accruals. The Officers of theTrust and the Chief Compliance Officer are also employees of the Administrator.
Quasar Distributors, LLC (the “Distributor”) acts as the Fund’s principalunderwriter in a continuous public offering of the Fund’s shares. U.S. Bank, N.A.(the “Custodian”) serves as custodian to the Fund. Both the Distributor andCustodian are affiliates of the Administrator.
NOTE 4 – PURCHASES AND SALES OF SECURITIES
Investment transactions (excluding short-term investments) for the six-monthsended May 31, 2014, were as follows:
Purchases Sales or Maturityat Cost Proceeds_________ _______________
$113,471,350 $50,986,945
NOTE 5 – DISTRIBUTIONS TO SHAREHOLDERS
The tax character of distributions paid during the six-months ended May 31,2014 and fiscal year ended November 30, 2013, was as follows:
May 31, 2014^ November 30, 2013_____________ _________________
Distributions paid from:Ordinary Income $ — $3,789,717Short-term capital gain 294,138 —Long-term capital gain $5,502,893 $ 62,420
^ Estimated
Distribution classifications may differ from the statement of changes in netassets as a result of the treatment of short-term capital gains as ordinary income fortax purposes.
As of May 31, 2014, the components of distributable earnings on a tax basiswere as follows:
Cost of investments $447,456,005______________________Gross tax unrealized appreciation 104,682,516Gross tax unrealized depreciation (13,502,822)___________Net tax unrealized appreciation 91,179,694______________________
NOTES TO FINANCIAL STATEMENTS May 31, 2014 (Unaudited) (Continued)

31
GoodHaven Fund
As of November 30, 2013, the components of distributable earnings on a taxbasis were as follows:
Net tax unrealized appreciation $ 80,094,052___________Undistributed ordinary income 294,121Undistributed long-term capital gain 5,502,765___________Total distributable earnings 5,796,886Other accumulated loss (375,542)___________Total accumulated earnings $ 85,515,396______________________
NOTES TO FINANCIAL STATEMENTS May 31, 2014 (Unaudited) (Continued)

32
GoodHaven Fund
As a shareholder of the GoodHaven Fund (the “Fund”) you incur two types ofcosts: (1) transaction costs, including redemption fees and exchange fees and (2)ongoing costs, including management fees. This example is intended to help youunderstand your ongoing costs (in dollars) of investing in the Fund and to comparethese costs with the ongoing costs of investing in other mutual funds. The exampleis based on an investment of $1,000 invested at the beginning of the period and heldfor the entire period (December 1, 2013 – May 31, 2014).
Actual Expenses
The first line of the table provides information about actual account valuesbased on actual returns and actual expenses. Although the Fund charges no salesload or other transaction fees, you will be assessed fees for outgoing wire transfers,returned checks and stop payment orders at prevailing rates charged by U.S.Bancorp Fund Services, LLC, the Fund’s transfer agent. If you request that aredemption be made by wire transfer, currently, the Fund’s transfer agent charges a$15.00 fee. You will be charged a redemption fee equal to 2.00% of the net amountof the redemption if you redeem shares that have been held for less than 60 days.Individual Retirement Accounts (“IRA”) will be charged a $15.00 annualmaintenance fee. To the extent the Fund invests in shares of other investmentcompanies as part of its investment strategy, you will indirectly bear yourproportionate share of any fees and expenses charged by the underlying funds inwhich the Fund invests in addition to the expenses of the Fund. Actual expenses ofthe underlying funds may vary. These expenses are not included in the example.The example includes, but is not limited to, management fees and support services.However, the example does not include portfolio trading commissions and relatedexpenses and other extraordinary expenses as determined under generally acceptedaccounting principles. You may use the information in this line, together with theamount you invested, to estimate the expenses that you paid over the period.Simply divide your account value by $1,000 (for example, an $8,600 account valuedivided by $1,000 = 8.6). Then, multiply the result by the number in the first lineunder the heading entitled “Expenses Paid During the Period” to estimate theexpenses you paid on your account during this period.
Hypothetical Example for Comparison Purposes
The second line of the table provides information about hypothetical accountvalues based on a hypothetical return and hypothetical expenses based on theFund’s actual expense ratio and an assumed rate of return of 5% per year beforeexpenses, which is not the Fund’s actual return. The hypothetical account valuesand expenses may not be used to estimate the actual ending account balance orexpenses you paid for the period. You may use this information to compare theongoing costs of investing in the Fund and other funds. To do so, compare this 5%hypothetical example with the 5% hypothetical examples that appear in the
EXPENSE EXAMPLE For the Six Months Ended May 31, 2014 (Unaudited)

33
GoodHaven Fund
shareholder reports of the other funds. Please note that the expenses shown in thetable are meant to highlight your ongoing costs only and do not reflect anytransactional costs, such as sales charges, redemption fees or exchange fees.Therefore, the second line of the table is useful in comparing ongoing costs onlyand will not help you determine the relative total costs of owning different funds. Ifthese transactional costs were included, your costs would have been higher.
Expenses PaidBeginning Ending During the Period
Account Value Account Value December 1, 2013 –December 1, 2013 May 31, 2014 May 31, 20141________________ _____________ _________________
Actual $1,000.00 $1,033.20 $5.58Hypothetical(5% annual returnbefore expenses) $1,000.00 $1,019.45 $5.541 The calculations are based on expenses incurred during the most recent six-month period. Theannualized six-month expense ratio for the GoodHaven Fund during that period was 1.10%. Thedollar amounts shown as expenses paid during the period are equal to the annualized six-monthexpense ratio multiplied by the average account value during the period, multiplied by the number ofdays in the most recent six-month period and divided by the number of days in the most recent twelvemonth period.
EXPENSE EXAMPLE For the Six Months Ended May 31, 2014 (Unaudited) (Continued)

34
GoodHaven Fund
A description of the policies and procedures that the Fund uses to determinehow to vote proxies relating to portfolio securities is available without charge, uponrequest, by calling toll-free at (855) 654-6639 and on the Fund’s website atwww.goodhavenfunds.com. Furthermore, you can obtain the description on theSEC’s website at www.sec.gov.
Information regarding how the Fund voted proxies relating to portfoliosecurities during the most recent 12-month period ended June 30 is availablewithout charge, upon request, by calling (855) 654-6639 or through the SEC’swebsite at www.sec.gov.
INFORMATION ABOUT PROXY VOTING (Unaudited)
The Fund files its complete schedule of portfolio holdings for its first and thirdfiscal quarters with the SEC on Form N-Q. The Fund’s Form N-Q is availablewithout charge, upon request, by calling toll-free at (855) 654-6639. Furthermore,you can obtain the Form N-Q on the SEC’s website at www.sec.gov.
INFORMATION ABOUT THE PORTFOLIO HOLDINGS (Unaudited)
HOUSEHOLDING (Unaudited)
In an effort to decrease costs, the Fund will reduce the number of duplicateProspectuses and annual and semi-annual reports that you receive by sending onlyone copy of each to those addresses shown by two or more accounts. Please call thetransfer agent toll free at (855) 654-6639 to request individual copies of thesedocuments. The Fund will begin sending individual copies thirty days afterreceiving your request. This policy does not apply to account statements.
INFORMATION ABOUT THE FUND’S TRUSTEES (Unaudited)
The Statement of Additional Information (“SAI”) includes additionalinformation about the Fund’s Trustees and is available without charge, upon request,by calling (855) 654-6639. Furthermore, you can obtain the SAI on the SEC’swebsite at www.sec.gov or the Fund’s web site at www.goodhavenfunds.com.
ADDITIONAL INFORMATION

35
GoodHaven Fund
PRIVACY NOTICE (Unaudited)
FACTS WHAT DOES GOODHAVEN CAPITAL MANAGEMENT, LLC &GOODHAVEN FUND DOWITHYOUR PERSONAL INFORMATION?
Why? Financial companies choose how they share your personalinformation. Federal law gives consumers the right to limit somebut not all sharing. Federal law also requires us to tell you how wecollect, share, and protect your personal information. Please readthis notice carefully to understand what we do.
What? The types of personal information we collect and share depend on theproduct or service you have with us. This information can include:• Social Security number and Income• Account Balances and Employment Information• Assets and Investment ExperienceWhen you are no longer our customer, we continue to share yourinformation as described in this notice.
How? All financial companies need to share customer’s personalinformation to run their everyday business. In the section below,we list the reasons financial companies can share their customer’spersonal information; the reasons GoodHaven chooses to share;and whether you can limit this sharing.
Reasons we can share your Does GoodHaven Can you limitpersonal information share? this sharing?
For our everyday business purposes—such as to process your transactions, maintainyour account(s), respond to court orders and Yes Nolegal investigations, or report to credit bureaus
For our marketing purposes—to offer our products and services to you Yes No
For joint marketing withother financial companies No We don’t share
For our affiliates’ everydaybusiness purposes—information about your Yes Yes
transactions and experiences
For our affiliates’ everydaybusiness purposes— Yes Yesinformation about your creditworthiness
For nonaffiliates to market to you No We don’t share
Questions? Call (305) 677-7650 or email [email protected]

36
GoodHaven Fund
PRIVACY NOTICE (Unaudited) (Continued)
Who we areWho is providing GoodHaven Capital Management, LLCthis notice? GoodHaven Fund (collectively “GoodHaven”)
What we doHow does To protect your personal information from unauthorizedGoodHaven access and use, we use security measures that complyprotect with federal law. These measures include computer safeguardsmy personal and secured files and buildings.information? Our service providers must represent to us that they will protect
any personal information through similar safeguards andsecurity.
How does We collect your personal information, for example, when youGoodHaven • open an account or give us your incomecollect my • give us contact information or seek advice about yourpersonal investmentsinformation? • tell us about your investments or retirement portfolio
Why can’t I Federal law gives you the right to limit onlylimit all sharing? • sharing for affiliates’ everyday business purposes—information
about your creditworthiness• affiliates from using your information to market to you• sharing for nonaffiliates to market youState laws and individual companies may give you additionalrights to limit sharing.
Definitions
Affiliates Companies related by common ownership or control. They canbe financial and nonfinancial companies.• Our affiliates include: a series of a registered investmentcompany called the GoodHaven Fund (a no-load mutual fund).
Nonaffiliates Companies not related by common ownership or control. Theycan be financial and nonfinancial companies.• We do not share with nonaffiliates so they can market to you.
Joint marketing A formal agreement between nonaffiliated financial companiesthat together market financial products or services to you.• We do not jointly market with nonaffiliated financialcompanies.
Other important information

(This Page Intentionally Left Blank.)

GoodHaven Fund
AdvisorGOODHAVEN CAPITAL MANAGEMENT, LLC
4940 SW 83rd StreetMiami, Florida 33143
DistributorQUASAR DISTRIBUTORS, LLC
615 East Michigan StreetMilwaukee, Wisconsin 53202
CustodianU.S. BANK N.A.Custody Operations
1555 N. RiverCenter Drive, Suite 302Milwaukee, Wisconsin 53212
Transfer AgentU.S. BANCORP FUND SERVICES, LLC
P.O. Box 701Milwaukee, Wisconsin 53201-0701
Independent Registered Public Accounting FirmTAIT, WELLER & BAKER LLP1818 Market Street, Suite 2400Philadelphia, Pennsylvania 19103
Legal CounselPAUL HASTINGS LLPPark Avenue Tower
75 E. 55th Street, Floor 15NewYork, NewYork 10022
GoodHaven Fund855-OK-GOODX (855-654-6639)
www.goodhavenfunds.comSymbol – GOODXCUSIP – 74316J763