Semi-Annual Financial Statements
46
Trident Performance Corp. Trident Performance Corp. II Trident Performance Trust Semi-Annual Financial Statements as at June 30, 2011 2011
Transcript of Semi-Annual Financial Statements

Trident Performance Corp.
Trident Performance Corp. II
Trident Performance Trust
Semi-Annual Financial Statementsas at June 30, 2011
2011

Table of ContentsTRIDENT PERFORMANCE CORP.
Financial StatementsStatement of Investment Portfolio ....................... 1Statements of Net Assets ..................................... 3Statements of Operations and Retained Earnings (Deficit) ............................... 4Statements of Changes in Net Assets .................. 5Statements of Cash Flows ................................... 6Corporation Specific Financial Instruments Risks .............................................. 7
TRIDENT PERFORMANCE CORP. II
Financial StatementsStatement of Investment Portfolio ....................... 8Statements of Net Assets ..................................... 10Statements of Operations and Retained Earnings (Deficit) ............................... 11Statements of Changes in Net Assets .................. 12Statements of Cash Flows ................................... 12Corporation Specific Financial Instruments Risks .............................................. 13
TRIDENT PERFORMANCE TRUST
Financial StatementsStatement of Investment Portfolio ....................... 14Statements of Net Assets ..................................... 22Statements of Operations and Retained Earnings (Deficit) ............................... 23Statements of Changes in Net Assets .................. 24Statements of Cash Flows ................................... 25Trust Specific Financial Instruments Risks .............................................. 26
Notes to the Financial Statements ....................... 30Corporations and Trust Information .................... 42
CI Investments Inc., the Manager of the Corporations and the Trust, appoints independent auditors to audit the Corporations’
and the Trust’s Annual Financial Statements. Under Canadian securities laws (National Instrument 81-106), if an auditor has not
reviewed the Semi-Annual Financial Statements, this must be disclosed in an accompanying notice.
The Corporations’ and the Trust’s independent auditors have not performed a review of these Semi-Annual Financial Statements
in accordance with standards established by the Canadian Institute of Chartered Accountants.

1Semi-Annual Financial Statements as at June 30, 2011
Average Fair Number of Shares Description Cost ($) Value ($) Equities Subject to Forward Contract (73.1%) 63,912 Celtic Exploration Ltd.* 1,065,827 1,361,965 55,679 Detour Gold Corp.* 1,749,991 1,554,558 69,334 Dundee Corp., Class A* 1,749,990 1,754,844 60,000 FirstService Corp.* 1,287,000 1,998,000 12,000 Flint Energy Services Ltd.* 134,640 166,800 10,000 CGI Group Inc.* 95,200 238,000 145,470 Harry Winston Diamond Corp.* 1,750,004 2,328,975 68,186 Kirkland Lake Gold Inc.* 1,016,653 1,032,336 104,478 Legacy Oil & Gas Inc.* 1,750,007 1,222,393 4,000 Open Text Corp.* 177,320 246,360 40,000 Osisko Mining Corp.* 582,000 598,000 69,638 Petrobank Energy & Resources Ltd.* 1,750,003 985,378 4,366 Precision Drilling Corp.* 63,831 60,294 123,762 Quadra FNX Mining Ltd.* 1,749,995 1,772,272 16,194 Research In Motion Ltd.* 1,703,123 450,355 95,000 SEMAFO Inc.* 1,135,250 699,200 12,000 Stantec Inc.* 315,960 334,920 70,879 Tourmaline Oil Corp.* 1,750,003 2,268,128 70,551 Transglobe Energy Corp.* 1,016,640 774,650
Commissions and other Portfolio Transaction Costs –
Total Equities Subject to Forward Contract (73.1%) 20,843,437 19,847,428 DERIVATIVE INSTRUMENTS Forward Contract (25.0%) (see Schedule A) 6,775,806 Total Investments (98.1%) 20,843,437 26,623,234 Other Assets (net) (1.9%) 529,252 Net Assets (100.0%) 27,152,486
Statement of Investment Portfolio (as at June 30, 2011)
* Securities sold forward as part of the Forward Contract Agreement. Percentages shown in brackets relate investments at fair value to net assets of the Corporation. The accompanying notes are an integral part of these financial statements.
TRIDENT PERFORMANCE CORP.
Financial Statements (unaudited)

2 Semi-Annual Financial Statements as at June 30, 2011
Schedule A
Forward Contract (25.0%) Investments sold forward Fair Value ($)
Celtic Exploration Ltd. (1,363,243)
Detour Gold Corp. (1,556,228)
Dundee Corp., Class A (1,757,617)
FirstService Corp. (2,003,400)
Flint Energy Services Ltd. (167,280)
CGI Group Inc. (238,100)
Harry Winston Diamond Corp. (2,330,429)
Kirkland Lake Gold Inc. (1,036,427)
Legacy Oil & Gas Inc. (1,223,437)
Open Text Corp. (247,320)
Osisko Mining Corp. (599,600)
Petrobank Energy & Resources Ltd. (986,074)
Precision Drilling Corp. (60,469)
Quadra FNX Mining Ltd. (1,772,272)
Research In Motion Ltd. (451,489)
SEMAFO Inc. (702,050)
Stantec Inc. (336,000)
Tourmaline Oil Corp. (2,270,963)
Transglobe Energy Corp. (776,061)
(19,878,459)
Notional Units Underlying Trust Fair Value ($)
2,200,259 Trident Perfomance Trust 26,654,265 Total Forward Contract Value 6,775,806
Settlement Date 31-Dec-13 Credit Rating of the Counterparty‡ A-1+
‡ Credit ratings are obtained from Standard & Poor’s, where available, otherwise ratings are obtained from: Moody’s Investors Service, Dominion Bond Rating Services or Canadian Bond Rating Services.
Statement of Investment Portfolio (as at June 30, 2011) (cont’d)
Percentages shown in brackets relate investments at fair value to net assets of the Corporation.The accompanying notes are an integral part of these financial statements.
TRIDENT PERFORMANCE CORP.
Financial Statements (unaudited) (cont’d)

3Semi-Annual Financial Statements as at June 30, 2011
ASSETSInvestments at fair value*CashUnrealized gain on forward contractReceivable for securities soldDividends and accrued interest receivable
LIABILITIESUnrealized loss on forward contractManagement fees payableAccrued expenses Payable for securities purchasedPayable for share redemptionsService fees payableSpread fee payableForward fee payableCapital taxes payable
Net assets and shareholders’ equity
SHAREHOLDERS’ EQUITYShare capitalContributed surplusRetained earnings (deficit)Net assets and shareholders’ equity
*Investments at cost
Net assets per class Class AClass F
Net assets per share (basic and diluted) (Note 9)Class A (basic)Class A (diluted)Class F (basic)Class F (diluted)
Number of shares outstanding (Note 3) Class AClass F
Statements of Net Assets (in $000’s except for per share amounts and number of shares outstanding)
The accompanying notes are an integral part of these financial statements.
TRIDENT PERFORMANCE CORP.
Financial Statements (unaudited) (cont’d)
As at June 30, 2011
19,847 698
6,776 ––
27,321
– 6
10 ––
26 –
11 116
169
27,152
25,062 –
2,090 27,152
20,843
26,268 884
10.52 –
10.91 –
2,496,230 81,000
As at December 31, 2010
11,570226
9,155 118
–21,069
–55–
7,590239–
1167,748
13,321
10,460–
2,86113,321
10,702
12,894427
11.8710.6512.9410.77
1,085,95333,000

4 Semi-Annual Financial Statements as at June 30, 2011
Statements of Operations and Retained Earnings (Deficit) (in $000’s except for per share amounts)
The accompanying notes are an integral part of these financial statements.
TRIDENT PERFORMANCE CORP.
Financial Statements (unaudited) (cont’d)
INVESTMENT INCOMEDividendsInterest Derivative income (loss)Income distribution from investmentsManagement fee rebateLess: Foreign withholding taxes
EXPENSESRepurchase of warrantsManagement fees (Note 4)Administrative fees (Note 4)Service fees (Note 4)Legal feesAudit feesInterest expense Capital taxesGoods and services tax/Harmonized sales tax (Note 4)
Net investment income (loss) for the period
Realized and unrealized gain (loss) on investments and commissions and other portfolio transaction costs Realized gain (loss) on investmentsForeign exchange gain (loss)Commissions and other portfolio transaction costs Forward fee (Note 4)Change in unrealized appreciation (depreciation) of investments and derivativesNet gain (loss) on investments
Increase (decrease) in net assets from operations
Increase (decrease) in net assets from operations per classClass AClass F
Increase (decrease) in net assets from operations per share (basic and diluted) (Note 2)Class A (basic)Class A (diluted)Class F (basic) Class F (diluted)
STATEMENTS OF RETAINED EARNINGS (DEFICIT)Retained earnings (deficit), beginning of periodIncrease (decrease) in net assets from operations(Excess) deficiency on amounts paid on shares redeemedDividends from incomeDividends from realized gainsRetained earnings (deficit), end of period
Contributed surplus, beginning of period(Excess) deficiency on amounts paid on shares redeemedContributed surplus, end of period
For the periods ended June 302010
–––––––
467 28 26 42
–2–
17 5
587
(587)
8,014 – –
(60) (7,800)
154
(433)
(423) (10)
(0.24) (0.10)(0.25)
(0.06)
5,418 (433) (475)
– –
4,510
–––
2011
–3––––3
–292852
–11–
13124
(121)
3,657––
(55)(4,243)
(641)
(762)
(629)(133)
(0.30)–
(1.95)–
2,861(762)
(9)––
2,090
–––
5Semi-Annual Financial Statements as at June 30, 2011
CLASS ANet assets, beginning of periodCAPITAL TRANSACTIONS Proceeds from shares issued Shares issued upon repurchase of warrants Amounts paid for shares redeemed (Excess) deficiency on amounts paid on shares redeemed
DIVIDENDS TO INVESTORS From realized gains From net income From return of capital
Increase (decrease) in net assets from operationsNet assets, end of period
CLASS FNet assets, beginning of periodCAPITAL TRANSACTIONS Proceeds from shares issued Shares issued upon repurchase of warrants Amounts paid for shares redeemed (Excess) deficiency on amounts paid on shares redeemed
DIVIDENDS TO INVESTORS From realized gains From net income From return of capital
Increase (decrease) in net assets from operationsNet assets, end of period
TOTAL CORPORATIONNet assets, beginning of periodCAPITAL TRANSACTIONS Proceeds from shares issued Shares issued upon repurchase of warrants Amounts paid for shares redeemed (Excess) deficiency on amounts paid on shares redeemed
DIVIDENDS TO INVESTORS From realized gains From net income From return of capital
Increase (decrease) in net assets from operationsNet assets, end of period
Statements of Changes in Net Assets (in $000’s)
The accompanying notes are an integral part of these financial statements.
TRIDENT PERFORMANCE CORP.
Financial Statements (unaudited) (cont’d)
For the periods ended June 302010
22,099
––
(151) (475) (626)
––––
(423) 21,050
486
–––––
––––
(10) 476
22,585
––
(151) (475) (626)
––––
(433) 21,526
2011
12,894
–14,003
––
14,003
––––
(629)26,268
427
–609(10)(9)
590
––––
(133)884
13,321
–14,612
(10)(9)
14,593
––––
(762)27,152

6 Semi-Annual Financial Statements as at June 30, 2011
The accompanying notes are an integral part of these financial statements.
Statements of Cash Flows (in $000’s)
TRIDENT PERFORMANCE CORP.
Financial Statements (unaudited) (cont’d)
CASH PROVIDED BY (USED IN) OPERATING ACTIVITIESNet investment income (loss)Proceeds from disposition of investmentsPurchase of investmentsNet change in non-cash balances related to operations
FINANCING ACTIVITIESDividends paidProceeds from shares issuedCost of shares redeemed
Increase (decrease) in cash during the period
Cash (Bank overdraft), beginning of period
Cash (Bank overdraft), end of period
For the periods ended June 30
2010
(587) 17,133 (1,100)
(8) 15,438
––
(15,168) (15,168)
270
113
383
2011
(121)11,395
(17,932)9
(6,649)
–14,730(7,609)7,121
472
226
698

7Semi-Annual Financial Statements as at June 30, 2011
The accompanying notes are an integral part of these financial statements.
TRIDENT PERFORMANCE CORP.
Corporation Specific Financial Instruments Risks (Note 13) (unaudited)
The Corporation is exposed to the financial instrument risks’ of the Trident Performance Trust (“the Trust”). The Corporation was created to obtain
exposure to the Global Macroeconomic Portfolio held by the Trust by virtue of the Forward Agreement. By entering into the Forward Agreement
the Corporation eliminated the direct risk exposure to its common share portfolio, and assumed risk exposure of the Trust, as well as credit risk
to the Counterparty of the Forward Agreement in respect of any positive amount of the Forward Contract value. Details of the Trust’s financial
instruments risks exposure can be found in the Trust Specific Financial Instruments Risks in the Trust’s financial statements. As at June 30, 2011,
the credit rating of the Counterparty to the Forward Agreement was A-1+ (December 31, 2010 - A-1+).
Long Positions at fair value as at June 30, 2011
Equities 19,847 – – 19,847 Forward contract, net – 6,776 – 6,776 Total 19,847 6,776 – 26,623
Level 1 Level 2 Level 3 Total (in $000’s) (in $000’s) (in $000’s) (in $000’s)
Fair Value Hierarchy
The tables below summarize the inputs used by the Corporation in valuing the Corporation’s investments and derivatives carried at fair value.
Long Positions at fair value as at December 31, 2010
Equities 11,570 – – 11,570 Forward contract, net – 9,155 – 9,155 Total 11,570 9,155 – 20,725
Level 1 Level 2 Level 3 Total (in $000’s) (in $000’s) (in $000’s) (in $000’s)

TRIDENT PERFORMANCE CORP. II
Financial Statements (unaudited)
8 Semi-Annual Financial Statements as at June 30, 2011
Average Fair Number of Shares Description Cost ($) Value ($) Equities Subject to Forward Contract (145.2%) 550,613 Bankers Petroleum Ltd.* 3,589,997 3,788,217 455,100 Celestica Inc.* 3,153,843 3,822,840 217,868 Crew Energy Inc.* 3,474,995 3,261,484 29,204 Detour Gold Corp.* 899,483 815,376 104,768 Dundee Corp., Class A* 2,613,675 2,651,678 66,967 Open Text Corp.* 2,951,236 4,124,498 159,916 Osisko Mining Corp.* 2,325,179 2,390,744 39,573 Petrobank Energy & Resources Ltd.* 899,494 559,958 297,659 Precision Drilling Corp.* 2,083,613 4,110,671 328,754 Quadra FNX Mining Ltd.* 3,589,994 4,707,757 50,174 Research In Motion Ltd.* 2,951,235 1,395,339 34,201 Tourmaline Oil Corp.* 899,486 1,094,432
Commissions and other Portfolio Transaction Costs –
Total Equities Subject to Forward Contract (145.2%) 29,432,229 32,722,994 DERIVATIVE INSTRUMENTS Forward Contract (-52.5%) (see Schedule A) (11,841,833) Total Investments (92.7%) 29,432,229 20,881,161 Other Assets (net) (7.3%) 1,662,048 Net Assets (100.0%) 22,543,209
Statement of Investment Portfolio (as at June 30, 2011)
* Securities sold forward as part of the Forward Contract Agreement. Percentages shown in brackets relate investments at fair value to net assets of the Corporation II. The accompanying notes are an integral part of these financial statements.

9Semi-Annual Financial Statements as at June 30, 2011
Schedule A
Forward Contract (-52.5%) Investments sold forward Fair Value ($)
Bankers Petroleum Ltd. (3,788,217)
Celestica Inc. (3,845,595)
Crew Energy Inc. (3,268,020)
Detour Gold Corp. (816,252)
Dundee Corp., Class A (2,655,869)
Open Text Corp. (4,140,570)
Osisko Mining Corp. (2,397,141)
Petrobank Energy & Resources Ltd. (560,354)
Precision Drilling Corp. (4,122,577)
Quadra FNX Mining Ltd. (4,707,757)
Research In Motion Ltd. (1,398,851)
Tourmaline Oil Corp. (1,095,800)
(32,797,003)
Notional Units Underlying Trust Fair Value ($)
2,271,300 Trident Performance Trust II 20,955,170 Total Forward Contract Value (11,841,833)
Settlement Date 28-Feb.-2018 Credit Rating of the Counterparty‡ A-1
‡ Credit ratings are obtained from Standard & Poor’s, where available, otherwise ratings are obtained from: Moody’s Investors Service, Dominion Bond Rating Services or Canadian Bond Rating Services.
Statement of Investment Portfolio (as at June 30, 2011) (cont’d)
Percentages shown in brackets relate investments at fair value to net assets of the Corporation II.The accompanying notes are an integral part of these financial statements.
TRIDENT PERFORMANCE CORP. II
Financial Statements (unaudited) (cont’d)

10 Semi-Annual Financial Statements as at June 30, 2011
Statements of Net Assets (in $000’s except for per share amounts and number of shares outstanding)
The accompanying notes are an integral part of these financial statements.
TRIDENT PERFORMANCE CORP. II
Financial Statements (unaudited) (cont’d)
ASSETSInvestments at fair value*CashUnrealized gain on forward contractReceivable for securities soldIncome tax recoverableDividends and accrued interest receivable
LIABILITIESUnrealized loss on forward contractBank overdraftManagement fees payableAccrued expensesPayable for securities purchasedPayable for share redemptionsService fees payableForward fee payableIncome tax payableCapital taxes payable
Net assets and shareholders’ equity
SHAREHOLDERS’ EQUITYShare capitalContributed surplusRetained earnings (deficit)Net assets and shareholders’ equity
*Investments at cost
Net assets per share (Note 9)Class A
Number of shares outstanding (Note 3) Class A
As at December 31, 2010
83,566278
– –
1,648–
85,492
47,008 –9
13–
13,205 38 16
1,64863
62,000
23,492
25,2601,257
(3,025)23,492
50,727
8.70
2,699,032
As at June 30, 2011
32,72370
––
1,647–
34,440
11,842–58––
239
10_
11,897
22,543
25,2601,257
(3,974)22,543
29,432
8.35
2,699,032
11Semi-Annual Financial Statements as at June 30, 2011
Statements of Operations and Retained Earnings (Deficit) (in $000’s except for per share amounts)
The accompanying notes are an integral part of these financial statements.
TRIDENT PERFORMANCE CORP. II
Financial Statements (unaudited) (cont’d)
INVESTMENT INCOMEDividendsInterest Derivative income (loss)Income distribution from investmentsManagement fee rebateLess: Foreign withholding taxes
EXPENSESManagement fees (Note 4)Administrative fees (Note 4)Interest expenseCustody feesService fees (Note 4)Legal feesAudit feesCapital taxesGoods and services tax/Harmonized sales tax (Note 4)
Net investment income (loss) for the period
Realized and unrealized gain (loss) on investments and commissions and other portfolio transaction costs Realized gain (loss) on investmentsForeign exchange gain (loss)Commissions and other portfolio transaction costsForward fee (Note 4)Change in unrealized appreciation (depreciation) of investments and derivativesNet gain (loss) on investments
Increase (decrease) in net assets from operations
Increase (decrease) in net assets from operations per share
STATEMENTS OF RETAINED EARNINGS (DEFICIT)Retained earnings (deficit), beginning of periodIncrease (decrease) in net assets from operations(Excess) deficiency on amounts paid on shares redeemedDividends from incomeDividends from realized gainsRetained earnings (deficit), end of period
Contributed surplus, beginning of period(Excess) deficiency on amounts paid on shares redeemedContributed surplus, end of period
2011
–1––––1
3029
––
44–1–
12116
(115)
(6,397)––
(54)5,617(834)
(949)
(0.35)
(3,025)(949)
–––
(3,947)
1,257–
1,257
2010
–––––––
48 46
––
74 –2
27 8
205
(205)
1,131 ––
(95) (757) 279
74
0.01
(1,602) 74
–––
(1,528)
108181
289
For the periods ended June 30

12 Semi-Annual Financial Statements as at June 30, 2011
Statements of Cash Flows (in $000’s)
CASH PROVIDED BY (USED IN) OPERATING ACTIVITIESNet investment income (loss)Proceeds from sale of investmentsPurchase of investmentsNet change in non-cash balances related to operations
FINANCING ACTIVITIESProceeds from shares issuedCost of shares redeemed
Increase (decrease) in cash during the period
Cash (Bank overdraft), beginning of period
Cash (Bank overdraft), end of period
CLASS ANet assets, beginning of periodCAPITAL TRANSACTIONS Proceeds from shares issued Amounts paid for shares redeemed (Excess) deficiency on amounts paid on shares redeemed
DIVIDENDS TO INVESTORS From realized gains From net income From return of capital
Increase (decrease) in net assets from operationsNet assets, end of period
Statements of Changes in Net Assets (in $000’s)
The accompanying notes are an integral part of these financial statements.
TRIDENT PERFORMANCE CORP. II
Financial Statements (unaudited) (cont’d)
2010
39,632
– (1,692)
181 (1,511)
––––
74 38,195
2011
23,492
––––
––––
(949)22,543
2010
(205) 16,502
(13,900) 22
2,419
– (1,663) (1,663)
756
(198)
558
2011
(115)21,830(6,995)(1,724)12,996
–(13,204)(13,204)
(208)
278
70
For the periods ended June 30
For the periods ended June 30

TRIDENT PERFORMANCE CORP. II
Corporation II Specific Financial Instruments Risks (unaudited) (Note 13)
13Semi-Annual Financial Statements as at June 30, 2011
The accompanying notes are an integral part of these financial statements.
The Corporation II is exposed to the financial instrument risks’ of the Trident Performance Trust (“the Trust”). The Corporation II was created
to obtain exposure to the Global Macroeconomic Portfolio held by the Trust by virtue of the Forward Agreement. By entering into the Forward
Agreement the Corporation II eliminated the direct risk exposure to its common share portfolio, and assumed risk exposure of the Trust, as well
as credit risk to the Counterparty of the Forward Agreement in respect of any positive amount of the Forward Contract value. Details of the
Trust’s financial instruments risks exposure can be found in the Trust Specific Financial Instruments Risks in the Trust’s financial statements.
As at June 30, 2011, the credit rating of the Counterparty to the Forward Agreement was A-1 (December 31, 2010 - A-1).
Long Positions at fair value as at June 30, 2011
Equities 32,723 – – 32,723 Forward contract, net – (11,842) – (11,842)Total 32,723 (11,842) – 20,881
Level 1 Level 2 Level 3 Total (in $000’s) (in $000’s) (in $000’s) (in $000’s)
Fair Value Hierarchy
The tables below summarize the inputs used by the Corporation II in valuing the Corporation II’s investments and derivatives carried at fair value.
Long Positions at fair value as at December 31, 2010
Equities 83,566 – – 83,566 Forward contract, net – (47,008) – (47,008)Total 83,566 (47,008) – 36,558
Level 1 Level 2 Level 3 Total (in $000’s) (in $000’s) (in $000’s) (in $000’s)

14 Semi-Annual Financial Statements as at June 30, 2011
Number of Shares/ Average Fair
Par Value Description Cost ($) Value ($)
LONG POSITIONS (43.2%)
U.S.A. (29.0%)
USD 400,000 3M Co., 4.65% 12/15/2012 427,294 408,850
2,814 Claymore S&P Global Water ETF 66,287 58,893
USD 400,000 ConocoPhillips Co., 6% 01/15/2020 458,036 451,127
63,188 Consumer Staples Select Sector SPDR Fund 1,828,709 1,902,600
USD 600,000 Eli Lilly and Co., 3.55% 03/06/2012 601,470 591,320
1,704 Energy Select Sector SPDR 123,260 123,766
41,999 Health Care Select Sector SPDR Fund 1,344,575 1,437,961
USD 350,000 Hewlett-Packard Co., 4.25% 02/24/2012 357,506 345,686
USD 350,000 IBM International Group Capital LLC 5.05% 10/22/2012 370,338 357,369
5,488 iShares S&P Global Healthcare Sector Index Fund 295,430 307,835
7,734 Johnson & Johnson 483,103 495,729
7,330 Market Vectors Gold Miners ETF 366,407 385,708
17,328 Market Vectors Gold Miners ETF 1,004,032 911,806
3,816 Newmont Mining Corp. 213,021 198,554
USD 600,000 Newmont Mining Corp., 5.125% 10/01/2019 642,984 621,498
USD 217,000 Pfizer Inc., 4.45% 03/15/2012 223,432 215,248
USD 110,000 Pfizer Inc., 5.35% 03/15/2015 139,411 119,614
3,938 PowerShares Water Resources Portfolio ETF 76,183 73,491
21,923 SPDR Gold Trust 2,495,370 3,086,972
USD 600,000 The Coca-Cola Co., 0.75% 11/15/2013 584,317 575,731
21,949 Utilities Select Sector SPDR Fund 701,902 708,305
USD 400,000 Wyeth 5.5% 03/15/2013 432,943 416,180
13,236,010 13,794,243
CANADA (4.5%)
4,800 Barrick Gold Corp. (USD) 211,760 209,710
1,100 EnCana Corp. 36,341 32,670
293 EnCana Corp. (USD) 11,328 8,704
USD 800,000 EnCana Corp., 6.5% 05/15/2019 971,637 906,282
USD 600,000 Suncor Energy Inc., 6.1% 06/01/2018 664,776 658,116
24,218 Viterra Inc. 269,186 252,836
8,000 Yamana Gold Inc. 153,408 89,655
2,318,436 2,157,973
INDIA (2.1%)
USD 1,000,000 State Bank of India, London 4.5% 07/27/2015 1,006,014 990,298
JAPAN (1.5%)
10,000 Bank of Kyoto Ltd. 93,422 88,053
21,810 JX Holdings Inc. 132,163 140,571
21,378 Showa Shell Sekiyu K.K. 190,572 190,545
18,350 Sumitomo Metal Mining Co., Ltd. 324,184 288,861
740,341 708,030
Statement of Investment Portfolio (as at June 30, 2011)
Percentages shown in brackets relate investments at fair value to net assets of the Trust.The accompanying notes are an integral part of these financial statements.
TRIDENT PERFORMANCE TRUST
Financial Statements (unaudited)

15Semi-Annual Financial Statements as at June 30, 2011
Number of Shares/ Average Fair
Par Value Description Cost ($) Value ($)
LONG POSITIONS (43.2%) (cont’d)
LUXEMBOURG (1.4%)
USD 600,000 Gazprom Via Gaz Capital SA 8.146% 04/11/2018 682,774 678,664
ISLE OF MAN (1.4%)
USD 600,000 AngloGold Ashanti Holdings Finance PLC 3.5% 05/22/2014 703,970 668,075
BRITISH VIRGIN ISLANDS (1.2%)
USD 600,000 CNOOC Finance 2011 Ltd., 4.25% 01/26/2021 566,219 567,485
UAE DIRHAM (0.7%)
USD 300,000 Emirate of Abu Dhabi 5.5% 04/08/2014 376,038 318,269
CHINA (0.6%)
USD 300,000 CNPC HK Overseas Capital Ltd., 4.5% 04/28/2021 281,714 282,507
FRANCE (0.4%)
3,543 Total SA, ADR 200,420 197,676
NETHERLANDS (0.4%)
USD 200,000 Shell International Finance BV 1.875% 03/25/2013 200,560 197,039
Total Long Positions 20,312,496 20,560,259
SHORT POSITIONS (-17.6%)
U.S.A. (-18.2%)
USD (355,000) City National Corp., 5.125% 02/15/2013 (317,487) (357,944)
(5,400) iShares Dow Jones US Transport Index Fund (497,174) (510,439)
(72,500) iShares MSCI Japan Index Fund (758,134) (729,293)
(11,472) Retail Holders Trust (1,159,077) (1,201,901)
(46,184) SPDR Trust, Series 1 (5,605,968) (5,878,231)
(8,337,840) (8,677,808)
AUSTRALIA (-0.6%)
(5,267) Commonwealth Bank of Australia (248,868) (284,921)
Total Short Positions (8,586,708) (8,962,729)
Percentages shown in brackets relate investments at fair value to net assets of the Trust.The accompanying notes are an integral part of these financial statements.
Statement of Investment Portfolio (as at June 30, 2011) (cont’d)
TRIDENT PERFORMANCE TRUST
Financial Statements (unaudited) (cont’d)

16 Semi-Annual Financial Statements as at June 30, 2011
Statement of Investment Portfolio (as at June 30, 2011) (cont’d)
Percentages shown in brackets relate investments at fair value to net assets of the Trust.The accompanying notes are an integral part of these financial statements.
TRIDENT PERFORMANCE TRUST
Financial Statements (unaudited) (cont’d)
Number of Shares/ Average Fair
Par Value Description Cost ($) Value ($)
Commissions and other Portfolio Transaction Costs (19,703)
Total Bonds & Equities (24.4%) 11,706,085 11,597,530
Short-Term Investments (4.4%) 2,131,621 2,106,240
DERIVATIVE INSTRUMENTS
Foreign Currency Forward Contracts (0.6%)
(see Schedule A) 297,068
Futures Contracts (-0.1%)
(see Schedule B) (38,605)
Short Option Contracts (0.0%)
(see Schedule C) (30,476) (15,206)
Long Option Contracts (4.9%)
(see Schedule D) 3,313,041 2,320,835
Interest Rate Swap Contracts (0.3%)
(see Schedule E) – 128,145
Credit Default Swap Contracts (-1.4%)
(see Schedule F) (366,944) (668,266)
Total Investments (33.1%) 16,753,327 15,727,741
Other Assets (net) (66.9%) 31,878,187
Net Assets (100.0%) 47,605,928
Principal amounts stated in:
USD U.S. DOLLAR

17Semi-Annual Financial Statements as at June 30, 2011
Schedule A
Foreign Currency Forward Contracts (0.6%)
Credit Rating of Settlement Contract Unrealized
Contracts Counterparty the Counterparty‡ Date Rate ($) Pay Receive Gain (Loss) ($)
1 Goldman, Sachs & Co. A-1 07-Nov-11 1.64 (608,419) British Pound 1,000,001 US $ 24,235
1 Goldman, Sachs & Co. A-1 11-Aug-11 46.85 (45,000,000) Indian Rupee 960,512 US $ (38,685)
1 Goldman, Sachs & Co. A-1 20-Sep-11 81.78 (108,437,303) Japanese Yen 1,325,967 US $ (20,955)
1 Goldman, Sachs & Co. A-1 16-Aug-11 83.39 (80,100,000) Japanese Yen 960,489 US $ (33,532)
1 Goldman, Sachs & Co. A-1 15-Jul-11 28.15 (70,475,000) Russian Ruble 2,503,330 US $ (15,944)
1 Goldman, Sachs & Co. A-1 20-Sep-11 1.28 (1,680,000) Singaporean $ 1,307,902 US $ (57,848)
1 Goldman, Sachs & Co. A-1 16-Aug-11 0.01 (1,011,664) US $ 80,100,000 Japanese Yen (15,808)
1 Goldman, Sachs & Co. A-1 20-Sep-11 0.01 (1,378,559) US $ 108,437,304 Japanese Yen (29,738)
1 Goldman, Sachs & Co. A-1 20-Sep-11 1.27 (1,325,967) US $ 1,680,000 Singaporean $ 40,435
1 Goldman, Sachs & Co. A-1 11-Jul-11 0.98 (30,681,278) US $ 30,000,000 Canadian $ 400,949
1 Goldman, Sachs & Co. A-1 11-Aug-11 46.85 (960,492) US $ 45,000,000 Indian Rupee 38,704
1 Goldman, Sachs & Co. A-1 03-Nov-11 45.90 (1,000,000) US $ 45,900,000 Indian Rupee 5,255
Total Foreign Currency Forward Contracts Value 297,068
‡ Credit ratings are obtained from Standard & Poor’s, where available, otherwise ratings are obtained from: Moody’s Investors Service, Dominion Bond Rating Services or
Canadian Bond Rating Services.
Schedule B
Futures Contracts (-0.1%)
Fair
Contract Future Expiry Date Price ($) Country Cost ($) Value ($)
(4) Australian SPI 200 Index Futures 15-Sep-11 4,601.00 Australian $ (472,066) (475,893)
(89) CBOT 10YR US Tresaury-Note Futures 21-Sep-11 122.33 US $ (10,477,551) (10,500,163)
(11) CBOT 5YR US Treseaury-Note Futures 30-Sep-11 119.36 US $ (1,262,729) (1,264,537)
(3) Comex Gold 100 Oz Futures 29-Aug-11 1,502.80 US $ (436,396) (434,813)
5 EUREX Bund Futures 08-Sep-11 125.48 Euro 875,468 877,510
46 MTL 10YR Canadian Bond Futures 21-Sep-11 123.99 Canadian $ 5,707,220 5,703,540
(2) OSA Nikkei 225 Index Futures 09-Sep-11 9,820.00 Japanese Yen (224,984) (235,287)
(6,291,038) (6,329,643)
Exercise Price ($) (6,291,038)
Total Futures Contracts Value (38,605)
Percentages shown in brackets relate investments at fair value to net assets of the Trust.The accompanying notes are an integral part of these financial statements.
Statement of Investment Portfolio (as at June 30, 2011) (cont’d)
TRIDENT PERFORMANCE TRUST
Financial Statements (unaudited) (cont’d)

18 Semi-Annual Financial Statements as at June 30, 2011
Schedule C
Short Option Contracts (0.0%)
No of . Expiry Strike Premium Paid Fair
Contract underlying Interest Underlying Interest Date Price ($) (Received) ($) Value ($)
(68) (6,800) Energy Select Sector SPDR@68 16-Jul-11 68.00 (992) (656)
(69) (6,900) Energy Select Sector SPD@68 30-Sep-11 68.00 (10,496) (9,317)
(300) (30,000) [email protected] Call Opt. 31-Aug-11 132.50 (5,524) (2,937)
(4) (400) Gold @1250 Call Opt. 15-Dec-11 1,250.00 (13,464) (2,297)
Total Short Option Contracts Value (30,476) (15,206)
Schedule D
Long Option Contracts (4.9%)
No of . Expiry Strike Premium Paid Fair
Contract underlying Interest Underlying Interest Date Price ($) (Received) ($) Value ($)
250,000 25,000,000 2Yr-10Yr Swap Spread Cap@200Bps 05-Jun-12 0.02 95,239 120,044
200,000 20,000,000 2Yr-10Yr Swap Spread Cap@200Bps 19-Feb-13 0.02 43,401 69,174
300,000 30,000,000 2Yr-10Yr Swap Spread Cap@225Bps 06-Dec-12 0.02 92,587 78,492
600,000 60,000,000 2Yr-10Yr Swap Spread Cap@225Bps 13-Nov-12 0.02 164,921 172,942
350,000 35,000,000 2Yr-10Yr Swap Spread Cap@225Bps 21-Jun-12 0.02 118,145 113,034
68 6,800 Energy Select Sector SPDR@78 16-Jul-11 78.00 1,195 1,508
69 6,900 Energy Select Sector SPDR@78 30-Sep-11 78.00 11,280 13,975
30 30,000 [email protected] Call Opt. 31-Aug-11 128.50 27,413 16,784
4 400 Gold@1500 Call Opt. 15-Dec-11 1,500.00 20,041 19,289
4 400 Gold @1575 Call Opt. 07-Oct-11 1,575.00 14,274 9,004
11 1,100 IDIX3 BRL @312000 01-Jul-11 312,000.00 77,505 –
1,080,000,000 108,000,000,000 KRW 2S10S Curve Cap @75Bps Gs 26-Aug-11 0.75 68,342 –
500,000 50,000,000 OTC Opt. 10Yr GBP/EUR@150 Bp Gs 19-Aug-11 1.50 69,932 –
8 800 OTC Opt. JPMCCI Gold Index@1400 11-Jul-11 1,400.00 57,481 79,301
270,000 27,000,000 OTC Swaption [email protected]% 30-Apr-12 0.06 159,182 269,196
180,000 18,000,000 OTC Swaption AUD [email protected]% 10-Nov-11 0.05 83,781 44,420
150,000 15,000,000 OTC Swaption AUD [email protected]% 17-Nov-11 0.05 83,781 56,883
130,000 13,000,000 OTC Swaption AUD [email protected]% 21-Nov-11 0.05 133,117 17,118
250,000 25,000,000 OTC Swaption AUD Rec. 18M-Yr [email protected] 09-Feb-12 0.05 67,878 29,194
250,000 25,000,000 OTC Swaption AUD Rec. 2Yr-2Yr [email protected]% 08-Mar-12 0.05 116,361 172,183
290,000 29,000,000 OTC Swaption AUD Rec. 2Yr-2Yr [email protected]% 19-Sep-11 0.05 167,974 163,529
160,000 16,000,000 OTC Swaption AUD Rec. 5Yr [email protected]% 03-Aug-11 0.05 132,393 24,163
6,440,000 644,000,000 OTC Swaption JYP 2Yr-10Yr [email protected] 24-Oct-11 0.03 76,312 32
6,400,000 640,000,000 OTC Swaption JYP 2Yr-10Yr [email protected] 25-Oct-11 0.03 76,681 32
7,500,000 750,000,000 OTC Swaption JYP 2Yr-10Yr [email protected] 15-Oct-12 0.03 48,519 37,083
10,200,000 1,020,000,000 OTC Swaption JYP 2Yr-10Yr [email protected] 07-Nov-11 0.03 151,523 257
Percentages shown in brackets relate investments at fair value to net assets of the Trust.The accompanying notes are an integral part of these financial statements.
Statement of Investment Portfolio (as at June 30, 2011) (cont’d)
TRIDENT PERFORMANCE TRUST
Financial Statements (unaudited) (cont’d)
19Semi-Annual Financial Statements as at June 30, 2011
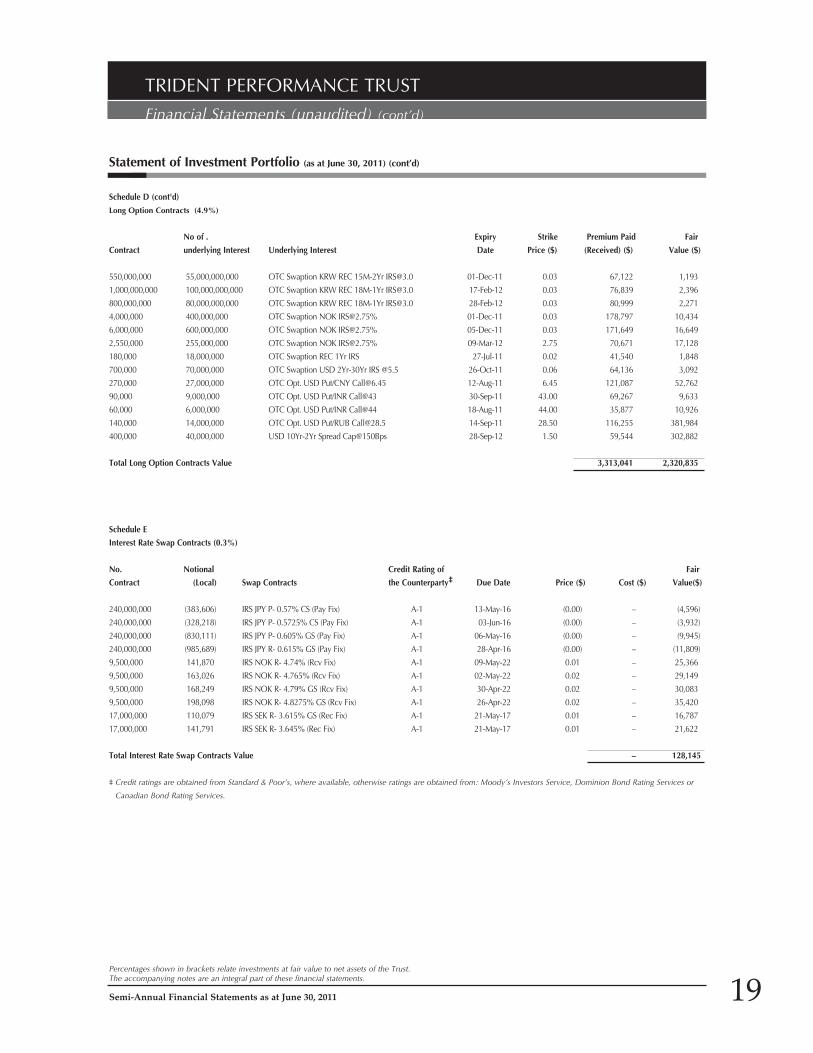
Schedule D (cont'd)
Long Option Contracts (4.9%)
No of . Expiry Strike Premium Paid Fair
Contract underlying Interest Underlying Interest Date Price ($) (Received) ($) Value ($)
550,000,000 55,000,000,000 OTC Swaption KRW REC 15M-2Yr [email protected] 01-Dec-11 0.03 67,122 1,193
1,000,000,000 100,000,000,000 OTC Swaption KRW REC 18M-1Yr [email protected] 17-Feb-12 0.03 76,839 2,396
800,000,000 80,000,000,000 OTC Swaption KRW REC 18M-1Yr [email protected] 28-Feb-12 0.03 80,999 2,271
4,000,000 400,000,000 OTC Swaption NOK [email protected]% 01-Dec-11 0.03 178,797 10,434
6,000,000 600,000,000 OTC Swaption NOK [email protected]% 05-Dec-11 0.03 171,649 16,649
2,550,000 255,000,000 OTC Swaption NOK [email protected]% 09-Mar-12 2.75 70,671 17,128
180,000 18,000,000 OTC Swaption REC 1Yr IRS 27-Jul-11 0.02 41,540 1,848
700,000 70,000,000 OTC Swaption USD 2Yr-30Yr IRS @5.5 26-Oct-11 0.06 64,136 3,092
270,000 27,000,000 OTC Opt. USD Put/CNY [email protected] 12-Aug-11 6.45 121,087 52,762
90,000 9,000,000 OTC Opt. USD Put/INR Call@43 30-Sep-11 43.00 69,267 9,633
60,000 6,000,000 OTC Opt. USD Put/INR Call@44 18-Aug-11 44.00 35,877 10,926
140,000 14,000,000 OTC Opt. USD Put/RUB [email protected] 14-Sep-11 28.50 116,255 381,984
400,000 40,000,000 USD 10Yr-2Yr Spread Cap@150Bps 28-Sep-12 1.50 59,544 302,882
Total Long Option Contracts Value 3,313,041 2,320,835
Schedule E
Interest Rate Swap Contracts (0.3%)
No. Notional Credit Rating of Fair
Contract (Local) Swap Contracts the Counterparty‡ Due Date Price ($) Cost ($) Value($)
240,000,000 (383,606) IRS JPY P- 0.57% CS (Pay Fix) A-1 13-May-16 (0.00) – (4,596)
240,000,000 (328,218) IRS JPY P- 0.5725% CS (Pay Fix) A-1 03-Jun-16 (0.00) – (3,932)
240,000,000 (830,111) IRS JPY P- 0.605% GS (Pay Fix) A-1 06-May-16 (0.00) – (9,945)
240,000,000 (985,689) IRS JPY R- 0.615% GS (Pay Fix) A-1 28-Apr-16 (0.00) – (11,809)
9,500,000 141,870 IRS NOK R- 4.74% (Rcv Fix) A-1 09-May-22 0.01 – 25,366
9,500,000 163,026 IRS NOK R- 4.765% (Rcv Fix) A-1 02-May-22 0.02 – 29,149
9,500,000 168,249 IRS NOK R- 4.79% GS (Rcv Fix) A-1 30-Apr-22 0.02 – 30,083
9,500,000 198,098 IRS NOK R- 4.8275% GS (Rcv Fix) A-1 26-Apr-22 0.02 – 35,420
17,000,000 110,079 IRS SEK R- 3.615% GS (Rec Fix) A-1 21-May-17 0.01 – 16,787
17,000,000 141,791 IRS SEK R- 3.645% (Rec Fix) A-1 21-May-17 0.01 – 21,622
Total Interest Rate Swap Contracts Value – 128,145
‡ Credit ratings are obtained from Standard & Poor’s, where available, otherwise ratings are obtained from: Moody’s Investors Service, Dominion Bond Rating Services or
Canadian Bond Rating Services.
Percentages shown in brackets relate investments at fair value to net assets of the Trust.The accompanying notes are an integral part of these financial statements.
Statement of Investment Portfolio (as at June 30, 2011) (cont’d)
TRIDENT PERFORMANCE TRUST
Financial Statements (unaudited) (cont’d)

Semi-Annual Financial Statements as at June 30, 2011
Schedule F
Credit Default Swap Contracts (-1.4%)
No. Notional Credit Rating of Fair
Contract (Local) Swap Contracts the Counterparty‡ Due Date Price ($) Cost ($) Value($)
1,100,000 (4,094) Allianz Se., -1.00% (Pay Cpn) A-1 20-Sep-14 (0.01) (15,329) (21,056)
1,000,000 489 AutoZone Inc., -1% (Pay Cpn) A-1 20-Jun-14 (0.02) (17,941) (17,470)
800,000 11,569 Aviva PLC., 1% Bp Gs A-1 20-Mar-16 0.01 (1,047) 15,134
1,000,000 24,479 Banco Santander SA., 1% (Pay Cpn) A-1 20-Jun-14 0.02 - 23,608
1,200,000 622 Capital One Financial Corp., 1% (Pay Cpn) A-1 20-Jun-14 (0.01) (10,298) (9,698)
750,000 (41,909) Carnival Corp., -1% (Pay Cpn) A-1 20-Sep-14 (0.01) 31,444 (8,976)
500,000 (13,615) Cdx.Na.Ig.Hvol.14-V1., 1% Gs A-1 20-Jun-15 0.00 14,233 1,102
1,000,000 7,453 Accor Sa., 1% Bp Cs A-1 20-Mar-16 0.00 7,966 778
1,100,000 1,577 Ace Ina., 1% Bp Cs A-1 20-Jun-16 (0.00) (3,534) (2,013)
1,200,000 6,148 Aunto Du France., 1% Bp A-1 20-Mar-16 (0.01) (13,209) (7,279)
1,200,000 625 Government of Australia., 1% Sp BAR A-1 20-Mar-16 0.02 24,888 25,491
1,200,000 (1,266) Government of Australia., 1% Sp Cs A-1 20-Mar-16 0.02 26,015 24,794
1,200,000 3,800 Aust&Nz., 1% Bp BAR A-1 20-Mar-16 0.01 5,407 9,072
1,000,000 4,047 Bouygues Sa., 1% Bp Cs A-1 20-Mar-16 (0.01) (13,360) (9,456)
1,200,000 1,235 Cie De St-Gobain., 1% Bp BAR A-1 20-Mar-16 0.00 (1,089) 102
1,200,000 150 Cred Suisse., 1% Bp JPM A-1 20-Jun-14 (0.01) (15,424) (15,279)
1,200,000 8,073 Deutsche Bank., 1% Bp BAR A-1 20-Jun-14 (0.01) (16,966) (9,180)
1,200,000 6,449 Deutsche Bank., 1% Bp JPM A-1 20-Jun-14 (0.01) (14,310) (8,091)
2,400,000 19,776 Republic of France., 0.25% Sp BAR A-1 20-Mar-16 (0.02) (70,073) (51,000)
3,000,000 25,931 Republic of France., 0.25% Sp Cs A-1 20-Mar-16 (0.02) (89,463) (64,453)
2,000,000 34,458 Republic of France., 0.25% Sp Cs A-1 20-Mar-16 (0.02) (76,201) (42,968)
1,200,000 (3,392) General Electric Capital Corp., 1% Bp 03/20/14 Cs A-1 20-Jun-14 (0.01) (3,416) (6,688)
2,400,000 11,139 Government of Germany., 0.25% Sp BAR A-1 20-Jun-16 (0.01) (25,979) (15,236)
2,400,000 10,121 Government of Germany., 0.25% Sp JPM A-1 20-Jun-16 (0.01) (23,613) (13,852)
1,200,000 1,978 JPMorgan Chase & Co., 1% Bp BAR A-1 20-Jun-14 (0.02) (24,395) (22,487)
1,000,000 (5,568) Klepierre., 1% Bp CS A-1 20-Mar-16 (0.01) (455) (5,825)
1,000,000 1,932 Publicis Groupe., 1% Bp Cs A-1 20-Mar-16 (0.01) (11,298) (9,435)
1,500,000 (3,750) Republic of China., 1% Sp A-1 20-Mar-16 0.01 18,571 14,955
1,200,000 6,396 UBS., 1% Bp BAR A-1 20-Jun-14 (0.01) (17,340) (11,171)
1,000,000 (2,178) Vivendi Universal SA., 1% Bp Cs A-1 20-Mar-16 0.00 2,789 689
1,200,000 3,422 Wells Fargo & Co., 1% Bp A-1 20-Jun-14 (0.02) (21,766) (18,466)
1,200,000 5,236 Westpac Banking Corp., 1% Bp Cs A-1 20-Mar-16 0.01 5,407 10,458
900,000 21,143 Commerzbank Aktiengesellschaft Bp Gs A-1 20-Mar-15 0.01 (8,750) 11,642
750,000 (13,593) Commonwealth Bank of Australia. 1% Bp Gs A-1 20-Jun-15 0.00 13,638 528
1,100,000 (38,907) Darden Restaurants Inc., -1.90% (Pay Cpn) A-1 20-Mar-14 (0.04) - (37,523)
600,000 (23,648) Darden Restaurants Inc., -2.13% (Pay Cpn) A-1 20-Dec-13 (0.04) - (22,807)
900,000 4,623 Dow Jones iTraxx Europ S12 Bp A-1 20-Dec-14 (0.00) (12,695) (6,230)
250,000 (13,137) Federated Dept (Macy's)., 1% Bp Gs A-1 20-Sep-15 (0.01) 10,922 (1,748)
1,000,000 8,175 French Republic 0.25% Sp Gs A-1 20-Mar-16 (0.02) (28,730) (20,845)
750,000 (8,698) HSBC Bank PLC 1% Bp Cs A-1 20-Jun-15 (0.01) (1,711) (10,099)
500,000 (3,521) Ingersoll Rand Co., 1% Bp Gs A-1 20-Jun-15 (0.03) (10,455) (13,851)
800,000 (13,954) Ingersoll Rand Co., Bp Gs A-1 20-Mar-15 (0.03) (7,878) (21,336)
500,000 (21,382) J. C. Penney Company 1% (Pay Cpn) A-1 20-Jun-14 0.00 22,361 1,739
500,000 (20,569) J. C. Penney Company 1% (Pay Cpn) A-1 20-Jun-14 0.00 21,577 1,739
‡ Credit ratings are obtained from Standard & Poor’s, where available, otherwise ratings are obtained from: Moody’s Investors Service, Dominion Bond Rating Services or
Canadian Bond Rating Services.
Statement of Investment Portfolio (as at June 30, 2011) (cont’d)
TRIDENT PERFORMANCE TRUST
Financial Statements (unaudited) (cont’d)
20Percentages shown in brackets relate investments at fair value to net assets of the Trust.The accompanying notes are an integral part of these financial statements.

21Semi-Annual Financial Statements as at June 30, 2011
Schedule F (cont'd)
Credit Default Swap Contracts (-1.4%)
No. Notional Credit Rating of Fair
Contract (Local) Swap Contracts the Counterparty‡ Due Date Price ($) Cost ($) Value($)
1,100,000 (36,868) John Hancock Financial Services, Inc.,
-2.10% (Pay Cpn) A-1 20-Mar-14 (0.03) - (35,557)
1,100,000 1,666 J.P. Morgan Chase & Co., 1% Bp Gs A-1 20-Jun-14 (0.02) (18,223) (16,616)
1,200,000 1,194 Linde Finance., 1% Bp Gs A-1 20-Mar-16 (0.02) (28,259) (27,108)
500,000 (2,525) MGIC Investment Corp., -4.40% (Pay Cpn) A-1 20-Jun-13 (0.01) - (2,435)
80,000,000 (282,171) Mitsui OSK Lines Ltd., 1% Bp Gs A-1 20-Mar-16 (0.01) (9,067) (12,447)
750,000 (29,206) Mohawk Industries Inc., 1% Gs A-1 20-Jun-15 0.02 39,124 10,955
800,000 8,889 Munich Re Ag, 1% Bp Gs A-1 20-Mar-16 (0.01) (26,160) (13,728)
1,200,000 (12,288) Newell Rubbermaid Inc., -1.04% (Pay Cpn) A-1 20-Dec-13 (0.01) - (11,851)
500,000 (42,012) Nordstrom Inc., -1% (Pay Cpn) A-1 20-Jun-14 (0.02) 33,039 (7,479)
400,000 (7,408) Nordstrom Inc., -1.17% (Pay Cpn) A-1 20-Sep-13 (0.02) - (7,144)
800,000 (5,226) Pearson PLC Bp Gs A-1 20-Mar-15 (0.02) (7,855) (12,895)
1,200,000 (14,137) Pitney Bowes Inc., -1.09% (Pay Cpn) A-1 20-Dec-13 (0.01) - (13,634)
1,100,000 (1,706) Republic of China., 1% (Pay Cpn) A-1 21-Sep-16 0.01 10,005 8,359
1,000,000 (2,282) Republic of China., 1% Sp Gs A-1 20-Mar-16 0.01 11,689 9,488
1,000,000 (2,560) Republic of China., 1% Sp Gs A-1 20-Mar-16 0.01 11,957 9,488
1,200,000 (4,766) Republic of China., 1% Sp Gs A-1 20-Jun-16 0.01 14,840 10,244
2,000,000 17,153 Republic of Germany., 0.25% Sp Gs A-1 20-Mar-16 (0.01) (26,322) (9,779)
1,000,000 8,094 Republic of Germany., 0.25% Sp Gs A-1 20-Mar-16 (0.01) (12,696) (4,890)
1,200,000 6,566 Republic of Germany., 0.25% Sp Gs A-1 20-Mar-16 (0.01) (12,200) (5,867)
1,500,000 (15,177) Target Corp., -1% Gs A-1 20-Jun-15 (0.02) (18,706) (33,343)
500,000 (12,094) Target Corp., -1% Gs A-1 20-Jun-14 (0.02) 1,589 (10,075)
500,000 (21,970) Black & Decker Corp., 1% (Pay Cpn) A-1 20-Jun-14 (0.02) 10,439 (10,750)
1,000,000 (55,637) Black & Decker Corp., -1% (Pay Cpn) A-1 20-Jun-14 (0.02) 32,159 (21,500)
600,000 (18,462) Black & Decker Corp., -1.45% (Pay Cpn) A-1 20-Dec-13 (0.03) - (17,806)
1,100,000 (25,145) Sherwin-Williams Co., -1.18% (Pay Cpn) A-1 20-Dec-13 (0.02) - (24,251)
1,200,000 (17,477) The Stanley Works., -0.90% (Pay Cpn) A-1 20-Dec-13 (0.01) - (16,855)
1,000,000 (7,746) The Stanley Works., Bp Gs A-1 20-Mar-15 (0.02) (11,510) (18,981)
1,100,000 3,201 Wells Fargo Co., 1% Bp Gs A-1 20-Jun-14 (0.01) (17,550) (14,463)
750,000 (5,444) Wells Fargo Co., 1% Bp Gs A-1 20-Jun-15 (0.01) (2,740) (7,991)
1,500,000 (5,517) Whirlpool Corp., 1% Bp Gs A-1 20-Sep-15 0.01 18,788 13,468
800,000 (2,446) Wolters Kluwer N.V. Bp Gs A-1 20-Mar-15 (0.01) (7,778) (10,136)
Total Credit Default Swap Contracts Value (366,944) (668,266)
‡ Credit ratings are obtained from Standard & Poor’s, where available, otherwise ratings are obtained from: Moody’s Investors Service, Dominion Bond Rating Services or
Canadian Bond Rating Services.
Statement of Investment Portfolio (as at June 30, 2011) (cont’d)
TRIDENT PERFORMANCE TRUST
Financial Statements (unaudited) (cont’d)
Percentages shown in brackets relate investments at fair value to net assets of the Trust.The accompanying notes are an integral part of these financial statements.

22 Semi-Annual Financial Statements as at June 30, 2011
Statements of Net Assets (in $000’s except for per unit amounts and number of units outstanding)
The accompanying notes are an integral part of these financial statements.
TRIDENT PERFORMANCE TRUST
Financial Statements (unaudited) (cont’d)
ASSETSInvestments at fair value*CashShort Term Investments Daily variation margin on derivative investmentsSwaps, swaptions and options at fair valueUnrealized gain on futures and forward currency contractsMargin for short salesReceivable for securities soldDividends and accrued interest receivable
LIABILITIESManagement fees payableAccrued expenses Dividend payable on securities sold shortInterest payable on securities sold shortUnrealized loss on futures and forward currency contractsPayable for securities purchasedPayable for unit redemptionsPerformance fees payableInvestments sold short at fair value**
Net assets and unitholders’ equity
UNITHOLDERS’ EQUITYUnit capitalContributed surplusRetained earnings (deficit)Net assets and unitholders’ equity
*Investments at cost**Investments sold short at cost
Net assets per classClass AClass A II
Net assets per unit (Note 9)Class AClass A II
Number of units outstanding (Note 3) Class AClass A II
As at December 31, 2010
14,43130,051
–1,3362,109
58812,3939,256
6870,232
568
8327
2355,259
20,670–
7,16833,506
36,726
35,192–
1,53436,726
13,527 (6,724)
13,23723,489
12.539.54
1,056,4682,460,978
As at June 30, 2011
20,56022,9172,1061,6361,766
5137,445
–136
57,079
486
727
255122
––
8,9639,473
47,606
47,294148164
47,606
20,293(8,587)
26,65220,954
12.119.23
2,200,2592,271,300

23Semi-Annual Financial Statements as at June 30, 2011
Statements of Operations and Retained Earnings (Deficit) (in $000’s except for per unit amounts)
The accompanying notes are an integral part of these financial statements.
TRIDENT PERFORMANCE TRUST
Financial Statements (unaudited) (cont’d)
INVESTMENT INCOMEDividendsInterest Derivative income (loss)Securities lendingLess: Foreign withholding taxes
EXPENSESManagement fees (Note 4)Administrative fees (Note 4)Dividend expense on securities sold shortInterest expense on securities sold shortPerformance fees (Note 4)Interest expenseLegal feesAudit feesGoods and services tax/Harmonized sales tax (Note 4)
Net investment income (loss) for the period
Realized and unrealized gain (loss) on investments and commissions and other portfolio transaction costsRealized gain (loss) on investmentsForeign exchange gain (loss)Commissions and other portfolio transaction costsChange in unrealized appreciation (depreciation) of investments and derivativesNet gain (loss) on investments
Increase (decrease) in net assets from operations
Increase (decrease) in net assets from operations per classClass AClass A II
Increase (decrease) in net assets from operations per unit Class AClass A II
STATEMENTS OF RETAINED EARNINGS (DEFICIT)Retained earnings (deficit), beginning of period Increase (decrease) in net assets from operations(Excess) deficiency on amounts paid on units redeemedDistribution from incomeDistribution from realized gainsRetained earnings (deficit), end of period
Contributed surplus, beginning of period(Excess) deficiency on amounts paid on units redeemedContributed surplus, end of period
For the periods ended June 302010
98 147
(379)–
(13) (147)
332 80 79 75
– 66
–3
19 654
(801)
(2,093) (100) (40)
3,341 1,108
307
114 193
0.07 0.06
7,533 307
(3,476) ––
4,364
–––
2011
99278
(475)(19)(14)
(131)
246337618
–111
––
16500
(631)
(275)(375)(34)(55)
(739)
(1,370)
(585)(785)
(0.31)(0.32)
1,534(1,370)
–––
164
–148148
24 Semi-Annual Financial Statements as at June 30, 2011
The accompanying notes are an integral part of these financial statements.
TRIDENT PERFORMANCE TRUST
Financial Statements (unaudited) (cont’d)
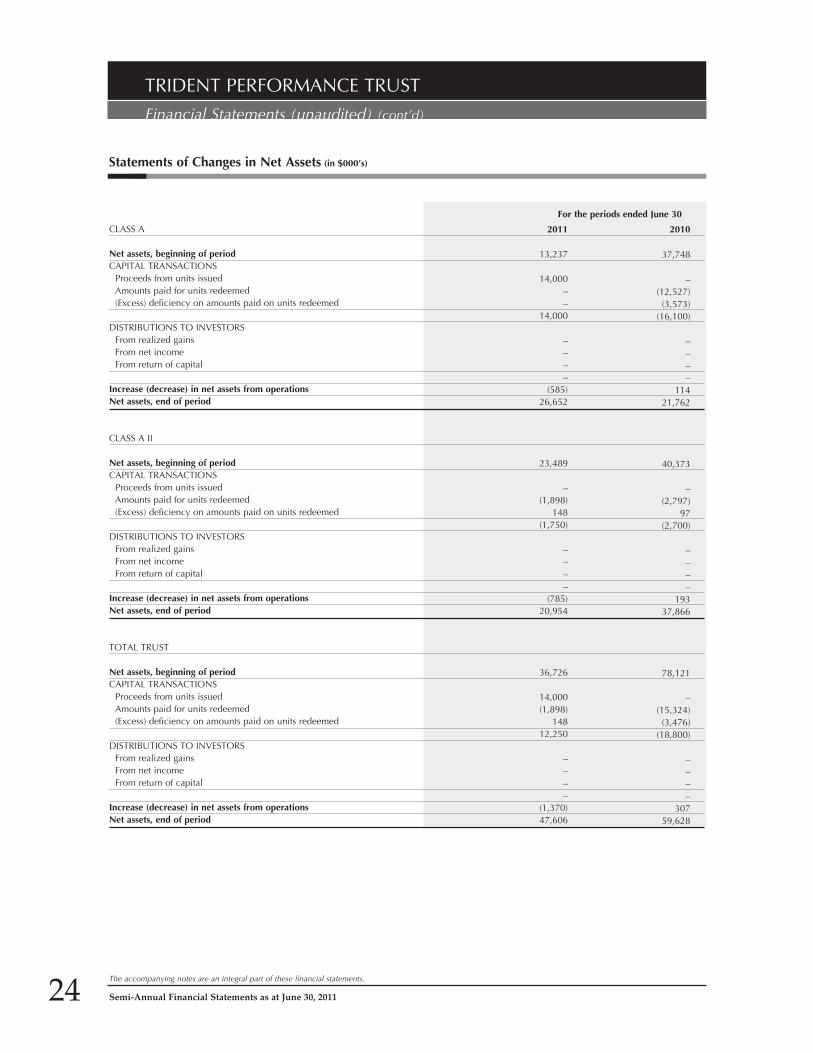
CLASS A
Net assets, beginning of periodCAPITAL TRANSACTIONS Proceeds from units issued Amounts paid for units redeemed (Excess) deficiency on amounts paid on units redeemed
DISTRIBUTIONS TO INVESTORS From realized gains From net income From return of capital
Increase (decrease) in net assets from operationsNet assets, end of period
CLASS A II
Net assets, beginning of periodCAPITAL TRANSACTIONS Proceeds from units issued Amounts paid for units redeemed (Excess) deficiency on amounts paid on units redeemed
DISTRIBUTIONS TO INVESTORS From realized gains From net income From return of capital
Increase (decrease) in net assets from operationsNet assets, end of period
TOTAL TRUST
Net assets, beginning of periodCAPITAL TRANSACTIONS Proceeds from units issued Amounts paid for units redeemed (Excess) deficiency on amounts paid on units redeemed
DISTRIBUTIONS TO INVESTORS From realized gains From net income From return of capital
Increase (decrease) in net assets from operationsNet assets, end of period
Statements of Changes in Net Assets (in $000’s)
For the periods ended June 30
2010
37,748
– (12,527) (3,573)
(16,100)
––––
114 21,762
40,373
– (2,797)
97 (2,700)
––––
193 37,866
78,121
– (15,324) (3,476)
(18,800)
––––
307 59,628
2011
13,237
14,000––
14,000
––––
(585)26,652
23,489
–(1,898)
148(1,750)
––––
(785)20,954
36,726
14,000(1,898)
14812,250
––––
(1,370)47,606

25Semi-Annual Financial Statements as at June 30, 2011
The accompanying notes are an integral part of these financial statements.
TRIDENT PERFORMANCE TRUST
Financial Statements (unaudited) (cont’d)
Statements of Cash Flows (in $000’s)
CASH PROVIDED BY (USED IN) OPERATING ACTIVITIESNet investment income (loss)Proceeds from sale of investmentsPurchase of investments(Increase) decrease in margin for short sales(Increase) decrease in daily variation margin on derivative instrumentsNet change in non-cash balances related to operations
FINANCING ACTIVITIESLoan facility (Note 7)Distributions paidProceeds from units issuedCost of units redeemed
Increase (decrease) in cash during the period
Cash (Bank overdraft), beginning of period
Cash (Bank overdraft), end of period
For the periods ended June 302010
(801) 25,646
(23,039) 1,858
(1,072) 26
2,618
–––
(18,800) (18,800)
(16,182)
51,178
34,996
2011
(631)26,618
(29,240)4,948(300)(109)1,286
––
14,000(22,420) (8,420)
(7,134)
30,051
22,917

26 Semi-Annual Financial Statements as at June 30, 2011
TRIDENT PERFORMANCE TRUST
Trust Specific Financial Instruments Risks (Note 13) (unaudited)
Other Price Risk
As at June 30, 2011 and December 31, 2010, the Trust was exposed to other price risk as it was invested in a diversified portfolio of international
equities. As a result, the Trust was sensitive to changes in global economic conditions. The Trust has a long/short equity strategy that is taken via macro
themes initiated by the portfolio manager to express bearish and bullish views within particular sectors. This strategy can reduce total exposure to the
market as the short positions offset the long positions sensitivity to the overall market.
As at June 30, 2011, had the global markets increased or decreased by 10% (December 31, 2010 - 10%), with all other variables held constant, net
assets of the Trust would have increased or decreased, respectively, by approximately $259,000 (December 31, 2010 - $499,000). In practice, actual
results may differ from this analysis and the difference may be material.
The Trust’s investments were concentrated in the following segments:
as at December 31, 2010Category Net Assets (%)
Long PositionsOther Assets (net) 73.5U.S.A. 25.1Long Options Contracts 6.8Canada 6.3Japan 3.4Isle Of Man 2.0Netherlands 1.1Uae Dirham 0.9Foreign Currency Forward Contracts 0.7France 0.6Future Contracts 0.2Total Long Positions 120.6
Short PositionsCredit Default Swap Contracts -1.0Australia -0.6U.S.A. -19.0Total Short Positions -20.6
During the six-month period the Trust's exposure to other price risk, credit risk, currency risk and fair value hierarchy changed significantly as
disclosed in the section below. For details relating to interest rate risk, refer to the audited annual financial statements as at December 31, 2010,
as the Trust's exposure to interest rate risk remains unchanged.
The accompanying notes are an integral part of these financial statements.

27Semi-Annual Financial Statements as at June 30, 2011
TRIDENT PERFORMANCE TRUST
Trust Specific Financial Instruments Risks (Note 13) (unaudited) (cont’d)
The accompanying notes are an integral part of these financial statements.
Credit Risk
CREDIT RATING^
AA/Aa/A+ 14.1 A 4.2 BBB/Baa/B++ 8.1 Not Rated 5.8 Total 32.2
Net Assets (%)
As at June 30, 2011 and December 31, 2010, the majority of the Trust’s assets were invested in listed securities in the form of common stock
that pose no credit risk. However, the Trust seeks to obtain a positive return on the default of low investment grade fixed income investments
and mortgage backed securities mainly through the investments in credit default swaps with counterparties. These investments are exposed to the
risk of impairment when there is risk of credit default in the market. All fixed income securities rated BB/Ba/B+ or lower are considered below
investment grade and have a higher credit risk than investment grade bonds.
The Trust was invested in fixed income securities, preferred securities and derivative instruments if any, with the following credit ratings:
as at June 30, 2011*
CREDIT RATING^
AA/Aa/A+ 10.4 A 1.3 BBB/Baa/B++ 6.2 Not Rated 2.0 Total 19.9
as at December 31, 2010*
Net Assets (%)
* Credit ratings are obtained from Standard & Poor’s, where available, otherwise ratings are obtained from: Moody’s Investors Service, Dominion Bond Rating Services or Canadian Bond Rating Services, respectively.
^Refer to Note 13 for Credit Rating cross reference.

28 Semi-Annual Financial Statements as at June 30, 2011
Currency Risk
As at June 30, 2011 and December 31, 2010, the Trust was exposed to currency risk at some of its assets were denominated in currencies other than
Canadian dollars, the functional currency of the Trust.
The tables below summarize the Trust’s exposure to currency risk.
as at June 30, 2011
CURRENCY
Hong Kong Dollar 2,123 – 2,123 4.5 Indian Rupee – 992 992 2.1 US Dollar 27,354 (26,738) 616 1.3 Norwegian Krone (8) 164 156 0.3 Swedish Krona – 38 38 0.1 Korean Won – 5 5 – Euro (186) (12) (198) (0.4)Australian Dollar (1,381) 777 (604) (1.3)Japanese Yen (671) (6) (677) (1.4)British Pound (322) (942) (1,264) (2.7)Russian Rouble – (2,434) (2,434) (5.1)Total 26,909 (28,156) (1,247) (2.6)
Financial Instruments Derivatives Total Currency Exposure Exposure Exposure Net Assets (in $000’s) (in $000’s) (in $000’s) (%)
TRIDENT PERFORMANCE TRUST
Trust Specific Financial Instruments Risks (Note 13) (unaudited) (cont’d)
CURRENCY
Swiss Franc – 832 832 2.3 Norwegian Krone (407) 1,069 662 1.8 Korean Won – 111 111 0.3 Euro (126) 18 (108) (0.3)British Pound (322) – (322) (0.9)Australian Dollar (1,077) 454 (623) (1.7)US Dollar 11,126 (11,945) (819) (2.2)Japanese Yen (1,397) (2,415) (3,812) (10.4)Total 7,797 (11,876) (4,079) (11.1)
As at June 30, 2011, had the Canadian dollar strengthened or weakened by 10% (December 31, 2010 - 10%) in relation to all other foreign
currencies held in the Trust, with all other variables held constant, net assets of the Trust would have decreased or increased, respectively, by
approximately $125,000 (December 31, 2010 - $408,000). In practice, the actual results may differ from this analysis and the difference may
be material.
Financial Instruments Derivatives Total Currency Exposure Exposure Exposure Net Assets (in $000’s) (in $000’s) (in $000’s) (%)
as at December 31, 2010
The accompanying notes are an integral part of these financial statements.
29Semi-Annual Financial Statements as at June 30, 2011
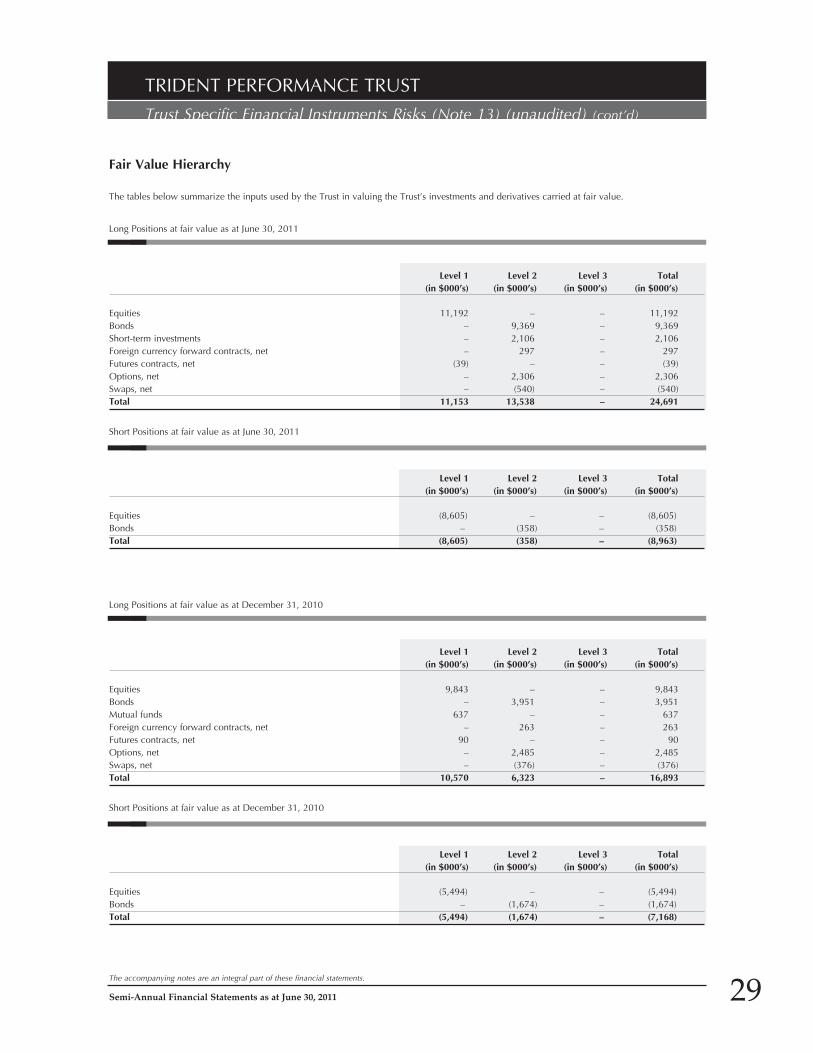
TRIDENT PERFORMANCE TRUST
Trust Specific Financial Instruments Risks (Note 13) (unaudited) (cont’d)
The tables below summarize the inputs used by the Trust in valuing the Trust’s investments and derivatives carried at fair value.
Long Positions at fair value as at June 30, 2011
Equities (8,605) – – (8,605)Bonds – (358) – (358) Total (8,605) (358) – (8,963)
Level 1 Level 2 Level 3 Total (in $000’s) (in $000’s) (in $000’s) (in $000’s)
Short Positions at fair value as at June 30, 2011
Equities 11,192 – – 11,192 Bonds – 9,369 – 9,369 Short-term investments – 2,106 – 2,106 Foreign currency forward contracts, net – 297 – 297 Futures contracts, net (39) – – (39)Options, net – 2,306 – 2,306 Swaps, net – (540) – (540) Total 11,153 13,538 – 24,691
Level 1 Level 2 Level 3 Total (in $000’s) (in $000’s) (in $000’s) (in $000’s)
Long Positions at fair value as at December 31, 2010
Equities (5,494) – – (5,494)Bonds – (1,674) – (1,674)Total (5,494) (1,674) – (7,168)
Level 1 Level 2 Level 3 Total (in $000’s) (in $000’s) (in $000’s) (in $000’s)
Short Positions at fair value as at December 31, 2010
Equities 9,843 – – 9,843 Bonds – 3,951 – 3,951 Mutual funds 637 – – 637 Foreign currency forward contracts, net – 263 – 263 Futures contracts, net 90 – – 90 Options, net – 2,485 – 2,485 Swaps, net – (376) – (376)Total 10,570 6,323 – 16,893
Level 1 Level 2 Level 3 Total (in $000’s) (in $000’s) (in $000’s) (in $000’s)
The accompanying notes are an integral part of these financial statements.
Fair Value Hierarchy

Semi-Annual Financial Statements as at June 30, 2011
1. THE CORPORATIONS AND THE TRUSTTrident Performance Corp. (the “Corporation”) is a mutual fund corporation established under the laws of the Province of
Ontario on January 31, 2008. The Corporation commenced operations on February 22, 2008. Each Class A Unit (the “Class
A Unit“) of the Corporation consists of one redeemable Class A share (the “Class A Share”) and one transferable Class A
Share purchase warrant (the “Class A Warrant”). Each Class F Unit (the “Class F Unit”) of the Corporation consists of one
redeemable Class F Share (the “Class F Share”) and one transferable Class F Share purchase warrant (the “Class F Warrant”).
The Corporation’s Class A Shares and Class A Warrants are listed on the Toronto Stock Exchange, under the symbol TCP
and TCP.WT, respectively.
Trident Performance Corp. II (the “Corporation II”) is a corporation established under the laws of the Province of Ontario
on March 30, 2009. On April 27, 2009, the Corporation II completed an initial public offering of 4,510,000 Class A shares
at $10 per share. The Corporation II’s Class A shares are listed on the Toronto Stock Exchange, under the symbol TCZ.
CI Investment Inc. is the manager (the “Manager”) and the investment advisor (the “Investment Advisor”) to the Corporation
and Corporation II (the “Corporations”).
Through a Forward Agreement with National Bank Correspondent Network (“NBCN”), (the “Forward Agreement”) the
Corporations provide shareholders with exposure to the performance of the Global Macroeconomic Portfolio that may consist of
equity and fixed-income securities, commodities, currencies and derivative instruments of global companies. The Corporations
will partially settle the Forward Agreement from time to time prior to the February 28, 2018 (the “Forward Date) in order to fund
redemptions of Shares and the payment of expenses and other liabilities of the Corporations.
Trident Performance Trust (the “Trust”) is an investment trust established under the laws of the Province of Ontario pursuant
to a declaration of trust dated January 31, 2008. The Trust commenced operations on February 22, 2008. The Trust is
authorized to issue an unlimited number of redeemable, transferable units (the “Trust Units”). The difference between
Class A and Class A II is to differentiate between the counterparties to the forward agreement with the Trust.
CI Investments Inc. is the trustee (the “Trustee”) of the Trust. The Trustee has retained Trident Investment Management
LLC as the investment advisor (the “Investment Advisor”) to the Trust. The Investment Advisor will manage the Trust’s
investment portfolio pursuant to an investment advisory agreement between the Trustee and Trident.
2. SUMMARY OF SIGNIFICANT ACCOUNTING POLICIESThere financial statements have been prepared in accordance with Canadian Generally Accepted Accounting Principles
(“Canadian GAAP”). Significant accounting policies used in preparing the semi-annual financial statements are consistent
with those used in preparing the annual financial statements. The semi-annual financial statements should be read in
conjunction with the Corporations' and Trust’s December 31, 2010 annual financial statements.
(a) Valuation of Investments
Canadian GAAP requires the fair value of financial instruments traded in an active market to be measured based on an
investment’s bid/ask price depending on the investment position (long/short).
For the purpose of processing shareholder/unitholder transactions, net asset value is calculated based on the closing market
price of investments (referred to as “Net Asset Value”), while for financial statement purposes net assets are calculated
based on bid/ask price of investments (referred to as “Net Assets”).
In accordance with National Instrument 81-106, a comparison between the Net Asset Value per share/unit and the Net
Assets per share/unit is disclosed in the Note 9.
Notes to the Financial Statements (unaudited)
30

Semi-Annual Financial Statements as at June 30, 2011
At the financial reporting date, listed securities are valued based on the bid price for securities held long and the ask price
for securities held short. Unlisted securities are valued based on price quotations from recognized investment dealers, or
failing that, their fair value is determined by the Manager on the basis of the latest reported information available. Fixed
income securities, debentures, money market investments and other debt instruments including short-term investments, are
valued at the bid quotation from recognized investment dealers. Underlying funds are valued on each business day at their
net asset value as reported by the underlying funds’ manager.
(b) Futures Contracts
Futures Contracts are valued using the bid price posted on the related public exchange. All gains or losses arising from
futures contracts are recorded as part of “Change in unrealized appreciation (depreciation) of investments and derivatives”
and "Unrealized gain (loss) on futures and forward currency contracts" in the Statement of Net Assets until the contracts are
closed out or expired, at which time the gains (losses) are realized and reported as “Realized gain (loss) on investments” in
the Statements of Operations.
(c) Forward Contracts
The Corporations or the Trust may enter into forward contracts. Forward foreign currency contracts are valued on each
valuation day based on the difference between the value of the contract on the date the contract originated and the value
of the contract on the valuation day.
All unrealized gains (losses) arising from forward foreign currency contracts are recorded as part of “Change in unrealized
appreciation (depreciation) of investments and derivatives” in the Statements of Operations and “Unrealized gain (loss) on
futures and forward currency contracts” in the Statements of Net Assets until the contracts are closed out or expire, at which
time the gains (losses) are realized and reported as “Realized gain (loss) on investments” in the Statements of Operations.
The value of the forward contract as part of the Forward Agreement on the valuation date is equal to the gain or loss
that would be realized if the contract were closed out or expired. Investments sold forward as part of the Forward
Agreement are valued at the market close price, and the Underlying Trust is valued at its net asset value as reported by
the Underlying Trust’s manager on the valuation date for purposes of determining the value of the forward contract. All
gains (losses) arising from the forward agreement are recorded as part of “Change in unrealized appreciation (depreciation)
of investments and derivatives” in the Statements of Operations and “Unrealized gain (loss) on forward contract” in the
Statements of Net Assets until the contracts are closed out or expire; at which time the gains (losses) are realized and
reported as “Realized gain (loss) on investments” in the Statements of Operations.
(d) Credit Default Swaps
The fair value of credit default swaps with exposures to underlying mortgage backed securities and asset backed securities
are determined using indicative bid values obtained from third-party broker-dealers. The broker-dealers determine the fair
value using valuation models that are based, in part, on assumptions that are not supported by observable market inputs.
The indicative bid values are independently assessed by the Manager to ensure that they are reasonable. The fair values of
credit default swaps are affected by the perceived credit risk of the underlying issuers, movements in credit spreads and the
length of time to maturity.
The fair value of credit default swaps with exposures to underlying marketable issuers are determined using indicative bid
values obtained from third-party broker-dealers. The broker-dealers determine the fair value using valuation models that are
based, on assumptions that are supported by observable market inputs. The indicative bid values are independently assessed
by the Manager to ensure that they are reasonable. The fair values of credit default swaps are affected by the perceived credit
risk of the underlying issuers, movements in credit spreads and the length of time to maturity.
Entering into credit default swaps involves, to varying degrees, elements of credit and market risk. Such risks involve, but,
but are not limited to, the possibility that there will be no liquid market for the agreements, and that the counterparty to the
agreements may default on its obligations.
Notes to the Financial Statements (unaudited) (cont’d)
31

Semi-Annual Financial Statements as at June 30, 2011
Any income received for credit default swaps contracts is recorded as “Derivative income (loss) ” in the Statements of
Operations, when the credit default swaps contracts are closed out or expire, any gains (losses) are recorded as “Realized
gain (loss) on investments” in the Statements of Operations.
(e) Short Selling
The Trust has obtained a relief from the required regulators to engage in short selling.
When the Trust sells a security short, it will borrow that security from a broker to complete the sale. The Trust will incur a
loss as a result of a short sale if the price of the borrowed security increases between the date of the short sale and the date
on which the Trust closes out its short position by buying that security. The Trust will realize a gain if the security declines
in price between those dates. The gains or losses arising from short positions are reflected in the Statements of Operations
as part of “Change in unrealized appreciation (depreciation) of investments and derivatives” and fair value of short positions
is reflected in the Statements of Net Assets in “Investments sold short at fair value”. When the short position is closed out,
gains or losses are realized and included in “Realized gain (loss) on investments” in the Statements of Operations.
(f) Options Contracts
Option contracts are valued each valuation day according to the gain or loss that would be realized if the contracts were
closed out. All gains or losses arising from option contracts are recorded as part of “Change in unrealized appreciation
(depreciation) of investments and derivatives” until the contracts are closed out or expire, at which time the gains (losses)
are realized and reflected in the Statements of Operations in “Realized gain (loss) on investments”.
Over-the-counter options are valued using the Black & Scholes model, whereas, exchange traded options are valued at bid/
ask price taken from the exchange.
(g) Interest Rate Swaps
The fair value of interest rate swaps are determined using indicative bid values obtained from third-party broker-dealers.
The broker dealers determine the fair value using valuation models that are based on assumptions that are supported by
observable market inputs, including the interest rates for that day. The indicative bid values are independently assessed by
the Manager to ensure that they are reasonable.
Any income received for interest rate swaps contracts is recorded as “Derivative income (loss)” in the Statements of
Operations.
3. SHAREHOLDERS’ AND UNITHOLDERS’ EQUITY
Trident Performance Corp.
Shares issued and outstanding represent the capital of the Corporation.
The relevant changes pertaining to subscription and redemption of the Corporation shares are disclosed in the Statements of
Changes in Net Assets. In accordance with the objectives and risk management policies outlined in Note 13 the Corporation
endeavors to invest subscriptions received in appropriate investments while maintaining sufficient liquidity to meet redemptions
through utilizing a short-term borrowing facility or partial settlement of the Forward Agreement.
Notes to the Financial Statements (unaudited) (cont’d)
32

Semi-Annual Financial Statements as at June 30, 2011
The Corporation is authorized to issue Class A and Class F Units. Each Class A Unit consists of one redeemable Class A
Share and one transferable Class A Share purchase warrant. Each Class F Unit consists of one redeemable Class F Share and
one transferable Class F share purchase warrants.
The Corporation is authorized to issue an unlimited number of transferable and redeemable Class A and Class F Shares of
the Corporation. Class F Shares are convertible into Class A Shares at the last day of each month by delivering a notice and
surrendering such Class F Shares by 4:00 p.m. (Toronto time) at least 20 business days prior to such Monthly Redemption
Date. The Class A Shares and Class F Shares are referred to, collectively, as the “Shares”. Commencing in December 2009,
shareholders are entitled to redeem their shares outstanding at the end of each month (the “Monthly Redemption”) or at
the end of each year (the “Annual Redemption”). Monthly redemption price per Class A Share is equal to the lesser of,
(a) 94% of the 15-day weighted average trading price of the Class A Shares preceding the applicable monthly redemption
date, and (b) of the “closing market price” of Class A Shares on the applicable monthly redemption date less applicable
redemption costs. The annual redemption price per Class A Share is equal to net asset value per Class A Share as at the
annual redemption date less any redemption costs. Monthly redemption price per Class F Share is equal to the product of
the monthly redemption price per Class A Share and a fraction of the most recently calculated net asset value per Class F
Share over the most recently calculated net asset value per Class A Share. The annual redemption price per Class F Share is
equal to the net asset value per Class F Share as at the annual redemption date less any redemption costs.
The Corporation is authorized to issue 100 Class M Shares. The holders of Class M Shares are not entitled to receive
dividends. The holders of the Class M Shares will be entitled to one vote per share. The Class M Shares are redeemable at
the option of either the Corporation or a holder thereof at a price of $1.00 per share. The Class M Shares rank subsequent
to the Class A Shares and Class F Shares.
Each Class A Warrant entitles the holder to purchase one Class A Share of the Corporation at a subscription price of $10.25 per
Class A Share on or before 4:00 p.m. (Toronto time) on the last day of any month on or before February 28, 2011 (“Expiry Time”).
Each Class F Warrant entitles the holder to purchase one Class F Share of the Corporation at a subscription price of $10.25 per
Class F Share on or before 4:00 p.m. (Toronto time) on the last day of any month on or before February 28, 2011 (“Expiry Time”).
For the periods ended June 30, net capital transactions of Corporation consisted of the following:
Class A Class F
Share Transactions 2011 2010 2011 2010
Balance, beginning of period 1,085,953 1,803,103 33,000 35,300
Shares issued for cash 1,410,277 – 60,000 –
Shares redeemed – (16,000) (12,000) –
Balance, end of period 2,496,230 1,787,103 81,000 35,300
Class A Warrants Class F Warrants
Warrants Transactions 2011 2010 2011 2010
Balance, beginning of period 2,444,200 3,124,700 115,300 115,300
Warrants issued – – – –
Warrants repurchased (2,444,200) (680,500) (115,300) –
Balance, end of period – 2,444,200 – 115,300
Notes to the Financial Statements (unaudited) (cont’d)
33

Semi-Annual Financial Statements as at June 30, 2011
Trident Performance Corp. II
Shares issued and outstanding represent the capital of the Corporation II.
The relevant changes pertaining to subscription and redemption of the Corporation II shares are disclosed in the Statements
of Changes in Net Assets. In accordance with the objectives and risk management policies outlined in Note 13 the Corporation
II endeavors to invest subscriptions received in appropriate investments while maintaining sufficient liquidity to meet
redemptions through utilizing a short-term borrowing facility or settlement of the Forward Agreement when necessary.
The Corporation II is authorized to issue an unlimited number of Class A shares of the Corporation II.
The Corporation II is authorized to issue 100 shares of the Corporation II designated as Class M Shares (“Class M Shares”) of
which, before giving effect to the Offering, there are 100 Class M Shares issued and outstanding. The holders of Class M Shares
are not entitled to receive dividends. The holders of the Class M Shares are entitled to one vote per share. The Class M Shares are
redeemable at the option of either the Corporation II or a holder thereof at a price of $1.00 per share. The Class M Shares rank
subsequent to the Class A Shares with respect to distributions on the dissolution, liquidation or winding-up of the Corporation II.
Shareholders are entitled to redeem their shares outstanding monthly (the “Monthly Redemption”) or on December 31 of any year
(the “December Redemption”). Monthly redemption price per share is equal to lesser of (a) 94% of the weighted average trading
price of the shares on the TSX during the 15 trading days preceding the applicable monthly redemption date, and (b) the “closing
market price” of the shares on the TSX on the applicable monthly redemption date, less (c) applicable redemption costs. Annual
redemption price per share is equal to net asset value per share determined on the December redemption date less applicable
redemption costs.
For the periods ended June 30, net capital transactions of Corporation II consisted of the following:
Share Transactions 2011 2010
Balance, beginning of period 2,699,032 4,394,100
Shares issued for cash – –
Shares redeemed – (180,708)Balance, end of period 2,699,032 4,213,392
Trident Performance Trust
The relevant changes pertaining to subscription and redemption of the Trust units are disclosed in the Statements of
Changes in Net Assets. In accordance with the objectives and risk management policies outlined in Note 13, the Trust
endeavors to invest subscriptions received in appropriate investments while maintaining sufficient liquidity to meet
redemptions through utilizing a short-term borrowing facility or disposal of investments when necessary.
The Trust is authorized to issue an unlimited number of redeemable, transferable units (“Trust Units”), each of which
represents an equal, undivided interest in the net assets of the Trust.
Notes to the Financial Statements (unaudited) (cont’d)
34

Semi-Annual Financial Statements as at June 30, 2011
For the periods ended June 30, net capital transactions of the Trust consisted of the following:
Class A Class A II
Unit Transactions 2011 2010 2011 2010
Balance, beginning of period 1,056,468 2,934,708 2,460,978 4,121,220
Units issued for cash 1,143,791 – – –
Units redeemed – (1,252,830) (189,678) (279,545)
Balance, end of period 2,200,259 1,681,878 2,271,300 3,841,675
When shares/units of the Corporations and Trust are redeemed at a price per share/unit which is lower than the average cost
per share/unit of capital, the difference is included in “Contributed surplus” on the Statements of Net Assets. If the redemption
price is greater than the average cost of capital, the difference is first charged to “Contributed surplus” until the entire account
is eliminated, and the remaining amount is charged to “Retained earnings (deficit)” in the Statements of Net Assets.
4. FEES AND OTHER EXPENSES(a) Management Fees
CI Investments Inc. is the Manager of the Corporations and in consideration for management fees provides management
services required in the day-to-day operations. The Corporations pay to the Manager an annual fee (the “Management Fee”)
equal to 0.25% of the net asset value of the Corporations calculated and paid monthly, plus an amount equal to the service
fees payable by to the Manager.
CI Investments Inc. is the Trustee of the Trust and in consideration of management fees provides management services
required in the day-to-day operations. The Trust pays to the Trustee an annual fee (the “Management Fee”) equal to 1.10%
of the net asset value of the Trust, calculated and paid monthly.
(b) Performance Fees
The Trust pays to the Trustee a performance fee (the “Performance Fee”) calculated as at December 31 of each year. The
performance fee will be an amount for each unit of the Trust then outstanding equal to 20% of the amount by which the
net asset value per unit of the Trust exceeds the Threshold Amount. The Threshold Amount is the greater of (i) the net asset
value per unit of the Trust immediately following the closing of the Offering, and (ii) the net asset value per unit of the Trust
on the most recent date that the performance fee was paid to the Trustee.
(c) Administrative Expenses
The Corporations and the Trust are also responsible for all expenses incurred in connection with its operations and administration
including audit and legal fees, transfer agency, custody, accounting fees, and independent review committee fees.
(d) Service Fees
The Corporations pays the Manager an annual service fee (the “Service Fee”) equal to 0.40% of the net asset value per
Class A Share for all Class A Shares then outstanding, calculated and paid quarterly. The Manager will pay a comparable
service fee to investment dealers on a pro rata basis based on the respective number of Class A Shares held by clients of
the sales representatives of such dealers.
(e) Advisory Fees
A portion of the Management Fee received by the Trustee will be paid to the Investment Advisor by the Trustee.
Notes to the Financial Statements (unaudited) (cont’d)
35

Semi-Annual Financial Statements as at June 30, 2011
(f) Forward Fees
The Corporations pay to the Counterparty under the Forward Agreement a fee of 0.50% per annum of the net asset value
of an applicable number of units of the Trust.
(g) Warrant Exercise Fees
The Corporation pays a fee of $0.10 per Warrant to TD Securities Inc. for and on behalf of the agents and in addition
in case of the exercise of Class A Warrant, a fee of $0.15 per Class A Warrant to the dealers whose client exercised the
Class A Warrant. The fees are paid by Corporation out of the assets attributable to corresponding classes.
(h) Harmonized Sales Tax
As of July 1, 2010, Ontario combined the federal goods and services tax (“GST” - 5%) with the provincial retail sales tax
(“PST” - 8%). The combination resulted in a Harmonized sales tax (“HST”) rate of 13%.
5. SECURITIES LENDINGThe Corporations and the Trust may engage into a securities lending. The amounts for securities loaned and the collateral
received is disclosed in the Statements of Net Assets as “Cash collateral received (payable) for securities on loan” and income
from securities lending is included in “Securities lending” in the Statements of Operations. As at June 30, 2011 and 2010 the
Corporations and the Trust were not engage in securities lending.
6. INCOME TAX LOSSES CARRY FORWARDNet capital losses may be carried forward indefinitely to reduce future net realized capital gains. Non-capital losses arising
in taxation years after 2005 may be carried forward twenty years. Non-capital losses carried forward may reduce future net
investment income.
Trident Performance Corp.Losses carry forwards (in $000’s) 2010Net capital losses carry forward 7,946
Year of expiry 2014 2015 2026 2027 2028 2029 2030 TotalNon-capital losses carry forward – – – – – – – –
Trident Performance Corp. IILosses carry forwards (in $000’s) 2010Net capital losses carry forward –
Year of expiry 2014 2015 2026 2027 2028 2029 2030 TotalNon-capital losses carry forward – – – – – 295 827 1,122
Notes to the Financial Statements (unaudited) (cont’d)
36

Semi-Annual Financial Statements as at June 30, 2011
Notes to the Financial Statements (unaudited) (cont’d)
Trident Performance TrustLosses carry forwards (in $000’s) 2010Net capital losses carry forward 8,677
Year of expiry 2014 2015 2026 2027 2028 2029 2030 TotalNon-capital losses carry forward – – – – – 2,038 5,275 7,313
7. LOAN FACILITYThe Trust may borrow pursuant to a loan facility (the “Loan Facility”) from a chartered bank (the “Lender”). The aggregate
amount of borrowing by the Trust may not exceed 35% of the net asset value of the Trust at the time of the borrowing.
During the periods ended June 30, 2011 and 2010 the Trust had no loan outstanding.
8. BROKERAGE AND OTHER COMMISSIONSCommissions paid for security transactions during the periods ended June 30, were as follows:
(in $000’s) 2011 2010
Brokerage Commissions
Trident Performance Corp. – –
Trident Performance Corp. II – –
Trident Performance Trust 28 36
Soft Dollar Commissions†
Trident Performance Corp. – –
Trident Performance Corp. II – –
Trident Performance Trust 28 36
†A portion of brokerage commissions paid was used to cover research and market data services, termed soft dollar commissions. These amounts have been estimated by the Manager.
9. NET ASSETS COMPARISONIn accordance with National Instrument 81-106, a comparison of net assets per share/unit and net asset value share/unit as
at June 30, is as follows:
Trident Performance Corp. Class A Class F
(in $) 2011 2010 2011 2010
Net assets per share 10.52 11.78 10.91 13.50
Net asset value per share 10.65 12.05 11.04 13.50
37

Semi-Annual Financial Statements as at June 30, 2011
Notes to the Financial Statements (unaudited) (cont’d)
Trident Performance Corp. II Class A
(in $) 2011 2010
Net assets per share 8.35 9.07
Net asset value per share 8.47 9.09
Trident Performance Trust Class A Class A II
(in $) 2011 2010 2011 2010
Net assets per unit 12.11 12.94 9.23 9.86
Net asset value per unit 12.11 12.95 9.23 9.86
10. RELATED PARTY TRANSACTIONSThe Bank of Nova Scotia has a significant interest in CI Financial Corp., the parent company of the Manager/Trustee.
The Corporations and the Trust may have direct or indirect holdings in The Bank of Nova Scotia and/or CI Financial Corp.
as identified in the Statement of Investment Portfolio of the Corporations and of the Trust, if applicable.
11. INTERNATIONAL FINANCIAL REPORTING STANDARDSOn February 13, 2008, the Canadian Accounting Standards Board (“AcSB”) confirmed that the use of International Financial
Reporting Standards (“IFRS”) will be required for all publicly accountable profit-oriented enterprises for interim and annual
financial statements relating to fiscal years beginning on or after January 1, 2011. On January 12, 2011, the AcSB confirmed
deferral of the IFRS changeover date for investment funds. Based on the AcSB decision IFRS will become effective for interim
and annual financial statements relating to fiscal years beginning on or after January 1, 2013 instead of January 1, 2011.
Based on the Manager’s current evaluation of the differences between IFRS and Canadian GAAP, the Manager currently does
not expect any impact to net asset value or net asset value per share/unit as a result of the transition to IFRS, and expects that
the main impact will be on the financial statements, where additional disclosures or changes in presentation will be required.
Further updates on the progress in the implementation of the IFRS transition plan and any changes to reporting will be provided
during the implementation period leading up to the transition date.
12. FINANCIAL INSTRUMENTS The categorization of financial instruments is as follows: investments and derivatives are classified as held for trading and
are stated at fair value. Receivable for securities sold, dividends and accrued interest receivable, margin for short sales
and other receivables are designated as loans and receivables. They are recorded at amortized cost which approximates
their fair value due to their short-term nature. Similarly, payable for unit/share redemptions, payable for securities purchased,
management fees payable, accrued expenses, service fees payable, forward fee payable, spread fee payable, performance
fees payable, dividend payable on securities sold short, interest payable on securities sold short, capital taxes payable and
income taxes payable are designated as financial liabilities and are carried at their amortized cost which approximates their
fair value, due to their short-term nature. Financial liabilities are generally settled within three months.
38

Semi-Annual Financial Statements as at June 30, 2011
Notes to the Financial Statements (unaudited) (cont’d)
13. FINANCIAL INSTRUMENTS RISK Risk Management
The Corporations and the Trust are exposed to a variety of financial instruments risks: credit risk, liquidity risk and market risk
(including interest rate risk, currency risk and other price risk). The level of risk to which the Corporations and the Trust are
exposed to depends on the investment objective and the type of investments held by the Corporations and the Trust. The value
of the investments within the portfolio can fluctuate daily as a result of changes in prevailing interest rates, economic and market
conditions and company specific news related to investments held by the Corporations and the Trust. The Manager of the
Corporations and the Trust may minimize potential adverse effects of these risks on the Corporations’ and the Trust’s performance
by, but not limited to, regular monitoring of the Corporations’ and the Trust’s positions and market events, diversification of the
investment portfolio by asset type, country, sector, term to maturity within the constraints of the stated objectives, and through the
usage of derivatives to hedge certain risk exposures.
Other Price Risk
Other price risk is the risk that the value of financial instruments will fluctuate as a result of changes in market prices (other
than those arising from interest rate risk or currency risk). The value of each investment is influenced by the outlook of the
issuer and by general economic and political conditions, as well as industry and market trends. All securities present a risk
of loss of capital. Except for options written, future contracts and investments sold short, the maximum risk resulting from
financial instruments is equivalent to their fair value.
Other assets and liabilities are monetary items that are short-term in nature and therefore are not subject to significant other
price risk.
Interest Rate Risk
Interest rate risk is the risk that the fair value of interest-bearing investments and interest rate derivative instruments will
fluctuate due to changes in prevailing levels of market interest rates. As a result, the value of the Corporations or the Trust
will be affected by changes in applicable interest rates as they invest in debt securities and income trusts. If interest rates
fall, the fair value of existing debt securities may increase due to the increase in yield. Alternatively, if interest rates rise,
the yield of existing debt securities decrease which may then lead to a decrease in their fair value. The magnitude of the
decline will generally be greater for long-term debt securities rather than for short-term debt securities.
Interest rate risk also applies to convertible securities. The fair value of these securities varies inversely with interest rates,
similar to other debt securities. However, since they may be converted into common shares, convertible securities are
generally less affected by interest rate fluctuations than other debt securities.
Credit Risk
Credit risk is the risk that a security, issuer or counterparty to a financial instrument will fail to meet its financial obligations.
The fair value of debt instruments includes consideration of the credit worthiness of the debt issuer. Credit risk exposure for
derivative instruments is based on the Trust’s unrealized gain of the contractual obligations with the counterparty as at the
reporting date.
The credit risk exposure of the Corporations’ and the Trust’s other assets are represented by their carrying amount as
disclosed in the Statements of Net Assets.
Credit ratings for fixed income securities, preferred securities and derivative instruments are obtained from Standard & Poor’s,
where available, otherwise ratings are obtained from: Moody’s Investors Service, Dominion Bond Rating Services or Canadian
Bond Rating Services.
39

Semi-Annual Financial Statements as at June 30, 2011
Notes to the Financial Statements (unaudited) (cont’d)
Credit ratings can be either long-term or short-term. Short-term credit ratings are generally assigned to those obligations
and derivative instruments considered short-term in nature. The table below provides a cross-reference between the long-
term credit ratings disclosed in the Credit Rating table inclusive of the short-term credit ratings disclosed in the derivatives
schedules in the Statement of Investment Portfolio.
Credit Rating as per Credit Risk table Credit Rating as per derivatives schedules
AAA/Aaa/A++ A-1+
AA/Aa/A+ A-1, A-2, A-3
A B, B-1
BBB/Baa/B++ B-2
BB/Ba/B+ B-3
B C
CCC/Caa/C++ -
CC/Ca/C+ -
C and Lower D
Not Rated WR
Significant cash balances as disclosed in the Statements of Net Assets are maintained by the Custodian, RBC Dexia. The
Manager monitors the credit worthiness of the custodian on a regular basis.
All transactions executed by the Corporations and the Trust in listed securities are settled / paid for upon delivery using approved
brokers. The risk of default is considered minimal, as delivery of securities sold is only made once the broker has received
payment. Payment is made on a purchase once the securities have been received by the broker. The trade will fail if either party
fails to meet its obligation.
Currency Risk
Currency risk arises from financial instruments that are denominated in a currency other than the Canadian dollar, the
functional currency of the Corporations or the Trust. As a result, the Trust may be exposed to the risk that the value of
securities denominated in other currencies will fluctuate due to changes in exchange rates. The Statement of Investment
Portfolio identifies all bonds and derivative instruments denominated in foreign currencies. Equities traded in foreign
markets are exposed to currency risk as the prices denominated in foreign currencies are converted to the Trust’s functional
currency to determine their fair value.
Liquidity Risk
Liquidity risk is the risk that the Corporations or the Trust may not be able to settle or meet their obligations, on time or at a
reasonable price. The Corporations are exposed to monthly and annual cash redemptions of redeemable shares. To finance
redemptions the Corporations will dispose of their assets. The Trust is exposed to daily cash redemption of redeemable units.
Therefore, the Trust aims to invest the majority of its assets in investments that are traded in active markets and can be readily
disposed of. In addition, the Trust aims to retain sufficient cash and cash equivalent positions to maintain liquidity. From time
to time, the Trust may enter into derivative contracts or invest in unlisted securities that may not trade in an organized market
and may be illiquid. Illiquid securities are identified in the Statement of Investment Portfolio of the Trust, if applicable.
Fair Value Hierarchy
The Corporations and the Trust are required to classify financial instruments measured at fair value using a fair value
hierarchy. Investments whose values are based on quoted market prices in active markets are classified as Level 1. This level
may include publicly traded equities, exchange traded and retail mutual funds, exchange traded warrants, futures contracts,
traded options, American depositary receipts (“ADRs”) and Global depositary receipts (“GDRs”).
40

Semi-Annual Financial Statements as at June 30, 2011
Notes to the Financial Statements (unaudited) (cont’d)
Financial instruments that trade in markets that are not considered to be active but are valued based on quoted market
prices, dealer quotations or alternative pricing sources supported by observable inputs are classified as Level 2. These may
include fixed income securities, mortgage backed securities (“MBS”), short-term instruments, non-traded warrants,
over-the-counter options, structured notes of indexed securities, foreign currency forward contracts and swap instruments.
Investments classified as Level 3 have significant unobservable inputs. Level 3 instruments may include private equities,
private term loans, private equity funds and certain derivatives. As observable prices are not available for these securities,
the Corporations and the Trust may use a variety of valuation techniques to derive the fair value.
Details of the Corporations’ and the Trust’s exposure to financial instruments risks including the fair value hierarchy
classification are available in the “Corporation and Trust Specific Financial Instruments Risks” section of the financial
statements.
41

Semi-Annual Financial Statements as at June 30, 2011
Manager and TrusteeCI Investments Inc.2 Queen Street East, 20th FloorToronto, OntarioM5C 3G7Phone: (416) 364-1145Fax: (416) 364-6299Toll Free: [email protected]
CustodianRBC Dexia Investor Services Trust155 Wellington Street West5th FloorToronto, OntarioM5V 3L3
AuditorPricewaterhouseCoopers LLPSuite 3000, Box 82Royal Trust Tower, TD CentreToronto, OntarioM5K 1G8
Registrar & Transfer AgentComputershare Investor Services Inc.100 University Avenue8th FloorToronto, OntarioM5J 2Y1
ListedThe Toronto Stock Exchange
Ticker SymbolTCP TCP.WT
For more information on the Corporations and Trust, visit us online at www.ci.com.
Corporations and Trust Information
42


TridentPerf_SA_08/11E
2 Queen Street East, Twentieth Floor, Toronto, Ontario M5C 3G7 I www.ci.com
Head Office / Toronto416-364-1145 1-800-268-9374
Calgary 403-205-43961-800-776-9027
Montreal 514-875-0090 1-800-268-1602
Vancouver 604-681-3346 1-800-665-6994
Client Services English: 1-800-563-5181 French: 1-800-668-3528