Semi-Annual Financial Statements · PDF filethe Semi-Annual Financial Statements, ... Class A...
19
Semi-Annual Financial Statements BMO Private Portfolios June 30, 2017 BMO Private U.S. Special Equity Portfolio NOTICE OF NO AUDITOR REVIEW OF THE SEMI-ANNUAL FINANCIAL STATEMENTS BMO Private Investment Counsel Inc., the Manager of the Portfolios, appoints independent auditors to audit the Portfolio’s Annual Financial Statements. Under Canadian securities laws (National Instrument 81-106), if an auditor has not reviewed the Semi-Annual Financial Statements, this must be disclosed in an accompanying notice. The Portfolio’s independent auditors have not performed a review of these Semi-Annual Financial Statements in accordance with standards established by the Chartered Professional Accountants of Canada.
Transcript of Semi-Annual Financial Statements · PDF filethe Semi-Annual Financial Statements, ... Class A...

Semi-Annual Financial Statements
BMO Private Portfolios
June 30, 2017
BMO Private U.S. Special Equity Portfolio
NOTICE OF NO AUDITOR REVIEW OF THE SEMI-ANNUAL FINANCIAL STATEMENTS
BMO Private Investment Counsel Inc., the Manager of the Portfolios, appoints independent auditors to audit the Portfolio’s Annual Financial Statements. Under Canadian securities laws (National Instrument 81-106), if an auditor has not reviewed the Semi-Annual Financial Statements, this must be disclosed in an accompanying notice.
The Portfolio’s independent auditors have not performed a review of these Semi-Annual Financial Statements in accordance with standards established by the Chartered Professional Accountants of Canada.

BMO Private U.S. Special Equity Portfolio
(unaudited)
STATEMENT OF FINANCIAL POSITION(All amounts in thousands of Canadian dollars, except per unit data)
The accompanying notes are an integral part of these financial statements.
June 30 December 31As at 2017 2016
Assets
Current AssetsCash 7,388 6,403Investments
Non-derivative financial assets 205,371 186,365Receivable for investments sold 202 —Subscriptions receivable 51 67Dividends receivable 51 71Total assets 213,063 192,906
Liabilities
Current LiabilitiesPayable for investments purchased 908 —Redemptions payable 95 91Accrued expenses 591 684Total liabilities 1,594 775
Net assets attributable to holders of redeemable units 211,469 192,131
Net assets attributable to holders of redeemable units per unit $ 9.36 $ 8.42

BMO Private U.S. Special Equity Portfolio
(unaudited)
STATEMENT OF COMPREHENSIVE INCOME(All amounts in thousands of Canadian dollars, except per unit data)
The accompanying notes are an integral part of these financial statements.
June 30 June 30For the periods ended 2017 2016
IncomeInterest income 0 —Dividend income 655 729Other changes in fair value of investments and derivatives
Net realized gain (loss) 26,106 (14,990)Change in unrealized depreciation (3,915) (16,979)
Net gain (loss) in fair value of investments and derivatives 22,846 (31,240)
Securities lending (note 8) 39 216Foreign exchange loss (184) (1,137)
Total other loss (145) (921)
Total income (loss) 22,701 (32,161)
ExpensesSub-advisory fees 753 652Audit fees 2 2Independent review committee fees 0 1Withholding taxes 28 49Custodian fees, interest and bank charges 12 14Legal and filing fees 10 15Unitholder servicing fees 92 117Printing and stationery fees 2 3Commissions and other portfolio transaction costs (note 6) 196 243Operating expenses absorbed by the Manager (166) (164)Total expenses 929 932
Increase (decrease) in net assets attributable to holders of redeemable units 21,772 (33,093)
Increase (decrease) in net assets attributable to holders of redeemable units per unit (note 8) 0.96 (1.19)

BMO Private U.S. Special Equity Portfolio
(unaudited)
STATEMENT OF CHANGES IN NET ASSETS ATTRIBUTABLE TO HOLDERS OF REDEEMABLE UNITS(All amounts in thousands of Canadian dollars)
The accompanying notes are an integral part of these financial statements.
June 30 June 30For the periods ended 2017 2016
Net assets attributable to holders of redeemable units at beginning of period 192,131 277,161
Increase (decrease) in net assets attributable to holders of redeemable units 21,772 (33,093)
Redeemable unit transactionsProceeds from redeemable units issued 25,858 27,180Redemption of redeemable units (28,292) (91,814)Net decrease from redeemable unit transactions (2,434) (64,634)
Net increase (decrease) in net assets attributable to holders of redeemable units 19,338 (97,727)
Net assets attributable to holders of redeemable units at end of period 211,469 179,434

BMO Private U.S. Special Equity Portfolio
(unaudited)
STATEMENT OF CASH FLOWS(All amounts in thousands of Canadian dollars)
The accompanying notes are an integral part of these financial statements.
June 30 June 30For the periods ended 2017 2016
Cash flows from operating activitiesIncrease (decrease) in net assets attributable to holders of redeemable units 21,772 (33,093)Adjustments for:
Foreign exchange loss on cash 176 102Net realized (gain) loss on sale of investments and derivatives (26,106) 14,990Change in unrealized depreciation of investments and derivatives 3,915 16,979Decrease in dividends receivable 20 104Decrease in accrued expenses (93) (137)Return of capital dividend received — 25Purchases of investments (217,382) (73,548)Proceeds from sale and maturity of investments 221,273 129,768
Net cash from operating activities 3,575 55,190
Cash flows from financing activitiesProceeds from issuances of redeemable units 25,874 27,492Amounts paid on redemption of redeemable units (28,288) (91,586)
Net cash from financing activities (2,414) (64,094)
Foreign exchange loss on cash (176) (102)Net increase (decrease) in cash 1,161 (8,904)Cash at beginning of period 6,403 12,853
Cash at end of period 7,388 3,847
Supplementary InformationInterest received, net of withholding taxes* 0 —Dividends received, net of withholding taxes* 654 857Interest expense paid* 0 —*These items are from operating activities

BMO Private U.S. Special Equity Portfolio
(unaudited)
SCHEDULE OF INVESTMENT PORTFOLIOAs at June 30, 2017 (All amounts in thousands of Canadian dollars, unless otherwise noted)
SecurityNumber of
Shares or UnitsCost+
($)Fair Value
($)
EquitiesConsumer Discretionary — 13.3%Adtalem Global Education Inc. 59,175 2,530 2,912Cable One, Inc. 1,470 1,150 1,355Domino's Pizza, Inc. 7,532 2,082 2,066Grand Canyon Education, Inc. 33,977 3,077 3,455Live Nation, Inc. 44,360 2,107 2,005Michaels Companies, Inc., The, 77,095 2,210 1,852Six Flags Entertainment Corporation 63,895 5,124 4,939Tractor Supply Company 52,608 5,235 3,698Universal Electronics Inc. 32,493 2,862 2,817Vail Resorts, Inc. 11,552 2,519 3,039
28,896 28,138
Consumer Staples — 0.6%Nu Skin Enterprises, Inc. 15,623 1,022 1,273
1,022 1,273
Energy — 1.2%Carrizo Oil & Gas, Inc. 29,900 1,505 675Diamondback Energy, Inc. 15,290 2,097 1,761
3,602 2,436
Financials — 10.1%Affiliated Managers Group, Inc. 14,167 2,805 3,047Bank of the Ozarks, Inc. 55,326 2,884 3,363CBOE Holdings, Inc. 20,443 2,063 2,423East West Bancorp, Inc. 22,255 1,702 1,691Encore Capital Group, Inc. 46,961 1,827 2,445FirstCash, Inc. 35,820 2,254 2,708OM Asset Management plc 75,464 1,447 1,454Signature Bank 16,366 3,270 3,046Virtu Financial, Inc., Class A 49,349 1,074 1,130
19,326 21,307
Health Care — 20.2%ABIOMED, Inc. 14,886 1,365 2,766Acadia Healthcare Company, Inc. 43,214 2,615 2,767Align Technology, Inc. 16,242 2,063 3,162Amedisys, Inc. 32,014 1,856 2,608Cambrex Corporation 35,350 2,627 2,739Centene Corporation 35,959 2,879 3,725Exact Sciences Corporation 62,552 1,390 2,869Glaukos Corporation 44,793 2,142 2,409HealthSouth Corporation 52,322 2,380 3,284Horizon Pharma Plc 23,299 357 359IDEXX Laboratories, Inc. 10,130 1,600 2,120Ligand Pharmaceuticals Incorporated 37,506 5,280 5,905Mettler-Toledo International Inc. 3,454 1,954 2,636NxStage Medical, Inc. 34,543 1,068 1,123Repligen Corporation 21,081 951 1,133

BMO Private U.S. Special Equity Portfolio
(unaudited)
SCHEDULE OF INVESTMENT PORTFOLIO (cont’d)As at June 30, 2017 (All amounts in thousands of Canadian dollars, unless otherwise noted)
SecurityNumber of
Shares or UnitsCost+
($)Fair Value
($)
Veeva Systems Inc., Class A 40,061 2,246 3,18532,773 42,790
Industrials — 17.9%BWX Technologies, Inc. 84,221 4,643 5,324Copart, Inc. 132,171 5,025 5,449Dun & Bradstreet Corporation, The, 12,617 2,035 1,770HEICO Corporation, Class A 33,354 2,416 2,684Hexcel Corporation 42,018 2,127 2,876Middleby Corporation, The, 26,007 4,485 4,098Old Dominion Freight Line, Inc. 36,213 4,147 4,473SiteOne Landscape Supply, Inc. 32,845 1,639 2,217Toro Company, The, 29,691 2,255 2,668TransUnion 54,080 2,752 3,037Wabtec Corporation 27,597 3,125 3,275
34,649 37,871
Information Technology — 22.1%2U, Inc. 58,165 2,494 3,539Arista Networks, Inc. 16,875 2,299 3,278Booz Allen Hamilton Holding Corporation 90,198 4,305 3,806CoStar Group, Inc. 17,307 4,419 5,916CSRA Inc. 80,016 3,386 3,294Euronet Worldwide, Inc. 19,537 2,115 2,214Guidewire Software, Inc. 55,206 3,791 4,919j2 Global, Inc. 42,465 4,215 4,686MAXIMUS, Inc. 41,679 2,700 3,385Maxlinear, Inc. 59,484 2,047 2,151National Instruments Corporation 53,880 2,672 2,810Take-Two Interactive Software, Inc. 32,562 2,173 3,099Vantiv, Inc., Class A 45,591 3,744 3,745
40,360 46,842
Materials — 6.4%Axalta Coating Systems Ltd. 63,594 2,359 2,642Ball Corporation 79,284 4,034 4,340Celanese Corporation, Series A 28,201 3,038 3,472Martin Marietta Materials, Inc. 10,646 3,190 3,073
12,621 13,527
Real Estate — 5.3%Colliers International Group Inc. 26,145 1,303 1,914FirstService Corporation 30,722 1,989 2,549Jones Lang Lasalle Incorporated 13,185 1,863 2,137

BMO Private U.S. Special Equity Portfolio
(unaudited)
SCHEDULE OF INVESTMENT PORTFOLIO (cont’d)As at June 30, 2017 (All amounts in thousands of Canadian dollars, unless otherwise noted)
SecurityNumber of
Shares or UnitsCost+
($)Fair Value
($)
SBA Communications Corporation 26,219 3,650 4,5878,805 11,187
Total Investment Portfolio — 97.1% 182,054 205,371
Other Assets Less Liabilities — 2.9% 6,098
NET ASSETS ATTRIBUTABLE TO HOLDERS OF REDEEMABLE UNITS — 100.0% 211,469
+ Where applicable, distributions received from holdings as a return of capital are used to reduce the adjusted cost base of the securities in the portfolio

NOTES TO THE FINANCIAL STATEMENTS(All amounts in thousands of Canadian dollars, except per unit data)June 30, 2017
BMO Private U.S. Special Equity Portfolio
(unaudited)
1. The PortfolioBMO Private U.S. Special Equity Portfolio (“the Portfolio”) is an open-ended mutual fund trust established by a Declaration of Trust under the laws of the Province of Ontario, most recently amended on July 8, 2016. BMO Private Investment Counsel Inc. (“the Manager”) is the Manager of the Portfolio. The address of the Portfolio’s registered office is 1 First Canadian Place, 41st Floor, Toronto, Ontario, M5X 1A1.
The Statement of Financial Position and related notes of each of the Portfolios are as at June 30, 2017 and December 31, 2016. The Statement of Comprehensive Income, Statement of Changes in Net Assets Attributable to Holders of Redeemable Units, Statement of Cash Flows and related notes are for the periods ended June 30, 2017 and June 30, 2016.
These financial statements were authorized for issuance by the Board of Directors of the Manager on August 14, 2017.
These financial statements should be read in conjunction with the annual financial statements for the period ended December 31, 2016 which have been prepared in accordance with International Financial Reporting Standards (“IFRS”).
2. Basis of preparation and presentationThese unaudited interim financial statements have been prepared in accordance with IFRS and in accordance with International Accounting Standard (“IAS”) 34 – Interim Financial Reporting, as issued by the International Accounting Standards Board (“IASB”).
3. Summary of significant accounting policiesFinancial instrumentsThe Portfolio records financial instruments at fair value. Investment transactions are accounted for on the trade date. The Portfolio’s investments are either designated at fair value through profit or loss (“FVTPL”) at inception or classified as held for trading. The changes in the investment fair values and related transaction costs are recorded in the Portfolio’s Statement of Comprehensive Income.
Financial assets and financial liabilities held for trading are those acquired or incurred principally for the purpose of selling or repurchasing in the near future, or on initial recognition, are part of a portfolio of identified financial instruments that the Portfolio manages together and that have a recent actual pattern of short-term profit taking. The Portfolio classifies all derivatives and short positions as held for trading. The
Portfolio does not designate any derivatives as hedges in a hedging relationship.
The Portfolio designates all other investments at FVTPL, as they have reliably measurable fair values and are part of a group of financial assets or financial liabilities that are managed and have their performance evaluated on a fair value basis in accordance with the Portfolio’s investment strategy.
The Portfolio’s outstanding redeemable units, which are puttable instruments, are entitled to a contractual obligation of annual distribution of any net income and net realized capital gains by the Portfolio. This annual distribution can be in cash at the option of the unitholders, and therefore the ongoing redemption feature is not the redeemable units’ only contractual obligation. Consequently, the units of the Portfolio do not meet the conditions to be classified as equity and therefore are classified as financial liabilities and presented at the redemption amounts.
All other financial assets and financial liabilities are measured at amortized cost. Under this method, financial assets and financial liabilities reflect the amount required to be received, paid or discounted, when appropriate, at the contract’s effective interest rate.
The Manager has determined that the Portfolio meets the definition of “investment entity” and as a result, the Portfolio measures subsidiaries, if any, at FVTPL.
Cost of investmentsThe cost of investments represents the amount paid for each security and is determined on an average cost basis.
Fair value measurementInvestments are recorded at their fair value with the change between this amount and their average cost being recorded as “Change in unrealized appreciation (depreciation)” in the Statement of Comprehensive Income.
For exchange-traded securities, close prices are considered to be fair value if they fall within the bid-ask spread. In circumstances where the close price is not within the bid-ask spread, the Manager determines the point within the bid-ask spread that is most representative of fair value based on the specific facts and circumstances.
Procedures are in place to fair value securities traded in countries outside of North America daily, to avoid stale

NOTES TO THE FINANCIAL STATEMENTS (cont’d)(All amounts in thousands of Canadian dollars, except per unit data)June 30, 2017
BMO Private U.S. Special Equity Portfolio
(unaudited)
prices and to take into account among other things, any significant events occurring after the close of a foreign market.
For bonds, debentures, asset-backed securities and other debt securities, fair value is represented by bid prices provided by independent security pricing services. Short-term investments, if any, are held at amortized cost which approximates fair value.
Unlisted warrants, if any, are valued based on a pricing model which considers factors such as the market value of the underlying security, strike price and terms of the warrant.
Mutual fund units held as investments are valued at their respective Net Asset Value (“NAV”) on each Valuation Date (the “Valuation Date” is each day on which the Toronto Stock Exchange is open for trading), as these values are the most readily and regularly available.
For securities where market quotes are not available, unreliable or not considered to reflect the current value, the Manager may determine another value which it considers to be fair and reasonable, or use a valuation technique that, to the extent possible, makes maximum use of inputs and assumptions based on observable market data including volatility, comparable companies, NAV (for exchange-traded funds) and other applicable rates or prices. These estimation techniques include discounted cash flows, internal models that utilize observable data or comparisons with other securities that are substantially similar. In limited circumstances, the Manager may use internal models where the inputs are not based on observable market data.
Derivative instrumentsDerivative instruments are financial contracts that derive their value from changes in underlying interest rates, foreign exchange rates or other financial or commodity prices or indices.
Derivative instruments are either regulated exchange-traded contracts or negotiated over-the-counter contracts. The Portfolio may use these instruments for trading purposes, as well as to manage the Portfolio’s risk exposures.
Derivatives are measured at fair value. Realized gains and losses are included in “Net realized gain (loss)” in the Statement of Comprehensive Income and unrealized gains and losses are included in “Change
in unrealized appreciation (depreciation)” in the Statement of Comprehensive Income.
Forward currency contractsA forward currency contract is an agreement between two parties (the Portfolio and the counterparty) to purchase or sell a currency against another currency at a set price on a future date. The Portfolio may enter into forward currency contracts for hedging purposes, which can include the economic hedging of all or a portion of the currency exposure of an investment or group of investments, either directly or indirectly. The Portfolio may also enter into these contracts for non-hedging purposes, which can include increasing the exposure to a foreign currency, or shifting the exposure to foreign currency fluctuations from one country to another. The value of forward currency contracts entered into by the Portfolio is recorded as the difference between the value of the contract on the Valuation Date and the value on the date the contract originated.
Income recognitionDividend income and distribution from investment trusts are recognized on the ex-dividend and ex-distribution date, respectively.
Interest income from interest bearing investments is recognized in the Statement of Comprehensive Income using the effective interest rate. Interest receivable shown in the Statement of Financial Position is accrued based on the interest bearing investments’ stated rates of interest.
Interest on inflation-indexed bonds is paid based on a principal value, which is adjusted for inflation. The inflation adjustment of the principal value is recognized as part of interest income in the Statement of Comprehensive Income. If held to maturity, the Portfolio will receive, in addition to a coupon interest payment, a final payment equal to the sum of the par value and the inflation compensation accrued from the original issue date. Interest is accrued on each Valuation Date based on the inflation adjusted par value at that time and is included in “Interest income” in the Statement of Comprehensive Income.
Foreign currency translationThe fair value of investments and other assets and liabilities in foreign currencies are translated into the Portfolio’s functional currency at the rates of exchange prevailing at the period-end date. Purchases and sales of investments, and income and expenses are translated at the rates of exchange prevailing on the respective

NOTES TO THE FINANCIAL STATEMENTS (cont’d)(All amounts in thousands of Canadian dollars, except per unit data)June 30, 2017
BMO Private U.S. Special Equity Portfolio
(unaudited)
dates of such transactions. Foreign exchange gains (losses) on completed transactions are included in “Net realized gain (loss)”in the Statement of Comprehensive Income and unrealized foreign exchange gains (losses) are included in “Change in unrealized appreciation (depreciation)” in the Statement of Comprehensive Income. Foreign exchange gains (losses) relating to cash, receivables and payables are included in "Foreign exchange gain (loss)" in the Statement of Comprehensive Income.
Securities lendingA Portfolio may engage in securities lending pursuant to the terms of an agreement with BNY Mellon (the “security lending agent”). The aggregate market value of all securities loaned by the Portfolio cannot exceed 50% of the NAV of the Portfolio. The Portfolio will receive collateral of at least 102% of the value of securities on loan. Collateral will generally be comprised of obligations of or guarantee by the Government of Canada or a province thereof, or by the United States government or its agencies, but it may include obligations of other governments with appropriate credit ratings. Further, the program entered into provides for 100% indemnification by the securities lending agent and parties related to the Portfolio’s custodian, to the Portfolio for the defaults by borrowers.
For those Portfolios participating in the program, aggregate values of securities on loan and the collateral held as at June 30, 2017 and December 31, 2016 are disclosed in Note 8(f).
Income from securities lending, where applicable, is included in the Statement of Comprehensive Income and is recognized when earned. The breakdown of the securities lending income is disclosed in Note 8(f), where applicable.
Short-term trading penaltyTo discourage excessive trading, the Portfolio may, at the Manager’s sole discretion, charge a short-term trading penalty. This penalty is paid directly to the Portfolio and is included in “Short-term trading penalty fees” in the Statement of Comprehensive Income.
CashCash is comprised of cash and deposits with banks which include bankers’ acceptances and overnight demand deposits. Cash is recorded at fair value. The carrying amount of cash approximates its fair value because it is short-term in nature.
Other assets and other liabilitiesReceivable for investments sold, dividends receivable, distribution receivable from investment trusts, and subscriptions receivable are initially recorded at fair value and subsequently measured at amortized cost. Similarly, payable for investments purchased, redemptions payable, distributions payable and accrued expenses are measured at amortized cost. Other assets and liabilities are short-term in nature, and are carried at cost or amortized cost.
Increase or decrease in net assets attributable to holders of redeemable units“Increase (decrease) in net assets attributable to holders of redeemable units” in the Statement of Comprehensive Income represents the increase (decrease) in net assets attributable to holders of redeemable units (“Net Assets”) divided by the weighted average number of units outstanding during the period.
TaxationThe Portfolio qualifies as a unit trust under the provisions of the Income Tax Act (Canada). Distributions of all net taxable income and sufficient amounts of net realized capital gains for each taxation year will be paid to unitholders so that the Portfolio will not be subject to income tax. As a result, the Portfolio has determined that it is in substance not taxable and therefore does not record income taxes in the Statement of Comprehensive Income nor does it recognize any deferred tax assets or liabilities in the Statement of Financial Position.
The Portfolio may incur withholding taxes imposed by certain countries on investment income and capital gains. Such income and capital gains are recorded on a gross basis with the related withholding taxes shown as a separate expense in the Statement of Comprehensive Income.
Investments in subsidiaries, joint ventures and associatesSubsidiaries are entities over which the Portfolio has control through its exposure or rights to variable returns from its investment and has the ability to affect those returns through its power over the entity. The Manager has determined that the Portfolio is an investment entity and as such, it accounts for subsidiaries, if any, at fair value. Joint ventures are those where the Portfolio exercises joint control through an agreement with other shareholders, and associates are investments in which the Portfolio exerts significant influence over operating, investing, and financing decisions (such as entities in
NOTES TO THE FINANCIAL STATEMENTS (cont’d)(All amounts in thousands of Canadian dollars, except per unit data)June 30, 2017
BMO Private U.S. Special Equity Portfolio
(unaudited)
which the Portfolio owns 20% - 50% of voting shares), all of which, if any, have been designated at FVTPL.
Unconsolidated structured entitiesDuring the periods, the Portfolio had no sponsored unconsolidated structured entities. The Manager has determined that the underlying funds in which the Portfolio may invest are unconsolidated structured entities. This determination is based on the fact that decision making about the underlying funds is not governed by the voting right or other similar right held by the Portfolio. Similarly, investments in securitizations, asset-backed securities and mortgage-backed securities are determined to be interests in unconsolidated structured entities.
The Portfolio may invest in underlying funds whose investment objectives range from achieving short-term to long-term income and capital growth potential. Underlying funds may use leverage in a manner consistent with their respective investment objectives and as permitted by Canadian securities regulatory authorities. Underlying funds finance their operations by issuing redeemable units which are puttable at the holders’ option and entitles the holder to a proportionate stake in the respective fund’s Net Assets. The change in fair value of each of the underlying funds during the periods is included in “Change in unrealized appreciation (depreciation)” in the Statement of Comprehensive Income.
Mortgage-related securities are created from pools of residential or commercial mortgage loans, including mortgage loans made by savings and loan institutions, mortgage bankers, commercial banks and others. Asset-backed securities created from many types of assets, including auto loans, credit card receivables, home equity loans, and student loans.
The Portfolio does not provide and has not committed to providing any additional significant financial or other support to the unconsolidated structured entities other than its investment in the unconsolidated structured entities.
Additional information on the Portfolio’s interest in unconsolidated structured entities, where applicable, is provided in Note 8(i).
Offsetting of financial assets and financial liabilitiesFinancial instruments are presented at net or gross amounts on the Statement of Financial Position depending on the existence of intention and legal right to offset opposite positions of such instruments
held with the same counterparties. Amounts offset in the Statement of Financial Position are transactions for which the Portfolio has legally enforceable rights to offset and intends to settle the positions on a net basis. Amounts not offset in the Statement of Financial Position relate to transactions where a master netting arrangement or similar agreement is in place with a right to offset only in the event of default, insolvency or bankruptcy, or where the Portfolio has no intention of settling on a net basis. There were no master netting agreements during the periods.
Accounting standards issued but not yet adoptedIn July 2014, the IASB issued the final version of IFRS 9 Financial Instruments, which addresses classification and measurement, impairment and hedge accounting.
The new standard requires assets to be carried at amortized cost, FVTPL or fair value through other comprehensive income based on the entity’s business model for managing financial assets and the contractual cash flow characteristics of the financial asset. The classification and measurement of liabilities remains generally unchanged with the exception of liabilities recorded at FVTPL. For these liabilities, fair value changes attributable to changes in the entity’s own credit risk are to be presented in other comprehensive income unless they affect amounts recorded in income.
The new standard is effective for the Portfolio for its fiscal year beginning January 1, 2018. The Manager is in the process of assessing the impact of adopting this standard but does not expect that the adoption of this standard to have a significant impact to the Portfolio’s financial statements.
4. Critical accounting judgements and estimatesThe preparation of financial statements requires the use of judgement in applying the Portfolio’s accounting policies and to make estimates and assumptions about the future. The following discusses the most significant accounting judgements and estimates that the Portfolio has made in preparing its financial statements:
Accounting judgements:Functional and presentation currencyThe Portfolio’s unitholders are mainly Canadian residents, with the subscriptions and redemptions of the redeemable units denominated in Canadian dollars. The Portfolio invests in Canadian and U.S. dollars and other foreign denominated securities, as applicable. The performance of the Portfolio is measured and reported to the investors in Canadian dollars. The

NOTES TO THE FINANCIAL STATEMENTS (cont’d)(All amounts in thousands of Canadian dollars, except per unit data)June 30, 2017
BMO Private U.S. Special Equity Portfolio
(unaudited)
Manager considers the Canadian dollar as the currency that most faithfully represents the economic effects of the underlying transactions, events and conditions. The financial statements are presented in Canadian dollars, which is the Portfolio's functional and presentation currency.
Classification and measurement of financial instruments and application of fair value optionIn classifying and measuring financial instruments held by the Portfolio, the Manager is required to make significant judgements about whether or not the business of the Portfolio is to invest on a total return basis for the purpose of applying the fair value options for financial assets.
Accounting estimates:Fair value measurement of securities not quoted in an active marketThe Portfolio has established policies and control procedures that are intended to ensure these estimates are well controlled, independently reviewed, and consistently applied from period to period. The estimates of the value of the Portfolio’s assets and liabilities are believed to be appropriate as at the reporting date.
The Portfolio may hold financial instruments that are not quoted in active markets. Note 3 discusses the policies used by the Portfolio for the estimates used in determining fair value.
5. Units and unit transactionsThe redeemable units of the Portfolio are classified as liabilities.
The units have no par value and are entitled to distributions, if any. Upon redemption, a unit is entitled to a proportionate share of the Portfolio’s NAV. The Portfolio is required to pay distributions in an amount not less than the amount necessary to ensure the Portfolio will not be liable for income taxes on realized capital gains, dividends and interest. The Portfolio has no restrictions or specific capital requirements on the subscriptions and redemptions of units except as disclosed in Note 8(a). The relevant movements in redeemable units are shown on the Statement of Changes in Net Assets Attributable to Holders of Redeemable Units. In accordance with its investment objectives and strategies, and the risk management practices outlined in Note 7, the Portfolio endeavours to invest the subscriptions received in appropriate investments, while maintaining sufficient liquidity to
meet redemptions, with such liquidity being augmented by short-term borrowings or disposal of investments where necessary.
Redeemable units of the Portfolio are offered for sale on a continuous basis and may be purchased or redeemed on any Valuation Date at the NAV per unit. The NAV per unit for the purposes of subscription or redemption is computed by dividing the NAV of the Portfolio (that is, the total fair value of the assets less the liabilities) by the total number of units of the Portfolio outstanding at such time on each Valuation Date, in accordance with Part 14 of National Instruments (“NI”) 81-106 Investment Fund Continuous Disclosure for the purpose of unitholder transactions. Net Assets are determined in accordance with IFRS and may differ to the Portfolio’s NAV. Where the Portfolio’s NAV is not equal to its Net Assets, a reconciliation is shown in Note 8.
6. Related party transactions(a) Management FeesThe Manager is responsible for the day-to-day management of the Portfolio, including managing or arranging for the management of the Portfolio’s investment portfolio as well as providing and arranging for the provision of administrative services to the Portfolio such as valuation services, fund accounting and unitholder records. The Manager does not receive a fee from the Portfolio for its services. Instead, unitholders pay an investment management fee directly to BMO Trust Company and the Manager as arranged between the unitholder, BMO Trust Company and the Manager.
(b) Unitholder servicing, sub-advisory commissions and other portfolio transaction costsThe Portfolio is provided with certain facilities and services by affiliates of the Manager. Expenses incurred in the administration of the Portfolio were paid to BMO Trust Company (“the Trustee”) and to BMO Asset Management Inc. (“the Registrar”) and charged to the Portfolio. These expenses are included in “Unitholder servicing fees” in the Statement of Comprehensive Income.
The sub-advisors (including affiliates of the Manager, where applicable) engaged by the Manager provide investment advice and make investment decisions for the Portfolio’s investment portfolio. For these services the sub-advisors receive sub-advisory fees. These fees are paid monthly by the Manager on behalf of the

NOTES TO THE FINANCIAL STATEMENTS (cont’d)(All amounts in thousands of Canadian dollars, except per unit data)June 30, 2017
BMO Private U.S. Special Equity Portfolio
(unaudited)
Portfolio. These expenses are included in “Sub-advisory fees” in the Statement of Comprehensive Income. Any sub-advisory fees less than or equal to 0.15% of the NAV of the Portfolio are absorbed by the Manager.
(c) Portfolio expensesThe Portfolio also pays certain operating expenses directly, including compensation and expenses payable to Independent Review Committee (“IRC”) members and any independent counsel or other advisors employed by the IRC, the costs of the orientation and continuing education of IRC members and the costs and expenses associated with IRC meetings.
(d) Commissions and other portfolio transaction costsThe Portfolio may execute trades with and through BMO Nesbitt Burns Inc., an affiliate of the Manager based on established standard brokerage agreements at market prices. These fees are included in “Commissions and other portfolio transaction costs” in the Statement of Comprehensive Income. Refer to Note 8 for related party fees charged to the Portfolio during the periods ended June 30, 2017 and June 30, 2016.
(e) Other related party transactionsFrom time to time, the Manager may on behalf of the Portfolio, enter into transactions or arrangements with or involving subsidiaries and affiliates of Bank of Montreal, or certain other persons or companies that are related or connected to the Manager of the Portfolio. These transactions or arrangements may include transactions or arrangements with or involving subsidiaries and affiliates of Bank of Montreal, BMO Asset Management Inc., BMO Trust Company, BMO Nesbitt Burns Inc., BMO InvestorLine Inc., BMO Private Investment Counsel Inc., BMO Asset Management Corp., Pyrford International Limited, or other investment funds offered by Bank of Montreal, and may involve the purchase or sale of portfolio securities through or from a subsidiary or affiliates of Bank of Montreal, the purchase or sale of securities issued or guaranteed by a subsidiary or affiliates of Bank of Montreal, entering into forward contracts with a subsidiary or affiliates of Bank of Montreal acting as counterparty, the purchase or redemption of units of other Bank of Montreal affiliated investment funds or the provision of services to the Manager.
7. Financial instruments risksThe Portfolio’s activities expose it to a variety of risks associated with the financial instruments, as follows: market risk (including currency risk, interest rate risk
and other market risk), credit risk and liquidity risk. The concentration table groups securities by asset type, geographic location and/or market segment. The Portfolio’s risk management practice outlines the monitoring of compliance to investment guidelines.
The Manager manages the potential effects of these financial risks on the Portfolio’s performance by employing and overseeing professional and experienced portfolio managers that regularly monitor the Portfolio’s positions, market events and diversify investment portfolios within the constraints of the investment guidelines.
(a) Currency riskCurrency risk is the risk that the value of financial instruments denominated in currencies, other than the functional currency of the Portfolio, will fluctuate due to changes in foreign exchange rates. Investments in foreign markets are exposed to currency risk as the prices denominated in foreign currencies are converted to the Portfolio’s functional currency in determining fair value. The Portfolio may enter into forward currency contracts for hedging purposes to reduce foreign currency exposure or to establish exposure to foreign currencies. The Portfolio’s exposure to currency risk, if any, is further disclosed in Note 8.
(b) Interest rate riskInterest rate risk is the risk that the fair value of the Portfolio's interest bearing investments will fluctuate due to changes in market interest rates. The Portfolio's exposure to interest rate risk is concentrated in its investment in debt securities (such as bonds, money market investments, short-term investments and debentures) and interest rate derivative instruments, if any. Other assets and liabilities are short-term in nature and/or non-interest bearing. The Portfolio's exposure to interest rate risk, if any, is further discussed in Note 8.
(c) Other market riskOther market risk is the risk that the fair value of a financial instrument will fluctuate as a result of changes in market prices (other than those arising from interest rate risk or currency risk), whether those changes are caused by factors specific to the individual financial instrument or its issuer, or factors affecting all similar financial instruments traded in a market. Other assets and liabilities are monetary items that are short-term in nature, as such they are not subject to other market risk. The Portfolio's exposure to other market risk, if any, is further discussed in Note 8.

NOTES TO THE FINANCIAL STATEMENTS (cont’d)(All amounts in thousands of Canadian dollars, except per unit data)June 30, 2017
BMO Private U.S. Special Equity Portfolio
(unaudited)
(d) Credit riskCredit risk is the risk that a loss could arise from a security issuer or counterparty to a financial instrument not being able to meet its financial obligations. The fair value of debt securities includes consideration of the credit worthiness of the debt issuer. Credit risk exposure for over-the-counter derivative instruments is based on the Portfolio's unrealized gain of the contractual obligations with the counterparty as at the reporting date. The credit exposure of other assets is represented by its carrying amount. The Portfolio's exposure to credit risk, if any, is further discussed in Note 8.
The Portfolio may enter into securities lending transactions with approved counterparties. Credit risk associated with these transactions is considered minimal as all counterparties have a sufficient approved credit rating and the market value of collateral held by the Portfolio must be at least 102% of the fair value of securities loaned, as disclosed in Note 8.
(e) Liquidity riskThe Portfolio's exposure to liquidity risk is concentrated in the daily cash redemptions of units. The Portfolio primarily invests in securities that are traded in active markets and can be readily disposed. In addition, the Portfolio retains sufficient cash and cash equivalent positions to maintain liquidity. The Portfolio may, from time to time, enter into over-the-counter derivative contracts or invest in unlisted securities, which are not traded in an organized market and may be illiquid. Securities for which a market quotation could not be obtained and may be illiquid are identified on the Schedule of Investment Portfolio. The proportion of illiquid securities to the NAV of the Portfolio is monitored by the Manager to ensure it does not exceed the regulatory limit and does not significantly affect the liquidity required to meet the Portfolio's financial obligations.

NOTES TO THE FINANCIAL STATEMENTS (cont’d)(All amounts in thousands of Canadian dollars, except per unit data)June 30, 2017
BMO Private U.S. Special Equity Portfolio
(unaudited)
8. Portfolio specific information(a) Portfolio information and change in unitsThe Portfolio’s inception date was September 29, 2006.
The number of units of each series that have been issued and are outstanding are disclosed in the table below.
For the periods ended (in thousands of units)
Jun. 30,
2017
Jun. 30,
2016Units issued and outstanding, beginning of
period 22,823 33,575Issued for cash 2,902 3,744Redeemed during the period (3,141) (13,136)Units issued and outstanding, end of period 22,584 24,183
(b) Reconciliation of NAV to Net AssetsAs at June 30, 2017 and December 31, 2016, there were no differences between the Portfolio’s NAV per unit and its Net Assets per unit calculated in accordance with IFRS.
(c) Increase (decrease) in net assets attributable to holders of redeemable units per unitThe increase (decrease) in net assets attributable to holders of redeemable units per unit for the periods ended June 30, 2017 and June 30, 2016 is calculated as follows:
Jun. 30, Jun. 30,For the periods ended 2017 2016
Increase (decrease) in net assets attributable
to holders of redeemable units 21,772 (33,093)
Weighted average units outstanding during
the period 22,766 27,874
Increase (decrease) in net assets attributable to holders of redeemable
units per unit 0.96 (1.19)
(d) Income taxesAs at the tax year-ended December 2016, the Portfolio had the following estimated capital and non-capital losses for income tax purposes:
Total Capital Losses
($)
Total Non-Capital Losses
($) Non-Capital Losses That Expire in
2027 ($)
2028 ($)
2029 and
thereafter ($)
30,153 — — — —
(e) Related party transactionsUnitholder servicingThe related party fees charged for unitholder servicing fees are as follows:
Jun. 30, Jun. 30,For the periods ended 2017 2016
Unitholder servicing ($) 62 84
Brokerage commissions and soft dollarsBrokerage commissions paid (excluding transaction costs) on security transactions and amounts paid to related parties of the Manager for brokerage services provided to the Portfolio for the periods are as follows:
Jun. 30, Jun. 30,For the periods ended 2017 2016
Total brokerage amounts paid ($) 191 237
Total brokerage amounts paid to related
parties ($) 0 —
The Manager may select brokers who charge a commission in “soft dollars” if they determine in good faith that the commission is reasonable in relation to the order execution and research services utilized. The ascertainable soft dollar value of services received as a percentage of total brokerage commissions paid under the soft dollar arrangement entered into by the portfolio advisor for the periods ended is as follows:
Jun. 30, Jun. 30,
For the periods ended 2017 2016
Total soft dollars ($) 20 50
Total soft dollars as a percentage of total
commissions (%) 10 21
There were no ascertainable soft dollars paid or payable to dealers by the Portfolio as at June 30, 2017.
(f) Financial instruments risksThe Portfolio’s objective is to achieve long term growth through appreciation by investing primarily in small- and mid-sized companies in the U.S. market.
No other changes affecting the overall level of risk of investing in the Portfolio were made during the period.
Currency riskThe Portfolio’s exposure to currency risk is summarized in the tables below. Amounts shown are based on the carrying value of monetary and non-monetary assets (including derivatives and the underlying principle (notional) amount of forward currency contracts, if any).

NOTES TO THE FINANCIAL STATEMENTS (cont’d)(All amounts in thousands of Canadian dollars, except per unit data)June 30, 2017
BMO Private U.S. Special Equity Portfolio
(unaudited)
As at Jun. 30, 2017Cash and
other current
receivables & payables
($)
Invest- ments
(monetary & non-
monetary)
($)
Forward currency contracts
($)
Net currency exposure
($)
As a % of Net Assets
(%)
U.S. Dollar 6,733 205,371 – 212,104 100.3
All amounts in Canadian Dollars
As at Dec. 31, 2016Cash and
other current
receivables & payables
($)
Invest- ments
(monetary & non-
monetary)
($)
Forward currency contracts
($)
Net currency exposure
($)
As a % of Net Assets
(%)
U.S. Dollar 6,474 186,365 – 192,839 100.4
All amounts in Canadian Dollars
As at June 30, 2017 and December 31, 2016, if the Canadian dollar had strengthened or weakened by 5% in relation to all foreign currencies, with all variables held constant, the Net Assets of the Portfolio could possibly have decreased or increased, respectively, by approximately $10,605 (December 31, 2016 – $9,642). In practice, actual results may differ from this sensitivity analysis and the difference could be material.
Interest rate riskAs at June 30, 2017 and December 31, 2016, the Portfolio did not have any significant exposure to interest rate risk.
Other market riskThe Portfolio has a significant exposure to other market risk arising from its investment in equity securities. Using historical correlation between the Portfolio's return and the return of its benchmark, if the benchmark, Russell 2000 Growth Index (CAD), had increased or decreased by 10%, with all other variables held constant, the Net Assets of the Portfolio would have increased or decreased, respectively, by $19,257 (December 31, 2016 — $17,512). Historical correlation may not be representative of future correlation, and accordingly, actual results may differ and the difference could be material.
Credit riskAs at June 30, 2017 and December 31, 2016, the Portfolio did not have any significant exposure to credit risk.
Securities lendingThe Portfolio had assets involved in securities lending transactions outstanding as at June 30, 2017 and December 31, 2016 as follows:
Aggregate Value of Securities on Loan
($)
Aggregate Value of Collateral
Received for the Loan
($)
June 30, 2017 — —December 31, 2016 9,656 10,161
There were no assets involved in securities lending transactions as at June 30, 2017.
The table below is a reconciliation of the gross amount generated from securities lending transactions to the security lending revenue for the periods ended June 30, 2017 and June 30, 2016:
For the periods ended Jun. 30, 2017 Jun. 30, 2016
Amount
% of Gross Securities Lending
Revenue Amount
% of Gross Securities Lending
Revenue Gross securities lending
revenue 53 100.0 288 100.0
Withholding taxes 7 13.2 48 12.4
46 86.8 240 87.6
Payment to securities
lending agents 14 26.1 72 24.5
Net securities lending
revenue* 32 60.7 168 63.1
* Amount shown on the Statement of Comprehensive Income is gross of withholding
taxes of $7 (June 30, 2016 - $48).
NOTES TO THE FINANCIAL STATEMENTS (cont’d)(All amounts in thousands of Canadian dollars, except per unit data)June 30, 2017
BMO Private U.S. Special Equity Portfolio
(unaudited)
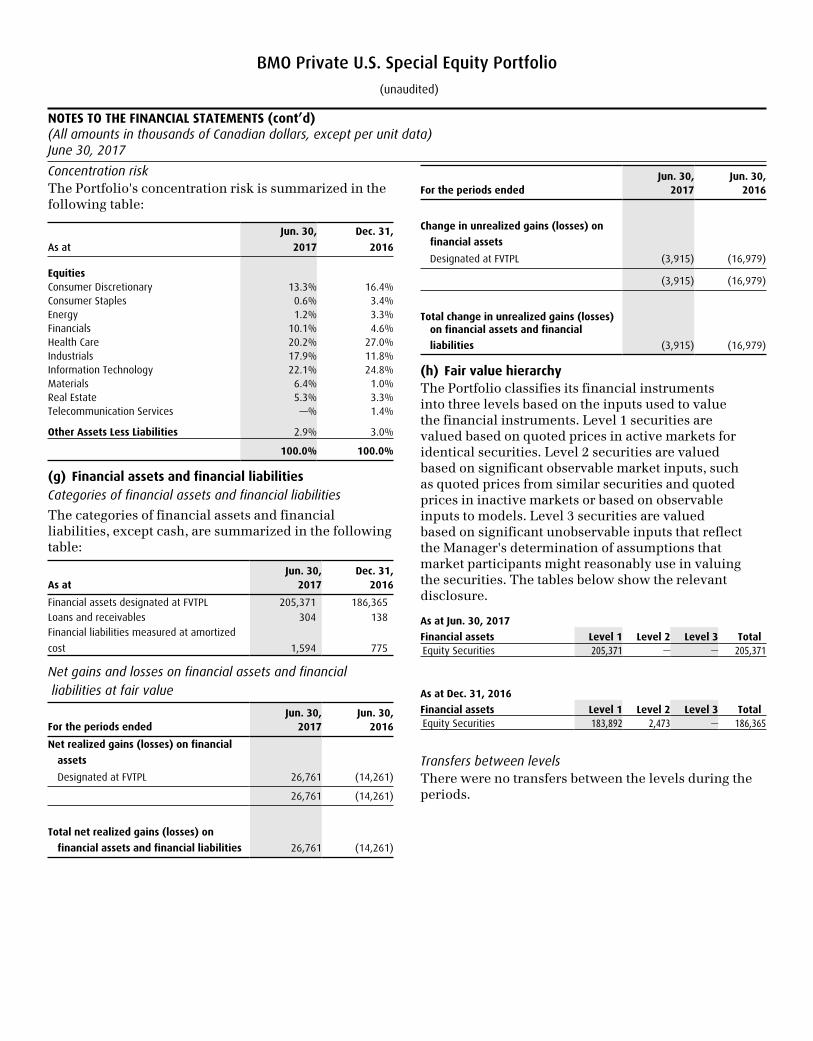
Concentration riskThe Portfolio's concentration risk is summarized in the following table:
As at
Jun. 30,
2017
Dec. 31,
2016
EquitiesConsumer Discretionary 13.3% 16.4%Consumer Staples 0.6% 3.4%Energy 1.2% 3.3%Financials 10.1% 4.6%Health Care 20.2% 27.0%Industrials 17.9% 11.8%Information Technology 22.1% 24.8%Materials 6.4% 1.0%Real Estate 5.3% 3.3%Telecommunication Services —% 1.4%
Other Assets Less Liabilities 2.9% 3.0%
100.0% 100.0%
(g) Financial assets and financial liabilitiesCategories of financial assets and financial liabilities
The categories of financial assets and financial liabilities, except cash, are summarized in the following table:
Jun. 30, Dec. 31,As at 2017 2016
Financial assets designated at FVTPL 205,371 186,365Loans and receivables 304 138Financial liabilities measured at amortized
cost 1,594 775
Net gains and losses on financial assets and financial liabilities at fair value
Jun. 30, Jun. 30,For the periods ended 2017 2016
Net realized gains (losses) on financial
assets
Designated at FVTPL 26,761 (14,261)
26,761 (14,261)
Total net realized gains (losses) on
financial assets and financial liabilities 26,761 (14,261)
Jun. 30, Jun. 30,For the periods ended 2017 2016
Change in unrealized gains (losses) on
financial assets
Designated at FVTPL (3,915) (16,979)
(3,915) (16,979)
Total change in unrealized gains (losses) on financial assets and financial
liabilities (3,915) (16,979)
(h) Fair value hierarchyThe Portfolio classifies its financial instruments into three levels based on the inputs used to value the financial instruments. Level 1 securities are valued based on quoted prices in active markets for identical securities. Level 2 securities are valued based on significant observable market inputs, such as quoted prices from similar securities and quoted prices in inactive markets or based on observable inputs to models. Level 3 securities are valued based on significant unobservable inputs that reflect the Manager's determination of assumptions that market participants might reasonably use in valuing the securities. The tables below show the relevant disclosure.
As at Jun. 30, 2017
Financial assets Level 1 Level 2 Level 3 Total Equity Securities 205,371 — — 205,371
As at Dec. 31, 2016
Financial assets Level 1 Level 2 Level 3 Total Equity Securities 183,892 2,473 — 186,365
Transfers between levelsThere were no transfers between the levels during the periods.

BMO Private Banking is part of BMO Wealth Management. Banking services are offered through Bank of Montreal. Investment management services are offered through BMO Private Investment Counsel Inc., an indirect subsidiary of Bank of Montreal. Estate, Trust, Planning and Custodial Services are offered through BMO Trust Company, a wholly-owned subsidiary of Bank of Montreal. BMO Wealth Management is a brand name that refers to Bank of Montreal and certain of its affiliates in providing wealth management products and services.
BMO (M-bar roundel symbol) registered trademark, and BMO (M-bar roundel symbol) Private Banking trademark are owned by Bank of Montreal, used under license.
ManagerBMO Private Investment Counsel Inc.1 First Canadian Place100 King St. W., 41st Floor Toronto, Ontario M5X 1A1
TrusteeBMO Trust Company1 First Canadian Place100 King St. W., 41st Floor Toronto, Ontario M5X 1A1
Independent AuditorPricewaterhouseCoopers LLP PwC Tower18 York Street, Suite 2600Toronto, Ontario M5J 0B2
www.bmoprivatebanking.com
For more information please call 1-800-361-1392