SEMI-ANNUAL REPORT April 30, 2014 - EuroPacificFunds · SEMI-ANNUAL REPORT April 30, 2014. This...
92
EuroPac International Value Fund - Class A (EPIVX) EuroPac International Value Fund - Class I (EPVIX) EuroPac International Bond Fund - Class A (EPIBX) EuroPac International Bond Fund - Class I (EPBIX) EuroPac Hard Asset Fund - Class A (EPHAX) EuroPac Hard Asset Fund - Class I (EPHIX) EuroPac Gold Fund - Class A (EPGFX) EuroPac International Dividend Income Fund - Class A (EPDPX) EuroPac International Dividend Income Fund - Class I (EPDIX) EP China Fund - Class A (EPHCX) EP Asia Small Companies Fund - Class A (EPASX) EP Asia Small Companies Fund - Class I (EPEIX) EP Latin America Fund - Class A (EPLAX) EP Latin America Fund - Class I (EPWIX) EP Strategic US Equity Fund - Class A (EPUSX) SEMI-ANNUAL REPORT April 30, 2014
Transcript of SEMI-ANNUAL REPORT April 30, 2014 - EuroPacificFunds · SEMI-ANNUAL REPORT April 30, 2014. This...

EuroPac International Value Fund - Class A (EPIVX)
EuroPac International Value Fund - Class I (EPVIX)
EuroPac International Bond Fund - Class A (EPIBX)
EuroPac International Bond Fund - Class I (EPBIX)
EuroPac Hard Asset Fund - Class A (EPHAX)
EuroPac Hard Asset Fund - Class I (EPHIX)
EuroPac Gold Fund - Class A (EPGFX)
EuroPac International Dividend Income Fund - Class A (EPDPX)
EuroPac International Dividend Income Fund - Class I (EPDIX)
EP China Fund - Class A (EPHCX)
EP Asia Small Companies Fund - Class A (EPASX)
EP Asia Small Companies Fund - Class I (EPEIX)
EP Latin America Fund - Class A (EPLAX)
EP Latin America Fund - Class I (EPWIX)
EP Strategic US Equity Fund - Class A (EPUSX)
SEMI-ANNUAL REPORT
April 30, 2014
This report and the financial statements contained herein are provided for the general information of the shareholders of the Euro Pacific Funds. This report is not authorized for distribution to prospective investors in the Funds unless preceded or accompanied by an effective prospectus.
www.europacificfunds.com
Euro Pacific Funds
EuroPac International Value Fund - Class A (EPIVX)
EuroPac International Value Fund - Class I (EPVIX)
EuroPac International Bond Fund - Class A (EPIBX)
EuroPac International Bond Fund - Class I (EPBIX)
EuroPac Hard Asset Fund - Class A (EPHAX)
EuroPac Hard Asset Fund - Class I (EPHIX)
EuroPac Gold Fund - Class A (EPGFX)
EuroPac International Dividend Income Fund - Class A (EPDPX)
EuroPac International Dividend Income Fund - Class I (EPDIX)
EP China Fund - Class A (EPHCX)
EP Asia Small Companies Fund - Class A (EPASX)
EP Asia Small Companies Fund - Class I (EPEIX)
EP Latin America Fund - Class A (EPLAX)
EP Latin America Fund - Class I (EPWIX)
EP Strategic US Equity Fund - Class A (EPUSX)
Each a series of the Investment Managers Series Trust
Table of Contents
Schedules of Investments .............................................................................................................................................. 1
Statements of Assets and Liabilities ............................................................................................................................ 36
Statements of Operations ........................................................................................................................................... 39
Statements of Changes in Net Assets .......................................................................................................................... 42
Financial Highlights ...................................................................................................................................................... 51
Notes to Financial Statements ..................................................................................................................................... 66
Supplemental Information .......................................................................................................................................... 83
Expense Examples ....................................................................................................................................................... 85

EuroPac International Value Fund SCHEDULE OF INVESTMENTS As of April 30, 2014 (Unaudited)
Number of Shares Value __________ ____________
COMMON STOCKS – 91.8%
AUSTRALIA – 8.4%
25,590 BHP Billiton Ltd.
$ 897,457
939,837 CFS Retail Property Trust - REIT
1,754,991
220,000 Newcrest Mining Ltd.
* 2,137,867
57,843 Origin Energy Ltd.
800,688
22,405 Woolworths Ltd.
776,806
____________ 6,367,809
____________ BRAZIL
– 6.4%
284,856 Cia Energetica de Minas Gerais - ADR
2,147,814
111,300 Grendene S.A.
703,799
93,000 Telefonica Brasil S.A. - ADR
1,971,600
____________ 4,823,213
____________ CANADA
– 16.6%
42,695 ARC Resources Ltd.
1,266,711
113,200 Barrick Gold Corp.
1,977,604
83,000 Goldcorp, Inc.
2,051,760
369,800 Kinross Gold Corp.
* 1,501,388
346,500 Major Drilling Group International, Inc.
2,724,961
180,700 Precision Drilling Corp.
2,349,215
91,490 Yamana Gold, Inc.
684,345
____________ 12,555,984
____________ CHILE
– 1.3%
1,544,742 Aguas Andinas S.A. - A Shares
956,294
____________ CHINA
– 0.7%
202,000 China Shenhua Energy Co., Ltd. - H Shares
547,143
____________ COLOMBIA
– 1.4%
63,800 Pacific Rubiales Energy Corp.
1,041,312
____________ FINLAND
– 3.0%
101,600 Fortum OYJ
2,293,330
____________ HONG KONG
– 2.1%
165,500 China Mobile Ltd.
1,573,243
____________ INDIA
– 1.7%
30,800 ICICI Bank Ltd. - ADR
1,314,236
____________ JAPAN
– 12.7%
322,000 Aozora Bank Ltd.
957,480
78,400 Asahi Group Holdings Ltd.
2,161,014
401,000 Isuzu Motors Ltd.
2,325,945
191,000 ITOCHU Corp.
2,137,272
23,000 JGC Corp.
744,657
49,000 SCSK Corp.
1,292,160
____________ 9,618,528
____________
1
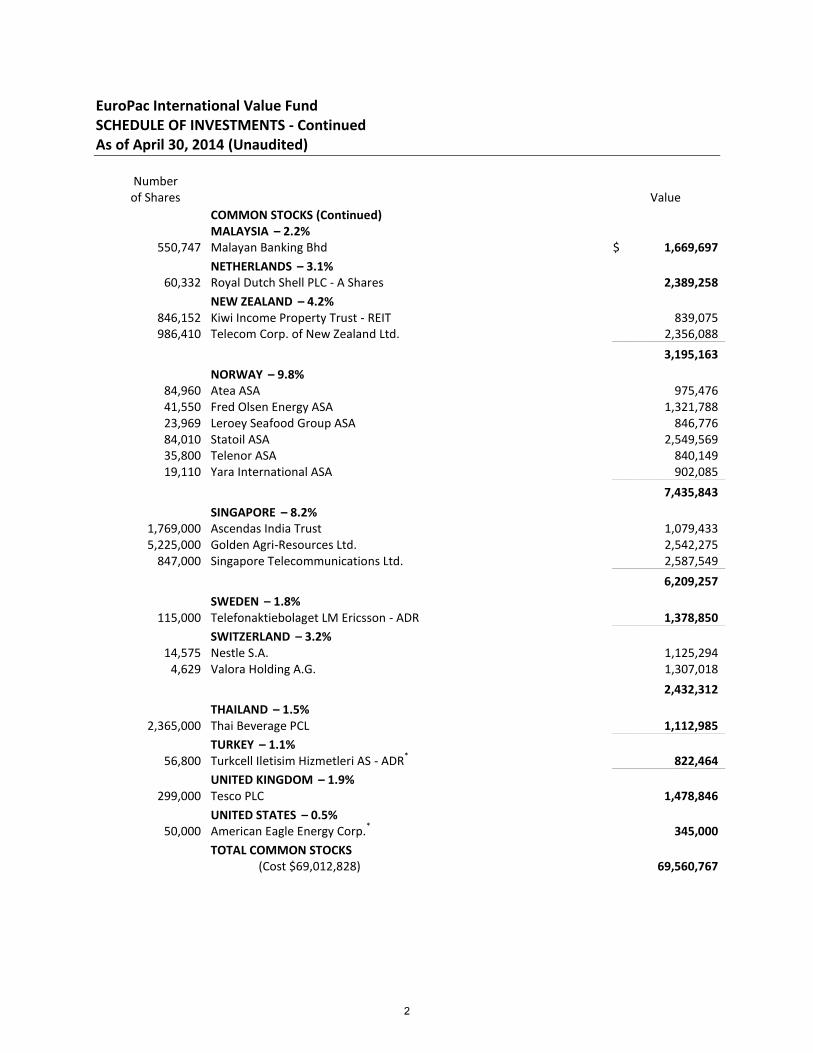
EuroPac International Value Fund SCHEDULE OF INVESTMENTS - Continued As of April 30, 2014 (Unaudited)
Number of Shares Value __________ ____________
COMMON STOCKS (Continued) MALAYSIA
– 2.2%
550,747 Malayan Banking Bhd
$ 1,669,697
____________ NETHERLANDS
– 3.1%
60,332 Royal Dutch Shell PLC - A Shares
2,389,258
____________ NEW ZEALAND
– 4.2%
846,152 Kiwi Income Property Trust - REIT
839,075
986,410 Telecom Corp. of New Zealand Ltd.
2,356,088
____________ 3,195,163
____________ NORWAY
– 9.8%
84,960 Atea ASA
975,476
41,550 Fred Olsen Energy ASA
1,321,788
23,969 Leroey Seafood Group ASA
846,776
84,010 Statoil ASA
2,549,569
35,800 Telenor ASA
840,149
19,110 Yara International ASA
902,085
____________ 7,435,843
____________ SINGAPORE
– 8.2%
1,769,000 Ascendas India Trust
1,079,433
5,225,000 Golden Agri-Resources Ltd.
2,542,275
847,000 Singapore Telecommunications Ltd.
2,587,549
____________ 6,209,257
____________ SWEDEN
– 1.8%
115,000 Telefonaktiebolaget LM Ericsson - ADR
1,378,850
____________ SWITZERLAND
– 3.2%
14,575 Nestle S.A.
1,125,294
4,629 Valora Holding A.G.
1,307,018
____________ 2,432,312
____________ THAILAND
– 1.5%
2,365,000 Thai Beverage PCL
1,112,985
____________ TURKEY
– 1.1%
56,800 Turkcell Iletisim Hizmetleri AS - ADR
* 822,464
____________ UNITED KINGDOM
– 1.9%
299,000 Tesco PLC
1,478,846
____________ UNITED STATES
– 0.5%
50,000 American Eagle Energy Corp.
* 345,000
____________
TOTAL COMMON STOCKS (Cost $69,012,828)
69,560,767
____________
2
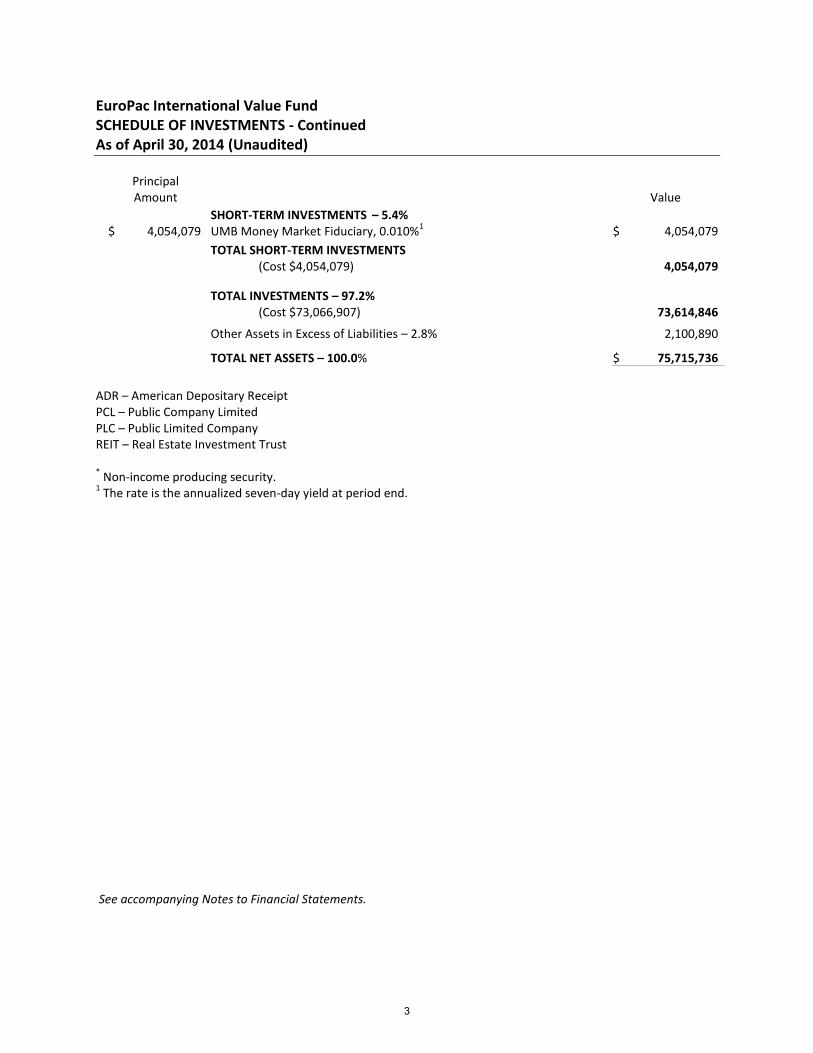
EuroPac International Value Fund SCHEDULE OF INVESTMENTS - Continued As of April 30, 2014 (Unaudited)
Principal Amount Value __________ ____________
SHORT-TERM INVESTMENTS – 5.4%
$ 4,054,079 UMB Money Market Fiduciary, 0.010%
1 $ 4,054,079
____________
TOTAL SHORT-TERM INVESTMENTS (Cost $4,054,079)
4,054,079
____________
TOTAL INVESTMENTS – 97.2% (Cost $73,066,907) 73,614,846
Other Assets in Excess of Liabilities – 2.8%
2,100,890 ____________
TOTAL NET ASSETS – 100.0% $ 75,715,736 ____________ ____________
ADR – American Depositary Receipt PCL – Public Company Limited PLC – Public Limited Company REIT – Real Estate Investment Trust * Non-income producing security.
1 The rate is the annualized seven-day yield at period end.
See accompanying Notes to Financial Statements.
3

EuroPac International Value Fund SUMMARY OF INVESTMENTS As of April 30, 2014 (Unaudited)
Security Type/Sector Percent of Total
Net Assets
Common Stocks Basic Materials 17.0% Communications 16.5% Energy 15.6% Consumer, Non-cyclical 13.3% Financial 10.0% Consumer, Cyclical 8.5% Utilities 8.2% Technology 1.7% Industrial 1.0% __________
Total Common Stocks 91.8%
Short-Term Investments 5.4% __________ Total Investments 97.2% Other Assets in Excess of Liabilities 2.8% __________ Total Net Assets 100.0% __________ __________
See accompanying Notes to Financial Statements.
4

EuroPac International Bond Fund SCHEDULE OF INVESTMENTS As of April 30, 2014 (Unaudited)
Principal Amount
6 Value __________ ____________
FIXED INCOME SECURITIES – 85.6%
AUSTRALIA – 8.9%
1,500,000
CFS Retail Property Trust Group 5.075%, 8/21/2014
1 $ 1,402,244
Queensland Treasury Corp.
2,500,000
6.000%, 6/14/2021
2,628,177
1,500,000 5.750%, 7/22/2024
1,541,728
1,000,000
Telstra Corp. Ltd. 7.750%, 7/15/2020
1,087,046
____________ 6,659,195
____________ BERMUDA
– 0.8%
4,000,000
Seadrill Ltd. 4.182%, 3/18/2019
2 615,176
____________
BRAZIL – 0.6%
1,000,000
Brazilian Government International Bond 12.500%, 1/5/2016
470,894
____________
CANADA – 9.4%
1,000,000
Baytex Energy Corp. 6.625%, 7/19/2022
3 963,644
2,000,000
Canadian Government Bond 2.500%, 6/1/2024
1,833,957
1,750,000
Export Development Canada 3.875%, 3/16/2017
1,487,719
350,000
Ontario Electricity Financial Corp. 8.900%, 8/18/2022
458,372
1,750,000
Province of Ontario Canada 1.900%, 9/8/2017
1,611,753
715,000
Sherritt International Corp. 7.750%, 10/15/2015
691,451
____________ 7,046,896
____________ CAYMAN ISLANDS
– 3.6%
5,000,000
AmBev International Finance Co., Ltd. 9.500%, 7/24/2017
2,179,344
500,000
Marfrig Overseas Ltd. 9.500%, 5/4/2020
3 513,750
____________ 2,693,094
____________
CHILE – 4.6%
550,000,000
Banco Santander Chile 6.750%, 6/1/2016
1,015,286
700,000,000
Bonos del Banco Central de Chile en Pesos 6.000%, 3/1/2022
1,349,513
5

EuroPac International Bond Fund SCHEDULE OF INVESTMENTS - Continued As of April 30, 2014 (Unaudited)
Principal Amount
6 Value __________ ____________
FIXED INCOME SECURITIES (Continued) CHILE (Continued)
600,000,000
Telefonica Moviles Chile S.A. 6.300%, 11/15/2016
$ 1,118,218
____________ 3,483,017
____________ GERMANY
– 5.9%
KFW
20,000,000
7.000%, 6/14/2016
541,648
14,500,000 5.000%, 5/22/2019
2,724,565
7,000,000 3.500%, 1/22/2021
1,165,961
____________ 4,432,174
____________ INDIA
– 1.7%
1,305,000
ICICI Bank Ltd. 7.250%, 8/29/2049
2,3 1,302,129
____________
LUXEMBOURG – 0.7%
500,000
VTB Bank OJSC Via VTB Capital S.A. 3.150%, 12/16/2016
559,027
____________
MALAYSIA – 5.0%
Malaysia Government Bond
1,990,000
3.434%, 8/15/2014
610,236
10,000,000 4.160%, 7/15/2021
3,103,996
____________ 3,714,232
____________ MEXICO
– 7.2%
20,000,000
America Movil S.A.B. de C.V. 9.000%, 1/15/2016
1,629,448
42,000,000
Mexican Bonos 5.000%, 6/15/2017
3,276,483
500,000
TV Azteca S.A.B. de C.V. 7.625%, 9/18/2020
3 534,375
____________ 5,440,306
____________ NEW ZEALAND
– 6.0%
2,000,000
Contact Energy Ltd. 7.855%, 4/13/2017
1,833,898
401,000
Fletcher Building Industries Ltd. 9.000%, 5/15/2014
346,110
650,000
Fletcher Building Ltd. 8.500%, 3/15/2015
574,921
2,000,000
Fonterra Cooperative Group Ltd. 5.520%, 2/25/2020
1,727,616
____________ 4,482,545
____________
6

EuroPac International Bond Fund SCHEDULE OF INVESTMENTS - Continued As of April 30, 2014 (Unaudited)
Principal Amount
6 Value __________ ____________
FIXED INCOME SECURITIES (Continued) NORWAY
– 4.7%
2,000,000
BOA Offshore AS 8.470%, 12/18/2018
2 $ 344,465
1,500,000
Kommunalbanken A.S. 3.750%, 12/11/2017
1,251,207
6,000,000 2.875%, 5/16/2017
1,031,153
5,000,000
Marine Harvest ASA 5.190%, 3/12/2018
2,3 864,273
____________ 3,491,098
____________ PERU
– 2.7%
5,000,000
Peruvian Government International Bond 7.840%, 8/12/2020
1,992,039
____________
POLAND – 3.8%
Poland Government Bond
3,000,000
4.750%, 10/25/2016
1,029,494
2,500,000 2.720%, 1/25/2017
2 825,035
3,000,000 2.720%, 1/25/2018
2 992,581
____________ 2,847,110
____________ RUSSIA
– 1.2%
34,000,000
Russian Federal Bond - OFZ 7.350%, 1/20/2016
938,639
____________
SINGAPORE – 4.0%
1,000,000
CapitaLand Ltd. 2.100%, 11/15/2016
1 799,633
1,750,000
Genting Singapore PLC 5.125%, 3/29/2049
2,3 1,367,425
1,000,000
Keppel Corp. Ltd. 3.800%, 4/23/2027
2,3 801,441
____________ 2,968,499
____________ SOUTH KOREA
– 3.2%
2,750,000
Korea Development Bank 5.250%, 4/3/2018
2,370,354
____________
SWEDEN – 5.5%
9,000,000
City of Stockholm Sweden 3.000%, 4/3/2017
1,459,863
9,250,000
Kommuninvest I Sverige A.B. 4.000%, 8/12/2017
1,540,955
4,000,000
Magnolia Bostad A.B. 8.000%, 5/2/2018
3,4 624,404
7
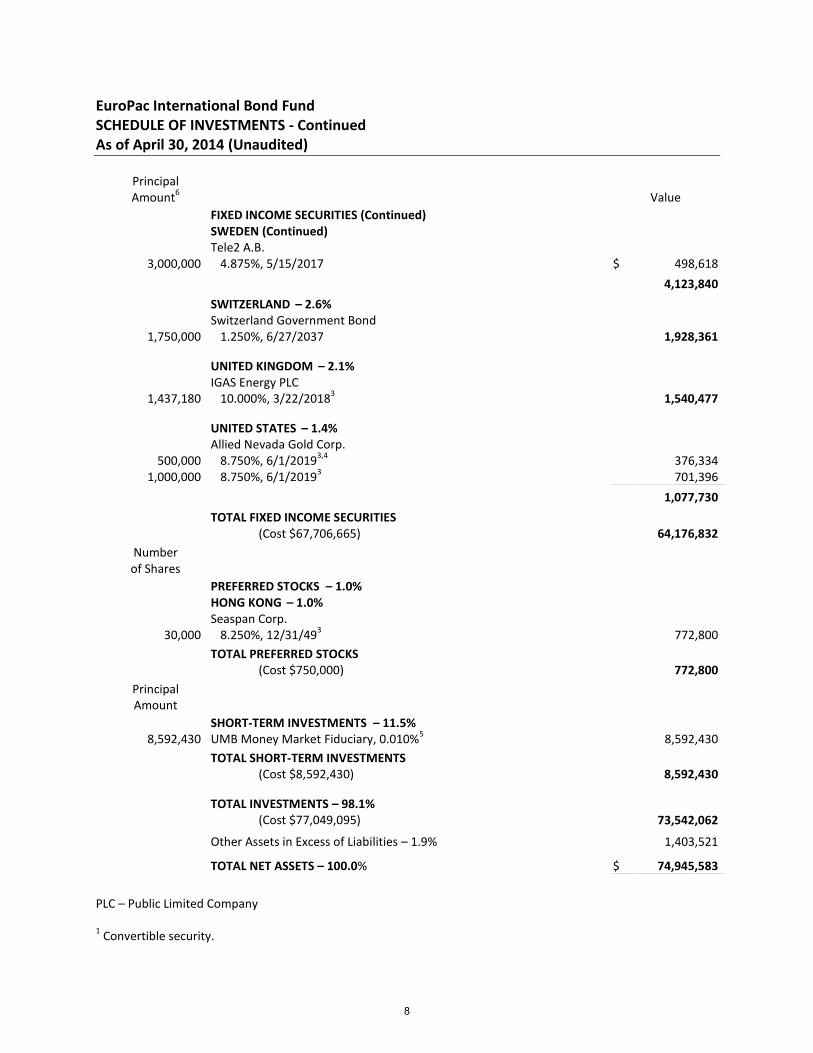
EuroPac International Bond Fund SCHEDULE OF INVESTMENTS - Continued As of April 30, 2014 (Unaudited)
Principal Amount
6 Value __________ ____________
FIXED INCOME SECURITIES (Continued) SWEDEN (Continued)
3,000,000
Tele2 A.B. 4.875%, 5/15/2017
$ 498,618
____________ 4,123,840
____________ SWITZERLAND
– 2.6%
1,750,000
Switzerland Government Bond 1.250%, 6/27/2037
1,928,361
____________
UNITED KINGDOM – 2.1%
1,437,180
IGAS Energy PLC 10.000%, 3/22/2018
3 1,540,477
____________
UNITED STATES – 1.4%
Allied Nevada Gold Corp.
500,000
8.750%, 6/1/2019
3,4 376,334
1,000,000 8.750%, 6/1/2019
3 701,396
____________ 1,077,730
____________
TOTAL FIXED INCOME SECURITIES (Cost $67,706,665)
64,176,832
____________
Number of Shares __________
PREFERRED STOCKS – 1.0% HONG KONG
– 1.0%
30,000
Seaspan Corp. 8.250%, 12/31/49
3 772,800
____________
TOTAL PREFERRED STOCKS (Cost $750,000)
772,800
____________
Principal Amount __________
SHORT-TERM INVESTMENTS – 11.5% 8,592,430
UMB Money Market Fiduciary, 0.010%
5 8,592,430
____________
TOTAL SHORT-TERM INVESTMENTS (Cost $8,592,430)
8,592,430
____________
TOTAL INVESTMENTS – 98.1% (Cost $77,049,095) 73,542,062
Other Assets in Excess of Liabilities – 1.9%
1,403,521 ____________
TOTAL NET ASSETS – 100.0% $ 74,945,583 ____________ ____________
PLC – Public Limited Company 1 Convertible security.
8
EuroPac International Bond Fund SCHEDULE OF INVESTMENTS - Continued As of April 30, 2014 (Unaudited) 2 Variable, floating or step rate security.
3 Callable.
4 Security exempt from registration under Rule 144A of the Securities Act of 1933. These
securities are restricted and may be resold in transactions exempt from registration normally
to qualified institutional buyers. 5 The rate is the annualized seven-day yield at period end.
6 Local currency.
See accompanying Notes to Financial Statements.
9

EuroPac International Bond Fund SUMMARY OF INVESTMENTS As of April 30, 2014 (Unaudited)
Security Type/Sector Percent of Total
Net Assets
Fixed Income Securities Government 41.2% Financial 17.3% Consumer, Non-cyclical 7.1% Communications 6.5% Energy 4.2% Utilities 2.4% Diversified 2.0% Consumer, Cyclical 1.8% Industrial 1.7% Basic Materials 1.4% __________
Total Fixed Income Securities 85.6%
Short-Term Investments 11.5% Preferred Stocks 1.0% __________ Total Investments 98.1% Other Assets in Excess of Liabilities 1.9% __________ Total Net Assets 100.0% __________ __________
See accompanying Notes to Financial Statements.
10

EuroPac Hard Asset Fund SCHEDULE OF INVESTMENTS As of April 30, 2014 (Unaudited)
Number of Shares Value __________ ____________
COMMON STOCKS – 97.3%
AUSTRALIA – 3.3%
79,150 Newcrest Mining Ltd.
* $ 769,146
____________ CANADA
– 36.2%
27,200 Agnico Eagle Mines Ltd.
804,032
46,740 Barrick Gold Corp.
816,548
23,000 Cameco Corp.
489,670
40,100 Encana Corp.
930,721
57,400 Endeavour Silver Corp.
* 262,318
21,400 Ensign Energy Services, Inc.
336,785
33,320 Freehold Royalties Ltd.
755,711
23,690 Goldcorp, Inc.
585,617
83,100 Kinross Gold Corp.
337,386
102,700 Major Drilling Group International, Inc.
807,658
24,240 Pan American Silver Corp.
314,150
11,700 Peyto Exploration & Development Corp.
431,345
10,000 Potash Corp. of Saskatchewan, Inc.
361,600
41,300 Precision Drilling Corp.
536,926
26,900 Silver Wheaton Corp.
597,180
26,910 Yamana Gold, Inc.
201,287
____________ 8,568,934
____________ CHILE
– 2.0%
14,800 Sociedad Quimica y Minera de Chile S.A. - ADR
472,120
____________
CHINA – 1.8%
480,000 China BlueChemical Ltd. - Class H
257,552
60,000 China Shenhua Energy Co., Ltd. - H Shares
162,518
____________ 420,070
____________
INDONESIA – 2.6%
3,000,000 Harum Energy Tbk P.T.
612,377
____________
NORWAY – 7.2%
28,950 Statoil ASA
878,586
17,400 Yara International ASA
821,365
____________ 1,699,951
____________ SINGAPORE
– 6.0%
368,000 First Resources Ltd.
754,375
1,375,000 Golden Agri-Resources Ltd.
669,020
____________ 1,423,395
____________ SWEDEN
– 2.9%
32,200 Lundin Petroleum A.B.
* 687,857
____________
11
EuroPac Hard Asset Fund SCHEDULE OF INVESTMENTS - Continued As of April 30, 2014 (Unaudited)
Number of Shares Value __________ ____________
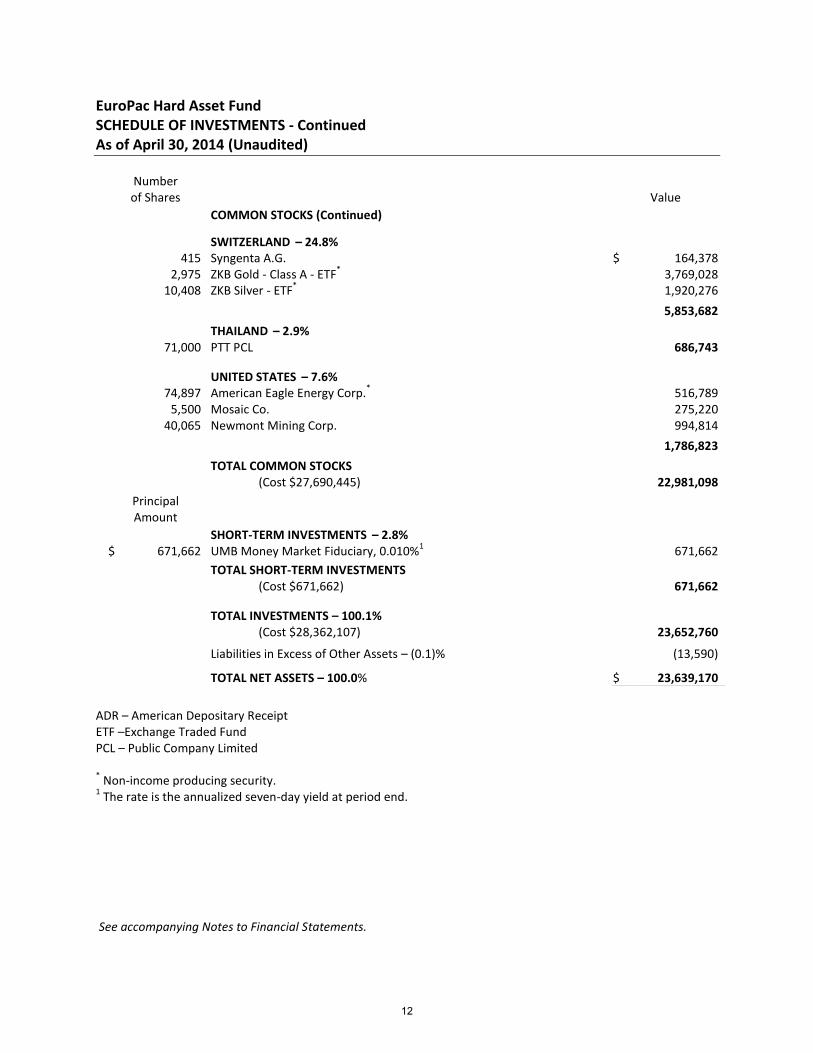
COMMON STOCKS (Continued)
SWITZERLAND – 24.8%
415 Syngenta A.G.
$ 164,378
2,975 ZKB Gold - Class A - ETF
* 3,769,028
10,408 ZKB Silver - ETF
* 1,920,276
____________ 5,853,682
____________ THAILAND
– 2.9%
71,000 PTT PCL
686,743
____________
UNITED STATES – 7.6%
74,897 American Eagle Energy Corp.
* 516,789
5,500 Mosaic Co.
275,220
40,065 Newmont Mining Corp.
994,814
____________ 1,786,823
____________
TOTAL COMMON STOCKS (Cost $27,690,445)
22,981,098
____________
Principal Amount __________
SHORT-TERM INVESTMENTS – 2.8%
$ 671,662 UMB Money Market Fiduciary, 0.010%
1 671,662
____________
TOTAL SHORT-TERM INVESTMENTS (Cost $671,662)
671,662
____________
TOTAL INVESTMENTS – 100.1% (Cost $28,362,107) 23,652,760
Liabilities in Excess of Other Assets – (0.1)%
(13,590) ____________
TOTAL NET ASSETS – 100.0% $ 23,639,170 ____________ ____________
ADR – American Depositary Receipt ETF –Exchange Traded Fund PCL – Public Company Limited * Non-income producing security.
1 The rate is the annualized seven-day yield at period end.
See accompanying Notes to Financial Statements.
12

EuroPac Hard Asset Fund SUMMARY OF INVESTMENTS As of April 30, 2014 (Unaudited)
Security Type/Sector Percent of Total
Net Assets
Common Stocks Basic Materials 39.5% Energy 27.7% Consumer, Non-cyclical 6.0% __________
Total Common Stocks 73.2%
Investment Companies / ETFs 24.1%
Short-Term Investments 2.8% __________ Total Investments 100.1% Liabilities in Excess of Other Assets (0.1)% __________ Total Net Assets 100.0% __________ __________
See accompanying Notes to Financial Statements.
13
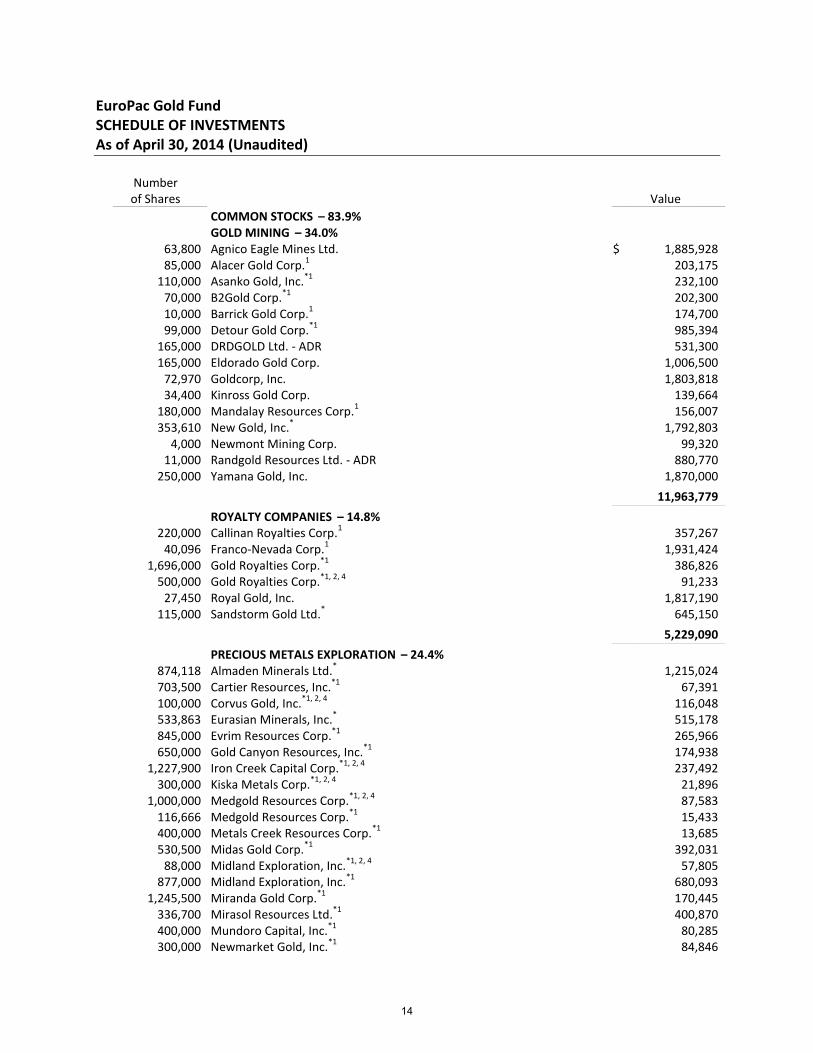
EuroPac Gold Fund SCHEDULE OF INVESTMENTS As of April 30, 2014 (Unaudited)
Number of Shares Value __________ ____________
COMMON STOCKS – 83.9%
GOLD MINING – 34.0%
63,800 Agnico Eagle Mines Ltd.
$ 1,885,928
85,000 Alacer Gold Corp.
1 203,175
110,000 Asanko Gold, Inc.
*1 232,100
70,000 B2Gold Corp.
*1 202,300
10,000 Barrick Gold Corp.
1 174,700
99,000 Detour Gold Corp.
*1 985,394
165,000 DRDGOLD Ltd. - ADR
531,300
165,000 Eldorado Gold Corp.
1,006,500
72,970 Goldcorp, Inc.
1,803,818
34,400 Kinross Gold Corp.
139,664
180,000 Mandalay Resources Corp.
1 156,007
353,610 New Gold, Inc.
* 1,792,803
4,000 Newmont Mining Corp.
99,320
11,000 Randgold Resources Ltd. - ADR
880,770
250,000 Yamana Gold, Inc.
1,870,000
____________ 11,963,779
____________ ROYALTY COMPANIES
– 14.8%
220,000 Callinan Royalties Corp.
1 357,267
40,096 Franco-Nevada Corp.
1 1,931,424
1,696,000 Gold Royalties Corp.
*1 386,826
500,000 Gold Royalties Corp.
*1, 2, 4 91,233
27,450 Royal Gold, Inc.
1,817,190
115,000 Sandstorm Gold Ltd.
* 645,150
____________ 5,229,090
____________ PRECIOUS METALS EXPLORATION
– 24.4%
874,118 Almaden Minerals Ltd.
* 1,215,024
703,500 Cartier Resources, Inc.
*1 67,391
100,000 Corvus Gold, Inc.
*1, 2, 4 116,048
533,863 Eurasian Minerals, Inc.
* 515,178
845,000 Evrim Resources Corp.
*1 265,966
650,000 Gold Canyon Resources, Inc.
*1 174,938
1,227,900 Iron Creek Capital Corp.
*1, 2, 4 237,492
300,000 Kiska Metals Corp.
*1, 2, 4 21,896
1,000,000 Medgold Resources Corp.
*1, 2, 4 87,583
116,666 Medgold Resources Corp.
*1 15,433
400,000 Metals Creek Resources Corp.
*1 13,685
530,500 Midas Gold Corp.
*1 392,031
88,000 Midland Exploration, Inc.
*1, 2, 4 57,805
877,000 Midland Exploration, Inc.
*1 680,093
1,245,500 Miranda Gold Corp.
*1 170,445
336,700 Mirasol Resources Ltd.
*1 400,870
400,000 Mundoro Capital, Inc.
*1 80,285
300,000 Newmarket Gold, Inc.
*1 84,846
14

EuroPac Gold Fund SCHEDULE OF INVESTMENTS - Continued As of April 30, 2014 (Unaudited)
Number of Shares Value __________ ____________
COMMON STOCKS (Continued) PRECIOUS METALS EXPLORATION (Continued) 200,000
Nulegacy Gold Corp.
* $ 26,457
200,000 Orezone Gold Corp.
* 109,479
30,000 Pretium Resources, Inc.
* 195,000
400,000 Radius Gold, Inc.
* 43,791
200,000 Renaissance Gold, Inc.
*1 80,285
473,500 Riverside Resources, Inc.
*1 194,394
130,000 Romarco Minerals, Inc.
* 104,370
195,000 Rubicon Minerals Corp.
* 212,550
903,000 Rye Patch Gold Corp.
*1 164,766
60,000 Solitario Exploration & Royalty Corp.
* 63,600
200,000 Sunridge Gold Corp.
*1 45,616
172,100 Virginia Mines, Inc.
*1 1,789,928
1,979,534 Vista Gold Corp.
* 969,972
____________ 8,597,217
____________ SILVER: EXPLORATION AND MINING
– 3.6%
78,266 Fortuna Silver Mines, Inc.
* 324,804
511,000 Golden Arrow Resources Corp.
* 109,557
41,500 Pan American Silver Corp.
537,840
13,000 Silver Wheaton Corp.
288,600
____________ 1,260,801
____________ DIVERSIFIED EXPLORATION AND MINING
– 7.1%
43,500 Altius Minerals Corp.
*1 571,481
2,550,000 Bitterroot Resources Ltd.
*1 93,057
13,000 Freeport-McMoRan Copper & Gold, Inc.
446,810
77,500 Ivanhoe Mines Ltd.
*1 127,976
175,000 Lara Exploration Ltd.
*1 130,919
108,910 Northern Dynasty Minerals Ltd.
* 83,861
159,900 Reservoir Minerals, Inc.
*1 921,967
50,000 Sprott Resource Corp.
1 115,409
____________ 2,491,480
____________
TOTAL COMMON STOCKS (Cost $30,848,371)
29,542,367
____________ INVESTMENT MANAGEMENT COMPANIES
– 13.3%
PRECIOUS METALS – 5.2%
150,000 Golden Prospect Precious Metals Ltd.
*1 94,336
52,000 Market Vectors Gold Miners ETF
1,253,720
13,000 Market Vectors Junior Gold Miners ETF
* 474,500
____________ 1,822,556
____________ BULLION
– 8.1%
53,000 Central Fund of Canada Ltd. - Class A
1 728,750
34,696 Central GoldTrust
* 1,576,586
15,000 Sprott Physical Platinum & Palladium Trust - ETF
* 145,350
15
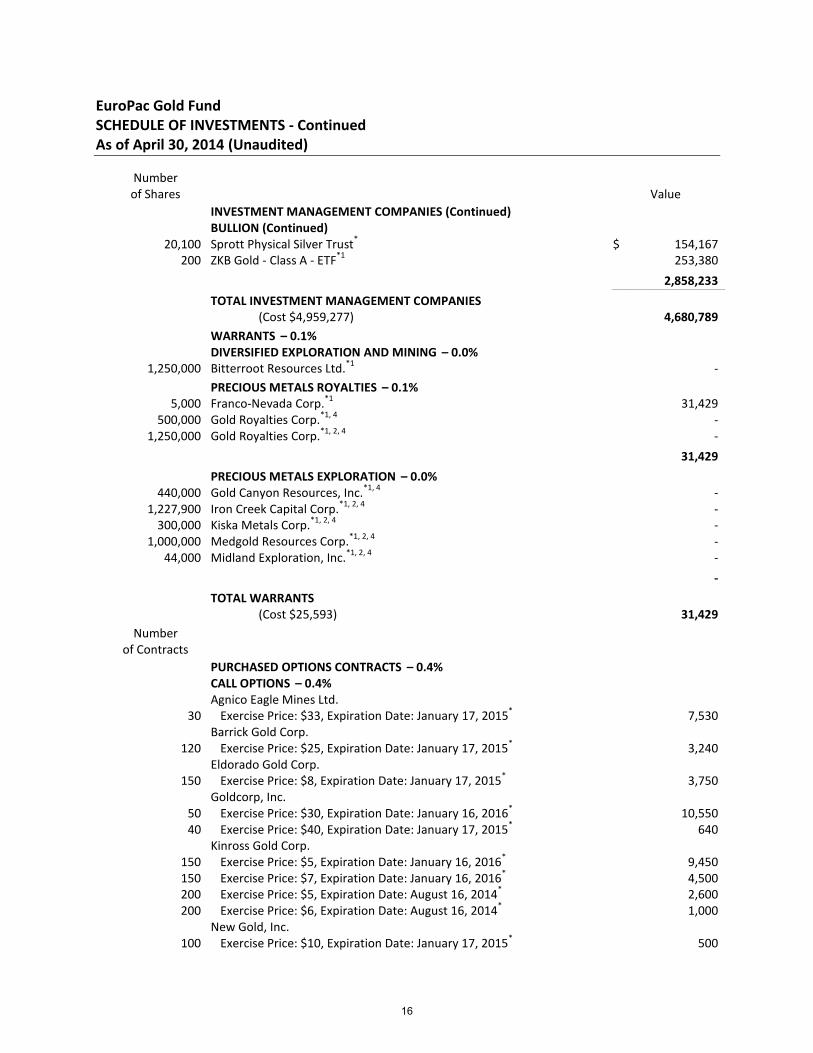
EuroPac Gold Fund SCHEDULE OF INVESTMENTS - Continued As of April 30, 2014 (Unaudited)
Number of Shares Value __________ ____________
INVESTMENT MANAGEMENT COMPANIES (Continued) BULLION (Continued) 20,100
Sprott Physical Silver Trust
* $ 154,167
200 ZKB Gold - Class A - ETF
*1 253,380
____________ 2,858,233
____________
TOTAL INVESTMENT MANAGEMENT COMPANIES (Cost $4,959,277)
4,680,789
____________ WARRANTS
– 0.1%
DIVERSIFIED EXPLORATION AND MINING – 0.0%
1,250,000 Bitterroot Resources Ltd.
*1 -
____________ PRECIOUS METALS ROYALTIES
– 0.1%
5,000 Franco-Nevada Corp.
*1 31,429
500,000 Gold Royalties Corp.
*1, 4 -
1,250,000 Gold Royalties Corp.
*1, 2, 4 -
____________ 31,429
____________ PRECIOUS METALS EXPLORATION
– 0.0%
440,000 Gold Canyon Resources, Inc.
*1, 4 -
1,227,900 Iron Creek Capital Corp.
*1, 2, 4 -
300,000 Kiska Metals Corp.
*1, 2, 4 -
1,000,000 Medgold Resources Corp.
*1, 2, 4 -
44,000 Midland Exploration, Inc.
*1, 2, 4 -
____________ -
____________
TOTAL WARRANTS (Cost $25,593)
31,429
____________
Number
of Contracts __________ PURCHASED OPTIONS CONTRACTS
– 0.4%
CALL OPTIONS – 0.4%
Agnico Eagle Mines Ltd. 30
Exercise Price: $33, Expiration Date: January 17, 2015
* 7,530
Barrick Gold Corp. 120
Exercise Price: $25, Expiration Date: January 17, 2015
* 3,240
Eldorado Gold Corp. 150
Exercise Price: $8, Expiration Date: January 17, 2015
* 3,750
Goldcorp, Inc.
50
Exercise Price: $30, Expiration Date: January 16, 2016
* 10,550
40 Exercise Price: $40, Expiration Date: January 17, 2015
* 640
Kinross Gold Corp.
150
Exercise Price: $5, Expiration Date: January 16, 2016
* 9,450
150 Exercise Price: $7, Expiration Date: January 16, 2016
* 4,500
200 Exercise Price: $5, Expiration Date: August 16, 2014
* 2,600
200 Exercise Price: $6, Expiration Date: August 16, 2014
* 1,000
New Gold, Inc. 100
Exercise Price: $10, Expiration Date: January 17, 2015
* 500
16

EuroPac Gold Fund SCHEDULE OF INVESTMENTS - Continued As of April 30, 2014 (Unaudited)
Number
of Contracts Value __________ ____________ PURCHASED OPTIONS CONTRACTS (Continued) CALL OPTIONS (Continued) Newmont Mining Corp. 80
Exercise Price: $38, Expiration Date: January 17, 2015
* $ 1,200
Pan American Silver Corp.
100
Exercise Price: $13, Expiration Date: January 17, 2015
* 14,500
100 Exercise Price: $12, Expiration Date: January 16, 2016
* 28,000
150 Exercise Price: $15, Expiration Date: January 16, 2016
* 26,250
50 Exercise Price: $17, Expiration Date: January 17, 2015
* 2,000
Royal Gold, Inc.
15
Exercise Price: $75, Expiration Date: January 16, 2016
* 11,700
20 Exercise Price: $73, Expiration Date: January 17, 2015
* 9,800
Yamana Gold, Inc.
70
Exercise Price: $12, Expiration Date: January 16, 2016
*1 3,360
100 Exercise Price: $15, Expiration Date: January 16, 2016
*1 2,700
____________ 143,270
____________
TOTAL PURCHASED OPTIONS CONTRACTS (Cost $275,995)
143,270
____________
Principal Amount __________
SHORT-TERM INVESTMENTS – 3.5%
$ 914
RBC Reserve Prime Money Market Fund
914
1,216,146 UMB Money Market Fiduciary, 0.010%
3 1,216,146
____________
TOTAL SHORT-TERM INVESTMENTS (Cost $1,217,060)
1,217,060
____________
TOTAL INVESTMENTS – 101.2% (Cost $37,326,296) 35,614,915
Liabilities in Excess of Other Assets – (1.2)%
(401,449) ____________
TOTAL NET ASSETS – 100.0% $ 35,213,466 ____________ ____________
Number
of Contracts __________ WRITTEN OPTIONS CONTRACTS
– (0.1)%
CALL OPTIONS – 0.0%
Barrick Gold Corp. (50)
Exercise Price: $20, Expiration Date: June 21, 2014
* (700)
Kinross Gold Corp. (150)
Exercise Price: $6, Expiration Date: May 17, 2014
* (150)
Newmont Mining Corp. (40)
Exercise Price: $27, Expiration Date: May 17, 2014
* (280)
17

EuroPac Gold Fund SCHEDULE OF INVESTMENTS - Continued As of April 30, 2014 (Unaudited)
Number
of Contracts Value __________ ____________ WRITTEN OPTIONS CONTRACTS (Continued) CALL OPTIONS (Continued) Randgold Resources Ltd. (50)
Exercise Price: $90, Expiration Date: June 21, 2014
* $ (3,250)
____________ (4,380)
____________ PUT OPTIONS
– (0.1)%
Royal Gold, Inc. (10)
Exercise Price: $63, Expiration Date: May 17, 2014
* (500)
Yamana Gold, Inc. (100)
Exercise Price: $9, Expiration Date: July 19, 2014
* (16,100)
____________ (16,600)
____________
TOTAL WRITTEN OPTIONS CONTRACTS (Proceeds $17,384)
$ (20,980)
____________ ____________ ADR – American Depositary Receipt ETF – Exchange Traded Fund * Non-income producing security.
1 Foreign security denominated in U.S. dollars.
2 Illiquid Security. Security exempt from registration under Rule 144A of the Securities Act of 1933, as amended, or
otherwise restricted. These securities may be resold in transactions exempt from registration, normally to qualified institutional buyers. Security fair valued under direction of the Board of Trustees. The aggregate value of such investments is 1.74% of net assets. 3 The rate is the annualized seven-day yield at period end.
4 Fair value under procedures established by the Board of Trustees, represents 1.74% of Net Assets.
See accompanying Notes to Financial Statements.
18

EuroPac Gold Fund SUMMARY OF INVESTMENTS As of April 30, 2014 (Unaudited)
Security Type/Sector Percent of Total
Net Assets
Common Stocks Gold Mining 34.0% Precious Metals Exploration 24.4% Royalty Companies 14.8% Diversified Exploration and Mining 7.1% Silver: Exploration and Mining 3.6%
Total Common Stocks 83.9%
Investment Management Companies
Bullion 8.1%
Precious Metals 5.2%
Total Investment Management Companies 13.3%
Short-Term Investments 3.5%
Purchased Options Contracts 0.4%
Warrants 0.1% __________ Total Investments 101.2% Liabilities in Excess of Other Assets (1.2)% __________ Total Net Assets 100.0% __________ __________
See accompanying Notes to Financial Statements.
19

EuroPac International Dividend Income Fund SCHEDULE OF INVESTMENTS As of April 30, 2014 (Unaudited)
Number of Shares Value __________ ____________
COMMON STOCKS – 87.3%
AUSTRALIA – 7.4%
664,000 CFS Retail Property Trust - REIT
$ 1,239,911
71,000 Telstra Corp. Ltd.
344,314
30,800 Woolworths Ltd.
1,067,871
____________ 2,652,096
____________ BRAZIL
– 6.0%
144,000 Grendene S.A.
910,575
59,000 Telefonica Brasil S.A. - ADR
1,250,800
____________ 2,161,375
____________ CANADA
– 3.5%
55,200 Freehold Royalties Ltd.
1,251,959
____________ CHILE
– 1.4%
800,000 Aguas Andinas S.A. - A Shares
495,251
____________ FINLAND
– 3.8%
60,000 Fortum OYJ
1,354,329
____________ FRANCE
– 2.7%
13,800 Total S.A. - ADR
983,112
____________ GERMANY
– 1.1%
11,700 Freenet A.G.
404,419
____________ HONG KONG
– 3.4%
130,500 China Mobile Ltd.
1,240,533
____________ JAPAN
– 3.8%
233,000 Aozora Bank Ltd.
692,835
60,000 ITOCHU Corp.
671,394
____________ 1,364,229
____________ MALAYSIA
– 4.2%
494,000 Malayan Banking Bhd
1,497,657
____________ NETHERLANDS
– 3.3%
15,000 Royal Dutch Shell PLC – Spon. ADR
1,181,100
____________ NEW ZEALAND
– 7.3%
949,000 Kiwi Income Property Trust - REIT
941,062
195,000 Mighty River Power Ltd.
390,942
542,000 Telecom Corp. of New Zealand Ltd.
1,294,593
____________ 2,626,597
____________ NORWAY
– 13.3%
125,815 Atea ASA
1,444,556
34,200 Fred Olsen Energy ASA
1,087,970
20,592 Leroey Seafood Group ASA
727,473
40,100 Statoil ASA - ADR
1,221,847
12,450 Telenor ASA
292,175
____________ 4,774,021
____________
20

EuroPac International Dividend Income Fund SCHEDULE OF INVESTMENTS - Continued As of April 30, 2014 (Unaudited)
Number of Shares Value __________ ____________
COMMON STOCKS (Continued) SINGAPORE
– 8.5%
1,109,000 Ascendas India Trust
$ 676,705
427,000 Singapore Telecommunications Ltd.
1,304,467
1,671,961 Starhill Global REIT
1,080,233
____________ 3,061,405
____________ SWEDEN
– 5.6%
32,400 Betsson A.B.
1,178,463
69,200 Telefonaktiebolaget LM Ericsson – Spon. ADR
829,708
____________ 2,008,171
____________ SWITZERLAND
– 4.6%
1,650 Nestle S.A. - ADR
127,347
900 Swisscom A.G.
547,097
3,460 Valora Holding A.G.
976,946
____________ 1,651,390
____________ TURKEY
– 2.8%
69,000 Turkcell Iletisim Hizmetleri AS – Spon. ADR
* 999,120
____________ UNITED KINGDOM
– 4.6%
338,000 Tesco PLC
1,671,739
____________
TOTAL COMMON STOCKS (Cost $29,477,669)
31,378,503
____________
Principal Amount __________
SHORT-TERM INVESTMENTS – 12.8%
$ 4,597,335 UMB Money Market Fiduciary, 0.010%
1 4,597,335
____________
TOTAL SHORT-TERM INVESTMENTS (Cost $4,597,335)
4,597,335
____________
TOTAL INVESTMENTS – 100.1% (Cost $34,075,004) 35,975,838
Liabilities in Excess of Other Assets – (0.1)%
(37,626) ____________
TOTAL NET ASSETS – 100.0% $ 35,938,212 ____________ ____________
ADR – American Depositary Receipt PLC – Public Limited Company REIT – Real Estate Investment Trust * Non-income producing security.
1 The rate is the annualized seven-day yield at period end.
See accompanying Notes to Financial Statements.
21
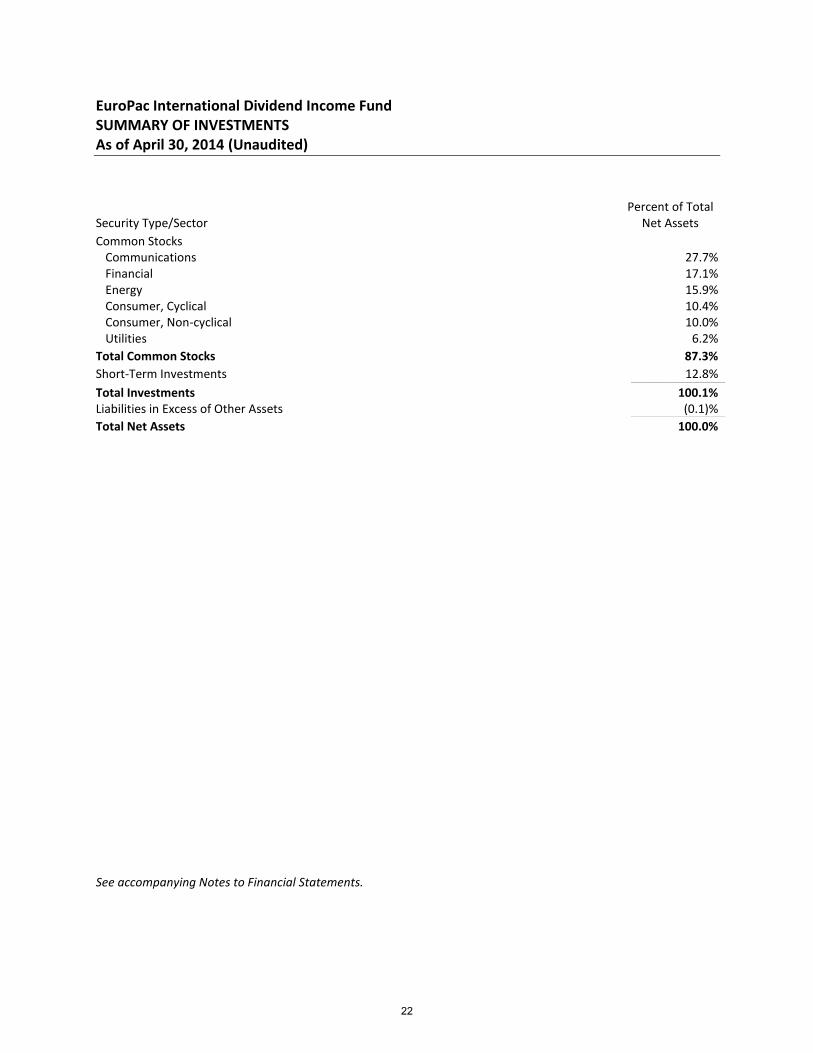
EuroPac International Dividend Income Fund SUMMARY OF INVESTMENTS As of April 30, 2014 (Unaudited)
Security Type/Sector Percent of Total
Net Assets
Common Stocks Communications 27.7% Financial 17.1% Energy 15.9% Consumer, Cyclical 10.4% Consumer, Non-cyclical 10.0% Utilities 6.2% __________
Total Common Stocks 87.3%
Short-Term Investments 12.8% __________ Total Investments 100.1% Liabilities in Excess of Other Assets (0.1)% __________ Total Net Assets 100.0% __________ __________
See accompanying Notes to Financial Statements.
22

EP China Fund SCHEDULE OF INVESTMENTS As of April 30, 2014 (Unaudited)
Number of Shares Value __________ ____________
COMMON STOCKS – 99.5%
BASIC MATERIALS – 0.3%
2,700,000 China Forestry Holdings Co., Ltd.
*1 $ 111,441
____________ COMMUNICATIONS
– 3.1%
1,000,000 Pacific Online Ltd.
542,667
13,000 SINA Corp.
* 621,400
____________ 1,164,067
____________ CONSUMER, CYCLICAL
– 20.0%
350,000 Great Wall Motor Co., Ltd. - Class H
1,592,236
240,000 Haier Electronics Group Co., Ltd.
590,364
600,000 Minth Group Ltd.
945,474
900,000 Nexteer Automotive Group Ltd.
* 592,052
550,000 Sa Sa International Holdings Ltd.
462,126
200,000 Sands China Ltd.
1,468,343
180,000 Shenzhou International Group Holdings Ltd.
621,022
800,000 Skyworth Digital Holdings Ltd.
383,779
1,000,000 Xinyi Glass Holdings Ltd.
790,313
____________ 7,445,709
____________ CONSUMER, NON-CYCLICAL
– 23.7%
500,000 China Medical System Holdings Ltd.
592,455
889,000 Goodbaby International Holdings Ltd.
487,970
100,000 Hengan International Group Co., Ltd.
1,054,198
1,170,000 Lee's Pharmaceutical Holdings Ltd.
1,314,631
80,000 Nan Liu Enterprise Co., Ltd.
450,558
210,000 Samsonite International S.A.
667,249
1,256,000 Sihuan Pharmaceutical Holdings Group Ltd.
1,388,258
1,700,001 Sino Biopharmaceutical
1,334,105
45,000 WuXi PharmaTech Cayman, Inc. - ADR
* 1,530,000
____________ 8,819,424
____________ DIVERSIFIED
– 3.8%
104,000 Hutchison Whampoa Ltd.
1,426,819
____________ ENERGY
– 7.8%
1,300,000 Anton Oilfield Services Group
863,302
750,000 CIMC Enric Holdings Ltd.
1,088,017
800,000 Hilong Holding Ltd.
417,996
1,000,000 SPT Energy Group, Inc.
544,202
____________ 2,913,517
____________ FINANCIAL
– 9.2%
325,000 AIA Group Ltd.
1,580,658
400,000 CITIC Securities Co., Ltd. - Class H
803,900
140,000 Ping An Insurance Group Co. of China Ltd. - Class H
1,039,090
____________ 3,423,648
____________
23

EP China Fund SCHEDULE OF INVESTMENTS - Continued As of April 30, 2014 (Unaudited)
Number of Shares Value __________ ____________
COMMON STOCKS (Continued) INDUSTRIAL
– 17.1%
170,000 AAC Technologies Holdings, Inc.
$ 951,880
521,000 Haitian International Holdings Ltd.
1,049,607
40,000 Hermes Microvision, Inc.
1,661,440
1,400,000 Sinotrans Ltd. - Class H
774,505
600,000 Techtronic Industries Co.
1,917,059
____________ 6,354,491
____________ TECHNOLOGY
– 7.5%
730,000 Lenovo Group Ltd.
831,868
66,000 MediaTek, Inc.
1,034,220
230,000 Taiwan Semiconductor Manufacturing Co., Ltd.
903,752
____________ 2,769,840
____________ UTILITIES
– 7.0%
160,000 ENN Energy Holdings Ltd.
1,119,082
1,350,000 Guangdong Investment Ltd.
1,467,709
____________ 2,586,791
____________
TOTAL COMMON STOCKS (Cost $27,100,739)
37,015,747
____________
Principal Amount __________
SHORT-TERM INVESTMENTS – 0.8%
$ 309,645 UMB Money Market Fiduciary, 0.010%
2 309,645
____________
TOTAL SHORT-TERM INVESTMENTS (Cost $309,645)
309,645
____________
TOTAL INVESTMENTS – 100.3% (Cost $27,410,384) 37,325,392
Liabilities in Excess of Other Assets – (0.3)%
(96,959) ____________
TOTAL NET ASSETS – 100.0% $ 37,228,433 ____________ ____________
ADR – American Depositary Receipt * Non-income producing security.
1 Fair value under procedures established by the Board of Trustees, represents 0.30% of Net
Assets.
2 The rate is the annualized seven-day yield at period end.
See accompanying Notes to Financial Statements.
24

EP China Fund SUMMARY OF INVESTMENTS As of April 30, 2014 (Unaudited)
Security Type/Country Percent of Total
Net Assets
Common Stocks China 48.0% Hong Kong 33.2% Taiwan 10.9% Macau 4.0% United States 3.4% __________
Total Common Stocks 99.5%
Short-Term Investments 0.8% __________ Total Investments 100.3% Liabilities in Excess of Other Assets (0.3)% __________ Total Net Assets 100.0% __________ __________
See accompanying Notes to Financial Statements.
25

EP Asia Small Companies Fund SCHEDULE OF INVESTMENTS As of April 30, 2014 (Unaudited)
Number of Shares Value __________ ____________
COMMON STOCKS – 99.3%
AUSTRALIA – 1.5%
500,000 Donaco International Ltd.
* $ 555,741
____________ CAMBODIA
– 2.5%
1,000,000 NagaCorp Ltd.
911,196
____________ CHINA
– 8.4%
500,000 Boer Power Holdings Ltd.
657,604
320,000 Haitian International Holdings Ltd.
644,672
1,000,000 Pacific Online Ltd.
542,667
150,000 Shenzhou International Group Holdings Ltd.
517,518
20,000 WuXi PharmaTech Cayman, Inc. - ADR
* 680,000
____________ 3,042,461
____________ HONG KONG
– 7.0%
500,000 CIMC Enric Holdings Ltd.
725,345
1,300,000 Paradise Entertainment Ltd.
* 970,280
260,000 Techtronic Industries Co.
830,725
____________ 2,526,350
____________ INDIA
– 4.5%
90,000 Aurobindo Pharma Ltd.
856,663
56,329 Ipca Laboratories Ltd.
781,694
____________ 1,638,357
____________ INDONESIA
– 18.2%
6,342,500 Ace Hardware Indonesia Tbk P.T.
409,079
6,500,000 Bank Tabungan Negara Persero Tbk P.T.
650,339
6,000,000 Bumi Serpong Damai P.T.
812,828
10,000,000 Ciputra Development Tbk P.T.
880,358
9,000,000 Industri Jamu Dan Farmasi Sido Muncul Tbk P.T.
* 634,107
750,000 Siloam International Hospitals Tbk P.T.
* 713,575
6,000,000 Tiga Pilar Sejahtera Food Tbk
1,144,760
900,000 Ultrajaya Milk Industry & Trading Co. Tbk P.T.
* 332,239
5,000,000 Wijaya Karya Persero Tbk P.T.
983,056
____________ 6,560,341
____________ MALAYSIA
– 2.9%
16,700 KPJ Healthcare BHD
16,572
782,919 Sapurakencana Petroleum BHD
* 1,034,973
____________ 1,051,545
____________ PHILIPPINES
– 16.7%
1,500,000 Alliance Global Group, Inc.
1,050,542
800,000 East West Banking Corp.
* 548,153
50,000 GT Capital Holdings, Inc.
974,591
1,300,000 Puregold Price Club, Inc.
1,341,406
5,250,000 RFM Corp.
766,208
370,000 Robinsons Retail Holdings, Inc.
* 556,853
26

EP Asia Small Companies Fund SCHEDULE OF INVESTMENTS - Continued As of April 30, 2014 (Unaudited)
Number of Shares Value __________ ____________
COMMON STOCKS (Continued) PHILIPPINES (Continued) 240,000
Universal Robina Corp.
$ 788,103
____________ 6,025,856
____________ SOUTH KOREA
– 15.1%
2,000 CJ O Shopping Co., Ltd.
707,027
11,480 Hanssem Co., Ltd.
939,256
8,000 Hotel Shilla Co., Ltd.
673,691
15,000 i-SENS, Inc.
* 754,291
29,960 Kolao Holdings
746,238
3,300 Medy-Tox, Inc.
488,890
14,000 Suheung Capsule Co., Ltd.
519,352
24,000 Vieworks Co., Ltd.
607,582
____________ 5,436,327
____________ TAIWAN
– 7.2%
50,000 ASPEED Technology, Inc.
433,804
34,000 Hermes Microvision, Inc.
1,412,224
90,000 PharmaEngine, Inc.
* 754,446
____________ 2,600,474
____________ THAILAND
– 12.4%
3,800,000 Jasmine International PCL
977,819
1,400,000 MC Group PCL
753,841
250,000 MK Restaurants Group PCL
* 438,694
700,000 Nok Airlines PCL
389,705
1,600,000 Sino Thai Engineering & Construction PCL
922,690
800,000 Thaicom PCL
1,003,112
____________ 4,485,861
____________ UNITED STATES
– 2.9%
1,600,000 Nexteer Automotive Group Ltd.
* 1,052,537
____________
TOTAL COMMON STOCKS (Cost $26,566,976)
35,887,046
____________ WARRANTS
– 0.0%
MALAYSIA – 0.0%
33,332 KPJ Healthcare BHD
* 6,941
____________
TOTAL WARRANTS (Cost $0)
6,941
____________
Principal Amount __________
SHORT-TERM INVESTMENTS – 0.6%
$ 203,910 UMB Money Market Fiduciary, 0.010%
1 203,910
____________
TOTAL SHORT-TERM INVESTMENTS (Cost $203,910)
203,910
____________
27

EP Asia Small Companies Fund SCHEDULE OF INVESTMENTS - Continued As of April 30, 2014 (Unaudited)
TOTAL INVESTMENTS – 99.9% (Cost $26,770,886) $ 36,097,897
Other Assets in Excess of Liabilities – 0.1%
27,228 ____________
TOTAL NET ASSETS – 100.0% $ 36,125,125 ____________ ____________
ADR – American Depositary Receipt PCL – Public Company Limited * Non-income producing security.
1 The rate is the annualized seven-day yield at period end.
See accompanying Notes to Financial Statements.
28

EP Asia Small Companies Fund SUMMARY OF INVESTMENTS As of April 30, 2014 (Unaudited)
Security Type/Sector Percent of Total
Net Assets
Common Stocks Consumer, Cyclical 28.8% Consumer, Non-cyclical 28.7% Industrial 15.1% Financial 10.7% Communications 7.0% Energy 4.9% Diversified 2.9% Technology 1.2% __________
Total Common Stocks 99.3% 1.2% __________ Warrants 0.0%
Short-Term Investments 0.6% __________ Total Investments 99.9% Other Assets in Excess of Liabilities 0.1% __________ Total Net Assets 100.0% __________ __________
See accompanying Notes to Financial Statements.
29
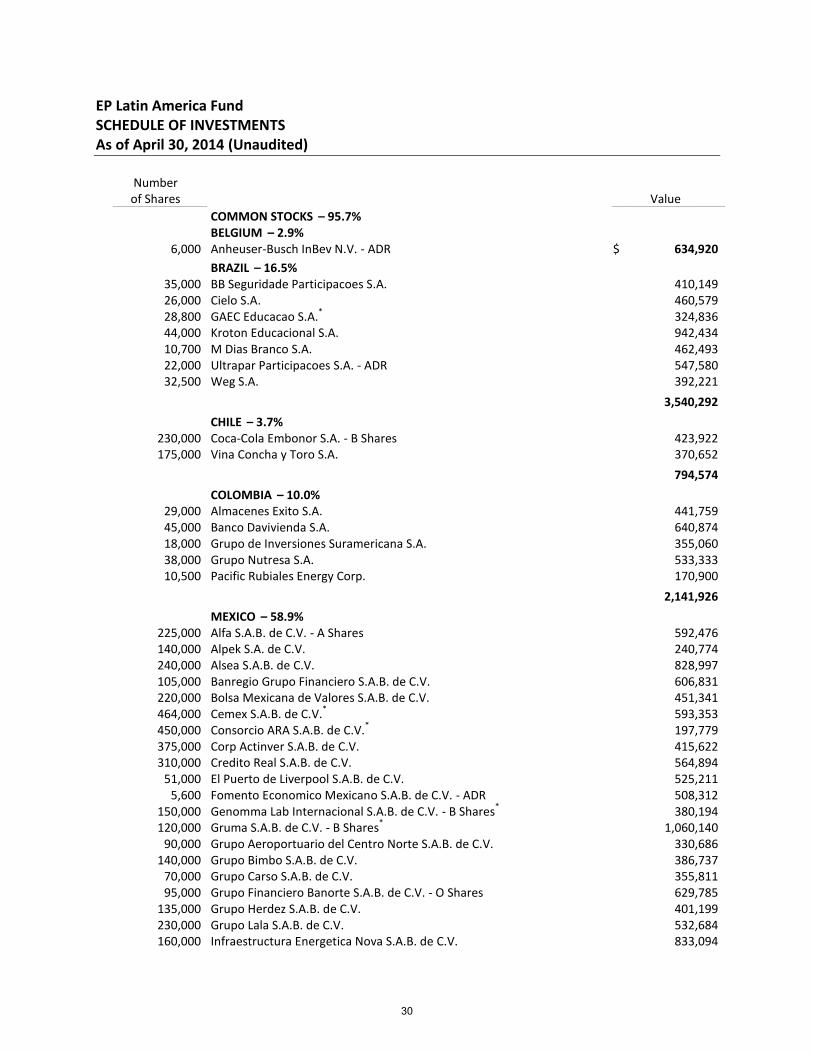
EP Latin America Fund SCHEDULE OF INVESTMENTS As of April 30, 2014 (Unaudited)
Number of Shares Value __________ ____________
COMMON STOCKS – 95.7%
BELGIUM – 2.9%
6,000 Anheuser-Busch InBev N.V. - ADR
$ 634,920
____________ BRAZIL
– 16.5%
35,000 BB Seguridade Participacoes S.A.
410,149
26,000 Cielo S.A.
460,579
28,800 GAEC Educacao S.A.
* 324,836
44,000 Kroton Educacional S.A.
942,434
10,700 M Dias Branco S.A.
462,493
22,000 Ultrapar Participacoes S.A. - ADR
547,580
32,500 Weg S.A.
392,221
____________ 3,540,292
____________ CHILE
– 3.7%
230,000 Coca-Cola Embonor S.A. - B Shares
423,922
175,000 Vina Concha y Toro S.A.
370,652
____________ 794,574
____________ COLOMBIA
– 10.0%
29,000 Almacenes Exito S.A.
441,759
45,000 Banco Davivienda S.A.
640,874
18,000 Grupo de Inversiones Suramericana S.A.
355,060
38,000 Grupo Nutresa S.A.
533,333
10,500 Pacific Rubiales Energy Corp.
170,900
____________ 2,141,926
____________ MEXICO
– 58.9%
225,000 Alfa S.A.B. de C.V. - A Shares
592,476
140,000 Alpek S.A. de C.V.
240,774
240,000 Alsea S.A.B. de C.V.
828,997
105,000 Banregio Grupo Financiero S.A.B. de C.V.
606,831
220,000 Bolsa Mexicana de Valores S.A.B. de C.V.
451,341
464,000 Cemex S.A.B. de C.V.
* 593,353
450,000 Consorcio ARA S.A.B. de C.V.
* 197,779
375,000 Corp Actinver S.A.B. de C.V.
415,622
310,000 Credito Real S.A.B. de C.V.
564,894
51,000 El Puerto de Liverpool S.A.B. de C.V.
525,211
5,600 Fomento Economico Mexicano S.A.B. de C.V. - ADR
508,312
150,000 Genomma Lab Internacional S.A.B. de C.V. - B Shares
* 380,194
120,000 Gruma S.A.B. de C.V. - B Shares
* 1,060,140
90,000 Grupo Aeroportuario del Centro Norte S.A.B. de C.V.
330,686
140,000 Grupo Bimbo S.A.B. de C.V.
386,737
70,000 Grupo Carso S.A.B. de C.V.
355,811
95,000 Grupo Financiero Banorte S.A.B. de C.V. - O Shares
629,785
135,000 Grupo Herdez S.A.B. de C.V.
401,199
230,000 Grupo Lala S.A.B. de C.V.
532,684
160,000 Infraestructura Energetica Nova S.A.B. de C.V.
833,094
30

EP Latin America Fund SCHEDULE OF INVESTMENTS - Continued As of April 30, 2014 (Unaudited)
Number of Shares Value __________ ____________
COMMON STOCKS (Continued) MEXICO (Continued) 115,986
Kimberly-Clark de Mexico S.A.B. de C.V. – A Shares
$ 301,517
175,000 Organizacion Cultiba S.A.B. de C.V.
288,260
48,000 Promotora y Operadora de Infraestructura S.A.B. de C.V.
* 670,902
140,000 Qualitas Controladora S.A.B. de C.V.
400,113
230,000 Wal-Mart de Mexico S.A.B. de C.V.
581,557
____________ 12,678,269
____________ PANAMA
– 2.5%
4,000 Copa Holdings S.A. - A Shares
541,120
____________ UNITED STATES
– 1.2%
15,000 American Axle & Manufacturing Holdings, Inc.
* 264,750
____________
TOTAL COMMON STOCKS (Cost $18,100,623)
20,595,851
____________
Principal Amount __________
SHORT-TERM INVESTMENTS – 4.9%
$ 1,046,792 UMB Money Market Fiduciary, 0.010%
1 1,046,792
____________
TOTAL SHORT-TERM INVESTMENTS (Cost $1,046,792)
1,046,792
____________
TOTAL INVESTMENTS – 100.6% (Cost $19,147,415) 21,642,643
Liabilities in Excess of Other Assets – (0.6)%
(134,929) ____________
TOTAL NET ASSETS – 100.0% $ 21,507,714 ____________ ____________
ADR – American Depositary Receipt * Non-income producing security.
1 The rate is the annualized seven-day yield at period end.
See accompanying Notes to Financial Statements.
31
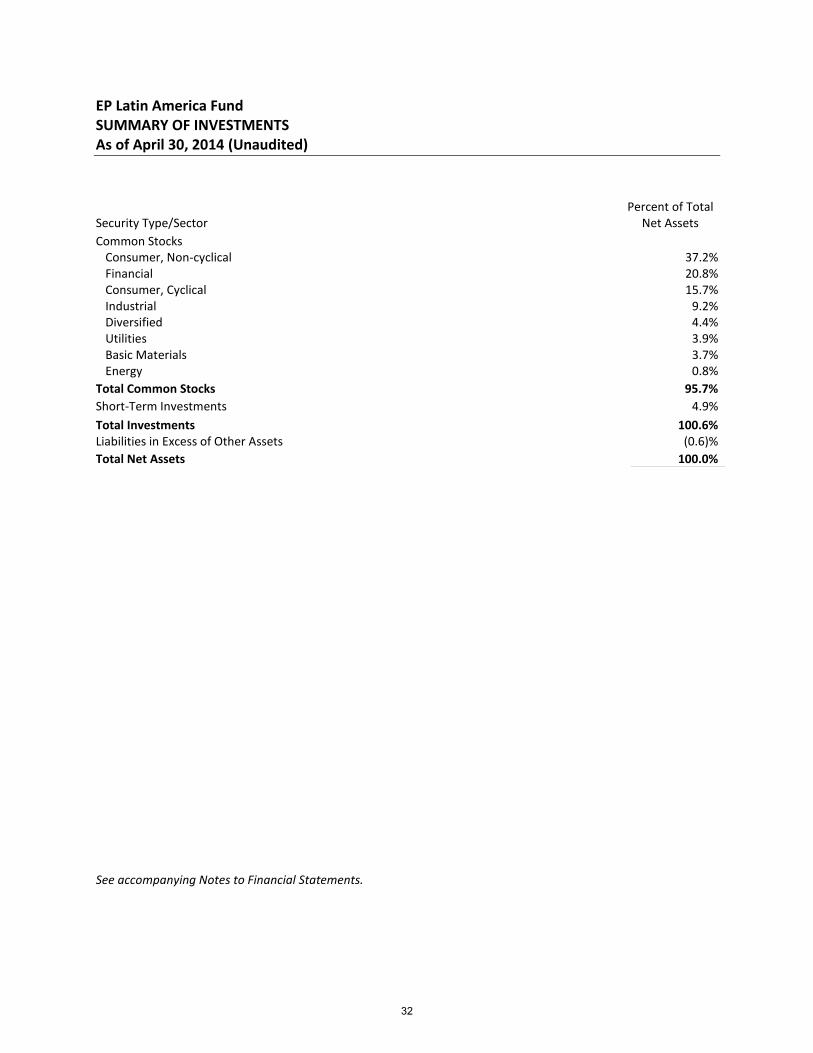
EP Latin America Fund SUMMARY OF INVESTMENTS As of April 30, 2014 (Unaudited)
Security Type/Sector Percent of Total
Net Assets
Common Stocks Consumer, Non-cyclical 37.2% Financial 20.8% Consumer, Cyclical 15.7% Industrial 9.2% Diversified 4.4% Utilities 3.9% Basic Materials 3.7% Energy 0.8% __________
Total Common Stocks 95.7%
Short-Term Investments 4.9% __________ Total Investments 100.6% Liabilities in Excess of Other Assets (0.6)% __________ Total Net Assets 100.0% __________ __________
See accompanying Notes to Financial Statements.
32

EP Strategic US Equity Fund SCHEDULE OF INVESTMENTS As of April 30, 2014 (Unaudited)
Number of Shares Value __________ ____________
COMMON STOCKS – 90.6%
BASIC MATERIALS – 16.5%
53,000 Allied Nevada Gold Corp.
* $ 179,670
14,700 Barrick Gold Corp.
256,809
14,500 Cameco Corp.
308,705
8,050 Goldcorp, Inc.
198,996
100,500 IAMGOLD Corp.
350,745
68,400 Kinross Gold Corp.
277,704
675 Newcrest Mining Ltd.
* 6,559
21,000 Newmont Mining Corp.
521,430
30,000 Yamana Gold, Inc.
224,400
____________ 2,325,018
____________ COMMUNICATIONS
– 15.1%
47,500 Boingo Wireless, Inc.
* 313,500
6,000 CenturyLink, Inc.
209,460
4,446 F5 Networks, Inc.
* 467,586
20,699 Juniper Networks, Inc.
* 511,058
8,000 Telephone & Data Systems, Inc.
217,520
8,500 Verizon Communications, Inc.
397,205
____________ 2,116,329
____________ CONSUMER, CYCLICAL
– 7.7%
57,500 TiVo, Inc.
* 681,950
5,150 Yum! Brands, Inc.
396,499
____________ 1,078,449
____________ CONSUMER, NON-CYCLICAL
– 15.6%
6,846 Coca-Cola Co.
279,248
2,715 Johnson & Johnson
275,002
3,600 Medtronic, Inc.
211,752
5,000 Merck & Co., Inc.
292,800
4,000 Molson Coors Brewing Co. - Class B
239,880
12,200 Pfizer, Inc.
381,616
2,530 Procter & Gamble Co.
208,852
4,000 Stryker Corp.
311,000
____________ 2,200,150
____________ ENERGY
– 7.9%
37,590 American Eagle Energy Corp.
* 259,371
6,500 Encana Corp.
150,865
4,360 Exxon Mobil Corp.
446,508
2,450 Schlumberger Ltd.
248,797
____________ 1,105,541
____________ TECHNOLOGY
– 16.7%
1,060 Apple, Inc.
625,496
17,000 Broadcom Corp. - Class A
523,770
33

EP Strategic US Equity Fund SCHEDULE OF INVESTMENTS - Continued As of April 30, 2014 (Unaudited)
Number of Shares Value __________ ____________
COMMON STOCKS (Continued) TECHNOLOGY (Continued) 14,500
EMC Corp.
$ 374,100
17,000 Microsoft Corp.
686,800
4,000 NetApp, Inc.
142,440
____________ 2,352,606
____________ UTILITIES
– 11.1%
3,500 American Electric Power Co., Inc.
188,335
3,250 Duke Energy Corp.
242,093
6,000 Edison International
339,360
6,800 PG&E Corp.
309,944
10,000 Portland General Electric Co.
334,700
3,300 Southern Co.
151,239
____________ 1,565,671
____________
TOTAL COMMON STOCKS (Cost $12,193,448)
12,743,764
____________
Principal Amount __________
SHORT-TERM INVESTMENTS – 8.0%
$ 1,122,556 UMB Money Market Fiduciary, 0.010%
1 1,122,556
____________
TOTAL SHORT-TERM INVESTMENTS (Cost $1,122,556)
1,122,556
____________
TOTAL INVESTMENTS – 98.6% (Cost $13,316,004) 13,866,320
Other Assets in Excess of Liabilities – 1.4%
200,384 ____________
TOTAL NET ASSETS – 100.0% $ 14,066,704 ____________ ____________
* Non-income producing security.
1 The rate is the annualized seven-day yield at period end.
See accompanying Notes to Financial Statements.
34
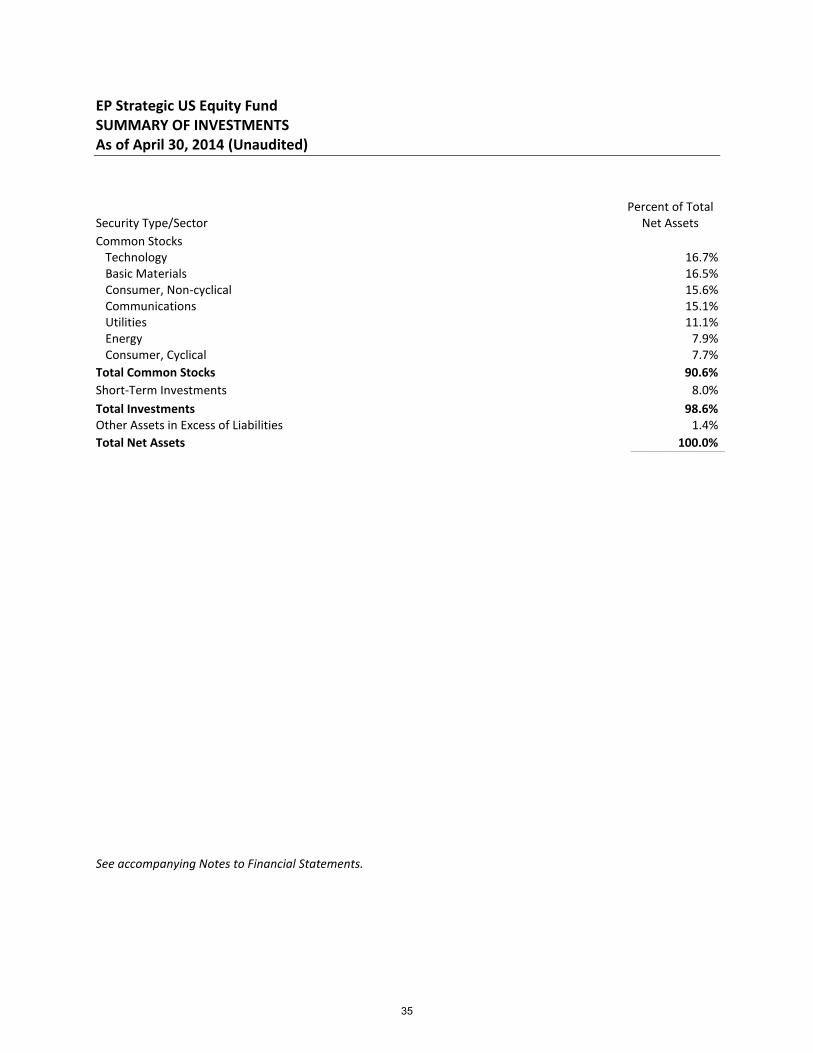
EP Strategic US Equity Fund SUMMARY OF INVESTMENTS As of April 30, 2014 (Unaudited)
Security Type/Sector Percent of Total
Net Assets
Common Stocks Technology 16.7% Basic Materials 16.5% Consumer, Non-cyclical 15.6% Communications 15.1% Utilities 11.1% Energy 7.9% Consumer, Cyclical 7.7% __________
Total Common Stocks 90.6%
Short-Term Investments 8.0% __________ Total Investments 98.6% Other Assets in Excess of Liabilities 1.4% __________ Total Net Assets 100.0% __________ __________
See accompanying Notes to Financial Statements.
35

STATEMENTS OF ASSETS AND LIABILITIES
As of April 30, 2014 (Unaudited)
EuroPac International EuroPac International EuroPac Hard
Value Fund Bond Fund Asset Fund
Assets:
Investments, at cost $ 73,066,907 $ 77,049,095 $ 28,362,107
Purchased options contracts, at cost - - - Foreign currency, at cost - 4,784,577 -
Investments, at value $ 73,614,846 $ 73,542,062 $ 23,652,760
Purchased options contracts, at value - - -
Foreign currency, at value - 4,804,850 -
Segregated cash at Broker
Receivables:
Investment securities sold 1,922,429 - -
Fund shares sold - - -
Dividends and interest 370,204 1,215,202 26,090
Due from Advisor - - -
Due from Custodian 10,209 - -
Prepaid expenses 23,995 21,132 19,936
Prepaid offering costs - - -
Total assets 75,941,683 79,583,246 23,698,786
Liabilities:Written options contracts, at cost - - -
Written options contracts, at value - - -
Payables:
Investment securities purchased - 4,417,287 -
Fund shares redeemed 81,642 116,860 8,978
Advisory fees 56,346 20,376 5,589
Distribution fees - Class A (Note 8) 14,407 14,500 4,797
Shareholder servicing fees (Note 7) 12,292 11,161 2,962
Administration fees 13,169 11,824 7,135
Transfer agent fees and expenses 11,386 9,867 5,633
Fund accounting fees 10,254 11,336 7,855
Custody fees 8,518 9,915 3,291
Auditing fees 8,325 8,324 8,326
Trustees' fees and expenses 1,595 810 1,062
Chief Compliance Officer fees 574 556 642
Due to Custodian - - -
Offering costs - Advisor - - -
Accrued other expenses 7,439 4,847 3,346
Total liabilities 225,947 4,637,663 59,616
Net Assets $ 75,715,736 $ 74,945,583 $ 23,639,170
Components of Net Assets:
Paid-in Capital (par value of $0.01 per share with an unlimited
number of shares authorized) $ 73,691,127 $ 78,801,579 $ 31,531,588
Accumulated net investment income (loss) (21,219) 703,624 (254,025)
Accumulated net realized gain (loss) on investments,
purchased options contracts, written options contracts
and foreign currency transactions 1,497,609 (1,077,996) (2,929,378)
Net unrealized appreciation/depreciation on:
Investments 547,939 (3,507,033) (4,709,347)
Purchased options contracts - - -
Written options contracts - - -
Foreign currency translations 280 25,409 332
Net Assets $ 75,715,736 $ 74,945,583 $ 23,639,170
Class A Shares:
Net assets applicable to shares outstanding $ 75,689,612 $ 74,756,110 $ 23,560,258
Shares of beneficial interest issued and outstanding 7,221,131 7,512,844 3,057,850
Redemption price per share $ 10.48 $ 9.95 $ 7.70
Maximum sales charge (4.50% of offering price)* 0.49 0.47 0.36
Maximum public offering price $ 10.97 $ 10.42 $ 8.06
Class I Shares:
Net assets applicable to shares outstanding $ 26,124 $ 189,473 $ 78,912
Shares of beneficial interest issued and outstanding 2,490 18,990 10,218
Offering and Redemption price $ 10.49 $ 9.98 $ 7.72
* On sales of $50,000 or more, the sales charge will be reduced.
Maximum Offering Price per Share:
See accompanying Notes to Financial Statements.
36
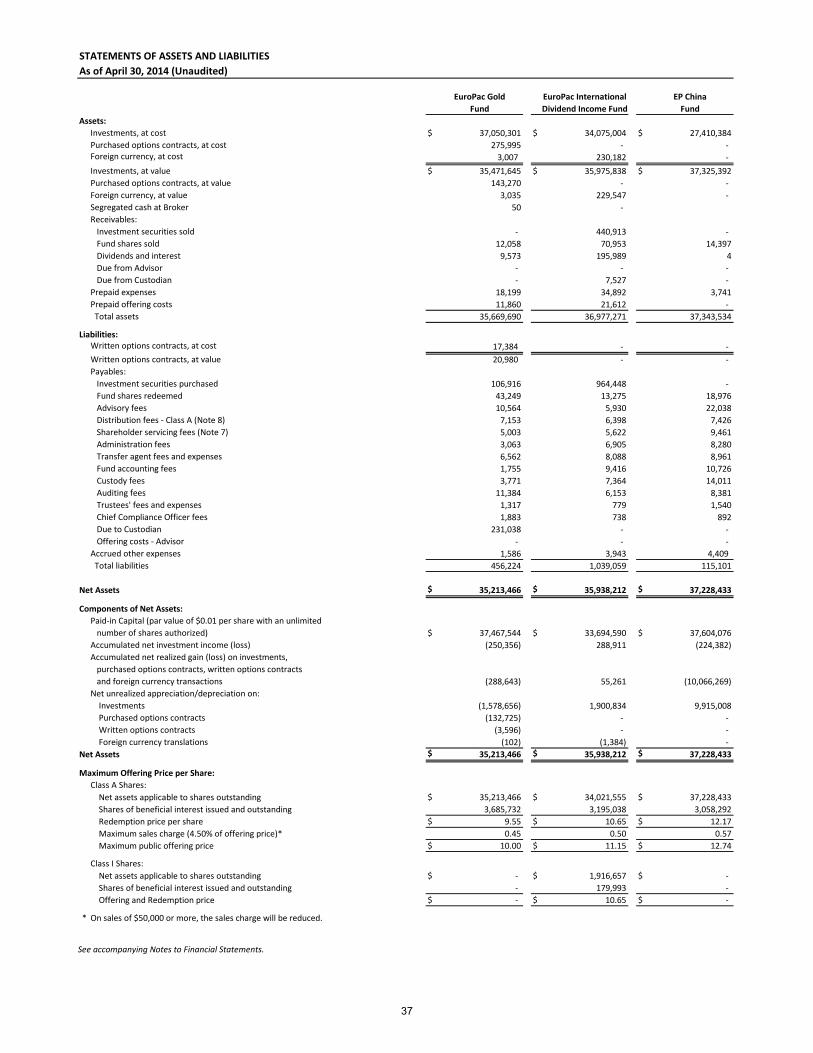
STATEMENTS OF ASSETS AND LIABILITIES
As of April 30, 2014 (Unaudited)
EuroPac Gold EuroPac International EP China
Fund Dividend Income Fund Fund
Assets:
Investments, at cost $ 37,050,301 $ 34,075,004 $ 27,410,384
Purchased options contracts, at cost 275,995 - - Foreign currency, at cost 3,007 230,182 -
Investments, at value $ 35,471,645 $ 35,975,838 $ 37,325,392
Purchased options contracts, at value 143,270 - -
Foreign currency, at value 3,035 229,547 -
Segregated cash at Broker 50 -
Receivables:
Investment securities sold - 440,913 -
Fund shares sold 12,058 70,953 14,397
Dividends and interest 9,573 195,989 4
Due from Advisor - - -
Due from Custodian - 7,527 -
Prepaid expenses 18,199 34,892 3,741
Prepaid offering costs 11,860 21,612 -
Total assets 35,669,690 36,977,271 37,343,534
Liabilities:Written options contracts, at cost 17,384 - -
Written options contracts, at value 20,980 - -
Payables:
Investment securities purchased 106,916 964,448 -
Fund shares redeemed 43,249 13,275 18,976
Advisory fees 10,564 5,930 22,038
Distribution fees - Class A (Note 8) 7,153 6,398 7,426
Shareholder servicing fees (Note 7) 5,003 5,622 9,461
Administration fees 3,063 6,905 8,280
Transfer agent fees and expenses 6,562 8,088 8,961
Fund accounting fees 1,755 9,416 10,726
Custody fees 3,771 7,364 14,011
Auditing fees 11,384 6,153 8,381
Trustees' fees and expenses 1,317 779 1,540
Chief Compliance Officer fees 1,883 738 892
Due to Custodian 231,038 - -
Offering costs - Advisor - - -
Accrued other expenses 1,586 3,943 4,409
Total liabilities 456,224 1,039,059 115,101
Net Assets $ 35,213,466 $ 35,938,212 $ 37,228,433
Components of Net Assets:
Paid-in Capital (par value of $0.01 per share with an unlimited
number of shares authorized) $ 37,467,544 $ 33,694,590 $ 37,604,076
Accumulated net investment income (loss) (250,356) 288,911 (224,382)
Accumulated net realized gain (loss) on investments,
purchased options contracts, written options contracts
and foreign currency transactions (288,643) 55,261 (10,066,269)
Net unrealized appreciation/depreciation on:
Investments (1,578,656) 1,900,834 9,915,008
Purchased options contracts (132,725) - -
Written options contracts (3,596) - -
Foreign currency translations (102) (1,384) -
Net Assets $ 35,213,466 $ 35,938,212 $ 37,228,433
Class A Shares:
Net assets applicable to shares outstanding $ 35,213,466 $ 34,021,555 $ 37,228,433
Shares of beneficial interest issued and outstanding 3,685,732 3,195,038 3,058,292
Redemption price per share $ 9.55 $ 10.65 $ 12.17
Maximum sales charge (4.50% of offering price)* 0.45 0.50 0.57
Maximum public offering price $ 10.00 $ 11.15 $ 12.74
Class I Shares:
Net assets applicable to shares outstanding $ - $ 1,916,657 $ -
Shares of beneficial interest issued and outstanding - 179,993 -
Offering and Redemption price $ - $ 10.65 $ -
* On sales of $50,000 or more, the sales charge will be reduced.
Maximum Offering Price per Share:
See accompanying Notes to Financial Statements.
37
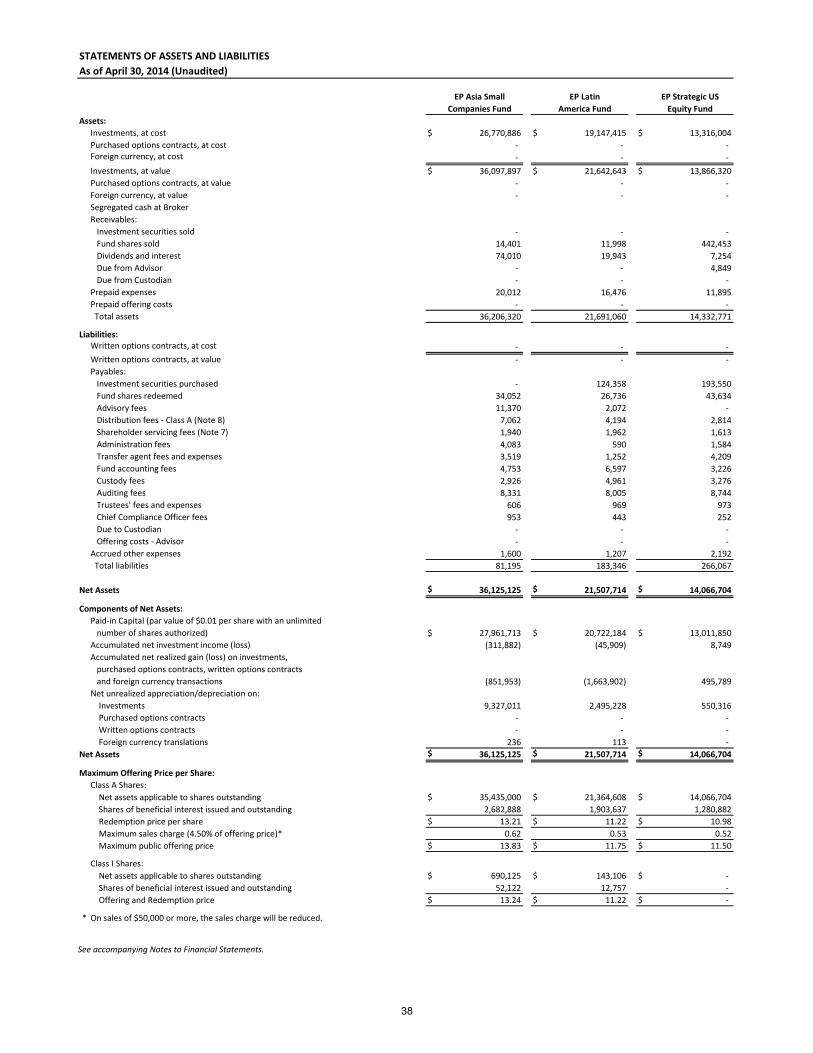
STATEMENTS OF ASSETS AND LIABILITIES
As of April 30, 2014 (Unaudited)
EP Asia Small EP Latin EP Strategic US
Companies Fund America Fund Equity Fund
Assets:
Investments, at cost $ 26,770,886 $ 19,147,415 $ 13,316,004
Purchased options contracts, at cost - - - Foreign currency, at cost - - -
Investments, at value $ 36,097,897 $ 21,642,643 $ 13,866,320
Purchased options contracts, at value - - -
Foreign currency, at value - - -
Segregated cash at Broker
Receivables:
Investment securities sold - - -
Fund shares sold 14,401 11,998 442,453
Dividends and interest 74,010 19,943 7,254
Due from Advisor - - 4,849
Due from Custodian - - -
Prepaid expenses 20,012 16,476 11,895
Prepaid offering costs - - -
Total assets 36,206,320 21,691,060 14,332,771
Liabilities:Written options contracts, at cost - - -
Written options contracts, at value - - -
Payables:
Investment securities purchased - 124,358 193,550
Fund shares redeemed 34,052 26,736 43,634
Advisory fees 11,370 2,072 -
Distribution fees - Class A (Note 8) 7,062 4,194 2,814
Shareholder servicing fees (Note 7) 1,940 1,962 1,613
Administration fees 4,083 590 1,584
Transfer agent fees and expenses 3,519 1,252 4,209
Fund accounting fees 4,753 6,597 3,226
Custody fees 2,926 4,961 3,276
Auditing fees 8,331 8,005 8,744
Trustees' fees and expenses 606 969 973
Chief Compliance Officer fees 953 443 252
Due to Custodian - - -
Offering costs - Advisor - - -
Accrued other expenses 1,600 1,207 2,192
Total liabilities 81,195 183,346 266,067
Net Assets $ 36,125,125 $ 21,507,714 $ 14,066,704
Components of Net Assets:
Paid-in Capital (par value of $0.01 per share with an unlimited
number of shares authorized) $ 27,961,713 $ 20,722,184 $ 13,011,850
Accumulated net investment income (loss) (311,882) (45,909) 8,749
Accumulated net realized gain (loss) on investments,
purchased options contracts, written options contracts
and foreign currency transactions (851,953) (1,663,902) 495,789
Net unrealized appreciation/depreciation on:
Investments 9,327,011 2,495,228 550,316
Purchased options contracts - - -
Written options contracts - - -
Foreign currency translations 236 113 -
Net Assets $ 36,125,125 $ 21,507,714 $ 14,066,704
Class A Shares:
Net assets applicable to shares outstanding $ 35,435,000 $ 21,364,608 $ 14,066,704
Shares of beneficial interest issued and outstanding 2,682,888 1,903,637 1,280,882
Redemption price per share $ 13.21 $ 11.22 $ 10.98
Maximum sales charge (4.50% of offering price)* 0.62 0.53 0.52
Maximum public offering price $ 13.83 $ 11.75 $ 11.50
Class I Shares:
Net assets applicable to shares outstanding $ 690,125 $ 143,106 $ -
Shares of beneficial interest issued and outstanding 52,122 12,757 -
Offering and Redemption price $ 13.24 $ 11.22 $ -
* On sales of $50,000 or more, the sales charge will be reduced.
Maximum Offering Price per Share:
See accompanying Notes to Financial Statements.
38

STATEMENTS OF OPERATIONS
For the Six Months Ended April 30, 2014 (Unaudited)
EuroPac International EuroPac International EuroPac Hard
Value Fund Bond Fund Asset Fund
Investment Income:
Dividends (net of foreign withholding taxes of $177,135, $0 and $18,591, respectively) 1,296,146$ 13,234$ 168,581$
Interest (net of foreign withholding taxes of $0, $35,758 and $0, respectively) 303 1,674,000 58
Total investment income 1,296,449 1,687,234 168,639
Expenses:
Advisory fees 418,561 234,277 148,617
Distribution fees - Class A (Note 8) 96,781 97,334 34,378
Transfer agent fees and expenses 40,567 35,336 28,591
Administration fees 38,829 37,960 28,619
Shareholder servicing fees (Note 7) 37,154 37,609 11,597
Fund accounting fees 36,453 33,457 25,774
Custody fees 15,640 18,091 7,248
Registration fees 15,579 16,900 14,536
Auditing fees 8,239 8,239 8,243
Legal fees 7,584 6,716 6,630
Miscellaneous 7,555 6,529 6,784
Shareholder reporting fees 6,581 6,303 6,644
Trustees' fees and expenses 2,769 2,363 2,488
Chief Compliance Officer fees 1,315 1,335 1,797
Insurance fees 642 691 627
Offering costs - - -
Interest expense - - -
Total expenses 734,249 543,140 332,573
Advisory fee waived (56,378) (94,472) (91,754)
Other expenses absorbed - - -
Net expenses 677,871 448,668 240,819
Net investment income (loss) 618,578 1,238,566 (72,180)
Realized and Unrealized Gain (Loss) on Investments, Purchased Options Contracts,
Written Options Contracts and Foreign Currency:
Net realized gain (loss) on:
Investments 3,702,722 (1,019,485) (2,543,814)
Purchased options contracts - - -
Written options contracts - - -
Foreign currency transactions 15,012 (57,308) (157)
Net realized gain (loss) 3,717,734 (1,076,793) (2,543,971)
Net change in unrealized appreciation/depreciation on:
Investments (2,414,291) 696,785 1,175,147
Purchased options contracts - - -
Written options contracts - - -
Foreign currency translations (620) 20,113 276
(2,414,911) 716,898 1,175,423
Net realized and unrealized gain (loss) on investments, purchased options contracts,
written options contracts and foreign currency 1,302,823 (359,895) (1,368,548)
Net Increase (Decrease) in Net Assets from Operations 1,921,401$ 878,671$ (1,440,728)$
Net change in unrealized appreciation/depreciation
See accompanying Notes to Financial Statements.
39

STATEMENTS OF OPERATIONS
For the Six Months Ended April 30, 2014 (Unaudited)
EuroPac Gold EuroPac International EP China
Fund Dividend Income Fund1Fund
Investment Income:
Dividends (net of foreign withholding taxes of $11,167, $65,801 and $0, respectively) 91,166$ 444,354$ 119,088$
Interest (net of foreign withholding taxes of $0, $0 and $0, respectively) 89 121 10
Total investment income 91,255 444,475 119,098
Expenses:
Advisory fees 107,508 57,264 211,946
Distribution fees - Class A (Note 8) 33,565 15,502 49,044
Transfer agent fees and expenses 14,726 13,619 27,169
Administration fees 21,698 15,979 25,971
Shareholder servicing fees (Note 7) 12,155 8,948 21,292
Fund accounting fees 17,734 16,273 30,435
Custody fees 8,630 7,363 19,201
Registration fees 11,799 10,398 10,812
Auditing fees 11,383 6,153 8,300
Legal fees 6,158 4,439 5,787
Miscellaneous 2,480 2,121 3,037
Shareholder reporting fees 3,845 2,875 5,860
Trustees' fees and expenses 2,976 1,776 3,058
Chief Compliance Officer fees 5,869 851 3,401
Insurance fees 2,274 355 744
Offering costs 26,833 8,895 -
Interest expense 23 - -
Total expenses 289,656 172,811 426,057
Advisory fee waived (88,244) (57,264) (82,753)
Other expenses absorbed - (15,832) -
Net expenses 201,412 99,715 343,304
Net investment income (loss) (110,157) 344,760 (224,206)
Realized and Unrealized Gain (Loss) on Investments, Purchased Options Contracts,
Written Options Contracts and Foreign Currency:
Net realized gain (loss) on:
Investments (220,841) 68,292 511,267
Purchased options contracts 102,133 - -
Written options contracts 30,112 - -
Foreign currency transactions (1,591) (13,031) (774)
Net realized gain (loss) (90,187) 55,261 510,493
Net change in unrealized appreciation/depreciation on:
Investments (330,796) 1,900,834 (550,163)
Purchased options contracts (79,662) - -
Written options contracts (3,596) - -
Foreign currency translations 504 (1,384) -
(413,550) 1,899,450 (550,163)
Net realized and unrealized gain (loss) on investments, purchased options contracts,
written options contracts and foreign currency (503,737) 1,954,711 (39,670)
Net Increase (Decrease) in Net Assets from Operations (613,894)$ 2,299,471$ (263,876)$
1 The EuroPac International Dividend Income Fund commenced operations on January 10, 2014.
Net change in unrealized appreciation/depreciation
See accompanying Notes to Financial Statements.
40
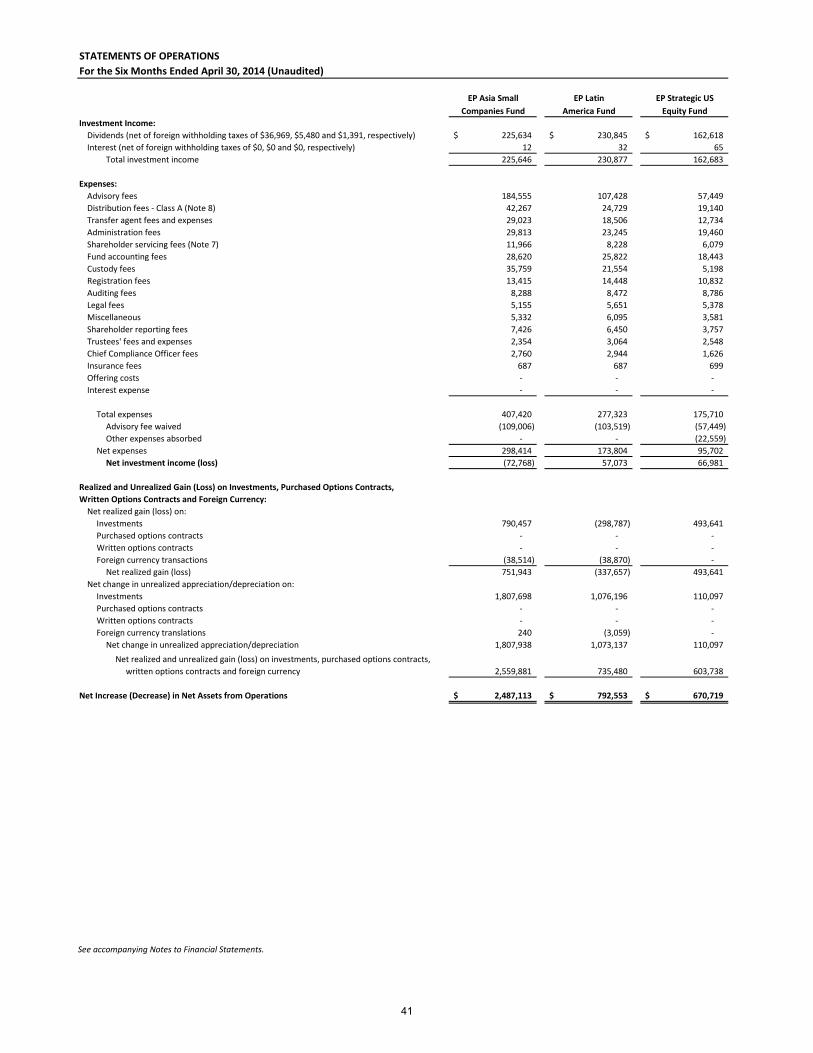
STATEMENTS OF OPERATIONS
For the Six Months Ended April 30, 2014 (Unaudited)
EP Asia Small EP Latin EP Strategic US
Companies Fund America Fund Equity Fund
Investment Income:
Dividends (net of foreign withholding taxes of $36,969, $5,480 and $1,391, respectively) 225,634$ 230,845$ 162,618$
Interest (net of foreign withholding taxes of $0, $0 and $0, respectively) 12 32 65
Total investment income 225,646 230,877 162,683
Expenses:
Advisory fees 184,555 107,428 57,449
Distribution fees - Class A (Note 8) 42,267 24,729 19,140
Transfer agent fees and expenses 29,023 18,506 12,734
Administration fees 29,813 23,245 19,460
Shareholder servicing fees (Note 7) 11,966 8,228 6,079
Fund accounting fees 28,620 25,822 18,443
Custody fees 35,759 21,554 5,198
Registration fees 13,415 14,448 10,832
Auditing fees 8,288 8,472 8,786
Legal fees 5,155 5,651 5,378
Miscellaneous 5,332 6,095 3,581
Shareholder reporting fees 7,426 6,450 3,757
Trustees' fees and expenses 2,354 3,064 2,548
Chief Compliance Officer fees 2,760 2,944 1,626
Insurance fees 687 687 699
Offering costs - - -
Interest expense - - -
Total expenses 407,420 277,323 175,710
Advisory fee waived (109,006) (103,519) (57,449)
Other expenses absorbed - - (22,559)
Net expenses 298,414 173,804 95,702
Net investment income (loss) (72,768) 57,073 66,981
Realized and Unrealized Gain (Loss) on Investments, Purchased Options Contracts,
Written Options Contracts and Foreign Currency:
Net realized gain (loss) on:
Investments 790,457 (298,787) 493,641
Purchased options contracts - - -
Written options contracts - - -
Foreign currency transactions (38,514) (38,870) -
Net realized gain (loss) 751,943 (337,657) 493,641
Net change in unrealized appreciation/depreciation on:
Investments 1,807,698 1,076,196 110,097
Purchased options contracts - - -
Written options contracts - - -
Foreign currency translations 240 (3,059) -
1,807,938 1,073,137 110,097
Net realized and unrealized gain (loss) on investments, purchased options contracts,
written options contracts and foreign currency 2,559,881 735,480 603,738
Net Increase (Decrease) in Net Assets from Operations 2,487,113$ 792,553$ 670,719$
Net change in unrealized appreciation/depreciation
See accompanying Notes to Financial Statements.
41

STATEMENTS OF CHANGES IN NET ASSETS
Operations:
$ 618,578 $ 1,590,157
3,717,734 2,871,132
(2,414,911) (2,931,409)
1,921,401 1,529,880
From net investment income:
Class A (566,551) (1,718,715)
Class I (583) (2)
Total distributions to shareholders (567,134) (1,718,717)
Class A 5,865,609 25,813,740
Class I - 101,347
Reinvestment of distributions:
Class A 397,622 1,246,851
Class I 583 2
Cost of shares redeemed:
Class A1 (15,603,868) (20,556,247)
Class I (76,837) -
Net increase (decrease) in net assets from capital transactions (9,416,891) 6,605,693
(8,062,624) 6,416,856
83,778,360 77,361,504
$ 75,715,736 $ 83,778,360
$ (21,219) $ (72,663)
Capital Share Transactions:
Shares sold:
Class A 585,672 2,506,810
Class I - 10,206
Shares reinvested:
Class A 41,204 125,738
Class I 60 -
Shares redeemed:
Class A (1,563,963) (2,009,660)
Class I (7,776) -
Net increase (decrease) in capital share transactions (944,803) 633,094
1 Net of redemption fees of $156 and $417, respectively.
Increase (Decrease) in Net Assets From:
(Unaudited)
Accumulated net investment loss
Net realized gain on investments and foreign currency transactions
Net change in unrealized appreciation/depreciation on investments
Net increase in net assets resulting from operations
Beginning of period
End of period
Net Assets:
EuroPac International
Net proceeds from shares sold:
Capital Transactions:
and foreign currency translations
Year Ended
Net investment income
October 31, 2013
April 30, 2014
Distributions to Shareholders:
Total increase (decrease) in net assets
Six Months Ended
Value Fund
For the
For the
See accompanying Notes to Financial Statements.
42
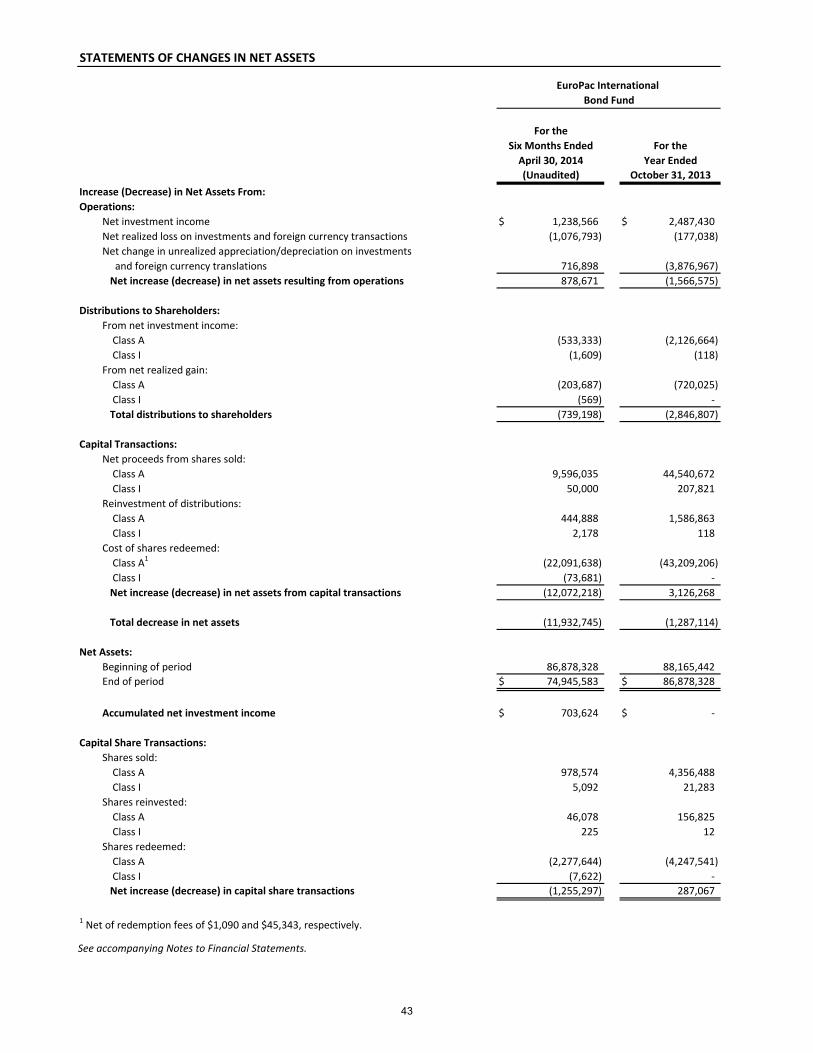
STATEMENTS OF CHANGES IN NET ASSETS
Operations:
$ 1,238,566 $ 2,487,430
(1,076,793) (177,038)
716,898 (3,876,967)
878,671 (1,566,575)
From net investment income:
Class A (533,333) (2,126,664)
Class I (1,609) (118)
Class A (203,687) (720,025)
Class I (569) -
Total distributions to shareholders (739,198) (2,846,807)
Class A 9,596,035 44,540,672
Class I 50,000 207,821
Reinvestment of distributions:
Class A 444,888 1,586,863
Class I 2,178 118
Cost of shares redeemed:
Class A1 (22,091,638) (43,209,206)
Class I (73,681) -
Net increase (decrease) in net assets from capital transactions (12,072,218) 3,126,268
(11,932,745) (1,287,114)
86,878,328 88,165,442
$ 74,945,583 $ 86,878,328
$ 703,624 $ -
Capital Share Transactions:
Shares sold:
Class A 978,574 4,356,488
Class I 5,092 21,283
Shares reinvested:
Class A 46,078 156,825
Class I 225 12
Shares redeemed:
Class A (2,277,644) (4,247,541)
Class I (7,622) -
Net increase (decrease) in capital share transactions (1,255,297) 287,067
1 Net of redemption fees of $1,090 and $45,343, respectively.
Total decrease in net assets
Net Assets:
Beginning of period
End of period
Accumulated net investment income
and foreign currency translations
Net increase (decrease) in net assets resulting from operations
Distributions to Shareholders:
From net realized gain:
Capital Transactions:
Net proceeds from shares sold:
Net investment income
Net realized loss on investments and foreign currency transactions
Net change in unrealized appreciation/depreciation on investments
April 30, 2014 Year Ended
(Unaudited) October 31, 2013
Increase (Decrease) in Net Assets From:
EuroPac International
Bond Fund
For the
Six Months Ended For the
See accompanying Notes to Financial Statements.
43
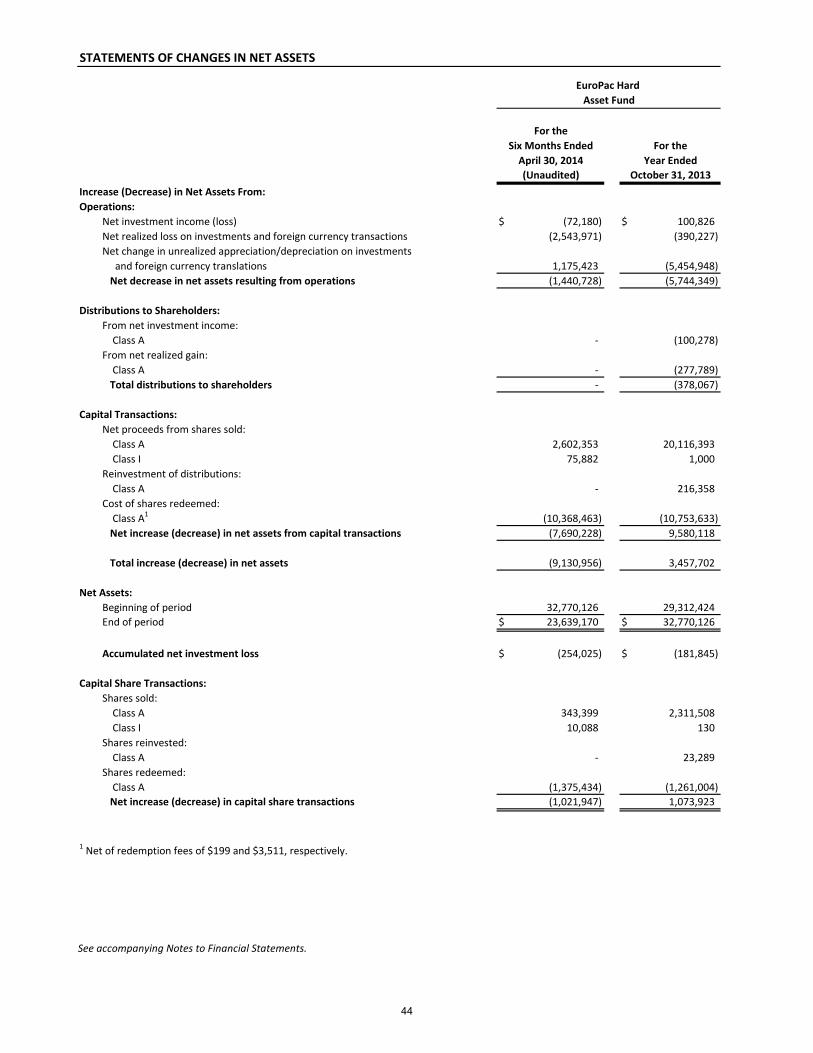
STATEMENTS OF CHANGES IN NET ASSETS
Operations:
$ (72,180) $ 100,826
(2,543,971) (390,227)
1,175,423 (5,454,948)
(1,440,728) (5,744,349)
From net investment income:
Class A - (100,278)
Class A - (277,789)
Total distributions to shareholders - (378,067)
Class A 2,602,353 20,116,393
Class I 75,882 1,000
Reinvestment of distributions:
Class A - 216,358
Cost of shares redeemed:
Class A1 (10,368,463) (10,753,633)
Net increase (decrease) in net assets from capital transactions (7,690,228) 9,580,118
(9,130,956) 3,457,702
32,770,126 29,312,424
$ 23,639,170 $ 32,770,126
$ (254,025) $ (181,845)
Capital Share Transactions:
Shares sold:
Class A 343,399 2,311,508
Class I 10,088 130
Shares reinvested:
Class A - 23,289
Shares redeemed:
Class A (1,375,434) (1,261,004)
Net increase (decrease) in capital share transactions (1,021,947) 1,073,923
1 Net of redemption fees of $199 and $3,511, respectively.
Net Assets:
Beginning of period
End of period
Accumulated net investment loss
Net decrease in net assets resulting from operations
Distributions to Shareholders:
From net realized gain:
Capital Transactions:
Net proceeds from shares sold:
Total increase (decrease) in net assets
Net investment income (loss)
Net realized loss on investments and foreign currency transactions
Net change in unrealized appreciation/depreciation on investments
and foreign currency translations
April 30, 2014 Year Ended
(Unaudited) October 31, 2013
Increase (Decrease) in Net Assets From:
EuroPac Hard
Asset Fund
For the
Six Months Ended For the
See accompanying Notes to Financial Statements.
44

STATEMENTS OF CHANGES IN NET ASSETS
Operations:
$ (110,157) $ (22,658)
options contracts and foreign currency transactions (90,187) (196,019)
(413,550) (1,301,530)
(613,894) (1,520,207)
From net investment income:
Class A (146,520) -
Total distributions to shareholders (146,520) -
17,955,599 21,526,149
Reinvestment of distributions:
Class A 53,128 -
Class A (1,756,767) (284,022)
Net increase in net assets from capital transactions 16,251,960 21,242,127
15,491,546 19,721,920
19,721,920 -
$ 35,213,466 $ 19,721,920
$ (250,356) $ 6,321
Capital Share Transactions:
Class A 1,795,637 2,093,475
Shares reinvested:
Class A 6,511 -
Cost of shares redeemed:
Class A (181,746) (28,145)
Net increase in capital share transactions 1,620,402 2,065,330
* Commencement of operations.1 Net of redemption fees of $1,319 and $1,023, respectively.
Net Assets:
Beginning of period
Net investment loss
Increase (Decrease) in Net Assets From:
Net proceeds from shares sold:
Net proceeds from shares sold:
Accumulated net investment income (loss)
Distributions to Shareholders:
Total increase in net assets
Cost of shares redeemed:
Class A
Net decrease in net assets resulting from operations
Net realized loss on investments, purchased options contracts, written
Net change in unrealized appreciation/depreciation on investments,
currency translations
purchased options contracts, written options contracts and foreign
through
October 31, 2013
For the
Six Months Ended
End of period
For the Period
July 19, 2013*
Capital Transactions:
April 30, 2014
(Unaudited)
EuroPac Gold Fund
See accompanying Notes to Financial Statements.
45

STATEMENT OF CHANGES IN NET ASSETS
Operations:
$ 344,760
55,261
1,899,450
2,299,471
From net investment income:
Class A (52,027)
Class I (3,822)
Total distributions to shareholders (55,849)
Net proceeds from shares sold:
Class A 32,836,984
Class I 1,650,984
Reinvestment of distributions:
Class A 24,869
Class I 3,822
Cost of shares redeemed:
Class A1 (812,396)
Class I (9,673)
Net increase in net assets from capital transactions 33,694,590
35,938,212
-
$ 35,938,212
$ 288,911
Capital Share Transactions:
Shares sold:
Class A 3,273,288
Class I 180,573
Shares reinvested:
Class A 2,433
Class I 374
Shares redeemed:
Class A (80,683)
Class I (954)
Net increase in capital share transactions 3,375,031
* Commencement of operations.1 Net of redemption fees of $1,416.
EuroPac International
Dividend Income Fund
April 30, 2014
Total increase in net assets
Net Assets:
Beginning of period
Net investment income
Net realized gain on investments and foreign currency transactions
Net change in unrealized appreciation/depreciation on investments
End of period
Accumulated net investment income
Net increase in net assets resulting from operations
Distributions to Shareholders:
Capital Transactions:
and foreign currency translations
through
(Unaudited)
Increase (Decrease) in Net Assets From:
For the Period
January 10, 2014*
See accompanying Notes to Financial Statements.
46

STATEMENTS OF CHANGES IN NET ASSETS
Operations:
$ (224,206) $ 220,045
510,493 342,609
(550,163) 6,867,156
(263,876) 7,429,810
From net investment income:
(210,774) (352,949)
Total distributions to shareholders (210,774) (352,949)
Class A 3,100,167 10,612,370
Reinvestment of distributions:
Class A 157,451 280,169
Cost of shares redeemed:
Class A1 (6,086,988) (16,192,052)
Net decrease in net assets from capital transactions (2,829,370) (5,299,513)
(3,304,020) 1,777,348
40,532,453 38,755,105
$ 37,228,433 $ 40,532,453
$ (224,382) $ 210,598
Capital Share Transactions:
Class A 250,493 934,543
Reinvestment of distributions:
Class A 12,506 26,332
Cost of shares redeemed:
Class A (490,504) (1,442,359)
Net decrease in capital share transactions (227,505) (481,484)
1 Net of redemption fees of $1,115 and $5,110, respectively.
Class A
Net proceeds from shares sold:
Net proceeds from shares sold:
End of period
Accumulated net investment income (loss)
Capital Transactions:
Total increase (decrease) in net assets
Net Assets:
Beginning of period
Net change in unrealized appreciation/depreciation on investments
and foreign currency translations
Net increase (decrease) in net assets resulting from operations
Distributions to Shareholders:
Net investment income (loss)
Net realized gain on investments and foreign currency transactions
(Unaudited)
April 30, 2014 Year Ended
October 31, 2013
Increase (Decrease) in Net Assets From:
EP China
Fund
For the
Six Months Ended For the
See accompanying Notes to Financial Statements.
47

STATEMENTS OF CHANGES IN NET ASSETS
Operations:
$ (72,768) $ 13,922
751,943 3,291,714
1,807,938 1,464,363
2,487,113 4,769,999
From net investment income:
Class A - (413,034)
Total distributions to shareholders - (413,034)
Net proceeds from shares sold:
Class A 3,029,959 14,716,311
Class I 598,052 181,738
Reinvestment of distributions:
Class A - 207,061
Cost of shares redeemed:
Class A1(4,516,892) (12,066,006)
Class I (121,516) -
Net increase (decrease) in net assets from capital transactions (1,010,397) 3,039,104
1,476,716 7,396,069
34,648,409 27,252,340
$ 36,125,125 $ 34,648,409
$ (311,882) $ (239,114)
Capital Share Transactions:
Shares sold:
Class A 245,816 1,186,476
Class I 47,863 14,859
Shares reinvested:
Class A - 18,570
Shares redeemed:
Class A (364,637) (956,442)
Class I (10,600) -
Net increase (decrease) in capital share transactions (81,558) 263,463
1 Net of redemption fees of $177 and $1,221, respectively.
EP Asia Small
Companies Fund
April 30, 2014 Year Ended
Six Months Ended For the
For the
Increase (Decrease) in Net Assets From:
(Unaudited) October 31, 2013
Net investment income (loss)
Net realized gain on investments and foreign currency transactions
Net change in unrealized appreciation/depreciation on investments
and foreign currency translations
Net Assets:
Beginning of period
End of period
Accumulated net investment loss
Net increase in net assets resulting from operations
Distributions to Shareholders:
Capital Transactions:
Total increase in net assets
See accompanying Notes to Financial Statements.
48
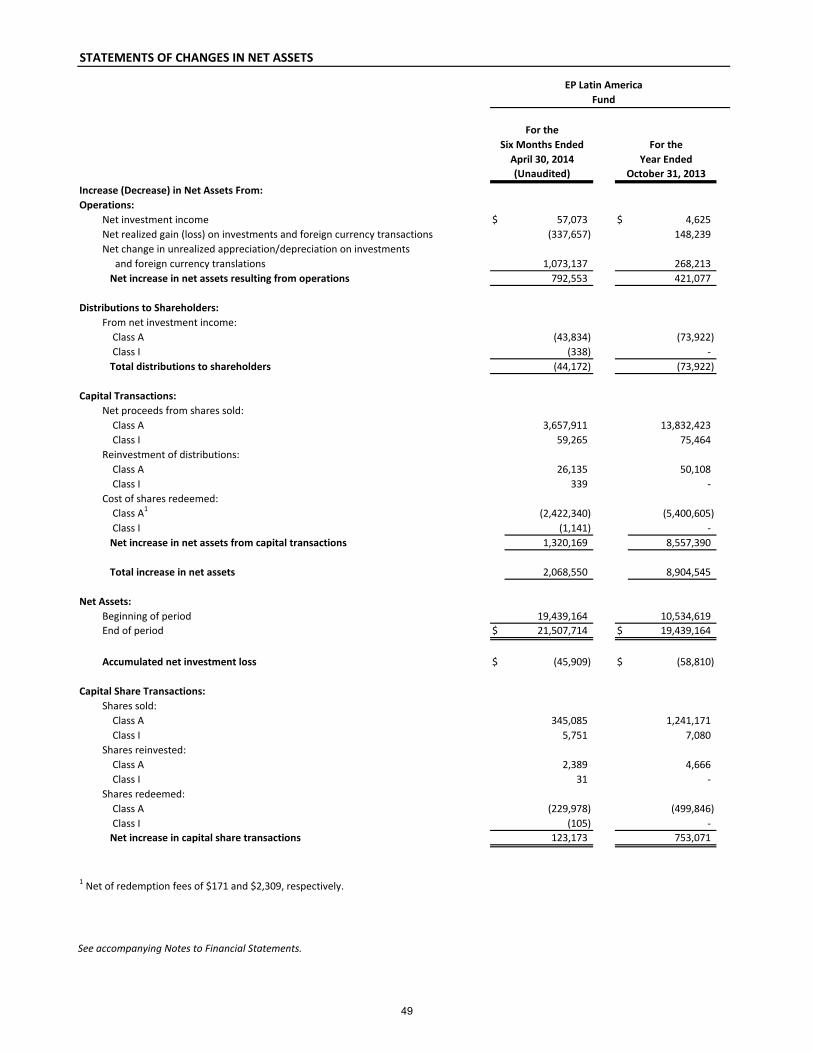
STATEMENTS OF CHANGES IN NET ASSETS
Operations:
$ 57,073 $ 4,625
(337,657) 148,239
1,073,137 268,213
792,553 421,077
From net investment income:
Class A (43,834) (73,922)
Class I (338) -
Total distributions to shareholders (44,172) (73,922)
Class A 3,657,911 13,832,423
Class I 59,265 75,464
Reinvestment of distributions:
Class A 26,135 50,108
Class I 339 -
Cost of shares redeemed:
Class A1(2,422,340) (5,400,605)
Class I (1,141) -
Net increase in net assets from capital transactions 1,320,169 8,557,390
2,068,550 8,904,545
19,439,164 10,534,619
$ 21,507,714 $ 19,439,164
$ (45,909) $ (58,810)
Capital Share Transactions:
Shares sold:
Class A 345,085 1,241,171
Class I 5,751 7,080
Shares reinvested:
Class A 2,389 4,666
Class I 31 -
Shares redeemed:
Class A (229,978) (499,846)
Class I (105) -
Net increase in capital share transactions 123,173 753,071
1 Net of redemption fees of $171 and $2,309, respectively.
EP Latin America
Fund
October 31, 2013
Increase (Decrease) in Net Assets From:
(Unaudited)
For theSix Months Ended
Year Ended
For the
Net investment income
Net realized gain (loss) on investments and foreign currency transactions
April 30, 2014
Net change in unrealized appreciation/depreciation on investments
and foreign currency translations
Net Assets:
Beginning of period
End of period
Accumulated net investment loss
Net increase in net assets resulting from operations
Distributions to Shareholders:
Capital Transactions:
Net proceeds from shares sold:
Total increase in net assets
See accompanying Notes to Financial Statements.
49
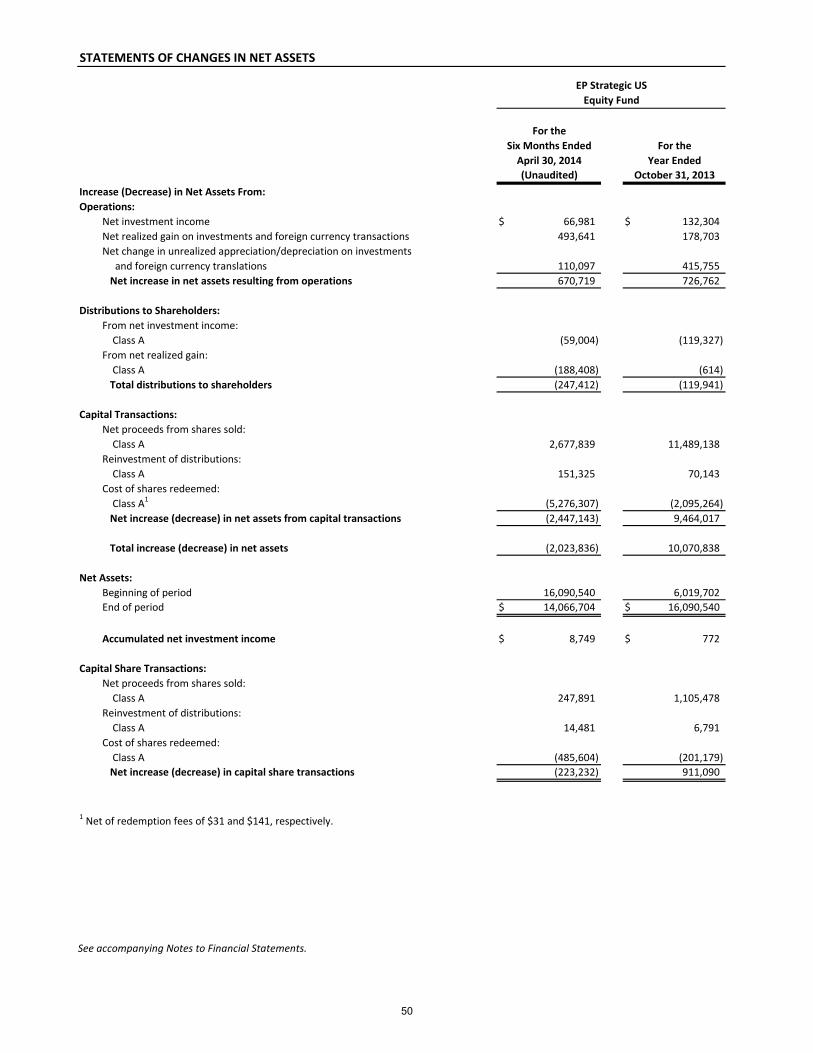
STATEMENTS OF CHANGES IN NET ASSETS
Operations:
$ 66,981 $ 132,304
493,641 178,703
110,097 415,755
670,719 726,762
From net investment income:
(59,004) (119,327)
Class A (188,408) (614)
Total distributions to shareholders (247,412) (119,941)
Class A 2,677,839 11,489,138
Reinvestment of distributions:
Class A 151,325 70,143
Cost of shares redeemed:
Class A1 (5,276,307) (2,095,264)
Net increase (decrease) in net assets from capital transactions (2,447,143) 9,464,017
(2,023,836) 10,070,838
16,090,540 6,019,702
$ 14,066,704 $ 16,090,540
$ 8,749 $ 772
Capital Share Transactions:
Class A 247,891 1,105,478
Reinvestment of distributions:
Class A 14,481 6,791
Cost of shares redeemed:
Class A (485,604) (201,179)
Net increase (decrease) in capital share transactions (223,232) 911,090
1 Net of redemption fees of $31 and $141, respectively.
Net proceeds from shares sold:
Total increase (decrease) in net assets
Net Assets:
Beginning of period
End of period
Accumulated net investment income
Net increase in net assets resulting from operations
Distributions to Shareholders:
Capital Transactions:
Net investment income
Net realized gain on investments and foreign currency transactions
Net change in unrealized appreciation/depreciation on investments
and foreign currency translations
Class A
From net realized gain:
Net proceeds from shares sold:
April 30, 2014 Year Ended
(Unaudited) October 31, 2013
Increase (Decrease) in Net Assets From:
EP Strategic US
Equity Fund
For the
Six Months Ended For the
See accompanying Notes to Financial Statements.
50
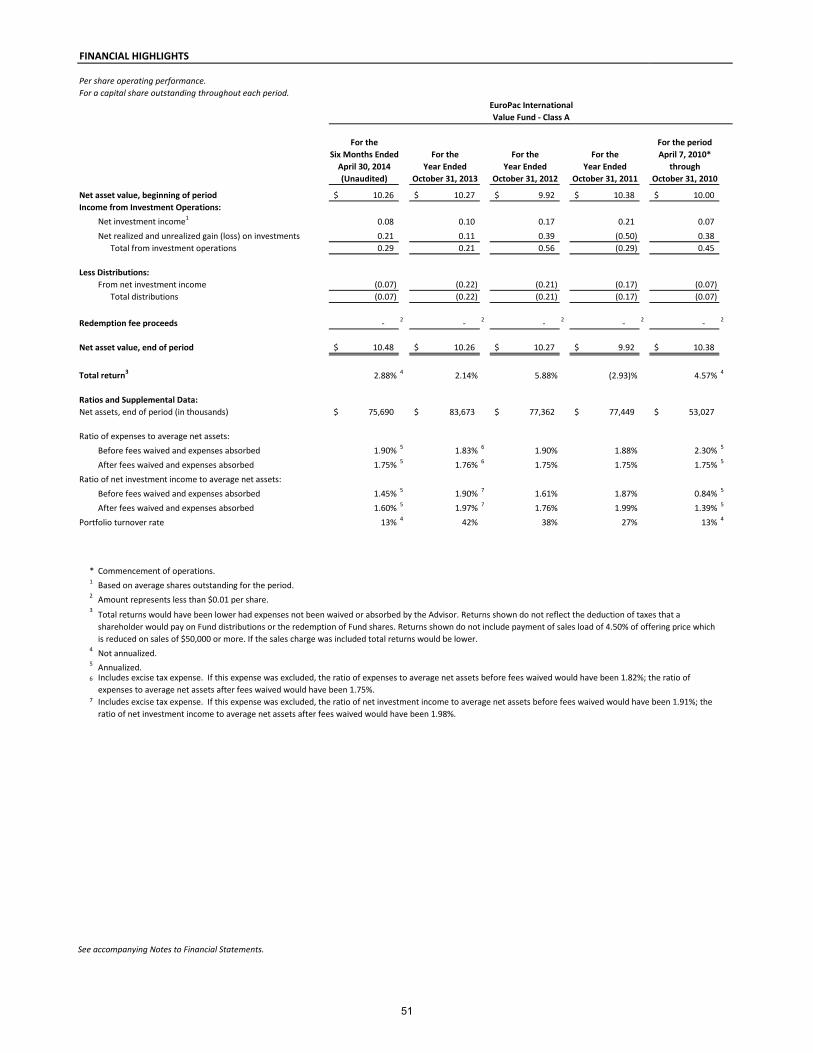
FINANCIAL HIGHLIGHTS
Per share operating performance.
For a capital share outstanding throughout each period.
For the For the period
Six Months Ended For the For the For the April 7, 2010*
April 30, 2014 Year Ended Year Ended Year Ended through
(Unaudited) October 31, 2013 October 31, 2012 October 31, 2011 October 31, 2010
Net asset value, beginning of period 10.26$ 10.27$ 9.92$ 10.38$ 10.00$
Income from Investment Operations:
Net investment income1 0.08 0.10 0.17 0.21 0.07
Net realized and unrealized gain (loss) on investments 0.21 0.11 0.39 (0.50) 0.38
Total from investment operations 0.29 0.21 0.56 (0.29) 0.45
Less Distributions:
From net investment income (0.07) (0.22) (0.21) (0.17) (0.07)
Total distributions (0.07) (0.22) (0.21) (0.17) (0.07)
Redemption fee proceeds - 2 - 2 - 2 - 2 - 2
Net asset value, end of period 10.48$ 10.26$ 10.27$ 9.92$ 10.38$
Total return3 2.88% 4 2.14% 5.88% (2.93)% 4.57% 4
Ratios and Supplemental Data:
Net assets, end of period (in thousands) 75,690$ 83,673$ 77,362$ 77,449$ 53,027$
Ratio of expenses to average net assets:
Before fees waived and expenses absorbed 1.90% 5 1.83% 6 1.90% 1.88% 2.30% 5
After fees waived and expenses absorbed 1.75% 5 1.76% 6 1.75% 1.75% 1.75% 5
Ratio of net investment income to average net assets:
Before fees waived and expenses absorbed 1.45% 5 1.90% 7 1.61% 1.87% 0.84% 5
After fees waived and expenses absorbed 1.60% 5 1.97% 7 1.76% 1.99% 1.39% 5
Portfolio turnover rate 13% 4 42% 38% 27% 13% 4
* Commencement of operations.1 Based on average shares outstanding for the period.2
Amount represents less than $0.01 per share.3
4Not annualized.
5Annualized.
6
7
Total returns would have been lower had expenses not been waived or absorbed by the Advisor. Returns shown do not reflect the deduction of taxes that a
shareholder would pay on Fund distributions or the redemption of Fund shares. Returns shown do not include payment of sales load of 4.50% of offering price which
is reduced on sales of $50,000 or more. If the sales charge was included total returns would be lower.
EuroPac International
Value Fund - Class A
Includes excise tax expense. If this expense was excluded, the ratio of expenses to average net assets before fees waived would have been 1.82%; the ratio of
expenses to average net assets after fees waived would have been 1.75%.
Includes excise tax expense. If this expense was excluded, the ratio of net investment income to average net assets before fees waived would have been 1.91%; the
ratio of net investment income to average net assets after fees waived would have been 1.98%.
See accompanying Notes to Financial Statements.
51
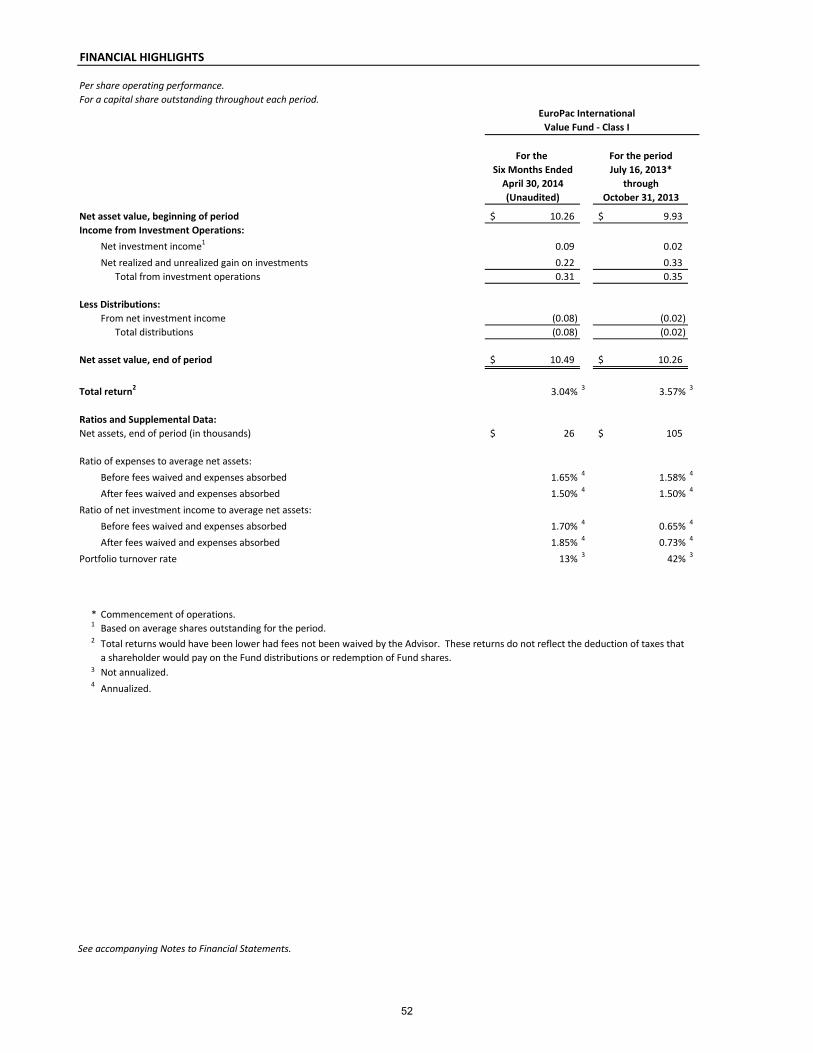
FINANCIAL HIGHLIGHTS
Per share operating performance.
For a capital share outstanding throughout each period.
For the For the period
Six Months Ended July 16, 2013*
April 30, 2014 through
(Unaudited) October 31, 2013
Net asset value, beginning of period 10.26$ 9.93$
Income from Investment Operations:
Net investment income1 0.09 0.02
Net realized and unrealized gain on investments 0.22 0.33
Total from investment operations 0.31 0.35
Less Distributions:
From net investment income (0.08) (0.02)
Total distributions (0.08) (0.02)
Net asset value, end of period 10.49$ 10.26$
Total return2 3.04% 3 3.57% 3
Ratios and Supplemental Data:
Net assets, end of period (in thousands) 26$ 105$
Ratio of expenses to average net assets:
Before fees waived and expenses absorbed 1.65% 4 1.58% 4
After fees waived and expenses absorbed 1.50% 4 1.50% 4
Ratio of net investment income to average net assets:
Before fees waived and expenses absorbed 1.70% 4 0.65% 4
After fees waived and expenses absorbed 1.85% 4 0.73% 4
Portfolio turnover rate 13% 3 42% 3
* Commencement of operations.1 Based on average shares outstanding for the period.2
3 Not annualized.4
Annualized.
Total returns would have been lower had fees not been waived by the Advisor. These returns do not reflect the deduction of taxes that
a shareholder would pay on the Fund distributions or redemption of Fund shares.
EuroPac International
Value Fund - Class I
See accompanying Notes to Financial Statements.
52
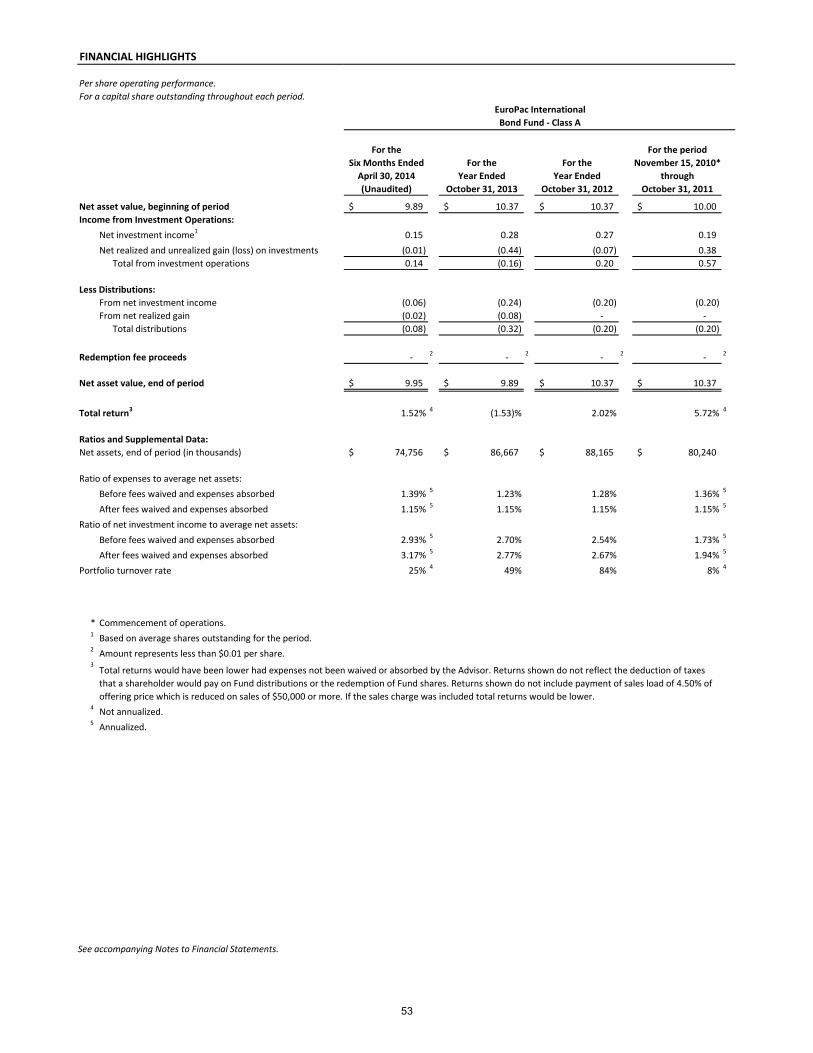
FINANCIAL HIGHLIGHTS
Per share operating performance.
For a capital share outstanding throughout each period.
For the For the period
Six Months Ended For the For the November 15, 2010*
April 30, 2014 Year Ended Year Ended through
(Unaudited) October 31, 2013 October 31, 2012 October 31, 2011
Net asset value, beginning of period 9.89$ 10.37$ 10.37$ 10.00$
Income from Investment Operations:
Net investment income1 0.15 0.28 0.27 0.19
Net realized and unrealized gain (loss) on investments (0.01) (0.44) (0.07) 0.38
Total from investment operations 0.14 (0.16) 0.20 0.57
Less Distributions:
From net investment income (0.06) (0.24) (0.20) (0.20)
From net realized gain (0.02) (0.08) - -
Total distributions (0.08) (0.32) (0.20) (0.20)
Redemption fee proceeds - 2 - 2 - 2 - 2
Net asset value, end of period 9.95$ 9.89$ 10.37$ 10.37$
Total return3 1.52% 4 (1.53)% 2.02% 5.72% 4
Ratios and Supplemental Data:
Net assets, end of period (in thousands) 74,756$ 86,667$ 88,165$ 80,240$
Ratio of expenses to average net assets:
Before fees waived and expenses absorbed 1.39% 5 1.23% 1.28% 1.36% 5
After fees waived and expenses absorbed 1.15% 5 1.15% 1.15% 1.15% 5
Ratio of net investment income to average net assets:
Before fees waived and expenses absorbed 2.93% 5 2.70% 2.54% 1.73% 5
After fees waived and expenses absorbed 3.17% 5 2.77% 2.67% 1.94% 5
Portfolio turnover rate 25% 4 49% 84% 8% 4
* Commencement of operations.1 Based on average shares outstanding for the period.2
Amount represents less than $0.01 per share.3
4Not annualized.
5Annualized.
EuroPac International
Bond Fund - Class A
Total returns would have been lower had expenses not been waived or absorbed by the Advisor. Returns shown do not reflect the deduction of taxes
that a shareholder would pay on Fund distributions or the redemption of Fund shares. Returns shown do not include payment of sales load of 4.50% of
offering price which is reduced on sales of $50,000 or more. If the sales charge was included total returns would be lower.
See accompanying Notes to Financial Statements.
53

FINANCIAL HIGHLIGHTS
Per share operating performance.
For a capital share outstanding throughout each period.
For the For the period
Six Months Ended July 16, 2013*
April 30, 2014 through
(Unaudited) October 31, 2013
Net asset value, beginning of period 9.91$ 9.73$
Income from Investment Operations:
Net investment income1
0.17 0.10
Net realized and unrealized gain (loss) on investments (0.01) 0.12
Total from investment operations 0.16 0.22
Less Distributions:
From net investment income (0.07) (0.04)
From net realized gain (0.02) -
Total distributions (0.09) (0.04)
Net asset value, end of period 9.98$ 9.91$
Total return21.71% 3 2.28% 3
Ratios and Supplemental Data:
Net assets, end of period (in thousands) 190$ 211$
Ratio of expenses to average net assets:
Before fees waived and expenses absorbed 1.14% 4 1.06% 4
After fees waived and expenses absorbed 0.90% 4 0.90% 4
Ratio of net investment income to average net assets:
Before fees waived and expenses absorbed 3.18% 4 3.32% 4
After fees waived and expenses absorbed 3.42% 4 3.48% 4
Portfolio turnover rate 25% 3 49% 3
* Commencement of operations.1 Based on average shares outstanding for the period.2
3Not annualized.
4Annualized.
EuroPac International
Bond Fund - Class I
Total returns would have been lower had fees not been waived by the Advisor. These returns do not reflect the deduction of taxes
that a shareholder would pay on the Fund distributions or redemption of Fund shares.
See accompanying Notes to Financial Statements.
54
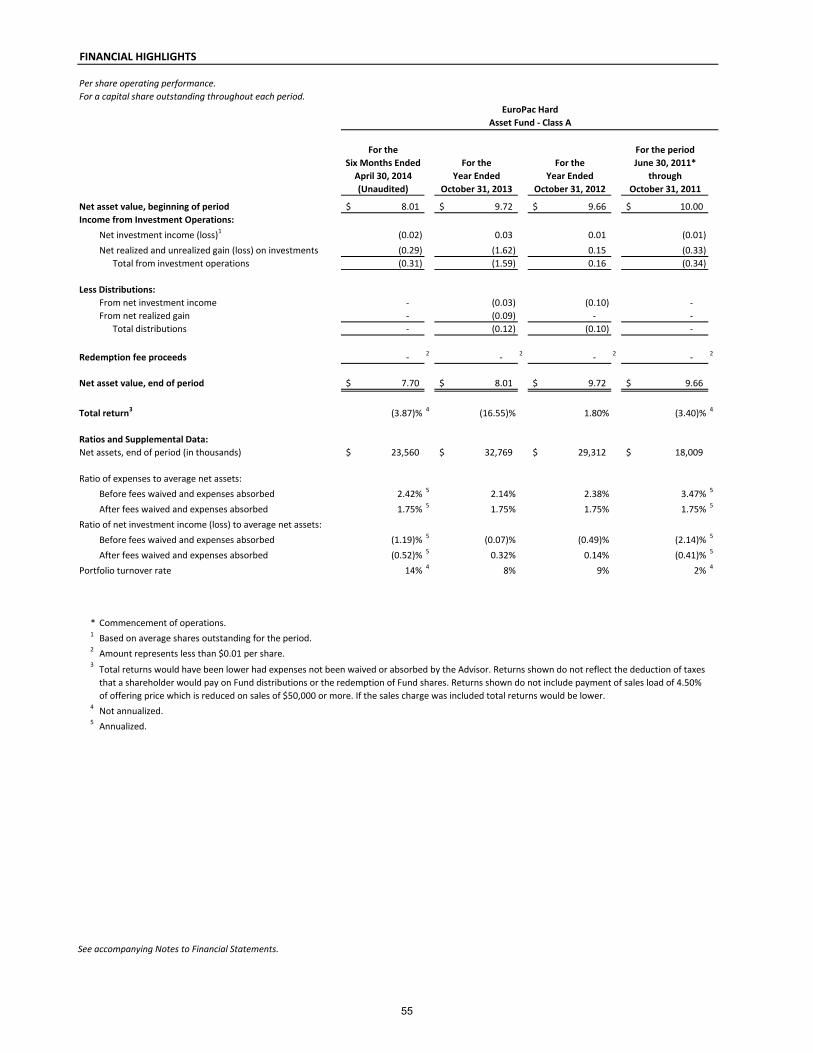
FINANCIAL HIGHLIGHTS
Per share operating performance.
For a capital share outstanding throughout each period.
For the For the period
Six Months Ended For the For the June 30, 2011*
April 30, 2014 Year Ended Year Ended through
(Unaudited) October 31, 2013 October 31, 2012 October 31, 2011
Net asset value, beginning of period 8.01$ 9.72$ 9.66$ 10.00$
Income from Investment Operations:
Net investment income (loss)1 (0.02) 0.03 0.01 (0.01)
Net realized and unrealized gain (loss) on investments (0.29) (1.62) 0.15 (0.33)
Total from investment operations (0.31) (1.59) 0.16 (0.34)
Less Distributions:
From net investment income - (0.03) (0.10) -
From net realized gain - (0.09) - -
Total distributions - (0.12) (0.10) -
Redemption fee proceeds - 2 - 2 - 2 - 2
Net asset value, end of period 7.70$ 8.01$ 9.72$ 9.66$
Total return3 (3.87)% 4 (16.55)% 1.80% (3.40)% 4
Ratios and Supplemental Data:
Net assets, end of period (in thousands) 23,560$ 32,769$ 29,312$ 18,009$
Ratio of expenses to average net assets:
Before fees waived and expenses absorbed 2.42% 5 2.14% 2.38% 3.47% 5
After fees waived and expenses absorbed 1.75% 5 1.75% 1.75% 1.75% 5
Ratio of net investment income (loss) to average net assets:
Before fees waived and expenses absorbed (1.19)% 5 (0.07)% (0.49)% (2.14)% 5
After fees waived and expenses absorbed (0.52)% 5 0.32% 0.14% (0.41)% 5
Portfolio turnover rate 14% 4 8% 9% 2% 4
* Commencement of operations.1 Based on average shares outstanding for the period.2
Amount represents less than $0.01 per share.3
4Not annualized.
5Annualized.
EuroPac Hard
Asset Fund - Class A
Total returns would have been lower had expenses not been waived or absorbed by the Advisor. Returns shown do not reflect the deduction of taxes
that a shareholder would pay on Fund distributions or the redemption of Fund shares. Returns shown do not include payment of sales load of 4.50%
of offering price which is reduced on sales of $50,000 or more. If the sales charge was included total returns would be lower.
See accompanying Notes to Financial Statements.
55

FINANCIAL HIGHLIGHTS
Per share operating performance.
For a capital share outstanding throughout each period.
For the For the period
Six Months Ended July 16, 2013*
April 30, 2014 through
(Unaudited) October 31, 2013
Net asset value, beginning of period 8.02$ 7.67$
Income from Investment Operations:
Net investment income (loss)1(0.01) - 2
Net realized and unrealized gain (loss) on investments (0.29) 0.35
Total from investment operations (0.30) 0.35
Net asset value, end of period 7.72$ 8.02$
Total return3 (3.74)% 4 4.56% 4
Ratios and Supplemental Data:
Net assets, end of period (in thousands) 79$ 1$
Ratio of expenses to average net assets:
Before fees waived and expenses absorbed 2.17% 5 2.10% 5
After fees waived and expenses absorbed 1.50% 5 1.50% 5
Ratio of net investment income (loss) to average net assets:
Before fees waived and expenses absorbed (0.94)% 5 (0.57)% 5
After fees waived and expenses absorbed (0.27)% 5 0.03% 5
Portfolio turnover rate 14% 4 8% 4
* Commencement of operations.1 Based on average shares outstanding for the period.2
Amount represents less than $0.01 per share.3
4Not annualized.
5Annualized.
EuroPac Hard
Asset Fund - Class I
Total returns would have been lower had fees not been waived by the Advisor. These returns do not reflect the deduction of taxes that a
shareholder would pay on the Fund distributions or redemption of Fund shares.
See accompanying Notes to Financial Statements.
56
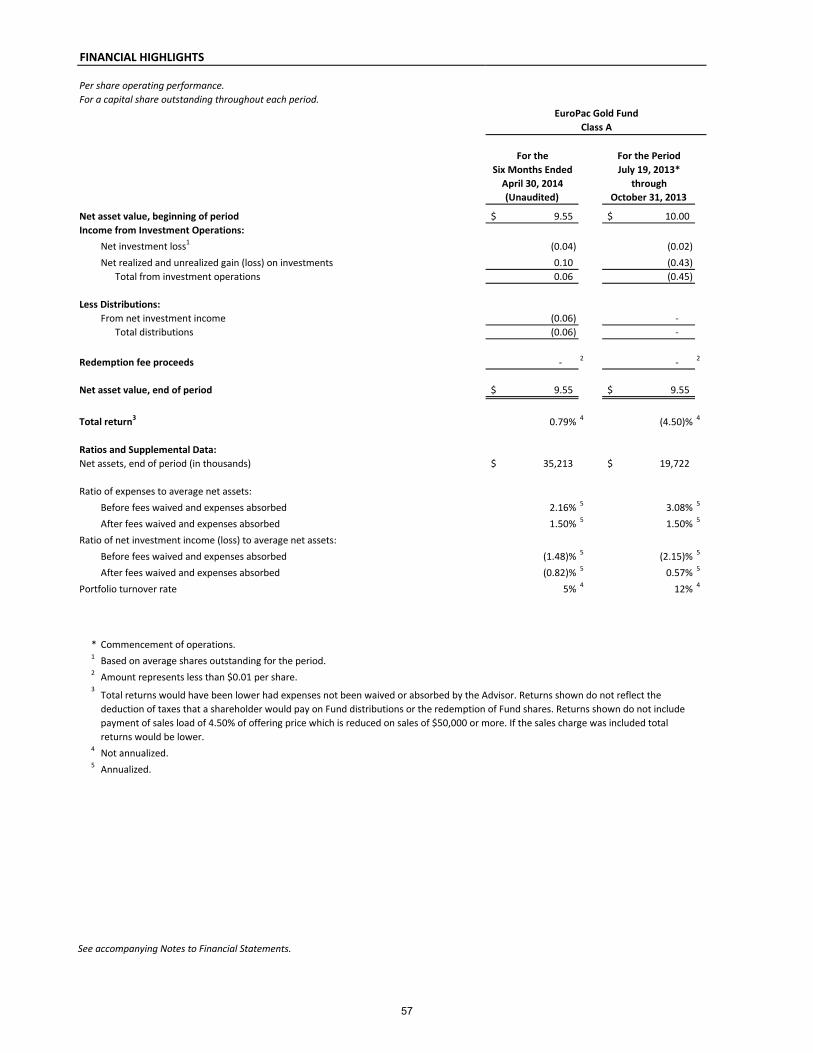
FINANCIAL HIGHLIGHTS
Per share operating performance.
For a capital share outstanding throughout each period.
For the For the Period
Six Months Ended July 19, 2013*
April 30, 2014 through
(Unaudited) October 31, 2013
Net asset value, beginning of period 9.55$ 10.00$
Income from Investment Operations:
Net investment loss1 (0.04) (0.02)
Net realized and unrealized gain (loss) on investments 0.10 (0.43)
Total from investment operations 0.06 (0.45)
Less Distributions:
From net investment income (0.06) -
Total distributions (0.06) -
Redemption fee proceeds - 2 - 2
Net asset value, end of period 9.55$ 9.55$
Total return3 0.79% 4 (4.50)% 4
Ratios and Supplemental Data:
Net assets, end of period (in thousands) 35,213$ 19,722$
Ratio of expenses to average net assets:
Before fees waived and expenses absorbed 2.16% 5 3.08% 5
After fees waived and expenses absorbed 1.50% 5 1.50% 5
Ratio of net investment income (loss) to average net assets:
Before fees waived and expenses absorbed (1.48)% 5 (2.15)% 5
After fees waived and expenses absorbed (0.82)% 5 0.57% 5
Portfolio turnover rate 5% 4 12% 4
* Commencement of operations.1 Based on average shares outstanding for the period.2
Amount represents less than $0.01 per share.3
4Not annualized.
5Annualized.
EuroPac Gold Fund
Class A
Total returns would have been lower had expenses not been waived or absorbed by the Advisor. Returns shown do not reflect the
deduction of taxes that a shareholder would pay on Fund distributions or the redemption of Fund shares. Returns shown do not include
payment of sales load of 4.50% of offering price which is reduced on sales of $50,000 or more. If the sales charge was included total
returns would be lower.
See accompanying Notes to Financial Statements.
57

FINANCIAL HIGHLIGHTS
Per share operating performance.
For a capital share outstanding throughout the period.
EuroPac International
Dividend Income
Fund - Class A
For the Period
January 10, 2014*
through
April 30, 2014
(Unaudited)
Net asset value, beginning of period 10.00$
Income from Investment Operations:
Net investment income1 0.16
Net realized and unrealized gain on investments 0.51
Total from investment operations 0.67
Less Distributions:
From net investment income (0.02)
Total distributions (0.02)
Redemption fee proceeds - 2
Net asset value, end of period 10.65$
Total return3 6.70% 4
Ratios and Supplemental Data:
Net assets, end of period (in thousands) 34,022$
Ratio of expenses to average net assets:
Before fees waived and expenses absorbed 2.58% 5
After fees waived and expenses absorbed 1.50% 5
Ratio of net investment income to average net assets:
Before fees waived and expenses absorbed 4.00% 5
After fees waived and expenses absorbed 5.08% 5
Portfolio turnover rate 9% 4
* Commencement of operations.1 Based on average shares outstanding for the period.2
Amount represents less than $0.01 per share.3
4Not annualized.
5Annualized.
Total returns would have been lower had expenses not been waived or absorbed by the Advisor. Returns shown do not
reflect the deduction of taxes that a shareholder would pay on Fund distributions or the redemption of Fund shares.
Returns shown do not include payment of sales load of 4.50% of offering price which is reduced on sales of $50,000 or
more. If the sales charge was included total returns would be lower.
See accompanying Notes to Financial Statements.
58

FINANCIAL HIGHLIGHTS
Per share operating performance.
For a capital share outstanding throughout the period.
EuroPac International
Dividend Income
Fund - Class I
For the Period
January 10, 2014*
through
April 30, 2014
(Unaudited)
Net asset value, beginning of period 10.00$
Income from Investment Operations:
Net investment income1 0.16
Net realized and unrealized gain on investments 0.51
Total from investment operations 0.67
Less Distributions:
From net investment income (0.02)
Total distributions (0.02)
Net asset value, end of period 10.65$
Total return2 6.73% 3
Ratios and Supplemental Data:
Net assets, end of period (in thousands) 1,917$
Ratio of expenses to average net assets:
Before fees waived and expenses absorbed 2.33% 4
After fees waived and expenses absorbed 1.25% 4
Ratio of net investment income to average net assets:
Before fees waived and expenses absorbed 4.25% 4
After fees waived and expenses absorbed 5.33% 4
Portfolio turnover rate 9% 3
* Commencement of operations.1 Based on average shares outstanding for the period.2
3Not annualized.
4Annualized.
Total returns would have been lower had fees not been waived by the Advisor. These returns do not reflect the deduction
of taxes that a shareholder would pay on the Fund distributions or redemption of Fund shares.
See accompanying Notes to Financial Statements.
59

FINANCIAL HIGHLIGHTS
Per share operating performance.
For a capital share outstanding throughout each period.
For the For the period For the period
Six Months Ended For the For the July 1, 2011 For the July 31, 2009*
April 30, 2014 Year Ended Year Ended through Year Ended through
(Unaudited) October 31, 2013 October 31, 2012 October 31, 2011** June 30, 2011 June 30, 2010
Net asset value, beginning of period 12.34$ 10.29$ 10.43$ 13.57$ 11.34$ 10.00$
Income from Investment Operations:
Net investment income (loss)1 (0.07) 0.06 0.08 0.01 0.10 0.02
Net realized and unrealized gain (loss) on investments (0.04) 2.09 0.41 6 (3.15) 2.36 1.38
Total from investment operations (0.11) 2.15 0.49 (3.14) 2.46 1.40
Less Distributions:
From net investment income (0.06) (0.10) (0.01) - (0.22) -
From net realized gain - - (0.62) - (0.01) (0.06)
Total distributions (0.06) (0.10) (0.63) - (0.23) (0.06)
Redemption fee proceeds - 2 - 2 - 2 - 2 - 2 - 2
Net asset value, end of period 12.17$ 12.34$ 10.29$ 10.43$ 13.57$ 11.34$
Total return3 (0.87)% 4 21.01% 5.45% (23.14)% 4 21.55% 13.93% 4
Ratios and Supplemental Data:
Net assets, end of period (in thousands) 37,228$ 40,532$ 38,755$ 52,407$ 86,352$ 58,765$
Ratio of expenses to average net assets:
Before fees waived and expenses absorbed 2.17% 5 2.14% 2.18% 2.00% 5 1.91% 2.18% 5
After fees waived and expenses absorbed 1.75% 5 1.75% 1.75% 1.74% 5 1.75% 1.75% 5
Ratio of net investment income (loss) to average net assets:
Before fees waived and expenses absorbed (1.56)% 5 0.16% 0.39% (0.01)% 5 0.56% 0.20% 5
After fees waived and expenses absorbed (1.14)% 5 0.55% 0.82% 0.25% 5 0.72% 0.63% 5
Portfolio turnover rate 20% 4 47% 90% 48% 4 77% 80% 4
* Commencement of operations.
** Fiscal year changed to October 31, effective July 1, 2011.1 Based on average shares outstanding for the period.2
Amount represents less than $0.01 per share.3
4Not annualized.
5Annualized.
6
Total returns would have been lower had expenses not been waived or absorbed by the Advisor. Returns shown do not reflect the deduction of taxes that a shareholder would pay
on Fund distributions or the redemption of Fund shares. Returns shown do not include payment of sales load of 4.50% of offering price which is reduced on sales of $50,000 or
more. If the sales charge was included total returns would be lower.
The Advisor reimbursed the Fund $21,698 for losses on a transaction not meeting the investment guidelines of the Fund. As of November 30, 2012, the reimbursement amount
represents $0.006 per share. This reimbursement had no impact to the Fund's total return.
Fund - Class A
EP China
See accompanying Notes to Financial Statements.
60

FINANCIAL HIGHLIGHTS
Per share operating performance.
For a capital share outstanding throughout each period.
For the For the Period
Six Months Ended For the For the December 1, 2010*
April 30, 2014 Year Ended Year Ended through
(Unaudited) October 31, 2013 October 31, 2012 October 31, 2011
Net asset value, beginning of period 12.30$ 10.67$ 8.35$ 10.00$
Income from Investment Operations:
Net investment income (loss)1 (0.03) 0.01 0.04 0.08
Net realized and unrealized gain (loss) on investments 0.94 1.78 2.32 6 (1.73)
Total from investment operations 0.91 1.79 2.36 (1.65)
Less Distributions:
From net investment income - (0.16) (0.04) -
Total distributions - (0.16) (0.04) -
Redemption fee proceeds - 2 - 2 - 2 - 2
Net asset value, end of period 13.21$ 12.30$ 10.67$ 8.35$
Total return3 7.40% 4 16.92% 28.40% (16.50)% 4
Ratios and Supplemental Data:
Net assets, end of period (in thousands) 35,435$ 34,465$ 27,252$ 26,900$
Ratio of expenses to average net assets:
Before fees waived and expenses absorbed 2.39% 5 2.24% 2.54% 2.34% 5
After fees waived and expenses absorbed 1.75% 5 1.75% 1.75% 1.75% 5
Ratio of net investment income (loss) to average net assets:
Before fees waived and expenses absorbed (1.07)% 5 (0.45)% (0.36)% 0.33% 5
After fees waived and expenses absorbed (0.43)% 5 0.04% 0.43% 0.92% 5
Portfolio turnover rate 43% 4 101% 84% 102% 4
* Commencement of operations.1 Based on average shares outstanding for the period.2
Amount represents less than $0.01 per share.3
4Not annualized.
5Annualized.
6
Total returns would have been lower had expenses not been waived or absorbed by the Advisor. Returns shown do not reflect the deduction of taxes
that a shareholder would pay on Fund distributions or the redemption of Fund shares. Returns shown do not include payment of sales load of 4.50%
of offering price which is reduced on sales of $50,000 or more. If the sales charge was included total returns would be lower.
Companies Fund - Class A
EP Asia Small
The Advisor reimbursed the Fund $5,753 for losses on a transaction not meeting the investment guidelines of the Fund. As of November 30, 2012, the
reimbursement amount represents $0.002 per share. This reimbursement had no impact to the Fund's total return.
See accompanying Notes to Financial Statements.
61
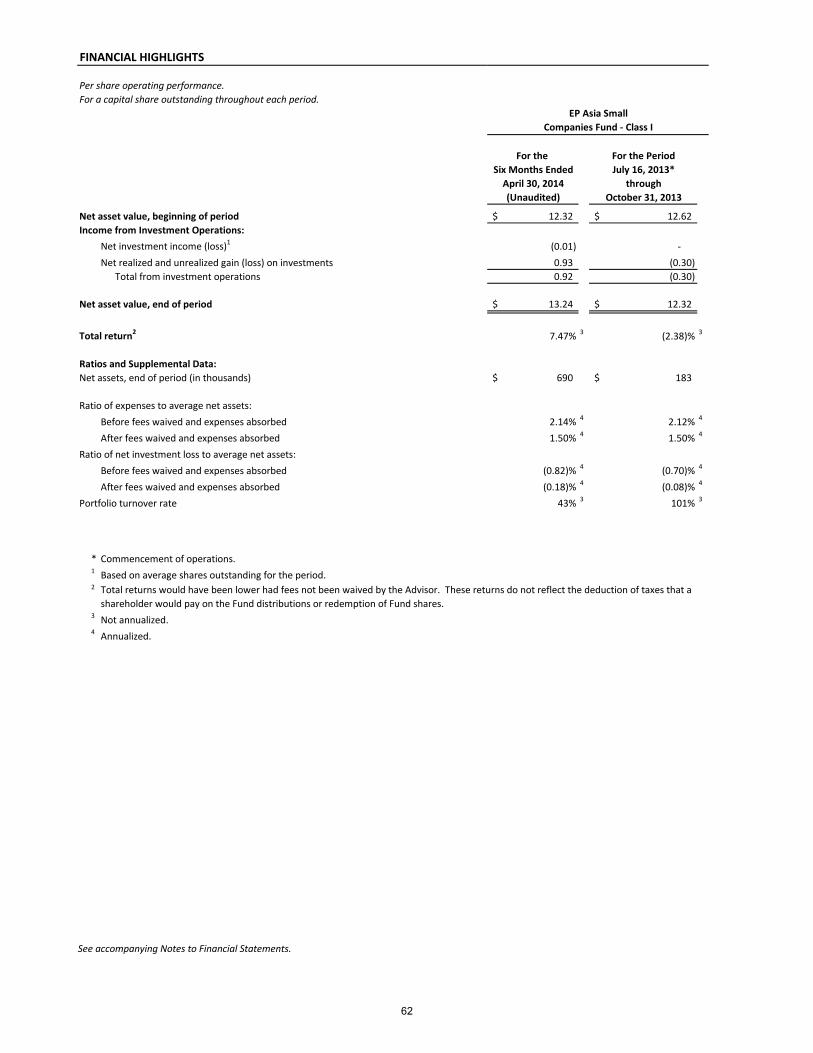
FINANCIAL HIGHLIGHTS
Per share operating performance.
For a capital share outstanding throughout each period.
For the For the Period
Six Months Ended July 16, 2013*
April 30, 2014 through
(Unaudited) October 31, 2013
Net asset value, beginning of period 12.32$ 12.62$
Income from Investment Operations:
Net investment income (loss)1 (0.01) -
Net realized and unrealized gain (loss) on investments 0.93 (0.30)
Total from investment operations 0.92 (0.30)
Net asset value, end of period 13.24$ 12.32$
Total return27.47% 3 (2.38)% 3
Ratios and Supplemental Data:
Net assets, end of period (in thousands) 690$ 183$
Ratio of expenses to average net assets:
Before fees waived and expenses absorbed 2.14% 4 2.12% 4
After fees waived and expenses absorbed 1.50% 4 1.50% 4
Ratio of net investment loss to average net assets:
Before fees waived and expenses absorbed (0.82)% 4 (0.70)% 4
After fees waived and expenses absorbed (0.18)% 4 (0.08)% 4
Portfolio turnover rate 43% 3 101% 3
* Commencement of operations.1 Based on average shares outstanding for the period.2
3Not annualized.
4Annualized.
Total returns would have been lower had fees not been waived by the Advisor. These returns do not reflect the deduction of taxes that a
shareholder would pay on the Fund distributions or redemption of Fund shares.
EP Asia Small
Companies Fund - Class I
See accompanying Notes to Financial Statements.
62
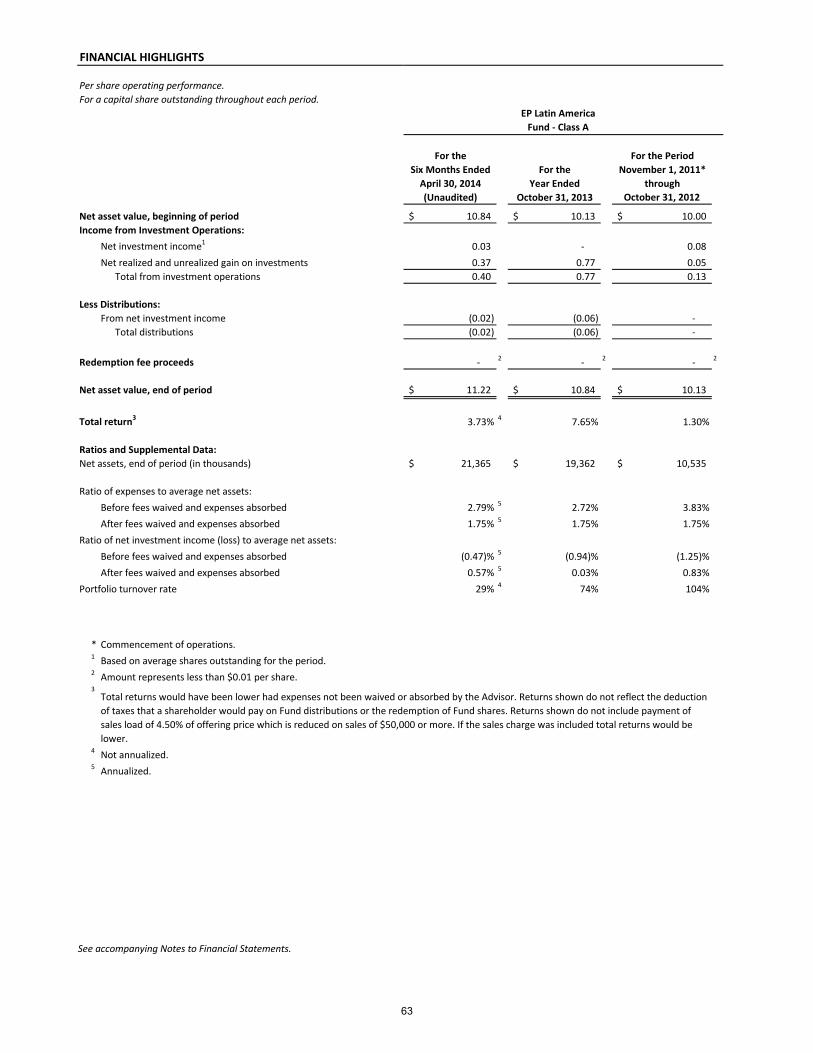
FINANCIAL HIGHLIGHTS
Per share operating performance.
For a capital share outstanding throughout each period.
For the For the Period
Six Months Ended For the November 1, 2011*
April 30, 2014 Year Ended through
(Unaudited) October 31, 2013 October 31, 2012
Net asset value, beginning of period 10.84$ 10.13$ 10.00$
Income from Investment Operations:
Net investment income1 0.03 - 0.08
Net realized and unrealized gain on investments 0.37 0.77 0.05
Total from investment operations 0.40 0.77 0.13
Less Distributions:
From net investment income (0.02) (0.06) -
Total distributions (0.02) (0.06) -
Redemption fee proceeds - 2 - 2 - 2
Net asset value, end of period 11.22$ 10.84$ 10.13$
Total return3 3.73% 4 7.65% 1.30%
Ratios and Supplemental Data:
Net assets, end of period (in thousands) 21,365$ 19,362$ 10,535$
Ratio of expenses to average net assets:
Before fees waived and expenses absorbed 2.79% 5 2.72% 3.83%
After fees waived and expenses absorbed 1.75% 5 1.75% 1.75%
Ratio of net investment income (loss) to average net assets:
Before fees waived and expenses absorbed (0.47)% 5 (0.94)% (1.25)%
After fees waived and expenses absorbed 0.57% 5 0.03% 0.83%
Portfolio turnover rate 29% 4 74% 104%
* Commencement of operations.1 Based on average shares outstanding for the period.2
Amount represents less than $0.01 per share.3
4Not annualized.
5Annualized.
Total returns would have been lower had expenses not been waived or absorbed by the Advisor. Returns shown do not reflect the deduction
of taxes that a shareholder would pay on Fund distributions or the redemption of Fund shares. Returns shown do not include payment of
sales load of 4.50% of offering price which is reduced on sales of $50,000 or more. If the sales charge was included total returns would be
lower.
EP Latin America
Fund - Class A
See accompanying Notes to Financial Statements.
63
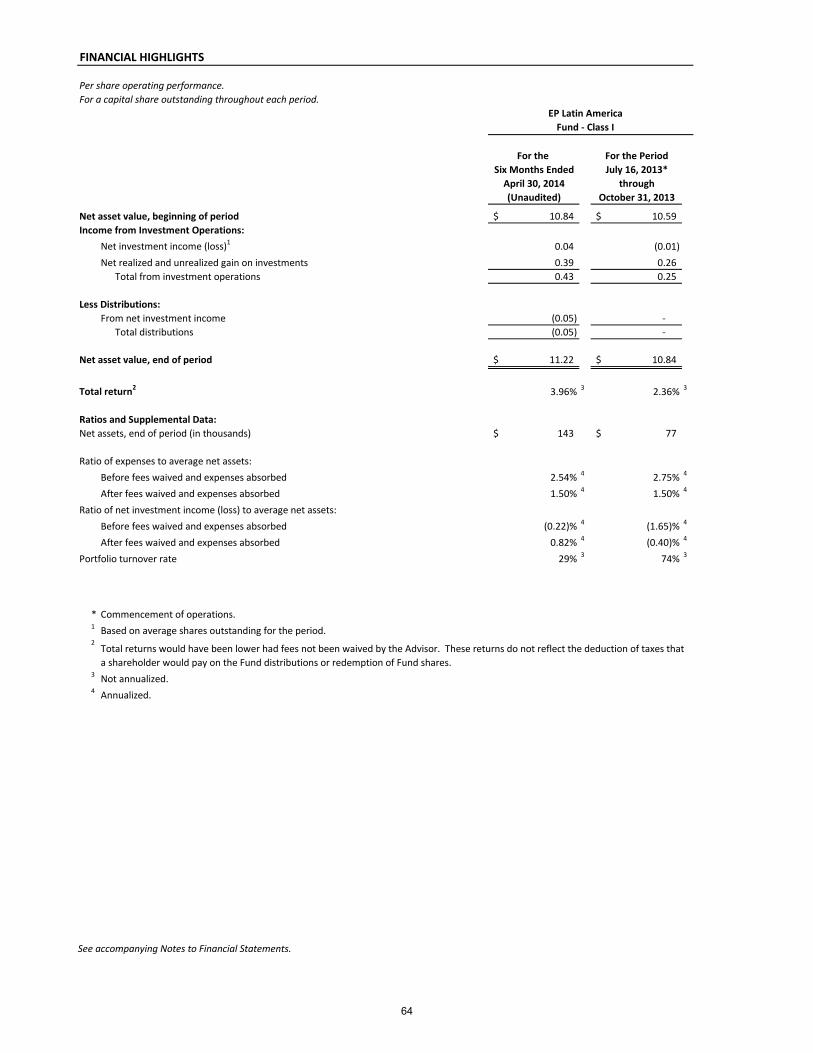
FINANCIAL HIGHLIGHTS
Per share operating performance.
For a capital share outstanding throughout each period.
For the For the Period
Six Months Ended July 16, 2013*
April 30, 2014 through
(Unaudited) October 31, 2013
Net asset value, beginning of period 10.84$ 10.59$
Income from Investment Operations:
Net investment income (loss)1 0.04 (0.01)
Net realized and unrealized gain on investments 0.39 0.26
Total from investment operations 0.43 0.25
Less Distributions:
From net investment income (0.05) -
Total distributions (0.05) -
Net asset value, end of period 11.22$ 10.84$
Total return2 3.96% 3 2.36% 3
Ratios and Supplemental Data:
Net assets, end of period (in thousands) 143$ 77$
Ratio of expenses to average net assets:
Before fees waived and expenses absorbed 2.54% 4 2.75% 4
After fees waived and expenses absorbed 1.50% 4 1.50% 4
Ratio of net investment income (loss) to average net assets:
Before fees waived and expenses absorbed (0.22)% 4 (1.65)% 4
After fees waived and expenses absorbed 0.82% 4 (0.40)% 4
Portfolio turnover rate 29% 3 74% 3
* Commencement of operations.1 Based on average shares outstanding for the period.2
3Not annualized.
4Annualized.
Total returns would have been lower had fees not been waived by the Advisor. These returns do not reflect the deduction of taxes that
a shareholder would pay on the Fund distributions or redemption of Fund shares.
EP Latin America
Fund - Class I
See accompanying Notes to Financial Statements.
64
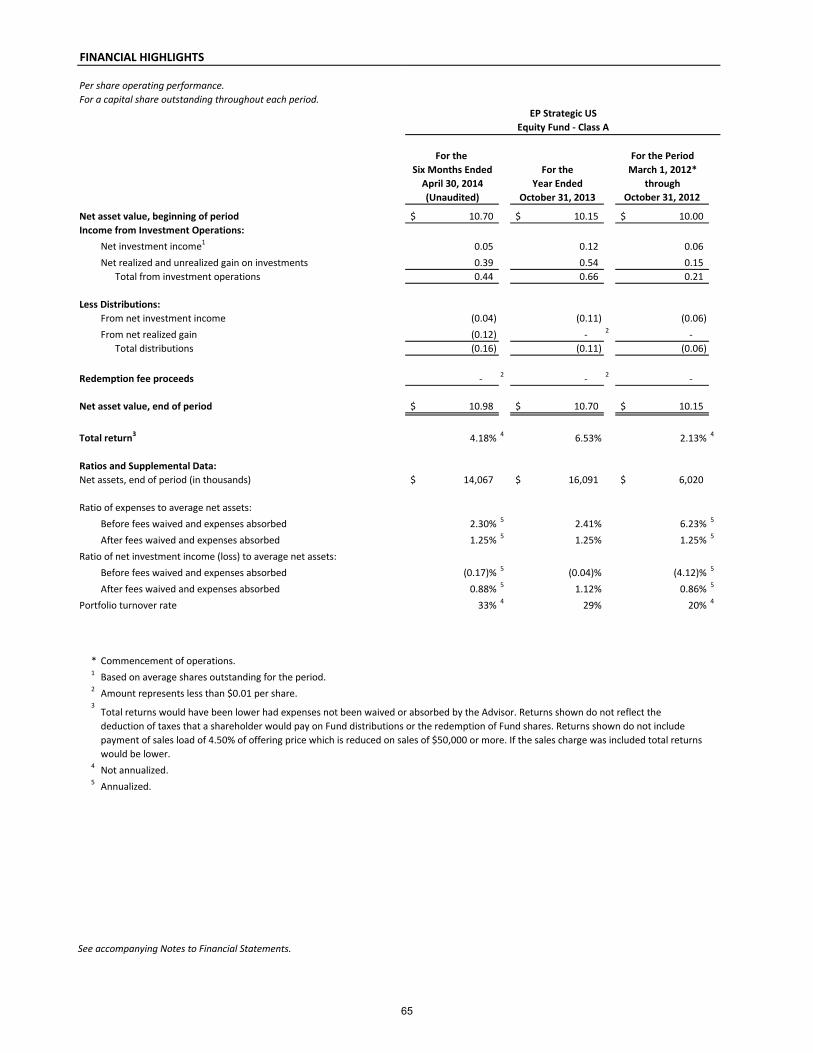
FINANCIAL HIGHLIGHTS
Per share operating performance.
For a capital share outstanding throughout each period.
For the For the Period
Six Months Ended For the March 1, 2012*
April 30, 2014 Year Ended through
(Unaudited) October 31, 2013 October 31, 2012
Net asset value, beginning of period 10.70$ 10.15$ 10.00$
Income from Investment Operations:
Net investment income1 0.05 0.12 0.06
Net realized and unrealized gain on investments 0.39 0.54 0.15
Total from investment operations 0.44 0.66 0.21
Less Distributions:
From net investment income (0.04) (0.11) (0.06)
From net realized gain (0.12) - 2 -
Total distributions (0.16) (0.11) (0.06)
Redemption fee proceeds - 2 - 2 -
Net asset value, end of period 10.98$ 10.70$ 10.15$
Total return3 4.18% 4 6.53% 2.13% 4
Ratios and Supplemental Data:
Net assets, end of period (in thousands) 14,067$ 16,091$ 6,020$
Ratio of expenses to average net assets:
Before fees waived and expenses absorbed 2.30% 5 2.41% 6.23% 5
After fees waived and expenses absorbed 1.25% 5 1.25% 1.25% 5
Ratio of net investment income (loss) to average net assets:
Before fees waived and expenses absorbed (0.17)% 5 (0.04)% (4.12)% 5
After fees waived and expenses absorbed 0.88% 5 1.12% 0.86% 5
Portfolio turnover rate 33% 4 29% 20% 4
* Commencement of operations.1 Based on average shares outstanding for the period.2
Amount represents less than $0.01 per share.3
4Not annualized.
5Annualized.
EP Strategic US
Equity Fund - Class A
Total returns would have been lower had expenses not been waived or absorbed by the Advisor. Returns shown do not reflect the
deduction of taxes that a shareholder would pay on Fund distributions or the redemption of Fund shares. Returns shown do not include
payment of sales load of 4.50% of offering price which is reduced on sales of $50,000 or more. If the sales charge was included total returns
would be lower.
See accompanying Notes to Financial Statements.
65
Euro Pacific Funds NOTES TO FINANCIAL STATEMENTS April 30, 2014 (Unaudited)
Note 1 – Organization EuroPac International Value Fund (the ‘‘International Value Fund’’), EuroPac International Bond Fund (the “International Bond Fund”), EuroPac Hard Asset Fund (the “Hard Asset Fund”), EuroPac Gold Fund (the “Gold Fund”), EuroPac International Dividend Income Fund (the “International Dividend Income Fund”), EP China Fund (formerly known as EPH China Fund) (the “China Fund”), EP Asia Small Companies Fund (the “Asia Small Companies Fund”), EP Latin America Fund (the “Latin America Fund”), and EP Strategic US Equity Fund (the “Strategic US Equity Fund”) (each a “Fund” and collectively the ‘‘Funds’’) are organized as a diversified series of Investment Managers Series Trust, a Delaware statutory trust (the “Trust”) which is registered as an open-end management investment company under the Investment Company Act of 1940, as amended (the “1940 Act”). The International Value Fund commenced operations on April 7, 2010, and its primary investment objective is to provide income and long-term capital appreciation. The International Bond Fund commenced operations on November 15, 2010, and its primary investment objective is to provide current income and capital appreciation. The Hard Asset Fund commenced operations on June 30, 2011, and its primary investment objective is appreciation of capital and protection against inflation. The Gold Fund commenced operations on July 19, 2013, and its primary investment objective is to provide long-term capital appreciation. The International Dividend Income Fund commenced operations on January 10, 2014, and its primary investment objective is to seek income and maximize growth of income. The China Fund commenced operations on July 31, 2009, and its primary investment objective is long-term capital appreciation. The China Fund’s fiscal year end was changed to October 31
st as of July 1, 2011. The Asia
Small Companies Fund commenced operations on December 1, 2010, and its primary investment objective is to provide long-term capital appreciation. The Latin America Fund commenced operations on November 1, 2011, and its primary investment objective is to provide long-term capital appreciation. The Strategic US Equity Fund commenced operations on March 1, 2012, and its primary investment objective is to provide long-term capital appreciation. The Gold Fund, China Fund and Strategic US Equity Fund, are authorized to issue Class A shares. The International Value Fund, International Bond Fund, Hard Asset Fund, International Dividend Income Fund, Asia Small Companies Fund and Latin America Fund are authorized to issue two classes of shares: Class A shares and Class I shares. The Class I shares commenced operations on July 16, 2013 in the International Value Fund, International Bond Fund, Hard Asset Fund, Asia Small Companies Fund and Latin America Fund. The shares of each class represent an interest in the same portfolio of investments of the Fund and have equal rights as to voting, redemptions, dividends and liquidation, subject to the approval of the Trustees. Income, expenses (other than expenses attributable to a specific class) and realized and unrealized gains and losses on investments are allocated to each class of shares in proportion to their relative shares outstanding. Shareholders of a class that bears distribution and service expenses under the terms of a distribution plan have exclusive voting rights to that distribution plan. Note 2 – Accounting Policies The following is a summary of the significant accounting policies consistently followed by the Funds in the preparation of their financial statements. The preparation of financial statements in conformity with accounting principles generally accepted in the United States of America (“GAAP”) requires management to make estimates and assumptions that affect the reported amounts and disclosures in the financial statements. Actual results could differ from these estimates. (a) Valuation of Investments The Funds value equity securities at the last reported sale price on the principal exchange or in the principal over the counter (“OTC”) market in which such securities are traded, as of the close of regular trading on the NYSE on the day the securities are being valued or, if there are no sales, at the mean between the last available bid and asked prices on that day. Securities traded on the NASDAQ are valued at the NASDAQ Official Closing Price (“NOCP”). Debt securities are valued at the mean between the last available bid and asked prices for such
66

Euro Pacific Funds NOTES TO FINANCIAL STATEMENTS – Continued April 30, 2014 (Unaudited)
securities, or if such prices are not available, at prices for securities of comparable maturity, quality and type. All other types of securities, including restricted securities and securities for which market quotations are not readily available, are valued at fair value as determined in accordance with procedures established in good faith by the Board of Trustees. Short-term securities with remaining maturities of sixty days or less are valued at amortized cost, which approximates market value. Fair value pricing may be applied to foreign securities held by the Funds upon the occurrence of an event after the close of trading on non-U.S. markets but before the close of trading on the NYSE when each Fund’s NAV is determined. If the event may result in a material adjustment to the price of the Fund’s foreign securities once non-U.S. markets open on the following business day (such as, for example, a significant surge or decline in the U.S. market), the Fund may value such foreign securities at fair value, taking into account the effect of such event, in order to calculate the Fund’s NAV. Other types of portfolio securities that the Fund may fair value include, but are not limited to: (1) investments that are illiquid or traded infrequently, including “restricted” securities and private placements for which there is no public market; (2) investments for which, in the judgment of the Advisor, the market price is stale; (3) securities of an issuer that has entered into a restructuring; (4) securities for which trading has been halted or suspended; and (5) fixed income securities for which there is not a current market value quotation. A Fund’s assets are valued at their fair market value. If a market quotation is not readily available for a portfolio security, the security will be valued at fair value (the amount which the Fund might reasonably expect to receive for the security upon its current sale) as determined in good faith by the Fund’s advisor, subject to review and approval by the Valuation Committee, pursuant to procedures adopted by the Board of Trustees. The actions of the Valuation Committee are subsequently reviewed by the Board at its next regularly scheduled board meeting. The Valuation Committee meets as needed. The Valuation Committee is comprised of all the Trustees but action may be taken by any one of the Trustees.
Foreign securities traded in countries outside the U.S. are fair valued by utilizing the quotations of an independent pricing service or from a brokerage firm. The pricing service or broker will use a statistical analyses and quantitative models to adjust local prices using factors such as subsequent movement and changes in the prices of indexes, securities and exchange rates in other markets in determining fair value as of the time the Fund calculates the NAVs. The Board reviews the independent third party fair valuation analysis report quarterly.
(b) Investment Transactions, Investment Income and Expenses Investment transactions are accounted for on trade date. Realized gains and losses on investments are determined on the identified cost basis. Dividend income is recorded net of applicable withholding taxes on the ex-dividend date and interest income is recorded on an accrual basis. Withholding taxes on foreign dividends have been provided for in accordance with the Funds’ understanding of the applicable country’s tax rules and rates. Discounts or premiums on debt securities are accreted or amortized to interest income over the lives of the respective securities using the effective interest method. Expenses incurred by the Trust with respect to more than one fund are allocated in proportion to the net assets of each fund except where allocation of direct expenses to each Fund or an alternative allocation method can be more appropriately made. The Gold Fund incurred offering costs of approximately $45,506 which are being amortized over a one-year period from July 19, 2013 (commencement of operations). The International Dividend Income Fund incurred offering costs of approximately $30,507 which are being amortized over a one-year period from January 10, 2014 (commencement of operations).
67
Euro Pacific Funds NOTES TO FINANCIAL STATEMENTS – Continued April 30, 2014 (Unaudited)
(c) Foreign Currency Translation The Funds’ records are maintained in U.S. dollars. The value of securities, currencies and other assets and liabilities denominated in currencies other than U.S. dollars are translated into U.S. dollars based upon foreign exchange rates prevailing at the end of the reporting period. The currencies are translated into U.S. dollars by using the exchange rates quoted at the close of the London Stock Exchange prior to when the Funds’ NAV is next determined. Purchases and sales of investment securities, income and expenses are translated on the respective dates of such transactions. The Funds do not isolate that portion of its net realized and unrealized gains and losses on investments resulting from changes in foreign exchange rates from the impact arising from changes in market prices. Such fluctuations are included with net realized and unrealized gain or loss from investments and foreign currency. Net realized foreign currency transaction gains and losses arise from sales of foreign currencies, currency gains or losses realized between the trade and settlement dates on securities transactions, and the differences between the amounts of dividends, interest, and foreign withholding taxes recorded on the Funds’ books and the U.S. dollar equivalent of the amounts actually received or paid. Net unrealized foreign currency translation gains and losses arise from changes in the value of assets and liabilities, other than investments in securities, resulting from changes in the exchange rates. (d) Federal Income Taxes The Funds intend to comply with the requirements of Subchapter M of the Internal Revenue Code applicable to regulated investment companies and to distribute substantially all of its net investment income and any net realized gains to its shareholders. Therefore, no provision is made for federal income or excise taxes. Due to the timing of dividend distributions and the differences in accounting for income and realized gains and losses for financial statement and federal income tax purposes, the fiscal year in which amounts are distributed may differ from the year in which the income and realized gains and losses are recorded by the Funds.
Accounting for Uncertainty in Income Taxes (the “Income Tax Statement”) requires an evaluation of tax positions taken (or expected to be taken) in the course of preparing a Fund’s tax returns to determine whether these positions meet a “more-likely-than-not” standard that, based on the technical merits, have a more than fifty percent likelihood of being sustained by a taxing authority upon examination. A tax position that meets the “more-likely-than-not” recognition threshold is measured to determine the amount of benefit to recognize in the financial statements. The Funds recognize interest and penalties, if any, related to unrecognized tax benefits as income tax expense in the Statements of Operations.
The Income Tax Statement requires management of the Fund to analyze tax positions taken in the prior three open tax years, if any, and tax positions expected to be taken in the Fund’s current tax year, as defined by the IRS statute of limitations for all major jurisdictions, including federal tax authorities and certain state tax authorities. As of and during the six months ended April 30, 2014, the Funds did not have a liability for any unrecognized tax benefits. The Funds have no examination in progress and are not aware of any tax positions for which they are reasonably possible that the total amounts of unrecognized tax benefits will significantly change in the next twelve months.
(e) Distributions to Shareholders The International Value Fund, International Bond Fund, Hard Asset Fund, Gold Fund, International Dividend Income Fund, China Fund, Asia Small Companies Fund, Latin America Fund and Strategic US Equity Fund, will make distributions of net investment income, per the table below and capital gains, if any, at least annually. Distributions to shareholders are recorded on the ex-dividend date. The amount and timing of distributions are determined in accordance with federal income tax regulations, which may differ from GAAP.
68
Euro Pacific Funds NOTES TO FINANCIAL STATEMENTS – Continued April 30, 2014 (Unaudited)
Distribution Frequency of
Net Investment Income
International Value Fund Quarterly
International Bond Fund Monthly
Hard Asset Fund Quarterly
Gold Fund Annually
International Dividend Income Fund Quarterly
China Fund Annually
Asia Small Companies Fund Annually
Latin America Fund Annually
Strategic US Equity Fund Quarterly
The character of distributions made during the year from net investment income or net realized gains may differ from the characterization for federal income tax purposes due to differences in the recognition of income, expense and gain (loss) items for financial statement and tax purposes. Where appropriate, reclassifications between net asset accounts are made for such differences that are permanent in nature. (f) Options
The Funds’ may write or purchase options contracts primarily to enhance each Fund’s returns and reduce volatility. In addition, the Funds may utilize options in an attempt to generate gains from option premiums or to reduce overall portfolio risk. When a Fund writes or purchases an option, an amount equal to the premium received or paid by the Fund is recorded as a liability or an asset and is subsequently adjusted to the current market value of the option written or purchased. Premiums received or paid from writing or purchasing options which expire unexercised are treated by the Fund on the expiration date as realized gains or losses. The difference between the premium and the amount paid or received on effecting a closing purchase or sale transaction, including brokerage commissions, is also treated as a realized gain or loss. If an option is exercised, the premium paid or received is added to the cost of the purchase or proceeds from the sale in determining whether the Fund has realized a gain or a loss on investment transactions. The Fund, as a writer of an option, may have no control over whether the underlying securities may be sold (call) or purchased (put) and as a result bears the market risk of an unfavorable change in the price of the security underlying the written option. The Fund, as a purchaser of an option, bears the risk that the counterparties to the option may not have the ability to meet the terms of the option contracts. Transactions in option contracts written for the six months ended April 30, 2014 in the EuroPac Gold Fund were as follows:
Number of Contracts
Contracts
Premiums Received
Received Outstanding at October 31, 2013 - $ -
Options written 1,386 60,630
Options terminated in closing purchasing transactions (40) (1,148)
Options expired (520) (30,169)
Options exercised (426) (11,929) Outstanding at April 30, 2014 400 $ 17,384
69

Euro Pacific Funds NOTES TO FINANCIAL STATEMENTS – Continued April 30, 2014 (Unaudited)
Note 3 – Investment Advisory and Other Agreements The Trust, on behalf of the Funds, entered into an Investment Advisory Agreement (the “Agreement”) with Euro Pacific Asset Management, LLC (the “Advisor”). Under the terms of the Agreement, the Funds pay a monthly investment advisory fee to the Advisor. The annual rates are listed by Fund in the table below. The Advisor has contractually agreed to waive its fees and, if necessary, to absorb other expenses (excluding any acquired fund fees and expenses as determined in accordance with Form N-1A, leverage interest, taxes, dividend expenses on short positions, brokerage commissions and expenses incurred in connection with any merger or reorganization, or extraordinary expenses such as litigation expenses) in order to limit total annual operating expenses of each fund until March 1, 2015. The table below contains the expense cap by Fund and by Class.
Investment Total Limit on Annual Total Limit on Annual
Advisory Operating Expenses Operating Expenses
Fees Class A Shares† Class I Shares†
International Value Fund 1.08% 1.75% 1.50%
International Bond Fund 0.60% 1.15% 0.90%
Hard Asset Fund 1.08% 1.75% 1.50%
Gold Fund 0.80% 1.50% -
International Dividend Income Fund 0.85% 1.50% 1.25%
China Fund 1.08% 1.75% -
Asia Small Companies Fund 1.08% 1.75% 1.50%
Latin America Fund 1.08% 1.75% 1.50%
Strategic US Equity Fund 0.75% 1.25% -
†The total limit on annual operating expenses is calculated based on each Fund’s average daily net assets.
Effective March 15, 2011, the Trust, on behalf of the China Fund, entered into an Investment Advisory Agreement (the “Agreement”) with Euro Pacific Asset Management, LLC (the “Advisor”). Under the terms of the Agreement, the Fund pays a monthly investment advisory fee to the Advisor at the annual rate of 1.08% of the Fund’s average daily net assets. Prior to March 15, 2011, the Fund’s investment advisor was Euro Pacific Halter Asia Management, Inc.
For the period July 1, 2010 through March 14, 2011, the China Fund paid advisory fees in the amount of $635,809 to Euro Pacific Halter Asia Management, Inc. and $303,365 to Euro Pacific Asset Management, LLC for the period March 15, 2011 through June 30, 2011.
The China Fund, Asia Small Companies Fund and Latin America Fund are sub-advised by New Sheridan Advisors, Inc. (the “Sub-advisor”). Pursuant to a sub-advisory agreement the Advisor pays a portion of the annual advisory fee of 1.08% of average daily net assets of the Fund to the Sub-advisor.
The Gold Fund is sub-advised by Global Strategic Management, d/b/a Adrian Day Asset Management (the “Sub-advisor”). Pursuant to a sub-advisory agreement the Advisor pays a portion of the annual advisory fee of 0.80% of average net assets of the Fund to the Sub-advisor.
70

Euro Pacific Funds NOTES TO FINANCIAL STATEMENTS – Continued April 30, 2014 (Unaudited)
For the six months ended April 30, 2014, the Advisor waived fees and absorbed other expenses as follows:
Advisory fees
Other expenses Total
International Value Fund $ 56,378 $ - $ 56,378 International Bond Fund 94,472 - 94,472 Hard Asset Fund 91,754 - 91,754 Gold Fund 88,244 - 88,244 International Dividend Income Fund (January 10, 2014 – April 30, 2014) 57,264 15,832 73,096 China Fund 82,753 - 82,753 Asia Small Companies Fund 109,006 - 109,006 Latin America Fund 103,519 - 103,519 Strategic US Equity Fund 57,449 22,559 80,008
$ 740,839 $ 38,391 $779,230
The Advisor may recover from each Fund’s fees and/or expenses previously waived and/or absorbed, if the Fund’s expense ratio, including the recovered expenses, falls below the expense limit at which they were waived. The Advisor is permitted to seek reimbursement from each Fund for a period of three fiscal years following the fiscal year in which such reimbursements occurred. The Advisor may recapture all or a portion of the amounts no later than the dates stated below: International
Value Fund International
Bond Fund Hard Asset
Fund Gold Fund
International Dividend Income Fund
October 31, 2014 $ 95,974 $ 95,046 $ 77,697 $ - $ - October 31, 2015 117,848 109,368 132,344 - - October 31, 2016 55,560 71,464 123,144 63,135 - October 31, 2017 56,378 94,472 91,754 88,244 73,096
Total $ 325,760 $ 370,350 $ 424,939 $ 151,379 $ 73,096
Asia Small Latin America Strategic US
China Fund‡ Companies Fund Fund Equity Fund June 30, 2014 $ 128,421 $ - $ - $ - October 31, 2014 59,642 142,239 - - October 31, 2015 190,733 208,947 152,559 87,136 October 31, 2016 154,764 167,862 160,072 136,798 October 31, 2017 82,753 109,006 103,519 80,008
Total $ 616,313 $ 628,054 $ 416,150 $ 303,942
‡The China Fund’s fiscal year end was changed to October 31st
as of July 1, 2011.
IMST Distributors, LLC serves as the Funds’ distributor; UMB Fund Services, Inc. (“UMBFS”) serves as the Funds’ fund accountant, transfer agent and co-administrator; and Mutual Fund Administration Corporation (“MFAC”) serves as the Funds’ other co-administrator. UMB Bank, N.A., an affiliate of UMBFS, serves as the Funds’ custodian. Certain trustees and officers of the Trust are employees of UMBFS or MFAC. The Funds do not compensate trustees and officers affiliated with the Funds’ co-administrators. For the six months ended April 30, 2014, the Funds’ allocated fees incurred for Trustees who are not affiliated with the Funds’ co-administrators are reported on the Statements of Operations.
71

Euro Pacific Funds NOTES TO FINANCIAL STATEMENTS – Continued April 30, 2014 (Unaudited)
Cipperman & Co. provides Chief Compliance Officer (“CCO”) services to the Trust. The Funds’ allocated fees incurred for CCO services for the six months ended April 30, 2014, are reported on the Statements of Operations. Note 4 – Federal Income Taxes At April 30, 2014, gross unrealized appreciation and depreciation of investments owned by the Funds, based on cost for federal income tax purposes were as follows:
International Value Fund
International Bond Fund
Hard Asset Fund Gold Fund
International Dividend
Income Fund
Cost of investments $ 73,114,888 $ 77,049,095 $ 28,362,107 $ 37,359,259 $ 34,075,004
Gross unrealized appreciation $ 9,464,357 $ 503,909 $ 1,396,432 $ 2,033,072 $ 2,254,677
Gross unrealized depreciation (8,964,399) (4,010,942) (6,105,779) (3,777,416) (353,843)
Net unrealized appreciation (depreciation) on investments
$ 499,958 $ (3,507,033) $ (4,709,347) $ (1,744,344) $ 1,900,834
China Fund
Asia Small Companies
Fund Latin America
Fund Strategic US Equity Fund
Cost of investments $ 27,427,242 $ 26,770,886 $ 19,147,415 $ 13,316,004
Gross unrealized appreciation $ 12,153,174 $ 9,665,348 $ 3,286,867 $ 1,391,502
Gross unrealized depreciation (2,255,024) (338,337) (791,639) (841,186)
Net unrealized appreciation (depreciation) on investments
$ 9,898,150 $ 9,327,011 $ 2,495,228 $ 550,316
The difference between cost amounts for financial statement and federal income tax purposes is due primarily to wash sale loss deferrals and passive foreign investment companies (“PFICs”).
72

Euro Pacific Funds NOTES TO FINANCIAL STATEMENTS – Continued April 30, 2014 (Unaudited)
As of October 31, 2013 the components of accumulated earnings (deficit) on a tax basis were as follows:
International Value Fund
International Bond Fund
Hard Asset Fund Gold Fund
Undistributed ordinary income $ 351,405 $ 82,728 $ - $ 146,342
Undistributed long-term gains - 120,325 - - Tax accumulated earnings 351,405 203,053 - 146,342
Accumulated capital and other losses $ (2,172,144) $ - $ (448,570) $ (165,492)
Net unrealized appreciation (depreciation) on investments 2,490,181 (4,203,817)
(6,003,176) (1,473,908)
Net unrealized appreciation (depreciation) on foreign currency translations 900 5,295 56 (606)
Total accumulated earnings (deficit) $ 670,342 $ (3,995,469) $ (6,451,690) $ (1,493,664)
China Fund
Asia Small Companies
Fund Latin America
Fund Strategic US Equity Fund
Undistributed ordinary income $ 210,598 $ - $ 3,118 $ 142,252
Undistributed long-term gains - - - 46,752
Tax accumulated earnings 210,598 - 3,118 189,004
Accumulated capital and other losses $(10,559,904) $ (1,691,056) $ (1,388,173) $ - Unrealized appreciation (depreciation) on investments
10,448,313 7,367,360 1,419,032 442,543
Unrealized appreciation (depreciation) on foreign currency translations - (5) 3,172 -
Total accumulated earnings (deficit) $ 99,007 $ 5,676,299 $ 37,149 $ 631,547
73

Euro Pacific Funds NOTES TO FINANCIAL STATEMENTS – Continued April 30, 2014 (Unaudited)
The tax character of distributions paid during the fiscal years ended October 31, 2013 and 2012 were as follows:
International Value Fund International Bond Fund Hard Asset Fund
2013 2012 2013 2012 2013 2012
Distributions paid from: Ordinary Income $1,718,717 $ 1,592,231 $ 2,795,383 $ 1,618,934 $ 334,648 $ 206,613
Net long-term capital gains - - 51,424 - 43,419 -
Total distributions paid $1,718,717 $ 1,592,231 $ 2,846,807 $ 1,618,934 $ 378,067 $ 206,613
Gold Fund China Fund Asia Small Companies Fund
2013 2013 2012 2013 2012
Distributions paid from: Ordinary Income $ - $ 352,949 $ 1,059,363 $ 413,034 $ 115,322
Net long-term capital gains - - 1,896,428 - -
Total distributions paid $ - $ 352,949 $ 2,955,791 $ 413,034 $ 115,322
Latin America Fund Strategic US Equity Fund
2013 2012 2013 2012
Distributions paid from:
Ordinary Income $ 73,922 $ - $ 119,941 $ 16,391
Net long-term capital gains - - - -
Total distributions paid $ 73,922 $ - $ 119,941 $ 16,391
At October 31, 2013, the Funds had accumulated capital loss carryforwards as follows:
To the extent that a fund may realize future net capital gains, those gains will be offset by any of its unused capital loss carryforward. Future capital loss carryover utilization in any given year may be subject to Internal Revenue Code limitations. During the period ended October 31, 2013, the International Value Fund, China Fund, Asia Small Companies Fund and Latin America Fund utilized $2,609,893, $541,500, $3,224,245, and $188,933, respectively, of their capital loss carryovers. As of October 31, 2013, International Value Fund, International Bond Fund, Hard Asset Fund, Gold Fund, China Fund, Asia Small Companies Fund, Latin America Fund and Strategic US Equity Fund had qualified late-year losses of $0, $0, $63,163, $0, $0, $87,160, $61,928 and $0, respectively.
Capital Loss Carryforward to
Expire In: Not Subject to Expiration:
Fund 2018 2019 Short-Term Long-Term Total
International Value Fund $ 1,647 $ - $ 708,711 $ 1,461,786 $ 2,172,144
Hard Asset Fund - - - 385,407 385,407
Gold Fund - - 165,492 - 165,492
China Fund - 5,462,398 3,802,777 1,294,729 10,559,904
Asia Small Companies Fund - 1,603,896 - - 1,603,896
Latin American Fund - - 1,326,245 - 1,326,245
74

Euro Pacific Funds NOTES TO FINANCIAL STATEMENTS – Continued April 30, 2014 (Unaudited)
Under the Regulated Investment Company Modernization Act of 2010 (the "Act"), the Funds are permitted to carryforward capital losses incurred in taxable years beginning after December 22, 2010, for an unlimited period. However, any losses incurred during those future taxable years will be required to be utilized prior to the losses incurred in pre-enactment taxable years. As a result of this ordering rule, pre-enactment capital loss carryforwards may be more likely to expire unused. Additionally, post-enactment capital losses that are carried forward will retain their character as either short-term or long-term capital losses rather than being considered all short-term as under previous law.
Note 5 – Redemption Fee The Funds may impose a redemption fee of 2.00% of the total redemption amount on all shares redeemed within 30 days of purchase. For the six months ended April 30, 2014, redemption fees were as follows: International Value Fund $ 156 International Bond Fund 1,090 Hard Asset Fund
199
Gold Fund 1,319
International Dividend Income Fund (January 10, 2014 – April 30, 2014) 1,416
China Fund 1,115 Asia Small Companies Fund 177
Latin America Fund 171
Strategic US Equity Fund 31 Note 6 – Investment Transactions For the six months ended April 30, 2014, purchases and sales of investments, excluding short-term investments, were as follows:
Note 7 – Shareholder Servicing Plan The Trust, on behalf of the Funds, has adopted a Shareholder Servicing Plan to pay a fee at an annual rate of up to 0.15% of average daily net assets of shares serviced by shareholder servicing agents who provide administrative and support services to their customers. For the six months ended April 30, 2014, shareholder servicing fees incurred are disclosed on the Statements of Operations. Note 8 – Distribution Plan The Trust, on behalf of the Funds, has adopted a Distribution Plan (the “Plan”) pursuant to Rule 12b-1 under the 1940 Act that allows each Fund to pay distribution fees for the sale and distribution of its Class A shares. The Plan
Purchases Sales
International Value Fund $ 9,469,854 $ 17,966,299
International Bond Fund
17,992,388 32,708,616
Hard Asset Fund
3,835,978 10,906,703
Gold Fund
17,138,357 1,312,558 International Dividend Income Fund (January 10, 2014 – April 30, 2014)
29,472,072 1,509,819
China Fund
7,731,313 11,268,406
Asia Small Companies Fund
14,940,477 16,241,037
Latin America Fund
7,174,582 5,636,945 Strategic US Equity Fund
4,667,136 7,121,548
75

Euro Pacific Funds NOTES TO FINANCIAL STATEMENTS – Continued April 30, 2014 (Unaudited)
provides for the payment of distribution fees at the annual rate of up to 0.25% of average daily net assets attributable to Class A shares. Class I Shares are not subject to any distribution or administrative service fees under the plan. For the six months ended April 30, 2014, distribution fees incurred are disclosed on the Statements of Operations. Note 9 – Indemnifications In the normal course of business, the Funds enter into contracts that contain a variety of representations which provide general indemnifications. The Funds’ maximum exposure under these arrangements is unknown, as this would involve future claims that may be made against the Funds that have not yet occurred. However, the Funds expect the risk of loss to be remote. Note 10 – Fair Value Measurements and Disclosure Fair Value Measurements and Disclosures defines fair value, establishes a framework for measuring fair value in accordance with GAAP, and expands disclosure about fair value measurements. It also provides guidance on determining when there has been a significant decrease in the volume and level of activity for an asset or liability, when a transaction is not orderly, and how that information must be incorporated into a fair value measurement. Under Fair Value Measurements and Disclosures, various inputs are used in determining the value of each Fund’s investments. These inputs are summarized into three broad Levels as described below:
Level 1 – Unadjusted quoted prices in active markets for identical assets or liabilities that the Fund has the ability to access.
Level 2 – Observable inputs other than quoted prices included in Level 1 that are observable for the asset or liability, either directly or indirectly. These inputs may include quoted prices for the identical instrument on an inactive market, prices for similar instruments, interest rates, prepayment speeds, credit risk, yield curves, default rates and similar data.
Level 3 – Unobservable inputs for the asset or liability, to the extent relevant observable inputs are not available, representing the Fund’s own assumptions about the assumptions a market participant would use in valuing the asset or liability, and would be based on the best information available.
The availability of observable inputs can vary from security to security and is affected by a wide variety of factors, including, for example, the type of security, whether the security is new and not yet established in the marketplace, the liquidity of markets, and other characteristics particular to the security. To the extent that valuation is based on models or inputs that are less observable or unobservable in the market, the determination of fair value requires more judgment. Accordingly, the degree of judgment exercised in determining fair value is greatest for instruments categorized in Level 3.
The inputs used to measure fair value may fall into different Levels of the fair value hierarchy. In such cases, for disclosure purposes, the Level in the fair value hierarchy within which the fair value measurement falls in its entirety, is determined based on the lowest Level input that is significant to the fair value measurement in its entirety.
The inputs or methodology used for valuing investments are not an indication of the risk associated with investing in those investments. The following is a summary of the inputs used, as of April 30, 2014, in valuing the Funds’ assets carried at fair value:
76

Euro Pacific Funds NOTES TO FINANCIAL STATEMENTS – Continued April 30, 2014 (Unaudited)
International Value Fund Level 1 Level 2 Level 3*
Total
Investments Common Stocks Basic Materials $ 12,877,467 $ - $ - $ 12,877,467 Communications 12,505,419 - - 12,505,419 Consumer, Cyclical 6,474,034 -
- 6,474,034
Consumer, Non-cyclical 10,043,996 - - 10,043,996 Energy 11,809,996 - - 11,809,996 Financial 7,614,912 - - 7,614,912 Industrial 744,657 - - 744,657 Technology 1,292,160 - - 1,292,160
Utilities 6,198,126 - - 6,198,126 Short-Term Investments 4,054,079 - - 4,054,079 Total Investments $ 73,614,846 $ - $ - $ 73,614,846
International Bond Fund Level 1 Level 2 Level 3*
Total Investments Bonds Basic Materials $ - $ 1,077,730 $ - $ 1,077,730 Communications - 4,867,704 - 4,867,704 Consumer, Cyclical - 1,367,425 - 1,367,425 Consumer, Non-cyclical - 5,284,983 - 5,284,983 Diversified - 1,492,893 - 1,492,893 Energy - 3,119,298 - 3,119,298 Financial - 12,963,623 - 12,963,623 Government
-
30,903,783
-
30,903,783 Industrial - 1,265,495 - 1,265,495
Utilities - 1,833,898 - 1,833,898 Preferred Stock 772,800 - - 772,800 Short-Term Investments 8,592,430 - - 8,592,430 Total Investments $ 9,365,230 $ 64,176,832 $ - $ 73,542,062
Hard Asset Fund Level 1 Level 2 Level 3*
Total Investments Common Stocks
Basic Materials $ 9,332,041 $ - $ - $ 9,332,041 Consumer, Non-cyclical 1,423,395 - - 1,423,395 Energy 6,536,358 - - 6,536,358 Exchange-Traded Fund 5,689,304 - - 5,689,304 Short-Term Investments 671,662 - - 671,662 Total Investments $ 23,652,760 $ - $ - $ 23,652,760
77

Euro Pacific Funds NOTES TO FINANCIAL STATEMENTS – Continued April 30, 2014 (Unaudited)
Gold Fund Level 1 Level 2 Level 3
Total
Assets Investments
Common Stocks Gold Mining $ 11,963,779 $ - $ -
$ 11,963,779
Royalty Companies
5,137,857
-
91,233
5,229,090
Precious Metals Exploration
8,076,393
-
520,824
8,597,217
Silver Exploration and Mining
1,260,801
-
-
1,260,801
Diversified Exploration and Mining
2,491,480
-
-
2,491,480
Investment Management Companies
Precious Metals
1,822,556 - - 1,822,556 Bullion
2,858,233
- -
2,858,233
Warrants Diversified Exploration and Mining
-
- -
- Precious Metals Royalties
31,429 - - 31,429
Precious Metals Exploration
-
- -
- Purchased Call Options Contracts
87,770 55,500 - 143,270
Short-Term Investments
1,217,060
-
-
1,217,060
Total Assets $ 34,947,358 $ 55,500 $ 612,057
$ 35,614,915
Level 1 Level 2 Level 3
Total Liabilities
Investments Written Call Options Contracts $ 3,950 $ 430 $ - $ 4,380 Written Put Options Contracts 16,600 - - 16,600 Total Investments $ 20,550 $ 430 $ - $ 20,980
International Dividend Income Fund Level 1 Level 2 Level 3*
Total Investments Common Stocks
Communications $ 9,951,782 $ - $ - $ 9,951,782 Consumer, Cyclical
3,737,378
-
-
3,737,378 Consumer, Non-cyclical 3,594,430 - - 3,594,430
Energy
5,725,988
-
-
5,725,988 Financial
6,128,404
-
-
6,128,404 Utilities 2,240,521 - - 2,240,521
Short-Term Investments 4,597,335 - - 4,597,335 Total Investments $ 35,975,838 $ - $ - $ 35,975,838
78
Euro Pacific Funds NOTES TO FINANCIAL STATEMENTS – Continued April 30, 2014 (Unaudited)
China Fund Level 1 Level 2 Level 3
Total
Investments Common Stocks Basic Materials $ - $ - $ 111,441 $ 111,441 Communications 621,400 542,667 - 1,164,067 Consumer, Cyclical - 7,445,709 - 7,445,709 Consumer, Non-cyclical 1,530,000 7,289,424 - 8,819,424 Diversified - 1,426,819 - 1,426,819 Energy - 2,913,517 - 2,913,517 Financial - 3,423,648 - 3,423,648 Industrial - 6,354,491 - 6,354,491 Technology - 2,769,840 - 2,769,840
Utilities - 2,586,791 - 2,586,791 Short-Term Investments 309,645 - - 309,645 Total Investments $ 2,461,045 $ 34,752,906 $ 111,441 $ 37,325,392
Asia Small Companies Fund Level 1 Level 2 Level 3*
Total Investments Common Stocks Communications $ - $ 2,523,599 $ - $ 2,523,599 Consumer, Cyclical - 10,407,321 - 10,407,321 Consumer, Non-cyclical 1,393,575 9,000,648 - 10,394,223 Diversified - 1,050,542 - 1,050,542 Energy - 1,760,318 - 1,760,318 Financial - 3,866,269 - 3,866,269 Industrial - 5,450,970 - 5,450,970 Technology - 433,804 - 433,804 Warrants
6,941
-
-
6,941 Short-Term Investments
203,910
-
-
203,910 Total Investments $ 1,604,426 $ 34,493,471 $ - $ 36,097,897
Latin America Fund Level 1 Level 2 Level 3*
Total Investments
Common Stocks Basic Materials $ 788,354 $ - $ - $ 788,354
Consumer, Cyclical
3,381,173
-
-
3,381,173 Consumer, Non-cyclical 8,012,211 - - 8,012,211 Diversified 948,287 - - 948,287 Energy 170,900 - - 170,900 Financial 4,474,669 - - 4,474,669 Industrial 1,987,163 - - 1,987,163 Utilities 833,094 - - 833,094 Short-Term Investments 1,046,792 - - 1,046,792 Total Investments $ 21,642,643 $ - $ - $ 21,642,643
79
Euro Pacific Funds NOTES TO FINANCIAL STATEMENTS – Continued April 30, 2014 (Unaudited)
Strategic US Equity Fund Level 1 Level 2 Level 3*
Total
Investments Common Stocks
1 $ 12,743,764 $ - $ - $ 12,743,764 Short-Term Investments 1,122,556 - - 1,122,556 Total Investments $ 13,866,320 $ - $ - $ 13,866,320
*The Fund did not hold any Level 3 securities at period end.
1 All common stocks held in the Fund are Level 1 securities. For a detailed break-out of common stocks by major
industry classification, please refer to the Schedule of Investments. Transfers between Level 1 and Level 2 relate to the use of systematic fair valuation. When systematic fair valuation is used, securities whose primary market closes before the NYSE are classified as Level 2. The Gold Fund had transfers out of Level 3 into Level 1 as a result of securities exempt from registration under Rule 144A of the Securities Act of 1933, as amended, converting to publicly traded securities. The following is a reconciliation of Level 3 assets for the Gold Fund, which significant unobservable inputs were used to determine fair value:
Investments,
at Value Other Financial Instruments
Balance as of 10/31/13 $ 157,053 $ - Realized gain (loss) - - Change in unrealized appreciation (depreciation) (57,328) - Net purchase (sales) 669,385 - Transfers in and/or out of Level 3 (157,053) -
Balance as of 4/30/14 $ 612,057 $ -
The following is a reconciliation of Level 3 assets for the China Fund, which significant unobservable inputs were used to determine fair value:
Investments,
at Value Other Financial Instruments
Balance as of 10/31/13 $ 111,441 $ - Realized gain (loss) - - Change in unrealized appreciation (depreciation) - - Net purchase (sales) - - Transfers in and/or out of Level 3 - -
Balance as of 4/30/14 $ 111,441 $ -
80
Euro Pacific Funds NOTES TO FINANCIAL STATEMENTS – Continued April 30, 2014 (Unaudited)
The following table presents additional information about valuation methodologies and inputs used for investments that are measured at fair value and categorized within Level 3 as of April 30, 2014:
Impact to
Valuation
Fair Value
from an
April 30,
Valuation
Unobservable
increase in
2014 Methodologies Input(1)
Input(2)
Gold Fund - Common Stocks
$ 612,057 Fair Value Pricing
discount for lack of marketability
decrease
China Fund - Common Stocks
$ 111,441 Fair Value Pricing
discount for lack of marketability
decrease
(1) The investment advisor considers relevant indications of value that are reasonably and timely available to it in
determining the fair value to be assigned to a particular security, such as the type and cost of the security; contractual or legal restrictions on resale of the security; relevant financial or business developments of the issuer; actively traded related securities; conversion or exchange rights on the security; related corporate actions; significant events occurring after the close of trading in the security; and changes in overall market conditions. The Fund’s use of fair value pricing may cause the net asset value of Fund shares to differ from the net asset value that would be calculated using market quotations. Fair value pricing involves subjective judgments and it is possible that the fair value determined for a security may be materially different than the value that could be realized upon the sale of that security.
(2) This column represents the directional change in the fair value of the Level 3 investments that would result
from an increase to the corresponding unobservable input. A decrease to the unobservable input would have the opposite effect.
Note 11 – Derivatives and Hedging Disclosures Derivatives and Hedging requires enhanced disclosures about the Gold Fund’s derivative and hedging activities, including how such activities are accounted for and their effects on the Gold Fund’s financial position, performance and cash flows. The Gold Fund invested in purchased options contracts and written options contracts during the six months ended April 30, 2014.
The effects of these derivative instruments on the Fund's financial position and financial performance as reflected in the Statement of Assets and Liabilities and Statement of Operations are presented in the tables below. The fair values of derivative instruments as of April 30, 2014 by risk category are as follows:
Asset Derivatives Liability Derivatives
Derivatives not designated as hedging instruments
Statement of Assets and Liabilities Location Value
Statement of Assets and Liabilities Location Value
Equity contracts Purchased options contracts, at value $ 143,270
Written options contracts, at value $ 20,980
Total
$ 142,270
$ 20,980
81

Euro Pacific Funds NOTES TO FINANCIAL STATEMENTS – Continued April 30, 2014 (Unaudited)
The effects of derivative instruments on the Statement of Operations for the year ended October 31, 2013 are as follows:
Amount of Realized Gain or (Loss) on Derivatives Recognized in Income
Derivatives not designated as hedging instruments
Purchased Options
Contracts
Written Options
Contracts Total
Equity contracts $ 102,133 $ 30,112 $ 132,245
Total $ 102,133 $ 30,112 $ 132,245
Change in Unrealized Appreciation/Depreciation on Derivatives Recognized in Income
Derivatives not designated as hedging instruments
Purchased Options
Contracts
Written Options
Contracts Total
Equity contracts $ (79,662) $ (3,596) $ (83,258)
Total $ (79,662) $ (3,596) $ (83,258)
Note 12 – Disclosures about Offsetting Assets and Liabilities Disclosures about Offsetting Assets and Liabilities requires an entity to disclose information about offsetting and related arrangements to enable users of its financial statements to understand the effect of those arrangements on its financial position. The guidance requires retrospective application for all comparative periods presented. Management has evaluated the impact on the financial statement disclosures and determined that there is no effect.
Note 13 – Events Subsequent to the Fiscal Period End The Funds have adopted financial reporting rules regarding subsequent events which require an entity to recognize in the financial statements the effects of all subsequent events that provide additional evidence about conditions that existed at the date of the balance sheet. Management has evaluated the Funds’ related events and transactions that occurred through the date of issuance of the Funds’ financial statements.
At a meeting of the Board of Trustees of Investment Managers Series Trust (the “Trust”) held on June 19, 2014, John P. Zader indicated that he would be retiring from UMB Fund Services, Inc. on June 27, 2014, and resigned as President of the Trust, and the Board of Trustees appointed Maureen Quill, Executive Vice President of UMB Fund Services, Inc., as President of the Trust effective June 20, 2014. Mr. Zader will continue as a Trustee of the Trust.
There were no other events or transactions that occurred during this period that materially impacted the amounts or disclosures in the Funds’ financial statements.
82
EuroPac International Dividend Income Fund SUPPLEMENTAL INFORMATION (Unaudited) Board Consideration of Investment Advisory Agreement (Unaudited) At an in-person meeting held on December 4-5, 2013, the Board of Trustees (the “Board”) of Investment Managers Series Trust (the “Trust”), including the trustees who are not “interested persons” of the Trust (the “Independent Trustees”) as defined in the Investment Company Act of 1940, as amended (the “1940 Act”), reviewed and unanimously approved the Investment Advisory Agreement (the “Advisory Agreement”) between the Trust and Euro Pacific Asset Management, LLC (the “Investment Advisor”) with respect to the EuroPac International Dividend Income Fund series of the Trust (the “Fund”) for an initial two-year term. In approving the Advisory Agreement, the Board of Trustees, including the Independent Trustees, determined that approval of the Advisory Agreement is in the best interests of the Fund and its shareholders. Background In advance of the meeting, the Board received information about the Fund and the Advisory Agreement from the Investment Advisor and from Mutual Fund Administration Corporation and UMB Fund Services, Inc., the Trust’s co-administrators, certain portions of which are discussed below. The materials, among other things, included information regarding the Investment Advisor’s proposal to launch the Fund by converting into the Fund a limited liability company separate account (the “Account”) managed by the Investment Advisor using the same strategies it would use to manage the Fund; performance information for the Account; and reports comparing the proposed advisory fee and the estimated total expenses of the Fund to those of a group of comparable funds (the “Peer Group”) selected by Morningstar, Inc. from its foreign large blend fund universe (the “Expense Universe”). The Board also received a memorandum from the independent legal counsel to the Independent Trustees discussing the legal standards under the 1940 Act and other applicable law for their consideration of the proposed Advisory Agreement. Before voting on the Advisory Agreement, the Independent Trustees met in a private session with counsel at which no representatives of the Investment Advisor were present. In approving the Advisory Agreement, the Board and the Independent Trustees considered a variety of factors, including those discussed below. In their deliberations, the Board and the Independent Trustees did not identify any particular factor that was controlling, and each Trustee may have attributed different weights to the various factors. The Board reviewed the materials and various matters concerning the Investment Advisor and the Fund. Nature, Extent and Quality of Services In reviewing the proposed investment advisory agreement for the Fund, the Board discussed, among other things, the nature, extent and quality of the services to be provided by the Investment Advisor with respect to the Fund. The Board considered the performance of the Account (which commenced on February 28, 2010), and noted that the Account’s returns (net of fees) for the one-year and since inception periods ended December 31, 2012, exceeded the returns of the S&P International Dividend Opportunities Index. The Board also considered the qualifications, experience and responsibilities of the personnel who would be involved in the activities of the Fund. In addition, the Board considered the overall quality of the organization and operations, and the compliance structure and compliance procedures, of the Investment Advisor. The Board also noted its familiarity with the Investment Advisor, which serves as investment advisor of eight other series of the Trust. Based on its review, the Board and the Independent Trustees concluded that the Investment Advisor would have the capabilities, resources and personnel necessary to manage the Fund and that the Investment Advisor would provide the Fund with a reasonable potential for good investment results.
83

EuroPac International Dividend Income Fund SUPPLEMENTAL INFORMATION (Unaudited) Advisory Fee and Expense Ratio The Board considered information included in the meeting materials regarding the proposed investment advisory fees and estimated total expenses of the Fund. With respect to the advisory fees proposed to be paid by the Fund, the Board noted that the meeting materials indicated that the advisory fees (before fee waivers by the Investment Advisor) were the same as the median advisory fees of funds in the Peer Group and the Expense Universe. In considering the estimated total expenses to be paid by the Fund, the Board observed that the total expenses (net of fee waivers) were slightly higher than the Peer Group median by two basis points and the Expense Universe median by seven basis points. The Board noted, however, that the Fund’s estimated assets for its first year of operations were significantly lower than the average net asset sizes of funds in the Peer Group and the Expense Universe. The Board and the Independent Trustees concluded that the proposed compensation payable to the Investment Advisor under the Advisory Agreement would be fair and reasonable in light of the services proposed to be provided by the Investment Advisor to the Fund. Profitability and Economies of Scale The Board also considered information relating to the estimated profitability to the Investment Advisor of its relationship with the Fund in its first year of operations taking into account estimated assets of $20 million, and noted that the Investment Advisor anticipated waiving a significant portion of its advisory fee during that year. The Board also noted that the potential benefits received by the Investment Advisor as a result of its relationship with the Fund would include not only the advisory fees paid to the Investment Advisor, but also any research provided by broker-dealers executing transactions on behalf of the Fund and any favorable publicity arising in connection with the Fund’s performance. The Board noted that during the Fund’s startup period the Fund’s asset levels would likely be too low to achieve significant economies of scale and that any such economies would be considered in the future as the Fund’s assets grow. Conclusion Based on these and other factors, the Board and the Independent Trustees concluded that approval of the Advisory Agreement is in the best interests of the Fund and its shareholders and accordingly, approved the Advisory Agreement.
84

Euro Pacific Funds EXPENSE EXAMPLES For the Six Months Ended April 30, 2014 (Unaudited)
Expense Example As a shareholder of the Funds, you incur two types of costs: (1) transaction costs, including sales charges (loads) on purchase payments (Class A shares only), and redemption fees and (2) ongoing costs, including management fees; distribution and/or service (12b-1) fees (Class A shares only); and other Fund expenses. The examples below are intended to help you understand your ongoing costs (in dollars) of investing in the Funds and to compare these costs with the ongoing costs of investing in other mutual funds. These examples are based on an investment of $1,000 invested at the beginning of the period and held for the entire period from 11/1/13 to 4/30/14. Actual Expenses The information in the row titled “Actual Performance” of the table below provides actual account values and actual expenses. You may use the information in these columns, together with the amount you invested, to estimate the expenses that you paid over the period. Simply divide your account value by $1,000 (for example, an $8,600 account value divided by $1,000 = 8.6), then multiply the result by the number in the appropriate row under the column titled “Expenses Paid During Period” to estimate the expenses you paid on your account during this period. Hypothetical Example for Comparison Purposes The information in the row titled “Hypothetical (5% annual return before expenses)” of the table below provides hypothetical account values and hypothetical expenses based on the Funds’ actual expense ratios and an assumed rate of return of 5% per year before expenses, which is not the Funds’ actual return. The hypothetical account values and expenses may not be used to estimate the actual ending account balance or expenses you paid for the period. You may use this information to compare the ongoing costs of investing in the Funds and other funds. To do so, compare these 5% hypothetical examples with the 5% hypothetical examples that appear in the shareholder reports of the other funds. Please note that the expenses shown in the table are meant to highlight your ongoing costs only and do not reflect any transaction costs, such as sales charges (load) or contingent deferred sales charges. Therefore, the information in the row titled “Hypothetical (5% annual return before expenses)” is useful in comparing ongoing costs only, and will not help you determine the relative total costs of owning different funds. In addition, if these transactional costs were included, your costs would have been higher.
EuroPac International Value Fund Actual Performance
Beginning Account Value
Ending Account Value
Expenses Paid During Period*
11/1/13 4/30/14 11/1/13 – 4/30/14 Class A $1,000.00 $1,028.80 $8.80 Class I 1,000.00 1,030.40 7.54 Hypothetical (5% annual return before taxes) 11/1/13 4/30/14 11/1/13 – 4/30/14 Class A 1,000.00 1,016.12 8.75
Class I 1,000.00 1,017.37 7.49
*Expenses are equal to the Fund’s annualized expense ratios of 1.75% and 1.50% for Class A and Class I shares, respectively, multiplied by the average account values over the period, multiplied by 181/365 (to reflect the six months period). The expense ratios reflect an expense waiver. Assumes all dividends and distributions were reinvested.
85
Euro Pacific Funds EXPENSE EXAMPLES - Continued For the Six Months Ended April 30, 2014 (Unaudited)
EuroPac International Bond Fund Actual Performance
Beginning Account Value
Ending Account Value
Expenses Paid During Period*
11/1/13 4/30/14 11/1/13 – 4/30/14 Class A $1,000.00 $1,015.20 $5.74 Class I 1,000.00 1,017.10 4.50
Hypothetical (5% annual return before taxes) 11/1/13 4/30/14 11/1/13 – 4/30/14
Class A 1,000.00 1,019.09 5.76
Class I 1,000.00 1,020.33 4.51
*Expenses are equal to the Fund’s annualized expense ratios of 1.15% and 0.90% for Class A and Class I shares, respectively, multiplied by the average account values over the period, multiplied by 181/365 (to reflect the six months period). The expense ratios reflect an expense waiver. Assumes all dividends and distributions were reinvested.
EuroPac Hard Asset Fund Beginning
Account Value Ending
Account Value Expenses
Paid During Period* Actual Performance 11/1/13 4/30/14 11/1/13 – 4/30/14 Class A $1,000.00 $961.30 $8.51 Class I 1,000.00 962.60 7.30
Hypothetical (5% annual return before taxes) 11/1/13 4/30/14 11/1/13 – 4/30/14
Class A 1,000.00 1,016.12 8.75
Class I 1,000.00 1,017.36 7.57
*Expenses are equal to the Fund’s annualized expense ratios of 1.75% and 1.50% for Class A and Class I shares, respectively, multiplied by the average account values over the period, multiplied by 181/365 (to reflect the six months period). The expense ratios reflect an expense waiver. Assumes all dividends and distributions were reinvested.
EuroPac Gold Fund - Class A Beginning Account Value
Ending Account Value
Expenses Paid During Period
11/1/13 4/30/14 11/1/13 – 4/30/14* Actual Performance $1,000.00 $1,007.90 $7.47
Hypothetical (5% annual return before expenses) 1,000.00 1,017.35 7.51 *Expenses are equal to the Fund’s annualized expense ratio of 1.50%, multiplied by the average account value over the period, multiplied by 181/365 (to reflect to six month period). The expense ratios reflect an expense waiver. Assumes all dividends and distributions were reinvested.
86
Euro Pacific Funds EXPENSE EXAMPLES - Continued For the Six Months Ended April 30, 2014 (Unaudited)
EuroPac International Dividend Income Fund Beginning
Account Value Ending
Account Value Expenses
Paid During Period Actual Performance** 1/10/14* 4/30/14 1/10/14* – 4/30/14 Class A $1,000.00 $1,067.00 $4.70 Class I 1,000.00 1,067.30 3.92
Hypothetical (5% annual return before taxes)^ 11/1/13 4/30/14 11/1/13 – 4/30/14 Class A 1,000.00 1,017.38 7.48
Class I 1,000.00 1,018.61 6.24
*Commencement of operations. **Expenses are equal to the Fund’s annualized expense ratios of 1.50% and 1.25% for Class A and Class I shares, respectively, multiplied by the average account values over the period, multiplied by 111/365 (to reflect the since inception period). The expense ratios reflect an expense waiver. Assumes all dividends and distributions were reinvested. ^Expenses are equal to the Fund’s annualized expense ratios of 1.50% and 1.25% for Class A and Class I shares, respectively, multiplied by the average account value over the period, multiplied by 181/365 (to reflect the six month period). The expense ratios reflect an expense waiver. Assumes all dividends and distributions were reinvested.
EP China Fund - Class A
Beginning Account Value
Ending Account Value
Expenses Paid During Period*
11/1/13 4/30/14 11/1/13 – 4/30/14 Actual Performance $1,000.00 $991.30 $8.64 Hypothetical (5% annual return before expenses) 1,000.00 1,016.12 8.75 *Expenses are equal to the Fund’s annualized expense ratio of 1.75% multiplied by the average account value over the period, multiplied by 181/365 (to reflect to six month period). The expense ratios reflect an expense waiver. Assumes all dividends and distributions were reinvested.
EP Asia Small Companies Fund Actual Performance
Beginning Account Value
Ending Account Value
Expenses Paid During Period*
11/1/13 4/30/14 11/1/13 – 4/30/14 Class A $1,000.00 $1,074.00 $9.00 Class I 1,000.00 1,074.70 7.72 Hypothetical (5% annual return before taxes) 11/1/13 4/30/14 11/1/13 – 4/30/14
Class A 1,000.00 1,016.12 8.75
Class I 1,000.00 1,017.35 7.51
*Expenses are equal to the Fund’s annualized expense ratios of 1.75% and 1.50% for Class A and Class I shares, respectively, multiplied by the average account values over the period, multiplied by 181/365 (to reflect the six months period). The expense ratios reflect an expense waiver. Assumes all dividends and distributions were reinvested.
87
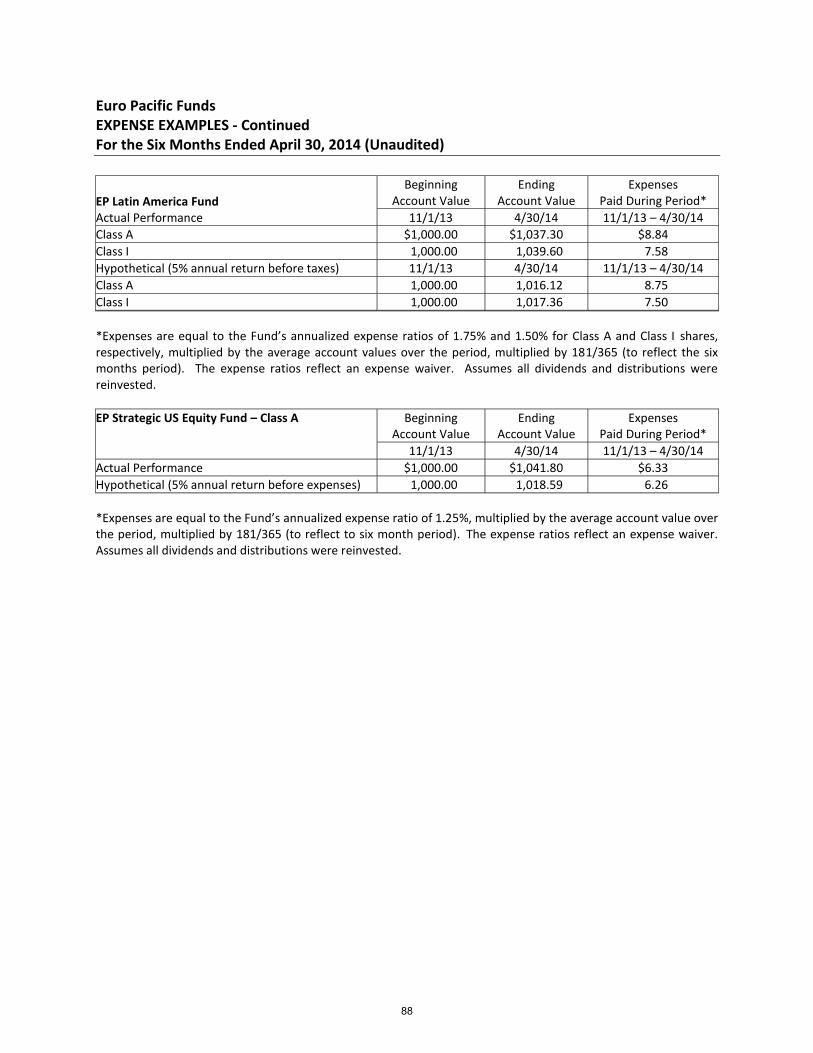
Euro Pacific Funds EXPENSE EXAMPLES - Continued For the Six Months Ended April 30, 2014 (Unaudited)
EP Latin America Fund Actual Performance
Beginning Account Value
Ending Account Value
Expenses Paid During Period*
11/1/13 4/30/14 11/1/13 – 4/30/14 Class A $1,000.00 $1,037.30 $8.84 Class I 1,000.00 1,039.60 7.58 Hypothetical (5% annual return before taxes) 11/1/13 4/30/14 11/1/13 – 4/30/14
Class A 1,000.00 1,016.12 8.75
Class I 1,000.00 1,017.36 7.50
*Expenses are equal to the Fund’s annualized expense ratios of 1.75% and 1.50% for Class A and Class I shares, respectively, multiplied by the average account values over the period, multiplied by 181/365 (to reflect the six months period). The expense ratios reflect an expense waiver. Assumes all dividends and distributions were reinvested.
EP Strategic US Equity Fund – Class A
Beginning Account Value
Ending Account Value
Expenses Paid During Period*
11/1/13 4/30/14 11/1/13 – 4/30/14 Actual Performance $1,000.00 $1,041.80 $6.33 Hypothetical (5% annual return before expenses) 1,000.00 1,018.59 6.26 *Expenses are equal to the Fund’s annualized expense ratio of 1.25%, multiplied by the average account value over the period, multiplied by 181/365 (to reflect to six month period). The expense ratios reflect an expense waiver. Assumes all dividends and distributions were reinvested.
88

Euro Pacific Funds Each a series of the Investment Managers Series Trust
Investment Advisor Euro Pacific Asset Management, LLC
53 Palmeras Street, Puerta de Tierra Ward San Juan, PR 00902
Sub-Advisor
New Sheridan Advisors, Inc. 18201 Von Karman, Suite 480
Irvine, California 92612
Sub-Advisor
Global Strategic Management dba Adrian Day Asset Management
801 Compass Way, Suite 207 P.O. Box 6643
Annapolis, Maryland 21401
Custodian
UMB Bank, n.a. 928 Grand Boulevard, 5th Floor
Kansas City, Missouri 64106
Fund Co-Administrator
Mutual Fund Administration Corporation 2220 E. Route 66, Suite 226
Glendora, California 91740
Fund Co-Administrator, Transfer Agent and Fund Accountant
UMB Fund Services, Inc. 235 W. Galena Street
Milwaukee, Wisconsin 53212
Distributor
IMST Distributors, LLC Three Canal Plaza, Suite 100
Portland, Maine 04101 www.foreside.com

FUND INFORMATION
TICKER CUSIP
EuroPac International Value Fund – Class A EPIVX 461 418 766
EuroPac International Value Fund – Class I EPVIX 461 41P 669
EuroPac International Bond Fund – Class A EPIBX 461 418 618
EuroPac International Bond Fund – Class I EPBIX 461 41P 651
EuroPac Hard Asset Fund – Class A EPHAX 461 418 436
EuroPac Hard Asset Fund – Class I EPHIX 461 41P 644
EuroPac Gold Fund – Class A EPGFX 461 41P 677
EuroPac International Dividend Income Fund – Class A EPDPX 461 41P 487
EuroPac International Dividend Income Fund – Class I EPDIX 461 41P 479
EP China Fund – Class A EPHCX 461 418 857
EP Asia Small Companies Fund – Class A EPASX 461 418 550
EP Asia Small Companies Fund – Class I EPEIX 461 41P 636
EP Latin America Fund – Class A EPLAX 461 418 352
EP Latin America Fund – Class I EPWIX 461 41P 628
EP Strategic US Equity Fund – Class A EPUSX 461 418 279
Privacy Principles of the Euro Pacific Funds for Shareholders The Funds are committed to maintaining the privacy of their shareholders and to safeguarding their non-public personal information. The following information is provided to help you understand what personal information the Funds collect, how we protect that information and why, in certain cases, we may share information with select other parties.
Generally, the Funds do not receive any non-public personal information relating to their shareholders, although certain non-public personal information of their shareholders may become available to the Funds. The Funds do not disclose any non-public personal information about their shareholders or former shareholders to anyone, except as permitted by law or as is necessary in order to service shareholder accounts (for example, to a transfer agent or third party administrator).
This report is sent to shareholders of the EuroPac International Value Fund, EuroPac International Bond Fund, EuroPac Hard Asset Fund, EuroPac Gold Fund, EuroPac International Dividend Income Fund, EP China Fund, EP Asia Small Companies Fund, EP Latin America Fund and EP Strategic US Equity Fund for their information. It is not a Prospectus, circular or representation intended for use in the purchase or sale of shares of the Funds or of any securities mentioned in this report.
Proxy Voting Policies and Procedures A description of the Funds’ proxy voting policies and procedures related to portfolio securities are available without charge, upon request, by calling the Funds at (888) 558-5851, on the Funds’ website at www.europacificfunds.com or on the U.S. Securities and Exchange Commission’s (“SEC”) website at www.sec.gov.
Proxy Voting Record Information regarding how the Funds voted proxies for portfolio securities, if applicable, during the most recent 12-month period ended June 30, is also available, without charge and upon request by calling (888) 558-5851, on the Funds’ website at www.europacificfunds.com or by accessing the Funds’ Form N-PX on the SEC’s website at www.sec.gov.
Form N-Q Disclosure The Funds file their complete schedules of portfolio holdings with the SEC for the first and third quarters of each fiscal year on Form N-Q. The Funds’ Form N-Q is available on the SEC website at www.sec.gov or by calling the Funds at (888) 558-5851. The Funds’ Form N-Q may also be viewed and copied at the SEC’s Public Reference Room in Washington, DC. Information on the operation of the Public Reference Room may be obtained by calling (800) SEC-0330.
Euro Pacific Funds P. O. Box 2175
Milwaukee, WI 53201 Toll Free: (888) 558-5851