SEMI-ANNUAL FINANCIAL STATEMENTS BMO … FINANCIAL STATEMENTS BMO High Yield US Corporate Bond ......
30
SEMI-ANNUAL FINANCIAL STATEMENTS BMO High Yield US Corporate Bond Hedged to CAD Index ETF (ZHY) June 30, 2017
Transcript of SEMI-ANNUAL FINANCIAL STATEMENTS BMO … FINANCIAL STATEMENTS BMO High Yield US Corporate Bond ......

SEMI-ANNUAL FINANCIAL STATEMENTS
BMO High Yield US Corporate Bond Hedged to CAD Index ETF (ZHY)June 30, 2017

BMO High Yield US Corporate Bond Hedged to CAD Index ETF(unaudited)
The accompanying notes are an integral part of these financial statements.
Statement of Financial Position(All amounts in thousands of Canadian dollars, except per unit data)
Statement of Comprehensive Income(All amounts in thousands of Canadian dollars, except per unit data)
June 30 December 31As at 2017 2016
Assets
Current AssetsCash 4,929 9,900
InvestmentsNon-derivative financial assets 1,121,881 1,067,127Derivative assets 41,943 4,827
Receivable for investments sold — 2,068Subscriptions receivable 1,455 1,436Interest receivable 17,357 17,224Distribution receivable from
investment trusts 268 467
Total assets 1,187,833 1,103,049
Liabilities
Current LiabilitiesPayable for investments purchased 38,185 —Derivative liabilities 945 1,879Distributions payable 4,959 5,838Accrued expenses 1,679 1,745
Total liabilities 45,768 9,462
Net assets attributable to holders of redeemable units 1,142,065 1,093,587
Net assets attributable to holders of redeemable unitsListed CAD Units 1,112,909 1,065,798Institutional Units 29,156 27,789
Net assets attributable to holders of redeemable units per unit Listed CAD Units $14.55 $14.36Institutional Units $14.92 $14.43
June 30 June 30For the periods ended 2017 2016
IncomeInterest income 34,411 36,236Dividend income 1 —Distribution from investment
trusts 294 1,132
Other changes in fair value of investments and derivativesNet realized gain 21,800 19,068Change in unrealized
(depreciation) appreciation (8,172) 36,017
Net gain in fair value of investments and derivatives 48,334 92,453
Securities lending (note 8) 488 573Foreign exchange loss (518) (2,202)
Total other loss (30) (1,629)
Total income 48,304 90,824
ExpensesManagement fees (note 6) 3,312 3,359Management fees reduction (113) (35)Independent review committee
fees (note 6) 1 2Withholding taxes 218 229Interest charges — 2ETF Summary document fees 0 0Commissions and other portfolio
transaction costs (note 6) 0 27Operating expenses absorbed by
the Manager (0) (2)Total expenses 3,418 3,582
Increase in net assets attributable to holders of redeemable units 44,886 87,242
Increase in net assets attributable to holders of redeemable unitsListed CAD Units 43,652 85,289Institutional Units 1,234 1,953
Increase in net assets attributable to holders of redeemable units per unit (note 8)Listed CAD Units 0.58 1.02Institutional Units 0.63 1.06

BMO High Yield US Corporate Bond Hedged to CAD Index ETF(unaudited)
The accompanying notes are an integral part of these financial statements.
Statement of Changes in Net Assets Attributable to Holders of Redeemable Units(All amounts in thousands of Canadian dollars)
June 30 June 30For the periods ended 2017 2016
Listed CAD UnitsNet assets attributable to holders
of redeemable units at beginning of period 1,065,798 1,073,887
Increase in net assets attributable to holders of redeemable units 43,652 85,289
Distributions to holders of redeemable units from:Net investment income (29,808) (34,443)Return of capital (209) (517)Management fee (113) (35)Total distributions to holders of
redeemable units (30,130) (34,995)
Redeemable unit transactionsProceeds from redeemable units
issued 37,918 99,299Redemption of redeemable units (4,329) (103,661)Net increase (decrease) from
redeemable unit transactions 33,589 (4,362)
Net increase in net assets attributable to holders of redeemable units 47,111 45,932
Net assets attributable to holders of redeemable units at end of period 1,112,909 1,119,819
Institutional UnitsNet assets attributable to holders
of redeemable units at beginning of period 27,789 24,000
Increase in net assets attributable to holders of redeemable units 1,234 1,953
Distributions to holders of redeemable units from:Net investment income (287) (798)Total distributions to holders of
redeemable units (287) (798)
Redeemable unit transactionsReinvestments of distributions to
holders of redeemable units 420 860Net increase from redeemable unit
transactions 420 860
Net increase in net assets attributable to holders of redeemable units 1,367 2,015
Net assets attributable to holders of redeemable units at end of period 29,156 26,015
June 30 June 30For the periods ended 2017 2016
Total FundNet assets attributable to holders
of redeemable units at beginning of period 1,093,587 1,097,887
Increase in net assets attributable to holders of redeemable units 44,886 87,242
Distributions to holders of redeemable units from:Net investment income (30,095) (35,241)Return of capital (209) (517)Management fee (113) (35)Total distributions paid to holders of
redeemable units (30,417) (35,793)
Redeemable unit transactionsProceeds from redeemable units
issued 37,918 99,299Reinvestments of distributions to
holders of redeemable units 420 860Redemption of redeemable units (4,329) (103,661)Net increase (decrease) from
redeemable unit transactions 34,009 (3,502)
Net increase in net assets attributable to holders of redeemable units 48,478 47,947
Net assets attributable to holders of redeemable units at end of period 1,142,065 1,145,834

BMO High Yield US Corporate Bond Hedged to CAD Index ETF(unaudited)
The accompanying notes are an integral part of these financial statements.
Statement of Cash Flows(All amounts in thousands of Canadian dollars)
June 30 June 30For the periods ended 2017 2016
Cash flows from operating activitiesIncrease in net assets attributable to holders of redeemable units 44,886 87,242Adjustments for:
Foreign exchange (gain) loss on cash (3) 49
Net realized gain on sale of investments and derivatives (21,800) (19,068)
Change in unrealized depreciation (appreciation) of investments and derivatives 8,172 (36,017)
Increase in interest receivable (133) (62)Decrease in distribution receivable
from investment trusts 199 361(Decrease) increase in accrued
expenses (66) 15Amortization of premium and
discount 353 1,443Interest received in kind — (129)Purchases of investments (207,537) (362,712)Proceeds from sale and maturity of
investments 177,592 348,896Cash (outflows) inflows on
derivatives (3,394) 12,729Net cash from operating activities (1,731) 32,747
Cash flows from financing activitiesDistributions paid to holders
of redeemable units, net of reinvested distributions (30,876) (38,238)
Proceeds from issuances of redeemable units 31,962 82,806
Amounts paid on redemption of redeemable units (4,329) (94,074)
Net cash used in financing activities (3,243) (49,506)
Foreign exchange gain (loss) on cash 3 (49)Net decrease in cash (4,974) (16,759)Cash at beginning of period 9,900 24,305Cash at end of period 4,929 7,497
Supplementary InformationInterest received, net of withholding
taxes* 34,532 37,459Dividends received, net of
withholding taxes* 1 —Distribution received from
investment trusts* 449 1,493Interest expense paid* — 2
*These items are from operating activities

BMO High Yield US Corporate Bond Hedged to CAD Index ETF(unaudited)
Schedule of Investment PortfolioAs at June 30, 2017 (All amounts in thousands of Canadian dollars, unless otherwise noted)
Par Value
(in thousands)
Cost
($)
Fair Value
($)
BONDS & DEBENTURES
Corporate Bonds & Debentures — 96.8%1011778 B.C. ULC/New Red Finance, Inc., Series
144A, Secured, Notes, Callable, 4.625% Jan 15, 2022 . . . . . . . . . . . . . . . . . . . . . . . . . . . . . . . . . . . . . . . . . . . . . . . USD 2,000. . . . . . . 2,460. . . . . . . 2,649
1011778 B.C. ULC/New Red Finance, Inc., Series 144A, Secured, Notes, Callable, 6.000% Apr 1, 2022 . . . . . . . . . . . . . . . . . . . . . . . . . . . . . . . . . . . . . . . . . . . . . . . USD 3,000. . . . . . . 3,346. . . . . . . 4,031
Acadia Healthcare Company, Inc., Senior, Unsecured, Notes, Callable, 5.625% Feb 15, 2023 . . . . . . . . . . . . . . . . . . . . . . . . . . . . . . . . . . . . . . . . . . . . . . . USD 1,000. . . . . . . 1,320. . . . . . . 1,345
Acosta Inc., Series 144A, Senior, Unsecured, Notes, Callable, 7.750% Oct 1, 2022 . . . . . . . . . . . . . . . . . . . . USD 1,250. . . . . . . 1,559. . . . . . . 1,228
Adient Global Holdings Ltd., Series 144A, Senior, Unsecured, Notes, Callable, 4.875% Aug 15, 2026 . . . . . . . . . . . . . . . . . . . . . . . . . . . . . . . . . . . . . . . . . . . . . . . USD 1,500. . . . . . . 1,968. . . . . . . 1,950
ADT Corporation, The, Senior, Unsecured, Notes, 6.250% Oct 15, 2021 . . . . . . . . . . . . . . . . . . . . . . . . . . . . . USD 1,500. . . . . . . 1,708. . . . . . . 2,113
ADT Corporation, The, Senior, Unsecured, Notes, 3.500% Jul 15, 2022 . . . . . . . . . . . . . . . . . . . . . . . . . . . . . . USD 1,000. . . . . . . . . 941. . . . . . . 1,255
AECOM, Senior, Unsecured, Notes, Callable, 5.750% Oct 15, 2022 . . . . . . . . . . . . . . . . . . . . . . . . . . . . . USD 1,250. . . . . . . 1,547. . . . . . . 1,698
AECOM, Senior, Unsecured, Notes, Callable, 5.875% Oct 15, 2024 . . . . . . . . . . . . . . . . . . . . . . . . . . . . . USD 750. . . . . . . . . 917. . . . . . . 1,053
AECOM, Series 144A, Senior, Unsecured, Notes, Callable, 5.125% Mar 15, 2027 . . . . . . . . . . . . . . . . . . USD 1,500. . . . . . . 2,021. . . . . . . 1,950
AES Corporation, The, Senior, Unsecured, Notes, 7.375% Jul 1, 2021 . . . . . . . . . . . . . . . . . . . . . . . . . . . . . . . USD 460. . . . . . . . . 646. . . . . . . . . 683
AES Corporation, The, Senior, Unsecured, Notes, Callable, 5.500% Mar 15, 2024 . . . . . . . . . . . . . . . . . . USD 2,000. . . . . . . 2,704. . . . . . . 2,707
Aircastle Limited, Senior, Unsecured, Notes, 5.125% Mar 15, 2021 . . . . . . . . . . . . . . . . . . . . . . . . . . . . . USD 2,500. . . . . . . 2,766. . . . . . . 3,465
Albertsons Cos LLC/Safeway Inc./New Albertson's Inc./Albertson's LLC, Series 144A, Senior, Unsecured, Notes, Callable, 6.625% Jun 15, 2024 . . . . . . . . . . . . . . . . . . . . . . . . . . . . . . . . . . . . . . . . . . . . . . . USD 2,000. . . . . . . 2,791. . . . . . . 2,574
Alcoa Nederland Holding B.V., Series 144A, Senior, Unsecured, Notes, Callable, 6.750% Sep 30, 2024 . . . . . . . . . . . . . . . . . . . . . . . . . . . . . . . . . . . . . . . . . . . . . . . USD 1,500. . . . . . . 2,115. . . . . . . 2,105
Alcoa Nederland Holding B.V., Series 144A, Senior, Unsecured, Notes, Callable, 7.000% Sep 30, 2026 . . . . . . . . . . . . . . . . . . . . . . . . . . . . . . . . . . . . . . . . . . . . . . . USD 1,500. . . . . . . 2,138. . . . . . . 2,135
Algeco Scotsman Global Finance Plc, Series 144A, Secured, Notes, Callable, 8.500% Oct 15, 2018 USD 2,000. . . . . . . 1,997. . . . . . . 2,425
Allegheny Technologies Inc., Senior, Unsecured, Notes, Callable, Multi-Coupon, 7.875% Aug 15, 2023 . . . . . . . . . . . . . . . . . . . . . . . . . . . . . . . . . . . . . . . . . . . . . . . USD 1,250. . . . . . . 1,633. . . . . . . 1,680
Alliance One International Inc., Secured, Notes, Callable, 9.875% Jul 15, 2021 . . . . . . . . . . . . . . . . . . . . USD 1,000. . . . . . . 1,100. . . . . . . 1,128
Allison Transmission Inc., Series 144A, Senior, Unsecured, Notes, Callable, 5.000% Oct 1, 2024 USD 1,000. . . . . . . 1,321. . . . . . . 1,324
Ally Financial Inc., Senior, Unsecured, Notes, 3.600% May 21, 2018 . . . . . . . . . . . . . . . . . . . . . . . . . . . . USD 2,000. . . . . . . 2,651. . . . . . . 2,626
Ally Financial Inc., Senior, Unsecured, Notes, 3.250% Nov 5, 2018 . . . . . . . . . . . . . . . . . . . . . . . . . . . . . . USD 1,000. . . . . . . 1,382. . . . . . . 1,311
Par Value
(in thousands)Cost
($)
Fair Value
($)
Ally Financial Inc., Senior, Unsecured, Notes, 4.250% Apr 15, 2021 . . . . . . . . . . . . . . . . . . . . . . . . . . . . . USD 1,000. . . . . . . 1,394. . . . . . . 1,342
Ally Financial Inc., Senior, Unsecured, Notes, 4.125% Feb 13, 2022 . . . . . . . . . . . . . . . . . . . . . . . . . . . . . USD 1,000. . . . . . . 1,372. . . . . . . 1,329
Ally Financial Inc., Senior, Unsecured, Notes, 5.125% Sep 30, 2024 . . . . . . . . . . . . . . . . . . . . . . . . . . . . . USD 1,000. . . . . . . 1,391. . . . . . . 1,368
Ally Financial Inc., Notes, Subordinated, Callable, 5.750% Nov 20, 2025 . . . . . . . . . . . . . . . . . . . . . . . . . . . . USD 1,000. . . . . . . 1,262. . . . . . . 1,367
Altice Financing S.A., Series 144A, Secured, Notes, Callable, 6.500% Jan 15, 2022 . . . . . . . . . . . . . . . . . . . USD 2,200. . . . . . . 2,583. . . . . . . 2,981
Altice Financing S.A., Series 144A, Secured, Notes, Callable, 6.625% Feb 15, 2023 . . . . . . . . . . . . . . . . . . USD 2,000. . . . . . . 2,542. . . . . . . 2,746
Altice Financing S.A., Series 144A, Secured, Notes, Callable, 7.500% May 15, 2026 . . . . . . . . . . . . . . . . . . USD 3,500. . . . . . . 4,433. . . . . . . 5,038
Altice S.A., Series 144A, Secured, Notes, Callable, 7.750% May 15, 2022 . . . . . . . . . . . . . . . . . . . . . . . . . . . . USD 5,750. . . . . . . 6,772. . . . . . . 7,913
Altice US Finance I Corporation, Series 144A, Secured, Notes, Callable, 5.375% Jul 15, 2023 . USD 3,500. . . . . . . 4,517. . . . . . . 4,715
AMC Entertainment Inc., Senior, Notes, Subordinated, Callable, 5.750% Jun 15, 2025 . . USD 1,000. . . . . . . 1,389. . . . . . . 1,349
AMC Networks Inc., Senior, Unsecured, Notes, Callable, 4.750% Dec 15, 2022 . . . . . . . . . . . . . . . . . . USD 750. . . . . . . . . 816. . . . . . . 1,002
American Airlines Group Inc., Series 144A, Senior, Unsecured, Notes, 5.500% Oct 1, 2019 . . . . . . . . . USD 1,750. . . . . . . 2,089. . . . . . . 2,389
American Axle & Manufacturing, Inc., Senior, Unsecured, Notes, Callable, 6.625% Oct 15, 2022 . . . . . . . . . . . . . . . . . . . . . . . . . . . . . . . . . . . . . . . . . . . . . . . USD 750. . . . . . . . . 865. . . . . . . 1,001
American Axle & Manufacturing, Inc., Series 144A, Senior, Unsecured, Notes, Callable, 6.500% Apr 1, 2027 . . . . . . . . . . . . . . . . . . . . . . . . . . . . . . . . . . . . . . . . . . . . USD 1,500. . . . . . . 1,964. . . . . . . 1,887
American Energy-Permian Basin LLC/AEPB Finance Corp., Series 144A, Senior, Unsecured, Notes, Callable, 7.125% Nov 1, 2020 . . . . . . . . . . . . . . . . . . . USD 2,000. . . . . . . 2,087. . . . . . . 2,140
American Tire Distributors, Inc., Series 144A, Senior, Notes, Subordinated, Callable, 10.250% Mar 1, 2022 . . . . . . . . . . . . . . . . . . . . . . . . . . . . . . . . . . . . . . . USD 1,000. . . . . . . 1,207. . . . . . . 1,339
AmeriGas Partners, L.P./AmeriGas Finance Corp., Senior, Unsecured, Notes, Callable, 5.875% Aug 20, 2026 . . . . . . . . . . . . . . . . . . . . . . . . . . . . . . . . . . . . . . . . . . . USD 1,000. . . . . . . 1,349. . . . . . . 1,329
Amkor Technology, Inc., Senior, Unsecured, Notes, Callable, 6.375% Oct 1, 2022 . . . . . . . . . . . . . . . . . . . . USD 1,000. . . . . . . 1,297. . . . . . . 1,349
Amsted Industries, Inc., Series 144A, Senior, Unsecured, Notes, Callable, 5.000% Mar 15, 2022 . . . . . . . . . . . . . . . . . . . . . . . . . . . . . . . . . . . . . . . . . . . . . . . USD 1,500. . . . . . . 1,878. . . . . . . 2,011
AmSurg Corporation, Senior, Unsecured, Notes, Callable, 5.625% Jul 15, 2022 . . . . . . . . . . . . . . . . . . . . USD 1,500. . . . . . . 1,712. . . . . . . 2,018
Anglo American Capital plc, Series 144A, Senior, Unsecured, Notes, 3.625% May 14, 2020 . . . . . . . USD 1,000. . . . . . . 1,169. . . . . . . 1,313
Anglo American Capital plc, Series 144A, Senior, Unsecured, Notes, 4.875% May 14, 2025 . . . . . . . USD 1,000. . . . . . . 1,087. . . . . . . 1,341
Antero Resources Corporation, Senior, Unsecured, Notes, Callable, 5.375% Nov 1, 2021 . . . . . . . . . . . USD 4,000. . . . . . . 4,702. . . . . . . 5,226
APX Group, Inc., Senior, Unsecured, Notes, Callable, 8.750% Dec 1, 2020 . . . . . . . . . . . . . . . . . . . . USD 2,500. . . . . . . 3,459. . . . . . . 3,339
Aramark Services, Inc., Senior, Unsecured, Notes, Callable, 5.125% Jan 15, 2024 . . . . . . . . . . . . . . . . . . . USD 1,500. . . . . . . 2,040. . . . . . . 2,042

BMO High Yield US Corporate Bond Hedged to CAD Index ETF(unaudited)
Schedule of Investment Portfolio (cont’d)
As at June 30, 2017 (All amounts in thousands of Canadian dollars, unless otherwise noted)
Par Value
(in thousands)Cost
($)
Fair Value
($)
Aramark Services, Inc., Senior, Unsecured, Notes, Callable, 4.750% Jun 1, 2026 . . . . . . . . . . . . . . . . . . . . USD 1,500. . . . . . . 1,947. . . . . . . 2,011
Arconic Inc., Senior, Unsecured, Notes, Callable, 5.125% Oct 1, 2024 . . . . . . . . . . . . . . . . . . . . . . . . . . . . . . . USD 2,000. . . . . . . 2,449. . . . . . . 2,691
Ardagh Packaging Finance PLC/Ardagh MP Holdings USA Inc., Series 144A, Secured, Notes, Callable, 4.625% May 15, 2023 . . . . . . . . . . . . . . . . . . USD 2,000. . . . . . . 2,584. . . . . . . 2,658
Ardagh Packaging Finance PLC/Ardagh MP Holdings USA Inc., Series 144A, Secured, Notes, Callable, 7.250% May 15, 2024 . . . . . . . . . . . . . . . . . . USD 2,000. . . . . . . 2,829. . . . . . . 2,834
Argos Merger Sub, Inc., Series 144A, Senior, Unsecured, Notes, Callable, 7.125% Mar 15, 2023 . . . . . . . . . . . . . . . . . . . . . . . . . . . . . . . . . . . . . . . . . . . . . . . USD 2,500. . . . . . . 3,198. . . . . . . 2,885
Ascent Resources-Utica Holdings LLC/ARU Finance Corp., Series 144A, Senior, Unsecured, Notes, Callable, 10.000% Apr 1, 2022 . . . . . . . . . . . . . . . . . . . USD 2,000. . . . . . . 2,793. . . . . . . 2,594
Ashland Inc., Senior, Unsecured, Notes, Callable, Multi-Couponed, 4.750% Aug 15, 2022 . . . . . . . . . USD 2,000. . . . . . . 2,176. . . . . . . 2,704
Avis Budget Car Rental LLC/Avis Budget Finance Inc., Senior, Unsecured, Notes, Callable, 5.500% Apr 1, 2023 . . . . . . . . . . . . . . . . . . . . . . . . . . . . . . USD 1,500. . . . . . . 1,859. . . . . . . 1,931
Avon Products, Inc., Senior, Unsecured, Notes, Multi-Step Coupon, 6.750% Mar 15, 2023 . . . . . . USD 1,500. . . . . . . 1,606. . . . . . . 1,773
B&G Foods, Inc., Senior, Unsecured, Notes, Callable, 4.625% Jun 1, 2021 . . . . . . . . . . . . . . . . . . . . USD 1,200. . . . . . . 1,350. . . . . . . 1,585
Ball Corporation, Senior, Unsecured, Notes, 4.375% Dec 15, 2020 . . . . . . . . . . . . . . . . . . . . . . . . . . . . . USD 1,500. . . . . . . 2,112. . . . . . . 2,045
Ball Corporation, Senior, Unsecured, Notes, 4.000% Nov 15, 2023 . . . . . . . . . . . . . . . . . . . . . . . . . . . . USD 1,000. . . . . . . 1,067. . . . . . . 1,326
Ball Corporation, Senior, Unsecured, Notes, 5.250% Jul 1, 2025 . . . . . . . . . . . . . . . . . . . . . . . . . . . . . . . USD 2,000. . . . . . . 2,455. . . . . . . 2,859
Belden Inc., Series 144A, Senior, Notes, Subordinated, Callable, 5.500% Sep 1, 2022 . . . USD 1,250. . . . . . . 1,454. . . . . . . 1,674
Berry Plastics Corporation, Secured, Notes, Callable, 5.500% May 15, 2022 . . . . . . . . . . . . . . . . . . USD 750. . . . . . . . . 816. . . . . . . 1,012
Berry Plastics Corporation, Secured, Notes, Callable, 5.125% Jul 15, 2023 . . . . . . . . . . . . . . . . . . . . USD 1,500. . . . . . . 1,970. . . . . . . 2,013
Blue Cube Spinco Inc., Senior, Unsecured, Notes, Callable, 9.750% Oct 15, 2023 . . . . . . . . . . . . . . . . . . . USD 800. . . . . . . 1,177. . . . . . . 1,258
Blue Cube Spinco Inc., Senior, Unsecured, Notes, Callable, 10.000% Oct 15, 2025 . . . . . . . . . . . . . . . . . USD 1,000. . . . . . . 1,478. . . . . . . 1,595
BMC Software Finance Inc., Series 144A, Senior, Unsecured, Notes, Callable, 8.125% Jul 15, 2021 . . . . . . . . . . . . . . . . . . . . . . . . . . . . . . . . . . . . . . . . . . . . . . . USD 2,500. . . . . . . 2,865. . . . . . . 3,364
Bombardier Inc., Series 144A, Senior, Unsecured, Notes, 6.125% Jan 15, 2023 . . . . . . . . . . . . . . . . . . . . . USD 3,000. . . . . . . 3,270. . . . . . . 3,895
Bombardier Inc., Series 144A, Senior, Unsecured, Notes, Callable, 7.500% Mar 15, 2025 . . . . . . . . . . USD 2,500. . . . . . . 3,250. . . . . . . 3,360
Boxer Parent Company, Inc., Series 144A, Senior, Unsecured, Notes, Callable, 9.000% Oct 15, 2019 . . . . . . . . . . . . . . . . . . . . . . . . . . . . . . . . . . . . . . . . . . . . . . . USD 1,000. . . . . . . 1,080. . . . . . . 1,297
Boyd Gaming Corporation, Senior, Unsecured, Notes, Callable, 6.875% May 15, 2023. . . . . . . . . . USD 2,600. . . . . . . 3,578. . . . . . . 3,608
Brookfield Residential Properties Inc., Series 144A, Senior, Unsecured, Notes, Callable, 6.500% Dec 15, 2020 . . . . . . . . . . . . . . . . . . . . . . . . . . . . . . . . . . . . . . . . . . . USD 2,000. . . . . . . 2,241. . . . . . . 2,684
Building Materials Corporation of America, Series 144A, Senior, Unsecured, Notes, Callable, 5.375% Nov 15, 2024 . . . . . . . . . . . . . . . . . . . . . . . . . . . . USD 1,500. . . . . . . 1,836. . . . . . . 2,035
Par Value
(in thousands)Cost
($)
Fair Value
($)
BWAY Holding Company, Series 144A, Secured, Notes, Callable, 5.500% Apr 15, 2024 . . . . . . . . . . USD 2,000. . . . . . . 2,686. . . . . . . 2,649
BWAY Holding Company, Series 144A, Senior, Unsecured, Notes, Callable, 7.250% Apr 15, 2025 . . . . . . . . . . . . . . . . . . . . . . . . . . . . . . . . . . . . . . . . . . . . . . . USD 2,000. . . . . . . 2,657. . . . . . . 2,629
California Resources Corporation, Series 144A, Secured, Notes, Callable, 8.000% Dec 15, 2022 USD 1,500. . . . . . . 1,274. . . . . . . 1,230
California Resources Corporation, Senior, Unsecured, Notes, Callable, 6.000% Nov 15, 2024 . . . . . . . . . . . . . . . . . . . . . . . . . . . . . . . . . . . . . . . . . . . . . . . USD 344. . . . . . . . . 395. . . . . . . . . 232
Calpine Corporation, Senior, Unsecured, Notes, Callable, 5.375% Jan 15, 2023 . . . . . . . . . . . . . . . . . . . USD 2,000. . . . . . . 2,146. . . . . . . 2,526
Calpine Corporation, Senior, Unsecured, Notes, Callable, 5.750% Jan 15, 2025 . . . . . . . . . . . . . . . . . . . USD 3,000. . . . . . . 3,322. . . . . . . 3,647
Calumet Specialty Products Partners LP/Calumet Finance Corporation, Senior, Unsecured, Notes, Callable, 6.500% Apr 15, 2021 . . . . . . . . . . . . . . . . . . . USD 2,000. . . . . . . 2,202. . . . . . . 2,256
Capsugel S.A., Series 144A, Senior, Unsecured, Notes, Callable, Pay-In-Kind, 7.000% May 15, 2019 . . . . . . . . . . . . . . . . . . . . . . . . . . . . . . . . . . . . . . . . . . . . . . . USD 994. . . . . . . 1,245. . . . . . . 1,289
Carrizo Oil & Gas, Inc., Senior, Unsecured, Notes, Callable, 6.250% Apr 15, 2023 . . . . . . . . . . . . . . . . . . . USD 1,500. . . . . . . 1,842. . . . . . . 1,872
Cascades Inc., Series 144A, Senior, Unsecured, Notes, Callable, 5.500% Jul 15, 2022 . . . . . . . . . . . USD 750. . . . . . . . . 800. . . . . . . . . 993
CCO Holdings LLC/CCO Holdings Capital Corporation, Series 144A, Senior, Unsecured, Notes, Callable, 5.125% May 1, 2023 . . . . . . . . . . . USD 1,900. . . . . . . 2,657. . . . . . . 2,581
CCO Holdings LLC/CCO Holdings Capital Corporation, Series 144A, Senior, Unsecured, Notes, Callable, 5.875% Apr 1, 2024 . . . . . . . . . . . . USD 3,900. . . . . . . 5,473. . . . . . . 5,393
CCO Holdings LLC/CCO Holdings Capital Corporation, Series 144A, Senior, Unsecured, Notes, Callable, 5.750% Feb 15, 2026 . . . . . . . . . . USD 3,000. . . . . . . 3,936. . . . . . . 4,163
CCO Holdings LLC/CCO Holdings Capital Corporation, Series 144A, Senior, Unsecured, Notes, Callable, 5.500% May 1, 2026 . . . . . . . . . . . USD 1,000. . . . . . . 1,432. . . . . . . 1,371
CCO Holdings LLC/CCO Holdings Capital Corporation, Series 144A, Senior, Unsecured, Notes, Callable, 5.125% May 1, 2027 . . . . . . . . . . . USD 4,900. . . . . . . 6,671. . . . . . . 6,481
CCO Holdings LLC/CCO Holdings Capital Corporation, Series 144A, Senior, Unsecured, Notes, Callable, 5.875% May 1, 2027 . . . . . . . . . . . USD 1,000. . . . . . . 1,446. . . . . . . 1,381
CDW LLC/CDW Finance Corp., Senior, Unsecured, Notes, Callable, 5.500% Dec 1, 2024. . . . . . . . . . . . USD 500. . . . . . . . . 651. . . . . . . . . 702
CDW LLC/CDW Finance Corp., Senior, Unsecured Notes, Callable, 5.000% Sep 1, 2025 . . . . . . . . . . . . USD 2,000. . . . . . . 2,725. . . . . . . 2,691
Centene Corporation, Senior, Unsecured, Notes, Callable, 5.625% Feb 15, 2021 . . . . . . . . . . . . . . . . . . USD 3,000. . . . . . . 4,219. . . . . . . 4,056
Centene Corporation, Senior, Unsecured, Notes, Callable, 4.750% Jan 15, 2025 . . . . . . . . . . . . . . . . . . . USD 2,000. . . . . . . 2,615. . . . . . . 2,678
CenturyLink Inc., Series V, Senior, Unsecured, Notes, 5.625% Apr 1, 2020 . . . . . . . . . . . . . . . . . . . . . . USD 1,500. . . . . . . 1,817. . . . . . . 2,059
CenturyLink Inc., Series Y, Senior, Unsecured, Notes, Callable, 7.500% Apr 1, 2024 . . . . . . . . . . . . USD 1,500. . . . . . . 2,133. . . . . . . 2,130
Cenveo Corporation, Series 144A, Secured, Notes, Callable, 6.000% Aug 1, 2019 . . . . . . . . . . . . . . . . . . . USD 750. . . . . . . . . 907. . . . . . . . . 819
Cequel Communications Holdings I LLC/Cequel Capital Corp., Series 144A, Senior, Unsecured, Notes, Callable, 6.375% Sep 15, 2020 . . . . . . . . . . USD 1,752. . . . . . . 1,803. . . . . . . 2,323
BMO High Yield US Corporate Bond Hedged to CAD Index ETF(unaudited)
Schedule of Investment Portfolio (cont’d)
As at June 30, 2017 (All amounts in thousands of Canadian dollars, unless otherwise noted)
Par Value
(in thousands)Cost
($)
Fair Value
($)
Cequel Communications Holdings I LLC/Cequel Capital Corp., Series 144A, Senior, Unsecured, Notes, Callable, 5.125% Dec 15, 2021 . . . . . . . . . . USD 1,500. . . . . . . 1,621. . . . . . . 1,987
CF Industries, Inc., Senior, Unsecured, Notes, 3.450% Jun 1, 2023 . . . . . . . . . . . . . . . . . . . . . . . . . . . . . . . USD 2,000. . . . . . . 2,544. . . . . . . 2,468
CF Industries, Inc., Senior, Unsecured, Notes, 5.375% Mar 15, 2044 . . . . . . . . . . . . . . . . . . . . . . . . . . . . . USD 1,000. . . . . . . 1,203. . . . . . . 1,161
Change Healthcare Holdings LLC/Change Healthcare Finance Inc., Series 144A, Senior, Unsecured, Notes, Callable, 5.750% Mar 1, 2025 . . . . . . . . . . . . . . . . . . . . . . . . . . . . . . . . . . . . . . . . . . . . . . . USD 1,500. . . . . . . 2,060. . . . . . . 1,991
Chemours Company, The, Senior, Unsecured, Notes, Callable, 6.625% May 15, 2023. . . . . . . . . . USD 3,000. . . . . . . 3,759. . . . . . . 4,114
Cheniere Corpus Christi Holdings, LLC, Senior, Secured, Notes, 5.875% Mar 31, 2025 . . . . . . . . . . USD 4,000. . . . . . . 5,503. . . . . . . 5,524
Chesapeake Energy Corporation, Secured, Notes, Callable, 8.000% Dec 15, 2022 . . . . . . . . . . . . . . . . . . USD 4,000. . . . . . . 3,402. . . . . . . 5,498
CHS/Community Health Systems, Inc., Senior, Unsecured, Notes, Callable, 8.000% Nov 15, 2019 . . . . . . . . . . . . . . . . . . . . . . . . . . . . . . . . . . . . . . . . . . . . . . . USD 3,300. . . . . . . 3,642. . . . . . . 4,301
CHS/Community Health Systems, Inc., Senior, Unsecured, Notes, Callable, 6.875% Feb 1, 2022 . . . . . . . . . . . . . . . . . . . . . . . . . . . . . . . . . . . . . . . . . . . . . . . USD 4,750. . . . . . . 5,832. . . . . . . 5,374
Cinemark USA, Inc., Senior, Unsecured, Notes, Callable, 4.875% Jun 1, 2023 . . . . . . . . . . . . . . . . . . . . USD 200. . . . . . . . . 248. . . . . . . . . 264
CIT Group, Inc., Senior, Unsecured, Notes, 3.875% Feb 19, 2019 . . . . . . . . . . . . . . . . . . . . . . . . . . . . . . . . . . . . . . USD 2,000. . . . . . . 2,733. . . . . . . 2,665
Clean Harbors, Inc., Senior, Unsecured, Notes, Callable, 5.125% Jun 1, 2021 . . . . . . . . . . . . . . . . . . . . USD 750. . . . . . . . . 812. . . . . . . . . 993
Clear Channel Communications, Inc., Senior, Secured, Notes, Callable, 9.000% Dec 15, 2019 USD 3,000. . . . . . . 3,256. . . . . . . 3,054
Clear Channel Worldwide Holdings, Inc., Senior, Unsecured, Notes, Callable, 6.500% Nov 15, 2022 . . . . . . . . . . . . . . . . . . . . . . . . . . . . . . . . . . . . . . . . . . . . . . . USD 2,000. . . . . . . 2,398. . . . . . . 2,665
Cliffs Natural Resources Inc., Series 144A, Secured, Notes, Callable, 8.250% Mar 31, 2020 . . . . . . . . . . USD 934. . . . . . . 1,043. . . . . . . 1,317
CNH Industrial Capital LLC, Senior, Unsecured, Notes, 3.625% Apr 15, 2018 . . . . . . . . . . . . . . . . . . . . . USD 1,000. . . . . . . 1,326. . . . . . . 1,307
CNH Industrial Capital LLC, Senior, Unsecured, Notes, 4.375% Nov 6, 2020 . . . . . . . . . . . . . . . . . . . . . . USD 1,000. . . . . . . 1,358. . . . . . . 1,360
CNH Industrial NV, Senior, Unsecured, Notes, 4.500% Aug 15, 2023 . . . . . . . . . . . . . . . . . . . . . . . . . . . . USD 1,000. . . . . . . 1,324. . . . . . . 1,373
CommScope Technologies Finance LLC, Series 144A, Senior, Secured, Notes, Callable, 6.000% Jun 15, 2025 . . . . . . . . . . . . . . . . . . . . . . . . . . . . . . . . . . . . . . . USD 1,500. . . . . . . 1,973. . . . . . . 2,081
CommScope Technologies LLC, Series 144A, Senior, Unsecured, Notes, Callable, 5.000% Mar 15, 2027 . . . . . . . . . . . . . . . . . . . . . . . . . . . . . . . . . . . . . . . . . . . . . . . USD 2,000. . . . . . . 2,646. . . . . . . 2,587
Communications Sales & Leasing, Inc., Senior, Unsecured, Notes, Callable, 8.250% Oct 15, 2023 . . . . . . . . . . . . . . . . . . . . . . . . . . . . . . . . . . . . . . . . . . . . . . . USD 1,500. . . . . . . 1,861. . . . . . . 2,004
Comstock Resources Inc., Series 144A, Secured, Notes, Callable, 10.000% Mar 15, 2020 . . . . . . . . . USD 1,000. . . . . . . 1,224. . . . . . . 1,281
Concho Resources Inc., Senior, Unsecured, Notes, Callable, 5.500% Apr 1, 2023 . . . . . . . . . . . . . . . . . . . . USD 3,000. . . . . . . 3,601. . . . . . . 4,007
Concordia Healthcare Corporation, Series 144A, Senior, Unsecured, Notes, Callable, 7.000% Apr 15, 2023 . . . . . . . . . . . . . . . . . . . . . . . . . . . . . . . . . . . . . . . . . . . USD 2,000. . . . . . . 2,444. . . . . . . . . 389
Par Value
(in thousands)Cost
($)
Fair Value
($)
CONSOL Energy Inc., Senior, Unsecured, Notes, Callable, 5.875% Apr 15, 2022 . . . . . . . . . . . . . . . . . . . USD 3,250. . . . . . . 3,721. . . . . . . 4,115
Consolidated Energy Finance S.A., Series 144A, Senior, Unsecured, Notes, Callable, 6.750% Oct 15, 2019 . . . . . . . . . . . . . . . . . . . . . . . . . . . . . . . . . . . . . . . . . . . USD 592. . . . . . . . . 721. . . . . . . . . 785
Continental Resources, Inc., Senior, Unsecured, Notes, Callable, 4.500% Apr 15, 2023 . . . . . . . . . . USD 1,300. . . . . . . 1,294. . . . . . . 1,610
Continental Resources, Inc., Senior, Unsecured, Notes, Callable, 3.800% Jun 1, 2024 . . . . . . . . . . . . USD 2,850. . . . . . . 2,669. . . . . . . 3,386
Crown Americas LLC/Crown Americas Capital Corp. IV, Senior, Unsecured, Notes, 4.500% Jan 15, 2023 . . . . . . . . . . . . . . . . . . . . . . . . . . . . . . . . . . . . . . . . . . . . . . . USD 1,500. . . . . . . 1,599. . . . . . . 2,038
CVR Refining LLC/Coffeyville Finance Inc., Secured, Notes, Callable, 6.500% Nov 1, 2022 . . . . . . . . . . . USD 750. . . . . . . . . 847. . . . . . . . . 982
DaVita Inc., Senior, Unsecured, Notes, Callable, 5.750% Aug 15, 2022 . . . . . . . . . . . . . . . . . . . . . . . . . . . . USD 1,000. . . . . . . 1,247. . . . . . . 1,334
DaVita Inc., Senior, Unsecured, Notes, Callable, 5.125% Jul 15, 2024 . . . . . . . . . . . . . . . . . . . . . . . . . . . . . . USD 2,000. . . . . . . 2,358. . . . . . . 2,633
DaVita Inc., Senior, Unsecured, Notes, Callable, 5.000% May 1, 2025 . . . . . . . . . . . . . . . . . . . . . . . . . . . . . USD 2,500. . . . . . . 3,101. . . . . . . 3,250
DCP Midstream LLC, Series 144A, Fixed to Floating, Junior, Notes, Subordinated, Callable, 5.850% May 21, 2043 . . . . . . . . . . . . . . . . . . . . . . . . . . . . . . . . . . . . . USD 1,204. . . . . . . 1,120. . . . . . . 1,452
Denbury Resources Inc., Senior, Notes, Subordinated, Callable, 5.500% May 1, 2022. . . USD 2,000. . . . . . . 2,226. . . . . . . 1,452
Deutsche Bank AG, Notes, Subordinated, 4.500% Apr 1, 2025 . . . . . . . . . . . . . . . . . . . . . . . . . . . . . . . . . . . . . . . . USD 2,000. . . . . . . 2,558. . . . . . . 2,577
Deutsche Bank AG, Fixed to Floating, Notes, Subordinated, Callable, 4.296% May 24, 2028 . USD 2,000. . . . . . . 2,546. . . . . . . 2,556
Diamond 1 Finance Corp./Diamond 2 Finance Corp., Series 144A, Senior, Unsecured, Notes, Callable, 5.875% Jun 15, 2021 . . . . . . . . . . . . . . . . . . . USD 4,000. . . . . . . 5,397. . . . . . . 5,434
Diamond Resorts International Inc., Series 144A, Secured, Notes, Callable, 7.750% Sep 1, 2023 . USD 1,250. . . . . . . 1,659. . . . . . . 1,716
Diamondback Energy Inc., Series 144A, Senior, Unsecured, Notes, Callable, 4.750% Nov 1, 2024 . . . . . . . . . . . . . . . . . . . . . . . . . . . . . . . . . . . . . . . . . . . . . . . USD 1,000. . . . . . . 1,307. . . . . . . 1,294
Diamondback Energy Inc., Series 144A, Senior, Unsecured, Notes, Callable, 5.375% May 31, 2025 . . . . . . . . . . . . . . . . . . . . . . . . . . . . . . . . . . . . . . . . . . . . . . . USD 1,000. . . . . . . 1,351. . . . . . . 1,329
DISH DBS Corporation, Senior, Unsecured, Notes, 5.875% Jul 15, 2022 . . . . . . . . . . . . . . . . . . . . . . . . . . . . . . USD 250. . . . . . . . . 289. . . . . . . . . 349
DISH DBS Corporation, Senior, Unsecured, Notes, 5.875% Nov 15, 2024 . . . . . . . . . . . . . . . . . . . . . . . . . . . . USD 4,000. . . . . . . 4,886. . . . . . . 5,531
DISH DBS Corporation, Senior, Unsecured, Notes, 7.750% Jul 1, 2026 . . . . . . . . . . . . . . . . . . . . . . . . . . . . . . . USD 2,000. . . . . . . 2,785. . . . . . . 3,070
DJO Finco Inc./DJO Finance LLC, Series 144A, Secured, Notes, Callable, 8.125% Jun 15, 2021 USD 2,000. . . . . . . 2,394. . . . . . . 2,419
Dollar Tree, Inc., Senior, Unsecured, Notes, Callable, 5.250% Mar 1, 2020. . . . . . . . . . . . . . . . . . . . USD 2,000. . . . . . . 2,566. . . . . . . 2,662
Dollar Tree, Inc., Senior, Unsecured, Notes, Callable, 5.750% Mar 1, 2023. . . . . . . . . . . . . . . . . . . . USD 2,500. . . . . . . 3,258. . . . . . . 3,416
DuPont Fabros Technology LP, Senior, Unsecured, Notes, Callable, 5.875% Sep 15, 2021 . . . . . . . . . . USD 750. . . . . . . . . 836. . . . . . . 1,012
Dynegy Inc., Senior, Unsecured, Notes, Callable, 6.750% Nov 1, 2019 . . . . . . . . . . . . . . . . . . . . . . . . . . . . . . USD 250. . . . . . . . . 312. . . . . . . . . 334
Dynegy Inc., Senior, Unsecured, Notes, Callable, 7.375% Nov 1, 2022 . . . . . . . . . . . . . . . . . . . . . . . . . . . . . . USD 2,500. . . . . . . 2,899. . . . . . . 3,201

BMO High Yield US Corporate Bond Hedged to CAD Index ETF(unaudited)
Schedule of Investment Portfolio (cont’d)
As at June 30, 2017 (All amounts in thousands of Canadian dollars, unless otherwise noted)
Par Value
(in thousands)Cost
($)
Fair Value
($)
Dynegy Inc., Senior, Unsecured, Notes, Callable, 7.625% Nov 1, 2024 . . . . . . . . . . . . . . . . . . . . . . . . . . . . . . USD 2,750. . . . . . . 3,394. . . . . . . 3,459
EMC Corporation, Senior, Unsecured, Notes, 1.875% Jun 1, 2018 . . . . . . . . . . . . . . . . . . . . . . . . . . . . . . . USD 1,800. . . . . . . 2,334. . . . . . . 2,321
EMC Corporation, Senior, Unsecured, Notes, 2.650% Jun 1, 2020 . . . . . . . . . . . . . . . . . . . . . . . . . . . . . . . USD 2,000. . . . . . . 2,539. . . . . . . 2,543
Endo Finance LLC & Endo Finco Inc., Series 144A, Senior, Unsecured, Notes, Callable, 5.375% Jan 15, 2023 . . . . . . . . . . . . . . . . . . . . . . . . . . . . . . . . . . . . . . . . . . . USD 1,000. . . . . . . 1,067. . . . . . . 1,083
Endo Finance LLC/Endo Ltd./Endo Finco Inc., Series 144A, Senior, Unsecured, Notes, Callable, 6.000% Jul 15, 2023 . . . . . . . . . . . . . . . . . . . . . . . . . . . . . . USD 2,500. . . . . . . 3,208. . . . . . . 2,723
Endo Finance LLC/Endo Ltd./Endo Finco Inc., Series 144A, Senior, Unsecured, Notes, Callable, 6.000% Feb 1, 2025 . . . . . . . . . . . . . . . . . . . . . . . . . . . . . . USD 1,500. . . . . . . 1,915. . . . . . . 1,600
Enel S.p.A., Series 144A, Fixed to Floating, Notes, Subordinated, Callable, 8.750% Sep 24, 2073 . . USD 2,250. . . . . . . 2,879. . . . . . . 3,465
Energy Transfer Equity, L.P., Secured, Notes, Callable, 5.875% Jan 15, 2024 . . . . . . . . . . . . . . . . . . . USD 750. . . . . . . . . 887. . . . . . . 1,029
Energy Transfer Equity, L.P., Senior, Unsecured, Notes, Callable, 5.500% Jun 1, 2027 . . . . . . . . . . . . USD 2,250. . . . . . . 2,633. . . . . . . 3,020
Ensco PLC, Senior, Unsecured, Notes, Callable, 5.200% Mar 15, 2025 . . . . . . . . . . . . . . . . . . . . . . . . . . . . . USD 2,000. . . . . . . 1,554. . . . . . . 2,101
Envision Healthcare Corporation, Series 144A, Senior, Unsecured, Notes, Callable, 5.125% Jul 1, 2022 . . . . . . . . . . . . . . . . . . . . . . . . . . . . . . . . . . . . . . . . . . . . USD 1,750. . . . . . . 2,253. . . . . . . 2,326
EP Energy LLC/Everest Acquisition Finance Inc., Series 144A, Secured, Notes, Callable, 8.000% Feb 15, 2025 . . . . . . . . . . . . . . . . . . . . . . . . . . . . . . . . . . . . . . USD 2,250. . . . . . . 2,804. . . . . . . 2,181
Equinix, Inc., Senior, Unsecured, Notes, Callable, 5.375% Apr 1, 2023 . . . . . . . . . . . . . . . . . . . . . . . . . . . . . . USD 3,250. . . . . . . 3,904. . . . . . . 4,388
Equinix, Inc., Senior, Unsecured, Notes, Callable, 5.875% Jan 15, 2026 . . . . . . . . . . . . . . . . . . . . . . . . . . . . . USD 1,000. . . . . . . 1,411. . . . . . . 1,414
Escow Corporation, Secured, Notes, 6.000% Oct 1, 2020 . . . . . . . . . . . . . . . . . . . . . . . . . . . . . . . . . . . . . . . . . . . . . . . USD 2,900. . . . . . . 3,373. . . . . . . 4,033
ESH Hospitality, Inc., Series 144A, Senior, Unsecured, Notes, Callable, 5.250% May 1, 2025 . . . . . . . . . . . . . . . . . . . . . . . . . . . . . . . . . . . . . . . . . . . . . . . USD 2,250. . . . . . . 2,850. . . . . . . 3,005
Felcor Lodging Limited Partnership, Secured, Notes, Callable, 5.625% Mar 1, 2023 . . . . . . . . . . . USD 750. . . . . . . . . 885. . . . . . . 1,010
Fiat Chrysler Automobiles N.V., Senior, Unsecured, Notes, 4.500% Apr 15, 2020 . . . . . . . . . . . . . . . . . . . . . USD 2,500. . . . . . . 3,148. . . . . . . 3,323
Fiat Chrysler Automobiles N.V., Senior, Unsecured, Notes, 5.250% Apr 15, 2023 . . . . . . . . . . . . . . . . . . . . . USD 1,500. . . . . . . 1,984. . . . . . . 1,974
First Data Corporation, Series 144A, Senior, Unsecured, Notes, Callable, 7.000% Dec 1, 2023 . . . . . . . . . . . . . . . . . . . . . . . . . . . . . . . . . . . . . . . . . . . . . . . USD 6,000. . . . . . . 8,044. . . . . . . 8,306
First Data Corporation, Series 144A, Secured, Notes, Callable, 5.750% Jan 15, 2024 . . . . . . . . . . . USD 3,000. . . . . . . 3,923. . . . . . . 4,046
First Quality Finance Company Inc., Series 144A, Senior, Unsecured, Notes, Callable, 4.625% May 15, 2021 . . . . . . . . . . . . . . . . . . . . . . . . . . . . . . . . . . . . . USD 1,500. . . . . . . 1,582. . . . . . . 1,970
First Quantum Minerals Ltd., Series 144A, Senior, Unsecured, Notes, Callable, 7.000% Feb 15, 2021 . . . . . . . . . . . . . . . . . . . . . . . . . . . . . . . . . . . . . . . . . . . . . . . USD 2,000. . . . . . . 2,336. . . . . . . 2,658
First Quantum Minerals Ltd., Series 144A, Senior, Unsecured, Notes, Callable, 7.500% Apr 1, 2025 . . . . . . . . . . . . . . . . . . . . . . . . . . . . . . . . . . . . . . . . . . . . . . . USD 2,500. . . . . . . 3,385. . . . . . . 3,169
Par Value
(in thousands)Cost
($)
Fair Value
($)
Florida East Coast Holdings Corporation, Series 144A, Secured, Notes, Callable, 6.750% May 1, 2019 . . . . . . . . . . . . . . . . . . . . . . . . . . . . . . . . . . . . . . . . . . . . . . . USD 1,500. . . . . . . 1,707. . . . . . . 1,991
Freeport-McMoRan Inc., Senior, Unsecured, Notes, 3.100% Mar 15, 2020 . . . . . . . . . . . . . . . . . . . . . . . . . . . . . USD 3,000. . . . . . . 3,937. . . . . . . 3,788
Freeport-McMoRan Inc., Senior, Unsecured, Notes, Callable, 3.875% Mar 15, 2023 . . . . . . . . . . . . . . . . . . USD 1,400. . . . . . . 1,339. . . . . . . 1,693
Freeport-McMoRan Inc., Senior, Unsecured, Notes, Callable, 5.450% Mar 15, 2043 . . . . . . . . . . . . . . . . . . USD 2,250. . . . . . . 1,975. . . . . . . 2,513
Fresh Market Inc., The, Series 144A, Secured, Notes, Callable, 9.750% May 1, 2023 . . . . . . . . . . . USD 1,500. . . . . . . 1,861. . . . . . . 1,624
Frontier Communications Corporation, Senior, Unsecured, Notes, Callable, 10.500% Sep 15, 2022 . . . . . . . . . . . . . . . . . . . . . . . . . . . . . . . . . . . . . . . . . . . . . . . USD 4,000. . . . . . . 5,384. . . . . . . 4,947
Frontier Communications Corporation, Senior, Unsecured, Notes, Callable, 11.000% Sep 15, 2025 . . . . . . . . . . . . . . . . . . . . . . . . . . . . . . . . . . . . . . . . . . . . . . . USD 3,000. . . . . . . 4,104. . . . . . . 3,594
Gannett Co., Inc., Senior, Unsecured, Notes, Callable, 5.125% Oct 15, 2019 . . . . . . . . . . . . . . . . . . . USD 1,000. . . . . . . 1,103. . . . . . . 1,326
Gannett Co., Inc., Senior, Unsecured, Notes, Callable, 6.375% Oct 15, 2023 . . . . . . . . . . . . . . . . . . . USD 1,500. . . . . . . 1,704. . . . . . . 2,052
Gates Global LLC/Gates Global Company, Series 144A, Senior, Unsecured, Notes, Callable, 6.000% Jul 15, 2022 . . . . . . . . . . . . . . . . . . . . . . . . . . . . . . USD 1,500. . . . . . . 1,820. . . . . . . 1,945
General Cable Corporation, Senior, Unsecured, Notes, Callable, Multi-Couponed, 5.750% Oct 1, 2022 . . . . . . . . . . . . . . . . . . . . . . . . . . . . . . . . . . . . . . . . . . . . . . . USD 1,000. . . . . . . 1,192. . . . . . . 1,287
GLP Capital LP/GLP Financing II Inc., Senior, Unsecured, Notes, Callable, 4.875% Nov 1, 2020 . . . . . . . . . . . . . . . . . . . . . . . . . . . . . . . . . . . . . . . . . . . . . . . USD 2,500. . . . . . . 2,900. . . . . . . 3,457
GLP Capital LP/GLP Financing II Inc., Senior, Unsecured, Notes, 5.375% Apr 15, 2026. . . . . . . . USD 1,000. . . . . . . 1,305. . . . . . . 1,412
Goodyear Tire & Rubber Company, The, Senior, Unsecured, Notes, Callable, 5.125% Nov 15, 2023 . . . . . . . . . . . . . . . . . . . . . . . . . . . . . . . . . . . . . . . . . . . . . . . USD 2,000. . . . . . . 2,717. . . . . . . 2,714
Gray Television, Inc., Series 144A, Senior, Unsecured, Notes, Callable, 5.125% Oct 15, 2024 . . . . . . . . . . . . . . . . . . . . . . . . . . . . . . . . . . . . . . . . . . . . . . . USD 1,500. . . . . . . 1,926. . . . . . . 1,965
Gulfport Energy Corporation, Series 144A, Senior, Unsecured, Notes, Callable, 6.000% Oct 15, 2024 . . . . . . . . . . . . . . . . . . . . . . . . . . . . . . . . . . . . . . . . . . . . . . . USD 1,000. . . . . . . 1,350. . . . . . . 1,261
Gulfport Energy Corporation, Series 144A, Senior, Unsecured, Notes, Callable, 6.375% May 15, 2025 . . . . . . . . . . . . . . . . . . . . . . . . . . . . . . . . . . . . . . . . . . . . . . . USD 1,000. . . . . . . 1,349. . . . . . . 1,274
H&E Equipment Services Inc., Senior, Unsecured, Notes, Callable, 7.000% Sep 1, 2022 . . . . . . . . . . . . USD 1,000. . . . . . . 1,055. . . . . . . 1,349
Halcon Resources Corporation, Series 144A, Senior, Unsecured, Notes, Callable, 6.750% Feb 15, 2025 . . . . . . . . . . . . . . . . . . . . . . . . . . . . . . . . . . . . . . . . . . . . . . . USD 2,000. . . . . . . 2,618. . . . . . . 2,334
Hanesbrands, Inc., Series 144A, Senior, Unsecured, Notes, Callable, 4.625% May 15, 2024. . . . . . . . . . USD 1,500. . . . . . . 1,959. . . . . . . 1,972
Hanesbrands, Inc., Series 144A, Senior, Unsecured, Notes, Callable, 4.875% May 15, 2026. . . . . . . . . . USD 1,500. . . . . . . 1,961. . . . . . . 1,974
Harland Clarke Holdings Corp., Series 144A, Senior, Unsecured, Notes, Callable, 9.250% Mar 1, 2021 . . . . . . . . . . . . . . . . . . . . . . . . . . . . . . . . . . . . . . . . . . . . . . . USD 1,000. . . . . . . 1,230. . . . . . . 1,269
HCA, Inc., Secured, Notes, 3.750% Mar 15, 2019 . . USD 1,000. . . . . . . 1,340. . . . . . . 1,323HCA, Inc., Secured, Notes, 5.000% Mar 15, 2024 . . USD 1,000. . . . . . . 1,380. . . . . . . 1,373

BMO High Yield US Corporate Bond Hedged to CAD Index ETF(unaudited)
Schedule of Investment Portfolio (cont’d)
As at June 30, 2017 (All amounts in thousands of Canadian dollars, unless otherwise noted)
Par Value
(in thousands)Cost
($)
Fair Value
($)
HCA, Inc., Senior, Unsecured, Notes, 5.375% Feb 1, 2025 . . . . . . . . . . . . . . . . . . . . . . . . . . . . . . . . . . . . . . . . . . . . USD 6,000. . . . . . . 7,798. . . . . . . 8,209
HCA, Inc., Secured, Notes, Callable, 5.250% Jun 15, 2026 . . . . . . . . . . . . . . . . . . . . . . . . . . . . . . . . . . . . . . . . . . . . . . . USD 2,000. . . . . . . 2,937. . . . . . . 2,801
HCA, Inc., Secured, Notes, Callable, 4.500% Feb 15, 2027 . . . . . . . . . . . . . . . . . . . . . . . . . . . . . . . . . . . . . . . . . . . USD 3,000. . . . . . . 4,184. . . . . . . 4,002
HD Supply, Inc., Series 144A, Secured, Notes, Callable, 5.250% Dec 15, 2021 . . . . . . . . . . . . . . . . . . USD 1,000. . . . . . . 1,286. . . . . . . 1,360
HD Supply, Inc., Series 144A, Senior, Unsecured, Notes, Callable, 5.750% Apr 15, 2024 . . . . . . . . . . USD 2,000. . . . . . . 2,670. . . . . . . 2,759
HealthSouth Corporation, Senior, Unsecured, Notes, Callable, 5.750% Nov 1, 2024 . . . . . . . . . . . USD 2,250. . . . . . . 2,974. . . . . . . 2,998
Hertz Corporation, The, Senior, Unsecured, Notes, Callable, 5.875% Oct 15, 2020 . . . . . . . . . . . . . . . . . . . USD 1,500. . . . . . . 1,756. . . . . . . 1,877
Hilcorp Energy I LP/Hilcorp Finance Company, Series144A, Senior, Unsecured, Notes, Callable, 5.750% Oct 1, 2025 . . . . . . . . . . . . . . . . . . . . . . . . . . . . . . . USD 1,500. . . . . . . 1,978. . . . . . . 1,833
Hilton Domestic Operating Company, Inc., Series 144A, Callable, 4.250% Sep 1, 2024 . . . . . . . . . . . . USD 200. . . . . . . . . 261. . . . . . . . . 262
Hilton Worldwide Finance LLC/Hilton Worldwide Finance Corporation, Series 144A, Senior, Unsecured, Notes, Callable, 4.875% Apr 1, 2027 . . . . . . . . . . . . . . . . . . . . . . . . . . . . . . . . . . . . . . . . . . . . . . . USD 2,000. . . . . . . 2,681. . . . . . . 2,701
Hockey Merger Sub 2 Inc., Series 144A, Senior, Unsecured, Notes, Callable, 7.875% Oct 1, 2021 USD 2,000. . . . . . . 2,349. . . . . . . 2,707
Hologic, Inc., Series 144A, Senior, Unsecured, Notes, Callable, 5.250% Jul 15, 2022 . . . . . . . . . . . USD 1,500. . . . . . . 2,117. . . . . . . 2,042
Howard Hughes Corporation, The, Series 144A, Senior, Unsecured, Notes, Callable, 5.375% Mar 15, 2025 . . . . . . . . . . . . . . . . . . . . . . . . . . . . . . . . . . . . . . . . . . . USD 2,000. . . . . . . 2,649. . . . . . . 2,650
HRG Group Inc, Senior, Unsecured, Notes, Callable, 7.750% Jan 15, 2022 . . . . . . . . . . . . . . . . . . . . . . . . . . . . . USD 3,000. . . . . . . 3,623. . . . . . . 4,085
Hughes Satellite Systems Corporation, Secured, Notes, 5.250% Aug 1, 2026 . . . . . . . . . . . . . . . . . . . . . . USD 1,965. . . . . . . 2,622. . . . . . . 2,663
Huntington Ingalls Industries, Inc., Series 144A, Senior, Unsecured, Notes, Callable, 5.000% Nov 15, 2025 . . . . . . . . . . . . . . . . . . . . . . . . . . . . . . . . . . . . . . . . . . . USD 2,250. . . . . . . 3,052. . . . . . . 3,111
Huntsman International LLC., Senior, Unsecured, Notes, 4.875% Nov 15, 2020 . . . . . . . . . . . . . . . . . . . . USD 1,000. . . . . . . 1,033. . . . . . . 1,368
Icahn Enterprises LP/Icahn Enterprises Finance Corp., Senior, Unsecured, Notes, Callable, 4.875% Mar 15, 2019 . . . . . . . . . . . . . . . . . . . . . . . . . . . . . USD 1,250. . . . . . . 1,465. . . . . . . 1,637
Icahn Enterprises LP/Icahn Enterprises Finance Corp., Senior, Unsecured, Notes, Callable, 6.000% Aug 1, 2020 . . . . . . . . . . . . . . . . . . . . . . . . . . . . . . USD 2,000. . . . . . . 2,256. . . . . . . 2,671
Icahn Enterprises LP/Icahn Enterprises Finance Corp., Senior, Unsecured, Notes, Callable, 5.875% Feb 1, 2022 . . . . . . . . . . . . . . . . . . . . . . . . . . . . . . USD 1,000. . . . . . . 1,165. . . . . . . 1,323
IHO Verwaltungs GmbH, Series 144A, Senior, Secured, Callable, 4.500% Sep 15, 2023 . . . . . . . . USD 3,250. . . . . . . 4,288. . . . . . . 4,278
IHS Markit Ltd., Series 144A, Senior, Unsecured, Notes, Callable, 5.000% Nov 1, 2022 . . . . . . . . . . . USD 1,000. . . . . . . 1,263. . . . . . . 1,401
Inception Merger Sub Inc./Rackspace Hosting Inc., Series 144A, Senior, Unsecured, Notes, Callable, 8.625% Nov 15, 2024 . . . . . . . . . . . . . . . . . . USD 2,000. . . . . . . 2,683. . . . . . . 2,762
Infor (US), Inc., Senior, Unsecured, Notes, Callable, 6.500% May 15, 2022 . . . . . . . . . . . . . . . . . . . . . . . . . . . . USD 1,000. . . . . . . 1,225. . . . . . . 1,339
Par Value
(in thousands)Cost
($)
Fair Value
($)
Infor Software Parent LLC/Infor Software Parent Inc., Series 144A, Senior, Unsecured, Notes, Callable, 7.125% May 1, 2021 . . . . . . . . . . . . . . . . . . . USD 3,000. . . . . . . 3,398. . . . . . . 4,017
Ingles Markets Inc., Senior, Unsecured, Notes, Callable, 5.750% Jun 15, 2023 . . . . . . . . . . . . . . . . . . . USD 1,000. . . . . . . 1,108. . . . . . . 1,271
Inmarsat Finance Plc, Series 144A, Senior, Unsecured, Notes, Callable, 4.875% May 15, 2022 . . . . . . . . . . . . . . . . . . . . . . . . . . . . . . . . . . . . . . . . . . . . . . . USD 2,000. . . . . . . 2,193. . . . . . . 2,632
Intelsat (Luxembourg) S.A., Senior, Unsecured, Notes, Callable, 7.750% Jun 1, 2021 . . . . . . . . . . . . USD 1,500. . . . . . . 1,684. . . . . . . 1,070
Intelsat Jackson Holdings S.A., Senior, Unsecured, Notes, Callable, 5.500% Aug 1, 2023 . . . . . . . . . . . USD 6,000. . . . . . . 6,531. . . . . . . 6,439
InterGen NV, Series 144A, Secured, Notes, Callable, 7.000% Jun 30, 2023 . . . . . . . . . . . . . . . . . . . USD 1,130. . . . . . . 1,228. . . . . . . 1,410
International Game Technology PLC, Series 144A, Secured, Notes, Callable, 6.250% Feb 15, 2022 USD 2,000. . . . . . . 2,469. . . . . . . 2,830
International Game Technology PLC, Series 144A, Secured, Notes, Callable, 6.500% Feb 15, 2025 USD 2,450. . . . . . . 3,000. . . . . . . 3,491
Intesa Sanpaolo S.p.A., Series 144A, Notes, Subordinated, 5.017% Jun 26, 2024 . . . . . . . . . . . . . USD 2,000. . . . . . . 2,309. . . . . . . 2,633
Intesa Sanpaolo S.p.A., Series 144A, Notes, Subordinated, 5.710% Jan 15, 2026 . . . . . . . . . . . . . USD 1,475. . . . . . . 1,919. . . . . . . 2,023
INVISTA Finance, LLC, Series 144A, Secured, Notes, 4.250% Oct 15, 2019 . . . . . . . . . . . . . . . . . . . . . . . . . . . . . USD 1,500. . . . . . . 1,976. . . . . . . 1,990
Iron Mountain Incorporated, Series 144A, Senior, Unsecured, Notes, Callable, 6.000% Oct 1, 2020 USD 1,000. . . . . . . 1,355. . . . . . . 1,342
Iron Mountain Incorporated, Senior, Unsecured, Notes, Callable, 6.000% Aug 15, 2023 . . . . . . . . . . USD 1,000. . . . . . . 1,127. . . . . . . 1,371
Iron Mountain Incorporated, Senior, Notes, Subordinated, Callable, 5.750% Aug 15, 2024 . USD 2,250. . . . . . . 2,550. . . . . . . 2,980
iStar Inc., Senior, Unsecured, Notes, Callable, 5.000% Jul 1, 2019 . . . . . . . . . . . . . . . . . . . . . . . . . . . . . . . USD 1,750. . . . . . . 1,868. . . . . . . 2,292
Jaguar Holding Company II/Pharmaceutical Product Development LLC, Series 144A, Senior, Unsecured, Notes, Callable, 6.375% Aug 1, 2023 . . . . . . . . . . . . . . . . . . . . . . . . . . . . . . . . . . . . . . . . . . . . . . . USD 2,000. . . . . . . 2,741. . . . . . . 2,733
Jaguar Land Rover Automotive PLC, Series 144A, Senior, Unsecured, Notes, 4.125% Dec 15, 2018 USD 2,750. . . . . . . 3,169. . . . . . . 3,642
JBS USA LLC/JBS USA Finance Inc., Series 144A, Senior, Unsecured, Notes, Callable, 5.875% Jul 15, 2024 . . . . . . . . . . . . . . . . . . . . . . . . . . . . . . . . . . . . . . . . . . . USD 2,500. . . . . . . 3,079. . . . . . . 3,060
Jefferies Finance LLC/JFIN Co-Issuer Corp., Series 144A, Senior, Unsecured, Notes, Callable, 7.375% Apr 1, 2020 . . . . . . . . . . . . . . . . . . . . . . . . . . . . . . USD 1,000. . . . . . . 1,111. . . . . . . 1,329
Jupiter Resources Inc., Series 144A, Senior, Unsecured, Notes, Callable, 8.500% Oct 1, 2022 USD 1,500. . . . . . . 1,554. . . . . . . 1,454
K. Hovnanian Enterprises, Inc., Series 144A, Secured, Notes, Callable, 7.250% Oct 15, 2020 USD 1,250. . . . . . . 1,420. . . . . . . 1,649
KFC Holding Co./Pizza Hut Holdings LLC/Taco Bell of America LLC, Series 144A, Senior, Unsecured, Notes, Callable, 5.000% Jun 1, 2024 . . . . . . . . . . . . USD 1,000. . . . . . . 1,362. . . . . . . 1,347
KFC Holding Co./Pizza Hut Holdings LLC/Taco Bell of America LLC, Series 144A, Senior, Unsecured, Notes, Callable, 5.250% Jun 1, 2026 . . . . . . . . . . . . USD 2,000. . . . . . . 2,761. . . . . . . 2,730
Kindred Healthcare, Inc., Senior, Unsecured, Notes, Callable, 6.375% Apr 15, 2022 . . . . . . . . . . . . . . . . . . . USD 3,250. . . . . . . 3,811. . . . . . . 4,151
Kinetics Concepts Inc./KCI USA Inc., Series 144A, Secured, Notes, Callable, 7.875% Feb 15, 2021 USD 1,000. . . . . . . 1,409. . . . . . . 1,375

BMO High Yield US Corporate Bond Hedged to CAD Index ETF(unaudited)
Schedule of Investment Portfolio (cont’d)
As at June 30, 2017 (All amounts in thousands of Canadian dollars, unless otherwise noted)
Par Value
(in thousands)Cost
($)
Fair Value
($)
KLX Inc., Series 144A, Senior, Unsecured, Notes, Callable, 5.875% Dec 1, 2022 . . . . . . . . . . . . . . . . . . . . USD 2,500. . . . . . . 3,118. . . . . . . 3,400
Koninklijke (Royal) KPN N.V., Series 144A, Senior, Notes, Subordinated, Callable, 7.000% Mar 28, 2073 . . . . . . . . . . . . . . . . . . . . . . . . . . . . . . . . . . . . . . . . . . . . . . . USD 1,000. . . . . . . 1,362. . . . . . . 1,438
Kronos Acquisition Holdings Inc., Series 144A, Senior, Unsecured, Notes, Callable, 9.000% Aug 15, 2023 . . . . . . . . . . . . . . . . . . . . . . . . . . . . . . . . . . . . . . . . . . . USD 1,500. . . . . . . 2,053. . . . . . . 1,935
L Brands, Inc., Senior, Unsecured, Notes, 6.875% Nov 1, 2035 . . . . . . . . . . . . . . . . . . . . . . . . . . . . . . . . . . . . . . . USD 1,500. . . . . . . 2,135. . . . . . . 1,877
Lamar Media Corporation, Senior, Notes, Subordinated, Callable, 5.000% May 1, 2023. . . USD 2,500. . . . . . . 2,768. . . . . . . 3,355
Lamb Weston Holdings, Inc., Series 144A, Senior, Unsecured, Notes, Callable, 4.625% Nov 1, 2024 . . . . . . . . . . . . . . . . . . . . . . . . . . . . . . . . . . . . . . . . . . . . . . . USD 1,000. . . . . . . 1,339. . . . . . . 1,336
Lennar Corporation, Senior, Unsecured, Notes, Callable, 4.125% Jan 15, 2022 . . . . . . . . . . . . . . . . . . . USD 2,500. . . . . . . 3,379. . . . . . . 3,347
Level 3 Financing Inc., Senior, Unsecured, Notes, Callable, 5.375% Aug 15, 2022 . . . . . . . . . . . . . . . . . . USD 1,000. . . . . . . 1,247. . . . . . . 1,332
Level 3 Financing Inc., Senior, Unsecured, Notes, Callable, 5.375% May 1, 2025 . . . . . . . . . . . . . . . . . . . USD 1,500. . . . . . . 2,056. . . . . . . 2,047
LifePoint Hospitals, Inc., Senior, Unsecured, Notes, Callable, 5.500% Dec 1, 2021 . . . . . . . . . . . . . . . . . . . . USD 1,500. . . . . . . 1,685. . . . . . . 2,013
LifePoint Hospitals, Inc., Senior, Unsecured, Notes, Callable, 5.875% Dec 1, 2023 . . . . . . . . . . . . . . . . . . . . USD 1,500. . . . . . . 2,032. . . . . . . 2,052
LKQ Corporation, Senior, Unsecured, Notes, Callable, 4.750% May 15, 2023 . . . . . . . . . . . . . . . . . . USD 1,250. . . . . . . 1,510. . . . . . . 1,653
Mallinckrodt International Finance SA/Mallinckrodt CB LLC, Series 144A, Senior, Unsecured, Notes, Callable, 4.875% Apr 15, 2020 . . . . . . . . . . . . . . . . . . . USD 1,000. . . . . . . 1,334. . . . . . . 1,263
Mallinckrodt International Finance SA/Mallinckrodt CB LLC, Series 144A, Senior, Unsecured, Notes, Callable, 5.750% Aug 1, 2022 . . . . . . . . . . . . . . . . . . . USD 1,200. . . . . . . 1,354. . . . . . . 1,463
Mallinckrodt International Finance SA/Mallinckrodt CB LLC, Series 144A, Senior, Unsecured, Notes, Callable, 5.625% Oct 15, 2023 . . . . . . . . . . . . . . . . . . . USD 1,000. . . . . . . 1,307. . . . . . . 1,185
MDC Partners Inc., Series 144A, Senior, Unsecured, Notes, Callable, 6.500% May 1, 2024 . . . . . . . . . . . USD 1,500. . . . . . . 1,974. . . . . . . 1,940
MEG Energy Corporation, Series 144A, Senior, Unsecured, Notes, Callable, 6.375% Jan 30, 2023 . . . . . . . . . . . . . . . . . . . . . . . . . . . . . . . . . . . . . . . . . . . . . . . USD 1,000. . . . . . . 1,119. . . . . . . 1,002
MEG Energy Corporation, Series 144A, Senior, Unsecured, Notes, Callable, 7.000% Mar 31, 2024 . . . . . . . . . . . . . . . . . . . . . . . . . . . . . . . . . . . . . . . . . . . . . . . USD 550. . . . . . . . . 649. . . . . . . . . 549
MEG Energy Corporation, Series 144A, Secured Notes, Callable, 6.500% Jan 15, 2025 . . . . . . . . . . . USD 2,000. . . . . . . 2,640. . . . . . . 2,360
MGM Growth Properties Operating Partnership LP/MGP Finance Co-Issuer Inc., Senior, Unsecured, Notes, Callable, 5.625% May 1, 2024 . . . . . . . . . . . USD 2,000. . . . . . . 2,628. . . . . . . 2,824
MGM Resorts International, Senior, Unsecured, Notes, 6.625% Dec 15, 2021 . . . . . . . . . . . . . . . . . . . . . USD 2,000. . . . . . . 2,081. . . . . . . 2,905
MGM Resorts International, Senior, Unsecured, Notes, 6.000% Mar 15, 2023 . . . . . . . . . . . . . . . . . . . . USD 1,070. . . . . . . 1,419. . . . . . . 1,533
Michaels Stores Inc., Series 144A, Senior, Notes, Subordinated, Callable, 5.875% Dec 15, 2020 . . USD 750. . . . . . . . . 813. . . . . . . . . 997
Micron Technology, Inc., Senior, Unsecured, Notes, Callable, 5.875% Feb 15, 2022 . . . . . . . . . . . . . . . . . . USD 2,000. . . . . . . 2,368. . . . . . . 2,710
Par Value
(in thousands)Cost
($)
Fair Value
($)
Micron Technology, Inc., Series 144A, Senior, Unsecured, Notes, Callable, 5.250% Aug 1, 2023 . . . . . . . . . . . . . . . . . . . . . . . . . . . . . . . . . . . . . . . . . . . . . . . USD 1,000. . . . . . . 1,201. . . . . . . 1,349
Millicom International Cellular S.A., Series 144A, Senior, Unsecured, Notes, Callable, 6.625% Oct 15, 2021 . . . . . . . . . . . . . . . . . . . . . . . . . . . . . . . . . . . . . . . . . . . USD 2,500. . . . . . . 2,914. . . . . . . 3,360
Momentive Performance Materials Inc., Secured, Notes, Callable, 3.880% Oct 24, 2021 . . . . . . . . . . . USD 1,500. . . . . . . 1,740. . . . . . . 1,926
MPH Acquisition Holdings LLC, Series 144A, Senior, Unsecured, Notes, Callable, 7.125% Jun 1, 2024 USD 2,000. . . . . . . 2,843. . . . . . . 2,769
MSCI Inc., Series 144A, Senior, Unsecured, Notes, Callable, 5.250% Nov 15, 2024 . . . . . . . . . . . . . . . . . . USD 1,000. . . . . . . 1,289. . . . . . . 1,381
MSCI Inc., Series 144A, Senior, Unsecured, Notes, Callable, 5.750% Aug 15, 2025 . . . . . . . . . . . . . . . . . . USD 1,000. . . . . . . 1,364. . . . . . . 1,401
Murphy Oil Corporation, Senior, Unsecured, Notes, Callable, Multi-Couponed, 4.700% Dec 1, 2022 USD 2,000. . . . . . . 2,214. . . . . . . 2,490
Nationstar Mortgage LLC/Nationstar Capital Corporation, Senior, Unsecured, Notes, Callable, 6.500% Jul 1, 2021 . . . . . . . . . . . . . . . . . . . . . . . . . . . . . . . USD 1,000. . . . . . . 1,227. . . . . . . 1,323
Nature's Bounty Company, The, Series 144A, Senior, Unsecured, Notes, Callable, 7.625% May 15, 2021 . . . . . . . . . . . . . . . . . . . . . . . . . . . . . . . . . . . . . USD 2,000. . . . . . . 2,820. . . . . . . 2,749
Navient Corporation, Medium Term Notes, Senior, Unsecured, 4.875% Jun 17, 2019 . . . . . . . . . . . . . . . . USD 1,000. . . . . . . 1,294. . . . . . . 1,348
Navient Corporation, Senior, Unsecured, Notes, 7.250% Sep 25, 2023 . . . . . . . . . . . . . . . . . . . . . . . . . . . . . USD 1,000. . . . . . . 1,412. . . . . . . 1,392
Navios Maritime Acquisition Corp./Navios Acquis- ition Finance US Inc., Series 144A, Secured, Notes, Callable, 8.125% Nov 15, 2021 . . . . . . . . . . USD 1,000. . . . . . . 1,115. . . . . . . 1,099
Navios Maritime Holdings Inc./Navios Maritime Finance II US Inc., Series 144A, Secured, Notes, Callable, 7.375% Jan 15, 2022 . . . . . . . . . . . . . . . . . . . USD 1,000. . . . . . . 1,113. . . . . . . 1,002
NCL Corporation Ltd., Series 144A, Senior, Unsecured, Notes, Callable, 4.625% Nov 15, 2020 . . . . . . . . . . . . . . . . . . . . . . . . . . . . . . . . . . . . . . . . . . . . . . . USD 750. . . . . . . . . 998. . . . . . . . . 999
NCR Corporation, Senior, Unsecured, Notes, Callable, 4.625% Feb 15, 2021 . . . . . . . . . . . . . . . . . . USD 1,000. . . . . . . 1,086. . . . . . . 1,324
NCR Corporation, Senior, Unsecured, Notes, Callable, 5.000% Jul 15, 2022 . . . . . . . . . . . . . . . . . . . . USD 1,500. . . . . . . 1,496. . . . . . . 1,989
Neiman Marcus Group Ltd LLC, Series 144A, Senior, Unsecured, Notes, Callable, 8.000% Oct 15, 2021 . . . . . . . . . . . . . . . . . . . . . . . . . . . . . . . . . . . . . . . . . . . . . . . USD 2,500. . . . . . . 2,769. . . . . . . 1,775
Neptune Finco Corp., Series 144A, Senior, Unsecured, Notes, Callable, 10.125% Jan 15, 2023 . . . . . . . . . . . . . . . . . . . . . . . . . . . . . . . . . . . . . . . . . . . . . . . USD 2,000. . . . . . . 2,759. . . . . . . 3,005
Neptune Finco Corp., Series 144A, Senior, Unsecured, Notes, Callable, 10.875% Oct 15, 2025 . . . . . . . . . . . . . . . . . . . . . . . . . . . . . . . . . . . . . . . . . . . . . . . USD 3,500. . . . . . . 4,978. . . . . . . 5,452
Netflix Inc., Senior, Unsecured, Notes, 5.500% Feb 15, 2022 . . . . . . . . . . . . . . . . . . . . . . . . . . . . . . . . . . . . . . . . . . . USD 1,750. . . . . . . 2,233. . . . . . . 2,459
Netflix Inc., Series 144A, Senior, Unsecured, Notes, 4.375% Nov 15, 2026 . . . . . . . . . . . . . . . . . . . . . . . . . . . . USD 2,000. . . . . . . 2,620. . . . . . . 2,590
Nexstar Escrow Corporation, Series 144A, Senior, Unsecured, Notes, Callable, 5.625% Aug 1, 2024 . . . . . . . . . . . . . . . . . . . . . . . . . . . . . . . . . . . . . . . . . . . . . . . USD 2,000. . . . . . . 2,647. . . . . . . 2,620
Nielsen Finance LLC/Nielsen Finance Co., Senior, Unsecured, Notes, Callable, 4.500% Oct 1, 2020 USD 2,000. . . . . . . 2,197. . . . . . . 2,633
BMO High Yield US Corporate Bond Hedged to CAD Index ETF(unaudited)
Schedule of Investment Portfolio (cont’d)
As at June 30, 2017 (All amounts in thousands of Canadian dollars, unless otherwise noted)
Par Value
(in thousands)Cost
($)
Fair Value
($)
Nielsen Finance LLC/Nielsen Finance Co., Series 144A, Senior, Unsecured, Notes, Callable, 5.000% Apr 15, 2022 . . . . . . . . . . . . . . . . . . . . . . . . . . . . . USD 3,000. . . . . . . 3,401. . . . . . . 4,036
Noble Holdings International Limited, Senior, Unsecured, Notes, Callable, 7.750% Jan 15, 2024 . . . . . . . . . . . . . . . . . . . . . . . . . . . . . . . . . . . . . . . . . . . . . . . USD 2,000. . . . . . . 2,594. . . . . . . 2,046
Novelis Corporation, Series 144A, Senior, Unsecured, Notes, Callable, 6.250% Aug 15, 2024 . . . . . . . . . . . . . . . . . . . . . . . . . . . . . . . . . . . . . . . . . . . . . . . USD 1,000. . . . . . . 1,371. . . . . . . 1,357
Novelis Corporation, Series 144A, Senior, Unsecured, Notes, Callable, 5.875% Sep 30, 2026 . . . . . . . . . . . . . . . . . . . . . . . . . . . . . . . . . . . . . . . . . . . . . . . USD 1,475. . . . . . . 1,964. . . . . . . 1,970
NRG Energy, Inc., Senior, Unsecured, Notes, Callable, 6.250% Jul 15, 2022 . . . . . . . . . . . . . . . . . . . . USD 2,750. . . . . . . 3,359. . . . . . . 3,655
Numericable-SFR S.A., Series 144A, Secured, Notes, Callable, 6.000% May 15, 2022. . . . . . . . . . USD 3,650. . . . . . . 4,547. . . . . . . 4,946
Numericable-SFR S.A., Series 144A, Secured, Notes, Callable, 6.250% May 15, 2024. . . . . . . . . . USD 2,000. . . . . . . 2,528. . . . . . . 2,743
Numericable-SFR S.A., Series 144A, Secured, Notes, Callable, 7.375% May 1, 2026 . . . . . . . . . . . USD 7,000. . . . . . . 9,146. . . . . . . 9,815
NXP B.V./NXP Funding LLC, Series 144A, Senior, Unsecured, Notes, 4.125% Jun 1, 2021 . . . . . . . . . USD 2,950. . . . . . . 4,132. . . . . . . 4,017
Oasis Petroleum Inc., Senior, Unsecured, Notes, Callable, 6.875% Mar 15, 2022 . . . . . . . . . . . . . . . . . . USD 1,500. . . . . . . 2,075. . . . . . . 1,887
OneMain Financial Holdings, Inc., Series 144A, Senior, Unsecured, Notes, Callable, 6.750% Dec 15, 2019 . . . . . . . . . . . . . . . . . . . . . . . . . . . . . . . . . . . . . . . . . . . USD 1,000. . . . . . . 1,267. . . . . . . 1,362
OneMain Financial Holdings, Inc., Series 144A, Senior, Unsecured, Notes, Callable, 7.250% Dec 15, 2021 . . . . . . . . . . . . . . . . . . . . . . . . . . . . . . . . . . . . . . . . . . . USD 250. . . . . . . . . 325. . . . . . . . . 341
Opal Acquisition Inc., Series 144A, Senior, Unsecured, Notes, Callable, 8.875% Dec 15, 2021 . . . . . . . . . . . . . . . . . . . . . . . . . . . . . . . . . . . . . . . . . . . . . . . USD 1,000. . . . . . . 1,282. . . . . . . 1,170
Open Text Corporation, Series 144A, Senior, Unsecured, Notes, Callable, 5.625% Jan 15, 2023 . . . . . . . . . . . . . . . . . . . . . . . . . . . . . . . . . . . . . . . . . . . . . . . USD 1,000. . . . . . . 1,287. . . . . . . 1,355
Ortho-Clinical Diagnostics, Inc., Series 144A, Senior, Unsecured, Notes, Callable, 6.625% May 15, 2022 . . . . . . . . . . . . . . . . . . . . . . . . . . . . . . . . . . . . . USD 2,000. . . . . . . 2,214. . . . . . . 2,477
Outdoor Americas Capital LLC/Outfront Media Capital Corporation, Senior, Unsecured, Notes, Callable, 5.625% Feb 15, 2024 . . . . . . . . . . . . . . . . . . USD 1,000. . . . . . . 1,338. . . . . . . 1,357
Outfront Media Capital LLC/Outfront Media Capital Corporation, Senior, Unsecured, Notes, Callable, 5.250% Feb 15, 2022 . . . . . . . . . . . . . . . . . . . . . . . . . . . . . USD 1,000. . . . . . . 1,318. . . . . . . 1,345
Owens-Brockway Glass Container Inc., Series 144A, Senior, Unsecured, Notes, 5.875% Aug 15, 2023 . . . . . . . . . . . . . . . . . . . . . . . . . . . . . . . . . . . . . . . . . . . USD 2,000. . . . . . . 2,751. . . . . . . 2,866
Pacific Drilling S.A., Series 144A, Secured, Notes, Callable, 5.375% Jun 1, 2020 . . . . . . . . . . . . . . . . . . . . USD 2,500. . . . . . . 2,746. . . . . . . 1,459
Paris Las Vegas Holding LLC/Harrah's Las Vegas LLC/Flamingo Las Vega Holding LLC, Series 144A, Secured, Notes, Callable, 11.000% Oct 1, 2021 . . . . . . . . . . . . . . . . . . . . . . . . . . . . . . . . . . . . . . . . . . . . . . . USD 3,050. . . . . . . 3,461. . . . . . . 4,242
Park Aerospace Holdings Limited, Series 144A, Senior, Unsecured, Notes, 5.250% Aug 15, 2022 . . . . . . . . . . . . . . . . . . . . . . . . . . . . . . . . . . . . . . . . . . . . . . . USD 2,500. . . . . . . 3,353. . . . . . . 3,381
PDC Energy Inc., Senior, Unsecured, Notes, Callable, 7.750% Oct 15, 2022 . . . . . . . . . . . . . . . . . . . USD 1,000. . . . . . . 1,291. . . . . . . 1,345
Par Value
(in thousands)Cost
($)
Fair Value
($)
Penske Automotive Group Inc., Senior, Notes, Subordinated, Callable, 5.750% Oct 1, 2022 . . . . USD 1,500. . . . . . . 1,679. . . . . . . 2,004
Pilgrim's Pride Corporation, Series 144A, Senior, Unsecured, Notes, Callable, 5.750% Mar 15, 2025 . . . . . . . . . . . . . . . . . . . . . . . . . . . . . . . . . . . . . . . . . . . . . . . USD 1,000. . . . . . . 1,317. . . . . . . 1,298
Platform Specialty Products Corporation, Series 144A, Senior, Unsecured, Notes, Callable, 6.500% Feb 1, 2022 . . . . . . . . . . . . . . . . . . . . . . . . . . . . . . USD 1,500. . . . . . . 1,859. . . . . . . 2,011
PolyOne Corporation, Senior, Unsecured, Notes, 5.250% Mar 15, 2023 . . . . . . . . . . . . . . . . . . . . . . . . . . . . . USD 1,500. . . . . . . 1,534. . . . . . . 2,038
Post Holdings Inc., Series 144A, Senior, Unsecured, Notes, Callable, 5.000% Aug 15, 2026 . . . . . . . . . . USD 2,500. . . . . . . 3,195. . . . . . . 3,234
Post Holdings Inc., Series 144A, Senior, Unsecured, Notes, Callable, 5.750% Mar 01, 2027 . . . . . . . . . . USD 3,000. . . . . . . 4,022. . . . . . . 3,866
Prime Security One MS, Inc., Series 144A, Secured, Notes, 4.875% Jul 15, 2032 . . . . . . . . . . . . . . . . . . . . . . USD 1,500. . . . . . . 1,382. . . . . . . 1,702
Prime Security Services Borrower LLC/Prime Finance Inc., Series 144A, Secured, Notes, Callable, 9.250% May 15, 2023 . . . . . . . . . USD 4,500. . . . . . . 5,910. . . . . . . 6,332
PulteGroup Inc., Senior, Unsecured, Notes, Callable, 5.500% Mar 1, 2026. . . . . . . . . . . . . . . . . . . . USD 2,000. . . . . . . 2,754. . . . . . . 2,765
PVH Corporation, Senior, Unsecured, Notes, Callable, 4.500% Dec 15, 2022 . . . . . . . . . . . . . . . . . . USD 1,000. . . . . . . 1,079. . . . . . . 1,339
Quicken Loans, Inc., Series 144A, Senior, Unsecured, Notes, Callable, 5.750% May 1, 2025 . . . . . . . . . . . . . . . . . . . . . . . . . . . . . . . . . . . . . . . . . . . . . . . USD 2,500. . . . . . . 3,043. . . . . . . 3,339
Quintiles IMS Incorporated, Series 144A, Senior, Unsecured, Notes, Callable, 5.000% Oct 15, 2026 . . . . . . . . . . . . . . . . . . . . . . . . . . . . . . . . . . . . . . . . . . . . . . . USD 2,000. . . . . . . 2,749. . . . . . . 2,671
Quintiles Transnational Corporation, Series 144A, Senior, Unsecured, Notes, Callable, 4.875% May 15, 2023 . . . . . . . . . . . . . . . . . . . . . . . . . . . . . . . . . . . . . USD 1,000. . . . . . . 1,329. . . . . . . 1,332
Range Resources Corporation, Senior, Unsecured, Notes, Subordinated, Callable, 5.000% Aug 15, 2022 . . . . . . . . . . . . . . . . . . . . . . . . . . . . . . . . . . . . . . . . . . . . . . . USD 1,000. . . . . . . 1,003. . . . . . . 1,274
Range Resources Corporation, Series 144A, Senior, Unsecured, Notes, Callable, 5.000% Mar 15, 2023 . . . . . . . . . . . . . . . . . . . . . . . . . . . . . . . . . . . . . . . . . . . . . . . USD 2,000. . . . . . . 2,253. . . . . . . 2,529
Realogy Group Llc/Realogy Co-Issuer Corp., Series 144A, Senior, Unsecured, Notes, Callable, 4.875% Jun 1, 2023 . . . . . . . . . . . . . . . . . . . . . . . . . . . . . . . USD 2,000. . . . . . . 2,559. . . . . . . 2,607
Regal Entertainment Group, Senior, Unsecured, Notes, Callable, 5.750% Mar 15, 2022 . . . . . . . . . . USD 1,000. . . . . . . 1,109. . . . . . . 1,355
RegionalCare Hospital Partners Holdings, Inc., Series 144A, Secured, Notes, Callable, 8.250% May 1, 2023 . . . . . . . . . . . . . . . . . . . . . . . . . . . . . . . . . . . . . . . USD 1,500. . . . . . . 1,972. . . . . . . 2,096
Resolute Forest Products Inc., Senior, Unsecured, Notes, Callable, 5.875% May 15, 2023. . . . . . . . . . USD 750. . . . . . . . . 805. . . . . . . . . 943
Reynolds Group Issuer Inc./Reynolds Group Issuer LLC/Reynolds Group Issuer LU, Secured, Notes, Callable, 5.750% Oct 15, 2020 . . . . . . . . . . . . . . . . . . . USD 4,750. . . . . . . 6,186. . . . . . . 6,291
Reynolds Group Issuer Inc./Reynolds Group Issuer LLC/Reynolds Group Issuer LU, Series 144A, Secured, Notes, Callable, 5.125% Jul 15, 2023 . USD 2,000. . . . . . . 2,717. . . . . . . 2,684
Rice Energy Inc., Senior, Unsecured, Notes, Callable, 6.250% May 1, 2022 . . . . . . . . . . . . . . . . . . . USD 1,000. . . . . . . 1,092. . . . . . . 1,352
Rite Aid Corporation, Senior, Unsecured, Notes, Callable, 6.750% Jun 15, 2021 . . . . . . . . . . . . . . . . . . . USD 500. . . . . . . . . 571. . . . . . . . . 668

BMO High Yield US Corporate Bond Hedged to CAD Index ETF(unaudited)
Schedule of Investment Portfolio (cont’d)
As at June 30, 2017 (All amounts in thousands of Canadian dollars, unless otherwise noted)
Par Value
(in thousands)Cost
($)
Fair Value
($)
Rite Aid Corporation, Series 144A, Senior, Unsecured, Notes, Callable, 6.125% Apr 1, 2023 . . . . . . . . . . . . . . . . . . . . . . . . . . . . . . . . . . . . . . . . . . . . . . . USD 2,250. . . . . . . 2,955. . . . . . . 2,870
RJS Power Holdings LLC, Series 144A, Senior, Unsecured, Notes, Callable, 4.625% Jul 15, 2019 . . . . . . . . . . . . . . . . . . . . . . . . . . . . . . . . . . . . . . . . . . . . . . . USD 265. . . . . . . . . 297. . . . . . . . . 335
Royal Bank of Scotland Group plc, The, Notes, Subordinated, 6.125% Dec 15, 2022 . . . . . . . . . . . . USD 1,250. . . . . . . 1,459. . . . . . . 1,771
Royal Bank of Scotland Group plc, The, Notes, Subordinated, 5.125% May 28, 2024 . . . . . . . . . . . . USD 4,250. . . . . . . 5,254. . . . . . . 5,777
Royal Bank of Scotland plc, The, Unsecured, Notes, 6.000% Dec 19, 2023 . . . . . . . . . . . . . . . . . . . . . . . . . . . . . USD 1,500. . . . . . . 1,714. . . . . . . 2,146
Royal Caribbean Cruises Ltd., Senior, Unsecured, Notes, 5.250% Nov 15, 2022 . . . . . . . . . . . . . . . . . . . . USD 1,000. . . . . . . 1,029. . . . . . . 1,433
RSP Permian, Inc., Senior, Unsecured, Notes, Callable, 6.625% Oct 1, 2022 . . . . . . . . . . . . . . . . . . . . USD 1,000. . . . . . . 1,288. . . . . . . 1,342
Sable International Finance Ltd., Series 144A, Senior, Unsecured, Notes, Callable, 6.875% Aug 1, 2022 . . . . . . . . . . . . . . . . . . . . . . . . . . . . . . . . . . . . . . . . . . . . USD 1,500. . . . . . . 2,140. . . . . . . 2,094
Sabre GLBL Inc., Series 144A, Secured, Notes, Callable, 5.250% Nov 15, 2023 . . . . . . . . . . . . . . . . . . USD 1,000. . . . . . . 1,324. . . . . . . 1,349
Sanchez Energy Corporation, Senior, Unsecured, Notes, Callable, 6.125% Jan 15, 2023 . . . . . . . . . . . USD 2,500. . . . . . . 2,770. . . . . . . 2,594
SBA Communications Corporation, Senior, Unsecured, Notes, Callable, 4.875% Jul 15, 2022 . . . . . . . . . . . . . . . . . . . . . . . . . . . . . . . . . . . . . . . . . . . . . . . USD 750. . . . . . . . . 896. . . . . . . 1,002
SBA Communications Corporation, Series 144A, Senior, Unsecured, Notes, Callable, 4.875% Sep 1, 2024 . . . . . . . . . . . . . . . . . . . . . . . . . . . . . . . . . . . . . . . . . . . . USD 1,000. . . . . . . 1,315. . . . . . . 1,318
Scientific Games International Inc., Series 144A, Secured, Notes, Callable, 7.000% Jan 1, 2022 . . USD 1,750. . . . . . . 2,168. . . . . . . 2,417
Scientific Games International Inc., Senior, Unsecured, Notes, Callable, 10.000% Dec 1, 2022 . . . . . . . . . . . . . . . . . . . . . . . . . . . . . . . . . . . . . . . . . . . . . . . USD 2,500. . . . . . . 2,921. . . . . . . 3,554
Select Medical Corporation, Senior, Unsecured, Notes, Callable, 6.375% Jun 1, 2021 . . . . . . . . . . . . USD 1,000. . . . . . . 1,260. . . . . . . 1,332
Sensata Technologies B.V., Series 144A, Senior, Unsecured, Notes, 4.875% Oct 15, 2023 . . . . . . . . USD 3,000. . . . . . . 3,943. . . . . . . 3,949
Service Corporation International, Senior, Unsecured, Notes, Callable, 5.375% May 15, 2024 . . . . . . . . . . . . . . . . . . . . . . . . . . . . . . . . . . . . . . . . . . . . . . . USD 2,000. . . . . . . 2,745. . . . . . . 2,730
Seven Generations Energy Ltd., Series 144A, Senior, Unsecured, Notes, Callable, 8.250% May 15, 2020 . . . . . . . . . . . . . . . . . . . . . . . . . . . . . . . . . . . . . USD 1,000. . . . . . . 1,279. . . . . . . 1,355
Signode Industrial Group US Inc., Series 144A, Senior, Unsecured, Notes, Callable, 6.375% May 1, 2022 . . . . . . . . . . . . . . . . . . . . . . . . . . . . . . . . . . . . . . . USD 1,900. . . . . . . 2,078. . . . . . . 2,575
SIL II BO/SIL II US Hold, Series 144A, Senior, Unsecured, Notes, Callable, 7.75% Dec 15, 2020 . . . . . . . . . . . . . . . . . . . . . . . . . . . . . . . . . . . . . . . . . . . . . . . USD 1,000. . . . . . . 1,023. . . . . . . 1,302
Sinclair Television Group, Inc., Senior, Unsecured, Notes, Callable, 5.375% Apr 1, 2021 . . . . . . . . . . . . USD 2,500. . . . . . . 2,656. . . . . . . 3,323
Sirius XM Holdings Inc., Series 144A, Senior, Unsecured, Notes, Callable, 6.000% Jul 15, 2024 . . . . . . . . . . . . . . . . . . . . . . . . . . . . . . . . . . . . . . . . . . . . . . . USD 1,000. . . . . . . 1,117. . . . . . . 1,378
Sirius XM Radio Inc., Series 144A, Senior, Unsecured, Notes, Callable, 5.375% Apr 15, 2025 . . . . . . . . . . . . . . . . . . . . . . . . . . . . . . . . . . . . . . . . . . . . . . . USD 2,500. . . . . . . 3,244. . . . . . . 3,351
Par Value
(in thousands)Cost
($)
Fair Value
($)
Sirius XM Radio Inc., Series 144A, Senior, Unsecured, Notes, Callable, 5.000% Aug 1, 2027 . . . . . . . . . . . . . . . . . . . . . . . . . . . . . . . . . . . . . . . . . . . . . . . USD 3,000. . . . . . . 3,929. . . . . . . 3,915
Six Flags Entertainment Corporation, Series 144A, Senior, Unsecured, Notes, Callable, 5.500% Apr 15, 2027 . . . . . . . . . . . . . . . . . . . . . . . . . . . . . . . . . . . . . . . . . . . USD 2,500. . . . . . . 3,356. . . . . . . 3,331
SLM Corporation, Series A, Medium Term Notes, Senior, Unsecured, 5.500% Jan 15, 2019 . . . . . . . USD 2,250. . . . . . . 2,688. . . . . . . 3,041
SLM Corporation, Senior, Unsecured, Notes, 5.500% Jan 25, 2023 . . . . . . . . . . . . . . . . . . . . . . . . . . . . . USD 1,000. . . . . . . 1,117. . . . . . . 1,313
SM Energy Company, Senior, Unsecured, Notes, Callable, 6.125% Nov 15, 2022 . . . . . . . . . . . . . . . . . . USD 1,500. . . . . . . 1,905. . . . . . . 1,848
SM Energy Company, Senior, Unsecured, Notes, Callable, 5.625% Jun 1, 2025 . . . . . . . . . . . . . . . . . . . . USD 500. . . . . . . . . 617. . . . . . . . . 584
SoftBank Group Corp., Series 144A, Senior, Unsecured, Notes, 4.500% Apr 15, 2020. . . . . . . . USD 3,750. . . . . . . 4,152. . . . . . . 5,033
Solera LLC/Solera Finance Inc., Series 144A, Senior, Unsecured, Notes, Callable, 10.500% Mar 1, 2024 . . . . . . . . . . . . . . . . . . . . . . . . . . . . . . . . . . . . . . . USD 1,500. . . . . . . 2,052. . . . . . . 2,235
Southwestern Energy Company, Senior, Unsecured, Notes, Callable, Multi-Coupon, 5.800% Jan 23, 2020 . . . . . . . . . . . . . . . . . . . . . . . . . . . . . . . . . . . . . . . . . . . . . . . USD 750. . . . . . . . . 754. . . . . . . . . 992
Southwestern Energy Company, Senior, Unsecured, Notes, Callable, 4.100% Mar 15, 2022 . . . . . . . . . . USD 900. . . . . . . . . 773. . . . . . . 1,085
Southwestern Energy Company, Senior, Unsecured, Notes, Callable, Multi-Coupon, 6.700% Jan 23, 2025 . . . . . . . . . . . . . . . . . . . . . . . . . . . . . . . . . . . . . . . . . . . . . . . USD 2,000. . . . . . . 1,667. . . . . . . 2,535
Spectrum Brands Inc., Senior, Unsecured, Notes, Callable, 6.625% Nov 15, 2022 . . . . . . . . . . . . . . . . . . USD 1,500. . . . . . . 1,725. . . . . . . 2,042
Spectrum Brands Inc., Senior, Unsecured, Notes, Callable, 5.750% Jul 15, 2025 . . . . . . . . . . . . . . . . . . . . USD 1,000. . . . . . . 1,326. . . . . . . 1,391
Springleaf Finance Corporation, Senior, Unsecured, Notes, 5.250% Dec 15, 2019 . . . . . . . . . . . . . . . . . . . . . USD 3,500. . . . . . . 4,363. . . . . . . 4,698
Sprint Communications Inc., Senior, Unsecured, Notes, 6.000% Nov 15, 2022 . . . . . . . . . . . . . . . . . . . . USD 2,000. . . . . . . 2,762. . . . . . . 2,749
Sprint Corporation, Senior, Unsecured, Notes, 7.250% Sep 15, 2021 . . . . . . . . . . . . . . . . . . . . . . . . . . . . . USD 1,000. . . . . . . 1,482. . . . . . . 1,439
Sprint Corporation, Senior, Unsecured, Notes, 7.875% Sep 15, 2023 . . . . . . . . . . . . . . . . . . . . . . . . . . . . . USD 3,750. . . . . . . 4,021. . . . . . . 5,592
Sprint Corporation, Senior, Unsecured, Notes, 7.125% Jun 15, 2024 . . . . . . . . . . . . . . . . . . . . . . . . . . . . . USD 6,000. . . . . . . 7,021. . . . . . . 8,656
Sprint Corporation, Senior, Unsecured, Notes, Callable, 7.625% Feb 15, 2025 . . . . . . . . . . . . . . . . . . USD 3,000. . . . . . . 4,497. . . . . . . 4,474
Standard Industries, Inc., Series 144A, Senior, Unsecured, Notes, Callable, 5.125% Feb 15, 2021 . . . . . . . . . . . . . . . . . . . . . . . . . . . . . . . . . . . . . . . . . . . . . . . USD 1,000. . . . . . . 1,379. . . . . . . 1,344
Steel Dynamics, Inc., Senior, Unsecured, Notes, Callable, 5.125% Oct 1, 2021 . . . . . . . . . . . . . . . . . . . . USD 1,500. . . . . . . 1,888. . . . . . . 2,001
Sunoco LP/Sunoco Finance Corporation, Senior, Unsecured, Notes, Callable, 6.375% Apr 1, 2023 . . . . . . . . . . . . . . . . . . . . . . . . . . . . . . . . . . . . . . . . . . . . . . . USD 2,000. . . . . . . 2,677. . . . . . . 2,736
Symantec Corporation, Series 144A, Senior, Unsecured, Notes, Callable, 5.000% Apr 15, 2025 . . . . . . . . . . . . . . . . . . . . . . . . . . . . . . . . . . . . . . . . . . . . . . . USD 500. . . . . . . . . 692. . . . . . . . . 678
Targa Resources Partners LP/Targa Resources Partners Finance Corp., Senior, Unsecured, Notes, Callable, 4.250% Nov 15, 2023 . . . . . . . . . . USD 2,000. . . . . . . 2,603. . . . . . . 2,532
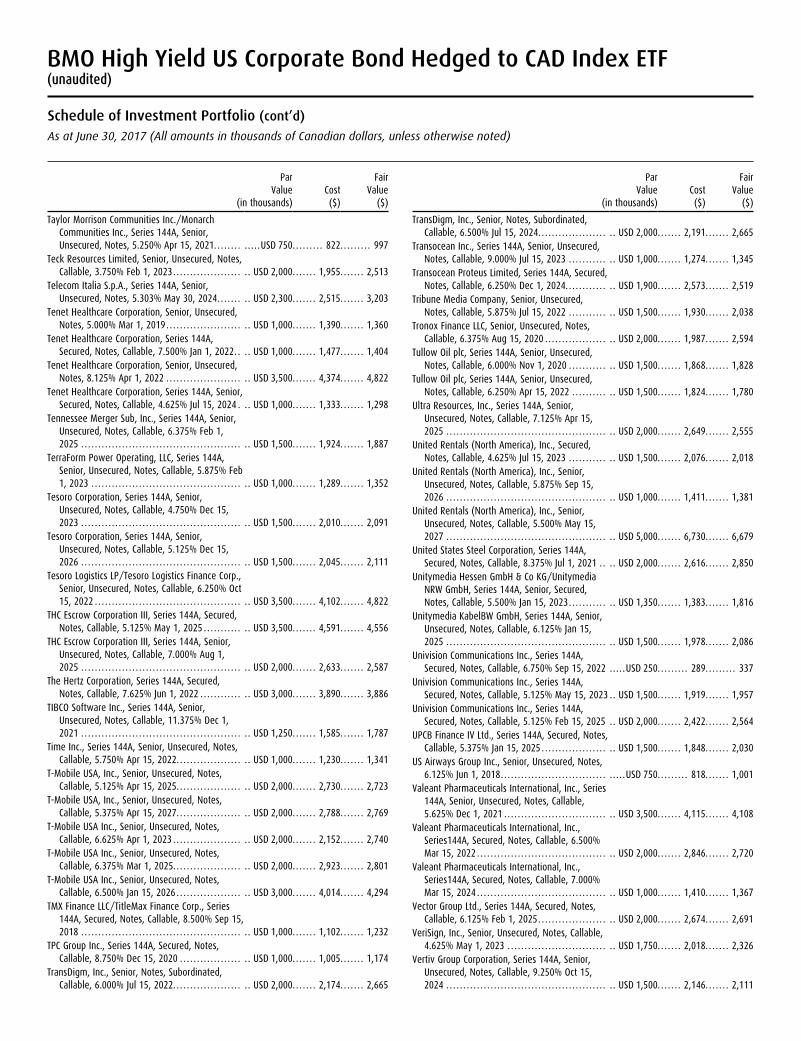
BMO High Yield US Corporate Bond Hedged to CAD Index ETF(unaudited)
Schedule of Investment Portfolio (cont’d)
As at June 30, 2017 (All amounts in thousands of Canadian dollars, unless otherwise noted)
Par Value
(in thousands)Cost
($)
Fair Value
($)
Taylor Morrison Communities Inc./Monarch Communities Inc., Series 144A, Senior, Unsecured, Notes, 5.250% Apr 15, 2021. . . . . . . . USD 750. . . . . . . . . 822. . . . . . . . . 997
Teck Resources Limited, Senior, Unsecured, Notes, Callable, 3.750% Feb 1, 2023 . . . . . . . . . . . . . . . . . . . . USD 2,000. . . . . . . 1,955. . . . . . . 2,513
Telecom Italia S.p.A., Series 144A, Senior, Unsecured, Notes, 5.303% May 30, 2024 . . . . . . . USD 2,300. . . . . . . 2,515. . . . . . . 3,203
Tenet Healthcare Corporation, Senior, Unsecured, Notes, 5.000% Mar 1, 2019 . . . . . . . . . . . . . . . . . . . . . . USD 1,000. . . . . . . 1,390. . . . . . . 1,360
Tenet Healthcare Corporation, Series 144A, Secured, Notes, Callable, 7.500% Jan 1, 2022 . . USD 1,000. . . . . . . 1,477. . . . . . . 1,404
Tenet Healthcare Corporation, Senior, Unsecured, Notes, 8.125% Apr 1, 2022 . . . . . . . . . . . . . . . . . . . . . . USD 3,500. . . . . . . 4,374. . . . . . . 4,822
Tenet Healthcare Corporation, Series 144A, Senior, Secured, Notes, Callable, 4.625% Jul 15, 2024 . USD 1,000. . . . . . . 1,333. . . . . . . 1,298
Tennessee Merger Sub, Inc., Series 144A, Senior, Unsecured, Notes, Callable, 6.375% Feb 1, 2025 . . . . . . . . . . . . . . . . . . . . . . . . . . . . . . . . . . . . . . . . . . . . . . . USD 1,500. . . . . . . 1,924. . . . . . . 1,887
TerraForm Power Operating, LLC, Series 144A, Senior, Unsecured, Notes, Callable, 5.875% Feb 1, 2023 . . . . . . . . . . . . . . . . . . . . . . . . . . . . . . . . . . . . . . . . . . . . USD 1,000. . . . . . . 1,289. . . . . . . 1,352
Tesoro Corporation, Series 144A, Senior, Unsecured, Notes, Callable, 4.750% Dec 15, 2023 . . . . . . . . . . . . . . . . . . . . . . . . . . . . . . . . . . . . . . . . . . . . . . . USD 1,500. . . . . . . 2,010. . . . . . . 2,091
Tesoro Corporation, Series 144A, Senior, Unsecured, Notes, Callable, 5.125% Dec 15, 2026 . . . . . . . . . . . . . . . . . . . . . . . . . . . . . . . . . . . . . . . . . . . . . . . USD 1,500. . . . . . . 2,045. . . . . . . 2,111
Tesoro Logistics LP/Tesoro Logistics Finance Corp., Senior, Unsecured, Notes, Callable, 6.250% Oct 15, 2022 . . . . . . . . . . . . . . . . . . . . . . . . . . . . . . . . . . . . . . . . . . . USD 3,500. . . . . . . 4,102. . . . . . . 4,822
THC Escrow Corporation III, Series 144A, Secured, Notes, Callable, 5.125% May 1, 2025 . . . . . . . . . . . USD 3,500. . . . . . . 4,591. . . . . . . 4,556
THC Escrow Corporation III, Series 144A, Senior, Unsecured, Notes, Callable, 7.000% Aug 1, 2025 . . . . . . . . . . . . . . . . . . . . . . . . . . . . . . . . . . . . . . . . . . . . . . . USD 2,000. . . . . . . 2,633. . . . . . . 2,587
The Hertz Corporation, Series 144A, Secured, Notes, Callable, 7.625% Jun 1, 2022 . . . . . . . . . . . . USD 3,000. . . . . . . 3,890. . . . . . . 3,886
TIBCO Software Inc., Series 144A, Senior, Unsecured, Notes, Callable, 11.375% Dec 1, 2021 . . . . . . . . . . . . . . . . . . . . . . . . . . . . . . . . . . . . . . . . . . . . . . . USD 1,250. . . . . . . 1,585. . . . . . . 1,787
Time Inc., Series 144A, Senior, Unsecured, Notes, Callable, 5.750% Apr 15, 2022 . . . . . . . . . . . . . . . . . . . USD 1,000. . . . . . . 1,230. . . . . . . 1,341
T-Mobile USA, Inc., Senior, Unsecured, Notes, Callable, 5.125% Apr 15, 2025 . . . . . . . . . . . . . . . . . . . USD 2,000. . . . . . . 2,730. . . . . . . 2,723
T-Mobile USA, Inc., Senior, Unsecured, Notes, Callable, 5.375% Apr 15, 2027 . . . . . . . . . . . . . . . . . . . USD 2,000. . . . . . . 2,788. . . . . . . 2,769
T-Mobile USA Inc., Senior, Unsecured, Notes, Callable, 6.625% Apr 1, 2023 . . . . . . . . . . . . . . . . . . . . USD 2,000. . . . . . . 2,152. . . . . . . 2,740
T-Mobile USA Inc., Senior, Unsecured, Notes, Callable, 6.375% Mar 1, 2025. . . . . . . . . . . . . . . . . . . . USD 2,000. . . . . . . 2,923. . . . . . . 2,801
T-Mobile USA Inc., Senior, Unsecured, Notes, Callable, 6.500% Jan 15, 2026 . . . . . . . . . . . . . . . . . . . USD 3,000. . . . . . . 4,014. . . . . . . 4,294
TMX Finance LLC/TitleMax Finance Corp., Series 144A, Secured, Notes, Callable, 8.500% Sep 15, 2018 . . . . . . . . . . . . . . . . . . . . . . . . . . . . . . . . . . . . . . . . . . . . . . . USD 1,000. . . . . . . 1,102. . . . . . . 1,232
TPC Group Inc., Series 144A, Secured, Notes, Callable, 8.750% Dec 15, 2020 . . . . . . . . . . . . . . . . . . USD 1,000. . . . . . . 1,005. . . . . . . 1,174
TransDigm, Inc., Senior, Notes, Subordinated, Callable, 6.000% Jul 15, 2022 . . . . . . . . . . . . . . . . . . . . USD 2,000. . . . . . . 2,174. . . . . . . 2,665
Par Value
(in thousands)Cost
($)
Fair Value
($)
TransDigm, Inc., Senior, Notes, Subordinated, Callable, 6.500% Jul 15, 2024 . . . . . . . . . . . . . . . . . . . . USD 2,000. . . . . . . 2,191. . . . . . . 2,665
Transocean Inc., Series 144A, Senior, Unsecured, Notes, Callable, 9.000% Jul 15, 2023 . . . . . . . . . . . USD 1,000. . . . . . . 1,274. . . . . . . 1,345
Transocean Proteus Limited, Series 144A, Secured, Notes, Callable, 6.250% Dec 1, 2024. . . . . . . . . . . . USD 1,900. . . . . . . 2,573. . . . . . . 2,519
Tribune Media Company, Senior, Unsecured, Notes, Callable, 5.875% Jul 15, 2022 . . . . . . . . . . . USD 1,500. . . . . . . 1,930. . . . . . . 2,038
Tronox Finance LLC, Senior, Unsecured, Notes, Callable, 6.375% Aug 15, 2020 . . . . . . . . . . . . . . . . . . USD 2,000. . . . . . . 1,987. . . . . . . 2,594
Tullow Oil plc, Series 144A, Senior, Unsecured, Notes, Callable, 6.000% Nov 1, 2020 . . . . . . . . . . . USD 1,500. . . . . . . 1,868. . . . . . . 1,828
Tullow Oil plc, Series 144A, Senior, Unsecured, Notes, Callable, 6.250% Apr 15, 2022 . . . . . . . . . . USD 1,500. . . . . . . 1,824. . . . . . . 1,780
Ultra Resources, Inc., Series 144A, Senior, Unsecured, Notes, Callable, 7.125% Apr 15, 2025 . . . . . . . . . . . . . . . . . . . . . . . . . . . . . . . . . . . . . . . . . . . . . . . USD 2,000. . . . . . . 2,649. . . . . . . 2,555
United Rentals (North America), Inc., Secured, Notes, Callable, 4.625% Jul 15, 2023 . . . . . . . . . . . USD 1,500. . . . . . . 2,076. . . . . . . 2,018
United Rentals (North America), Inc., Senior, Unsecured, Notes, Callable, 5.875% Sep 15, 2026 . . . . . . . . . . . . . . . . . . . . . . . . . . . . . . . . . . . . . . . . . . . . . . . USD 1,000. . . . . . . 1,411. . . . . . . 1,381
United Rentals (North America), Inc., Senior, Unsecured, Notes, Callable, 5.500% May 15, 2027 . . . . . . . . . . . . . . . . . . . . . . . . . . . . . . . . . . . . . . . . . . . . . . . USD 5,000. . . . . . . 6,730. . . . . . . 6,679
United States Steel Corporation, Series 144A, Secured, Notes, Callable, 8.375% Jul 1, 2021 . . USD 2,000. . . . . . . 2,616. . . . . . . 2,850
Unitymedia Hessen GmbH & Co KG/Unitymedia NRW GmbH, Series 144A, Senior, Secured, Notes, Callable, 5.500% Jan 15, 2023 . . . . . . . . . . . USD 1,350. . . . . . . 1,383. . . . . . . 1,816
Unitymedia KabelBW GmbH, Series 144A, Senior, Unsecured, Notes, Callable, 6.125% Jan 15, 2025 . . . . . . . . . . . . . . . . . . . . . . . . . . . . . . . . . . . . . . . . . . . . . . . USD 1,500. . . . . . . 1,978. . . . . . . 2,086
Univision Communications Inc., Series 144A, Secured, Notes, Callable, 6.750% Sep 15, 2022 USD 250. . . . . . . . . 289. . . . . . . . . 337
Univision Communications Inc., Series 144A, Secured, Notes, Callable, 5.125% May 15, 2023 USD 1,500. . . . . . . 1,919. . . . . . . 1,957
Univision Communications Inc., Series 144A, Secured, Notes, Callable, 5.125% Feb 15, 2025 USD 2,000. . . . . . . 2,422. . . . . . . 2,564
UPCB Finance IV Ltd., Series 144A, Secured, Notes, Callable, 5.375% Jan 15, 2025 . . . . . . . . . . . . . . . . . . . USD 1,500. . . . . . . 1,848. . . . . . . 2,030
US Airways Group Inc., Senior, Unsecured, Notes, 6.125% Jun 1, 2018 . . . . . . . . . . . . . . . . . . . . . . . . . . . . . . . USD 750. . . . . . . . . 818. . . . . . . 1,001
Valeant Pharmaceuticals International, Inc., Series 144A, Senior, Unsecured, Notes, Callable, 5.625% Dec 1, 2021 . . . . . . . . . . . . . . . . . . . . . . . . . . . . . . USD 3,500. . . . . . . 4,115. . . . . . . 4,108
Valeant Pharmaceuticals International, Inc., Series144A, Secured, Notes, Callable, 6.500% Mar 15, 2022 . . . . . . . . . . . . . . . . . . . . . . . . . . . . . . . . . . . . . . USD 2,000. . . . . . . 2,846. . . . . . . 2,720
Valeant Pharmaceuticals International, Inc., Series144A, Secured, Notes, Callable, 7.000% Mar 15, 2024 . . . . . . . . . . . . . . . . . . . . . . . . . . . . . . . . . . . . . . USD 1,000. . . . . . . 1,410. . . . . . . 1,367
Vector Group Ltd., Series 144A, Secured, Notes, Callable, 6.125% Feb 1, 2025 . . . . . . . . . . . . . . . . . . . . USD 2,000. . . . . . . 2,674. . . . . . . 2,691
VeriSign, Inc., Senior, Unsecured, Notes, Callable, 4.625% May 1, 2023 . . . . . . . . . . . . . . . . . . . . . . . . . . . . . USD 1,750. . . . . . . 2,018. . . . . . . 2,326
Vertiv Group Corporation, Series 144A, Senior, Unsecured, Notes, Callable, 9.250% Oct 15, 2024 . . . . . . . . . . . . . . . . . . . . . . . . . . . . . . . . . . . . . . . . . . . . . . . USD 1,500. . . . . . . 2,146. . . . . . . 2,111
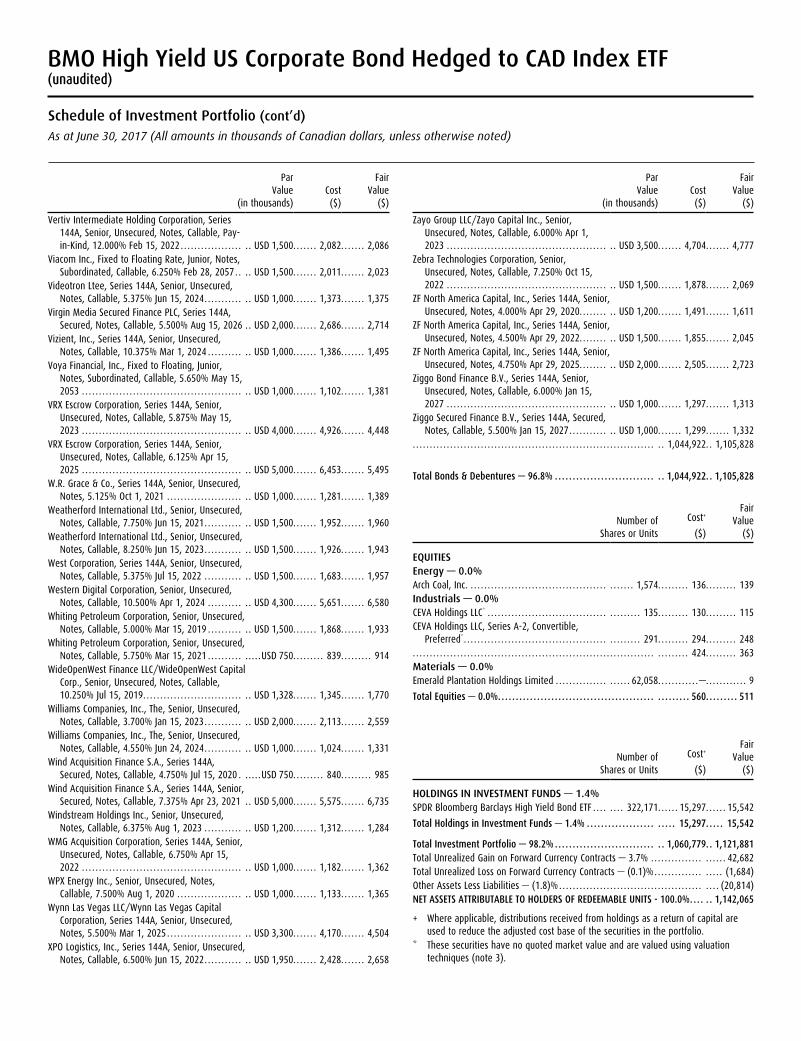
BMO High Yield US Corporate Bond Hedged to CAD Index ETF(unaudited)
Schedule of Investment Portfolio (cont’d)
As at June 30, 2017 (All amounts in thousands of Canadian dollars, unless otherwise noted)
Par Value
(in thousands)Cost
($)
Fair Value
($)
Vertiv Intermediate Holding Corporation, Series 144A, Senior, Unsecured, Notes, Callable, Pay-in-Kind, 12.000% Feb 15, 2022 . . . . . . . . . . . . . . . . . . USD 1,500. . . . . . . 2,082. . . . . . . 2,086
Viacom Inc., Fixed to Floating Rate, Junior, Notes, Subordinated, Callable, 6.250% Feb 28, 2057 . . USD 1,500. . . . . . . 2,011. . . . . . . 2,023
Videotron Ltee, Series 144A, Senior, Unsecured, Notes, Callable, 5.375% Jun 15, 2024 . . . . . . . . . . . USD 1,000. . . . . . . 1,373. . . . . . . 1,375
Virgin Media Secured Finance PLC, Series 144A, Secured, Notes, Callable, 5.500% Aug 15, 2026 USD 2,000. . . . . . . 2,686. . . . . . . 2,714
Vizient, Inc., Series 144A, Senior, Unsecured, Notes, Callable, 10.375% Mar 1, 2024 . . . . . . . . . . USD 1,000. . . . . . . 1,386. . . . . . . 1,495
Voya Financial, Inc., Fixed to Floating, Junior, Notes, Subordinated, Callable, 5.650% May 15, 2053 . . . . . . . . . . . . . . . . . . . . . . . . . . . . . . . . . . . . . . . . . . . . . . . USD 1,000. . . . . . . 1,102. . . . . . . 1,381
VRX Escrow Corporation, Series 144A, Senior, Unsecured, Notes, Callable, 5.875% May 15, 2023 . . . . . . . . . . . . . . . . . . . . . . . . . . . . . . . . . . . . . . . . . . . . . . . USD 4,000. . . . . . . 4,926. . . . . . . 4,448
VRX Escrow Corporation, Series 144A, Senior, Unsecured, Notes, Callable, 6.125% Apr 15, 2025 . . . . . . . . . . . . . . . . . . . . . . . . . . . . . . . . . . . . . . . . . . . . . . . USD 5,000. . . . . . . 6,453. . . . . . . 5,495
W.R. Grace & Co., Series 144A, Senior, Unsecured, Notes, 5.125% Oct 1, 2021 . . . . . . . . . . . . . . . . . . . . . . USD 1,000. . . . . . . 1,281. . . . . . . 1,389
Weatherford International Ltd., Senior, Unsecured, Notes, Callable, 7.750% Jun 15, 2021 . . . . . . . . . . . USD 1,500. . . . . . . 1,952. . . . . . . 1,960
Weatherford International Ltd., Senior, Unsecured, Notes, Callable, 8.250% Jun 15, 2023 . . . . . . . . . . . USD 1,500. . . . . . . 1,926. . . . . . . 1,943
West Corporation, Series 144A, Senior, Unsecured, Notes, Callable, 5.375% Jul 15, 2022 . . . . . . . . . . . USD 1,500. . . . . . . 1,683. . . . . . . 1,957
Western Digital Corporation, Senior, Unsecured, Notes, Callable, 10.500% Apr 1, 2024 . . . . . . . . . . USD 4,300. . . . . . . 5,651. . . . . . . 6,580
Whiting Petroleum Corporation, Senior, Unsecured, Notes, Callable, 5.000% Mar 15, 2019 . . . . . . . . . . USD 1,500. . . . . . . 1,868. . . . . . . 1,933
Whiting Petroleum Corporation, Senior, Unsecured, Notes, Callable, 5.750% Mar 15, 2021 . . . . . . . . . . USD 750. . . . . . . . . 839. . . . . . . . . 914
WideOpenWest Finance LLC/WideOpenWest Capital Corp., Senior, Unsecured, Notes, Callable, 10.250% Jul 15, 2019 . . . . . . . . . . . . . . . . . . . . . . . . . . . . . USD 1,328. . . . . . . 1,345. . . . . . . 1,770
Williams Companies, Inc., The, Senior, Unsecured, Notes, Callable, 3.700% Jan 15, 2023 . . . . . . . . . . . USD 2,000. . . . . . . 2,113. . . . . . . 2,559
Williams Companies, Inc., The, Senior, Unsecured, Notes, Callable, 4.550% Jun 24, 2024 . . . . . . . . . . . USD 1,000. . . . . . . 1,024. . . . . . . 1,331
Wind Acquisition Finance S.A., Series 144A, Secured, Notes, Callable, 4.750% Jul 15, 2020 . USD 750. . . . . . . . . 840. . . . . . . . . 985
Wind Acquisition Finance S.A., Series 144A, Senior, Secured, Notes, Callable, 7.375% Apr 23, 2021 USD 5,000. . . . . . . 5,575. . . . . . . 6,735
Windstream Holdings Inc., Senior, Unsecured, Notes, Callable, 6.375% Aug 1, 2023 . . . . . . . . . . . USD 1,200. . . . . . . 1,312. . . . . . . 1,284
WMG Acquisition Corporation, Series 144A, Senior, Unsecured, Notes, Callable, 6.750% Apr 15, 2022 . . . . . . . . . . . . . . . . . . . . . . . . . . . . . . . . . . . . . . . . . . . . . . . USD 1,000. . . . . . . 1,182. . . . . . . 1,362
WPX Energy Inc., Senior, Unsecured, Notes, Callable, 7.500% Aug 1, 2020 . . . . . . . . . . . . . . . . . . . USD 1,000. . . . . . . 1,133. . . . . . . 1,365
Wynn Las Vegas LLC/Wynn Las Vegas Capital Corporation, Series 144A, Senior, Unsecured, Notes, 5.500% Mar 1, 2025 . . . . . . . . . . . . . . . . . . . . . . USD 3,300. . . . . . . 4,170. . . . . . . 4,504
XPO Logistics, Inc., Series 144A, Senior, Unsecured, Notes, Callable, 6.500% Jun 15, 2022 . . . . . . . . . . . USD 1,950. . . . . . . 2,428. . . . . . . 2,658
Par Value
(in thousands)Cost
($)
Fair Value
($)
Zayo Group LLC/Zayo Capital Inc., Senior, Unsecured, Notes, Callable, 6.000% Apr 1, 2023 . . . . . . . . . . . . . . . . . . . . . . . . . . . . . . . . . . . . . . . . . . . . . . . USD 3,500. . . . . . . 4,704. . . . . . . 4,777
Zebra Technologies Corporation, Senior, Unsecured, Notes, Callable, 7.250% Oct 15, 2022 . . . . . . . . . . . . . . . . . . . . . . . . . . . . . . . . . . . . . . . . . . . . . . . USD 1,500. . . . . . . 1,878. . . . . . . 2,069
ZF North America Capital, Inc., Series 144A, Senior, Unsecured, Notes, 4.000% Apr 29, 2020. . . . . . . . USD 1,200. . . . . . . 1,491. . . . . . . 1,611
ZF North America Capital, Inc., Series 144A, Senior, Unsecured, Notes, 4.500% Apr 29, 2022. . . . . . . . USD 1,500. . . . . . . 1,855. . . . . . . 2,045
ZF North America Capital, Inc., Series 144A, Senior, Unsecured, Notes, 4.750% Apr 29, 2025. . . . . . . . USD 2,000. . . . . . . 2,505. . . . . . . 2,723
Ziggo Bond Finance B.V., Series 144A, Senior, Unsecured, Notes, Callable, 6.000% Jan 15, 2027 . . . . . . . . . . . . . . . . . . . . . . . . . . . . . . . . . . . . . . . . . . . . . . . USD 1,000. . . . . . . 1,297. . . . . . . 1,313
Ziggo Secured Finance B.V., Series 144A, Secured, Notes, Callable, 5.500% Jan 15, 2027 . . . . . . . . . . . USD 1,000. . . . . . . 1,299. . . . . . . 1,332
. . . . . . . . . . . . . . . . . . . . . . . . . . . . . . . . . . . . . . . . . . . . . . . . . . . . . . . . . . . . . . . . . . . . . . . . . 1,044,922. . 1,105,828
Total Bonds & Debentures — 96.8% . . . . . . . . . . . . . . . . . . . . . . . . . . . . . . 1,044,922. . 1,105,828
Number of Shares or Units
Cost+
($)
Fair Value
($)
EQUITIESEnergy — 0.0%Arch Coal, Inc. . . . . . . . . . . . . . . . . . . . . . . . . . . . . . . . . . . . . . . . . . . . . . . . 1,574. . . . . . . . . 136. . . . . . . . . 139Industrials — 0.0%CEVA Holdings LLC* . . . . . . . . . . . . . . . . . . . . . . . . . . . . . . . . . . . . . . . . . . . . 135. . . . . . . . . 130. . . . . . . . . 115CEVA Holdings LLC, Series A-2, Convertible,
Preferred* . . . . . . . . . . . . . . . . . . . . . . . . . . . . . . . . . . . . . . . . . . . . . . . . . . . 291. . . . . . . . . 294. . . . . . . . . 248. . . . . . . . . . . . . . . . . . . . . . . . . . . . . . . . . . . . . . . . . . . . . . . . . . . . . . . . . . . . . . . . . . . . . . . . . . . . . . . . 424. . . . . . . . . 363Materials — 0.0%Emerald Plantation Holdings Limited . . . . . . . . . . . . . . . . . . . . . 62,058. . . . . . . . . . . .—. . . . . . . . . . . . 9
Total Equities — 0.0% . . . . . . . . . . . . . . . . . . . . . . . . . . . . . . . . . . . . . . . . . . . . . . . . . . . . . 560. . . . . . . . . 511
Number of Shares or Units
Cost+
($)
Fair Value
($)
HOLDINGS IN INVESTMENT FUNDS — 1.4%SPDR Bloomberg Barclays High Yield Bond ETF . . . . . . . . 322,171. . . . . . 15,297. . . . . . 15,542
Total Holdings in Investment Funds — 1.4% . . . . . . . . . . . . . . . . . . . . . . . . 15,297. . . . . 15,542
Total Investment Portfolio — 98.2% . . . . . . . . . . . . . . . . . . . . . . . . . . . . . . 1,060,779. . 1,121,881Total Unrealized Gain on Forward Currency Contracts — 3.7% . . . . . . . . . . . . . . . . . . . . . 42,682Total Unrealized Loss on Forward Currency Contracts — (0.1)% . . . . . . . . . . . . . . . . . . . (1,684)Other Assets Less Liabilities — (1.8)% . . . . . . . . . . . . . . . . . . . . . . . . . . . . . . . . . . . . . . . . . . . . . . (20,814)NET ASSETS ATTRIBUTABLE TO HOLDERS OF REDEEMABLE UNITS - 100.0% . . . . . . 1,142,065
+ Where applicable, distributions received from holdings as a return of capital are used to reduce the adjusted cost base of the securities in the portfolio.
* These securities have no quoted market value and are valued using valuation techniques (note 3).

BMO High Yield US Corporate Bond Hedged to CAD Index ETF(unaudited)
Schedule of Investment Portfolio (cont’d)
As at June 30, 2017 (All amounts in thousands of Canadian dollars, unless otherwise noted)
UNREALIZED GAIN ON FORWARD CURRENCY CONTRACTS
Settlement Date
Currency Buy
Position (000s)
Currency Sell
Position (000s)
Contract Rate Counterparty
Credit Rating*
Unrealized Gain
6-Jul-17 . . . . . . . . . . . . . . . . . . . .CAD . . . . . . . . . . . 1,452. . . . . . . . . . . .USD . . . . . . . . . (1,116). . . . . . . . . 1.3013. . . . . . Royal Bank of Canada . . . . . . . . . . . . . . . . . . . . . . . . . . . . . . . . . . A-1+ . . . . . . . . . . . . . . . . . . . . . . . . . . . 56-Jul-17 . . . . . . . . . . . . . . . . . . . .CAD . . . . . . . . . . . 1,470. . . . . . . . . . . .USD . . . . . . . . . (1,117). . . . . . . . . 1.3161. . . . . . Royal Bank of Canada . . . . . . . . . . . . . . . . . . . . . . . . . . . . . . . . . . A-1+ . . . . . . . . . . . . . . . . . . . . . . . . . 226-Jul-17 . . . . . . . . . . . . . . . . . . . .CAD . . . . . . . . . . . 1,477. . . . . . . . . . . .USD . . . . . . . . . (1,118). . . . . . . . . 1.3208. . . . . . Toronto Dominion Bank, The . . . . . . . . . . . . . . . . . . . . . . . . . . A-1+ . . . . . . . . . . . . . . . . . . . . . . . . . 276-Jul-17 . . . . . . . . . . . . . . . . . . . .CAD . . . . . . . . . . . 2,953. . . . . . . . . . . .USD . . . . . . . . . (2,235). . . . . . . . . 1.3214. . . . . . Bank of Nova Scotia . . . . . . . . . . . . . . . . . . . . . . . . . . . . . . . . . . . . A-1 . . . . . . . . . . . . . . . . . . . . . . . . . . . 556-Jul-17 . . . . . . . . . . . . . . . . . . . .CAD . . . . . . . . . . . 2,954. . . . . . . . . . . .USD . . . . . . . . . (2,233). . . . . . . . . 1.3228. . . . . . Bank of Nova Scotia . . . . . . . . . . . . . . . . . . . . . . . . . . . . . . . . . . . . A-1 . . . . . . . . . . . . . . . . . . . . . . . . . . . 586-Jul-17 . . . . . . . . . . . . . . . . . . . .CAD . . . . . . . . . . . 4,499. . . . . . . . . . . .USD . . . . . . . . . (3,397). . . . . . . . . 1.3245. . . . . . Bank of New York Mellon Trust Co. N.A.(The). . . . . . . . A-1+ . . . . . . . . . . . . . . . . . . . . . . . . . 946-Jul-17 . . . . . . . . . . . . . . . . . . . .CAD . . . . . . . . . . . 3,000. . . . . . . . . . . .USD . . . . . . . . . (2,234). . . . . . . . . 1.3431. . . . . . Royal Bank of Canada . . . . . . . . . . . . . . . . . . . . . . . . . . . . . . . . . . A-1+ . . . . . . . . . . . . . . . . . . . . . . . . 1046-Jul-17 . . . . . . . . . . . . . . . . . . . .CAD . . . . . . . . . . . 3,010. . . . . . . . . . . .USD . . . . . . . . . (2,235). . . . . . . . . 1.3466. . . . . . Bank of New York Mellon Trust Co. N.A.(The). . . . . . . . A-1+ . . . . . . . . . . . . . . . . . . . . . . . . 1116-Jul-17 . . . . . . . . . . . . . . . . . . . .CAD . . . . . . . . . 20,396. . . . . . . . . . . .USD . . . . . . . (15,105). . . . . . . . . 1.3503. . . . . . Bank of New York Mellon Trust Co. N.A.(The). . . . . . . . A-1+ . . . . . . . . . . . . . . . . . . . . . . . . 8086-Jul-17 . . . . . . . . . . . . . . . . . . . .CAD . . . . . . . . 185,561. . . . . . . . . . . .USD . . . . . . (137,976). . . . . . . . . 1.3449. . . . . . Toronto Dominion Bank, The . . . . . . . . . . . . . . . . . . . . . . . . . . A-1+ . . . . . . . . . . . . . . . . . . . . . . 6,6386-Jul-17 . . . . . . . . . . . . . . . . . . . .CAD . . . . . . . . 206,852. . . . . . . . . . . .USD . . . . . . (153,808). . . . . . . . . 1.3449. . . . . . Royal Bank of Canada . . . . . . . . . . . . . . . . . . . . . . . . . . . . . . . . . . A-1+ . . . . . . . . . . . . . . . . . . . . . . 7,3996-Jul-17 . . . . . . . . . . . . . . . . . . . .CAD . . . . . . . . 208,206. . . . . . . . . . . .USD . . . . . . (154,816). . . . . . . . . 1.3449. . . . . . Bank of Montreal . . . . . . . . . . . . . . . . . . . . . . . . . . . . . . . . . . . . . . . A-1 . . . . . . . . . . . . . . . . . . . . . . . . 7,4466-Jul-17 . . . . . . . . . . . . . . . . . . . .CAD . . . . . . . . 233,857. . . . . . . . . . . .USD . . . . . . (173,892). . . . . . . . . 1.3448. . . . . . Bank of Nova Scotia . . . . . . . . . . . . . . . . . . . . . . . . . . . . . . . . . . . . A-1 . . . . . . . . . . . . . . . . . . . . . . . . 8,3606-Jul-17 . . . . . . . . . . . . . . . . . . . .CAD . . . . . . . . 273,576. . . . . . . . . . . .USD . . . . . . (203,425). . . . . . . . . 1.3448. . . . . . Bank of New York Mellon Trust Co. N.A.(The). . . . . . . . A-1+ . . . . . . . . . . . . . . . . . . . . . . 9,7803-Aug-17 . . . . . . . . . . . . . . . . . .CAD . . . . . . . . . 34,963. . . . . . . . . . . .USD . . . . . . . (26,945). . . . . . . . . 1.2976. . . . . . Bank of New York Mellon Trust Co. N.A.(The). . . . . . . . A-1+ . . . . . . . . . . . . . . . . . . . . . . . . . 443-Aug-17 . . . . . . . . . . . . . . . . . .CAD . . . . . . . . 180,539. . . . . . . . . . . .USD . . . . . . (139,094). . . . . . . . . 1.2980. . . . . . Toronto Dominion Bank, The . . . . . . . . . . . . . . . . . . . . . . . . . . A-1+ . . . . . . . . . . . . . . . . . . . . . . . . 2823-Aug-17 . . . . . . . . . . . . . . . . . .CAD . . . . . . . . 205,430. . . . . . . . . . . .USD . . . . . . (158,275). . . . . . . . . 1.2979. . . . . . Royal Bank of Canada . . . . . . . . . . . . . . . . . . . . . . . . . . . . . . . . . . A-1+ . . . . . . . . . . . . . . . . . . . . . . . . 3173-Aug-17 . . . . . . . . . . . . . . . . . .CAD . . . . . . . . 200,947. . . . . . . . . . . .USD . . . . . . (154,816). . . . . . . . . 1.2980. . . . . . Bank of Montreal . . . . . . . . . . . . . . . . . . . . . . . . . . . . . . . . . . . . . . . A-1 . . . . . . . . . . . . . . . . . . . . . . . . . . 3173-Aug-17 . . . . . . . . . . . . . . . . . .CAD . . . . . . . . 231,504. . . . . . . . . . . .USD . . . . . . (178,360). . . . . . . . . 1.2980. . . . . . Bank of Nova Scotia . . . . . . . . . . . . . . . . . . . . . . . . . . . . . . . . . . . . A-1 . . . . . . . . . . . . . . . . . . . . . . . . . . 3623-Aug-17 . . . . . . . . . . . . . . . . . .CAD . . . . . . . . 290,951. . . . . . . . . . . .USD . . . . . . (224,162). . . . . . . . . 1.2980. . . . . . Bank of New York Mellon Trust Co. N.A.(The). . . . . . . . A-1+ . . . . . . . . . . . . . . . . . . . . . . . . 453
Total Unrealized Gain on Forward Currency Contracts . . . . . . . . . . . . . . . . . . . . . . . . . . . . . . . . . . . . . . . . . . . . . . . . . . . . . . . . . . . . . . . . . . . . . . . . . . . . . . . . . . . . . . . . . . . . . . . . . . . . . . . . . . . . . . . . . . . . . . . . . . . . . . . . . . . . 42,682
UNREALIZED LOSS ON FORWARD CURRENCY CONTRACTS
Settlement Date
Currency Buy
Position (000s)
Currency Sell
Position (000s)
Contract Rate Counterparty
Credit Rating*
Unrealized Loss
6-Jul-17 . . . . . . . . . . . . . . . . . . . .USD . . . . . . . . . . . 1,116. . . . . . . . . . . .CAD . . . . . . . . . (1,452). . . . . . . . . 0.7685. . . . . . Royal Bank of Canada . . . . . . . . . . . . . . . . . . . . . . . . . . . . . . . . . . A-1+ . . . . . . . . . . . . . . . . . . . . . . . . . (5)6-Jul-17 . . . . . . . . . . . . . . . . . . . .USD . . . . . . . . . 27,500. . . . . . . . . . . .CAD . . . . . . . (35,703). . . . . . . . . 0.7702. . . . . . Bank of New York Mellon Trust Co. N.A.(The). . . . . . . . A-1+ . . . . . . . . . . . . . . . . . . . . . . . (42)6-Jul-17 . . . . . . . . . . . . . . . . . . . .USD . . . . . . . . 139,094. . . . . . . . . . . .CAD . . . . . . (180,642). . . . . . . . . 0.7700. . . . . . Toronto Dominion Bank, The . . . . . . . . . . . . . . . . . . . . . . . . . . A-1+ . . . . . . . . . . . . . . . . . . . . . . (268)6-Jul-17 . . . . . . . . . . . . . . . . . . . .USD . . . . . . . . 154,816. . . . . . . . . . . .CAD . . . . . . (201,059). . . . . . . . . 0.7700. . . . . . Bank of Montreal . . . . . . . . . . . . . . . . . . . . . . . . . . . . . . . . . . . . . . . A-1 . . . . . . . . . . . . . . . . . . . . . . . . (299)6-Jul-17 . . . . . . . . . . . . . . . . . . . .USD . . . . . . . . 158,275. . . . . . . . . . . .CAD . . . . . . (205,548). . . . . . . . . 0.7700. . . . . . Royal Bank of Canada . . . . . . . . . . . . . . . . . . . . . . . . . . . . . . . . . . A-1+ . . . . . . . . . . . . . . . . . . . . . . (302)6-Jul-17 . . . . . . . . . . . . . . . . . . . .USD . . . . . . . . 178,360. . . . . . . . . . . .CAD . . . . . . (231,630). . . . . . . . . 0.7700. . . . . . Bank of Nova Scotia . . . . . . . . . . . . . . . . . . . . . . . . . . . . . . . . . . . . A-1 . . . . . . . . . . . . . . . . . . . . . . . . (339)6-Jul-17 . . . . . . . . . . . . . . . . . . . .USD . . . . . . . . 224,162. . . . . . . . . . . .CAD . . . . . . (291,116). . . . . . . . . 0.7700. . . . . . Bank of New York Mellon Trust Co. N.A.(The). . . . . . . . A-1+ . . . . . . . . . . . . . . . . . . . . . . (429)
Total Unrealized Loss on Forward Currency Contracts . . . . . . . . . . . . . . . . . . . . . . . . . . . . . . . . . . . . . . . . . . . . . . . . . . . . . . . . . . . . . . . . . . . . . . . . . . . . . . . . . . . . . . . . . . . . . . . . . . . . . . . . . . . . . . . . . . . . . . . . . . . . . . . . . . . . (1,684)
* Credit Rating provided by Standard & Poor's.
BMO High Yield US Corporate Bond Hedged to CAD Index ETF(unaudited)
Notes to the Financial Statements (All amounts in thousands of Canadian dollars, except per unit data)June 30, 2017
1. The ETF Fund
BMO High Yield US Corporate Bond Hedged to CAD Index ETF (“the ETF”) is an exchange-traded fund established as an open-ended trust by a Declaration of Trust under the laws of the Province of Ontario. BMO Asset Management Inc. (“the Manager”) is the Manager and trustee of the ETF. The Manager is a wholly owned subsidiary of Bank of Montreal. The address of the ETF’s registered office is 100 King Street West, Toronto, Ontario, M5X 1A1.
The Statement of Financial Position and related notes of each of the ETFs are as at June 30, 2017 and December 31, 2016, except for ETFs established in 2017, in which case the information is only as at June 30, 2017. The Statement of Comprehensive Income, Statement of Changes in Net Assets Attributable to Holders of Redeemable Units, Statement of Cash Flows and related notes are for the periods ended June 30, 2017 and June 30, 2016 except for the ETFs established during either period, in which case the information provided relates to the period from the date of establishment to June 30, 2017or June 30, 2016, as applicable. Financial information provided for a class of units established during the period(s) is presented from the establishment date as noted in Note 8.
Certain prior period balances have been reclassified to conform with the current presentation.
The financial statements were authorized for issue by the Manager on August 9, 2017.
These financial statements should be read in conjunction with the annual financial statements for the period ended December 31, 2016 which have been prepared in accordance with International Financial Reporting Standards (“IFRS”).
2. Basis of preparation and presentation
These unaudited interim financial statements have been prepared in accordance with IFRS and in accordance with International Accounting Standard (“IAS”) 34 – Interim Financial Reporting, as issued
by the International Accounting Standards Board (“IASB”).
3. Summary of significant accounting policiesFinancial instrumentsThe ETF records financial instruments at fair value. Investment transactions are accounted for on the trade date. The ETF’s investments are either designated at fair value through profit or loss (“FVTPL”) at inception or classified as held for trading. The changes in investment fair values and related transaction costs are recorded in the ETF’s Statement of Comprehensive Income.
Financial assets or financial liabilities held for trading are those acquired or incurred principally for the purpose of selling or repurchasing in the near future, or on initial recognition, are part of a portfolio of identified financial instruments that the ETF manages together and that have a recent actual pattern of short-term profit taking. The ETF classifies all derivatives and short positions as held for trading. The ETF does not designate any derivatives as hedges in a hedging relationship.
The ETF designates all other investments at FVTPL, as they have reliably measurable fair values and are part of a group of financial assets or financial liabilities that are managed and have their performance evaluated on a fair value basis in accordance with the ETF’s investment strategy.
The ETF’s redeemable units, which are puttable instruments, are held by different types of unitholders that are entitled to different redemption rights. See Note 5 for details of unitholders’ transactions in the units of the ETF.
The different redemption features create equally subordinate but not identical units or classes of the units of the ETF. Redemption of units at 95% of the Net Asset Value “NAV” for some type of unitholders redemptions also results in a situation where the redemption value of this puttable instrument is not based substantially on the net assets of the ETF. As a result, the ETF’s obligations for net assets attributable

BMO High Yield US Corporate Bond Hedged to CAD Index ETF(unaudited)
Notes to the Financial Statements (cont’d)(All amounts in thousands of Canadian dollars, except per unit data)June 30, 2017
to holders of redeemable units are classified as financial liabilities and presented at the redemption amounts.
All other financial assets and financial liabilities are measured at amortized cost. Under this method, financial assets and financial liabilities reflect the amount required to be received, paid or discounted, when appropriate, at the contract’s effective interest rate.
The Manager has determined that the ETF meets the definition of “investment entity” and as a result, the ETF measures subsidiaries, if any, at FVTPL.
Cost of investmentsThe cost of investments represents the amount paid for each security and is determined on an average cost basis.
Fair value measurementInvestments are recorded at their fair value with the change between this amount and their average cost being recorded as “Change in unrealized appreciation (depreciation)” in the Statement of Comprehensive Income.
For exchange-traded securities, close prices are considered to be fair value if they fall within the bid-ask spread. In circumstances where the close price is not within the bid-ask spread, the Manager determines the point within the bid-ask spread that is most representative of fair value based on the specific facts and circumstances.
Procedures are in place to fair value securities traded in countries outside of North America daily, to avoid stale prices and to take into account, among other things, any significant events occurring after the close of a foreign market.
For bonds, debentures, asset-backed securities and other debt securities, fair value is represented by mid prices provided by independent security pricing services. Short-term investments, if any, are held at amortized cost which approximates fair value.
For securities where market quotes are not available, unreliable or not considered to reflect the current value, the Manager may determine another value which it considers to be fair and reasonable, or use a valuation technique that, to the extent possible, makes maximum use of inputs and assumptions based on observable market data, including volatility, comparable companies, NAV (for exchange-traded funds) and other applicable rates or prices. These estimation techniques include discounted cash flows, internal models that utilize observable data or comparisons with other securities that are substantially similar. In limited circumstances, the Manager may use internal models where the inputs are not based on observable market data.
Derivative instrumentsDerivative instruments are financial contracts that derive their value from changes in the underlying interest rates, foreign exchange rates, or other financial or commodity prices or indices.
Derivative instruments are either regulated exchange-traded contracts or negotiated over-the-counter contracts. The ETF may use these instruments for trading purposes, as well as to manage the ETF’s risk exposures.
Derivatives are measured at fair value. Realized gains and losses are included in “Net realized gain (loss) in the Statement of Comprehensive Income and unrealized gains and losses are included in “Change in unrealized appreciation (depreciation)” in the Statement of Comprehensive Income.
Forward currency contracts
A forward currency contract is an agreement between two parties (the ETF and the counterparty) to purchase or sell a currency against another currency at a set price on a future date. The ETF may enter into forward currency contracts for hedging purposes, which can include the economic hedging of all or a portion of the currency exposure of an investment or group of investments, either directly or indirectly. The ETF may also enter into these contracts for non-hedging

BMO High Yield US Corporate Bond Hedged to CAD Index ETF(unaudited)
Notes to the Financial Statements (cont’d)(All amounts in thousands of Canadian dollars, except per unit data)June 30, 2017
purposes, which can include increasing the exposure to a foreign currency, or the shifting exposure to foreign currency fluctuations from one country to another. The value of forward currency contracts entered into by the ETF is recorded as the difference between the value of the contract on the Valuation Date (the “Valuation Date” is each day on which the Toronto Stock Exchange is open for trading) and the value on the date the contract originated.
Option contracts
The ETF may engage in option contract transactions by purchasing (long positions) or writing (short positions) call or put option contracts. These contracts have different risk exposures for the ETF, whereas the risk for long positions will be limited to the premium paid to purchase the option contracts, the risk exposure for the short positions is potentially unlimited until closed or expired.
Purchased option contracts
The premium paid for purchasing an option is recorded as an asset in the Statement of Financial Position. The option contract is valued on each Valuation Date at an amount equal to the fair value of the option that would have the effect of closing the position. The change in the difference between the premium and the fair value is shown as “Change in unrealized appreciation (depreciation)” in the Statement of Comprehensive Income.
When a purchased option expires, the ETF will realize a loss equal to the premium paid. When a purchased option is closed, the gain or loss the ETF will realize will be the difference between the proceeds and the premium paid. When a purchased call option is exercised, the premium paid is added to the cost of acquiring the underlying security. When a purchased put option is exercised, the premium paid is subtracted from the proceeds from the sale of the underlying security that had to be sold.
Written option contracts
The premium received from writing a call or put option is recorded as a liability in the Statement of Financial Position.
When a written option expires, the ETF will realize a gain equal to the premium received. When a written option is closed, the ETF will realize a gain or loss equal to the difference between the cost at which the contract was closed and the premium received. When a written call option is exercised, the premium received is added to the proceeds from the sale of the underlying investments to determine the realized gain or loss. When a written put option is exercised, the premium received is subtracted from the cost of the underlying investment the ETF had purchased.
The gain or loss that the ETF realizes when a purchased or written option is expired or closed is recorded as “Net realized gain (loss)” in the Statement of Comprehensive Income.
Credit default swap contracts
A credit default swap contract is an agreement to transfer credit risk from one party, a buyer of protection, to another party, a seller of protection. The ETF, as a seller of protection, would be required to pay a notional or other agreed upon value to the buyer of protection in the event of a default by a third-party. In return, the ETF would receive from the counterparty a periodic stream of payments over the term of the contract provided that no event of default occurs. If no default occurs, the ETF would keep the stream of payments and would have no payment obligations.
In connection with the agreement, securities or cash may be identified as collateral or margin in accordance with the terms of the agreement to provide assets of value in the event of default or bankruptcy/insolvency.
The ETF, as a buyer of protection, would receive a notional or other agreed upon value from the seller of protection in the event of a default by a third-party. In return, the ETF would be required to pay to the counterparty a periodic stream of payments over the

BMO High Yield US Corporate Bond Hedged to CAD Index ETF(unaudited)
Notes to the Financial Statements (cont’d)(All amounts in thousands of Canadian dollars, except per unit data)June 30, 2017
term of the contract provided that no event of default occurs.
Credit default swap contracts are fair valued daily based upon quotations from independent security pricing sources. Premiums paid or received, if any, are included in “Net realized gain (loss)” in the Statement of Comprehensive Income. Net periodic payments are accrued daily and recorded as “Interest income” in the Statement of Comprehensive Income. When credit default swap contracts expire or are closed out, gains or losses are recorded as “Net realized gain (loss)” in the Statement of Comprehensive Income.
Income recognitionDividend income and distribution from investment trusts are recognized on the ex-dividend and ex-distribution date, respectively.
Interest income from interest bearing investments is recognized in the Statement of Comprehensive Income using the effective interest rate. Interest receivable shown in the Statement of Financial Position is accrued based on the interest bearing investments’ stated rates of interest.
Interest on inflation-indexed bonds is paid based on a principal value, which is adjusted for inflation. The inflation adjustment of the principal value is recognized as part of interest income in the Statement of Comprehensive Income. If held to maturity, the ETF will receive, in addition to a coupon interest payment, a final payment equal to the sum of the par value and the inflation compensation accrued from the original issue date. Interest is accrued on each Valuation Date based on the inflation adjusted par value at that time and is included in “Interest income” in the Statement of Comprehensive Income.
Foreign currency translationThe fair value of investments and other assets and liabilities in foreign currencies are translated into the ETF’s functional currency at the rates of exchange prevailing at the period-end date. Purchases and sales of investments, and income and expenses are translated at the rates of exchange prevailing on
the respective dates of such transactions. Foreign exchange gains (losses) on completed transactions are included in “Net realized gain (loss)” in the Statement of Comprehensive Income and unrealized foreign exchange gains (losses) are included in “Change in unrealized appreciation (depreciation)” in the Statement of Comprehensive Income. Foreign exchange gains (losses) relating to cash, receivables and payables are included in "Foreign exchange gain (loss)” in the Statement of Comprehensive Income.
Securities lendingAn ETF may engage in securities lending pursuant to the terms of an agreement with BNY Mellon (the “securities lending agent”). The aggregate market value of all securities on loan by an ETF cannot exceed 50% of the NAV of the ETF. An ETF will receive collateral of at least 102% of the value of the securities on loan. Collateral will generally be comprised of obligations of or guarantee by the Government of Canada or a province thereof, or by the United States government or its agencies, but may include obligations of other governments with appropriate credit ratings. Further, the program entered into provides for 100% indemnification by the securities lending agent and parties related to the ETF’s custodian, to the ETF for any defaults by borrowers.
For those ETFs participating in the program, aggregate values of securities on loan and the collateral held as at June 30, 2017 and December 31, 2016 and information about the security lending income earned by the ETF are disclosed in Note 8.
Income from securities lending, where applicable, is included in the Statement of Comprehensive Income and is recognized when earned. The breakdown of the securities lending income is disclosed in Note 8, where applicable.
CashCash is comprised of cash and deposits with banks which include bankers’ acceptances and overnight demand deposits. Cash is recorded at fair value. The

BMO High Yield US Corporate Bond Hedged to CAD Index ETF(unaudited)
Notes to the Financial Statements (cont’d)(All amounts in thousands of Canadian dollars, except per unit data)June 30, 2017
carrying amount of cash approximates its fair value because it is short-term in nature.
Other assets and other liabilitiesReceivable from investments sold, dividends receivable, distribution receivable from investment trusts, and subscriptions receivable, are initially recorded at fair value and subsequently measured at amortized cost. Similarly, payable for investments purchased, redemptions payable, distributions payable and accrued expenses are measured at amortized cost. Other assets and liabilities are short-term in nature, and are carried at cost or amortized cost.
Increase or decrease in net assets attributable to holders of redeemable units“Increase (decrease) in net assets attributable to holders of redeemable units per unit” of a class in the Statement of Comprehensive Income represents the increase (decrease) in net assets attributable to holders of redeemable units (“Net Assets”) of the class divided by the weighted average number of units of the class outstanding during the period.
TaxationThe ETF qualifies as a mutual fund trust under the provisions of the Income Tax Act (Canada). Distributions of all net taxable income and sufficient amounts of net realized capital gains for each taxation year will be paid to unitholders so that the ETF will not be subject to income tax. As a result, the ETF has determined that it is in substance not taxable and therefore does not record income taxes in the Statement of Comprehensive Income nor does it recognize any deferred tax assets or liabilities in the Statement of Financial Position.
The ETF may incur withholding taxes imposed by certain countries on investment income and capital gains. Such income and gains are recorded on a gross basis with the related withholding taxes shown as a separate expense in the Statement of Comprehensive Income.
Investments in subsidiaries, joint ventures and associatesSubsidiaries are entities over which the ETF has control through its exposure or rights to variable returns from its investment and has the ability to affect those returns through its power over the entity. The Manager has determined that the ETF is an investment entity and as such, it accounts for subsidiaries, if any, at fair value. Joint ventures are those where the ETF exercises joint control through an agreement with other shareholders, and associates are investments in which the ETF exerts significant influence over operating, investing, and financing decisions (such as entities in which the ETF owns 20% - 50% of voting shares), all of which, if any, have been designated at FVTPL.
Unconsolidated structured entitiesDuring the periods, the ETF had no sponsored unconsolidated structured entities. The Manager has determined that the underlying funds in which the ETF may invest are unconsolidated structured entities. This determination is based on the fact that decision making about the underlying funds is not governed by the voting right or other similar right held by the ETF. Similarly, investments in securitizations, asset-backed securities and mortgage-backed securities are determined to be interests in unconsolidated structured entities.
The ETF may invest in underlying funds whose investment objectives range from achieving short-term to long-term income and capital growth potential. Underlying funds may use leverage in a manner consistent with their respective investment objectives and as permitted by Canadian securities regulatory authorities. Underlying funds finance their operations by issuing redeemable units which are puttable at the holders’ option and entitles the holder to a proportionate stake in the respective fund’s Net Assets. The change in fair value of each of the underlying funds during the periods is included in “Change in unrealized appreciation (depreciation)” in the Statement of Comprehensive Income.

BMO High Yield US Corporate Bond Hedged to CAD Index ETF(unaudited)
Notes to the Financial Statements (cont’d)(All amounts in thousands of Canadian dollars, except per unit data)June 30, 2017
Mortgage-related securities are created from pools of residential or commercial mortgage loans, including mortgage loans made by savings and loan institutions, mortgage bankers, commercial banks and others. Asset-backed securities are created from many types of assets, including auto loans, credit card receivables, home equity loans, and student loans.
The ETF does not provide and has not committed to providing any additional significant financial or other support to the unconsolidated structured entities other than its investment in the unconsolidated structured entities.
Additional information on the ETF’s interest in unconsolidated structured entities, where applicable, is provided in Note 8.
Offsetting of financial assets and financial liabilities Financial instruments are presented at net or gross amounts on the Statement of Financial Position depending on the existence of intention and legal right to offset opposite positions of such instruments held with the same counterparties. Amounts offset in the Statement of Financial Position are transactions for which the ETF has legally enforceable rights to offset and intends to settle the positions on a net basis. Amounts not offset in the Statement of Financial Position relate to transactions where a master netting arrangement or similar agreement is in place with a right to offset only in the event of default, insolvency or bankruptcy, or where the ETF has no intention of settling on a net basis.
Accounting standards issued but not yet adoptedIn July 2014, the IASB issued the final version of IFRS 9 Financial Instruments, which addresses classification and measurement, impairment and hedge accounting.
The new standard requires assets to be carried at amortized cost, FVTPL or fair value through other comprehensive income based on the entity’s business model for managing financial assets and the contractual cash flow characteristics of the financial asset. The classification and measurement of liabilities remains generally unchanged with the exception of
liabilities recorded at FVTPL. For these liabilities, fair value changes attributable to changes in the entity’s own credit risk are to be presented in other comprehensive income unless they affect amounts recorded in income.
The new standard is effective for the ETF for its fiscal year beginning January 1, 2018. The Manager is in the process of assessing the impact of adopting this standard but does not expect that the adoption of this standard to have a significant impact to the ETF’s financial statements.
4. Critical accounting judgements and estimates
The preparation of financial statements requires the use of judgement in applying the ETF’s accounting policies and to make estimates and assumptions about the future. The following discusses the most significant accounting judgements and estimates that the ETF has made in preparing its financial statements:
Accounting judgements:Functional and presentation currencyThe ETF’s unitholders are mainly Canadian residents, with the subscriptions and redemptions of the redeemable units denominated in Canadian dollars. The ETF invests in Canadian and U.S. dollars and other foreign denominated securities, as applicable. The performance of the ETF is measured and reported to the investors in Canadian dollars. The Manager considers the Canadian dollar as the currency that most faithfully represents the economic effects of the underlying transactions, events and conditions. The financial statements are presented in Canadian dollars, which is the ETF's functional and presentation currency.
Classification and measurement of financial instruments and application of fair value optionIn classifying and measuring financial instruments held by the ETF, the Manager is required to make significant judgements about whether or not the business of the ETF is to invest on a total return basis for the purpose of applying the fair value options for financial assets.
BMO High Yield US Corporate Bond Hedged to CAD Index ETF(unaudited)
Notes to the Financial Statements (cont’d)(All amounts in thousands of Canadian dollars, except per unit data)June 30, 2017
Accounting estimates:Fair value measurement of securities not quoted in an active marketThe ETF has established policies and control procedures that are intended to ensure these estimates are well controlled, independently reviewed, and consistently applied from period to period. The estimates of the value of the ETF’s assets and liabilities are believed to be appropriate as at the reporting date.
The ETF may hold financial instruments that are not quoted in active markets. Note 3 discusses the policies used by the ETF for the estimates used in determining fair value.
5. Units and unit transactions
The redeemable units of the ETF are classified as liabilities.
The units have no par value and are entitled to distributions, if any. Upon redemption, a unit is entitled to a proportionate share of the ETF’s NAV. The ETF is required to pay distributions in an amount not less than the amount necessary to ensure the ETF will not be liable for income taxes on realized capital gains, dividends and interest. The ETF has no restrictions or specific capital requirements on the subscriptions and redemptions of units except as disclosed in Note 8. The relevant movements in redeemable units are shown in the Statement of Changes in Net Assets Attributable to Holders of Redeemable Units.
In accordance with its investment objectives and strategies, and the risk management practices outlined in Note 7, the ETF endeavours to invest the subscriptions received in appropriate investments, while maintaining sufficient liquidity to meet redemptions, with such liquidity being augmented by short-term borrowings or disposal of investments where necessary.
The ETF is authorized to issue an unlimited number of units of each class. On any trading day, a designated broker or underwriter may place a subscription or redemption order for an integral multiple of the
prescribed number of units of the ETF. A trading day is each day on which the TSX is opened for business.
If the subscription or redemption order is accepted, the ETF will issue or redeem units to/from the designated broker or underwriter by no later than the third trading day after the date on which the subscription or redemption order is accepted. For each prescribed number of units issued or redeemed, a designated broker or underwriter must deliver or receive payment consisting of:
• A basket of applicable securities and cash in an amount sufficient so that the value of the securities, and the cash received is equal to the NAV of the units redeemed; or
• Cash in the amount equal to the NAV of the units redeemed.
On any trading day, unitholders may redeem units for cash or exchange units for baskets of securities and cash. Units redeemed for cash will be redeemed at a redemption price per unit equal to 95% of the closing price for the units on the TSX on the effective day of the redemption. Units exchanged for baskets of securities will be exchanged at a price equal to the NAV of the units on the effective date of the exchange request, payable by delivery of baskets of securities and cash. The units will be redeemed in the exchange.
Unitholders that redeem units prior to the distribution record date will not be entitled to receive the distribution.
The NAV per unit of a class for the purposes of subscription or redemption is computed by dividing the NAV of the ETF (that is, the total fair value of the assets attributable to the class of the ETF less the liabilities attributable to the class) by the total number of units of the class of the ETF outstanding at such time on each Valuation Day, in accordance with Part 14 National Instrument (“NI”) 81-106 Investment Fund Continuous Disclosure for the purpose of processing unitholder transactions. Net Assets are determined in accordance with IFRS and may differ from the ETF’s NAV. Where an ETF’s NAV is not equal to its Net Assets, a reconciliation is shown in Note 8.

BMO High Yield US Corporate Bond Hedged to CAD Index ETF(unaudited)
Notes to the Financial Statements (cont’d)(All amounts in thousands of Canadian dollars, except per unit data)June 30, 2017
6. Related party transactions(a) Management fees
The Manager is responsible for all other costs and expenses of the ETF, including the fees payable to the Custodian, Registrar and Transfer Agent and Plan Agent fees payable to other service providers, including the index providers retained by the Manager.
The ETF will pay the Manager a management fee as disclosed in Note 8 based on the NAV of the class of the ETF. The management fee, plus applicable taxes, will be accrued daily and paid quarterly in arrears. The Manager may, from time to time in its discretion, waive a portion of the management fee charged at any given time.
The Manager may agree to charge a reduced management fee it otherwise would be entitled to receive from the ETF with respect to investments in the ETF by certain unitholders. An amount equal to the difference between the fee otherwise chargeable and the reduced fee of the ETF will be distributed in cash to those unitholders as Management Fee Distributions.
(b) Other related party transactions
All expenses are recognized in the Statement of Comprehensive Income on the accrual basis.
The ETF is responsible for the costs and expenses incurred in complying with National Instruments 81-107 (including any expenses related to the implementation and on-going operation of an Independent Review Committee), brokerage expenses and commissions, income and withholding taxes as well as other applicable taxes, the costs of complying with any new governmental or regulatory requirement introduced after the date the ETF was established and extraordinary expenses.
From time to time, the Manager may on behalf of the ETF enter into transactions or arrangements with or involving subsidiaries and affiliates of Bank of Montreal, or certain other persons or companies that are related or connected to the Manager of the ETF. These transactions or arrangements may include transactions or arrangements with or involving
subsidiaries and affiliates of Bank of Montreal, BMO Asset Management Corp., BMO Asset Management Inc., BMO Nesbitt Burns Inc., BMO Private Investment Counsel Inc., BMO InvestorLine Inc., BMO Investments Inc., or other investment funds offered by Bank of Montreal and may involve the purchase or sale of portfolio securities through or from a subsidiary or affiliates of Bank of Montreal, the purchase or sale of securities issued or guaranteed by a subsidiary or affiliates of Bank of Montreal, entering into forward contracts with a subsidiary or affiliates of Bank of Montreal acting as counterparty, the purchase or redemption of units of other Bank of Montreal affiliated investment funds or the provision of services to the Manager.
BMO Nesbitt Burns Inc. is one of the designated brokers that have entered into an underwriting agreement with the Manager. As a Designated Broker, under the underwriting agreement, BMO Nesbitt Burns Inc. may subscribe for and or be issued units of the ETF by the Manager from time to time.
7. Financial instruments risks
The ETF’s activities expose it to a variety of risks associated with the financial instruments, as follows: market risk (including currency risk, interest rate risk and other market risk), credit risk and liquidity risk. The concentration table groups securities by asset type, geographic location and/or market segment. The ETF’s risk management practice focuses on processes and strategies to minimize the tracking error between the ETF’s performance and the performance of its relevant index.
(a) Currency risk
Currency risk is the risk that the value of financial instruments denominated in currencies, other than the functional currency of the ETF, will fluctuate due to changes in foreign exchange rates. Investments in foreign markets are exposed to currency risk as the prices denominated in foreign currencies are converted to the ETF’s functional currency in determining fair value. The ETF may enter into

BMO High Yield US Corporate Bond Hedged to CAD Index ETF(unaudited)
Notes to the Financial Statements (cont’d)(All amounts in thousands of Canadian dollars, except per unit data)June 30, 2017
forward currency contracts for hedging purposes to reduce foreign currency exposure. The ETF’s exposure to currency risk, if any, is further disclosed in Note 8.
(b) Interest rate risk
Interest rate risk is the risk that the fair value of the ETF's interest bearing investments will fluctuate due to changes in market interest rates. The ETF's exposure to interest rate risk is concentrated in its investment in debt securities (such as bonds, money market investments, short-term investments and debentures) and interest rate derivative instruments, if any. Other assets and liabilities are short-term in nature and/or non-interest bearing. The ETF's exposure to interest rate risk, if any, is further discussed in Note 8.
(c) Other market risk
Other market risk is the risk that the fair value of a financial instrument will fluctuate as a result of changes in market prices (other than those arising from interest rate risk or currency risk), whether those changes are caused by factors specific to the individual financial instrument or its issuer, or factors affecting all similar financial instruments traded in a market or market segment. The Manager moderates this risk through the use of investment strategies that seek to minimize the ETF’s tracking error versus a market index, within the parameters of the investment strategy. The maximum risk resulting from financial instruments is equivalent to its fair value.
The Manager monitors the ETF’s overall market positions on a daily basis and positions are maintained within established ranges. Other assets and liabilities are monetary items that are short-term in nature, and as such they are not subject to other market risk. The ETF's exposure to other market risk, if any, is further discussed in Note 8.
(d) Credit risk
Credit risk is the risk that a loss could arise from a security issuer or counterparty to a financial instrument not being able to meet its financial obligations. The fair value of debt securities includes consideration of the credit worthiness of the debt
issuer. Credit risk exposure for over-the-counter derivative instruments is based on the ETF's unrealized gain of the contractual obligations with the counterparty as at the reporting date. The credit exposure of other assets is represented by its carrying amount. The ETF's exposure to credit risk, if any, is further discussed in Note 8.
The ETF may enter into securities lending transactions with approved counterparties. Credit risk associated with these transactions is considered minimal as all counterparties have a sufficient approved credit rating and the market value of collateral held by the ETF must be at least 102% of the fair value of securities loaned, if any, as disclosed in Note 8.
(e) Liquidity risk
The ETF's exposure to liquidity risk is concentrated in the daily redemptions of units. Since the settlement of redemptions is primarily by delivery of securities, the ETF is not exposed to any significant liquidity risk. The ETF primarily invests in securities that are traded in active markets and can be readily disposed. In addition, the ETF retains sufficient cash and cash equivalent positions to maintain liquidity. The ETF may, from time to time, enter into over-the-counter derivative contracts or invest in unlisted securities, which are not traded in an organized market and may be illiquid. Securities for which market quotation could not be obtained and may be illiquid are identified on the Schedule of Investment Portfolio. The proportion of illiquid securities to the NAV of the ETF is monitored by the Manager to ensure it does not exceed the regulatory limit and does not significantly affect the liquidity required to meet the ETF's financial obligations.

BMO High Yield US Corporate Bond Hedged to CAD Index ETF(unaudited)
Notes to the Financial Statements (cont’d)(All amounts in thousands of Canadian dollars, except per unit data)June 30, 2017
8. ETF specific information(a) ETF information and change in units
The ETF was established on October 16, 2009. The Listed Units are listed on the TSX under the symbol ZHY.
Institutional Units are available to Accredited Investors only. A subscription agreement is required to purchase Institutional Units and must be received in a form satisfactory to the Manager before an investor’s initial subscription for Institutional Units may be accepted.
The last close price as at June 30, 2017 and December 31, 2016 are shown in the following table.
As at
Jun. 30, Dec. 31,Class 2017 2016Listed CAD Units $14.60 $14.41
The number of units that have been issued and are outstanding are disclosed in the table below.
For the periods ended (in thousands of units)
Jun. 30, 2017
Jun. 30, 2016
Listed CAD UnitsUnits issued and outstanding,
beginning of period 74,197 80,709Units issued 2,600 7,400Redeemed during the period (300) (7,523)Units issued and outstanding,
end of period 76,497 80,586
Institutional UnitsUnits issued and outstanding,
beginning of period 1,926 1,804Issued on reinvestment of distributions 29 64Units issued and outstanding,
end of period 1,955 1,868
(b) Reconciliation of NAV to Net Assets
As at June 30, 2017 and December 31, 2016, there were no differences between the ETF’s NAV per unit and its Net Assets per unit calculated in accordance with IFRS.
(c) Increase (decrease) in net assets attributable to holders of redeemable units per unit
The increase (decrease) in net assets attributable to holders of redeemable units per unit for the periods ended June 30, 2017 and June 30, 2016 is calculated as follows:
Jun. 30, Jun. 30,For the periods ended 2017 2016
Listed CAD Units
Increase in net assets attributable to holders of redeemable units 43,652 85,289
Weighted average units outstanding during the period 74,962 83,455
Increase in net assets attributable to holders of redeemable units per unit 0.58 1.02
Institutional Units
Increase in net assets attributable to holders of redeemable units 1,234 1,953
Weighted average units outstanding during the period 1,949 1,842
Increase in net assets attributable to holders of redeemable units per unit 0.63 1.06
(d) Income taxes
As at the tax year-ended December 2016, the ETF had the following capital and non-capital losses available for income tax purposes:
Non-Capital Losses That Expire in
Total Capital Losses
($)
Total Non-Capital Losses ($)
2027 ($)
2028 ($)
2029 and
thereafter ($)
223,449 — — — —
(e) Related party transactionsManagement fees
The Manager is entitled to receive a management fee of 0.550% per annum of the NAV of the ETF, plus applicable taxes, accrued daily and paid quarterly in arrears.
Management fees for Institutional Units are paid directly to the Manager as negotiated with the investor.
The outstanding accrued management fees due to the Manager are included in “Accrued expenses” in the Statement of Financial Position and as at June 30, 2017 amounted to $1,678 (December 31, 2016 — $1,744).

BMO High Yield US Corporate Bond Hedged to CAD Index ETF(unaudited)
Notes to the Financial Statements (cont’d)(All amounts in thousands of Canadian dollars, except per unit data)June 30, 2017
Brokerage commissions
Brokerage commissions paid (excluding transaction costs) on security transactions and amounts paid to related parties of the Manager for brokerage services provided to the ETF for the periods are as follows:
Jun. 30, 2017 Jun. 30, 2016For the periods ended ($) ($)
Total brokerage amounts paid — 26Total brokerage amounts paid to
related parties — 0
There were no ascertainable soft dollars paid or payable to dealers by the ETF during the periods.
(f) Financial instruments risks
The ETF’s objective is to replicate, to the extent possible, the performance of the broad United States high yield corporate bond market index, net of expenses. The investment strategy of the ETF is currently to invest in and hold the constituent securities of the Barclays Capital U.S. High Yield Very Liquid Index CAD Hedged in the same proportion as they are reflected in the Barclays Capital U.S. High Yield Very Liquid Index CAD Hedged or securities intended to replicate the performance of the index.
No changes affecting the overall level of risk of investing in the ETF were made during the period.
Currency risk
The ETF’s exposure to currency risk is summarized in the tables below. Amounts shown are based on the carrying value of monetary and non-monetary assets (including derivatives and the underlying principle (notional) amount of forward currency contracts, if any).
As at Jun. 30, 2017
Currency
Cash and other current receivables & payables
($)
Invest- ments
(monetary & non-monetary)
($)
Forward currency contracts
($)
Net currency exposure
($)
As a % of net assets
(%)
U.S. Dollar (16,498) 1,121,881 (1,105,450) (67) (0.0)
All amounts in Canadian dollars
As at Dec. 31, 2016
Currency
Cash and other current receivables & payables
($)
Invest- ments
(monetary & non-monetary)
($)
Forward currency contracts
($)
Net currency exposure
($)
As a % of net assets
(%)
U.S. Dollar 29,060 1,067,127 (1,095,912) 275 0.0
All amounts in Canadian dollars
As at June 30, 2017 and December 31, 2016, if the Canadian dollar had strengthened or weakened by 5% in relation to all foreign currencies, with all variables held constant, the Net Assets of the ETF could possibly have increased or decreased, respectively, by approximately $3 (December 31, 2016 — $14). In practice, actual results may differ from this sensitivity analysis and the difference could be material.
Interest rate risk
The ETF’s exposure to interest rate risk, by remaining term to maturity, is summarized in the following table:
Number of years
Interest Rate Exposure as at Jun. 30, 2017
Interest Rate Exposure as at Dec. 31, 2016
Less than 1 year 7,254 —One to three years 83,276 84,846Three to five years 275,305 234,619Five to ten years 716,511 708,168Greater than ten years 23,482 24,048Total 1,105,828 1,051,681
All amounts in Canadian dollars
As at June 30, 2017 and December 31, 2016, if the prevailing interest rates had been raised or lowered by 1%, assuming a parallel shift in the yield curve, with all other variables held constant, the Net Assets of the ETF could possibly have increased or decreased, respectively, by approximately $38,657 (December 31, 2016 — $36,558). The ETF’s interest rate sensitivity was determined based on portfolio weighted duration. In practice, actual results may differ from this sensitivity analysis and the difference could be material.
Other market risk
The ETF was not significantly exposed to other market risk as at June 30, 2017 and December 31, 2016 as it was invested fully in fixed income securities.

BMO High Yield US Corporate Bond Hedged to CAD Index ETF(unaudited)
Notes to the Financial Statements (cont’d)(All amounts in thousands of Canadian dollars, except per unit data)June 30, 2017
Credit risk
The ETF’s exposure to credit risk, grouped by credit ratings, is summarized in the following table:
As a % of Net Assets as at
Credit Rating Jun. 30, 2017 Dec. 31, 2016
AA 2.3 0.2A 1.4 0.3BBB 0.3 0.3BB 37.4 36.3B 44.2 41.5CCC 14.6 17.7CC 0.3 0.3Unrated – 0.1
Total 100.5 96.7
Securities lending
The ETF had assets involved in securities lending transactions outstanding as at June 30, 2017 and December 31, 2016 as follows:
Aggregate Value of Securities on Loan
($)
Aggregate Value of Collateral Received for the Loan
($)
Jun. 30, 2017 357,150 375,575Dec. 31, 2016 310,116 326,352
The table below is a reconciliation of the gross amount generated from securities lending transactions to the security lending revenue for the periods ended June 30, 2017 and June 30, 2016:
For the periods ended Jun. 30, 2017 Jun. 30, 2016
Amount
% of Gross Securities Lending Revenue Amount
% of Gross Securities Lending Revenue
Gross securities lending revenue 623 100.0 727 100.0
Withholding taxes 174 27.8 215 29.5
449 72.2 512 70.5
Payment to securities lending agents 135 21.6 154 21.1
Net securities lending revenue* 314 50.6 358 49.4
* Amount shown on the Statement of Comprehensive Income is gross of withholding taxes of $174 (June 30, 2016 — $215).
Concentration risk
The ETF's concentration risk is summarized in the following table:
As atJun. 30,
2017Dec. 31,
2016
Bonds & DebenturesCorporate Bonds & Debentures 96.8% 96.2%
EquitiesEnergy 0.0% 0.0%Industrials 0.0% 0.1%Materials 0.0% 0.0%
Exchange Traded Funds 1.4% 1.3%
Other Assets Less Liabilities 1.8% 2.4%
100.0% 100.0%
(g) Financial assets and financial liabilitiesCategories of financial assets and financial liabilities
The categories of financial assets and financial liabilities, except cash, are summarized in the following table:
Jun. 30, Dec. 31,As at 2017 2016
Financial assets designated at FVTPL 1,121,881 1,067,127
Financial assets held for trading 41,943 4,827
Loans and receivables 19,080 21,195
Financial liabilities held for trading 945 1,879
Financial liabilities measured at amortized cost 44,823 7,583
Net gains and losses on financial assets and financial liabilities at fair value
Jun. 30, Jun. 30,For the periods ended 2017 2016
Net realized gains (losses) on financial assets
Held for trading — 12,729
Designated at FVTPL 59,900 43,707
59,900 56,436
Net realized gains (losses) on financial liabilities
Held for trading (3,394) —
Total net realized gains (losses) on financial assets and financial liabilities 56,506 56,436

BMO High Yield US Corporate Bond Hedged to CAD Index ETF(unaudited)
Notes to the Financial Statements (cont’d)(All amounts in thousands of Canadian dollars, except per unit data)June 30, 2017
Jun. 30, Jun. 30,For the periods ended 2017 2016
Change in unrealized gains (losses) on financial assets
Held for trading 38,050 58,752
Designated at FVTPL (46,222) (22,735)
(8,172) 36,017
Total change in net unrealized gains (losses) on financial assets and financial liabilities (8,172) 36,017
(h) Fair value hierarchy
The ETF classifies its financial instruments into three levels based on the inputs used to value the financial instruments. Level 1 securities are valued based on quoted prices in active markets for identical securities. Level 2 securities are valued based on significant observable market inputs, such as quoted prices from similar securities and quoted prices in inactive markets or based on observable inputs to models. Level 3 securities are valued based on significant unobservable inputs that reflect the Manager's determination of assumptions that market participants might reasonably use in valuing the securities. The tables below show the relevant disclosure.
As at Jun. 30, 2017
Financial assets Level 1 Level 2 Level 3 Total
Debt Securities 1,039,592 66,236 — 1,105,828Equity Securities 148 — 363 511Investment Funds 15,542 — — 15,542Derivatives — 42,682 — 42,682Total 1,055,282 108,918 363 1,164,563
Financial liabilities
Derivatives — (1,684) — (1,684)
As at Dec. 31, 2016
Financial assets Level 1 Level 2 Level 3 Total
Debt Securities 1,016,769 34,912 — 1,051,681Equity Securities 176 — 520 696Investment Funds 14,750 — — 14,750Derivatives — 5,145 — 5,145Total 1,031,695 40,057 520 1,072,272
Financial liabilities
Derivatives — (2,197) — (2,197)
Transfers between levels
Transfers are made between the various fair value hierarchy levels due to changes in the availability of quoted market prices or observable inputs due to changing market conditions.
During the period from January 1, 2017 to June 30, 2017, $2,632 of debt securities were transferred from Level 1 to Level 2 due to reduced observability of the inputs used to value these securities and $1,161 of debt securities were transferred from Level 2 to Level 1 due to increased availability of quoted prices in the active market.
During the period from January 1, 2016 to December 31, 2016, $3,153 of debt securities were transferred from Level 1 to Level 2 due to reduced observability of the inputs used to value these securities and $10,184 of debt securities were transferred from Level 2 to Level 1 due to increased availability of quoted prices in the active market.
Changes in Level 3 Fair Value Measurements
The following table presents a reconciliation of all Level 3 financial instruments during the periods ended June 30, 2017 and December 31, 2016, including realized and unrealized gains (losses) included in earnings.
For the periods endedJun 30,
2017Dec 31,
2016
Financial Assets
Equity SecuritiesOpening Balance 520 650Purchase issuance — —Sales/settlements — —Realized and unrealized gains/
(losses) included in earnings (157) (130)Transfers in — —Transfers out — —Closing Balance 363 520
The Manager has assessed the effect of changing the inputs to possible alternatives and determined that they would not have a significant impact on Net Assets of the ETF.
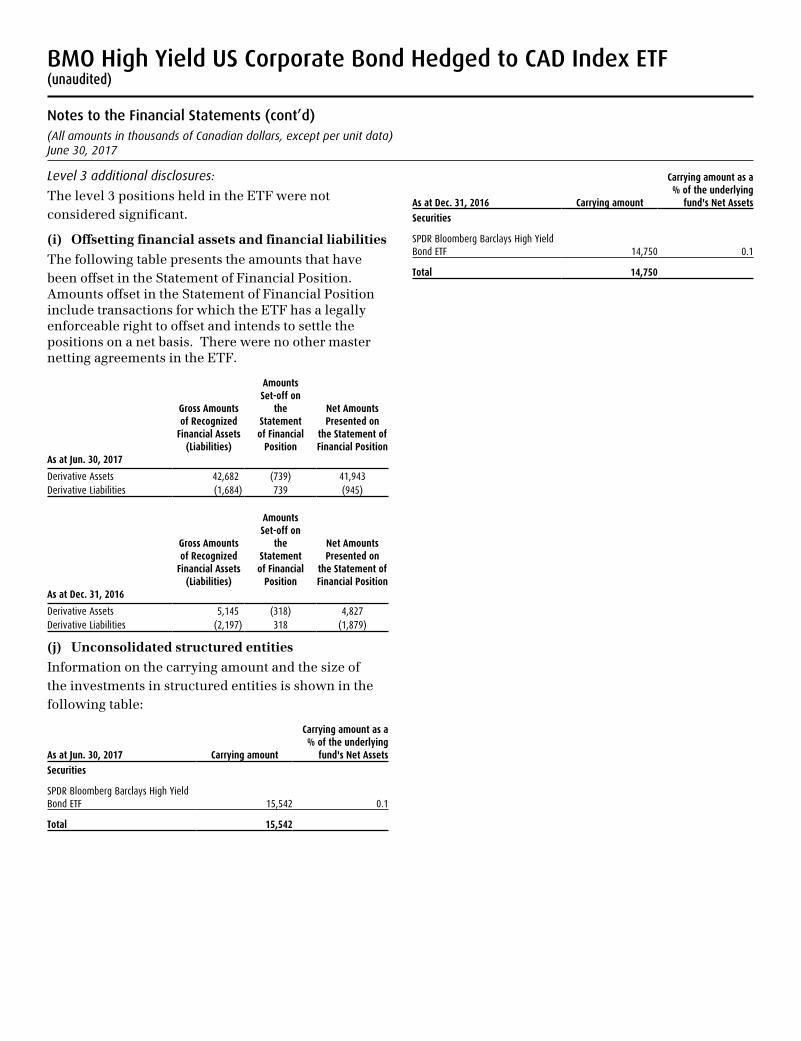
BMO High Yield US Corporate Bond Hedged to CAD Index ETF(unaudited)
Notes to the Financial Statements (cont’d)(All amounts in thousands of Canadian dollars, except per unit data)June 30, 2017
Level 3 additional disclosures:
The level 3 positions held in the ETF were not considered significant.
(i) Offsetting financial assets and financial liabilities
The following table presents the amounts that have been offset in the Statement of Financial Position. Amounts offset in the Statement of Financial Position include transactions for which the ETF has a legally enforceable right to offset and intends to settle the positions on a net basis. There were no other master netting agreements in the ETF.
As at Jun. 30, 2017
Gross Amounts of Recognized
Financial Assets (Liabilities)
Amounts Set-off on
the Statement of Financial
Position
Net Amounts Presented on
the Statement of Financial Position
Derivative Assets 42,682 (739) 41,943Derivative Liabilities (1,684) 739 (945)
As at Dec. 31, 2016
Gross Amounts of Recognized
Financial Assets (Liabilities)
Amounts Set-off on
the Statement of Financial
Position
Net Amounts Presented on
the Statement of Financial Position
Derivative Assets 5,145 (318) 4,827Derivative Liabilities (2,197) 318 (1,879)
(j) Unconsolidated structured entities
Information on the carrying amount and the size of the investments in structured entities is shown in the following table:
As at Jun. 30, 2017 Carrying amount
Carrying amount as a % of the underlying
fund's Net Assets
Securities
SPDR Bloomberg Barclays High Yield Bond ETF 15,542 0.1
Total 15,542
As at Dec. 31, 2016 Carrying amount
Carrying amount as a % of the underlying
fund's Net Assets
Securities
SPDR Bloomberg Barclays High Yield Bond ETF 14,750 0.1
Total 14,750

® “BMO (M-bar roundel symbol)” is a registered trade-mark of Bank of Montreal.
BMO ETFs are managed and administered by BMO Asset Management Inc., an investment fund manager and portfolio manager and separate legal entity from Bank of Montreal.
BMO Asset Management Inc.First Canadian Place, 43rd Floor100 King Street WestToronto, Ontario M5X 1A1
www.bmo.com/etflegalFor more information please call 1-800-361-1392
Independent AuditorPricewaterhouseCoopers LLPPwC Tower 18 York Street, Suite 2600Toronto, Ontario M5J 0B2


![[XLS]karnatakaaryavysyamahasabha.comkarnatakaaryavysyamahasabha.com/images/Prathiba... · Web view1 91.04. 2 8971925359 96.8 2. 3 96.8 0.91039999999999999 1. 4 9741190748 96.48 1.](https://static.fdocuments.us/doc/165x107/5b067b8a7f8b9a79538c81b2/xlskarnata-view1-9104-2-8971925359-968-2-3-968-091039999999999999-1-4-9741190748.jpg)