Semi Annual Report and Unaudited Financial Statements for ...
54
Semi Annual Report and Unaudited Financial Statements for the period 1 January 2019 - 30 June 2019 MCI(P) 091/01/2019
Transcript of Semi Annual Report and Unaudited Financial Statements for ...
Semi Annual Report and Unaudited Financial Statements for the period 1 January 2019 - 30 June 2019
MCI
(P) 0
91/0
1/20
19
GENERAL DISCLAIMERS:The fact sheets on Max Funds are compiled by The Great Eastern Life Assurance Company Limited (GEL). The information presented is for informational use only. A product summary and a Product Highlights Sheet in relation to the funds may be obtained through GEL or its appointed distributors. Potential investors should read the product summary and the Product Highlights Sheet before deciding whether to invest in the funds. Returns on the units of the funds are not guaranteed. The value of the units in the funds and the income accruing to the units, if any, may fall or rise. The fees and charges payable through deduction of premium or cancellation of units are excluded in the calculation of fund returns. Past returns, and any other economic or market predictions, projections or forecasts, are not necessarily indicative of future or likely performance.
Contents
Message 1
Investment Outlook 2
Fund Fact Sheet
Max Asian Credit Opportunities 4
Max Multi-Asset Advantage Fund 11
Max Asian Equity Yield Fund 16
Max Pacific Equity Fund 22
Max Global Emerging Markets Fund 27
Max Global Allocation Fund 32
Max Singapore Balanced Fund 38
Max Singapore Trust Fund 43
Capital Account 47
Statement of Assets and Liabilities 49
Notes to the Accounts 50
1
MESSAGE
Mess
age
2019 began with a strong recovery in global equities from the malaise of 4Q2018 due to more dovish stance from the US Federal Reserve and other central banks globally amid signs of progress in US-China trade negotiation. However, a sudden escalation in US-China trade tension in May led to heightened volatility in risk assets. A breakdown in the US-China trade negotiations heightens risks of global supply chain disruptions and economy slowdown. Brexit uncertainty and geopolitical risk in the Middle East, which could lead to higher oil prices, are additional risk factors that investors have to contend with. Despite the challenging environment, equities and bonds ended the half year positively, underpinned primarily by supportive monetary policies and domestic stimulus measures.
To support the journey in meeting your financial goals, we remain committed to work with the fund managers to uncover opportunities and be vigilant with the investments.
We thank you for your continued trust and support.
Yours sincerely
Khor Hock SengGroup Chief Executive OfficerGreat Eastern Holdings
Please refer to page 3 for disclaimer.
2
Investment OutlookThe trade war truce announcement at the G20 meeting provided a reprieve and markets were also buoyed by a more dovish Fed. However, existing tariffs and continued uncertainty are here to stay until a resolution materializes between China and the US.
USThe US economy is expected to grow at a moderate pace in second half of 2019. The record low unemployment rate, coupled with steady job gains should support consumer spending. Manufacturing could recover as inventories are drawn down. Business fixed investments, weighed down by trade uncertainties, may remain weak. The market has priced in at least 2 rate cuts this year as the Federal Reserve (Fed) pivots towards easing. With inflation still below the target of 2%, the Fed will likely cut interest rates to insure against an economic downturn. Nevertheless, as much of the potential interest rate cuts have been priced in by the markets, and valuations are rich, a further downgrade in US earnings could see profit taking in the US equity markets.
EuropeIn the Eurozone, economic growth will be supported by favourable financing conditions, further employment gains and rising wages. As the largest economy in the bloc, the ongoing weakness in international trade will affect Germany the most as it struggles from a manufacturing downturn, driven largely by global trade tensions. The European Central Bank is likely to change its forward guidance to signal an easing bias, and lower its deposit rate by 10-20 bps in September.
JapanWith the unpredictable US-China trade negotiations having taken a more conciliatory turn at the G20 meeting, the worst case scenario has been averted. Nevertheless, the uncertainty will continue until some kind of deal materializes. As global economic indicators continue to deteriorate, particularly in China and US, the urgency for an earlier resolution increases. Central banks worldwide are already reacting to the economic weakness, with the US Fed prominent in a complete turnaround to a dovish stance, pushing Japanese bond yields heavily into negative territory. While current conditions are unfavourable for Japanese corporates and the stock market, the situation can quickly reverse to a bullish one if the US-China trade conflict is resolved.
INVESTMENT OUTLOOK Inv
estm
ent O
utloo
k
3
Asia Pacific ex-JapanFor Asia, the trade war truce announced at the G20 meeting in June was mostly in line with market expectations. This had discounted a scenario of no additional tariffs while negotiations are extended. What has been encouraging is that exports to China telecommunications giant, Huawei, have been allowed temporarily. This helps to defer a significant slow-down in the tech component supply chain. However, the lack of progress in the trade negotiation and the prevailing sense of uncertainty will slow global economic growth, negatively impacting corporate earnings growth in Asia. A positive support to market sentiment comes from central bank policy. Central banks have already indicated softening of monetary policy because of the potential implications of a trade war.
ConclusionAn improvement in global economic growth hinges on the resolution to the US-China trade spats. Against an investment background that is besieged with several uncertainties, investors should continue to adopt a cautious stance. Navigating such challenging markets will require careful active selection, prudent risk management and risk balancing.
Inves
tmen
t Outl
ook
INVESTMENT OUTLOOK
All data from Bloomberg as at 11 July 2019 unless otherwise stated.
Disclaimer: The report is accurate at time of writing on 11 July 2019. Past performance is not necessarily indicative of future performances. Any opinion or view presented is subject to change without notice. The document is intended for information purposes only, and is not intended as an offer or solicitation for the purchase or sale of any financial instrument. The information provided may contain projections or other forward looking statements regarding future events or future financial performance of countries, markets or companies, and such prediction or forecast is not necessarily indicative of the future or likely performance of the fund.
4
Max A
sian C
redit
Opp
ortun
ities
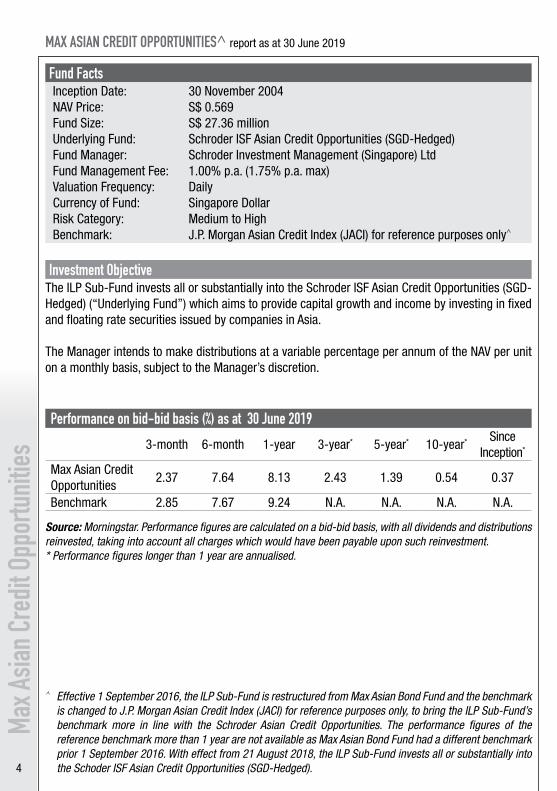
^ Effective 1 September 2016, the ILP Sub-Fund is restructured from Max Asian Bond Fund and the benchmark is changed to J.P. Morgan Asian Credit Index (JACI) for reference purposes only, to bring the ILP Sub-Fund’s benchmark more in line with the Schroder Asian Credit Opportunities. The performance figures of the reference benchmark more than 1 year are not available as Max Asian Bond Fund had a different benchmark prior 1 September 2016. With effect from 21 August 2018, the ILP Sub-Fund invests all or substantially into the Schoder ISF Asian Credit Opportunities (SGD-Hedged).
Fund FactsInception Date: 30 November 2004NAV Price: S$ 0.569Fund Size: S$ 27.36 millionUnderlying Fund: Schroder ISF Asian Credit Opportunities (SGD-Hedged)Fund Manager: Schroder Investment Management (Singapore) LtdFund Management Fee: 1.00% p.a. (1.75% p.a. max) Valuation Frequency: DailyCurrency of Fund: Singapore DollarRisk Category: Medium to HighBenchmark: J.P. Morgan Asian Credit Index (JACI) for reference purposes only^
Investment ObjectiveThe ILP Sub-Fund invests all or substantially into the Schroder ISF Asian Credit Opportunities (SGD-Hedged) (“Underlying Fund”) which aims to provide capital growth and income by investing in fixed and floating rate securities issued by companies in Asia.
The Manager intends to make distributions at a variable percentage per annum of the NAV per unit on a monthly basis, subject to the Manager’s discretion.
Performance on bid-bid basis (%) as at 30 June 2019
3-month 6-month 1-year 3-year* 5-year* 10-year* Since Inception*
Max Asian Credit Opportunities
2.37 7.64 8.13 2.43 1.39 0.54 0.37
Benchmark 2.85 7.67 9.24 N.A. N.A. N.A. N.A.
Source: Morningstar. Performance figures are calculated on a bid-bid basis, with all dividends and distributions reinvested, taking into account all charges which would have been payable upon such reinvestment.* Performance figures longer than 1 year are annualised.
MAX ASIAN CREDIT OPPORTUNITIES^ report as at 30 June 2019
5
Max A
sian C
redit
Opp
ortun
ities
MAX ASIAN CREDIT OPPORTUNITIES report as at 30 June 2019
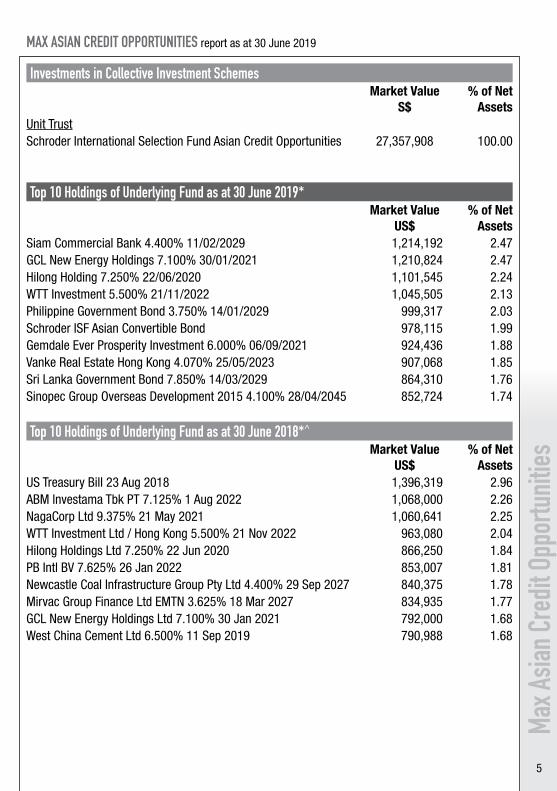
Investments in Collective Investment SchemesMarket Value
S$% of Net
AssetsUnit TrustSchroder International Selection Fund Asian Credit Opportunities 27,357,908 100.00
Top 10 Holdings of Underlying Fund as at 30 June 2019*Market Value
US$% of Net
AssetsSiam Commercial Bank 4.400% 11/02/2029 1,214,192 2.47GCL New Energy Holdings 7.100% 30/01/2021 1,210,824 2.47Hilong Holding 7.250% 22/06/2020 1,101,545 2.24WTT Investment 5.500% 21/11/2022 1,045,505 2.13Philippine Government Bond 3.750% 14/01/2029 999,317 2.03Schroder ISF Asian Convertible Bond 978,115 1.99Gemdale Ever Prosperity Investment 6.000% 06/09/2021 924,436 1.88Vanke Real Estate Hong Kong 4.070% 25/05/2023 907,068 1.85Sri Lanka Government Bond 7.850% 14/03/2029 864,310 1.76Sinopec Group Overseas Development 2015 4.100% 28/04/2045 852,724 1.74
Top 10 Holdings of Underlying Fund as at 30 June 2018*^
Market ValueUS$
% of NetAssets
US Treasury Bill 23 Aug 2018 1,396,319 2.96ABM lnvestama Tbk PT 7.125% 1 Aug 2022 1,068,000 2.26NagaCorp Ltd 9.375% 21 May 2021 1,060,641 2.25WTT Investment Ltd / Hong Kong 5.500% 21 Nov 2022 963,080 2.04Hilong Holdings Ltd 7.250% 22 Jun 2020 866,250 1.84PB Intl BV 7.625% 26 Jan 2022 853,007 1.81Newcastle Coal Infrastructure Group Pty Ltd 4.400% 29 Sep 2027 840,375 1.78Mirvac Group Finance Ltd EMTN 3.625% 18 Mar 2027 834,935 1.77GCL New Energy Holdings Ltd 7.100% 30 Jan 2021 792,000 1.68West China Cement Ltd 6.500% 11 Sep 2019 790,988 1.68
6
Max A
sian C
redit
Opp
ortun
ities
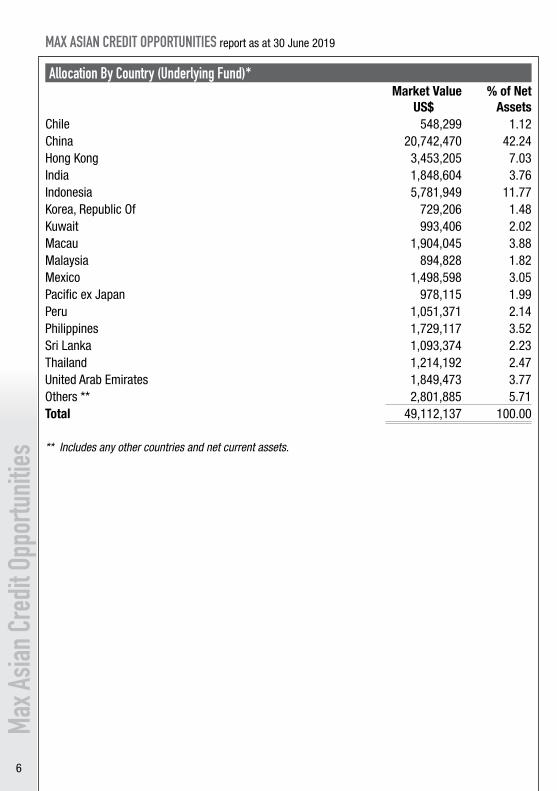
Allocation By Country (Underlying Fund)*Market Value
US$% of Net
AssetsChile 548,299 1.12China 20,742,470 42.24Hong Kong 3,453,205 7.03India 1,848,604 3.76Indonesia 5,781,949 11.77Korea, Republic Of 729,206 1.48Kuwait 993,406 2.02Macau 1,904,045 3.88Malaysia 894,828 1.82Mexico 1,498,598 3.05Pacific ex Japan 978,115 1.99Peru 1,051,371 2.14Philippines 1,729,117 3.52Sri Lanka 1,093,374 2.23Thailand 1,214,192 2.47United Arab Emirates 1,849,473 3.77Others ** 2,801,885 5.71Total 49,112,137 100.00
** Includes any other countries and net current assets.
MAX ASIAN CREDIT OPPORTUNITIES report as at 30 June 2019
7
Max A
sian C
redit
Opp
ortun
ities
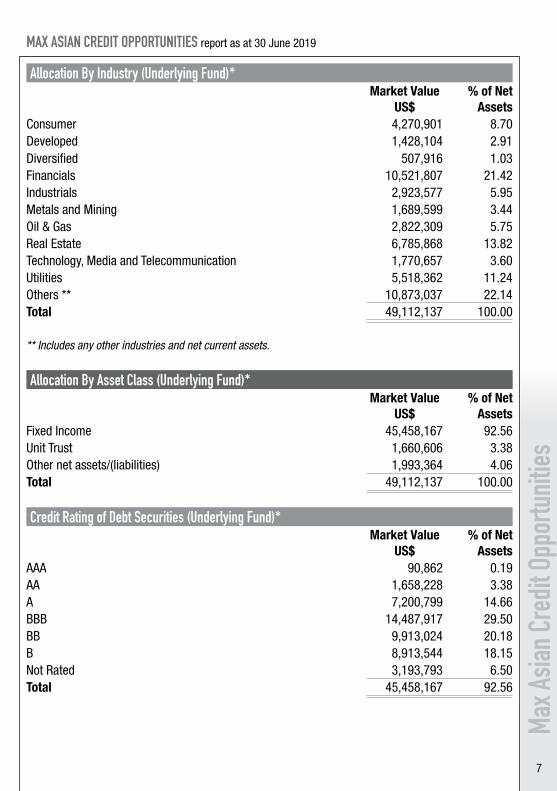
Allocation By Industry (Underlying Fund)*Market Value
US$% of Net
AssetsConsumer 4,270,901 8.70Developed 1,428,104 2.91Diversified 507,916 1.03Financials 10,521,807 21.42Industrials 2,923,577 5.95Metals and Mining 1,689,599 3.44Oil & Gas 2,822,309 5.75Real Estate 6,785,868 13.82Technology, Media and Telecommunication 1,770,657 3.60Utilities 5,518,362 11.24Others ** 10,873,037 22.14Total 49,112,137 100.00
** Includes any other industries and net current assets.
Allocation By Asset Class (Underlying Fund)*Market Value
US$% of Net
AssetsFixed Income 45,458,167 92.56 Unit Trust 1,660,606 3.38 Other net assets/(liabilities) 1,993,364 4.06 Total 49,112,137 100.00
Credit Rating of Debt Securities (Underlying Fund)*Market Value
US$% of Net
AssetsAAA 90,862 0.19AA 1,658,228 3.38A 7,200,799 14.66BBB 14,487,917 29.50BB 9,913,024 20.18B 8,913,544 18.15Not Rated 3,193,793 6.50Total 45,458,167 92.56
MAX ASIAN CREDIT OPPORTUNITIES report as at 30 June 2019
8
Max A
sian C
redit
Opp
ortun
ities
MAX ASIAN CREDIT OPPORTUNITIES report as at 30 June 2019
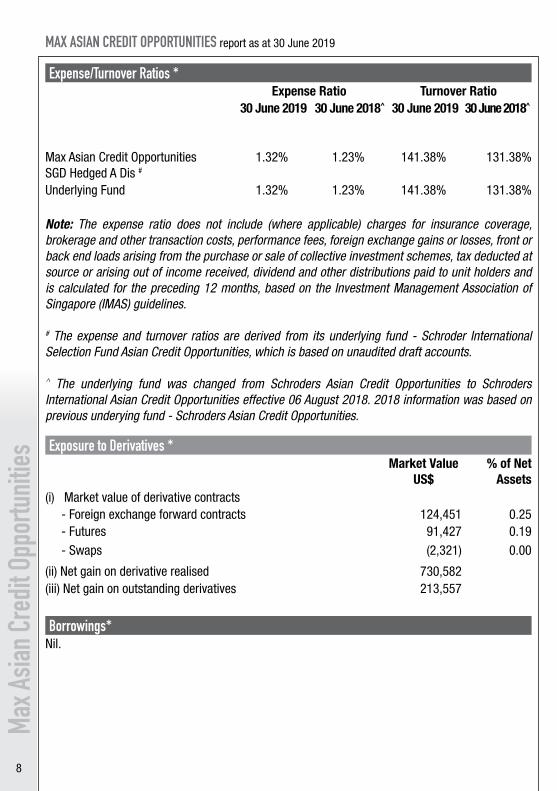
Expense/Turnover Ratios *Expense Ratio Turnover Ratio
30 June 2019 30 June 2018^ 30 June 2019 30 June 2018^
Max Asian Credit Opportunities SGD Hedged A Dis #
1.32% 1.23% 141.38% 131.38%
Underlying Fund 1.32% 1.23% 141.38% 131.38%
Note: The expense ratio does not include (where applicable) charges for insurance coverage, brokerage and other transaction costs, performance fees, foreign exchange gains or losses, front or back end loads arising from the purchase or sale of collective investment schemes, tax deducted at source or arising out of income received, dividend and other distributions paid to unit holders and is calculated for the preceding 12 months, based on the Investment Management Association of Singapore (IMAS) guidelines.
# The expense and turnover ratios are derived from its underlying fund - Schroder International Selection Fund Asian Credit Opportunities, which is based on unaudited draft accounts.
^ The underlying fund was changed from Schroders Asian Credit Opportunities to Schroders International Asian Credit Opportunities effective 06 August 2018. 2018 information was based on previous underying fund - Schroders Asian Credit Opportunities.
Exposure to Derivatives *Market Value
US$% of Net
Assets(i) Market value of derivative contracts - Foreign exchange forward contracts 124,451 0.25 - Futures 91,427 0.19 - Swaps (2,321) 0.00
(ii) Net gain on derivative realised 730,582 (iii) Net gain on outstanding derivatives 213,557
Borrowings*Nil.
9
Max A
sian C
redit
Opp
ortun
ities
MAX ASIAN CREDIT OPPORTUNITIES report as at 30 June 2019
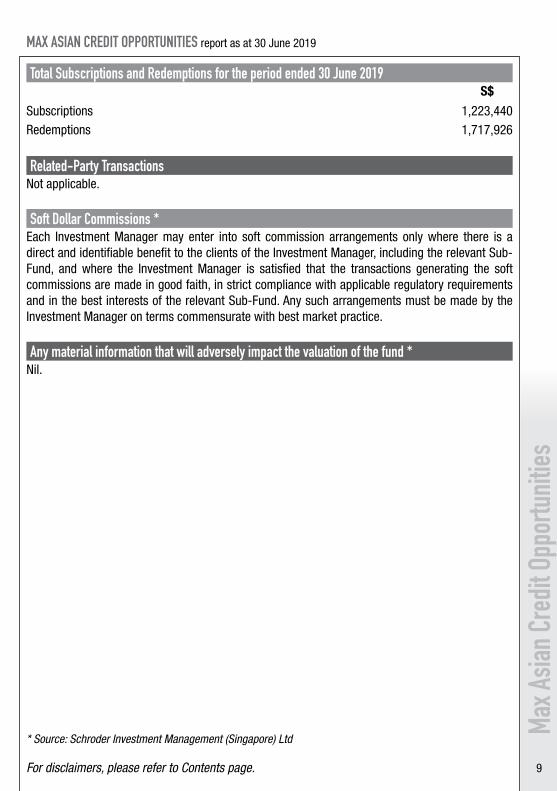
Total Subscriptions and Redemptions for the period ended 30 June 2019S$
Subscriptions 1,223,440 Redemptions 1,717,926
Related-Party TransactionsNot applicable.
Soft Dollar Commissions *Each Investment Manager may enter into soft commission arrangements only where there is a direct and identifiable benefit to the clients of the Investment Manager, including the relevant Sub-Fund, and where the Investment Manager is satisfied that the transactions generating the soft commissions are made in good faith, in strict compliance with applicable regulatory requirements and in the best interests of the relevant Sub-Fund. Any such arrangements must be made by the Investment Manager on terms commensurate with best market practice.
Any material information that will adversely impact the valuation of the fund *Nil.
For disclaimers, please refer to Contents page.
* Source: Schroder Investment Management (Singapore) Ltd
MAX ASIAN CREDIT OPPORTUNITIES report as at 30 June 2018
Max A
sian C
redit
Opp
ortun
ities
(This page is intentionally left blank)
11
Max M
ulti-A
sset
Adva
ntage
Fund
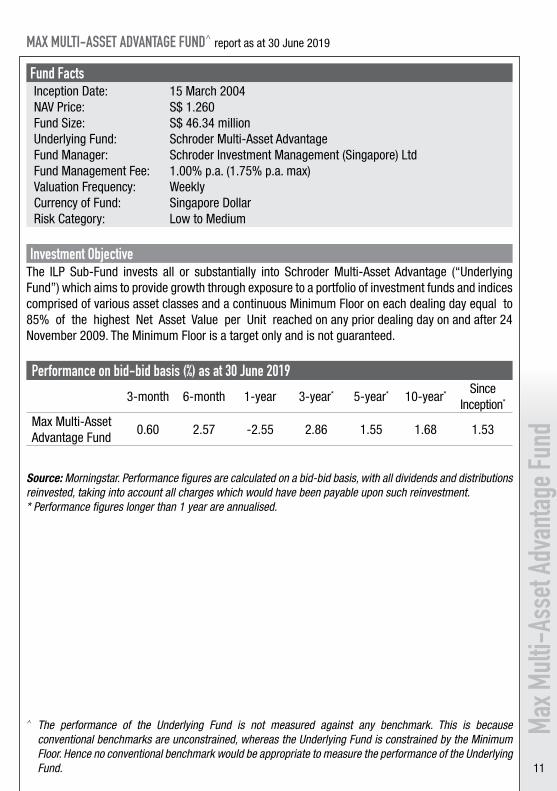
MAX MULTI-ASSET ADVANTAGE FUND^ report as at 30 June 2019
Fund FactsInception Date: 15 March 2004NAV Price: S$ 1.260Fund Size: S$ 46.34 millionUnderlying Fund: Schroder Multi-Asset AdvantageFund Manager: Schroder Investment Management (Singapore) LtdFund Management Fee: 1.00% p.a. (1.75% p.a. max)Valuation Frequency: WeeklyCurrency of Fund: Singapore DollarRisk Category: Low to Medium
Investment ObjectiveThe ILP Sub-Fund invests all or substantially into Schroder Multi-Asset Advantage (“Underlying Fund”) which aims to provide growth through exposure to a portfolio of investment funds and indices comprised of various asset classes and a continuous Minimum Floor on each dealing day equal to 85% of the highest Net Asset Value per Unit reached on any prior dealing day on and after 24 November 2009. The Minimum Floor is a target only and is not guaranteed.
Performance on bid-bid basis (%) as at 30 June 2019
3-month 6-month 1-year 3-year* 5-year* 10-year* Since Inception*
Max Multi-Asset Advantage Fund
0.60 2.57 -2.55 2.86 1.55 1.68 1.53
Source: Morningstar. Performance figures are calculated on a bid-bid basis, with all dividends and distributions reinvested, taking into account all charges which would have been payable upon such reinvestment.* Performance figures longer than 1 year are annualised.
^ The performance of the Underlying Fund is not measured against any benchmark. This is because conventional benchmarks are unconstrained, whereas the Underlying Fund is constrained by the Minimum Floor. Hence no conventional benchmark would be appropriate to measure the performance of the Underlying Fund.
12
Max M
ulti-A
sset
Adva
ntage
Fund
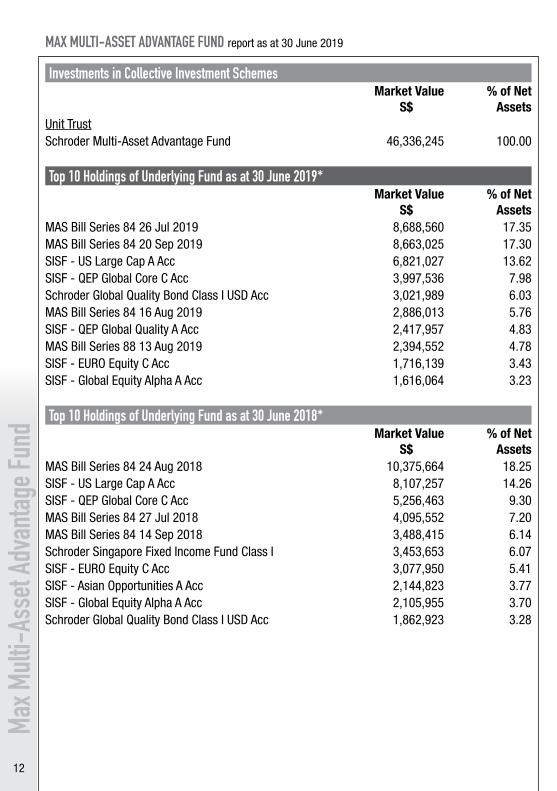
Investments in Collective Investment SchemesMarket Value
S$% of Net
AssetsUnit TrustSchroder Multi-Asset Advantage Fund 46,336,245 100.00
Top 10 Holdings of Underlying Fund as at 30 June 2019*Market Value
S$% of Net
AssetsMAS Bill Series 84 26 Jul 2019 8,688,560 17.35MAS Bill Series 84 20 Sep 2019 8,663,025 17.30SISF - US Large Cap A Acc 6,821,027 13.62SISF - QEP Global Core C Acc 3,997,536 7.98Schroder Global Quality Bond Class I USD Acc 3,021,989 6.03MAS Bill Series 84 16 Aug 2019 2,886,013 5.76SISF - QEP Global Quality A Acc 2,417,957 4.83MAS Bill Series 88 13 Aug 2019 2,394,552 4.78SISF - EURO Equity C Acc 1,716,139 3.43SISF - Global Equity Alpha A Acc 1,616,064 3.23
Top 10 Holdings of Underlying Fund as at 30 June 2018*Market Value
S$% of Net
AssetsMAS Bill Series 84 24 Aug 2018 10,375,664 18.25SISF - US Large Cap A Acc 8,107,257 14.26SISF - QEP Global Core C Acc 5,256,463 9.30MAS Bill Series 84 27 Jul 2018 4,095,552 7.20MAS Bill Series 84 14 Sep 2018 3,488,415 6.14Schroder Singapore Fixed Income Fund Class I 3,453,653 6.07SISF - EURO Equity C Acc 3,077,950 5.41SISF - Asian Opportunities A Acc 2,144,823 3.77SISF - Global Equity Alpha A Acc 2,105,955 3.70Schroder Global Quality Bond Class I USD Acc 1,862,923 3.28
MAX MULTI-ASSET ADVANTAGE FUND report as at 30 June 2019
13
Max M
ulti-A
sset
Adva
ntage
Fund
MAX MULTI-ASSET ADVANTAGE FUND report as at 30 June 2019
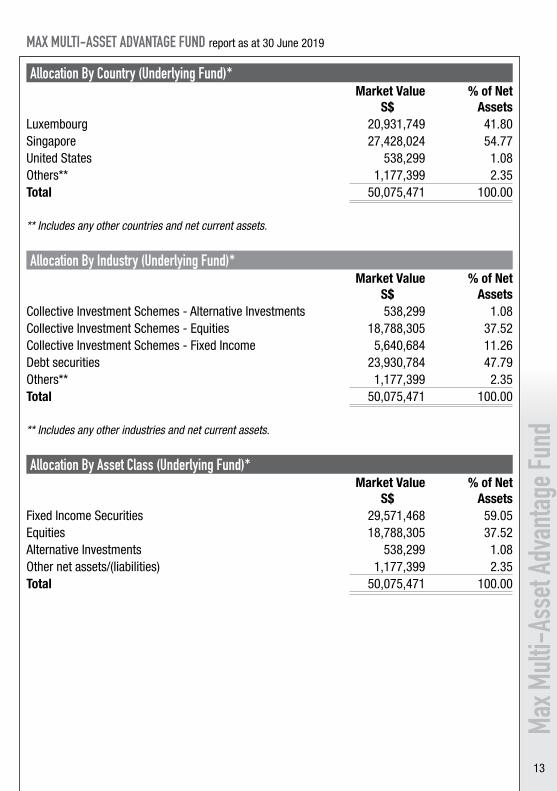
Allocation By Country (Underlying Fund)*Market Value
S$% of Net
AssetsLuxembourg 20,931,749 41.80Singapore 27,428,024 54.77United States 538,299 1.08Others** 1,177,399 2.35Total 50,075,471 100.00
** Includes any other countries and net current assets.
Allocation By Industry (Underlying Fund)*Market Value
S$% of Net
AssetsCollective Investment Schemes - Alternative Investments 538,299 1.08Collective Investment Schemes - Equities 18,788,305 37.52Collective Investment Schemes - Fixed Income 5,640,684 11.26Debt securities 23,930,784 47.79Others** 1,177,399 2.35Total 50,075,471 100.00
** Includes any other industries and net current assets.
Allocation By Asset Class (Underlying Fund)*Market Value
S$% of Net
AssetsFixed Income Securities 29,571,468 59.05Equities 18,788,305 37.52Alternative Investments 538,299 1.08Other net assets/(liabilities) 1,177,399 2.35Total 50,075,471 100.00
14
Max M
ulti-A
sset
Adva
ntage
Fund
MAX MULTI-ASSET ADVANTAGE FUND report as at 30 June 2019
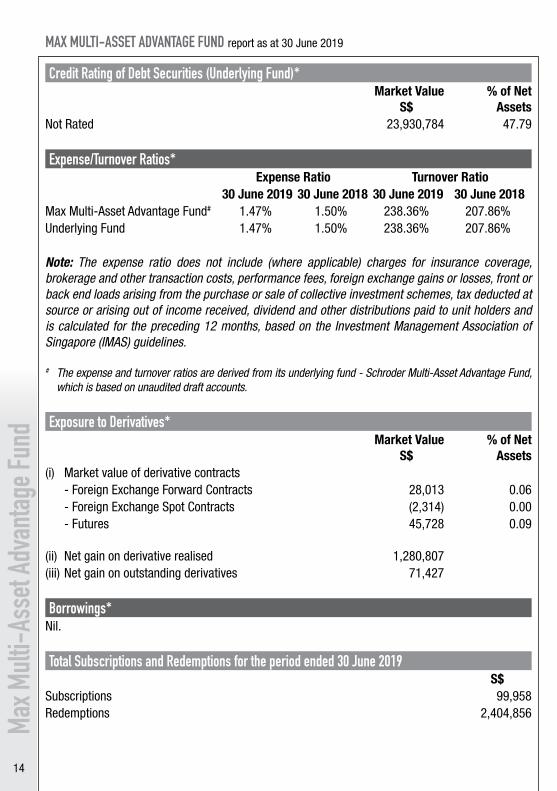
Credit Rating of Debt Securities (Underlying Fund)*Market Value
S$% of Net
AssetsNot Rated 23,930,784 47.79
Expense/Turnover Ratios*Expense Ratio Turnover Ratio
30 June 2019 30 June 2018 30 June 2019 30 June 2018Max Multi-Asset Advantage Fund# 1.47% 1.50% 238.36% 207.86%Underlying Fund 1.47% 1.50% 238.36% 207.86%
Note: The expense ratio does not include (where applicable) charges for insurance coverage, brokerage and other transaction costs, performance fees, foreign exchange gains or losses, front or back end loads arising from the purchase or sale of collective investment schemes, tax deducted at source or arising out of income received, dividend and other distributions paid to unit holders and is calculated for the preceding 12 months, based on the Investment Management Association of Singapore (IMAS) guidelines.
# The expense and turnover ratios are derived from its underlying fund - Schroder Multi-Asset Advantage Fund, which is based on unaudited draft accounts.
Exposure to Derivatives*Market Value
S$% of Net
Assets(i) Market value of derivative contracts
- Foreign Exchange Forward Contracts 28,013 0.06 - Foreign Exchange Spot Contracts (2,314) 0.00 - Futures 45,728 0.09
(ii) Net gain on derivative realised 1,280,807 (iii) Net gain on outstanding derivatives 71,427
Borrowings*Nil.
Total Subscriptions and Redemptions for the period ended 30 June 2019S$
Subscriptions 99,958 Redemptions 2,404,856
15
Max M
ulti-A
sset
Adva
ntage
Fund
MAX MULTI-ASSET ADVANTAGE FUND report as at 30 June 2019
Related-Party TransactionsNot applicable.
Soft Dollar Commissions*In the management of the Fund, the Manager may accept soft dollar commissions from, or enter into soft dollar arrangements with, stockbrokers who execute trades on behalf of the Fund and the soft dollars received are restricted to the following kinds of services:
(i) research, analysis or price information;(ii) performance measurement;(iii) portfolio valuations; and(iv) administration services.
The Manager may not receive or enter into soft dollar commissions or arrangements unless (a) such soft dollar commissions or arrangements shall reasonably assist the Manager in their management of the Fund, (b) best execution is carried out for the transactions, and (c) that no unnecessary trades are entered into in order to qualify for such soft dollar commissions or arrangements. The Manager shall not receive goods and services such as travel, accommodation and entertainment.
The description of soft dollar and the conditions set out above also apply to the investment managers of the underlying Schroders funds.
Any material information that will adversely impact the valuation of the fund*Nil.
* Source: Schroder Investment Management (Singapore) Ltd
For disclaimers, please refer to Contents page.
16
Max A
sian E
quity
Yield
Fund
MAX ASIAN EQUITY YIELD FUND^ report as at 30 June 2019
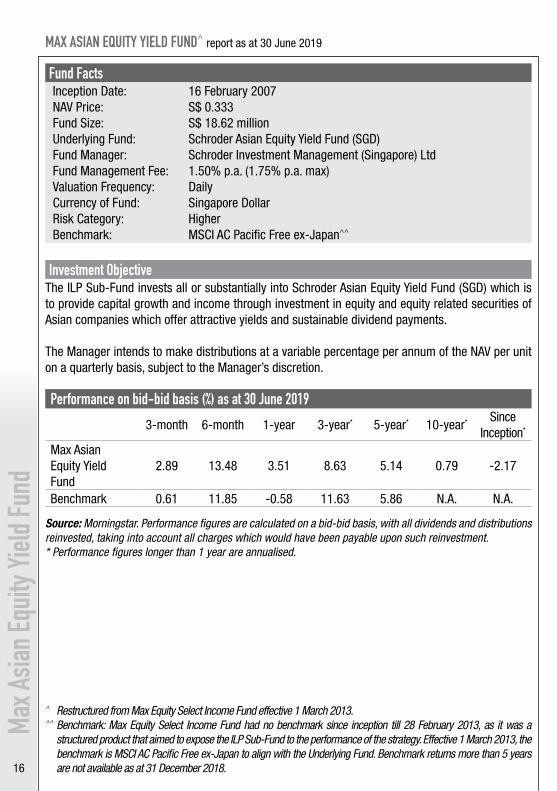
Fund FactsInception Date: 16 February 2007NAV Price: S$ 0.333Fund Size: S$ 18.62 millionUnderlying Fund: Schroder Asian Equity Yield Fund (SGD)Fund Manager: Schroder Investment Management (Singapore) LtdFund Management Fee: 1.50% p.a. (1.75% p.a. max)Valuation Frequency: DailyCurrency of Fund: Singapore DollarRisk Category: HigherBenchmark: MSCI AC Pacific Free ex-Japan^^
Investment ObjectiveThe ILP Sub-Fund invests all or substantially into Schroder Asian Equity Yield Fund (SGD) which is to provide capital growth and income through investment in equity and equity related securities of Asian companies which offer attractive yields and sustainable dividend payments.
The Manager intends to make distributions at a variable percentage per annum of the NAV per unit on a quarterly basis, subject to the Manager’s discretion.
Performance on bid-bid basis (%) as at 30 June 2019
3-month 6-month 1-year 3-year* 5-year* 10-year* Since Inception*
Max Asian Equity Yield Fund
2.89 13.48 3.51 8.63 5.14 0.79 -2.17
Benchmark 0.61 11.85 -0.58 11.63 5.86 N.A. N.A.
Source: Morningstar. Performance figures are calculated on a bid-bid basis, with all dividends and distributions reinvested, taking into account all charges which would have been payable upon such reinvestment.* Performance figures longer than 1 year are annualised.
^ Restructured from Max Equity Select Income Fund effective 1 March 2013.^ ̂ Benchmark: Max Equity Select Income Fund had no benchmark since inception till 28 February 2013, as it was a
structured product that aimed to expose the ILP Sub-Fund to the performance of the strategy. Effective 1 March 2013, the benchmark is MSCI AC Pacific Free ex-Japan to align with the Underlying Fund. Benchmark returns more than 5 years are not available as at 31 December 2018.
17
Max A
sian E
quity
Yield
Fund
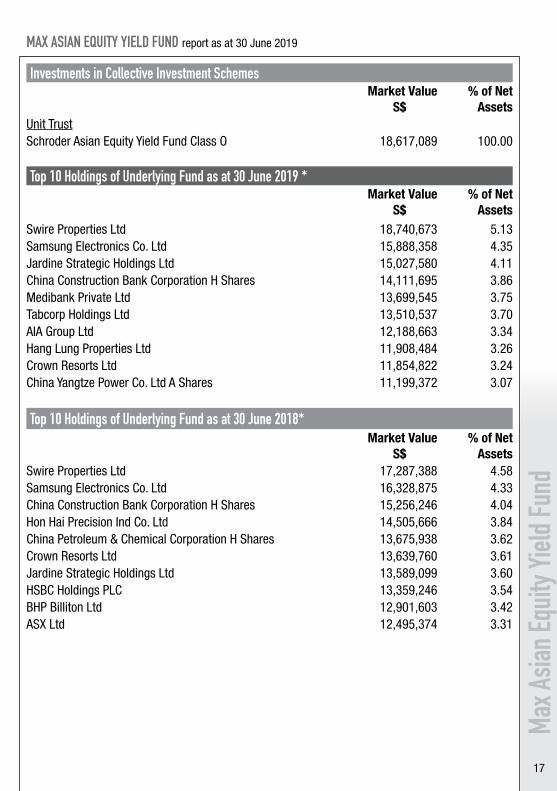
MAX ASIAN EQUITY YIELD FUND report as at 30 June 2019
Investments in Collective Investment SchemesMarket Value
S$% of Net
AssetsUnit TrustSchroder Asian Equity Yield Fund Class O 18,617,089 100.00
Top 10 Holdings of Underlying Fund as at 30 June 2019 *Market Value
S$% of Net
AssetsSwire Properties Ltd 18,740,673 5.13Samsung Electronics Co. Ltd 15,888,358 4.35Jardine Strategic Holdings Ltd 15,027,580 4.11China Construction Bank Corporation H Shares 14,111,695 3.86Medibank Private Ltd 13,699,545 3.75Tabcorp Holdings Ltd 13,510,537 3.70AIA Group Ltd 12,188,663 3.34Hang Lung Properties Ltd 11,908,484 3.26Crown Resorts Ltd 11,854,822 3.24China Yangtze Power Co. Ltd A Shares 11,199,372 3.07
Top 10 Holdings of Underlying Fund as at 30 June 2018*Market Value
S$% of Net
AssetsSwire Properties Ltd 17,287,388 4.58Samsung Electronics Co. Ltd 16,328,875 4.33China Construction Bank Corporation H Shares 15,256,246 4.04Hon Hai Precision Ind Co. Ltd 14,505,666 3.84China Petroleum & Chemical Corporation H Shares 13,675,938 3.62Crown Resorts Ltd 13,639,760 3.61Jardine Strategic Holdings Ltd 13,589,099 3.60HSBC Holdings PLC 13,359,246 3.54BHP Billiton Ltd 12,901,603 3.42ASX Ltd 12,495,374 3.31
18
Max A
sian E
quity
Yield
Fund
MAX ASIAN EQUITY YIELD FUND report as at 30 June 2019
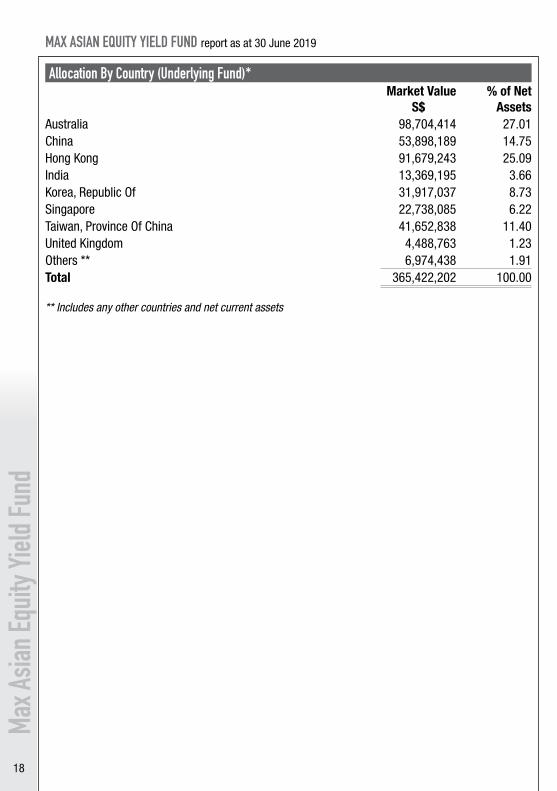
Allocation By Country (Underlying Fund)*Market Value
S$% of Net
AssetsAustralia 98,704,414 27.01China 53,898,189 14.75Hong Kong 91,679,243 25.09India 13,369,195 3.66Korea, Republic Of 31,917,037 8.73Singapore 22,738,085 6.22Taiwan, Province Of China 41,652,838 11.40United Kingdom 4,488,763 1.23Others ** 6,974,438 1.91Total 365,422,202 100.00
** Includes any other countries and net current assets
19
Max A
sian E
quity
Yield
Fund
MAX ASIAN EQUITY YIELD FUND report as at 30 June 2019
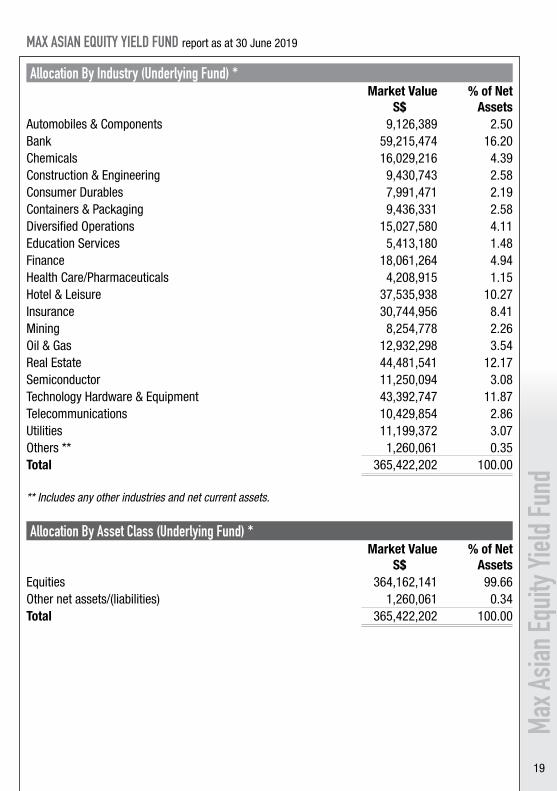
Allocation By Industry (Underlying Fund) *Market Value
S$% of Net
AssetsAutomobiles & Components 9,126,389 2.50Bank 59,215,474 16.20Chemicals 16,029,216 4.39Construction & Engineering 9,430,743 2.58Consumer Durables 7,991,471 2.19Containers & Packaging 9,436,331 2.58Diversified Operations 15,027,580 4.11Education Services 5,413,180 1.48Finance 18,061,264 4.94Health Care/Pharmaceuticals 4,208,915 1.15Hotel & Leisure 37,535,938 10.27Insurance 30,744,956 8.41Mining 8,254,778 2.26Oil & Gas 12,932,298 3.54Real Estate 44,481,541 12.17Semiconductor 11,250,094 3.08Technology Hardware & Equipment 43,392,747 11.87Telecommunications 10,429,854 2.86Utilities 11,199,372 3.07Others ** 1,260,061 0.35Total 365,422,202 100.00
** Includes any other industries and net current assets.
Allocation By Asset Class (Underlying Fund) *Market Value
S$% of Net
AssetsEquities 364,162,141 99.66Other net assets/(liabilities) 1,260,061 0.34 Total 365,422,202 100.00
20
Max A
sian E
quity
Yield
Fund
MAX ASIAN EQUITY YIELD FUND report as at 30 June 2019
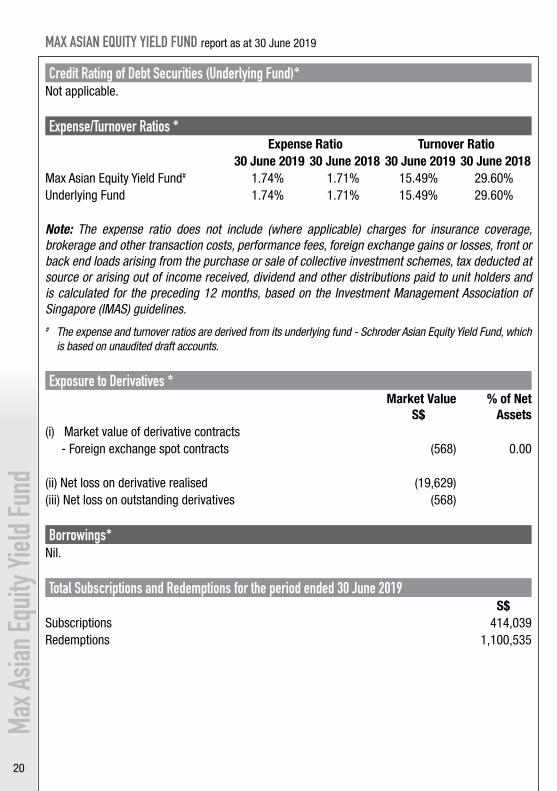
Credit Rating of Debt Securities (Underlying Fund)*Not applicable.
Expense/Turnover Ratios *Expense Ratio Turnover Ratio
30 June 2019 30 June 2018 30 June 2019 30 June 2018Max Asian Equity Yield Fund# 1.74% 1.71% 15.49% 29.60%Underlying Fund 1.74% 1.71% 15.49% 29.60%
Note: The expense ratio does not include (where applicable) charges for insurance coverage, brokerage and other transaction costs, performance fees, foreign exchange gains or losses, front or back end loads arising from the purchase or sale of collective investment schemes, tax deducted at source or arising out of income received, dividend and other distributions paid to unit holders and is calculated for the preceding 12 months, based on the Investment Management Association of Singapore (IMAS) guidelines.# The expense and turnover ratios are derived from its underlying fund - Schroder Asian Equity Yield Fund, which
is based on unaudited draft accounts.
Exposure to Derivatives *Market Value
S$% of Net
Assets(i) Market value of derivative contracts - Foreign exchange spot contracts (568) 0.00
(ii) Net loss on derivative realised (19,629)(iii) Net loss on outstanding derivatives (568)
Borrowings*Nil.
Total Subscriptions and Redemptions for the period ended 30 June 2019S$
Subscriptions 414,039 Redemptions 1,100,535
21
Max A
sian E
quity
Yield
Fund
MAX ASIAN EQUITY YIELD FUND report as at 30 June 2019
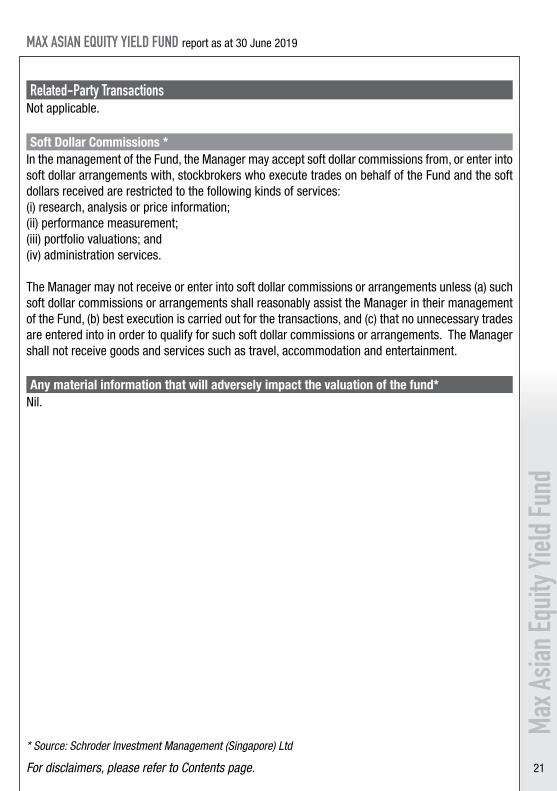
Related-Party TransactionsNot applicable.
Soft Dollar Commissions *In the management of the Fund, the Manager may accept soft dollar commissions from, or enter into soft dollar arrangements with, stockbrokers who execute trades on behalf of the Fund and the soft dollars received are restricted to the following kinds of services: (i) research, analysis or price information;(ii) performance measurement;(iii) portfolio valuations; and(iv) administration services.
The Manager may not receive or enter into soft dollar commissions or arrangements unless (a) such soft dollar commissions or arrangements shall reasonably assist the Manager in their management of the Fund, (b) best execution is carried out for the transactions, and (c) that no unnecessary trades are entered into in order to qualify for such soft dollar commissions or arrangements. The Manager shall not receive goods and services such as travel, accommodation and entertainment.
Any material information that will adversely impact the valuation of the fund*Nil.
* Source: Schroder Investment Management (Singapore) Ltd
For disclaimers, please refer to Contents page.
22
Max P
acific
Equit
y Fun
dMAX PACIFIC EQUITY FUND report as at 30 June 2019
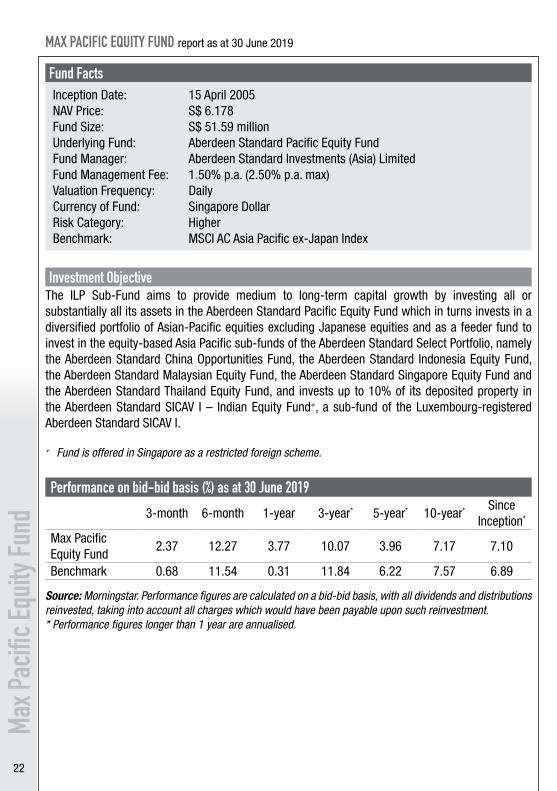
Fund FactsInception Date: 15 April 2005NAV Price: S$ 6.178Fund Size: S$ 51.59 millionUnderlying Fund: Aberdeen Standard Pacific Equity FundFund Manager: Aberdeen Standard Investments (Asia) LimitedFund Management Fee: 1.50% p.a. (2.50% p.a. max)Valuation Frequency: DailyCurrency of Fund: Singapore DollarRisk Category: HigherBenchmark: MSCI AC Asia Pacific ex-Japan Index
Investment ObjectiveThe ILP Sub-Fund aims to provide medium to long-term capital growth by investing all or substantially all its assets in the Aberdeen Standard Pacific Equity Fund which in turns invests in a diversified portfolio of Asian-Pacific equities excluding Japanese equities and as a feeder fund to invest in the equity-based Asia Pacific sub-funds of the Aberdeen Standard Select Portfolio, namely the Aberdeen Standard China Opportunities Fund, the Aberdeen Standard Indonesia Equity Fund, the Aberdeen Standard Malaysian Equity Fund, the Aberdeen Standard Singapore Equity Fund and the Aberdeen Standard Thailand Equity Fund, and invests up to 10% of its deposited property in the Aberdeen Standard SICAV I – Indian Equity Fund+, a sub-fund of the Luxembourg-registered Aberdeen Standard SICAV I.
+ Fund is offered in Singapore as a restricted foreign scheme.
Performance on bid-bid basis (%) as at 30 June 2019
3-month 6-month 1-year 3-year* 5-year* 10-year* SinceInception*
Max Pacific Equity Fund
2.37 12.27 3.77 10.07 3.96 7.17 7.10
Benchmark 0.68 11.54 0.31 11.84 6.22 7.57 6.89
Source: Morningstar. Performance figures are calculated on a bid-bid basis, with all dividends and distributions reinvested, taking into account all charges which would have been payable upon such reinvestment.* Performance figures longer than 1 year are annualised.
23
Max P
acific
Equit
y Fun
d
MAX PACIFIC EQUITY FUND report as at 30 June 2019
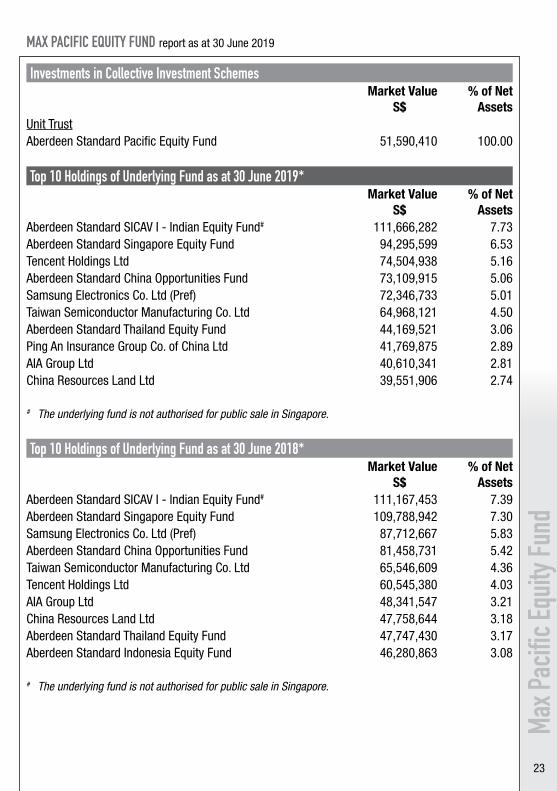
Investments in Collective Investment SchemesMarket Value
S$% of Net
AssetsUnit TrustAberdeen Standard Pacific Equity Fund 51,590,410 100.00
Top 10 Holdings of Underlying Fund as at 30 June 2019*Market Value
S$% of Net
AssetsAberdeen Standard SICAV I - Indian Equity Fund# 111,666,282 7.73Aberdeen Standard Singapore Equity Fund 94,295,599 6.53Tencent Holdings Ltd 74,504,938 5.16Aberdeen Standard China Opportunities Fund 73,109,915 5.06Samsung Electronics Co. Ltd (Pref) 72,346,733 5.01Taiwan Semiconductor Manufacturing Co. Ltd 64,968,121 4.50Aberdeen Standard Thailand Equity Fund 44,169,521 3.06Ping An Insurance Group Co. of China Ltd 41,769,875 2.89AIA Group Ltd 40,610,341 2.81China Resources Land Ltd 39,551,906 2.74
# The underlying fund is not authorised for public sale in Singapore.
Top 10 Holdings of Underlying Fund as at 30 June 2018*Market Value
S$% of Net
AssetsAberdeen Standard SICAV I - Indian Equity Fund# 111,167,453 7.39Aberdeen Standard Singapore Equity Fund 109,788,942 7.30Samsung Electronics Co. Ltd (Pref) 87,712,667 5.83Aberdeen Standard China Opportunities Fund 81,458,731 5.42Taiwan Semiconductor Manufacturing Co. Ltd 65,546,609 4.36Tencent Holdings Ltd 60,545,380 4.03AIA Group Ltd 48,341,547 3.21China Resources Land Ltd 47,758,644 3.18Aberdeen Standard Thailand Equity Fund 47,747,430 3.17Aberdeen Standard Indonesia Equity Fund 46,280,863 3.08
# The underlying fund is not authorised for public sale in Singapore.
24
Max P
acific
Equit
y Fun
dMAX PACIFIC EQUITY FUND report as at 30 June 2019
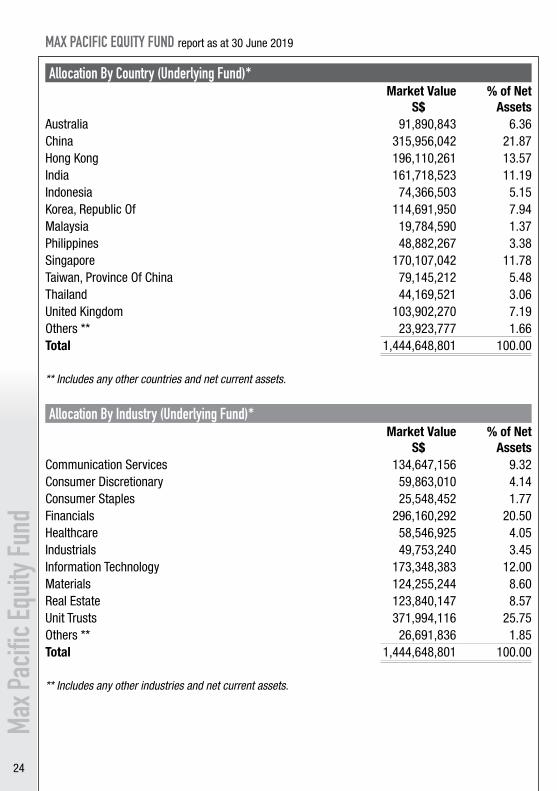
Allocation By Country (Underlying Fund)*Market Value
S$% of Net
AssetsAustralia 91,890,843 6.36 China 315,956,042 21.87 Hong Kong 196,110,261 13.57 India 161,718,523 11.19 Indonesia 74,366,503 5.15 Korea, Republic Of 114,691,950 7.94 Malaysia 19,784,590 1.37 Philippines 48,882,267 3.38 Singapore 170,107,042 11.78 Taiwan, Province Of China 79,145,212 5.48 Thailand 44,169,521 3.06 United Kingdom 103,902,270 7.19 Others ** 23,923,777 1.66 Total 1,444,648,801 100.00
** Includes any other countries and net current assets.
Allocation By Industry (Underlying Fund)*Market Value
S$% of Net
AssetsCommunication Services 134,647,156 9.32 Consumer Discretionary 59,863,010 4.14 Consumer Staples 25,548,452 1.77 Financials 296,160,292 20.50 Healthcare 58,546,925 4.05 Industrials 49,753,240 3.45 Information Technology 173,348,383 12.00 Materials 124,255,244 8.60 Real Estate 123,840,147 8.57 Unit Trusts 371,994,116 25.75 Others ** 26,691,836 1.85 Total 1,444,648,801 100.00
** Includes any other industries and net current assets.
25
MAX PACIFIC EQUITY FUND report as at 30 June 2019
Max P
acific
Equit
y Fun
d
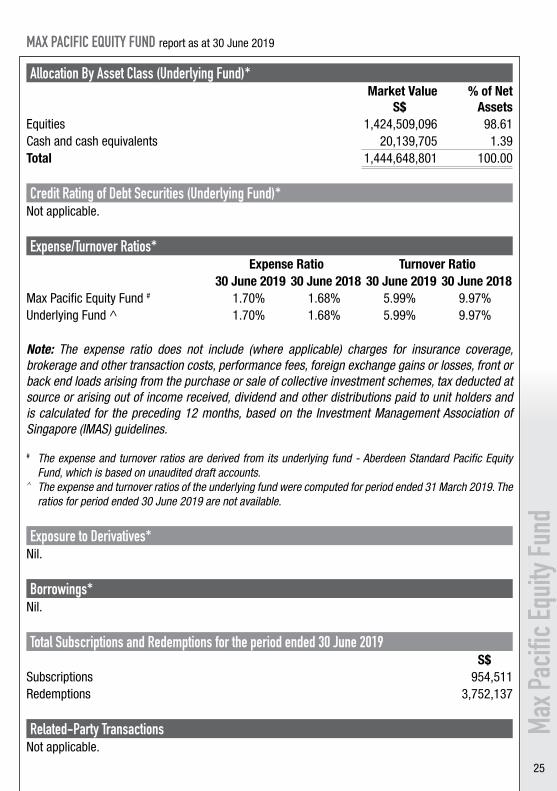
Allocation By Asset Class (Underlying Fund)*Market Value
S$% of Net
AssetsEquities 1,424,509,096 98.61 Cash and cash equivalents 20,139,705 1.39 Total 1,444,648,801 100.00
Credit Rating of Debt Securities (Underlying Fund)*Not applicable.
Expense/Turnover Ratios*Expense Ratio Turnover Ratio
30 June 2019 30 June 2018 30 June 2019 30 June 2018Max Pacific Equity Fund # 1.70% 1.68% 5.99% 9.97%Underlying Fund ^ 1.70% 1.68% 5.99% 9.97%
Note: The expense ratio does not include (where applicable) charges for insurance coverage, brokerage and other transaction costs, performance fees, foreign exchange gains or losses, front or back end loads arising from the purchase or sale of collective investment schemes, tax deducted at source or arising out of income received, dividend and other distributions paid to unit holders and is calculated for the preceding 12 months, based on the Investment Management Association of Singapore (IMAS) guidelines.
# The expense and turnover ratios are derived from its underlying fund - Aberdeen Standard Pacific Equity Fund, which is based on unaudited draft accounts.
^ The expense and turnover ratios of the underlying fund were computed for period ended 31 March 2019. The ratios for period ended 30 June 2019 are not available.
Exposure to Derivatives*Nil.
Borrowings*Nil.
Total Subscriptions and Redemptions for the period ended 30 June 2019S$
Subscriptions 954,511 Redemptions 3,752,137
Related-Party TransactionsNot applicable.
26
MAX PACIFIC EQUITY FUND report as at 30 June 2019
Max P
acific
Equit
y Fun
d
* Source: Aberdeen Standard Investments (Asia) Limited
The information is published based on Aberdeen Standard Select Portfolio Semi Annual Report and Financial Statements 1 October 2018 to 31 March 2019
For disclaimers, please refer to Contents page.
Soft Dollar Commissions*Nil.
Any material information that will adversely impact the valuation of the fund*Nil.
27
Max G
lobal
Emer
ging M
arke
ts Fu
nd
MAX GLOBAL EMERGING MARKETS FUND report as at 30 June 2019
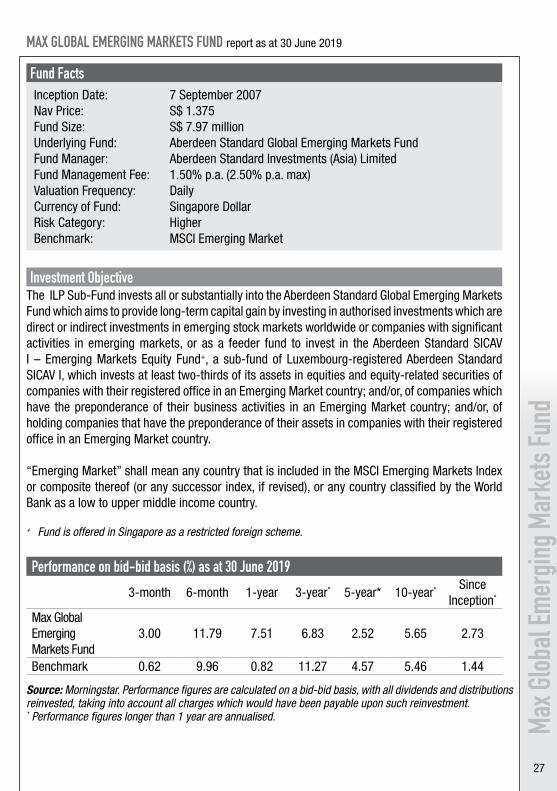
Fund FactsInception Date: 7 September 2007Nav Price: S$ 1.375Fund Size: S$ 7.97 millionUnderlying Fund: Aberdeen Standard Global Emerging Markets FundFund Manager: Aberdeen Standard Investments (Asia) LimitedFund Management Fee: 1.50% p.a. (2.50% p.a. max)Valuation Frequency: DailyCurrency of Fund: Singapore DollarRisk Category: HigherBenchmark: MSCI Emerging Market
Investment ObjectiveThe ILP Sub-Fund invests all or substantially into the Aberdeen Standard Global Emerging Markets Fund which aims to provide long-term capital gain by investing in authorised investments which are direct or indirect investments in emerging stock markets worldwide or companies with significant activities in emerging markets, or as a feeder fund to invest in the Aberdeen Standard SICAV I – Emerging Markets Equity Fund+, a sub-fund of Luxembourg-registered Aberdeen Standard SICAV I, which invests at least two-thirds of its assets in equities and equity-related securities of companies with their registered office in an Emerging Market country; and/or, of companies which have the preponderance of their business activities in an Emerging Market country; and/or, of holding companies that have the preponderance of their assets in companies with their registered office in an Emerging Market country.
“Emerging Market” shall mean any country that is included in the MSCI Emerging Markets Index or composite thereof (or any successor index, if revised), or any country classified by the World Bank as a low to upper middle income country.
+ Fund is offered in Singapore as a restricted foreign scheme.
Performance on bid-bid basis (%) as at 30 June 2019
3-month 6-month 1-year 3-year* 5-year* 10-year* SinceInception*
Max Global Emerging Markets Fund
3.00 11.79 7.51 6.83 2.52 5.65 2.73
Benchmark 0.62 9.96 0.82 11.27 4.57 5.46 1.44
Source: Morningstar. Performance figures are calculated on a bid-bid basis, with all dividends and distributions reinvested, taking into account all charges which would have been payable upon such reinvestment.* Performance figures longer than 1 year are annualised.
28
Max G
lobal
Emer
ging M
arke
ts Fu
ndMAX GLOBAL EMERGING MARKETS FUND report as at 30 June 2019
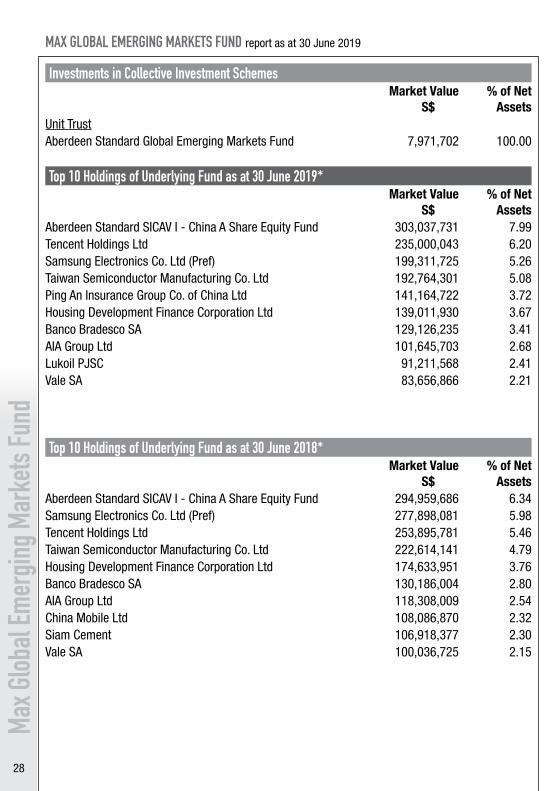
Investments in Collective Investment SchemesMarket Value
S$% of Net
AssetsUnit TrustAberdeen Standard Global Emerging Markets Fund 7,971,702 100.00
Top 10 Holdings of Underlying Fund as at 30 June 2019*Market Value
S$% of Net
AssetsAberdeen Standard SICAV I - China A Share Equity Fund 303,037,731 7.99Tencent Holdings Ltd 235,000,043 6.20Samsung Electronics Co. Ltd (Pref) 199,311,725 5.26Taiwan Semiconductor Manufacturing Co. Ltd 192,764,301 5.08Ping An Insurance Group Co. of China Ltd 141,164,722 3.72Housing Development Finance Corporation Ltd 139,011,930 3.67Banco Bradesco SA 129,126,235 3.41AIA Group Ltd 101,645,703 2.68Lukoil PJSC 91,211,568 2.41Vale SA 83,656,866 2.21
Top 10 Holdings of Underlying Fund as at 30 June 2018*Market Value
S$% of Net
AssetsAberdeen Standard SICAV I - China A Share Equity Fund 294,959,686 6.34Samsung Electronics Co. Ltd (Pref) 277,898,081 5.98Tencent Holdings Ltd 253,895,781 5.46Taiwan Semiconductor Manufacturing Co. Ltd 222,614,141 4.79Housing Development Finance Corporation Ltd 174,633,951 3.76Banco Bradesco SA 130,186,004 2.80AIA Group Ltd 118,308,009 2.54China Mobile Ltd 108,086,870 2.32Siam Cement 106,918,377 2.30Vale SA 100,036,725 2.15
29
MAX GLOBAL EMERGING MARKETS FUND report as at 30 June 2019
Max G
lobal
Emer
ging M
arke
ts Fu
nd
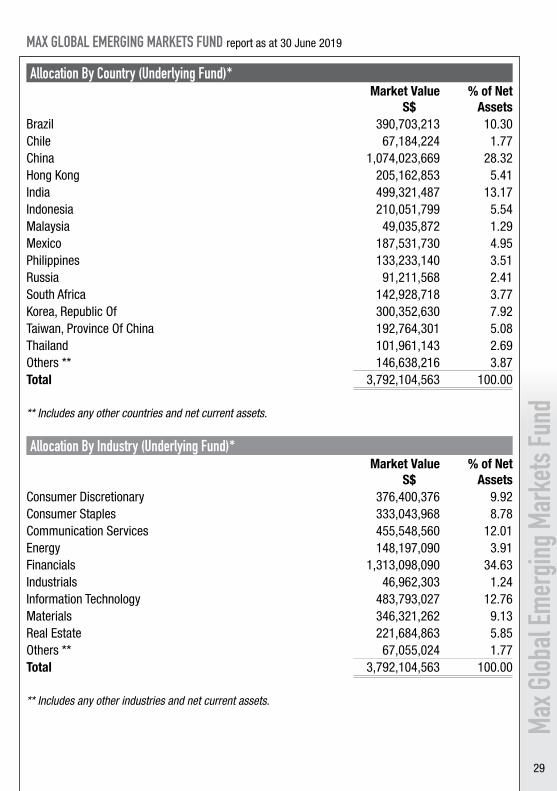
Allocation By Country (Underlying Fund)*Market Value
S$% of Net
AssetsBrazil 390,703,213 10.30Chile 67,184,224 1.77China 1,074,023,669 28.32Hong Kong 205,162,853 5.41India 499,321,487 13.17Indonesia 210,051,799 5.54Malaysia 49,035,872 1.29Mexico 187,531,730 4.95Philippines 133,233,140 3.51Russia 91,211,568 2.41South Africa 142,928,718 3.77Korea, Republic Of 300,352,630 7.92Taiwan, Province Of China 192,764,301 5.08Thailand 101,961,143 2.69Others ** 146,638,216 3.87Total 3,792,104,563 100.00
** Includes any other countries and net current assets.
Allocation By Industry (Underlying Fund)*Market Value
S$% of Net
AssetsConsumer Discretionary 376,400,376 9.92Consumer Staples 333,043,968 8.78Communication Services 455,548,560 12.01Energy 148,197,090 3.91Financials 1,313,098,090 34.63Industrials 46,962,303 1.24Information Technology 483,793,027 12.76Materials 346,321,262 9.13Real Estate 221,684,863 5.85Others ** 67,055,024 1.77Total 3,792,104,563 100.00
** Includes any other industries and net current assets.
30
Max G
lobal
Emer
ging M
arke
ts Fu
ndMAX GLOBAL EMERGING MARKETS FUND report as at 30 June 2019
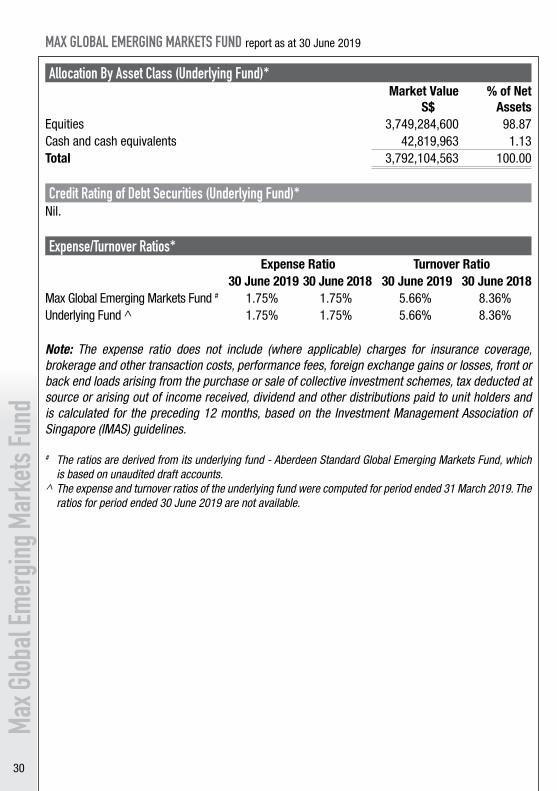
Allocation By Asset Class (Underlying Fund)*Market Value
S$% of Net
AssetsEquities 3,749,284,600 98.87 Cash and cash equivalents 42,819,963 1.13 Total 3,792,104,563 100.00
Credit Rating of Debt Securities (Underlying Fund)*Nil.
Expense/Turnover Ratios*Expense Ratio Turnover Ratio
30 June 2019 30 June 2018 30 June 2019 30 June 2018Max Global Emerging Markets Fund # 1.75% 1.75% 5.66% 8.36%Underlying Fund ^ 1.75% 1.75% 5.66% 8.36%
Note: The expense ratio does not include (where applicable) charges for insurance coverage, brokerage and other transaction costs, performance fees, foreign exchange gains or losses, front or back end loads arising from the purchase or sale of collective investment schemes, tax deducted at source or arising out of income received, dividend and other distributions paid to unit holders and is calculated for the preceding 12 months, based on the Investment Management Association of Singapore (IMAS) guidelines.
# The ratios are derived from its underlying fund - Aberdeen Standard Global Emerging Markets Fund, which is based on unaudited draft accounts.
^ The expense and turnover ratios of the underlying fund were computed for period ended 31 March 2019. The ratios for period ended 30 June 2019 are not available.
31
Max G
lobal
Emer
ging M
arke
ts Fu
nd
MAX GLOBAL EMERGING MARKETS FUND report as at 30 June 2019
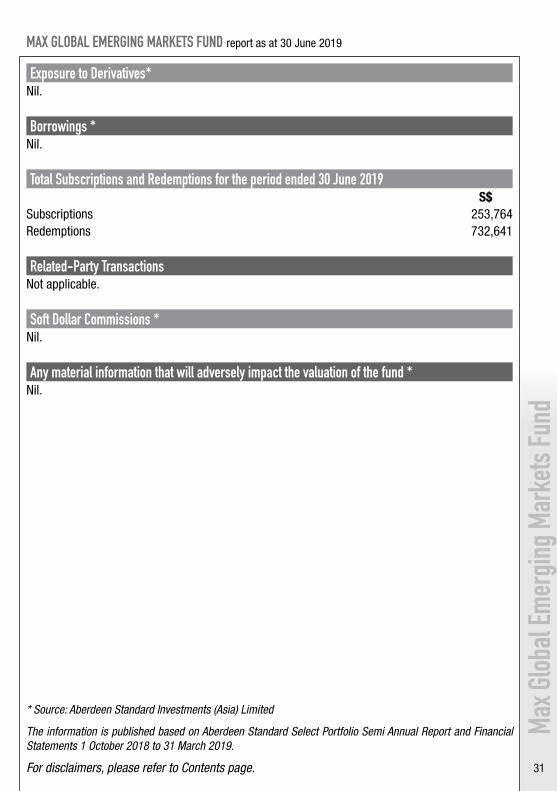
Exposure to Derivatives*Nil.
Borrowings *Nil.
Total Subscriptions and Redemptions for the period ended 30 June 2019S$
Subscriptions 253,764 Redemptions 732,641
Related-Party TransactionsNot applicable.
Soft Dollar Commissions *Nil.
Any material information that will adversely impact the valuation of the fund *Nil.
* Source: Aberdeen Standard Investments (Asia) Limited
The information is published based on Aberdeen Standard Select Portfolio Semi Annual Report and Financial Statements 1 October 2018 to 31 March 2019.
For disclaimers, please refer to Contents page.
32
Max G
lobal
Alloc
ation
Fund
MAX GLOBAL ALLOCATION FUND report as at 30 June 2019
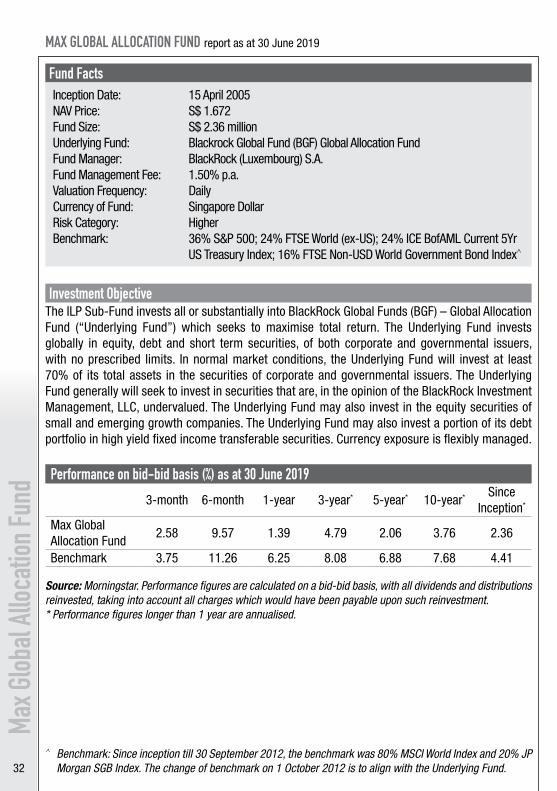
Fund FactsInception Date: 15 April 2005NAV Price: S$ 1.672Fund Size: S$ 2.36 millionUnderlying Fund: Blackrock Global Fund (BGF) Global Allocation FundFund Manager: BlackRock (Luxembourg) S.A. Fund Management Fee: 1.50% p.a. Valuation Frequency: DailyCurrency of Fund: Singapore DollarRisk Category: HigherBenchmark: 36% S&P 500; 24% FTSE World (ex-US); 24% ICE BofAML Current 5Yr
US Treasury Index; 16% FTSE Non-USD World Government Bond Index^
Investment ObjectiveThe ILP Sub-Fund invests all or substantially into BlackRock Global Funds (BGF) – Global Allocation Fund (“Underlying Fund”) which seeks to maximise total return. The Underlying Fund invests globally in equity, debt and short term securities, of both corporate and governmental issuers, with no prescribed limits. In normal market conditions, the Underlying Fund will invest at least 70% of its total assets in the securities of corporate and governmental issuers. The Underlying Fund generally will seek to invest in securities that are, in the opinion of the BlackRock Investment Management, LLC, undervalued. The Underlying Fund may also invest in the equity securities of small and emerging growth companies. The Underlying Fund may also invest a portion of its debt portfolio in high yield fixed income transferable securities. Currency exposure is flexibly managed.
Performance on bid-bid basis (%) as at 30 June 2019
3-month 6-month 1-year 3-year* 5-year* 10-year* Since Inception*
Max Global Allocation Fund
2.58 9.57 1.39 4.79 2.06 3.76 2.36
Benchmark 3.75 11.26 6.25 8.08 6.88 7.68 4.41
Source: Morningstar. Performance figures are calculated on a bid-bid basis, with all dividends and distributions reinvested, taking into account all charges which would have been payable upon such reinvestment.* Performance figures longer than 1 year are annualised.
^ Benchmark: Since inception till 30 September 2012, the benchmark was 80% MSCI World Index and 20% JP Morgan SGB Index. The change of benchmark on 1 October 2012 is to align with the Underlying Fund.
33
Max G
lobal
Alloc
ation
Fund
MAX GLOBAL ALLOCATION FUND report as at 30 June 2019
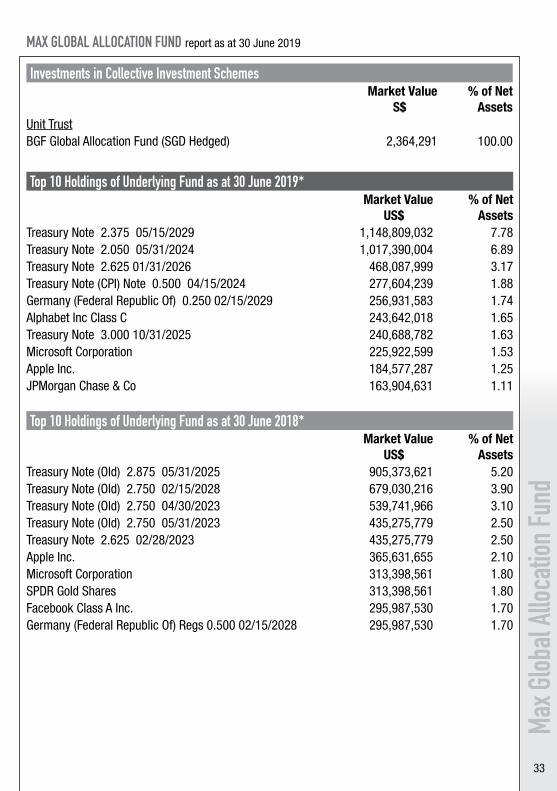
Investments in Collective Investment SchemesMarket Value
S$% of Net
AssetsUnit TrustBGF Global Allocation Fund (SGD Hedged) 2,364,291 100.00
Top 10 Holdings of Underlying Fund as at 30 June 2019*Market Value
US$% of Net
AssetsTreasury Note 2.375 05/15/2029 1,148,809,032 7.78Treasury Note 2.050 05/31/2024 1,017,390,004 6.89Treasury Note 2.625 01/31/2026 468,087,999 3.17Treasury Note (CPI) Note 0.500 04/15/2024 277,604,239 1.88Germany (Federal Republic Of) 0.250 02/15/2029 256,931,583 1.74Alphabet Inc Class C 243,642,018 1.65Treasury Note 3.000 10/31/2025 240,688,782 1.63Microsoft Corporation 225,922,599 1.53Apple Inc. 184,577,287 1.25JPMorgan Chase & Co 163,904,631 1.11
Top 10 Holdings of Underlying Fund as at 30 June 2018*Market Value
US$% of Net
AssetsTreasury Note (Old) 2.875 05/31/2025 905,373,621 5.20Treasury Note (Old) 2.750 02/15/2028 679,030,216 3.90Treasury Note (Old) 2.750 04/30/2023 539,741,966 3.10Treasury Note (Old) 2.750 05/31/2023 435,275,779 2.50Treasury Note 2.625 02/28/2023 435,275,779 2.50Apple Inc. 365,631,655 2.10Microsoft Corporation 313,398,561 1.80SPDR Gold Shares 313,398,561 1.80Facebook Class A Inc. 295,987,530 1.70Germany (Federal Republic Of) Regs 0.500 02/15/2028 295,987,530 1.70
34
Max G
lobal
Alloc
ation
Fund
MAX GLOBAL ALLOCATION FUND report as at 30 June 2019
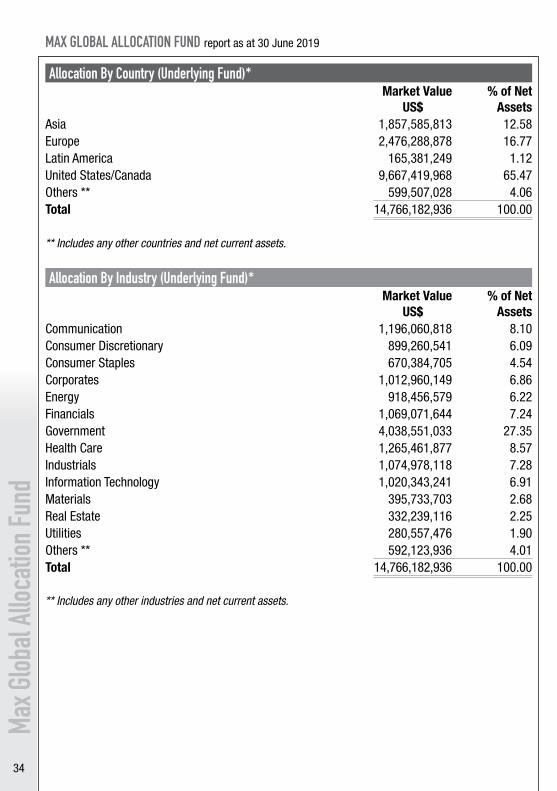
Allocation By Country (Underlying Fund)*Market Value
US$% of Net
AssetsAsia 1,857,585,813 12.58Europe 2,476,288,878 16.77Latin America 165,381,249 1.12United States/Canada 9,667,419,968 65.47Others ** 599,507,028 4.06Total 14,766,182,936 100.00
** Includes any other countries and net current assets.
Allocation By Industry (Underlying Fund)*Market Value
US$% of Net
AssetsCommunication 1,196,060,818 8.10 Consumer Discretionary 899,260,541 6.09 Consumer Staples 670,384,705 4.54 Corporates 1,012,960,149 6.86 Energy 918,456,579 6.22 Financials 1,069,071,644 7.24 Government 4,038,551,033 27.35 Health Care 1,265,461,877 8.57 Industrials 1,074,978,118 7.28 Information Technology 1,020,343,241 6.91 Materials 395,733,703 2.68 Real Estate 332,239,116 2.25 Utilities 280,557,476 1.90 Others ** 592,123,936 4.01 Total 14,766,182,936 100.00
** Includes any other industries and net current assets.
35
Max G
lobal
Alloc
ation
Fund
MAX GLOBAL ALLOCATION FUND report as at 30 June 2019
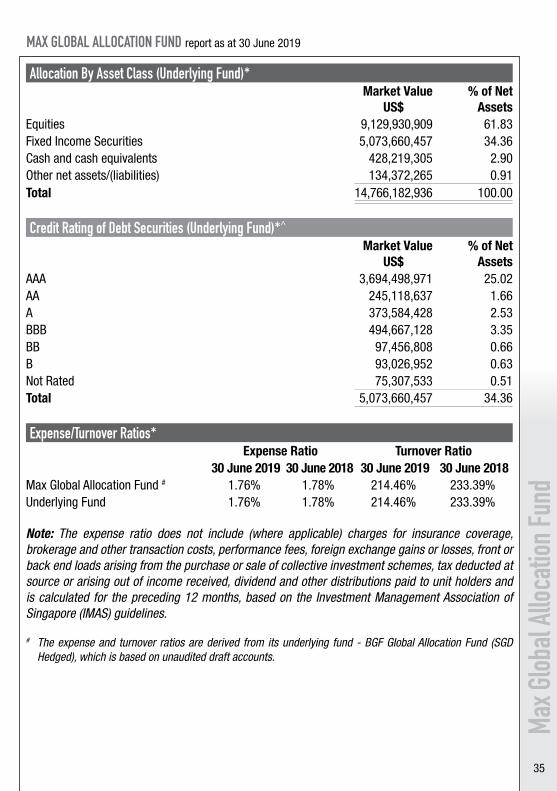
Allocation By Asset Class (Underlying Fund)*Market Value
US$% of Net
AssetsEquities 9,129,930,909 61.83Fixed Income Securities 5,073,660,457 34.36Cash and cash equivalents 428,219,305 2.90Other net assets/(liabilities) 134,372,265 0.91Total 14,766,182,936 100.00
Credit Rating of Debt Securities (Underlying Fund)*^
Market ValueUS$
% of NetAssets
AAA 3,694,498,971 25.02AA 245,118,637 1.66A 373,584,428 2.53BBB 494,667,128 3.35BB 97,456,808 0.66B 93,026,952 0.63Not Rated 75,307,533 0.51Total 5,073,660,457 34.36
Expense/Turnover Ratios*Expense Ratio Turnover Ratio
30 June 2019 30 June 2018 30 June 2019 30 June 2018Max Global Allocation Fund # 1.76% 1.78% 214.46% 233.39%Underlying Fund 1.76% 1.78% 214.46% 233.39%
Note: The expense ratio does not include (where applicable) charges for insurance coverage, brokerage and other transaction costs, performance fees, foreign exchange gains or losses, front or back end loads arising from the purchase or sale of collective investment schemes, tax deducted at source or arising out of income received, dividend and other distributions paid to unit holders and is calculated for the preceding 12 months, based on the Investment Management Association of Singapore (IMAS) guidelines.
# The expense and turnover ratios are derived from its underlying fund - BGF Global Allocation Fund (SGD Hedged), which is based on unaudited draft accounts.
36
Max G
lobal
Alloc
ation
Fund
MAX GLOBAL ALLOCATION FUND report as at 30 June 2019
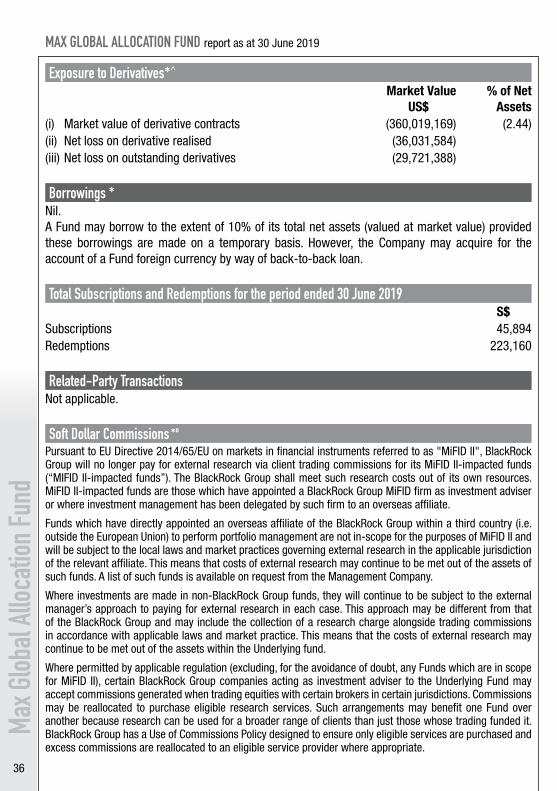
Exposure to Derivatives*^
Market ValueUS$
% of NetAssets
(i) Market value of derivative contracts (360,019,169) (2.44)(ii) Net loss on derivative realised (36,031,584)(iii) Net loss on outstanding derivatives (29,721,388)
Borrowings *Nil.A Fund may borrow to the extent of 10% of its total net assets (valued at market value) provided these borrowings are made on a temporary basis. However, the Company may acquire for the account of a Fund foreign currency by way of back-to-back loan.
Total Subscriptions and Redemptions for the period ended 30 June 2019S$
Subscriptions 45,894 Redemptions 223,160
Related-Party TransactionsNot applicable. Soft Dollar Commissions *º
Pursuant to EU Directive 2014/65/EU on markets in financial instruments referred to as "MiFID II", BlackRock Group will no longer pay for external research via client trading commissions for its MiFID II-impacted funds (“MIFID II-impacted funds”). The BlackRock Group shall meet such research costs out of its own resources. MiFID II-impacted funds are those which have appointed a BlackRock Group MiFID firm as investment adviser or where investment management has been delegated by such firm to an overseas affiliate.
Funds which have directly appointed an overseas affiliate of the BlackRock Group within a third country (i.e. outside the European Union) to perform portfolio management are not in-scope for the purposes of MiFID II and will be subject to the local laws and market practices governing external research in the applicable jurisdiction of the relevant affiliate. This means that costs of external research may continue to be met out of the assets of such funds. A list of such funds is available on request from the Management Company.
Where investments are made in non-BlackRock Group funds, they will continue to be subject to the external manager’s approach to paying for external research in each case. This approach may be different from that of the BlackRock Group and may include the collection of a research charge alongside trading commissions in accordance with applicable laws and market practice. This means that the costs of external research may continue to be met out of the assets within the Underlying fund.
Where permitted by applicable regulation (excluding, for the avoidance of doubt, any Funds which are in scope for MiFID II), certain BlackRock Group companies acting as investment adviser to the Underlying Fund may accept commissions generated when trading equities with certain brokers in certain jurisdictions. Commissions may be reallocated to purchase eligible research services. Such arrangements may benefit one Fund over another because research can be used for a broader range of clients than just those whose trading funded it. BlackRock Group has a Use of Commissions Policy designed to ensure only eligible services are purchased and excess commissions are reallocated to an eligible service provider where appropriate.
37
* Source: BlackRock (Singapore) Ltd^ There may be some slight differences due to decimal rounding issues.
For disclaimers, please refer to Contents page.
To the extent that investment advisers within the BlackRock Group are permitted to receive trading commissions or soft dollar commissions, with respect to the Underlying Fund (or portion of the Underlying Fund) for which they provide investment management and advice, they may select brokers (including, without limitation, brokers who are affiliated with the BlackRock Group or PNC Group) that furnish the BlackRock Group, directly or through third-party or correspondent relationships, with research or execution services which provide, in BlackRock Group’s view, lawful and appropriate assistance to each applicable BlackRock Group company in the investment decision-making or trade execution processes and the nature of which is that their provision can reasonably be expected to benefit the Underlying Fund as a whole and may contribute to an improvement in the Underlying Funds’ performance. Such research or execution services may include, without limitation and to the extent permitted by applicable law: research reports on companies, industries and securities; economic and financial information and analysis; and quantitative analytical software. Research or execution services obtained in this manner may be used in servicing not only the account from which commissions were used to pay for the services, but also other BlackRock Group client accounts. For the avoidance of doubt, such goods and services do not include travel, accommodation, entertainment, general administrative goods and services, general office equipment, computer hardware or premises, membership fees, employee salaries or direct money payments. To the extent that BlackRock uses its clients’ commission dollars to obtain research or execution services, BlackRock Group companies will not have to pay for those products and services themselves. BlackRock Group companies may receive research or execution services that are bundled with the trade execution, clearing and/or settlement services provided by a particular broker-dealer. To the extent that each BlackRock Group company receives research or execution services on this basis, many of the same potential conflicts related to receipt of these services through third party arrangements exist. For example, the research effectively will be paid by client commissions that also will be used to pay for the execution, clearing and settlement services provided by the broker-dealer and will not be paid by that BlackRock Group company.
Each BlackRock Group company may endeavour, subject to best execution, to execute trades through brokers who, pursuant to such arrangements, provide research or execution services in order to ensure the continued receipt of research or execution services that BlackRock Group company believes are useful in their investment decision-making or trade execution process.
Each BlackRock Group company may pay, or be deemed to have paid, commission rates higher than it could have otherwise paid in order to obtain research or execution services if that BlackRock Group company determines in good faith that the commission paid is reasonable in relation to the value of the research or execution services provided. BlackRock Group believes that using commission dollars to obtain the research or execution services enhances its investment research and trading processes, thereby increasing the prospect for higher investment returns.
BlackRock Group may from time to time choose to alter or choose not to engage in the above described arrangements to varying degrees, without notice to BlackRock Group clients, to the extent permitted by applicable law.o The Investment Manager may, subject to applicable regulation and best execution, execute trades through brokers who, pursuant to such arrangements, provide research or execution services in order to ensure the continued receipt of research or execution services that the Investment Manager believes are useful in their investment decision-making or trade execution process. To the best of their knowledge, the Investment Manager does not engage in any portfolio or market manipulative practices, including, but not limited to churning of trade.
Any material information that will adversely impact the valuation of the fund *Nil.
38
MAX SINGAPORE BALANCED FUND report as at 30 June 2019
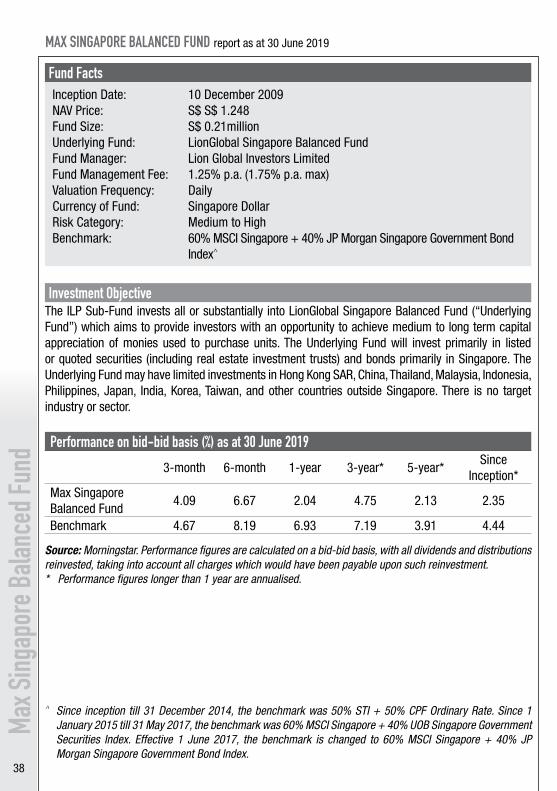
Fund FactsInception Date: 10 December 2009NAV Price: S$ S$ 1.248Fund Size: S$ 0.21millionUnderlying Fund: LionGlobal Singapore Balanced FundFund Manager: Lion Global Investors LimitedFund Management Fee: 1.25% p.a. (1.75% p.a. max)Valuation Frequency: DailyCurrency of Fund: Singapore DollarRisk Category: Medium to HighBenchmark: 60% MSCI Singapore + 40% JP Morgan Singapore Government Bond
Index^
Investment ObjectiveThe ILP Sub-Fund invests all or substantially into LionGlobal Singapore Balanced Fund (“Underlying Fund”) which aims to provide investors with an opportunity to achieve medium to long term capital appreciation of monies used to purchase units. The Underlying Fund will invest primarily in listed or quoted securities (including real estate investment trusts) and bonds primarily in Singapore. The Underlying Fund may have limited investments in Hong Kong SAR, China, Thailand, Malaysia, Indonesia, Philippines, Japan, India, Korea, Taiwan, and other countries outside Singapore. There is no target industry or sector.
Performance on bid-bid basis (%) as at 30 June 2019
3-month 6-month 1-year 3-year* 5-year*Since
Inception*Max Singapore Balanced Fund
4.09 6.67 2.04 4.75 2.13 2.35
Benchmark 4.67 8.19 6.93 7.19 3.91 4.44
Source: Morningstar. Performance figures are calculated on a bid-bid basis, with all dividends and distributions reinvested, taking into account all charges which would have been payable upon such reinvestment.* Performance figures longer than 1 year are annualised.
Max S
ingap
ore B
alanc
ed Fu
nd
^ Since inception till 31 December 2014, the benchmark was 50% STI + 50% CPF Ordinary Rate. Since 1 January 2015 till 31 May 2017, the benchmark was 60% MSCI Singapore + 40% UOB Singapore Government Securities Index. Effective 1 June 2017, the benchmark is changed to 60% MSCI Singapore + 40% JP Morgan Singapore Government Bond Index.
39
MAX SINGAPORE BALANCED FUND report as at 30 June 2019
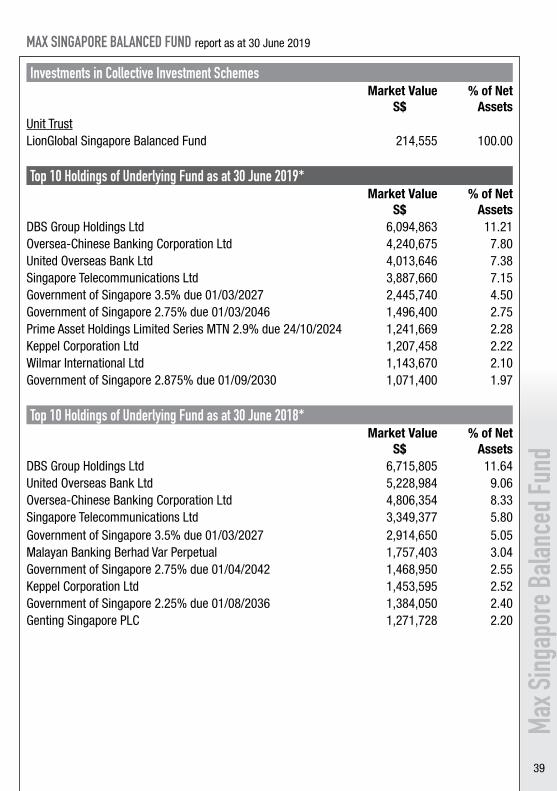
Investments in Collective Investment SchemesMarket Value
S$% of Net
AssetsUnit TrustLionGlobal Singapore Balanced Fund 214,555 100.00
Top 10 Holdings of Underlying Fund as at 30 June 2019*Market Value
S$% of Net
AssetsDBS Group Holdings Ltd 6,094,863 11.21Oversea-Chinese Banking Corporation Ltd 4,240,675 7.80United Overseas Bank Ltd 4,013,646 7.38Singapore Telecommunications Ltd 3,887,660 7.15Government of Singapore 3.5% due 01/03/2027 2,445,740 4.50Government of Singapore 2.75% due 01/03/2046 1,496,400 2.75Prime Asset Holdings Limited Series MTN 2.9% due 24/10/2024 1,241,669 2.28Keppel Corporation Ltd 1,207,458 2.22Wilmar International Ltd 1,143,670 2.10Government of Singapore 2.875% due 01/09/2030 1,071,400 1.97
Top 10 Holdings of Underlying Fund as at 30 June 2018*Market Value
S$% of Net
AssetsDBS Group Holdings Ltd 6,715,805 11.64United Overseas Bank Ltd 5,228,984 9.06Oversea-Chinese Banking Corporation Ltd 4,806,354 8.33Singapore Telecommunications Ltd 3,349,377 5.80Government of Singapore 3.5% due 01/03/2027 2,914,650 5.05Malayan Banking Berhad Var Perpetual 1,757,403 3.04Government of Singapore 2.75% due 01/04/2042 1,468,950 2.55Keppel Corporation Ltd 1,453,595 2.52Government of Singapore 2.25% due 01/08/2036 1,384,050 2.40Genting Singapore PLC 1,271,728 2.20
Max S
ingap
ore B
alanc
ed Fu
nd
40
MAX SINGAPORE BALANCED FUND report as at 30 June 2019
Max S
ingap
ore B
alanc
ed Fu
nd
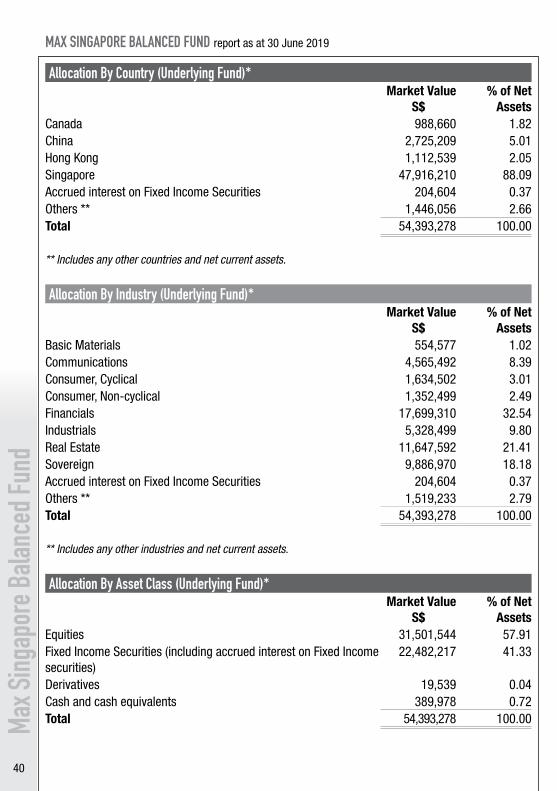
Allocation By Country (Underlying Fund)*Market Value
S$% of Net
AssetsCanada 988,660 1.82China 2,725,209 5.01Hong Kong 1,112,539 2.05Singapore 47,916,210 88.09Accrued interest on Fixed Income Securities 204,604 0.37Others ** 1,446,056 2.66Total 54,393,278 100.00
** Includes any other countries and net current assets.
Allocation By Industry (Underlying Fund)*Market Value
S$% of Net
AssetsBasic Materials 554,577 1.02Communications 4,565,492 8.39Consumer, Cyclical 1,634,502 3.01Consumer, Non-cyclical 1,352,499 2.49Financials 17,699,310 32.54Industrials 5,328,499 9.80Real Estate 11,647,592 21.41Sovereign 9,886,970 18.18Accrued interest on Fixed Income Securities 204,604 0.37Others ** 1,519,233 2.79Total 54,393,278 100.00
** Includes any other industries and net current assets.
Allocation By Asset Class (Underlying Fund)*Market Value
S$% of Net
AssetsEquities 31,501,544 57.91 Fixed Income Securities (including accrued interest on Fixed Income securities)
22,482,217 41.33
Derivatives 19,539 0.04 Cash and cash equivalents 389,978 0.72 Total 54,393,278 100.00
41
MAX SINGAPORE BALANCED FUND report as at 30 June 2019
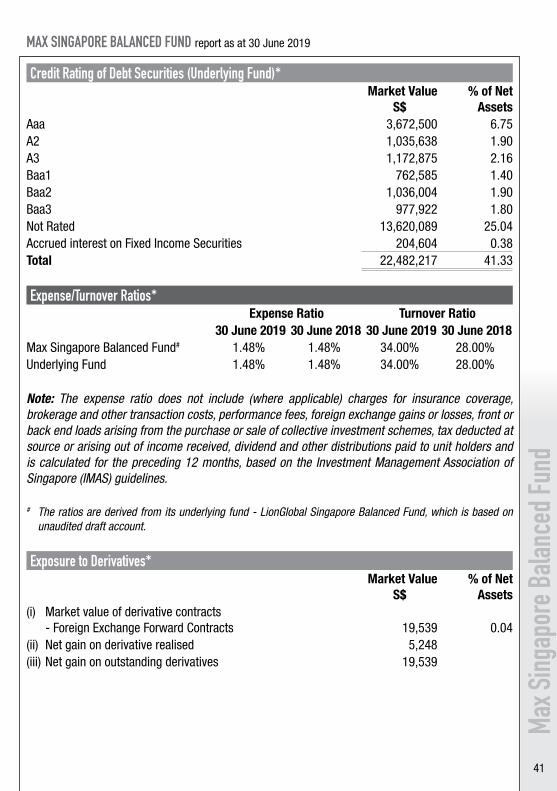
Credit Rating of Debt Securities (Underlying Fund)*Market Value
S$% of Net
AssetsAaa 3,672,500 6.75A2 1,035,638 1.90A3 1,172,875 2.16Baa1 762,585 1.40Baa2 1,036,004 1.90Baa3 977,922 1.80Not Rated 13,620,089 25.04Accrued interest on Fixed Income Securities 204,604 0.38Total 22,482,217 41.33
Expense/Turnover Ratios*Expense Ratio Turnover Ratio
30 June 2019 30 June 2018 30 June 2019 30 June 2018Max Singapore Balanced Fund# 1.48% 1.48% 34.00% 28.00%Underlying Fund 1.48% 1.48% 34.00% 28.00%
Note: The expense ratio does not include (where applicable) charges for insurance coverage, brokerage and other transaction costs, performance fees, foreign exchange gains or losses, front or back end loads arising from the purchase or sale of collective investment schemes, tax deducted at source or arising out of income received, dividend and other distributions paid to unit holders and is calculated for the preceding 12 months, based on the Investment Management Association of Singapore (IMAS) guidelines.
# The ratios are derived from its underlying fund - LionGlobal Singapore Balanced Fund, which is based on unaudited draft account.
Exposure to Derivatives*Market Value
S$% of Net
Assets(i) Market value of derivative contracts - Foreign Exchange Forward Contracts 19,539 0.04 (ii) Net gain on derivative realised 5,248 (iii) Net gain on outstanding derivatives 19,539
Max S
ingap
ore B
alanc
ed Fu
nd
42
MAX SINGAPORE BALANCED FUND report as at 30 June 2019
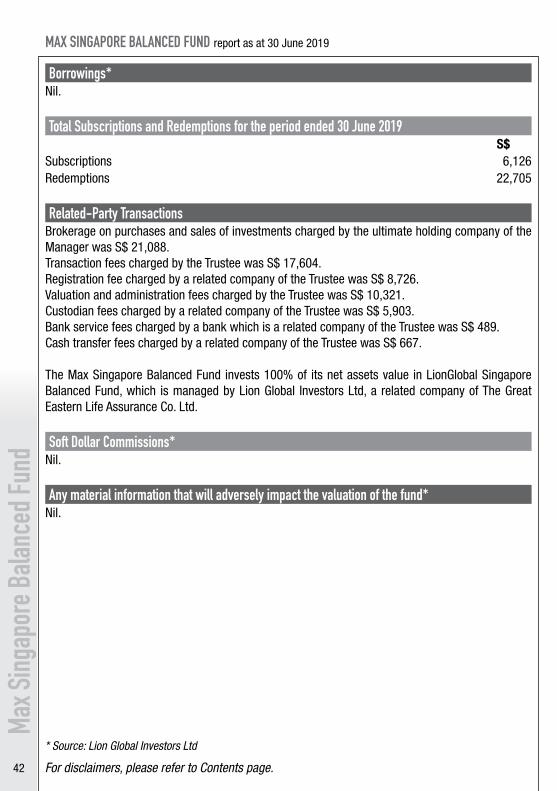
Borrowings*Nil.
Total Subscriptions and Redemptions for the period ended 30 June 2019S$
Subscriptions 6,126 Redemptions 22,705
Related-Party TransactionsBrokerage on purchases and sales of investments charged by the ultimate holding company of the Manager was S$ 21,088. Transaction fees charged by the Trustee was S$ 17,604. Registration fee charged by a related company of the Trustee was S$ 8,726. Valuation and administration fees charged by the Trustee was S$ 10,321. Custodian fees charged by a related company of the Trustee was S$ 5,903. Bank service fees charged by a bank which is a related company of the Trustee was S$ 489. Cash transfer fees charged by a related company of the Trustee was S$ 667. The Max Singapore Balanced Fund invests 100% of its net assets value in LionGlobal Singapore Balanced Fund, which is managed by Lion Global Investors Ltd, a related company of The Great Eastern Life Assurance Co. Ltd.
Soft Dollar Commissions*Nil.
Any material information that will adversely impact the valuation of the fund*Nil.
* Source: Lion Global Investors Ltd
For disclaimers, please refer to Contents page.
Max S
ingap
ore B
alanc
ed Fu
nd
43
MAX SINGAPORE TRUST FUND report as at 30 June 2019
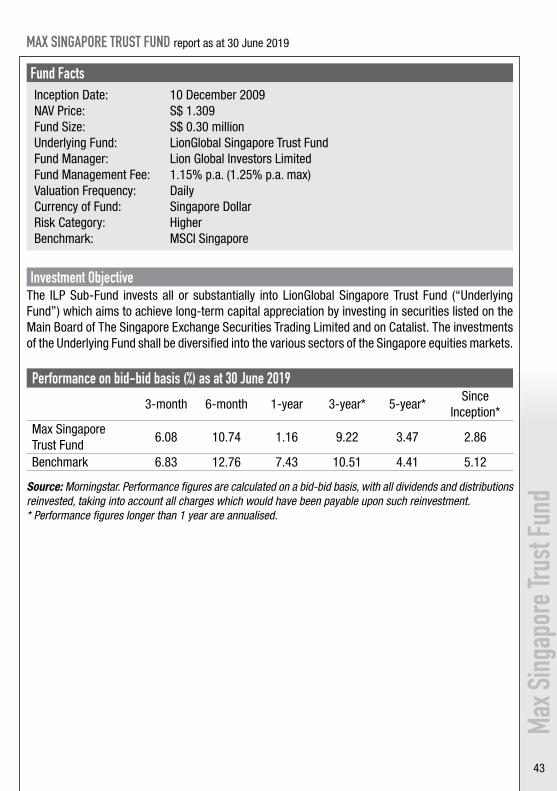
Fund FactsInception Date: 10 December 2009NAV Price: S$ 1.309Fund Size: S$ 0.30 millionUnderlying Fund: LionGlobal Singapore Trust FundFund Manager: Lion Global Investors LimitedFund Management Fee: 1.15% p.a. (1.25% p.a. max)Valuation Frequency: DailyCurrency of Fund: Singapore DollarRisk Category: HigherBenchmark: MSCI Singapore
Investment ObjectiveThe ILP Sub-Fund invests all or substantially into LionGlobal Singapore Trust Fund (“Underlying Fund”) which aims to achieve long-term capital appreciation by investing in securities listed on the Main Board of The Singapore Exchange Securities Trading Limited and on Catalist. The investments of the Underlying Fund shall be diversified into the various sectors of the Singapore equities markets.
Performance on bid-bid basis (%) as at 30 June 2019
3-month 6-month 1-year 3-year* 5-year*Since
Inception*Max Singapore Trust Fund
6.08 10.74 1.16 9.22 3.47 2.86
Benchmark 6.83 12.76 7.43 10.51 4.41 5.12
Source: Morningstar. Performance figures are calculated on a bid-bid basis, with all dividends and distributions reinvested, taking into account all charges which would have been payable upon such reinvestment.* Performance figures longer than 1 year are annualised.
Max S
ingap
ore T
rust
Fund
44
MAX SINGAPORE TRUST FUND report as at 30 June 2019
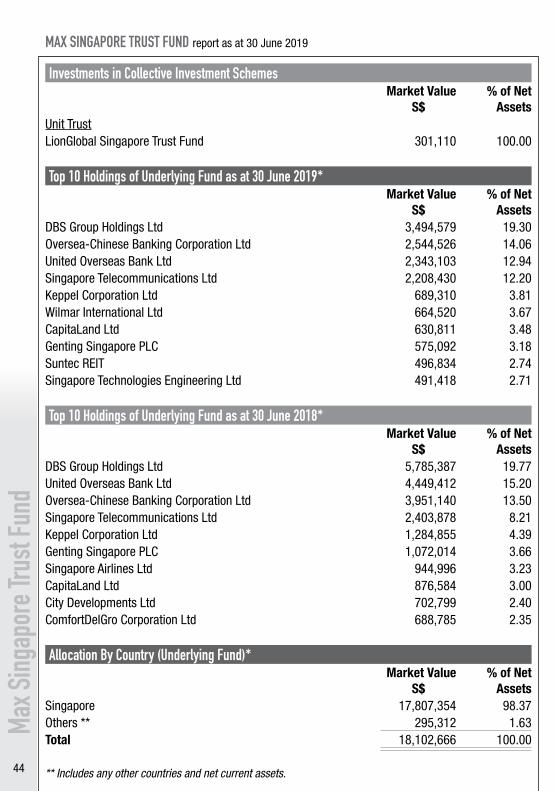
Investments in Collective Investment SchemesMarket Value
S$% of Net
AssetsUnit TrustLionGlobal Singapore Trust Fund 301,110 100.00
Top 10 Holdings of Underlying Fund as at 30 June 2019*Market Value
S$% of Net
AssetsDBS Group Holdings Ltd 3,494,579 19.30Oversea-Chinese Banking Corporation Ltd 2,544,526 14.06United Overseas Bank Ltd 2,343,103 12.94Singapore Telecommunications Ltd 2,208,430 12.20Keppel Corporation Ltd 689,310 3.81Wilmar International Ltd 664,520 3.67CapitaLand Ltd 630,811 3.48Genting Singapore PLC 575,092 3.18Suntec REIT 496,834 2.74Singapore Technologies Engineering Ltd 491,418 2.71
Top 10 Holdings of Underlying Fund as at 30 June 2018*Market Value
S$% of Net
AssetsDBS Group Holdings Ltd 5,785,387 19.77United Overseas Bank Ltd 4,449,412 15.20Oversea-Chinese Banking Corporation Ltd 3,951,140 13.50Singapore Telecommunications Ltd 2,403,878 8.21Keppel Corporation Ltd 1,284,855 4.39Genting Singapore PLC 1,072,014 3.66Singapore Airlines Ltd 944,996 3.23CapitaLand Ltd 876,584 3.00City Developments Ltd 702,799 2.40ComfortDelGro Corporation Ltd 688,785 2.35
Allocation By Country (Underlying Fund)*Market Value
S$% of Net
AssetsSingapore 17,807,354 98.37Others ** 295,312 1.63Total 18,102,666 100.00
** Includes any other countries and net current assets.
Max S
ingap
ore T
rust
Fund
45
MAX SINGAPORE TRUST FUND report as at 30 June 2019
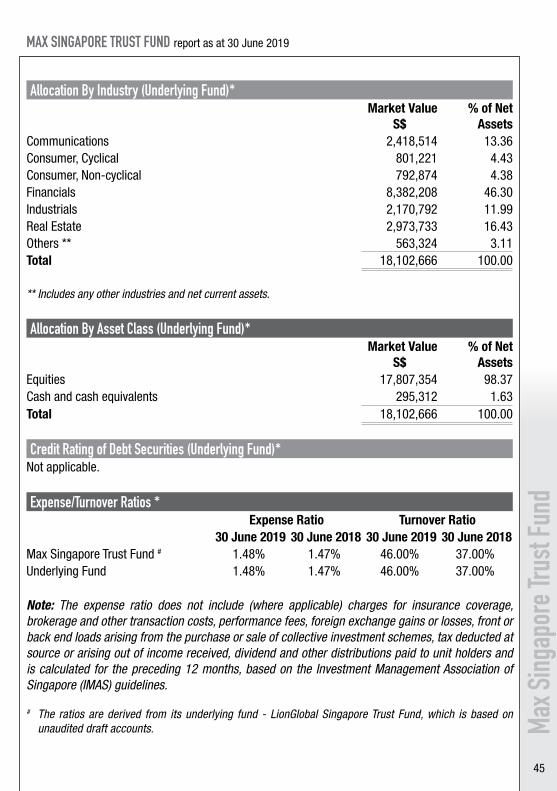
Allocation By Industry (Underlying Fund)*Market Value
S$% of Net
AssetsCommunications 2,418,514 13.36Consumer, Cyclical 801,221 4.43Consumer, Non-cyclical 792,874 4.38Financials 8,382,208 46.30Industrials 2,170,792 11.99Real Estate 2,973,733 16.43Others ** 563,324 3.11Total 18,102,666 100.00
** Includes any other industries and net current assets.
Allocation By Asset Class (Underlying Fund)*Market Value
S$% of Net
AssetsEquities 17,807,354 98.37Cash and cash equivalents 295,312 1.63Total 18,102,666 100.00
Credit Rating of Debt Securities (Underlying Fund)*Not applicable.
Expense/Turnover Ratios *Expense Ratio Turnover Ratio
30 June 2019 30 June 2018 30 June 2019 30 June 2018Max Singapore Trust Fund # 1.48% 1.47% 46.00% 37.00%Underlying Fund 1.48% 1.47% 46.00% 37.00%
Note: The expense ratio does not include (where applicable) charges for insurance coverage, brokerage and other transaction costs, performance fees, foreign exchange gains or losses, front or back end loads arising from the purchase or sale of collective investment schemes, tax deducted at source or arising out of income received, dividend and other distributions paid to unit holders and is calculated for the preceding 12 months, based on the Investment Management Association of Singapore (IMAS) guidelines.
# The ratios are derived from its underlying fund - LionGlobal Singapore Trust Fund, which is based on unaudited draft accounts. Ma
x Sing
apor
e Tru
st Fu
nd
46
MAX SINGAPORE TRUST FUND report as at 30 June 2019
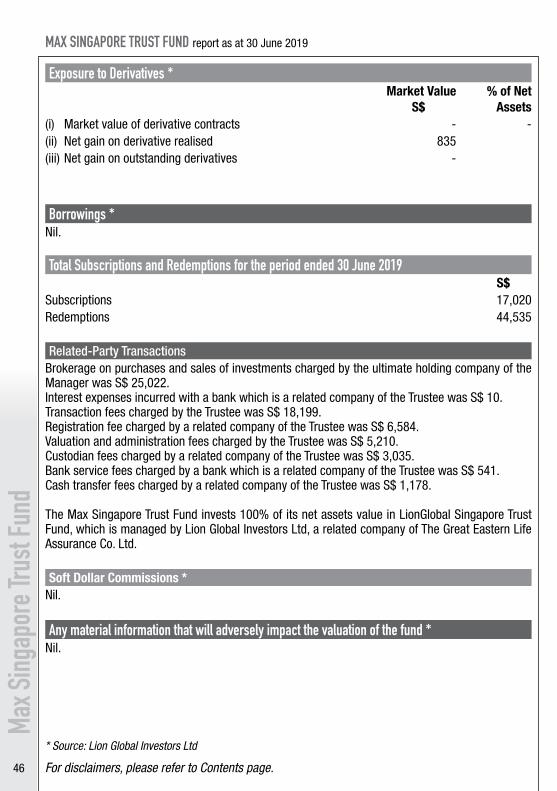
Exposure to Derivatives *Market Value
S$% of Net
Assets(i) Market value of derivative contracts - - (ii) Net gain on derivative realised 835(iii) Net gain on outstanding derivatives -
Borrowings *Nil.
Total Subscriptions and Redemptions for the period ended 30 June 2019S$
Subscriptions 17,020 Redemptions 44,535
Related-Party TransactionsBrokerage on purchases and sales of investments charged by the ultimate holding company of the Manager was S$ 25,022. Interest expenses incurred with a bank which is a related company of the Trustee was S$ 10. Transaction fees charged by the Trustee was S$ 18,199. Registration fee charged by a related company of the Trustee was S$ 6,584. Valuation and administration fees charged by the Trustee was S$ 5,210. Custodian fees charged by a related company of the Trustee was S$ 3,035. Bank service fees charged by a bank which is a related company of the Trustee was S$ 541. Cash transfer fees charged by a related company of the Trustee was S$ 1,178.
The Max Singapore Trust Fund invests 100% of its net assets value in LionGlobal Singapore Trust Fund, which is managed by Lion Global Investors Ltd, a related company of The Great Eastern Life Assurance Co. Ltd.
Soft Dollar Commissions *Nil.
Any material information that will adversely impact the valuation of the fund *Nil.
* Source: Lion Global Investors Ltd
For disclaimers, please refer to Contents page.
Max S
ingap
ore T
rust
Fund
47
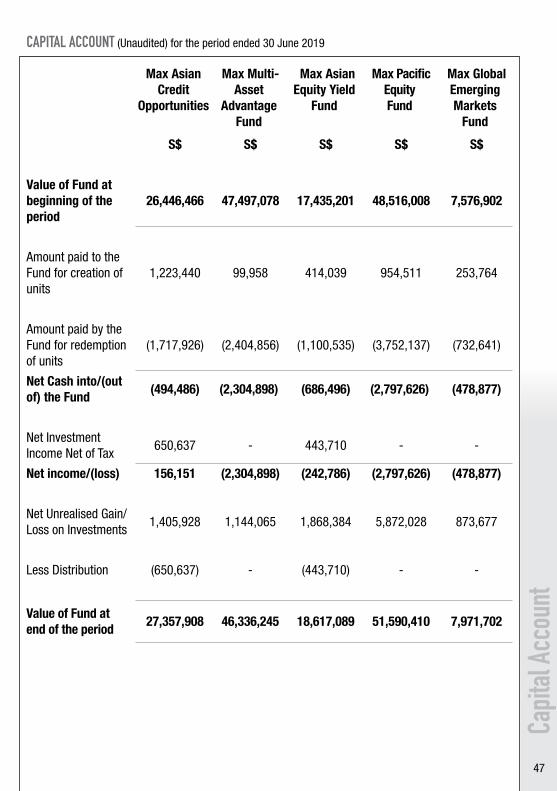
CAPITAL ACCOUNT (Unaudited) for the period ended 30 June 2019
Max Asian Credit
Opportunities
Max Multi-Asset
Advantage Fund
Max Asian Equity Yield
Fund
Max Pacific Equity Fund
Max Global Emerging Markets
Fund
S$ S$ S$ S$ S$
Value of Fund at beginning of the period
26,446,466 47,497,078 17,435,201 48,516,008 7,576,902
Amount paid to the Fund for creation of units
1,223,440 99,958 414,039 954,511 253,764
Amount paid by the Fund for redemption of units
(1,717,926) (2,404,856) (1,100,535) (3,752,137) (732,641)
Net Cash into/(out of) the Fund
(494,486) (2,304,898) (686,496) (2,797,626) (478,877)
Net Investment Income Net of Tax
650,637 - 443,710 - -
Net income/(loss) 156,151 (2,304,898) (242,786) (2,797,626) (478,877)
Net Unrealised Gain/Loss on Investments
1,405,928 1,144,065 1,868,384 5,872,028 873,677
Less Distribution (650,637) - (443,710) - -
Value of Fund at end of the period
27,357,908 46,336,245 18,617,089 51,590,410 7,971,702
Capit
al Ac
coun
t
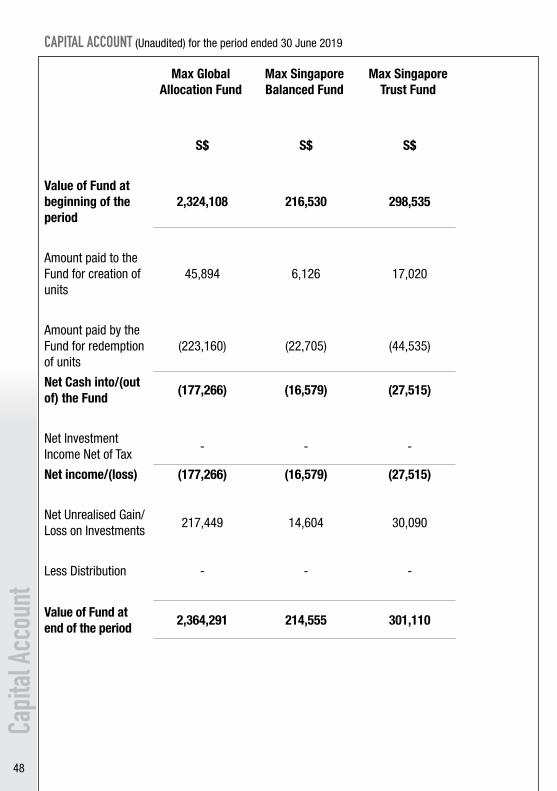
48
Max Global Allocation Fund
Max Singapore Balanced Fund
Max Singapore Trust Fund
S$ S$ S$
Value of Fund at beginning of the period
2,324,108 216,530 298,535
Amount paid to the Fund for creation of units
45,894 6,126 17,020
Amount paid by the Fund for redemption of units
(223,160) (22,705) (44,535)
Net Cash into/(out of) the Fund
(177,266) (16,579) (27,515)
Net Investment Income Net of Tax
- - -
Net income/(loss) (177,266) (16,579) (27,515)
Net Unrealised Gain/Loss on Investments
217,449 14,604 30,090
Less Distribution - - -
Value of Fund at end of the period
2,364,291 214,555 301,110
CAPITAL ACCOUNT (Unaudited) for the period ended 30 June 2019
Capit
al Ac
coun
t
49
Max Global Allocation Fund
Max Singapore Balanced Fund
Max Singapore Trust Fund
S$ S$ S$
Value of Fund at beginning of the period
2,324,108 216,530 298,535
Amount paid to the Fund for creation of units
45,894 6,126 17,020
Amount paid by the Fund for redemption of units
(223,160) (22,705) (44,535)
Net Cash into/(out of) the Fund
(177,266) (16,579) (27,515)
Net Investment Income Net of Tax
- - -
Net income/(loss) (177,266) (16,579) (27,515)
Net Unrealised Gain/Loss on Investments
217,449 14,604 30,090
Less Distribution - - -
Value of Fund at end of the period
2,364,291 214,555 301,110
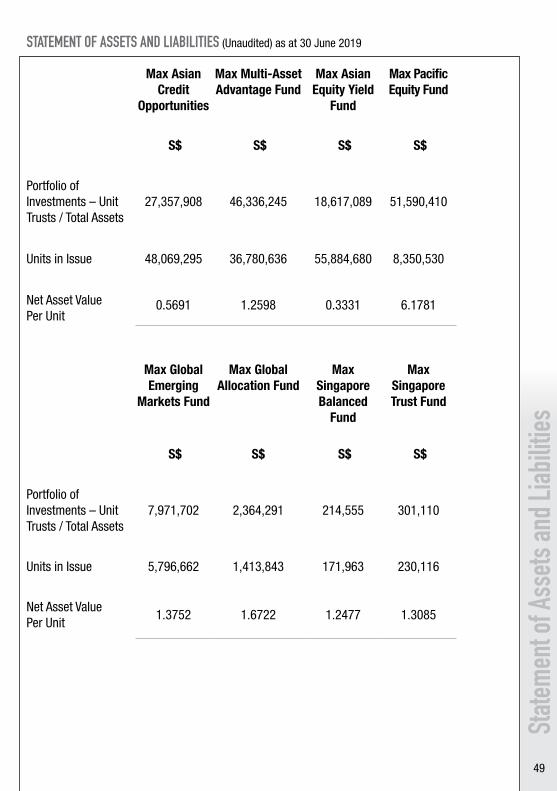
STATEMENT OF ASSETS AND LIABILITIES (Unaudited) as at 30 June 2019
Max Asian Credit
Opportunities
Max Multi-Asset Advantage Fund
Max Asian Equity Yield
Fund
Max Pacific Equity Fund
S$ S$ S$ S$
Portfolio of Investments – Unit Trusts / Total Assets
27,357,908 46,336,245 18,617,089 51,590,410
Units in Issue 48,069,295 36,780,636 55,884,680 8,350,530
Net Asset Value Per Unit
0.5691 1.2598 0.3331 6.1781
Max Global Emerging
Markets Fund
Max Global Allocation Fund
Max Singapore Balanced
Fund
Max Singapore Trust Fund
S$ S$ S$ S$
Portfolio of Investments – Unit Trusts / Total Assets
7,971,702 2,364,291 214,555 301,110
Units in Issue 5,796,662 1,413,843 171,963 230,116
Net Asset Value Per Unit
1.3752 1.6722 1.2477 1.3085
State
ment
of As
sets
and L
iabilit
ies

50
NOTES TO THE ACCOUNTS
1 GENERAL The Max Funds are feeder funds comprising:
• Max Multi-Asset Advantage Fund• Max Asian Credit Opportunities• Max Pacific Equity Fund• Max Global Emerging Markets Fund • Max Global Allocation Fund• Max Asian Equity Yield Fund• Max Singapore Balanced Fund• Max Singapore Trust Fund
2 SIGNIFICANT ACCOUNTING POLICIES
a. Basis of Accounting The financial statements are expressed in Singapore dollars and are prepared
in accordance with the historical cost convention, except for investments, which are carried at fair value.
b. Recognition of Income and Expenses Dividend income is recognised when the shareholders' right to receive
payment is established. Interest income is recognised as interest accrues (using the effective interest method).
Expenses are recognised on an accrual basis.
c. Investments All purchases of investments are recognised on their trade dates, ie., the
date of commitment exists to purchase the investments. The investments are initially recorded at fair value (or at costs representing fair value on trade date) which would include transaction costs directly attributable to the acquisition of the investments. After initial recognition, the unrealised gains or losses on remeasurement to fair value are taken to the Capital Account. Fair value is determined by using open market valuation at the year-end date. The closing price has been adopted for all investments.
d. Derivative financial instruments All derivatives are carried at fair value. All fair value changes on derivatives
are taken to the Underlying Funds' Capital Account.
3 DISTRIBUTION TO POLICYHOLDERS Max Asian Credit Opportunities Fund and Max Asian Equity Yield Fund have
made distributions of $650,637 and $443,710 respectively to policyholders for the period ended 30 June 2019.
Notes
to th
e Acc
ounts
Printed by Ngai Heng Pte Ltd

51
(This page is intentionally left blank)

52
The Great Eastern Life Assurance Company Limited (Registration No. 1908 00011G)
1 Pickering Street #01-01 Great Eastern Centre Singapore 048659