2020 Semi-Annual Report (Unaudited)
40
NOVEMBER 30, 2020 2020 Semi-Annual Report (Unaudited) BlackRock Funds SM • BlackRock Commodity Strategies Fund Not FDIC Insured • May Lose Value • No Bank Guarantee
Transcript of 2020 Semi-Annual Report (Unaudited)

NOVEMBER 30, 2020
2020 Semi-Annual Report(Unaudited)
BlackRock FundsSM
• BlackRock Commodity Strategies Fund
Not FDIC Insured • May Lose Value • No Bank Guarantee

Dear Shareholder,
The 12-month reporting period as of November 30, 2020 has been a time of sudden change in global financialmarkets, as the emergence and spread of the coronavirus (or “COVID-19”) led to a vast disruption in the globaleconomy and financial markets. Prior to the outbreak of the virus, U.S. equities and bonds both delivered solidreturns, despite fears and doubts about the economy that were ultimately laid to rest with unprecedentedmonetary stimulus and a sluggish yet resolute performance from the U.S. economy. But as the threat from thecoronavirus became more apparent throughout February and March 2020, countries around the world tookeconomically disruptive countermeasures. Stay-at-home orders and closures of non-essential businessesbecame widespread, many workers were laid off, and unemployment claims spiked, causing a globalrecession and a sharp fall in equity prices.
After markets hit their lowest point of the reporting period in late March 2020, a steady recovery ensued, asbusinesses began to re-open and governments learned to adapt to life with the virus. Equity prices continuedto rise throughout the summer, fed by strong fiscal and monetary support and improving economic indicators.Many equity indices neared or surpassed all-time highs in November 2020 following a series of successfulvaccine trials. In the United States, both large- and small-capitalization stocks posted a significant advance.International equities from developed economies grew at a more modest pace, significantly lagging emergingmarket stocks, which rebounded sharply.
During the market downturn, the performance of different types of fixed-income securities initially diverged dueto a reduced investor appetite for risk. U.S. Treasuries benefited from the risk-off environment, and postedsolid returns, as the 10-year U.S. Treasury yield (which is inversely related to bond prices) touched an all-timelow. In the corporate bond market, support from the U.S. Federal Reserve (the “Fed”) assuaged creditconcerns and both investment-grade and high-yield bonds recovered to post positive returns.
The Fed took an accommodative monetary stance in late 2019 to support slowing economic growth. After thecoronavirus outbreak, the Fed instituted two emergency interest rate cuts, pushing short-term interest ratesclose to zero. To stabilize credit markets, the Fed also implemented a new bond-buying program, as didseveral other central banks around the world, including the European Central Bank and the Bank of Japan.
Looking ahead, while coronavirus-related disruptions have clearly hindered worldwide economic growth, webelieve that the global expansion is likely to accelerate as vaccination efforts get under way. Inflation shouldincrease as the growth accelerates, but a shift in central bank policy means that moderate inflation is less likelyto be followed by interest rate hikes that could threaten the equity expansion.
Overall, we favor a positive stance toward risk, with an overweight in both equities and credit. We see U.S. andAsian equities benefiting from structural growth trends in tech, while emerging markets should be particularlyhelped by a vaccine-led economic expansion. In credit, rising inflation should provide tailwinds for inflation-protected bonds, and global high-yield and Asian bonds also provide attractive opportunities. We believe thatinternational diversification and a focus on sustainability can help provide portfolio resilience, and thedisruption created by the coronavirus appears to be accelerating the shift toward sustainable investments.
In this environment, our view is that investors need to think globally, extend their scope across a broad array ofasset classes, and be nimble as market conditions change. We encourage you to talk with your financialadvisor and visit blackrock.com for further insight about investing in today’s markets.
Sincerely,
Rob KapitoPresident, BlackRock Advisors, LLC
Total Returns as of November 30, 2020
6-Month 12-Month
U.S. large cap equities(S&P 500� Index)
19.98% 17.46%
U.S. small cap equities(Russell 2000� Index)
31.36 13.59
International equities(MSCI Europe, Australasia,Far East Index)
20.16 6.37
Emerging marketequities (MSCI EmergingMarkets Index)
31.14 18.43
3-month Treasury bills(ICE BofA 3-Month U.S.Treasury Bill Index)
0.07 0.80
U.S. Treasury securities(ICE BofA 10-Year U.S.Treasury Index)
(1.31) 10.09
U.S. investment gradebonds (Bloomberg BarclaysU.S. Aggregate Bond Index)
1.79 7.28
Tax-exempt municipalbonds (S&P MunicipalBond Index)
3.12 4.68
U.S. high yield bonds(Bloomberg Barclays U.S.Corporate High Yield 2%Issuer Capped Index)
10.30 7.17
Past performance is not an indication of future results. Indexperformance is shown for illustrative purposes only. Youcannot invest directly in an index.
The Markets in Review
Rob KapitoPresident, BlackRock Advisors, LLC
2 T H I S P A G E I S N O T P A R T O F Y O U R F U N D R E P O R T

Page
The Markets in Review ............................................................................................................................................................ 2Semi-Annual Report:Fund Summary ................................................................................................................................................................... 4About Fund Performance .......................................................................................................................................................... 6Disclosure of Expenses ........................................................................................................................................................... 6Derivative Financial Instruments ................................................................................................................................................... 6Consolidated Financial Statements:
Consolidated Schedule of Investments .......................................................................................................................................... 7Consolidated Statement of Assets and Liabilities ................................................................................................................................. 15Consolidated Statement of Operations ........................................................................................................................................... 17Consolidated Statements of Changes in Net Assets .............................................................................................................................. 18
Consolidated Financial Highlights .................................................................................................................................................. 19Notes to Consolidated Financial Statements ........................................................................................................................................ 23Statement Regarding Liquidity Risk Management Program .......................................................................................................................... 33Additional Information ............................................................................................................................................................. 34Glossary of Terms Used in this Report ............................................................................................................................................. 36
Table of Contents
3

Investment Objective
BlackRock Commodity Strategies Fund’s (the “Fund”) investment objective is to seek total return.
Portfolio Management Commentary
How did the Fund perform?For the six-month reporting period that ended on November 30, 2020, the Fund underperformed its benchmark, the Bloomberg Commodity Index Total ReturnSM.
What factors influenced performance?Commodity prices rose during the past six months. The gradual re-opening of the world economy, together with the November 2020 announcements that several COVID-19 vaccines were on the way, led to a meaningful improvement in the demand outlook. Commodity-related equities also delivered a robust gain, with the best performanceoccurring from late October onward.
The Fund invests in both commodity futures and natural resources stocks. In comparison, the benchmark consists entirely of commodity futures.
Part of the Fund’s strategy is to employ derivatives by investing in commodity futures through total return swaps, using an enhanced index approach. Approximately 50% of theportfolio was invested in commodity total return swaps. The Fund’s use of derivatives had a positive impact on Fund performance.
Among the Fund’s equity holdings, chicken producer Pilgrims Pride Corp. was one of the largest detractors. The company was negatively impacted by continued softness indemand from restaurants and other large food-service providers. A position in Exxon Mobil Corp. also detracted. Consistent with trends across the broader, shares of Exxonlost ground in the June-October time frame amid concerns about the outlook for the sector as a whole.
On the positive side, Vale SA was among the Fund’s top performers. The stock benefited from strength in the price of iron ore, the outperformance of the broader Brazilianmarket in November, and the broader “global reflation trade.” The Fund’s holdings in copper companies, such as Freeport-McMoRan, Inc., were also boosted by the reflationtheme as investors gained confidence in the economic outlook for 2021. CF Industries Holdings, Inc. was another leading contributor. The stock performed strongly due torising crop prices and improving sentiment regarding upstream agriculture companies.
Describe recent portfolio activity.The Fund decreased its allocation to the agriculture/livestock and precious metals sub-sectors following a period of strong returns for both areas. On the other end of thespectrum, the Fund reduced its weightings in energy and mining.
The Fund maintained a position in cash and cash equivalents, predominantly comprised of U.S. Treasury bills, as collateral against its position in commodity total return swaps.The cash balance did not have any material impact on Fund results.
Describe portfolio positioning at period end.The Fund‘s largest equity position was in the agriculture/livestock sector, followed by energy, industrial metals, and precious metals, respectively.
The views expressed reflect the opinions of BlackRock as of the date of this report and are subject to change based on changes in market, economic or other conditions. Theseviews are not intended to be a forecast of future events and are no guarantee of future results.
Fund Summary as of November 30, 2020 BlackRock Commodity Strategies Fund
4 2 0 2 0 B L A C K R O C K S E M I - A N N U A L R E P O R T T O S H A R E H O L D E R S

Performance Summary for the Period Ended November 30, 2020Average Annual Total Returns(a)(b)
1 Year 5 Years Since Inception(c)
6-MonthTotal
Returns
WithoutSales
Charge
WithSales
Charge
WithoutSales
Charge
WithSales
Charge
WithoutSales
Charge
WithSales
Charge
Institutional . . . . . . . . . . . . . . . . . . . . . . . . . . . . . . . . . . . . . . . . . . . . . . . . . . . . . . . . . . . . . . . . . . . . . . . . . . . . . 15.61% 5.57% N/A 4.06% N/A (2.46)% N/AInvestor A . . . . . . . . . . . . . . . . . . . . . . . . . . . . . . . . . . . . . . . . . . . . . . . . . . . . . . . . . . . . . . . . . . . . . . . . . . . . . . 15.49 5.36 (0.18)% 3.83 2.71% (2.67) (3.24)%Investor C . . . . . . . . . . . . . . . . . . . . . . . . . . . . . . . . . . . . . . . . . . . . . . . . . . . . . . . . . . . . . . . . . . . . . . . . . . . . . . 15.16 4.55 3.55 3.06 3.06 (3.30) (3.30)Class K . . . . . . . . . . . . . . . . . . . . . . . . . . . . . . . . . . . . . . . . . . . . . . . . . . . . . . . . . . . . . . . . . . . . . . . . . . . . . . . . 15.61 5.64 N/A 4.11 N/A (2.43) N/A
Bloomberg Commodity Index Total ReturnSM(d) . . . . . . . . . . . . . . . . . . . . . . . . . . . . . . . . . . . . . . . . 17.11 (3.06) N/A (0.57) N/A (6.08) N/A
(a) Assuming maximum sales charges, if any. Average annual total returns with and without sales charges reflect reductions for distribution and service fees. See “About FundPerformance” for a detailed description of share classes, including any related sales charges and fees, and how performance was calculated for certain share classes.
(b) The Fund utilizes two strategies and under normal circumstances expects to invest approximately 50% of its total assets in each strategy; provided, however, that from time to time, Fundmanagement may alter the weightings if it deems it prudent to do so based on market conditions, trends or movements or other similar factors.
(c) The Fund commenced operations on October 3, 2011.(d) An index composed of futures contracts and reflects the returns on a fully collateralized investment in the Bloomberg Commodity Index (“BCOM”). This combines the returns of the
BCOM with the returns on cash collateral invested in 13 week (3 Month) U.S. Treasury Bills. Prior to July 1, 2014, the Bloomberg Commodity Index Total ReturnSM was known as the DowJones-UBS Commodity Index Total ReturnSM.
N/A - Not applicable as share class and index do not have a sales charge.Past performance is not an indication of future results.Performance results may include adjustments made for financial reporting purposes in accordance with U.S. generally accepted accounting principles.
Expense ExampleActual Hypothetical(a)
BeginningAccount Value
(06/01/20)
EndingAccount Value
(11/30/20)
ExpensesPaid During
the Period(b)
BeginningAccount Value
(06/01/20)
EndingAccount Value
(11/30/20)
ExpensesPaid During
the Period(b)
AnnualizedExpense
Ratio
Institutional . . . . . . . . . . . . . . . . . . . . . . . . . . . . . . . . . . . . . . . . . . . . . . . $ 1,000.00 $ 1,156.10 $ 3.89 $ 1,000.00 $ 1,021.46 $ 3.65 0.72%Investor A. . . . . . . . . . . . . . . . . . . . . . . . . . . . . . . . . . . . . . . . . . . . . . . . . 1,000.00 1,154.90 5.24 1,000.00 1,020.20 4.91 0.97Investor C . . . . . . . . . . . . . . . . . . . . . . . . . . . . . . . . . . . . . . . . . . . . . . . . 1,000.00 1,151.60 9.28 1,000.00 1,016.44 8.69 1.72Class K . . . . . . . . . . . . . . . . . . . . . . . . . . . . . . . . . . . . . . . . . . . . . . . . . . . 1,000.00 1,156.10 3.62 1,000.00 1,021.71 3.40 0.67
(a) Hypothetical 5% annual return before expenses is calculated by prorating the number of days in the most recent fiscal half year divided by 365.(b) For each class of the Fund, expenses are equal to the annualized expense ratio for the class, multiplied by the average account value over the period, multiplied by 183/365 (to reflect
the one-half year period shown).
See “Disclosure of Expenses” for further information on how expenses were calculated.
Portfolio Information
TEN LARGEST HOLDINGS
Security(a)
Percent ofNet Assets
Chevron Corp. . . . . . . . . . . . . . . . . . . . . . . . . . . . . . . . . . . . . . . . . . . . . . . . . . . . . . . . . . . . . 2%Royal Dutch Shell PLC, A Shares . . . . . . . . . . . . . . . . . . . . . . . . . . . . . . . . . . . . . . . . . . 1Newmont Corp. . . . . . . . . . . . . . . . . . . . . . . . . . . . . . . . . . . . . . . . . . . . . . . . . . . . . . . . . . . . 1TOTAL SE . . . . . . . . . . . . . . . . . . . . . . . . . . . . . . . . . . . . . . . . . . . . . . . . . . . . . . . . . . . . . . . . 1Barrick Gold Corp.. . . . . . . . . . . . . . . . . . . . . . . . . . . . . . . . . . . . . . . . . . . . . . . . . . . . . . . . . 1Rio Tinto PLC . . . . . . . . . . . . . . . . . . . . . . . . . . . . . . . . . . . . . . . . . . . . . . . . . . . . . . . . . . . . . 1BHP Group PLC. . . . . . . . . . . . . . . . . . . . . . . . . . . . . . . . . . . . . . . . . . . . . . . . . . . . . . . . . . . 1FMC Corp. . . . . . . . . . . . . . . . . . . . . . . . . . . . . . . . . . . . . . . . . . . . . . . . . . . . . . . . . . . . . . . . . 1Freeport-McMoRan, Inc. . . . . . . . . . . . . . . . . . . . . . . . . . . . . . . . . . . . . . . . . . . . . . . . . . . . 1BP PLC . . . . . . . . . . . . . . . . . . . . . . . . . . . . . . . . . . . . . . . . . . . . . . . . . . . . . . . . . . . . . . . . . . . 1
SECTOR ALLOCATION
Sector(b)
Percent ofNet Assets
Materials . . . . . . . . . . . . . . . . . . . . . . . . . . . . . . . . . . . . . . . . . . . . . . . . . . . . . . . . . . . . . . . . . . 21%Energy. . . . . . . . . . . . . . . . . . . . . . . . . . . . . . . . . . . . . . . . . . . . . . . . . . . . . . . . . . . . . . . . . . . . 13Consumer Staples. . . . . . . . . . . . . . . . . . . . . . . . . . . . . . . . . . . . . . . . . . . . . . . . . . . . . . . . . 10Consumer Discretionary . . . . . . . . . . . . . . . . . . . . . . . . . . . . . . . . . . . . . . . . . . . . . . . . . . . 3Industrials. . . . . . . . . . . . . . . . . . . . . . . . . . . . . . . . . . . . . . . . . . . . . . . . . . . . . . . . . . . . . . . . . 2Short-Term Securities. . . . . . . . . . . . . . . . . . . . . . . . . . . . . . . . . . . . . . . . . . . . . . . . . . . . . . 49Other Assets Less Liabilities . . . . . . . . . . . . . . . . . . . . . . . . . . . . . . . . . . . . . . . . . . . . . . . 2
(a) Excludes short-term securities.(b) For Fund compliance purposes, the Fund’s sector classifications refer to one or more of the sector sub-classifications used by one or more widely recognized market indexes or ratings group
indexes, and/or as defined by the investment adviser. These definitions may not apply for purposes of this report, which may combine such sector subclassifications for reporting ease.
Fund Summary as of November 30, 2020 (continued) BlackRock Commodity Strategies Fund
F U N D S U M M A R Y 5

About Fund Performance
Institutional and Class K Shares are not subject to any sales charge. These shares bear no ongoing distribution or service fees and are available only to certain eligibleinvestors. Class K Shares performance shown prior to the Class K Shares inception date of January 25, 2018 is that of Institutional Shares. The performance of the Fund’sClass K Shares would be substantially similar to Institutional Shares because Class K Shares and Institutional Shares invest in the same portfolio of securities andperformance would only differ to the extent that Class K Shares and Institutional Shares have different expenses. The actual returns of Class K Shares would have been higherthan those of the Institutional Shares because Class K Shares have lower expenses than the Institutional Shares.
Investor A Shares are subject to a maximum initial sales charge (front-end load) of 5.25% and a service fee of 0.25% per year (but no distribution fee). Certain redemptionsof these shares may be subject to a contingent deferred sales charge (“CDSC”) where no initial sales charge was paid at the time of purchase. These shares are generallyavailable through financial intermediaries.
Investor C Shares are subject to a 1.00% CDSC if redeemed within one year of purchase. In addition, these shares are subject to a distribution fee of 0.75% per year and aservice fee of 0.25% per year. These shares are generally available through financial intermediaries. These shares automatically convert to Investor A Shares afterapproximately eight years.
Past performance is not an indication of future results. Financial markets have experienced extreme volatility and trading in many instruments has been disrupted. Thesecircumstances may continue for an extended period of time, and may continue to affect adversely the value and liquidity of the fund’s investments. As a result, currentperformance may be lower or higher than the performance data quoted. Refer to blackrock.com to obtain performance data current to the most recent month-end.Performance results do not reflect the deduction of taxes that a shareholder would pay on Fund distributions or the redemption of Fund shares. Figures shown in theperformance table on the previous page assume reinvestment of all distributions, if any, at net asset value (“NAV”) on the ex-dividend date or payable date, as applicable.Investment return and principal value of shares will fluctuate so that shares, when redeemed, may be worth more or less than their original cost. Distributions paid to each classof shares will vary because of the different levels of service, distribution and transfer agency fees applicable to each class, which are deducted from the income available to bepaid to shareholders.
BlackRock Advisors, LLC (the “Manager”), the Fund’s investment adviser, has contractually and/or voluntarily agreed to waive and/or reimburse a portion of the Fund’sexpenses. Without such waiver and/or reimbursement, the Fund’s performance would have been lower. With respect to the Fund’s voluntary waivers, if any, the Manager isunder no obligation to waive and/or reimburse or to continue waiving and/or reimbursing its fees and such voluntary waivers may be reduced or discontinued at any time. Withrespect to the Fund’s contractual waivers, if any, the Manager is under no obligation to continue waiving and/or reimbursing its fees after the applicable termination date of suchagreement. See the Notes to Consolidated Financial Statements for additional information on waivers and/or reimbursements.
Disclosure of ExpensesShareholders of the Fund may incur the following charges: (a) transactional expenses, such as sales charges; and (b) operating expenses, including investment advisory fees,administration fees, service and distribution fees, including 12b-1 fees, acquired fund fees and expenses, and other fund expenses. The expense example shown on theprevious page (which is based on a hypothetical investment of $1,000 invested on June 1, 2020 and held through November 30, 2020) is intended to assist shareholders bothin calculating expenses based on an investment in the Fund and in comparing these expenses with similar costs of investing in other mutual funds.
The expense example provides information about actual account values and actual expenses. In order to estimate the expenses a shareholder paid during the period coveredby this report, shareholders can divide their account value by $1,000 and then multiply the result by the number corresponding to their share class under the heading entitled“Expenses Paid During the Period.”
The expense example also provides information about hypothetical account values and hypothetical expenses based on the Fund’s actual expense ratio and an assumed rateof return of 5% per year before expenses. In order to assist shareholders in comparing the ongoing expenses of investing in the Fund and other funds, compare the 5%hypothetical example with the 5% hypothetical examples that appear in shareholder reports of other funds.
The expenses shown in the expense example are intended to highlight shareholders’ ongoing costs only and do not reflect transactional expenses, such as sales charges, ifany. Therefore, the hypothetical example is useful in comparing ongoing expenses only, and will not help shareholders determine the relative total expenses of owning differentfunds. If these transactional expenses were included, shareholder expenses would have been higher.
Derivative Financial InstrumentsThe Fund may invest in various derivative financial instruments. These instruments are used to obtain exposure to a security, commodity, index, market, and/or other assetswithout owning or taking physical custody of securities, commodities and/or other referenced assets or to manage market, equity, credit, interest rate, foreign currencyexchange rate, commodity and/or other risks. Derivative financial instruments may give rise to a form of economic leverage and involve risks, including the imperfectcorrelation between the value of a derivative financial instrument and the underlying asset, possible default of the counterparty to the transaction or illiquidity of the instrument.The Fund’s successful use of a derivative financial instrument depends on the investment adviser’s ability to predict pertinent market movements accurately, which cannot beassured. The use of these instruments may result in losses greater than if they had not been used, may limit the amount of appreciation the Fund can realize on an investmentand/or may result in lower distributions paid to shareholders. The Fund’s investments in these instruments, if any, are discussed in detail in the Notes to Consolidated FinancialStatements.
6 2 0 2 0 B L A C K R O C K S E M I - A N N U A L R E P O R T T O S H A R E H O L D E R S

Security Shares Value
Common Stocks
Biotechnology — 0.1%Hofseth BioCare ASA(a) . . . . . . . . . . . . . . . . . . . . . . . . . . . . . . . 271,244 $ 250,025
Capital Markets — 0.2%Agronomics Ltd.(a) . . . . . . . . . . . . . . . . . . . . . . . . . . . . . . . . . . . . 4,000,000 378,615
Chemicals — 3.9%CF Industries Holdings, Inc. . . . . . . . . . . . . . . . . . . . . . . . . . . . 41,340 1,541,982FMC Corp. . . . . . . . . . . . . . . . . . . . . . . . . . . . . . . . . . . . . . . . . . . . 17,131 1,987,367Koninklijke DSM NV . . . . . . . . . . . . . . . . . . . . . . . . . . . . . . . . . . 10,501 1,714,683Nutrien Ltd.. . . . . . . . . . . . . . . . . . . . . . . . . . . . . . . . . . . . . . . . . . . 16,426 809,309Robertet SA . . . . . . . . . . . . . . . . . . . . . . . . . . . . . . . . . . . . . . . . . . 1,129 1,214,749Symrise AG . . . . . . . . . . . . . . . . . . . . . . . . . . . . . . . . . . . . . . . . . . 12,773 1,600,951
8,869,041
Containers & Packaging — 0.9%Graphic Packaging Holding Co. . . . . . . . . . . . . . . . . . . . . . . . 78,540 1,203,233Westrock Co. . . . . . . . . . . . . . . . . . . . . . . . . . . . . . . . . . . . . . . . . . 22,339 942,929
2,146,162
Energy Equipment & Services — 0.5%Baker Hughes Co. . . . . . . . . . . . . . . . . . . . . . . . . . . . . . . . . . . . . 27,550 515,736Schlumberger NV. . . . . . . . . . . . . . . . . . . . . . . . . . . . . . . . . . . . . 25,482 529,771
1,045,507
Food & Staples Retailing — 2.4%Costco Wholesale Corp. . . . . . . . . . . . . . . . . . . . . . . . . . . . . . . 4,068 1,593,720Grocery Outlet Holding Corp.(a) . . . . . . . . . . . . . . . . . . . . . . . . 41,955 1,620,302Kroger Co. . . . . . . . . . . . . . . . . . . . . . . . . . . . . . . . . . . . . . . . . . . . 31,534 1,040,622Total Produce PLC. . . . . . . . . . . . . . . . . . . . . . . . . . . . . . . . . . . . 665,422 1,122,215
5,376,859
Food Products — 5.9%Bunge Ltd. . . . . . . . . . . . . . . . . . . . . . . . . . . . . . . . . . . . . . . . . . . . 23,038 1,356,708Calavo Growers, Inc.. . . . . . . . . . . . . . . . . . . . . . . . . . . . . . . . . . 15,794 1,131,324Cranswick PLC . . . . . . . . . . . . . . . . . . . . . . . . . . . . . . . . . . . . . . . 18,345 836,027Darling Ingredients, Inc.(a) . . . . . . . . . . . . . . . . . . . . . . . . . . . . . 34,460 1,663,729Freshpet, Inc.(a). . . . . . . . . . . . . . . . . . . . . . . . . . . . . . . . . . . . . . . 4,603 630,058Gruma SAB de CV, Class B . . . . . . . . . . . . . . . . . . . . . . . . . . . 112,133 1,239,440Hormel Foods Corp. . . . . . . . . . . . . . . . . . . . . . . . . . . . . . . . . . . 12,927 609,896Kerry Group PLC, Class A. . . . . . . . . . . . . . . . . . . . . . . . . . . . . 10,956 1,536,230Laird Superfood, Inc.(a)(b). . . . . . . . . . . . . . . . . . . . . . . . . . . . . . 5,824 281,940Maple Leaf Foods, Inc.. . . . . . . . . . . . . . . . . . . . . . . . . . . . . . . . 55,882 1,138,982Nestlé SA, Registered Shares . . . . . . . . . . . . . . . . . . . . . . . . . 15,642 1,752,131Salmar ASA(a) . . . . . . . . . . . . . . . . . . . . . . . . . . . . . . . . . . . . . . . . 20,163 1,102,170
13,278,635
Hotels, Restaurants & Leisure — 0.7%Restaurant Brands International, Inc. . . . . . . . . . . . . . . . . . . 26,198 1,492,238
Internet & Direct Marketing Retail — 1.6%Delivery Hero SE(a)(c) . . . . . . . . . . . . . . . . . . . . . . . . . . . . . . . . . 5,227 635,536HelloFresh SE(a) . . . . . . . . . . . . . . . . . . . . . . . . . . . . . . . . . . . . . . 17,714 1,045,343Meituan, Class B(a) . . . . . . . . . . . . . . . . . . . . . . . . . . . . . . . . . . . 13,900 519,810Ocado Group PLC(a) . . . . . . . . . . . . . . . . . . . . . . . . . . . . . . . . . . 19,277 566,767THG Holdings PLC(a) . . . . . . . . . . . . . . . . . . . . . . . . . . . . . . . . . 109,379 916,908
3,684,364
Machinery — 1.6%Ag Growth International, Inc. . . . . . . . . . . . . . . . . . . . . . . . . . . 48,501 1,165,563Deere & Co. . . . . . . . . . . . . . . . . . . . . . . . . . . . . . . . . . . . . . . . . . . 4,664 1,220,196Marel HF . . . . . . . . . . . . . . . . . . . . . . . . . . . . . . . . . . . . . . . . . . . . . 242,448 1,229,117
3,614,876
Metals & Mining — 16.3%Agnico Eagle Mines Ltd. . . . . . . . . . . . . . . . . . . . . . . . . . . . . . . 11,764 770,951Alamos Gold, Inc., Class A . . . . . . . . . . . . . . . . . . . . . . . . . . . . 5,056 41,851
Security Shares Value
Metals & Mining (continued)Anglo American PLC. . . . . . . . . . . . . . . . . . . . . . . . . . . . . . . . . . 57,110 $ 1,663,034AngloGold Ashanti Ltd., ADR . . . . . . . . . . . . . . . . . . . . . . . . . . 2,178 47,197ArcelorMittal SA(a) . . . . . . . . . . . . . . . . . . . . . . . . . . . . . . . . . . . . 24,657 448,351B2Gold Corp.. . . . . . . . . . . . . . . . . . . . . . . . . . . . . . . . . . . . . . . . . 94,251 525,431Barrick Gold Corp. . . . . . . . . . . . . . . . . . . . . . . . . . . . . . . . . . . . . 117,190 2,711,777Bellevue Gold Ltd.(a) . . . . . . . . . . . . . . . . . . . . . . . . . . . . . . . . . . 70,698 68,049BHP Group PLC . . . . . . . . . . . . . . . . . . . . . . . . . . . . . . . . . . . . . . 89,216 2,017,233BlueScope Steel Ltd. . . . . . . . . . . . . . . . . . . . . . . . . . . . . . . . . . 44,417 555,766Centamin PLC. . . . . . . . . . . . . . . . . . . . . . . . . . . . . . . . . . . . . . . . 96,839 146,702Centerra Gold, Inc. . . . . . . . . . . . . . . . . . . . . . . . . . . . . . . . . . . . 45,083 440,173Deterra Royalties Ltd.(a) . . . . . . . . . . . . . . . . . . . . . . . . . . . . . . . 29,055 98,108Dundee Precious Metals, Inc. . . . . . . . . . . . . . . . . . . . . . . . . . 11,219 73,428Eldorado Gold Corp.(a)(b) . . . . . . . . . . . . . . . . . . . . . . . . . . . . . . 8,189 96,630Endeavour Mining Corp.(a) . . . . . . . . . . . . . . . . . . . . . . . . . . . . 18,968 447,363Equinox Gold Corp.(a) . . . . . . . . . . . . . . . . . . . . . . . . . . . . . . . . . 7,070 69,845ERO Copper Corp.(a) . . . . . . . . . . . . . . . . . . . . . . . . . . . . . . . . . 13,916 238,738Evolution Mining Ltd.. . . . . . . . . . . . . . . . . . . . . . . . . . . . . . . . . . 146,188 533,409First Quantum Minerals Ltd. . . . . . . . . . . . . . . . . . . . . . . . . . . . 73,138 1,037,910Fortescue Metals Group Ltd. . . . . . . . . . . . . . . . . . . . . . . . . . . 60,413 804,858Franco-Nevada Corp. . . . . . . . . . . . . . . . . . . . . . . . . . . . . . . . . . 6,420 854,566Freeport-McMoRan, Inc. . . . . . . . . . . . . . . . . . . . . . . . . . . . . . . 81,172 1,898,613Glencore PLC(a) . . . . . . . . . . . . . . . . . . . . . . . . . . . . . . . . . . . . . . 106,940 301,491Gold Fields Ltd., ADR . . . . . . . . . . . . . . . . . . . . . . . . . . . . . . . . . 80,211 698,638Iluka Resources Ltd. . . . . . . . . . . . . . . . . . . . . . . . . . . . . . . . . . . 29,055 114,220Impala Platinum Holdings Ltd. . . . . . . . . . . . . . . . . . . . . . . . . . 60,650 634,596Ivanhoe Mines Ltd., Class A(a) . . . . . . . . . . . . . . . . . . . . . . . . . 81,200 380,146Kinross Gold Corp. . . . . . . . . . . . . . . . . . . . . . . . . . . . . . . . . . . . 132,011 940,249Kirkland Lake Gold Ltd. . . . . . . . . . . . . . . . . . . . . . . . . . . . . . . . 22,619 926,740Lundin Mining Corp. . . . . . . . . . . . . . . . . . . . . . . . . . . . . . . . . . . 103,872 830,208Lynas Corp. Ltd.(a) . . . . . . . . . . . . . . . . . . . . . . . . . . . . . . . . . . . . 87,719 243,924Metro Mining Ltd.(a) . . . . . . . . . . . . . . . . . . . . . . . . . . . . . . . . . . . 232,175 10,737MMC Norilsk Nickel PJSC, ADR . . . . . . . . . . . . . . . . . . . . . . . 11,001 305,098Nevada Copper Corp.(a)(b). . . . . . . . . . . . . . . . . . . . . . . . . . . . . 397,646 36,743Newcrest Mining Ltd.. . . . . . . . . . . . . . . . . . . . . . . . . . . . . . . . . . 22,969 454,693Newmont Corp. . . . . . . . . . . . . . . . . . . . . . . . . . . . . . . . . . . . . . . . 56,538 3,325,565Nickel Mines Ltd. . . . . . . . . . . . . . . . . . . . . . . . . . . . . . . . . . . . . . 414,447 328,416Northam Platinum Ltd.(a) . . . . . . . . . . . . . . . . . . . . . . . . . . . . . . 29,154 331,075Northern Star Resources Ltd. . . . . . . . . . . . . . . . . . . . . . . . . . 99,558 924,643OceanaGold Corp.(a). . . . . . . . . . . . . . . . . . . . . . . . . . . . . . . . . . 36,949 46,090Osisko Gold Royalties Ltd. . . . . . . . . . . . . . . . . . . . . . . . . . . . . 8,034 87,287OZ Minerals Ltd. . . . . . . . . . . . . . . . . . . . . . . . . . . . . . . . . . . . . . . 36,143 432,728Pan American Silver Corp. . . . . . . . . . . . . . . . . . . . . . . . . . . . . 4,319 127,540Polymetal International PLC . . . . . . . . . . . . . . . . . . . . . . . . . . . 35,911 748,114Polyus PJSC, GDR . . . . . . . . . . . . . . . . . . . . . . . . . . . . . . . . . . . 4,596 434,785Pretium Resources, Inc.(a). . . . . . . . . . . . . . . . . . . . . . . . . . . . . 8,499 93,124Rio Tinto PLC . . . . . . . . . . . . . . . . . . . . . . . . . . . . . . . . . . . . . . . . 33,230 2,169,228Saracen Mineral Holdings Ltd.(a). . . . . . . . . . . . . . . . . . . . . . . 135,397 470,313Sibanye Stillwater Ltd. . . . . . . . . . . . . . . . . . . . . . . . . . . . . . . . . 170,443 567,909Sierra Metals, Inc.(a) . . . . . . . . . . . . . . . . . . . . . . . . . . . . . . . . . . 9,037 27,069Sigma Lithium Resources Corp.(a) . . . . . . . . . . . . . . . . . . . . . 122,315 243,933Skeena Resources Ltd.(a) . . . . . . . . . . . . . . . . . . . . . . . . . . . . . 9,376 17,977Sociedad Minera Cerro Verde SAA(a) . . . . . . . . . . . . . . . . . . 11,841 241,556SolGold PLC(a) . . . . . . . . . . . . . . . . . . . . . . . . . . . . . . . . . . . . . . . 321,715 148,397SSR Mining, Inc.(a). . . . . . . . . . . . . . . . . . . . . . . . . . . . . . . . . . . . 7,260 134,389SSR Mining, Inc.(a)(b). . . . . . . . . . . . . . . . . . . . . . . . . . . . . . . . . . 16,490 303,581Steel Dynamics, Inc. . . . . . . . . . . . . . . . . . . . . . . . . . . . . . . . . . . 15,886 575,232Stelco Holdings, Inc. . . . . . . . . . . . . . . . . . . . . . . . . . . . . . . . . . . 8,085 104,339Teck Resources Ltd., Class B . . . . . . . . . . . . . . . . . . . . . . . . . 38,369 606,246Teranga Gold Corp.(a) . . . . . . . . . . . . . . . . . . . . . . . . . . . . . . . . . 11,638 128,505Titan Mining Corp.(a)(b) . . . . . . . . . . . . . . . . . . . . . . . . . . . . . . . . 159,796 77,517Titan Mining Corp. (Acquired 09/22/20, cost $7,806)(d) . . 20,773 10,239Torex Gold Resources, Inc.(a). . . . . . . . . . . . . . . . . . . . . . . . . . 18,226 251,490
Consolidated Schedule of Investments (unaudited)
November 30, 2020
BlackRock Commodity Strategies Fund(Percentages shown are based on Net Assets)
C O N S O L I D A T E D S C H E D U L E O F I N V E S T M E N T S 7

Security Shares Value
Metals & Mining (continued)Vale SA, ADR . . . . . . . . . . . . . . . . . . . . . . . . . . . . . . . . . . . . . . . . 126,758 $ 1,845,596Wheaton Precious Metals Corp. . . . . . . . . . . . . . . . . . . . . . . . 16,639 642,268
36,912,617
Oil, Gas & Consumable Fuels — 12.9%Aker BP ASA . . . . . . . . . . . . . . . . . . . . . . . . . . . . . . . . . . . . . . . . . 26,697 599,444BP PLC . . . . . . . . . . . . . . . . . . . . . . . . . . . . . . . . . . . . . . . . . . . . . . 571,349 1,855,074Cairn Energy PLC(a) . . . . . . . . . . . . . . . . . . . . . . . . . . . . . . . . . . 150,678 321,201Canadian Natural Resources Ltd.. . . . . . . . . . . . . . . . . . . . . . 12,289 280,375Chevron Corp.. . . . . . . . . . . . . . . . . . . . . . . . . . . . . . . . . . . . . . . . 50,177 4,374,431CNOOC Ltd.. . . . . . . . . . . . . . . . . . . . . . . . . . . . . . . . . . . . . . . . . . 474,000 471,662Concho Resources, Inc.. . . . . . . . . . . . . . . . . . . . . . . . . . . . . . . 8,989 516,688ConocoPhillips . . . . . . . . . . . . . . . . . . . . . . . . . . . . . . . . . . . . . . . 36,785 1,455,215Enbridge, Inc. . . . . . . . . . . . . . . . . . . . . . . . . . . . . . . . . . . . . . . . . 22,174 692,521EOG Resources, Inc. . . . . . . . . . . . . . . . . . . . . . . . . . . . . . . . . . 19,792 927,849Exxon Mobil Corp. . . . . . . . . . . . . . . . . . . . . . . . . . . . . . . . . . . . . 15,586 594,294Galp Energia SGPS SA . . . . . . . . . . . . . . . . . . . . . . . . . . . . . . . 56,470 605,854Hess Corp. . . . . . . . . . . . . . . . . . . . . . . . . . . . . . . . . . . . . . . . . . . . 16,267 767,477Kinder Morgan, Inc. . . . . . . . . . . . . . . . . . . . . . . . . . . . . . . . . . . . 87,818 1,262,823Kosmos Energy Ltd. . . . . . . . . . . . . . . . . . . . . . . . . . . . . . . . . . . 218,325 384,252LUKOIL PJSC, ADR . . . . . . . . . . . . . . . . . . . . . . . . . . . . . . . . . . 4,104 264,196Lundin Energy AB . . . . . . . . . . . . . . . . . . . . . . . . . . . . . . . . . . . . 14,459 345,433Marathon Petroleum Corp. . . . . . . . . . . . . . . . . . . . . . . . . . . . . 9,515 369,943Oil Search Ltd. . . . . . . . . . . . . . . . . . . . . . . . . . . . . . . . . . . . . . . . 120,845 319,234Petroleo Brasileiro SA, ADR . . . . . . . . . . . . . . . . . . . . . . . . . . . 56,988 545,375Pioneer Natural Resources Co.. . . . . . . . . . . . . . . . . . . . . . . . 9,478 953,297Royal Dutch Shell PLC, A Shares. . . . . . . . . . . . . . . . . . . . . . 198,442 3,326,754Santos Ltd. . . . . . . . . . . . . . . . . . . . . . . . . . . . . . . . . . . . . . . . . . . . 97,077 433,901Suncor Energy, Inc. . . . . . . . . . . . . . . . . . . . . . . . . . . . . . . . . . . . 70,224 1,123,087TC Energy Corp.. . . . . . . . . . . . . . . . . . . . . . . . . . . . . . . . . . . . . . 29,794 1,310,642TOTAL SE. . . . . . . . . . . . . . . . . . . . . . . . . . . . . . . . . . . . . . . . . . . . 74,693 3,170,372Valero Energy Corp. . . . . . . . . . . . . . . . . . . . . . . . . . . . . . . . . . . 15,518 834,403Williams Cos., Inc. . . . . . . . . . . . . . . . . . . . . . . . . . . . . . . . . . . . . 53,751 1,127,696
29,233,493
Personal Products — 1.4%BellRing Brands, Inc., Class A(a)(b) . . . . . . . . . . . . . . . . . . . . . 65,589 1,338,015Jamieson Wellness, Inc. . . . . . . . . . . . . . . . . . . . . . . . . . . . . . . 62,055 1,719,211
3,057,226
Pharmaceuticals — 0.0%Sativa Wellness Group, Inc.(a) . . . . . . . . . . . . . . . . . . . . . . . . . 440,928 23,766
Specialty Retail — 0.7%Tractor Supply Co. . . . . . . . . . . . . . . . . . . . . . . . . . . . . . . . . . . . . 11,605 1,634,100
Warrants(a)(d)(e)
Metals & Mining — 0.0%Titan Mining Corp. (Issued/Exercisable, 1 Share for
1 Warrant, Expires 09/23/23, Strike Price CAD 0.75)(Acquired 09/22/20, cost $1) . . . . . . . . . . . . . . . . . . . . . . . . 10,387 —
Total Warrants — 0.0%(Cost: $1). . . . . . . . . . . . . . . . . . . . . . . . . . . . . . . . . . . . . . . . . . . . . . . . . . . . . . . . . . . . —
Total Long-Term Investments — 49.1%(Cost: $87,291,350) . . . . . . . . . . . . . . . . . . . . . . . . . . . . . . . . . . . . . . . . . . . . . . . . . . 110,997,524
Security Shares Value
Short-Term Securities
Money Market Funds — 1.8%BlackRock Liquidity Funds, T-Fund, Institutional Class,
0.00%(f)(g). . . . . . . . . . . . . . . . . . . . . . . . . . . . . . . . . . . . . . . . . . 3,112,567 $ 3,112,567SL Liquidity Series, LLC, Money Market Series,
0.18%(f)(g)(h). . . . . . . . . . . . . . . . . . . . . . . . . . . . . . . . . . . . . . . . 1,068,963 1,069,284
4,181,851
Par(000)
U.S. Treasury Obligations — 47.3%U.S. Treasury Bills
0.16%, 12/03/20(i). . . . . . . . . . . . . . . . . . . . . . . . . . . . . . . . . USD 17,000 16,999,9500.12%, 01/07/21(i). . . . . . . . . . . . . . . . . . . . . . . . . . . . . . . . . 18,000 17,998,4740.11%, 02/04/21(i) . . . . . . . . . . . . . . . . . . . . . . . . . . . . . . . . . 18,000 17,997,1560.11%, 03/04/21(i) . . . . . . . . . . . . . . . . . . . . . . . . . . . . . . . . . 18,000 17,996,0610.10%, 04/08/21(i). . . . . . . . . . . . . . . . . . . . . . . . . . . . . . . . . 18,000 17,994,2400.10%, 05/06/21(i). . . . . . . . . . . . . . . . . . . . . . . . . . . . . . . . . 18,000 17,993,078
106,978,959
Total Short-Term Securities — 49.1%(Cost: $111,156,017) . . . . . . . . . . . . . . . . . . . . . . . . . . . . . . . . . . . . . . . . . . 111,160,810
Total Investments — 98.2%(Cost: $198,447,367) . . . . . . . . . . . . . . . . . . . . . . . . . . . . . . . . . . . . . . . . . . 222,158,334
Other Assets Less Liabilities — 1.8% . . . . . . . . . . . . . . . . . . . . . . . . . . . 4,009,694
Net Assets — 100.0%. . . . . . . . . . . . . . . . . . . . . . . . . . . . . . . . . . . . . . . . . . . . $ 226,168,028
(a) Non-income producing security.(b) All or a portion of this security is on loan.(c) Security exempt from registration pursuant to Rule 144A under the Securities Act of 1933,
as amended. These securities may be resold in transactions exempt from registration toqualified institutional investors.
(d) Restricted security as to resale, excluding 144A securities. The Fund held restrictedsecurities with a current value of $10,239, representing 0.0% of its net assets as of periodend, and an original cost of $7,807.
(e) Security is valued using significant unobservable inputs and is classified as Level 3 in thefair value hierarchy.
(f) Affiliate of the Fund.(g) Annualized 7-day yield as of period end.(h) All or a portion of this security was purchased with the cash collateral from loaned
securities.(i) Rates are discount rates or a range of discount rates as of period end.
Consolidated Schedule of Investments (unaudited) (continued)
November 30, 2020
BlackRock Commodity Strategies Fund(Percentages shown are based on Net Assets)
8 2 0 2 0 B L A C K R O C K S E M I - A N N U A L R E P O R T T O S H A R E H O L D E R S

Affiliates
Investments in issuers considered to be affiliate(s) of the Fund during the six months ended November 30, 2020 for purposes of Section 2(a)(3) of the Investment CompanyAct of 1940, as amended, were as follows:
Affiliated IssuerValue at
05/31/20Purchases
at CostProceedsfrom Sale
NetRealized
Gain (Loss)
Change inUnrealized
Appreciation(Depreciation)
Value at11/30/20
SharesHeld at
11/30/20 Income
CapitalGain
Distributionsfrom Underlying
Funds
BlackRock Liquidity Funds, T-Fund,Institutional Class . . . . . . . . . . . . . . . . $ 4,663,663 $ — $ (1,551,096)(a) $ — $ — $ 3,112,567 3,112,567 $ 1,118 $ —
SL Liquidity Series, LLC, MoneyMarket Series . . . . . . . . . . . . . . . . . . . 487,626 582,608(a) — (832) (118) 1,069,284 1,068,963 4,713(b) —
$ (832) $ (118) $ 4,181,851 $ 5,831 $ —
(a) Represents net amount purchased (sold).(b) All or a portion represents securities lending income earned from the reinvestment of cash collateral from loaned securities, net of fees and collateral investment expenses, and other
payments to and from borrowers of securities.
For Fund compliance purposes, the Fund’s industry classifications refer to one or more of the industry sub-classifications used by one or more widely recognized marketindexes or rating group indexes, and/or as defined by the investment adviser. These definitions may not apply for purposes of this report, which may combine such industrysub-classifications for reporting ease.
Derivative Financial Instruments Outstanding as of Period End
OTC Total Return Swaps
Paid by the Fund Received by the Fund
CounterpartyTermination
Date
NotionalAmount
(000) Value
UpfrontPremium
Paid(Received)
UnrealizedAppreciation
(Depreciation)Rate Frequency Reference Frequency
3-month U.S.Treasury Bill,0.09%(a) At Termination BCOMRST At Termination
JPMorgan Chase BankN.A. 01/22/21 USD 23,085 $ (291,977) $ — $ (291,977)
3-month U.S.Treasury Bill,0.09%(a) At Termination BCOMRST At Termination
JPMorgan Chase BankN.A. 01/29/21 USD 1,257 29,374 — 29,374
3-month U.S.Treasury Bill,0.09%(a) At Termination BCOMINTR At Termination
Goldman SachsInternational 02/08/21 USD 970 220,458 — 220,458
3-month U.S.Treasury Bill,0.09%(a) At Termination BCOMPRTR At Termination Merrill Lynch International 02/08/21 USD 651 83,108 — 83,108
3-month U.S.Treasury Bill,0.09%(a) At Termination BCOMRENT At Termination
JPMorgan Chase BankN.A. 03/12/21 USD 1,675 60,031 — 60,031
3-month U.S.Treasury Bill,0.09%(a) At Termination BCOMRINT At Termination
JPMorgan Chase BankN.A. 03/12/21 USD 4,125 1,293,578 — 1,293,578
3-month U.S.Treasury Bill,0.09%(a) At Termination BCOMRLIT At Termination
JPMorgan Chase BankN.A. 03/12/21 USD 1,819 200,855 — 200,855
3-month U.S.Treasury Bill,0.09%(a) At Termination BCOMRPRT At Termination
JPMorgan Chase BankN.A. 03/12/21 USD 9,114 1,387,396 — 1,387,396
3-month U.S.Treasury Bill,0.09%(a) At Termination BCOMRAGT At Termination
JPMorgan Chase BankN.A. 03/12/21 USD 8,498 1,481,245 — 1,481,245
3-month U.S.Treasury Bill,0.09%(a) At Termination BCOMRENT At Termination
JPMorgan Chase BankN.A. 04/30/21 USD 1,512 189,340 — 189,340
3-month U.S.Treasury Bill,0.09%(a) At Termination BCOMRINT At Termination
JPMorgan Chase BankN.A. 04/30/21 USD 1,086 413,058 — 413,058
Consolidated Schedule of Investments (unaudited) (continued)
November 30, 2020
BlackRock Commodity Strategies Fund
C O N S O L I D A T E D S C H E D U L E O F I N V E S T M E N T S 9

OTC Total Return Swaps (continued)
Paid by the Fund Received by the Fund
CounterpartyTermination
Date
NotionalAmount
(000) Value
UpfrontPremium
Paid(Received)
UnrealizedAppreciation
(Depreciation)Rate Frequency Reference Frequency
3-month U.S.Treasury Bill,0.09%(a) At Termination BCOMRST At Termination
JPMorgan Chase BankN.A. 05/19/21 USD 998 $ 169,116 $ — $ 169,116
3-month U.S.Treasury Bill,0.09%(a) At Termination BCOMRST At Termination
JPMorgan Chase BankN.A. 05/27/21 USD 769 137,081 — 137,081
3-month U.S.Treasury Bill,0.09%(a) At Termination BCOMRST At Termination
JPMorgan Chase BankN.A. 05/28/21 USD 1,400 245,823 — 245,823
3-month U.S.Treasury Bill,0.09%(a) At Termination BCOMRENT At Termination
JPMorgan Chase BankN.A. 06/01/21 USD 1,642 162,553 — 162,553
3-month U.S.Treasury Bill,0.09%(a) At Termination BCOMRST At Termination
JPMorgan Chase BankN.A. 06/03/21 USD 917 143,580 — 143,580
3-month U.S.Treasury Bill,0.09%(a) At Termination BCOMRST At Termination
JPMorgan Chase BankN.A. 06/08/21 USD 1,622 232,583 — 232,583
3-month U.S.Treasury Bill,0.09%(a) At Termination BCOMRST At Termination
JPMorgan Chase BankN.A. 06/22/21 USD 1,574 216,246 — 216,246
3-month U.S.Treasury Bill,0.09%(a) At Termination BCOMLITR At Termination
JPMorgan Chase BankN.A. 07/01/21 USD 951 125,554 — 125,554
3-month U.S.Treasury Bill,0.09%(a) At Termination BCOMENTR At Termination
JPMorgan Chase BankN.A. 07/01/21 USD 4,247 322,425 — 322,425
3-month U.S.Treasury Bill,0.09%(a) At Termination BCOMAGTR At Termination
JPMorgan Chase BankN.A. 07/01/21 USD 4,276 871,608 — 871,608
3-month U.S.Treasury Bill,0.09%(a) At Termination BCOMRENT At Termination
JPMorgan Chase BankN.A. 07/01/21 USD 1,159 59,032 — 59,032
3-month U.S.Treasury Bill,0.09%(a) At Termination BCOMINTR At Termination
JPMorgan Chase BankN.A. 07/01/21 USD 2,112 557,833 — 557,833
3-month U.S.Treasury Bill,0.09%(a) At Termination BCOMRINT At Termination
JPMorgan Chase BankN.A. 07/01/21 USD 288 74,332 — 74,332
3-month U.S.Treasury Bill,0.09%(a) At Termination BCOMPRTR At Termination
JPMorgan Chase BankN.A. 07/01/21 USD 3,942 108,272 — 108,272
3-month U.S.Treasury Bill,0.09%(a) At Termination BCOMTR At Termination
JPMorgan Chase BankN.A. 07/12/21 USD 1,135 131,292 — 131,292
3-month U.S.Treasury Bill,0.09%(a) At Termination BCOMTR At Termination
JPMorgan Chase BankN.A. 07/13/21 USD 1,099 129,777 — 129,777
3-month U.S.Treasury Bill,0.09%(a) At Termination BCOMRST At Termination
Goldman SachsInternational 08/02/21 USD 503 37,017 — 37,017
3-month U.S.Treasury Bill,0.09%(a) At Termination BCOMTR At Termination
Goldman SachsInternational 08/06/21 USD 1,002 42,160 — 42,160
3-month U.S.Treasury Bill,0.09%(a) At Termination BCOMTR At Termination
Goldman SachsInternational 08/13/21 USD 1,228 60,785 — 60,785
3-month U.S.Treasury Bill,0.09%(a) At Termination BCOMRST At Termination
Goldman SachsInternational 08/25/21 USD 1,026 36,557 — 36,557
Consolidated Schedule of Investments (unaudited) (continued)
November 30, 2020
BlackRock Commodity Strategies Fund
10 2 0 2 0 B L A C K R O C K S E M I - A N N U A L R E P O R T T O S H A R E H O L D E R S

OTC Total Return Swaps (continued)
Paid by the Fund Received by the Fund
CounterpartyTermination
Date
NotionalAmount
(000) Value
UpfrontPremium
Paid(Received)
UnrealizedAppreciation
(Depreciation)Rate Frequency Reference Frequency
3-month U.S.Treasury Bill,0.09%(a) At Termination BCOMRST At Termination
Goldman SachsInternational 08/31/21 USD 2,080 $ 40,298 $ — $ 40,298
3-month U.S.Treasury Bill,0.09%(a) At Termination BCOMRENT At Termination
Goldman SachsInternational 09/01/21 USD 1,528 (71,995) — (71,995)
3-month U.S.Treasury Bill,0.09%(a) At Termination BCOMRST At Termination Citibank N.A. 09/03/21 USD 1,986 52,731 — 52,731
3-month U.S.Treasury Bill,0.09%(a) At Termination BCOMRINT At Termination
JPMorgan Chase BankN.A. 09/24/21 USD 865 133,899 — 133,899
3-month U.S.Treasury Bill,0.09%(a) At Termination BCOMRENT At Termination
JPMorgan Chase BankN.A. 09/24/21 USD 1,119 (17,224) — (17,224)
3-month U.S.Treasury Bill,0.09%(a) At Termination BCOMRPRT At Termination
Goldman SachsInternational 09/30/21 USD 395 (24,353) — (24,353)
3-month U.S.Treasury Bill,0.09%(a) At Termination BCOMRST At Termination Citibank N.A. 10/25/21 USD 1,366 18,375 — 18,375
3-month U.S.Treasury Bill,0.09%(a) At Termination BCOMRST At Termination
Goldman SachsInternational 11/05/21 USD 1,008 14,768 — 14,768
3-month U.S.Treasury Bill,0.09%(a) At Termination BCOMRST At Termination
Goldman SachsInternational 11/08/21 USD 997 17,847 — 17,847
3-month U.S.Treasury Bill,0.09%(a) At Termination BCOMRENT At Termination
Goldman SachsInternational 11/09/21 USD 1,547 52,361 — 52,361
3-month U.S.Treasury Bill,0.09%(a) At Termination BCOMRST At Termination
Morgan Stanley & Co.International PLC 11/23/21 USD 1,000 2,255 — 2,255
$ 9,149,054 $ — $ 9,149,054
(a) All or a portion of the security is held by a wholly-owned subsidiary. See Note 1 of the Notes to Consolidated Financial Statements for details on the wholly-owned subsidiary.
Balances Reported in the Consolidated Statement of Assets and Liabilities for OTC Swaps
SwapsPremiums
Paid
SwapPremiumsReceived
UnrealizedAppreciation
UnrealizedDepreciation
OTC Swaps . . . . . . . . . . . . . . . . . . . . . . . . . . . . . . . . . . . . . . . . . . . . . . . . . . . . . . . . . . . . . . . . . . . . . . . . . . . . . . . . . . . . . . . . . . . . . . . . . . . $ — $ — $ 9,554,603 $ (405,549)
Consolidated Schedule of Investments (unaudited) (continued)
November 30, 2020
BlackRock Commodity Strategies Fund
C O N S O L I D A T E D S C H E D U L E O F I N V E S T M E N T S 11

Derivative Financial Instruments Categorized by Risk Exposure
As of period end, the fair values of derivative financial instruments located in the Consolidated Statement of Assets and Liabilities were as follows:
CommodityContracts
CreditContracts
EquityContracts
ForeignCurrency
ExchangeContracts
InterestRate
ContractsOther
Contracts Total
Assets — Derivative Financial InstrumentsSwaps — OTC
Unrealized appreciation on OTC swaps;Swap premiums paid . . . . . . . . . . . . . . . . . . . . . . . . . . . . . . . . . . . . . . . . $ 9,554,603 $ — $ — $ — $ — $ — $ 9,554,603
Liabilities — Derivative Financial InstrumentsSwaps — OTC
Unrealized depreciation on OTC swaps;Swap premiums received . . . . . . . . . . . . . . . . . . . . . . . . . . . . . . . . . . . . $ 405,549 $ — $ — $ — $ — $ — $ 405,549
For the six months ended November 30, 2020, the effect of derivative financial instruments in the Consolidated Statement of Operations was as follows:
CommodityContracts
CreditContracts
EquityContracts
ForeignCurrency
ExchangeContracts
InterestRate
ContractsOther
Contracts Total
Net Realized Gain (Loss) fromSwaps. . . . . . . . . . . . . . . . . . . . . . . . . . . . . . . . . . . . . . . . . . . . . . . . . . . . . . . . . $ 485,491 $ — $ — $ — $ — $ — $ 485,491
Net Change in Unrealized Appreciation (Depreciation) onSwaps. . . . . . . . . . . . . . . . . . . . . . . . . . . . . . . . . . . . . . . . . . . . . . . . . . . . . . . . . $ 13,108,827 $ — $ — $ — $ — $ — $ 13,108,827
Average Quarterly Balances of Outstanding Derivative Financial Instruments
Total return swapsAverage notional amount . . . . . . . . . . . . . . . . . . . . . . . . . . . . . . . . . . . . . . . . . . . . . . . . . . . . . . . . . . . . . . . . . . . . . . . . . . . . . . . . . . . . . . . . . . . . . . . . . . . . . . . . . . . . . . . . . . . . . . . . . . . . . . . . . . . . . . $98,014,271
For more information about the Fund’s investment risks regarding derivative financial instruments, refer to the Notes to Consolidated Financial Statements.
Derivative Financial Instruments – Offsetting as of Period End
The Fund’s derivative assets and liabilities (by type) were as follows:
Assets Liabilities
Derivative Financial InstrumentsSwaps — OTC(a) . . . . . . . . . . . . . . . . . . . . . . . . . . . . . . . . . . . . . . . . . . . . . . . . . . . . . . . . . . . . . . . . . . . . . . . . . . . . . . . . . . . . . . . . . . . . . . . . . . . . . . . . . . . . . . . . . . . . . . . . . . . $ 9,554,603 $ 405,549
Total derivative assets and liabilities in the Consolidated Statement of Assets and Liabilities . . . . . . . . . . . . . . . . . . . . . . . . . . . . . . . . . . . . . . . . . . . . . . . . . . . . . . . $ 9,554,603 $ 405,549
Derivatives not subject to a Master Netting Agreement or similar agreement ("MNA") . . . . . . . . . . . . . . . . . . . . . . . . . . . . . . . . . . . . . . . . . . . . . . . . . . . . . . . . . . . . . — —
Total derivative assets and liabilities subject to an MNA. . . . . . . . . . . . . . . . . . . . . . . . . . . . . . . . . . . . . . . . . . . . . . . . . . . . . . . . . . . . . . . . . . . . . . . . . . . . . . . . . . . . . . . . . . $ 9,554,603 $ 405,549
(a) Includes unrealized appreciation (depreciation) on OTC swaps in the Consolidated Statement of Assets and Liabilities.
Consolidated Schedule of Investments (unaudited) (continued)
November 30, 2020
BlackRock Commodity Strategies Fund
12 2 0 2 0 B L A C K R O C K S E M I - A N N U A L R E P O R T T O S H A R E H O L D E R S

The following tables present the Fund’s derivative assets and liabilities by counterparty net of amounts available for offset under an MNA and net of the related collateralreceived and pledged by the Fund:
Counterparty
DerivativeAssets
Subject toan MNA by
Counterparty
DerivativesAvailable
for Offset(a)
Non-Cash
CollateralReceived
CashCollateral
Received(b)
NetAmount ofDerivative
Assets(c)
Citibank N.A. . . . . . . . . . . . . . . . . . . . . . . . . . . . . . . . . . . . . . . . . . . . . . . . . . . . . . . . . . . . . . . . . . . . . . . . . $ 71,106 $ — $ — $ — $ 71,106Goldman Sachs International . . . . . . . . . . . . . . . . . . . . . . . . . . . . . . . . . . . . . . . . . . . . . . . . . . . . . . . . . 522,251 (96,348) — (425,903) —JPMorgan Chase Bank N.A . . . . . . . . . . . . . . . . . . . . . . . . . . . . . . . . . . . . . . . . . . . . . . . . . . . . . . . . . . 8,875,883 (309,201) — (8,566,682) —Merrill Lynch International . . . . . . . . . . . . . . . . . . . . . . . . . . . . . . . . . . . . . . . . . . . . . . . . . . . . . . . . . . . . 83,108 — — — 83,108Morgan Stanley & Co. International PLC . . . . . . . . . . . . . . . . . . . . . . . . . . . . . . . . . . . . . . . . . . . . . . 2,255 — — — 2,255
$ 9,554,603 $ (405,549) $ — $ (8,992,585) $ 156,469
Counterparty
DerivativeLiabilities
Subject toan MNA by
Counterparty
DerivativesAvailable
for Offset(a)
Non-Cash
CollateralPledged
CashCollateralPledged
NetAmount ofDerivativeLiabilities
Goldman Sachs International . . . . . . . . . . . . . . . . . . . . . . . . . . . . . . . . . . . . . . . . . . . . . . . . . . . . . . . . . $ 96,348 $ (96,348) $ — $ — $ —JPMorgan Chase Bank N.A.. . . . . . . . . . . . . . . . . . . . . . . . . . . . . . . . . . . . . . . . . . . . . . . . . . . . . . . . . . 309,201 (309,201) — — —
$ 405,549 $ (405,549) $ — $ — $ —
(a) The amount of derivatives available for offset is limited to the amount of derivative assets and/or liabilities that are subject to an MNA.(b) Excess of collateral received from the individual counterparty is not shown for financial reporting purposes.(c) Net amount represents the net amount receivable from the counterparty in the event of default.
Fair Value Hierarchy as of Period End
Various inputs are used in determining the fair value of financial instruments. For a description of the input levels and information about the Fund’s policy regarding valuationof financial instruments, refer to the Notes to Consolidated Financial Statements.
The following tables summarize the Fund’s investments and derivative financial instruments categorized in the disclosure hierarchy. The breakdown of the Fund’sinvestments into major categories is disclosed in the Consolidated Schedule of Investments above.
Level 1 Level 2 Level 3 Total
AssetsInvestments
Long-Term InvestmentsCommon Stocks
Biotechnology. . . . . . . . . . . . . . . . . . . . . . . . . . . . . . . . . . . . . . . . . . . . . . . . . . . . . . . . . . $ 250,025 $ — $ — $ 250,025Capital Markets . . . . . . . . . . . . . . . . . . . . . . . . . . . . . . . . . . . . . . . . . . . . . . . . . . . . . . . . 378,615 — — 378,615Chemicals . . . . . . . . . . . . . . . . . . . . . . . . . . . . . . . . . . . . . . . . . . . . . . . . . . . . . . . . . . . . . 5,553,407 3,315,634 — 8,869,041Containers & Packaging . . . . . . . . . . . . . . . . . . . . . . . . . . . . . . . . . . . . . . . . . . . . . . . . 2,146,162 — — 2,146,162Energy Equipment & Services . . . . . . . . . . . . . . . . . . . . . . . . . . . . . . . . . . . . . . . . . . 1,045,507 — — 1,045,507Food & Staples Retailing . . . . . . . . . . . . . . . . . . . . . . . . . . . . . . . . . . . . . . . . . . . . . . . 4,254,644 1,122,215 — 5,376,859Food Products . . . . . . . . . . . . . . . . . . . . . . . . . . . . . . . . . . . . . . . . . . . . . . . . . . . . . . . . . 8,052,077 5,226,558 — 13,278,635Hotels, Restaurants & Leisure . . . . . . . . . . . . . . . . . . . . . . . . . . . . . . . . . . . . . . . . . . 1,492,238 — — 1,492,238Internet & Direct Marketing Retail . . . . . . . . . . . . . . . . . . . . . . . . . . . . . . . . . . . . . . . 916,908 2,767,456 — 3,684,364Machinery . . . . . . . . . . . . . . . . . . . . . . . . . . . . . . . . . . . . . . . . . . . . . . . . . . . . . . . . . . . . . 3,614,876 — — 3,614,876Metals & Mining . . . . . . . . . . . . . . . . . . . . . . . . . . . . . . . . . . . . . . . . . . . . . . . . . . . . . . . . 22,203,743 14,708,874 — 36,912,617Oil, Gas & Consumable Fuels. . . . . . . . . . . . . . . . . . . . . . . . . . . . . . . . . . . . . . . . . . . 17,841,569 11,391,924 — 29,233,493Personal Products . . . . . . . . . . . . . . . . . . . . . . . . . . . . . . . . . . . . . . . . . . . . . . . . . . . . . 3,057,226 — — 3,057,226Pharmaceuticals . . . . . . . . . . . . . . . . . . . . . . . . . . . . . . . . . . . . . . . . . . . . . . . . . . . . . . . 23,766 — — 23,766Specialty Retail . . . . . . . . . . . . . . . . . . . . . . . . . . . . . . . . . . . . . . . . . . . . . . . . . . . . . . . . 1,634,100 — — 1,634,100
Warrants . . . . . . . . . . . . . . . . . . . . . . . . . . . . . . . . . . . . . . . . . . . . . . . . . . . . . . . . . . . . . . . . . — — — —
Consolidated Schedule of Investments (unaudited) (continued)
November 30, 2020
BlackRock Commodity Strategies Fund
C O N S O L I D A T E D S C H E D U L E O F I N V E S T M E N T S 13

Level 1 Level 2 Level 3 Total
Short-Term SecuritiesMoney Market Funds . . . . . . . . . . . . . . . . . . . . . . . . . . . . . . . . . . . . . . . . . . . . . . . . . . . . . $ 3,112,567 $ — $ — $ 3,112,567U.S. Treasury Obligations . . . . . . . . . . . . . . . . . . . . . . . . . . . . . . . . . . . . . . . . . . . . . . . . . — 106,978,959 — 106,978,959
$ 75,577,430 $ 145,511,620 $ — 221,089,050
Investments Valued at NAV(a) . . . . . . . . . . . . . . . . . . . . . . . . . . . . . . . . . . . . . . . . . . . . . . . . . . . 1,069,284
$ 222,158,334
Derivative Financial Instruments(b)
AssetsCommodity Contracts . . . . . . . . . . . . . . . . . . . . . . . . . . . . . . . . . . . . . . . . . . . . . . . . . . . . . $ — $ 9,554,603 $ — $ 9,554,603
LiabilitiesCommodity Contracts . . . . . . . . . . . . . . . . . . . . . . . . . . . . . . . . . . . . . . . . . . . . . . . . . . . . . — (405,549) — (405,549)
$ — $ 9,149,054 $ — $ 9,149,054
(a) Certain investments of the Fund were fair valued using NAV per share as no quoted market value is available and therefore have been excluded from the fair value hierarchy.(b) Derivative financial instruments are swaps. Swaps are valued at the unrealized appreciation (depreciation) on the instrument.
See notes to consolidated financial statements.
Consolidated Schedule of Investments (unaudited) (continued)
November 30, 2020
BlackRock Commodity Strategies Fund
14 2 0 2 0 B L A C K R O C K S E M I - A N N U A L R E P O R T T O S H A R E H O L D E R S

BlackRockCommodityStrategies
Fund
ASSETSInvestments at value — unaffiliated(a)(b) . . . . . . . . . . . . . . . . . . . . . . . . . . . . . . . . . . . . . . . . . . . . . . . . . . . . . . . . . . . . . . . . . . . . . . . . . . . . . . . . . . . . . . . . . . . . . . . . . . . . . . . . . . . . . . . . . . . . . . . . . . . . . . . $ 217,976,483Investments at value — affiliated(c) . . . . . . . . . . . . . . . . . . . . . . . . . . . . . . . . . . . . . . . . . . . . . . . . . . . . . . . . . . . . . . . . . . . . . . . . . . . . . . . . . . . . . . . . . . . . . . . . . . . . . . . . . . . . . . . . . . . . . . . . . . . . . . . . . . . . 4,181,851Cash . . . . . . . . . . . . . . . . . . . . . . . . . . . . . . . . . . . . . . . . . . . . . . . . . . . . . . . . . . . . . . . . . . . . . . . . . . . . . . . . . . . . . . . . . . . . . . . . . . . . . . . . . . . . . . . . . . . . . . . . . . . . . . . . . . . . . . . . . . . . . . . . . . . . . . . . . . . . . . . . 7,196,958Cash pledged for collateral — OTC derivatives . . . . . . . . . . . . . . . . . . . . . . . . . . . . . . . . . . . . . . . . . . . . . . . . . . . . . . . . . . . . . . . . . . . . . . . . . . . . . . . . . . . . . . . . . . . . . . . . . . . . . . . . . . . . . . . . . . . . . . . . 60,000Receivables:
Investments sold . . . . . . . . . . . . . . . . . . . . . . . . . . . . . . . . . . . . . . . . . . . . . . . . . . . . . . . . . . . . . . . . . . . . . . . . . . . . . . . . . . . . . . . . . . . . . . . . . . . . . . . . . . . . . . . . . . . . . . . . . . . . . . . . . . . . . . . . . . . . . . . . . . 845,472Securities lending income — affiliated . . . . . . . . . . . . . . . . . . . . . . . . . . . . . . . . . . . . . . . . . . . . . . . . . . . . . . . . . . . . . . . . . . . . . . . . . . . . . . . . . . . . . . . . . . . . . . . . . . . . . . . . . . . . . . . . . . . . . . . . . . . . . . 450Capital shares sold . . . . . . . . . . . . . . . . . . . . . . . . . . . . . . . . . . . . . . . . . . . . . . . . . . . . . . . . . . . . . . . . . . . . . . . . . . . . . . . . . . . . . . . . . . . . . . . . . . . . . . . . . . . . . . . . . . . . . . . . . . . . . . . . . . . . . . . . . . . . . . . . 680,625Dividends — affiliated. . . . . . . . . . . . . . . . . . . . . . . . . . . . . . . . . . . . . . . . . . . . . . . . . . . . . . . . . . . . . . . . . . . . . . . . . . . . . . . . . . . . . . . . . . . . . . . . . . . . . . . . . . . . . . . . . . . . . . . . . . . . . . . . . . . . . . . . . . . . . . 76Dividends — unaffiliated . . . . . . . . . . . . . . . . . . . . . . . . . . . . . . . . . . . . . . . . . . . . . . . . . . . . . . . . . . . . . . . . . . . . . . . . . . . . . . . . . . . . . . . . . . . . . . . . . . . . . . . . . . . . . . . . . . . . . . . . . . . . . . . . . . . . . . . . . . . 279,265From the Manager . . . . . . . . . . . . . . . . . . . . . . . . . . . . . . . . . . . . . . . . . . . . . . . . . . . . . . . . . . . . . . . . . . . . . . . . . . . . . . . . . . . . . . . . . . . . . . . . . . . . . . . . . . . . . . . . . . . . . . . . . . . . . . . . . . . . . . . . . . . . . . . . . 9,601
Unrealized appreciation on OTC swaps . . . . . . . . . . . . . . . . . . . . . . . . . . . . . . . . . . . . . . . . . . . . . . . . . . . . . . . . . . . . . . . . . . . . . . . . . . . . . . . . . . . . . . . . . . . . . . . . . . . . . . . . . . . . . . . . . . . . . . . . . . . . . . . 9,554,603Prepaid expenses . . . . . . . . . . . . . . . . . . . . . . . . . . . . . . . . . . . . . . . . . . . . . . . . . . . . . . . . . . . . . . . . . . . . . . . . . . . . . . . . . . . . . . . . . . . . . . . . . . . . . . . . . . . . . . . . . . . . . . . . . . . . . . . . . . . . . . . . . . . . . . . . . . . . 52,875
Total assets . . . . . . . . . . . . . . . . . . . . . . . . . . . . . . . . . . . . . . . . . . . . . . . . . . . . . . . . . . . . . . . . . . . . . . . . . . . . . . . . . . . . . . . . . . . . . . . . . . . . . . . . . . . . . . . . . . . . . . . . . . . . . . . . . . . . . . . . . . . . . . . . . . . . . . . . . . 240,838,259
LIABILITIESCash received as collateral for OTC derivatives . . . . . . . . . . . . . . . . . . . . . . . . . . . . . . . . . . . . . . . . . . . . . . . . . . . . . . . . . . . . . . . . . . . . . . . . . . . . . . . . . . . . . . . . . . . . . . . . . . . . . . . . . . . . . . . . . . . . . . . . 9,460,000Cash collateral on securities loaned at value. . . . . . . . . . . . . . . . . . . . . . . . . . . . . . . . . . . . . . . . . . . . . . . . . . . . . . . . . . . . . . . . . . . . . . . . . . . . . . . . . . . . . . . . . . . . . . . . . . . . . . . . . . . . . . . . . . . . . . . . . . . 1,067,040Payables:
Investments purchased . . . . . . . . . . . . . . . . . . . . . . . . . . . . . . . . . . . . . . . . . . . . . . . . . . . . . . . . . . . . . . . . . . . . . . . . . . . . . . . . . . . . . . . . . . . . . . . . . . . . . . . . . . . . . . . . . . . . . . . . . . . . . . . . . . . . . . . . . . . . 3,209,886Administration fees . . . . . . . . . . . . . . . . . . . . . . . . . . . . . . . . . . . . . . . . . . . . . . . . . . . . . . . . . . . . . . . . . . . . . . . . . . . . . . . . . . . . . . . . . . . . . . . . . . . . . . . . . . . . . . . . . . . . . . . . . . . . . . . . . . . . . . . . . . . . . . . . 7,735Capital shares redeemed . . . . . . . . . . . . . . . . . . . . . . . . . . . . . . . . . . . . . . . . . . . . . . . . . . . . . . . . . . . . . . . . . . . . . . . . . . . . . . . . . . . . . . . . . . . . . . . . . . . . . . . . . . . . . . . . . . . . . . . . . . . . . . . . . . . . . . . . . . 218,841Investment advisory fees. . . . . . . . . . . . . . . . . . . . . . . . . . . . . . . . . . . . . . . . . . . . . . . . . . . . . . . . . . . . . . . . . . . . . . . . . . . . . . . . . . . . . . . . . . . . . . . . . . . . . . . . . . . . . . . . . . . . . . . . . . . . . . . . . . . . . . . . . . . 83,227Trustees’ and Officer’s fees . . . . . . . . . . . . . . . . . . . . . . . . . . . . . . . . . . . . . . . . . . . . . . . . . . . . . . . . . . . . . . . . . . . . . . . . . . . . . . . . . . . . . . . . . . . . . . . . . . . . . . . . . . . . . . . . . . . . . . . . . . . . . . . . . . . . . . . . 3,680Other accrued expenses . . . . . . . . . . . . . . . . . . . . . . . . . . . . . . . . . . . . . . . . . . . . . . . . . . . . . . . . . . . . . . . . . . . . . . . . . . . . . . . . . . . . . . . . . . . . . . . . . . . . . . . . . . . . . . . . . . . . . . . . . . . . . . . . . . . . . . . . . . . 201,224Other affiliate fees . . . . . . . . . . . . . . . . . . . . . . . . . . . . . . . . . . . . . . . . . . . . . . . . . . . . . . . . . . . . . . . . . . . . . . . . . . . . . . . . . . . . . . . . . . . . . . . . . . . . . . . . . . . . . . . . . . . . . . . . . . . . . . . . . . . . . . . . . . . . . . . . . 696Service and distribution fees . . . . . . . . . . . . . . . . . . . . . . . . . . . . . . . . . . . . . . . . . . . . . . . . . . . . . . . . . . . . . . . . . . . . . . . . . . . . . . . . . . . . . . . . . . . . . . . . . . . . . . . . . . . . . . . . . . . . . . . . . . . . . . . . . . . . . . . 12,353
Unrealized depreciation on OTC swaps . . . . . . . . . . . . . . . . . . . . . . . . . . . . . . . . . . . . . . . . . . . . . . . . . . . . . . . . . . . . . . . . . . . . . . . . . . . . . . . . . . . . . . . . . . . . . . . . . . . . . . . . . . . . . . . . . . . . . . . . . . . . . . . 405,549
Total liabilities . . . . . . . . . . . . . . . . . . . . . . . . . . . . . . . . . . . . . . . . . . . . . . . . . . . . . . . . . . . . . . . . . . . . . . . . . . . . . . . . . . . . . . . . . . . . . . . . . . . . . . . . . . . . . . . . . . . . . . . . . . . . . . . . . . . . . . . . . . . . . . . . . . . . . . . . 14,670,231
NET ASSETS . . . . . . . . . . . . . . . . . . . . . . . . . . . . . . . . . . . . . . . . . . . . . . . . . . . . . . . . . . . . . . . . . . . . . . . . . . . . . . . . . . . . . . . . . . . . . . . . . . . . . . . . . . . . . . . . . . . . . . . . . . . . . . . . . . . . . . . . . . . . . . . . . . . . . . . . $ 226,168,028
NET ASSETS CONSIST OFPaid-in capital . . . . . . . . . . . . . . . . . . . . . . . . . . . . . . . . . . . . . . . . . . . . . . . . . . . . . . . . . . . . . . . . . . . . . . . . . . . . . . . . . . . . . . . . . . . . . . . . . . . . . . . . . . . . . . . . . . . . . . . . . . . . . . . . . . . . . . . . . . . . . . . . . . . . . . . . $ 375,589,376Accumulated loss . . . . . . . . . . . . . . . . . . . . . . . . . . . . . . . . . . . . . . . . . . . . . . . . . . . . . . . . . . . . . . . . . . . . . . . . . . . . . . . . . . . . . . . . . . . . . . . . . . . . . . . . . . . . . . . . . . . . . . . . . . . . . . . . . . . . . . . . . . . . . . . . . . . . (149,421,348)
NET ASSETS . . . . . . . . . . . . . . . . . . . . . . . . . . . . . . . . . . . . . . . . . . . . . . . . . . . . . . . . . . . . . . . . . . . . . . . . . . . . . . . . . . . . . . . . . . . . . . . . . . . . . . . . . . . . . . . . . . . . . . . . . . . . . . . . . . . . . . . . . . . . . . . . . . . . . . . . $ 226,168,028(a) Investments at cost — unaffiliated . . . . . . . . . . . . . . . . . . . . . . . . . . . . . . . . . . . . . . . . . . . . . . . . . . . . . . . . . . . . . . . . . . . . . . . . . . . . . . . . . . . . . . . . . . . . . . . . . . . . . . . . . . . . . . . . . . . . . . . . . . . . . . . . . . $ 194,265,605(b) Securities loaned at value . . . . . . . . . . . . . . . . . . . . . . . . . . . . . . . . . . . . . . . . . . . . . . . . . . . . . . . . . . . . . . . . . . . . . . . . . . . . . . . . . . . . . . . . . . . . . . . . . . . . . . . . . . . . . . . . . . . . . . . . . . . . . . . . . . . . . . . . . . $ 1,046,653(c) Investments at cost — affiliated. . . . . . . . . . . . . . . . . . . . . . . . . . . . . . . . . . . . . . . . . . . . . . . . . . . . . . . . . . . . . . . . . . . . . . . . . . . . . . . . . . . . . . . . . . . . . . . . . . . . . . . . . . . . . . . . . . . . . . . . . . . . . . . . . . . . . $ 4,181,762
Consolidated Statement of Assets and Liabilities (unaudited)
November 30, 2020
C O N S O L I D A T E D F I N A N C I A L S T A T E M E N T S 15

BlackRockCommodityStrategies
Fund
NET ASSET VALUEInstitutional
Net assets . . . . . . . . . . . . . . . . . . . . . . . . . . . . . . . . . . . . . . . . . . . . . . . . . . . . . . . . . . . . . . . . . . . . . . . . . . . . . . . . . . . . . . . . . . . . . . . . . . . . . . . . . . . . . . . . . . . . . . . . . . . . . . . . . . . . . . . . . . . . . . . . . . . . . . . . $ 151,843,535
Shares outstanding . . . . . . . . . . . . . . . . . . . . . . . . . . . . . . . . . . . . . . . . . . . . . . . . . . . . . . . . . . . . . . . . . . . . . . . . . . . . . . . . . . . . . . . . . . . . . . . . . . . . . . . . . . . . . . . . . . . . . . . . . . . . . . . . . . . . . . . . . . . . . . . . 20,818,964
Net asset value. . . . . . . . . . . . . . . . . . . . . . . . . . . . . . . . . . . . . . . . . . . . . . . . . . . . . . . . . . . . . . . . . . . . . . . . . . . . . . . . . . . . . . . . . . . . . . . . . . . . . . . . . . . . . . . . . . . . . . . . . . . . . . . . . . . . . . . . . . . . . . . . . . . . $ 7.29
Shares authorized . . . . . . . . . . . . . . . . . . . . . . . . . . . . . . . . . . . . . . . . . . . . . . . . . . . . . . . . . . . . . . . . . . . . . . . . . . . . . . . . . . . . . . . . . . . . . . . . . . . . . . . . . . . . . . . . . . . . . . . . . . . . . . . . . . . . . . . . . . . . . . . . . Unlimited
Par value. . . . . . . . . . . . . . . . . . . . . . . . . . . . . . . . . . . . . . . . . . . . . . . . . . . . . . . . . . . . . . . . . . . . . . . . . . . . . . . . . . . . . . . . . . . . . . . . . . . . . . . . . . . . . . . . . . . . . . . . . . . . . . . . . . . . . . . . . . . . . . . . . . . . . . . . . . $ 0.001
Investor ANet assets . . . . . . . . . . . . . . . . . . . . . . . . . . . . . . . . . . . . . . . . . . . . . . . . . . . . . . . . . . . . . . . . . . . . . . . . . . . . . . . . . . . . . . . . . . . . . . . . . . . . . . . . . . . . . . . . . . . . . . . . . . . . . . . . . . . . . . . . . . . . . . . . . . . . . . . . $ 39,764,849
Shares outstanding . . . . . . . . . . . . . . . . . . . . . . . . . . . . . . . . . . . . . . . . . . . . . . . . . . . . . . . . . . . . . . . . . . . . . . . . . . . . . . . . . . . . . . . . . . . . . . . . . . . . . . . . . . . . . . . . . . . . . . . . . . . . . . . . . . . . . . . . . . . . . . . . 5,498,848
Net asset value. . . . . . . . . . . . . . . . . . . . . . . . . . . . . . . . . . . . . . . . . . . . . . . . . . . . . . . . . . . . . . . . . . . . . . . . . . . . . . . . . . . . . . . . . . . . . . . . . . . . . . . . . . . . . . . . . . . . . . . . . . . . . . . . . . . . . . . . . . . . . . . . . . . . $ 7.23
Shares authorized . . . . . . . . . . . . . . . . . . . . . . . . . . . . . . . . . . . . . . . . . . . . . . . . . . . . . . . . . . . . . . . . . . . . . . . . . . . . . . . . . . . . . . . . . . . . . . . . . . . . . . . . . . . . . . . . . . . . . . . . . . . . . . . . . . . . . . . . . . . . . . . . . Unlimited
Par value. . . . . . . . . . . . . . . . . . . . . . . . . . . . . . . . . . . . . . . . . . . . . . . . . . . . . . . . . . . . . . . . . . . . . . . . . . . . . . . . . . . . . . . . . . . . . . . . . . . . . . . . . . . . . . . . . . . . . . . . . . . . . . . . . . . . . . . . . . . . . . . . . . . . . . . . . . $ 0.001
Investor CNet assets . . . . . . . . . . . . . . . . . . . . . . . . . . . . . . . . . . . . . . . . . . . . . . . . . . . . . . . . . . . . . . . . . . . . . . . . . . . . . . . . . . . . . . . . . . . . . . . . . . . . . . . . . . . . . . . . . . . . . . . . . . . . . . . . . . . . . . . . . . . . . . . . . . . . . . . . $ 5,846,579
Shares outstanding . . . . . . . . . . . . . . . . . . . . . . . . . . . . . . . . . . . . . . . . . . . . . . . . . . . . . . . . . . . . . . . . . . . . . . . . . . . . . . . . . . . . . . . . . . . . . . . . . . . . . . . . . . . . . . . . . . . . . . . . . . . . . . . . . . . . . . . . . . . . . . . . 841,607
Net asset value. . . . . . . . . . . . . . . . . . . . . . . . . . . . . . . . . . . . . . . . . . . . . . . . . . . . . . . . . . . . . . . . . . . . . . . . . . . . . . . . . . . . . . . . . . . . . . . . . . . . . . . . . . . . . . . . . . . . . . . . . . . . . . . . . . . . . . . . . . . . . . . . . . . . $ 6.95
Shares authorized . . . . . . . . . . . . . . . . . . . . . . . . . . . . . . . . . . . . . . . . . . . . . . . . . . . . . . . . . . . . . . . . . . . . . . . . . . . . . . . . . . . . . . . . . . . . . . . . . . . . . . . . . . . . . . . . . . . . . . . . . . . . . . . . . . . . . . . . . . . . . . . . . Unlimited
Par value. . . . . . . . . . . . . . . . . . . . . . . . . . . . . . . . . . . . . . . . . . . . . . . . . . . . . . . . . . . . . . . . . . . . . . . . . . . . . . . . . . . . . . . . . . . . . . . . . . . . . . . . . . . . . . . . . . . . . . . . . . . . . . . . . . . . . . . . . . . . . . . . . . . . . . . . . . $ 0.001
Class KNet assets . . . . . . . . . . . . . . . . . . . . . . . . . . . . . . . . . . . . . . . . . . . . . . . . . . . . . . . . . . . . . . . . . . . . . . . . . . . . . . . . . . . . . . . . . . . . . . . . . . . . . . . . . . . . . . . . . . . . . . . . . . . . . . . . . . . . . . . . . . . . . . . . . . . . . . . . $ 28,713,065
Shares outstanding . . . . . . . . . . . . . . . . . . . . . . . . . . . . . . . . . . . . . . . . . . . . . . . . . . . . . . . . . . . . . . . . . . . . . . . . . . . . . . . . . . . . . . . . . . . . . . . . . . . . . . . . . . . . . . . . . . . . . . . . . . . . . . . . . . . . . . . . . . . . . . . . 3,934,824
Net asset value. . . . . . . . . . . . . . . . . . . . . . . . . . . . . . . . . . . . . . . . . . . . . . . . . . . . . . . . . . . . . . . . . . . . . . . . . . . . . . . . . . . . . . . . . . . . . . . . . . . . . . . . . . . . . . . . . . . . . . . . . . . . . . . . . . . . . . . . . . . . . . . . . . . . $ 7.30
Shares authorized . . . . . . . . . . . . . . . . . . . . . . . . . . . . . . . . . . . . . . . . . . . . . . . . . . . . . . . . . . . . . . . . . . . . . . . . . . . . . . . . . . . . . . . . . . . . . . . . . . . . . . . . . . . . . . . . . . . . . . . . . . . . . . . . . . . . . . . . . . . . . . . . . Unlimited
Par value. . . . . . . . . . . . . . . . . . . . . . . . . . . . . . . . . . . . . . . . . . . . . . . . . . . . . . . . . . . . . . . . . . . . . . . . . . . . . . . . . . . . . . . . . . . . . . . . . . . . . . . . . . . . . . . . . . . . . . . . . . . . . . . . . . . . . . . . . . . . . . . . . . . . . . . . . . $ 0.001
See notes to consolidated financial statements.
Consolidated Statement of Assets and Liabilities (unaudited) (continued)
November 30, 2020
16 2 0 2 0 B L A C K R O C K S E M I - A N N U A L R E P O R T T O S H A R E H O L D E R S

BlackRockCommodityStrategies
Fund
INVESTMENT INCOMEDividends — unaffiliated . . . . . . . . . . . . . . . . . . . . . . . . . . . . . . . . . . . . . . . . . . . . . . . . . . . . . . . . . . . . . . . . . . . . . . . . . . . . . . . . . . . . . . . . . . . . . . . . . . . . . . . . . . . . . . . . . . . . . . . . . . . . . . . . . . . . . . . . . $ 1,412,408Dividends — affiliated . . . . . . . . . . . . . . . . . . . . . . . . . . . . . . . . . . . . . . . . . . . . . . . . . . . . . . . . . . . . . . . . . . . . . . . . . . . . . . . . . . . . . . . . . . . . . . . . . . . . . . . . . . . . . . . . . . . . . . . . . . . . . . . . . . . . . . . . . . . . 1,118Interest — unaffiliated. . . . . . . . . . . . . . . . . . . . . . . . . . . . . . . . . . . . . . . . . . . . . . . . . . . . . . . . . . . . . . . . . . . . . . . . . . . . . . . . . . . . . . . . . . . . . . . . . . . . . . . . . . . . . . . . . . . . . . . . . . . . . . . . . . . . . . . . . . . . 113,443Securities lending income — affiliated — net . . . . . . . . . . . . . . . . . . . . . . . . . . . . . . . . . . . . . . . . . . . . . . . . . . . . . . . . . . . . . . . . . . . . . . . . . . . . . . . . . . . . . . . . . . . . . . . . . . . . . . . . . . . . . . . . . . . . . . 4,713Foreign taxes withheld . . . . . . . . . . . . . . . . . . . . . . . . . . . . . . . . . . . . . . . . . . . . . . . . . . . . . . . . . . . . . . . . . . . . . . . . . . . . . . . . . . . . . . . . . . . . . . . . . . . . . . . . . . . . . . . . . . . . . . . . . . . . . . . . . . . . . . . . . . . (70,404)
Total investment income . . . . . . . . . . . . . . . . . . . . . . . . . . . . . . . . . . . . . . . . . . . . . . . . . . . . . . . . . . . . . . . . . . . . . . . . . . . . . . . . . . . . . . . . . . . . . . . . . . . . . . . . . . . . . . . . . . . . . . . . . . . . . . . . . . . . . . . . . . . . 1,461,278
EXPENSESInvestment advisory . . . . . . . . . . . . . . . . . . . . . . . . . . . . . . . . . . . . . . . . . . . . . . . . . . . . . . . . . . . . . . . . . . . . . . . . . . . . . . . . . . . . . . . . . . . . . . . . . . . . . . . . . . . . . . . . . . . . . . . . . . . . . . . . . . . . . . . . . . . . . 613,759Transfer agent — class specific . . . . . . . . . . . . . . . . . . . . . . . . . . . . . . . . . . . . . . . . . . . . . . . . . . . . . . . . . . . . . . . . . . . . . . . . . . . . . . . . . . . . . . . . . . . . . . . . . . . . . . . . . . . . . . . . . . . . . . . . . . . . . . . . . . 106,964Service and distribution — class specific . . . . . . . . . . . . . . . . . . . . . . . . . . . . . . . . . . . . . . . . . . . . . . . . . . . . . . . . . . . . . . . . . . . . . . . . . . . . . . . . . . . . . . . . . . . . . . . . . . . . . . . . . . . . . . . . . . . . . . . . . . 68,805Professional . . . . . . . . . . . . . . . . . . . . . . . . . . . . . . . . . . . . . . . . . . . . . . . . . . . . . . . . . . . . . . . . . . . . . . . . . . . . . . . . . . . . . . . . . . . . . . . . . . . . . . . . . . . . . . . . . . . . . . . . . . . . . . . . . . . . . . . . . . . . . . . . . . . . . 67,269Administration . . . . . . . . . . . . . . . . . . . . . . . . . . . . . . . . . . . . . . . . . . . . . . . . . . . . . . . . . . . . . . . . . . . . . . . . . . . . . . . . . . . . . . . . . . . . . . . . . . . . . . . . . . . . . . . . . . . . . . . . . . . . . . . . . . . . . . . . . . . . . . . . . . . 42,072Registration . . . . . . . . . . . . . . . . . . . . . . . . . . . . . . . . . . . . . . . . . . . . . . . . . . . . . . . . . . . . . . . . . . . . . . . . . . . . . . . . . . . . . . . . . . . . . . . . . . . . . . . . . . . . . . . . . . . . . . . . . . . . . . . . . . . . . . . . . . . . . . . . . . . . . 38,439Custodian . . . . . . . . . . . . . . . . . . . . . . . . . . . . . . . . . . . . . . . . . . . . . . . . . . . . . . . . . . . . . . . . . . . . . . . . . . . . . . . . . . . . . . . . . . . . . . . . . . . . . . . . . . . . . . . . . . . . . . . . . . . . . . . . . . . . . . . . . . . . . . . . . . . . . . . 27,131Accounting services . . . . . . . . . . . . . . . . . . . . . . . . . . . . . . . . . . . . . . . . . . . . . . . . . . . . . . . . . . . . . . . . . . . . . . . . . . . . . . . . . . . . . . . . . . . . . . . . . . . . . . . . . . . . . . . . . . . . . . . . . . . . . . . . . . . . . . . . . . . . . 23,813Administration — class specific . . . . . . . . . . . . . . . . . . . . . . . . . . . . . . . . . . . . . . . . . . . . . . . . . . . . . . . . . . . . . . . . . . . . . . . . . . . . . . . . . . . . . . . . . . . . . . . . . . . . . . . . . . . . . . . . . . . . . . . . . . . . . . . . . . . 19,763Printing and postage . . . . . . . . . . . . . . . . . . . . . . . . . . . . . . . . . . . . . . . . . . . . . . . . . . . . . . . . . . . . . . . . . . . . . . . . . . . . . . . . . . . . . . . . . . . . . . . . . . . . . . . . . . . . . . . . . . . . . . . . . . . . . . . . . . . . . . . . . . . . . 17,165Trustees and Officer . . . . . . . . . . . . . . . . . . . . . . . . . . . . . . . . . . . . . . . . . . . . . . . . . . . . . . . . . . . . . . . . . . . . . . . . . . . . . . . . . . . . . . . . . . . . . . . . . . . . . . . . . . . . . . . . . . . . . . . . . . . . . . . . . . . . . . . . . . . . . 5,294Miscellaneous . . . . . . . . . . . . . . . . . . . . . . . . . . . . . . . . . . . . . . . . . . . . . . . . . . . . . . . . . . . . . . . . . . . . . . . . . . . . . . . . . . . . . . . . . . . . . . . . . . . . . . . . . . . . . . . . . . . . . . . . . . . . . . . . . . . . . . . . . . . . . . . . . . . 11,128
Total expenses . . . . . . . . . . . . . . . . . . . . . . . . . . . . . . . . . . . . . . . . . . . . . . . . . . . . . . . . . . . . . . . . . . . . . . . . . . . . . . . . . . . . . . . . . . . . . . . . . . . . . . . . . . . . . . . . . . . . . . . . . . . . . . . . . . . . . . . . . . . . . . . . . . . . . 1,041,602Less:
Fees waived and/or reimbursed by the Manager . . . . . . . . . . . . . . . . . . . . . . . . . . . . . . . . . . . . . . . . . . . . . . . . . . . . . . . . . . . . . . . . . . . . . . . . . . . . . . . . . . . . . . . . . . . . . . . . . . . . . . . . . . . . . . . . (182,744)Administration fees waived — class specific . . . . . . . . . . . . . . . . . . . . . . . . . . . . . . . . . . . . . . . . . . . . . . . . . . . . . . . . . . . . . . . . . . . . . . . . . . . . . . . . . . . . . . . . . . . . . . . . . . . . . . . . . . . . . . . . . . . . (19,763)Transfer agent fees waived and/or reimbursed — class specific . . . . . . . . . . . . . . . . . . . . . . . . . . . . . . . . . . . . . . . . . . . . . . . . . . . . . . . . . . . . . . . . . . . . . . . . . . . . . . . . . . . . . . . . . . . . . . . . . (64,251)
Total expenses after fees waived and/or reimbursed. . . . . . . . . . . . . . . . . . . . . . . . . . . . . . . . . . . . . . . . . . . . . . . . . . . . . . . . . . . . . . . . . . . . . . . . . . . . . . . . . . . . . . . . . . . . . . . . . . . . . . . . . . . . . . . . . . 774,844
Net investment income . . . . . . . . . . . . . . . . . . . . . . . . . . . . . . . . . . . . . . . . . . . . . . . . . . . . . . . . . . . . . . . . . . . . . . . . . . . . . . . . . . . . . . . . . . . . . . . . . . . . . . . . . . . . . . . . . . . . . . . . . . . . . . . . . . . . . . . . . . . . . 686,434
REALIZED AND UNREALIZED GAIN (LOSS)Net realized gain (loss) from:
Investments — unaffiliated (net of $29,829 foreign capital gain tax) . . . . . . . . . . . . . . . . . . . . . . . . . . . . . . . . . . . . . . . . . . . . . . . . . . . . . . . . . . . . . . . . . . . . . . . . . . . . . . . . . . . . . . . . . . . . . . 921,879Investments — affiliated . . . . . . . . . . . . . . . . . . . . . . . . . . . . . . . . . . . . . . . . . . . . . . . . . . . . . . . . . . . . . . . . . . . . . . . . . . . . . . . . . . . . . . . . . . . . . . . . . . . . . . . . . . . . . . . . . . . . . . . . . . . . . . . . . . . . . . . (832)Foreign currency transactions . . . . . . . . . . . . . . . . . . . . . . . . . . . . . . . . . . . . . . . . . . . . . . . . . . . . . . . . . . . . . . . . . . . . . . . . . . . . . . . . . . . . . . . . . . . . . . . . . . . . . . . . . . . . . . . . . . . . . . . . . . . . . . . . . (35)Swaps. . . . . . . . . . . . . . . . . . . . . . . . . . . . . . . . . . . . . . . . . . . . . . . . . . . . . . . . . . . . . . . . . . . . . . . . . . . . . . . . . . . . . . . . . . . . . . . . . . . . . . . . . . . . . . . . . . . . . . . . . . . . . . . . . . . . . . . . . . . . . . . . . . . . . . . . 485,491
1,406,503
Net change in unrealized appreciation (depreciation) on:Investments — unaffiliated. . . . . . . . . . . . . . . . . . . . . . . . . . . . . . . . . . . . . . . . . . . . . . . . . . . . . . . . . . . . . . . . . . . . . . . . . . . . . . . . . . . . . . . . . . . . . . . . . . . . . . . . . . . . . . . . . . . . . . . . . . . . . . . . . . . . . 11,959,545(a)
Investments — affiliated . . . . . . . . . . . . . . . . . . . . . . . . . . . . . . . . . . . . . . . . . . . . . . . . . . . . . . . . . . . . . . . . . . . . . . . . . . . . . . . . . . . . . . . . . . . . . . . . . . . . . . . . . . . . . . . . . . . . . . . . . . . . . . . . . . . . . . . (118)Foreign currency translations . . . . . . . . . . . . . . . . . . . . . . . . . . . . . . . . . . . . . . . . . . . . . . . . . . . . . . . . . . . . . . . . . . . . . . . . . . . . . . . . . . . . . . . . . . . . . . . . . . . . . . . . . . . . . . . . . . . . . . . . . . . . . . . . . . 1,807Swaps. . . . . . . . . . . . . . . . . . . . . . . . . . . . . . . . . . . . . . . . . . . . . . . . . . . . . . . . . . . . . . . . . . . . . . . . . . . . . . . . . . . . . . . . . . . . . . . . . . . . . . . . . . . . . . . . . . . . . . . . . . . . . . . . . . . . . . . . . . . . . . . . . . . . . . . . 13,108,827
25,070,061
Net realized and unrealized gain . . . . . . . . . . . . . . . . . . . . . . . . . . . . . . . . . . . . . . . . . . . . . . . . . . . . . . . . . . . . . . . . . . . . . . . . . . . . . . . . . . . . . . . . . . . . . . . . . . . . . . . . . . . . . . . . . . . . . . . . . . . . . . . . . . . . 26,476,564
NET INCREASE IN NET ASSETS RESULTING FROM OPERATIONS . . . . . . . . . . . . . . . . . . . . . . . . . . . . . . . . . . . . . . . . . . . . . . . . . . . . . . . . . . . . . . . . . . . . . . . . . . . . . . . . . . . . . . . . . . . . . . . . $ 27,162,998
(a) Net of $5,560 foreign capital gain tax.
See notes to consolidated financial statements.
Consolidated Statement of Operations (unaudited)
Six Months Ended November 30, 2020
C O N S O L I D A T E D F I N A N C I A L S T A T E M E N T S 17

BlackRock Commodity Strategies Fund
Six MonthsEnded
11/30/20(unaudited)
Period from08/01/19
to 05/31/20Year Ended
07/31/19
INCREASE (DECREASE) IN NET ASSETS
OPERATIONSNet investment income . . . . . . . . . . . . . . . . . . . . . . . . . . . . . . . . . . . . . . . . . . . . . . . . . . . . . . . . . . . . . . . . . . . . . . . . . . . . . . . . . . . . . . . . . . . . . . . . . . . . . . . $ 686,434 $ 2,339,809 $ 4,373,061Net realized gain (loss) . . . . . . . . . . . . . . . . . . . . . . . . . . . . . . . . . . . . . . . . . . . . . . . . . . . . . . . . . . . . . . . . . . . . . . . . . . . . . . . . . . . . . . . . . . . . . . . . . . . . . . . 1,406,503 (19,865,221) (18,660,315)Net change in unrealized appreciation (depreciation) . . . . . . . . . . . . . . . . . . . . . . . . . . . . . . . . . . . . . . . . . . . . . . . . . . . . . . . . . . . . . . . . . . . . . . . . . . 25,070,061 (3,216,924) (5,667,385)
Net increase (decrease) in net assets resulting from operations . . . . . . . . . . . . . . . . . . . . . . . . . . . . . . . . . . . . . . . . . . . . . . . . . . . . . . . . . . . . . . . . . . . 27,162,998 (20,742,336) (19,954,639)
DISTRIBUTIONS TO SHAREHOLDERS(a)
Institutional . . . . . . . . . . . . . . . . . . . . . . . . . . . . . . . . . . . . . . . . . . . . . . . . . . . . . . . . . . . . . . . . . . . . . . . . . . . . . . . . . . . . . . . . . . . . . . . . . . . . . . . . . . . . . . . . . . (466,179) (2,843,280) (3,491,694)Investor A . . . . . . . . . . . . . . . . . . . . . . . . . . . . . . . . . . . . . . . . . . . . . . . . . . . . . . . . . . . . . . . . . . . . . . . . . . . . . . . . . . . . . . . . . . . . . . . . . . . . . . . . . . . . . . . . . . . (90,310) (512,839) (669,467)Investor C . . . . . . . . . . . . . . . . . . . . . . . . . . . . . . . . . . . . . . . . . . . . . . . . . . . . . . . . . . . . . . . . . . . . . . . . . . . . . . . . . . . . . . . . . . . . . . . . . . . . . . . . . . . . . . . . . . . (4,109) (50,040) (78,763)Class K. . . . . . . . . . . . . . . . . . . . . . . . . . . . . . . . . . . . . . . . . . . . . . . . . . . . . . . . . . . . . . . . . . . . . . . . . . . . . . . . . . . . . . . . . . . . . . . . . . . . . . . . . . . . . . . . . . . . . . (108,253) (593,845) (445,982)
Decrease in net assets resulting from distributions to shareholders . . . . . . . . . . . . . . . . . . . . . . . . . . . . . . . . . . . . . . . . . . . . . . . . . . . . . . . . . . . . . . . . (668,851) (4,000,004) (4,685,906)
CAPITAL SHARE TRANSACTIONS
Net increase (decrease) in net assets derived from capital share transactions . . . . . . . . . . . . . . . . . . . . . . . . . . . . . . . . . . . . . . . . . . . . . . . . . . . . . 42,233,397 (25,260,513) (55,635,613)
NET ASSETSTotal increase (decrease) in net assets . . . . . . . . . . . . . . . . . . . . . . . . . . . . . . . . . . . . . . . . . . . . . . . . . . . . . . . . . . . . . . . . . . . . . . . . . . . . . . . . . . . . . . . . . . 68,727,544 (50,002,853) (80,276,158)Beginning of period . . . . . . . . . . . . . . . . . . . . . . . . . . . . . . . . . . . . . . . . . . . . . . . . . . . . . . . . . . . . . . . . . . . . . . . . . . . . . . . . . . . . . . . . . . . . . . . . . . . . . . . . . . . . . 157,440,484 207,443,337 287,719,495
End of period . . . . . . . . . . . . . . . . . . . . . . . . . . . . . . . . . . . . . . . . . . . . . . . . . . . . . . . . . . . . . . . . . . . . . . . . . . . . . . . . . . . . . . . . . . . . . . . . . . . . . . . . . . . . . . . . . . . $ 226,168,028 $ 157,440,484 $ 207,443,337
(a) Distributions for annual periods determined in accordance with U.S. federal income tax regulations.
See notes to consolidated financial statements.
Consolidated Statements of Changes in Net Assets
18 2 0 2 0 B L A C K R O C K S E M I - A N N U A L R E P O R T T O S H A R E H O L D E R S

BlackRock Commodity Strategies Fund
Institutional
Six Months Ended11/30/20
(unaudited)
Period from08/01/19
to 05/31/20
Year Ended July 31,
2019 2018 2017 2016 2015
Net asset value, beginning of period . . . . . . . . . . . . . . . . . . . . . . . . . . . $ 6.33 $ 7.18 $ 7.82 $ 7.43 $ 7.36 $ 6.98 $ 9.89
Net investment income(a) . . . . . . . . . . . . . . . . . . . . . . . . . . . . . . . . . . . . . . 0.03 0.09 0.14(b) 0.07 0.05(c) 0.00(d) 0.00(d)
Net realized and unrealized gain (loss) . . . . . . . . . . . . . . . . . . . . . . . . . 0.96 (0.79) (0.64) 0.37 0.09 0.38 (2.91)
Net increase (decrease) from investment operations . . . . . . . . . . . . . . 0.99 (0.70) (0.50) 0.44 0.14 0.38 (2.91)
Distributions from net investment income(e) . . . . . . . . . . . . . . . . . . . . . . . (0.03) (0.15) (0.14) (0.05) (0.07) — (0.00)(f)
Net asset value, end of period . . . . . . . . . . . . . . . . . . . . . . . . . . . . . . . . . . $ 7.29 $ 6.33 $ 7.18 $ 7.82 $ 7.43 $ 7.36 $ 6.98
Total Return(g)
Based on net asset value . . . . . . . . . . . . . . . . . . . . . . . . . . . . . . . . . . . . . . . . 15.61%(h) (9.96)%(h) (6.34)% 5.97% 1.89% 5.44% (29.41)%
Ratios to Average Net AssetsTotal expenses(i). . . . . . . . . . . . . . . . . . . . . . . . . . . . . . . . . . . . . . . . . . . . . . . . . 0.99%(j) 1.04%(j) 1.01% 1.14% 1.21% 1.39% 1.33%
Total expenses after fees waived and/or reimbursed(i) . . . . . . . . . . . . . 0.72%(j) 0.72%(j) 0.72% 0.88% 0.99% 1.26% 1.28%
Net investment income(i) . . . . . . . . . . . . . . . . . . . . . . . . . . . . . . . . . . . . . . . . . 0.75%(j) 1.61%(j) 1.90%(b) 0.90% 0.65%(c) 0.05% 0.00%(k)
Supplemental DataNet assets, end of period (000). . . . . . . . . . . . . . . . . . . . . . . . . . . . . . . . . . . $ 151,844 $ 104,275 $ 145,239 $ 200,786 $ 148,978 $ 107,021 $ 348,529
Portfolio turnover rate. . . . . . . . . . . . . . . . . . . . . . . . . . . . . . . . . . . . . . . . . . . . 34% 72% 76% 110% 96% 132% 85%
(a) Based on average shares outstanding.(b) Net investment income per share and the ratio of net investment income to average net assets includes $0.01 per share and 0.13%, respectively, resulting from a special dividend.(c) Net investment income per share and the ratio of net investment income to average net assets includes $0.02 per share and 0.20%, respectively, resulting from a special dividend.(d) Amount is less than $0.005 per share.(e) Distributions for annual periods determined in accordance with U.S. federal income tax regulations.(f) Amount is greater than $(0.005) per share.(g) Where applicable, assumes the reinvestment of distributions.(h) Aggregate total return.(i) Excludes expenses incurred indirectly as a result of investments in underlying funds as follows:
Six Months Ended11/30/20
(unaudited)
Period from08/01/19
to 05/31/20
Year Ended July 31,
2019 2018 2017 2016 2015
Investments in underlying funds . . . . . . . . . . . . . . . . . . . . . . . . . . . . . . . . —% —% —% 0.04% 0.04% 0.01% 0.01%
(j) Annualized.(k) Amount is less than 0.005%.
See notes to consolidated financial statements.
Consolidated Financial Highlights(For a share outstanding throughout each period)
C O N S O L I D A T E D F I N A N C I A L H I G H L I G H T S 19

BlackRock Commodity Strategies Fund (continued)
Investor A
Six Months Ended11/30/20
(unaudited)
Period from08/01/19
to 05/31/20
Year Ended July 31,
2019 2018 2017 2016 2015
Net asset value, beginning of period . . . . . . . . . . . . . . . . . . . . . . . . . . . . . . . . . . . . $ 6.28 $ 7.12 $ 7.74 $ 7.36 $ 7.29 $ 6.94 $ 9.85
Net investment income (loss)(a). . . . . . . . . . . . . . . . . . . . . . . . . . . . . . . . . . . . . . . . . 0.02 0.08 0.12(b) 0.06 0.03(c) (0.02) (0.02)Net realized and unrealized gain (loss) . . . . . . . . . . . . . . . . . . . . . . . . . . . . . . . . . 0.95 (0.79) (0.63) 0.36 0.10 0.37 (2.89)
Net increase (decrease) from investment operations . . . . . . . . . . . . . . . . . . . . . . . 0.97 (0.71) (0.51) 0.42 0.13 0.35 (2.91)
Distributions from net investment income(d) . . . . . . . . . . . . . . . . . . . . . . . . . . . . . . . . (0.02) (0.13) (0.11) (0.04) (0.06) — —
Net asset value, end of period. . . . . . . . . . . . . . . . . . . . . . . . . . . . . . . . . . . . . . . . . . . $ 7.23 $ 6.28 $ 7.12 $ 7.74 $ 7.36 $ 7.29 $ 6.94
Total Return(e)
Based on net asset value . . . . . . . . . . . . . . . . . . . . . . . . . . . . . . . . . . . . . . . . . . . . . . . . . 15.49%(f) (10.18)%(f) (6.50)% 5.69% 1.71% 5.04% (29.54)%
Ratios to Average Net AssetsTotal expenses(g) . . . . . . . . . . . . . . . . . . . . . . . . . . . . . . . . . . . . . . . . . . . . . . . . . . . . . . . . . 1.27%(h) 1.40%(h) 1.38% 1.55% 1.69% 1.97% 1.85%
Total expenses after fees waived and/or reimbursed(g) . . . . . . . . . . . . . . . . . . . . . 0.97%(h) 0.97%(h) 0.97% 1.11% 1.24% 1.45% 1.50%
Net investment income (loss)(g) . . . . . . . . . . . . . . . . . . . . . . . . . . . . . . . . . . . . . . . . . . . 0.52%(h) 1.38%(h) 1.68%(b) 0.73% 0.38%(c) (0.33)% (0.23)%
Supplemental DataNet assets, end of period (000) . . . . . . . . . . . . . . . . . . . . . . . . . . . . . . . . . . . . . . . . . . . $ 39,765 $ 23,628 $ 33,853 $ 56,622 $ 31,755 $ 23,652 $ 11,308
Portfolio turnover rate . . . . . . . . . . . . . . . . . . . . . . . . . . . . . . . . . . . . . . . . . . . . . . . . . . . . 34% 72% 76% 110% 96% 132% 85%
(a) Based on average shares outstanding.(b) Net investment income per share and the ratio of net investment income to average net assets includes $0.01 per share and 0.13%, respectively, resulting from a special dividend.(c) Net investment income per share and the ratio of net investment income to average net assets includes $0.02 per share and 0.20%, respectively, resulting from a special dividend.(d) Distributions for annual periods determined in accordance with U.S. federal income tax regulations.(e) Where applicable, excludes the effects of any sales charges and assumes the reinvestment of distributions.(f) Aggregate total return.(g) Excludes expenses incurred indirectly as a result of investments in underlying funds as follows:
Six Months Ended11/30/20
(unaudited)
Period from08/01/19
to 05/31/20
Year Ended July 31,
2019 2018 2017 2016 2015
Investments in underlying funds . . . . . . . . . . . . . . . . . . . . . . . . . . . . . . . . . . . . . . . . —% —% —% 0.04% 0.04% 0.01% 0.01%
(h) Annualized.
See notes to consolidated financial statements.
Consolidated Financial Highlights (continued)
(For a share outstanding throughout each period)
20 2 0 2 0 B L A C K R O C K S E M I - A N N U A L R E P O R T T O S H A R E H O L D E R S
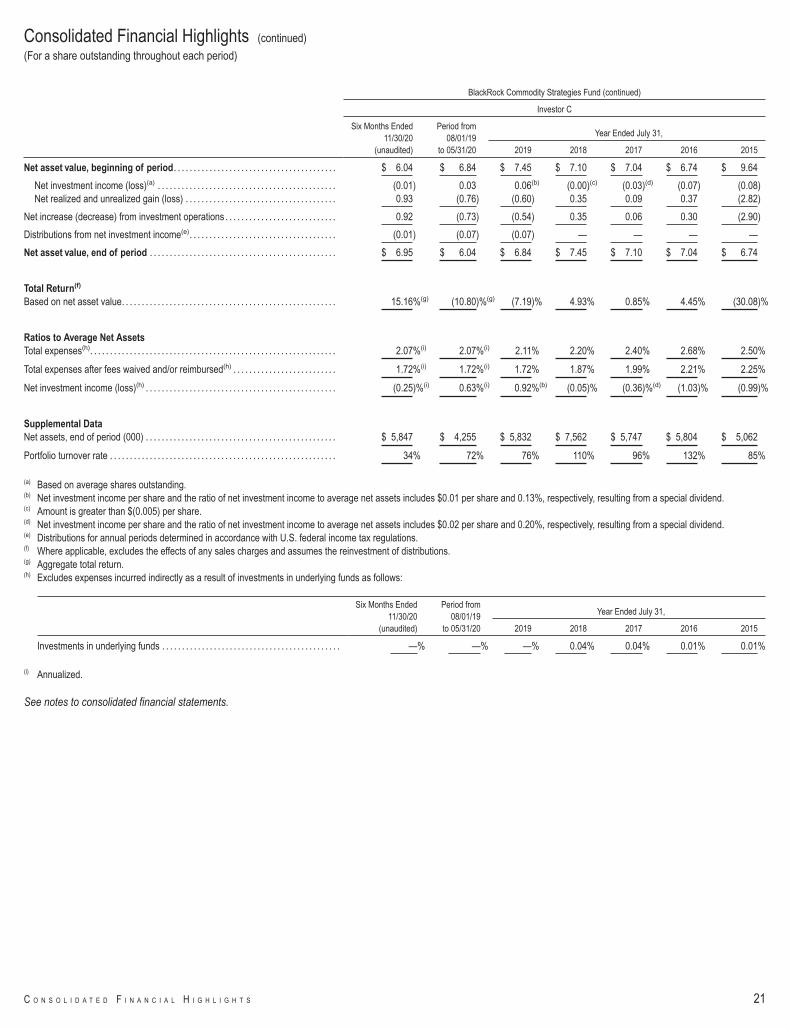
BlackRock Commodity Strategies Fund (continued)
Investor C
Six Months Ended11/30/20
(unaudited)
Period from08/01/19
to 05/31/20
Year Ended July 31,
2019 2018 2017 2016 2015
Net asset value, beginning of period. . . . . . . . . . . . . . . . . . . . . . . . . . . . . . . . . . . . . . . . . $ 6.04 $ 6.84 $ 7.45 $ 7.10 $ 7.04 $ 6.74 $ 9.64
Net investment income (loss)(a) . . . . . . . . . . . . . . . . . . . . . . . . . . . . . . . . . . . . . . . . . . . . . (0.01) 0.03 0.06(b) (0.00)(c) (0.03)(d) (0.07) (0.08)Net realized and unrealized gain (loss) . . . . . . . . . . . . . . . . . . . . . . . . . . . . . . . . . . . . . . 0.93 (0.76) (0.60) 0.35 0.09 0.37 (2.82)
Net increase (decrease) from investment operations . . . . . . . . . . . . . . . . . . . . . . . . . . . . 0.92 (0.73) (0.54) 0.35 0.06 0.30 (2.90)
Distributions from net investment income(e). . . . . . . . . . . . . . . . . . . . . . . . . . . . . . . . . . . . . (0.01) (0.07) (0.07) — — — —
Net asset value, end of period . . . . . . . . . . . . . . . . . . . . . . . . . . . . . . . . . . . . . . . . . . . . . . . $ 6.95 $ 6.04 $ 6.84 $ 7.45 $ 7.10 $ 7.04 $ 6.74
Total Return(f)
Based on net asset value. . . . . . . . . . . . . . . . . . . . . . . . . . . . . . . . . . . . . . . . . . . . . . . . . . . . . . 15.16%(g) (10.80)%(g) (7.19)% 4.93% 0.85% 4.45% (30.08)%
Ratios to Average Net AssetsTotal expenses(h). . . . . . . . . . . . . . . . . . . . . . . . . . . . . . . . . . . . . . . . . . . . . . . . . . . . . . . . . . . . . . 2.07%(i) 2.07%(i) 2.11% 2.20% 2.40% 2.68% 2.50%
Total expenses after fees waived and/or reimbursed(h) . . . . . . . . . . . . . . . . . . . . . . . . . . 1.72%(i) 1.72%(i) 1.72% 1.87% 1.99% 2.21% 2.25%
Net investment income (loss)(h) . . . . . . . . . . . . . . . . . . . . . . . . . . . . . . . . . . . . . . . . . . . . . . . . (0.25)%(i) 0.63%(i) 0.92%(b) (0.05)% (0.36)%(d) (1.03)% (0.99)%
Supplemental DataNet assets, end of period (000) . . . . . . . . . . . . . . . . . . . . . . . . . . . . . . . . . . . . . . . . . . . . . . . . $ 5,847 $ 4,255 $ 5,832 $ 7,562 $ 5,747 $ 5,804 $ 5,062
Portfolio turnover rate . . . . . . . . . . . . . . . . . . . . . . . . . . . . . . . . . . . . . . . . . . . . . . . . . . . . . . . . . 34% 72% 76% 110% 96% 132% 85%
(a) Based on average shares outstanding.(b) Net investment income per share and the ratio of net investment income to average net assets includes $0.01 per share and 0.13%, respectively, resulting from a special dividend.(c) Amount is greater than $(0.005) per share.(d) Net investment income per share and the ratio of net investment income to average net assets includes $0.02 per share and 0.20%, respectively, resulting from a special dividend.(e) Distributions for annual periods determined in accordance with U.S. federal income tax regulations.(f) Where applicable, excludes the effects of any sales charges and assumes the reinvestment of distributions.(g) Aggregate total return.(h) Excludes expenses incurred indirectly as a result of investments in underlying funds as follows:
Six Months Ended11/30/20
(unaudited)
Period from08/01/19
to 05/31/20
Year Ended July 31,
2019 2018 2017 2016 2015
Investments in underlying funds . . . . . . . . . . . . . . . . . . . . . . . . . . . . . . . . . . . . . . . . . . . . . —% —% —% 0.04% 0.04% 0.01% 0.01%
(i) Annualized.
See notes to consolidated financial statements.
Consolidated Financial Highlights (continued)
(For a share outstanding throughout each period)
C O N S O L I D A T E D F I N A N C I A L H I G H L I G H T S 21

BlackRock Commodity Strategies Fund (continued)
Class K
Six Months Ended11/30/20
(unaudited)
Period from08/01/19
to 05/31/20Year Ended
July 31, 2019
Period from01/25/18(a)
to 7/31/18
Net asset value, beginning of period . . . . . . . . . . . . . . . . . . . . . . . . . . . . . . . . . . . . . . . . . . . . . . . . . . . . . . . . . . . . . . . . . . . . . . . . $ 6.34 $ 7.19 $ 7.83 $ 8.27
Net investment income(b). . . . . . . . . . . . . . . . . . . . . . . . . . . . . . . . . . . . . . . . . . . . . . . . . . . . . . . . . . . . . . . . . . . . . . . . . . . . . . . . . . . 0.03 0.09 0.14(c) 0.07Net realized and unrealized gain (loss). . . . . . . . . . . . . . . . . . . . . . . . . . . . . . . . . . . . . . . . . . . . . . . . . . . . . . . . . . . . . . . . . . . . . . 0.96 (0.79) (0.63) (0.51)
Net increase (decrease) from investment operations . . . . . . . . . . . . . . . . . . . . . . . . . . . . . . . . . . . . . . . . . . . . . . . . . . . . . . . . . . . 0.99 (0.70) (0.49) (0.44)
Distributions from net investment income(d) . . . . . . . . . . . . . . . . . . . . . . . . . . . . . . . . . . . . . . . . . . . . . . . . . . . . . . . . . . . . . . . . . . . . (0.03) (0.15) (0.15) —
Net asset value, end of period . . . . . . . . . . . . . . . . . . . . . . . . . . . . . . . . . . . . . . . . . . . . . . . . . . . . . . . . . . . . . . . . . . . . . . . . . . . . . . . $ 7.30 $ 6.34 $ 7.19 $ 7.83
Total Return(e)
Based on net asset value . . . . . . . . . . . . . . . . . . . . . . . . . . . . . . . . . . . . . . . . . . . . . . . . . . . . . . . . . . . . . . . . . . . . . . . . . . . . . . . . . . . . . 15.61%(f) (9.90)%(f) (6.28)% (5.32)%(f)
Ratios to Average Net AssetsTotal expenses . . . . . . . . . . . . . . . . . . . . . . . . . . . . . . . . . . . . . . . . . . . . . . . . . . . . . . . . . . . . . . . . . . . . . . . . . . . . . . . . . . . . . . . . . . . . . . . 0.90%(g) 0.95%(g) 0.96% 0.92%(g)(h)(i)
Total expenses after fees waived and/or reimbursed. . . . . . . . . . . . . . . . . . . . . . . . . . . . . . . . . . . . . . . . . . . . . . . . . . . . . . . . . . . . 0.67%(g) 0.67%(g) 0.67% 0.74%(g)(h)(i)
Net investment income . . . . . . . . . . . . . . . . . . . . . . . . . . . . . . . . . . . . . . . . . . . . . . . . . . . . . . . . . . . . . . . . . . . . . . . . . . . . . . . . . . . . . . . 0.80%(g) 1.60%(g) 1.97%(c) 1.80%(g)(h)
Supplemental DataNet assets, end of period (000). . . . . . . . . . . . . . . . . . . . . . . . . . . . . . . . . . . . . . . . . . . . . . . . . . . . . . . . . . . . . . . . . . . . . . . . . . . . . . . . $ 28,713 $ 25,283 $ 22,520 $ 22,750
Portfolio turnover rate. . . . . . . . . . . . . . . . . . . . . . . . . . . . . . . . . . . . . . . . . . . . . . . . . . . . . . . . . . . . . . . . . . . . . . . . . . . . . . . . . . . . . . . . . 34% 72% 76% 110%
(a) Commencement of operations.(b) Based on average shares outstanding.(c) Net investment income per share and the ratio of net investment income to average net assets includes $0.01 per share and 0.13%, respectively, resulting from a special dividend.(d) Distributions for annual periods determined in accordance with U.S. federal income tax regulations.(e) Where applicable, assumes the reinvestment of distributions.(f) Aggregate total return.(g) Annualized.(h) Excludes expenses incurred indirectly as a result of investments in underlying funds of 0.04%.(i) Offering and board realignment and consolidation costs were not annualized in the calculation of the expense ratios. If these expenses were annualized, the total expenses and total
expenses after fees waived and/or reimbursed would have been 0.93% and 0.76%, respectively.
See notes to consolidated financial statements.
Consolidated Financial Highlights (continued)
(For a share outstanding throughout each period)
22 2 0 2 0 B L A C K R O C K S E M I - A N N U A L R E P O R T T O S H A R E H O L D E R S

1. ORGANIZATION
BlackRock FundsSM (the "Trust") is registered under the Investment Company Act of 1940, as amended (the “1940 Act”), as an open-end management investment company.The Trust is organized as a Massachusetts business trust. BlackRock Commodity Strategies Fund (the “Fund”) is a series of the Trust. The Fund is classified as diversified.
The Fund offers multiple classes of shares. All classes of shares have identical voting, dividend, liquidation and other rights and are subject to the same terms and conditions,except that certain classes bear expenses related to the shareholder servicing and distribution of such shares. Institutional and Class K Shares are sold only to certain eligibleinvestors. Investor A and Investor C Shares bear certain expenses related to shareholder servicing of such shares, and Investor C Shares also bear certain expenses relatedto the distribution of such shares. Investor A and Investor C Shares are generally available through financial intermediaries. Each class has exclusive voting rights with respectto matters relating to its shareholder servicing and distribution expenditures (except that Investor C shareholders may vote on material changes to the Investor A Sharesdistribution and service plan).
Share Class Initial Sales Charge CDSC Conversion Privilege
Institutional and Class K Shares . . . . . . . . . . . . . . . . . . . . . . . . . . . . . . . . . . . . . . . . . . . . . . . . . . . . . . . . . . . . . . . No No NoneInvestor A Shares. . . . . . . . . . . . . . . . . . . . . . . . . . . . . . . . . . . . . . . . . . . . . . . . . . . . . . . . . . . . . . . . . . . . . . . . . . . . . Yes No(a) NoneInvestor C Shares . . . . . . . . . . . . . . . . . . . . . . . . . . . . . . . . . . . . . . . . . . . . . . . . . . . . . . . . . . . . . . . . . . . . . . . . . . . . No Yes(b) To Investor A Shares after approximately 8 years(a) Investor A Shares may be subject to a contingent deferred sales charge ("CDSC") for certain redemptions where no initial sales charge was paid at the time of purchase.(b) A CDSC of 1.00% is assessed on certain redemptions of Investor C Shares made within one year after purchase.
The Fund, together with certain other registered investment companies advised by BlackRock Advisors, LLC (the “Manager”) or its affiliates, is included in a complex of equity,multi-asset, index and money market funds referred to as the BlackRock Multi-Asset Complex.
Basis of Consolidation: The accompanying consolidated financial statements of the Fund include the accounts of BlackRock Cayman Commodity Strategies Fund, Ltd. (the“Subsidiary”), which is a wholly-owned subsidiary of the Fund and primarily invests in commodity-related instruments and other derivatives. The Subsidiary enables the Fundto hold these commodity-related instruments and satisfy regulated investment company tax requirements. The Fund may invest up to 25% of its total assets in the Subsidiary.The net assets of the Subsidiary as of period end were $14,752,694, which is 6.5% of the Fund’s consolidated net assets. Intercompany accounts and transactions, if any, havebeen eliminated. The Subsidiary is subject to the same investment policies and restrictions that apply to the Fund, except that the Subsidiary may invest without limitation incommodity-related instruments.
2. SIGNIFICANT ACCOUNTING POLICIES
The consolidated financial statements are prepared in conformity with accounting principles generally accepted in the United States of America (“U.S. GAAP”), which mayrequire management to make estimates and assumptions that affect the reported amounts of assets and liabilities in the consolidated financial statements, disclosure ofcontingent assets and liabilities at the date of the consolidated financial statements and the reported amounts of increases and decreases in net assets from operations duringthe reporting period. Actual results could differ from those estimates. The Fund is considered an investment company under U.S. GAAP and follows the accounting andreporting guidance applicable to investment companies. Below is a summary of significant accounting policies:
Investment Transactions and Income Recognition: For financial reporting purposes, investment transactions are recorded on the dates the transactions are executed.Realized gains and losses on investment transactions are determined using the specific identification method. Dividend income and capital gain distributions, if any, arerecorded on the ex-dividend date. Non-cash dividends, if any, are recorded on the ex-dividend date at fair value. Dividends from foreign securities where the ex-dividend datemay have passed are subsequently recorded when the Fund is informed of the ex-dividend date. Under the applicable foreign tax laws, a withholding tax at various rates maybe imposed on capital gains, dividends and interest. Upon notification from issuers, a portion of the dividend income received from a real estate investment trust may beredesignated as a reduction of cost of the related investment and/or realized gain. Interest income, including amortization and accretion of premiums and discounts on debtsecurities, is recognized daily on an accrual basis. Income, expenses and realized and unrealized gains and losses are allocated daily to each class based on its relative netassets.
Foreign CurrencyTranslation: The Fund’s books and records are maintained in U.S. dollars. Securities and other assets and liabilities denominated in foreign currencies aretranslated into U.S. dollars using exchange rates determined as of the close of trading on the New York Stock Exchange (“NYSE”). Purchases and sales of investments arerecorded at the rates of exchange prevailing on the respective dates of such transactions. Generally, when the U.S. dollar rises in value against a foreign currency, theinvestments denominated in that currency will lose value; the opposite effect occurs if the U.S. dollar falls in relative value.
The Fund does not isolate the effect of fluctuations in foreign exchange rates from the effect of fluctuations in the market prices of investments for financial reporting purposes.Accordingly, the effects of changes in exchange rates on investments are not segregated in the Consolidated Statement of Operations from the effects of changes in marketprices of those investments, but are included as a component of net realized and unrealized gain (loss) from investments. The Fund reports realized currency gains (losses)on foreign currency related transactions as components of net realized gain (loss) for financial reporting purposes, whereas such components are generally treated as ordinaryincome for U.S. federal income tax purposes.
Foreign Taxes: The Fund may be subject to foreign taxes (a portion of which may be reclaimable) on income, stock dividends, capital gains on investments, or certain foreigncurrency transactions. All foreign taxes are recorded in accordance with the applicable foreign tax regulations and rates that exist in the foreign jurisdictions in which the Fundinvests. These foreign taxes, if any, are paid by the Fund and are reflected in its Consolidated Statement of Operations as follows: foreign taxes withheld at source arepresented as a reduction of income, foreign taxes on securities lending income are presented as a reduction of securities lending income, foreign taxes on stock dividends are
Notes to Consolidated Financial Statements (unaudited)
N O T E S T O C O N S O L I D A T E D F I N A N C I A L S T A T E M E N T S 23

presented as “Foreign taxes withheld”, and foreign taxes on capital gains from sales of investments and foreign taxes on foreign currency transactions are included in theirrespective net realized gain (loss) categories. Foreign taxes payable or deferred as of November 30, 2020, if any, are disclosed in the Consolidated Statement of Assets andLiabilities.
Segregation and Collateralization: In cases where the Fund enters into certain investments (e.g., swaps) that would be treated as “senior securities” for 1940 Act purposes,the Fund may segregate or designate on its books and records cash or liquid assets having a market value at least equal to the amount of its future obligations under suchinvestments. Doing so allows the investment to be excluded from treatment as a “senior security.” Furthermore, if required by an exchange or counterparty agreement, theFund may be required to deliver/deposit cash and/or securities to/with an exchange, or broker-dealer or custodian as collateral for certain investments or obligations.
Distributions: Distributions paid by the Fund are recorded on the ex-dividend dates. The character and timing of distributions are determined in accordance with U.S. federalincome tax regulations, which may differ from U.S. GAAP.
Net income and realized gains from investments held by the Subsidiary are treated as ordinary income for tax purposes. If a net loss is realized by the Subsidiary in any taxableyear, the loss will generally not be available to offset the Fund’s ordinary income and/or capital gains for that year.
Indemnifications: In the normal course of business, the Fund enters into contracts that contain a variety of representations that provide general indemnification. The Fund’smaximum exposure under these arrangements is unknown because it involves future potential claims against the Fund, which cannot be predicted with any certainty.
Other: Expenses directly related to the Fund or its classes are charged to the Fund or the applicable class. Expenses directly related to the Fund and other shared expensesprorated to the Fund are allocated daily to each class based on its relative net assets or other appropriate methods. Other operating expenses shared by several funds,including other funds managed by the Manager, are prorated among those funds on the basis of relative net assets or other appropriate methods.
The Fund has an arrangement with its custodian whereby credits are earned on uninvested cash balances, which could be used to reduce custody fees and/or overdraftcharges. The Fund may incur charges on overdrafts, subject to certain conditions.
3. INVESTMENT VALUATION AND FAIR VALUE MEASUREMENTS
Investment Valuation Policies: The Fund’s investments are valued at fair value (also referred to as “market value” within the consolidated financial statements) each day thatthe Fund is open for business and, for financial reporting purposes, as of the report date. U.S. GAAP defines fair value as the price the Fund would receive to sell an asset orpay to transfer a liability in an orderly transaction between market participants at the measurement date. The Fund determines the fair values of its financial instruments usingvarious independent dealers or pricing services under policies approved by the Board of Trustees of the Trust (the "Board"). If a security’s market price is not readily availableor does not otherwise accurately represent the fair value of the security, the security will be valued in accordance with a policy approved by the Board as reflecting fair value.The BlackRock Global Valuation Methodologies Committee (the “Global Valuation Committee”) is the committee formed by management to develop global pricing policies andprocedures and to oversee the pricing function for all financial instruments.
Fair Value Inputs and Methodologies: The following methods and inputs are used to establish the fair value of the Fund’s assets and liabilities:
• Equity investments traded on a recognized securities exchange are valued at that day’s official closing price, as applicable, on the exchange where the stock is primarilytraded. Equity investments traded on a recognized exchange for which there were no sales on that day may be valued at the last available bid (long positions) or ask(short positions) price.
Generally, trading in foreign instruments is substantially completed each day at various times prior to the close of trading on the Fund’s listing exchange. Occasionally,events affecting the values of such instruments may occur between the foreign market close and the close of trading on the Fund’s listing exchange that may not bereflected in the computation of the Fund’s net assets. Each business day, the Fund uses a pricing service to assist with the valuation of certain foreign exchange-tradedequity securities and foreign exchange-traded and over-the-counter (“OTC”) options (the “Systematic Fair Value Price”). Using current market factors, the SystematicFair Value Price is designed to value such foreign securities and foreign options at fair value as of the close of trading on the NYSE, which follows the close of the localmarkets.
• Fixed-income investments for which market quotations are readily available are generally valued using the last available bid prices or current market quotations providedby independent dealers or third party pricing services. Floating rate loan interests are valued at the mean of the bid prices from one or more independent brokers ordealers as obtained from a third party pricing service. Pricing services generally value fixed-income securities assuming orderly transactions of an institutional round lotsize, but a fund may hold or transact in such securities in smaller, odd lot sizes. Odd lots may trade at lower prices than institutional round lots. The pricing services mayuse matrix pricing or valuation models that utilize certain inputs and assumptions to derive values, including transaction data (e.g., recent representative bids and offers),market data, credit quality information, perceived market movements, news, and other relevant information. Certain fixed-income securities, including asset-backed andmortgage related securities may be valued based on valuation models that consider the estimated cash flows of each tranche of the entity, establish a benchmark yieldand develop an estimated tranche specific spread to the benchmark yield based on the unique attributes of the tranche. The amortized cost method of valuation may beused with respect to debt obligations with sixty days or less remaining to maturity.
• Investments in open-end U.S. mutual funds (including money market funds) are valued at that day’s published net asset value (“NAV”).
• The Fund values its investment in SL Liquidity Series, LLC, Money Market Series (the “Money Market Series”) at fair value, which is ordinarily based upon its pro rataownership in the underlying fund’s net assets.
• Swap agreements are valued utilizing quotes received daily by independent pricing services or through brokers, which are derived using daily swap curves and modelsthat incorporate a number of market data factors, such as discounted cash flows, trades and values of the underlying reference instruments.
Notes to Consolidated Financial Statements (unaudited) (continued)
24 2 0 2 0 B L A C K R O C K S E M I - A N N U A L R E P O R T T O S H A R E H O L D E R S

If events (e.g., a market closure, market volatility, company announcement or a natural disaster) occur that are expected to materially affect the value of such investment, orin the event that the application of these methods of valuation results in a price for an investment that is deemed not to be representative of the market value of suchinvestment, or if a price is not available, the investment will be valued by the Global Valuation Committee, or its delegate, in accordance with a policy approved by the Boardas reflecting fair value (“Fair Valued Investments”). The fair valuation approaches that may be used by the Global Valuation Committee will include market approach, incomeapproach and cost approach. Valuation techniques such as discounted cash flow, use of market comparables and matrix pricing are types of valuation approaches and aretypically used in determining fair value. When determining the price for Fair Valued Investments, the Global Valuation Committee, or its delegate, seeks to determine the pricethat the Fund might reasonably expect to receive or pay from the current sale or purchase of that asset or liability in an arm’s-length transaction. Fair value determinations shallbe based upon all available factors that the Global Valuation Committee, or its delegate, deems relevant and consistent with the principles of fair value measurement. Thepricing of all Fair Valued Investments is subsequently reported to the Board or a committee thereof on a quarterly basis.
For investments in equity or debt issued by privately held companies or funds (“Private Company” or collectively, the “Private Companies”) and other Fair Valued Investments,the fair valuation approaches that are used by the Global Valuation Committee and third party pricing services utilize one or a combination of, but not limited to, the followinginputs.
Standard Inputs Generally Considered By Third Party Pricing Services
Market approach . . . . . . . . . . . . . . . . . . . . . . . . . . . (i) recent market transactions, including subsequent rounds of financing, in the underlying investment or comparable issuers;(ii) recapitalizations and other transactions across the capital structure; and(iii) market multiples of comparable issuers.
Income approach . . . . . . . . . . . . . . . . . . . . . . . . . . . (i) future cash flows discounted to present and adjusted as appropriate for liquidity, credit and/or market risks;(ii) quoted prices for similar investments or assets in active markets; and(iii) other risk factors, such as interest rates, yield curves, volatilities, prepayment speeds, loss severities, credit risks, recovery rates,
liquidation amounts and/or default rates.
Cost approach. . . . . . . . . . . . . . . . . . . . . . . . . . . . . . (i) audited or unaudited financial statements, investor communications and financial or operational metrics issued by the PrivateCompany;
(ii) changes in the valuation of relevant indices or publicly traded companies comparable to the Private Company;(iii) relevant news and other public sources; and(iv) known secondary market transactions in the Private Company’s interests and merger or acquisition activity in companies
comparable to the Private Company.
Investments in series of preferred stock issued by Private Companies are typically valued utilizing market approach in determining the enterprise value of the company. Suchinvestments often contain rights and preferences that differ from other series of preferred and common stock of the same issuer. Valuation techniques such as an option pricingmodel (“OPM”), a probability weighted expected return model (“PWERM”) or a hybrid of those techniques are used in allocating enterprise value of the company, as deemedappropriate under the circumstances. The use of OPM and PWERM techniques involve a determination of the exit scenarios of the investment in order to appropriately allocatethe enterprise value of the company among the various parts of its capital structure.
The Private Companies are not subject to the public company disclosure, timing, and reporting standards applicable to other investments held by the Fund. Typically, the mostrecently available information by a Private Company is as of a date that is earlier than the date the Fund is calculating its NAV. This factor may result in a difference betweenthe value of the investment and the price the Fund could receive upon the sale of the investment.
Fair Value Hierarchy: Various inputs are used in determining the fair value of financial instruments. These inputs to valuation techniques are categorized into a fair valuehierarchy consisting of three broad levels for financial reporting purposes as follows:
• Level 1 – Unadjusted price quotations in active markets/exchanges for identical assets or liabilities that the Fund has the ability to access
• Level 2 – Other observable inputs (including, but not limited to, quoted prices for similar assets or liabilities in markets that are active, quoted prices for identical or similarassets or liabilities in markets that are not active, inputs other than quoted prices that are observable for the assets or liabilities (such as interest rates, yield curves,volatilities, prepayment speeds, loss severities, credit risks and default rates) or other market–corroborated inputs)
• Level 3 – Unobservable inputs based on the best information available in the circumstances, to the extent observable inputs are not available (including the GlobalValuation Committee’s assumptions used in determining the fair value of financial instruments)
The hierarchy gives the highest priority to unadjusted quoted prices in active markets for identical assets or liabilities (Level 1 measurements) and the lowest priority tounobservable inputs (Level 3 measurements). Accordingly, the degree of judgment exercised in determining fair value is greatest for instruments categorized in Level 3. Theinputs used to measure fair value may fall into different levels of the fair value hierarchy. In such cases, for disclosure purposes, the fair value hierarchy classification isdetermined based on the lowest level input that is significant to the fair value measurement in its entirety. Investments classified within Level 3 have significant unobservableinputs used by the Global Valuation Committee in determining the price for Fair Valued Investments. Level 3 investments include equity or debt issued by Private Companiesthat may not have a secondary market and/or may have a limited number of investors. The categorization of a value determined for financial instruments is based on the pricingtransparency of the financial instruments and is not necessarily an indication of the risks associated with investing in those securities.
As of November 30, 2020, certain investments of the Fund were fair valued using NAV per share as no quoted market value is available and therefore have been excluded fromthe fair value hierarchy.
Notes to Consolidated Financial Statements (unaudited) (continued)
N O T E S T O C O N S O L I D A T E D F I N A N C I A L S T A T E M E N T S 25

4. SECURITIES AND OTHER INVESTMENTS
Warrants: Warrants entitle a fund to purchase a specified number of shares of common stock and are non-income producing. The purchase price and number of shares aresubject to adjustment under certain conditions until the expiration date of the warrants, if any. If the price of the underlying stock does not rise above the strike price before thewarrant expires, the warrant generally expires without any value and a fund will lose any amount it paid for the warrant. Thus, investments in warrants may involve more riskthan investments in common stock. Warrants may trade in the same markets as their underlying stock; however, the price of the warrant does not necessarily move with theprice of the underlying stock.
Securities Lending: The Fund may lend its securities to approved borrowers, such as brokers, dealers and other financial institutions. The borrower pledges and maintainswith the Fund collateral consisting of cash, an irrevocable letter of credit issued by a bank, or securities issued or guaranteed by the U.S. Government. The initial collateralreceived by the Fund is required to have a value of at least 102% of the current value of the loaned securities for securities traded on U.S. exchanges and a value of at least105% for all other securities. The collateral is maintained thereafter at a value equal to at least 100% of the current market value of the securities on loan. The market value ofthe loaned securities is determined at the close of each business day of the Fund and any additional required collateral is delivered to the Fund, or excess collateral returnedby the Fund, on the next business day. During the term of the loan, the Fund is entitled to all distributions made on or in respect of the loaned securities, but does not receiveinterest income on securities received as collateral. Loans of securities are terminable at any time and the borrower, after notice, is required to return borrowed securities withinthe standard time period for settlement of securities transactions.
The market value of any securities on loan, all of which were classified as common stocks in the Fund’s Consolidated Schedule of Investments, and the value of any relatedcollateral are shown separately in the Consolidated Statement of Assets and Liabilities as a component of investments at value – unaffiliated, and collateral on securitiesloaned at value, respectively. As of period end, any securities on loan were collateralized by cash and/or U.S. Government obligations. Cash collateral invested by thesecurities lending agent, BlackRock Investment Management, LLC (“BIM”), if any, is disclosed in the Consolidated Schedule of Investments.
Securities lending transactions are entered into by the Fund under Master Securities Lending Agreements (each, an “MSLA”), which provide the right, in the event of default(including bankruptcy or insolvency), for the non-defaulting party to liquidate the collateral and calculate a net exposure to the defaulting party or request additional collateral.In the event that a borrower defaults, the Fund, as lender, would offset the market value of the collateral received against the market value of the securities loaned. When thevalue of the collateral is greater than that of the market value of the securities loaned, the lender is left with a net amount payable to the defaulting party. However, bankruptcyor insolvency laws of a particular jurisdiction may impose restrictions on or prohibitions against such a right of offset in the event of an MSLA counterparty’s bankruptcy orinsolvency. Under the MSLA, absent an event of default, the borrower can resell or re-pledge the loaned securities, and the Fund can reinvest cash collateral received inconnection with loaned securities. Upon an event of default, the parties’ obligations to return the securities or collateral to the other party are extinguished, and the parties canresell or re-pledge the loaned securities or the collateral received in connection with the loaned securities in order to satisfy the defaulting party’s net payment obligation for alltransactions under the MSLA. The defaulting party remains liable for any deficiency.
As of period end, the following table is a summary of the Fund’s securities on loan by counterparty which are subject to offset under an MSLA:
CounterpartySecurities
Loaned at ValueCash
Collateral Received(a)Net
Amount
BofA Securities, Inc. . . . . . . . . . . . . . . . . . . . . . . . . . . . . . . . . . . . . . . . . . . . . . . . . . . . . . . . . . . . . . . . . . . . . . . . . . . . . . . . . . . . . . . . . . . . . . . . . . . $ 31,011 $ (31,011) $ —Citigroup Global Markets, Inc.. . . . . . . . . . . . . . . . . . . . . . . . . . . . . . . . . . . . . . . . . . . . . . . . . . . . . . . . . . . . . . . . . . . . . . . . . . . . . . . . . . . . . . . . . 667,725 (667,725) —National Financial Services LLC . . . . . . . . . . . . . . . . . . . . . . . . . . . . . . . . . . . . . . . . . . . . . . . . . . . . . . . . . . . . . . . . . . . . . . . . . . . . . . . . . . . . . . 347,917 (347,917) —
$ 1,046,653 $ (1,046,653) $ —
(a) Collateral received in excess of the market value of securities on loan is not presented in this table. The total cash collateral received by the Fund is disclosed in the Fund’s ConsolidatedStatement of Assets and Liabilities.
The risks of securities lending include the risk that the borrower may not provide additional collateral when required or may not return the securities when due. To mitigate theserisks, the Fund benefits from a borrower default indemnity provided by BIM. BIM’s indemnity allows for full replacement of the securities loaned to the extent the collateralreceived does not cover the value on the securities loaned in the event of borrower default. The Fund could incur a loss if the value of an investment purchased with cashcollateral falls below the market value of loaned securities or if the value of an investment purchased with cash collateral falls below the value of the original cash collateralreceived. Such losses are borne entirely by the Fund.
5. DERIVATIVE FINANCIAL INSTRUMENTS
The Fund engages in various portfolio investment strategies using derivative contracts both to increase the returns of the Fund and/or to manage its exposure to certain riskssuch as credit risk, equity risk, interest rate risk, foreign currency exchange rate risk, commodity price risk or other risks (e.g., inflation risk). Derivative financial instrumentscategorized by risk exposure are included in the Consolidated Schedule of Investments. These contracts may be transacted on an exchange or OTC.
Swaps: Swap contracts are entered into to manage exposure to issuers, markets and securities. Such contracts are agreements between the Fund and a counterparty tomake periodic net payments on a specified notional amount or a net payment upon termination. Swap agreements are privately negotiated in the OTC market and may beentered into as a bilateral contract (“OTC swaps”) or centrally cleared (“centrally cleared swaps”).
For OTC swaps, any upfront premiums paid and any upfront fees received are shown as swap premiums paid and swap premiums received, respectively, in the ConsolidatedStatement of Assets and Liabilities and amortized over the term of the contract. The daily fluctuation in market value is recorded as unrealized appreciation (depreciation) onOTC Swaps in the Consolidated Statement of Assets and Liabilities. Payments received or paid are recorded in the Consolidated Statement of Operations as realized gains
Notes to Consolidated Financial Statements (unaudited) (continued)
26 2 0 2 0 B L A C K R O C K S E M I - A N N U A L R E P O R T T O S H A R E H O L D E R S

or losses, respectively. When an OTC swap is terminated, a realized gain or loss is recorded in the Consolidated Statement of Operations equal to the difference between theproceeds from (or cost of) the closing transaction and the Fund’s basis in the contract, if any. Generally, the basis of the contract is the premium received or paid.
In a centrally cleared swap, immediately following execution of the swap contract, the swap contract is novated to a central counterparty (the “CCP”) and the CCP becomes theFund’s counterparty on the swap. The Fund is required to interface with the CCP through the broker. Upon entering into a centrally cleared swap, the Fund is required to depositinitial margin with the broker in the form of cash or securities in an amount that varies depending on the size and risk profile of the particular swap. Securities deposited as initialmargin are designated in the Consolidated Schedule of Investments and cash deposited is shown as cash pledged for centrally cleared swaps in the Consolidated Statementof Assets and Liabilities. Amounts pledged, which are considered restricted cash, are included in cash pledged for centrally cleared swaps in the Consolidated Statement ofAssets and Liabilities. Pursuant to the contract, the Fund agrees to receive from or pay to the broker an amount of cash equal to the daily fluctuation in market value of thecontract (“variation margin”). Variation margin is recorded as unrealized appreciation (depreciation) and shown as variation margin receivable (or payable) on centrally clearedswaps in the Consolidated Statement of Assets and Liabilities. Payments received from (paid to) the counterparty are amortized over the term of the contract and recorded asrealized gains (losses) in the Consolidated Statement of Operations, including those at termination.
• Total return swaps — Total return swaps are entered into to obtain exposure to a security or market without owning such security or investing directly in such market orto exchange the risk/return of one security or market (e.g., fixed-income) with another security or market (e.g., equity or commodity prices) (equity risk, commodity pricerisk and/or interest rate risk).
Total return swaps are agreements in which there is an exchange of cash flows whereby one party commits to make payments based on the total return (distributions pluscapital gains/losses) of an underlying instrument, or basket of underlying instruments, in exchange for fixed or floating rate interest payments. If the total return of theinstrument(s) or index underlying the transaction exceeds or falls short of the offsetting fixed or floating interest rate obligation, the Fund receives payment from or makesa payment to the counterparty.
Swap transactions involve, to varying degrees, elements of interest rate, credit and market risk in excess of the amounts recognized in the Consolidated Statement of Assetsand Liabilities. Such risks involve the possibility that there will be no liquid market for these agreements, that the counterparty to the agreements may default on its obligationto perform or disagree as to the meaning of the contractual terms in the agreements, and that there may be unfavorable changes in interest rates and/or market valuesassociated with these transactions.
Master Netting Arrangements: In order to define its contractual rights and to secure rights that will help it mitigate its counterparty risk, a Fund may enter into an InternationalSwaps and Derivatives Association, Inc. Master Agreement (“ISDA Master Agreement”) or similar agreement with its counterparties. An ISDA Master Agreement is a bilateralagreement between a Fund and a counterparty that governs certain OTC derivatives and typically contains, among other things, collateral posting terms and netting provisionsin the event of a default and/or termination event. Under an ISDA Master Agreement, a Fund may, under certain circumstances, offset with the counterparty certain derivativefinancial instruments’ payables and/or receivables with collateral held and/or posted and create one single net payment. The provisions of the ISDA Master Agreement typicallypermit a single net payment in the event of default including the bankruptcy or insolvency of the counterparty. However, bankruptcy or insolvency laws of a particular jurisdictionmay impose restrictions on or prohibitions against the right of offset in bankruptcy, insolvency or other events.
Collateral Requirements: For derivatives traded under an ISDA Master Agreement, the collateral requirements are typically calculated by netting the mark-to-market amountfor each transaction under such agreement and comparing that amount to the value of any collateral currently pledged by the Fund and the counterparty.
Cash collateral that has been pledged to cover obligations of the Fund and cash collateral received from the counterparty, if any, is reported separately in the ConsolidatedStatement of Assets and Liabilities as cash pledged as collateral and cash received as collateral, respectively. Non-cash collateral pledged by the Fund, if any, is noted in theConsolidated Schedule of Investments. Generally, the amount of collateral due from or to a counterparty is subject to a certain minimum transfer amount threshold before atransfer is required, which is determined at the close of business of the Fund. Any additional required collateral is delivered to/pledged by the Fund on the next business day.Typically, the counterparty is not permitted to sell, re-pledge or use cash and non-cash collateral it receives. The Fund generally agrees not to use non-cash collateral that itreceives but may, absent default or certain other circumstances defined in the underlying ISDA Master Agreement, be permitted to use cash collateral received. In such cases,interest may be paid pursuant to the collateral arrangement with the counterparty. To the extent amounts due to the Fund from the counterparties are not fully collateralized, theFund bears the risk of loss from counterparty non-performance. Likewise, to the extent the Fund has delivered collateral to a counterparty and stands ready to perform underthe terms of its agreement with such counterparty, the Fund bears the risk of loss from a counterparty in the amount of the value of the collateral in the event the counterpartyfails to return such collateral. Based on the terms of agreements, collateral may not be required for all derivative contracts.
For financial reporting purposes, the Fund does not offset derivative assets and derivative liabilities that are subject to netting arrangements, if any, in the ConsolidatedStatement of Assets and Liabilities.
6. INVESTMENT ADVISORY AGREEMENT AND OTHER TRANSACTIONS WITH AFFILIATES
Investment Advisory: The Trust, on behalf of the Fund, entered into an Investment Advisory Agreement with the Manager, the Fund’s investment adviser and an indirect,wholly-owned subsidiary of BlackRock, Inc. (“BlackRock”), to provide investment advisory and administrative services. The Manager is responsible for the management of theFund’s portfolio and provides the personnel, facilities, equipment and certain other services necessary to the operations of the Fund.
Notes to Consolidated Financial Statements (unaudited) (continued)
N O T E S T O C O N S O L I D A T E D F I N A N C I A L S T A T E M E N T S 27

For such services, the Fund pays the Manager a monthly fee at an annual rate equal to the following percentages of the average daily value of the Fund’s net assets:
Average Daily Net Assets Investment Advisory Fees
First $1 billion . . . . . . . . . . . . . . . . . . . . . . . . . . . . . . . . . . . . . . . . . . . . . . . . . . . . . . . . . . . . . . . . . . . . . . . . . . . . . . . . . . . . . . . . . . . . . . . . . . . . . . . . . . . . . . . . . . . . . . . . . . . . . . . . . . . . . . 0.62%$1 billion - $3 billion . . . . . . . . . . . . . . . . . . . . . . . . . . . . . . . . . . . . . . . . . . . . . . . . . . . . . . . . . . . . . . . . . . . . . . . . . . . . . . . . . . . . . . . . . . . . . . . . . . . . . . . . . . . . . . . . . . . . . . . . . . . . . . . . 0.58$3 billion - $5 billion . . . . . . . . . . . . . . . . . . . . . . . . . . . . . . . . . . . . . . . . . . . . . . . . . . . . . . . . . . . . . . . . . . . . . . . . . . . . . . . . . . . . . . . . . . . . . . . . . . . . . . . . . . . . . . . . . . . . . . . . . . . . . . . . 0.56$5 billion - $10 billion . . . . . . . . . . . . . . . . . . . . . . . . . . . . . . . . . . . . . . . . . . . . . . . . . . . . . . . . . . . . . . . . . . . . . . . . . . . . . . . . . . . . . . . . . . . . . . . . . . . . . . . . . . . . . . . . . . . . . . . . . . . . . . . 0.54Greater than $10 billion. . . . . . . . . . . . . . . . . . . . . . . . . . . . . . . . . . . . . . . . . . . . . . . . . . . . . . . . . . . . . . . . . . . . . . . . . . . . . . . . . . . . . . . . . . . . . . . . . . . . . . . . . . . . . . . . . . . . . . . . . . . . . 0.53
The Manager provides investment management and other services to the Subsidiary. The Manager does not receive separate compensation from the Subsidiary for providinginvestment management or administrative services. However, the Fund pays the Manager based on the Fund’s net assets, which includes the assets of the Subsidiary.
With respect to the Fund, the Manager entered into a sub-advisory agreement with BlackRock International Limited (“BIL”), an affiliate of the Manager. The Manager pays BILfor services it provides for that portion of the Fund for which BIL acts as sub-adviser, a monthly fee that is equal to a percentage of the investment advisory fees paid by theFund to the Manager.
Service and Distribution Fees: The Trust, on behalf of the Fund, entered into a Distribution Agreement and a Distribution and Service Plan with BlackRock Investments, LLC(“BRIL”), an affiliate of the Manager. Pursuant to the Distribution and Service Plan and in accordance with Rule 12b-1 under the 1940 Act, the Fund pays BRIL ongoing serviceand distribution fees. The fees are accrued daily and paid monthly at annual rates based upon the average daily net assets of the relevant share class of the Fund as follows:
Share Class Service Fees Distribution Fees
Investor A . . . . . . . . . . . . . . . . . . . . . . . . . . . . . . . . . . . . . . . . . . . . . . . . . . . . . . . . . . . . . . . . . . . . . . . . . . . . . . . . . . . . . . . . . . . . . . . . . . . . . . . . . . . . . . . . . . . . . . . . . . . . . . . 0.25% N/AInvestor C . . . . . . . . . . . . . . . . . . . . . . . . . . . . . . . . . . . . . . . . . . . . . . . . . . . . . . . . . . . . . . . . . . . . . . . . . . . . . . . . . . . . . . . . . . . . . . . . . . . . . . . . . . . . . . . . . . . . . . . . . . . . . . . 0.25 0.75%
BRIL and broker-dealers, pursuant to sub-agreements with BRIL, provide shareholder servicing and distribution services to the Fund. The ongoing service and/or distributionfee compensates BRIL and each broker-dealer for providing shareholder servicing and/or distribution related services to shareholders.
For the six months ended November 30, 2020, the following table shows the class specific service and distribution fees borne directly by each share class of the Fund:
Investor A Investor C Total
Service and distribution fees — class specific . . . . . . . . . . . . . . . . . . . . . . . . . . . . $ 41,555 $ 27,250 $ 68,805
Administration: The Trust, on behalf of the Fund, entered into an Administration Agreement with the Manager, an indirect, wholly-owned subsidiary of BlackRock, to provideadministrative services. For these services, the Manager receives an administration fee computed daily and payable monthly, based on a percentage of the average daily netassets of the Fund. The administration fee, which is shown as administration in the Consolidated Statement of Operations, is paid at the annual rates below.
Average Daily Net Assets Administration Fees
First $500 million . . . . . . . . . . . . . . . . . . . . . . . . . . . . . . . . . . . . . . . . . . . . . . . . . . . . . . . . . . . . . . . . . . . . . . . . . . . . . . . . . . . . . . . . . . . . . . . . . . . . . . . . . . . . . . . . . . . . . . . . . . . . . . . . . . . . . . . . 0.0425%$500 million - $1 billion. . . . . . . . . . . . . . . . . . . . . . . . . . . . . . . . . . . . . . . . . . . . . . . . . . . . . . . . . . . . . . . . . . . . . . . . . . . . . . . . . . . . . . . . . . . . . . . . . . . . . . . . . . . . . . . . . . . . . . . . . . . . . . . . . . . 0.0400$1 billion - $2 billion. . . . . . . . . . . . . . . . . . . . . . . . . . . . . . . . . . . . . . . . . . . . . . . . . . . . . . . . . . . . . . . . . . . . . . . . . . . . . . . . . . . . . . . . . . . . . . . . . . . . . . . . . . . . . . . . . . . . . . . . . . . . . . . . . . . . . . 0.0375$2 billion - $4 billion. . . . . . . . . . . . . . . . . . . . . . . . . . . . . . . . . . . . . . . . . . . . . . . . . . . . . . . . . . . . . . . . . . . . . . . . . . . . . . . . . . . . . . . . . . . . . . . . . . . . . . . . . . . . . . . . . . . . . . . . . . . . . . . . . . . . . . 0.0350$4 billion - $13 billion. . . . . . . . . . . . . . . . . . . . . . . . . . . . . . . . . . . . . . . . . . . . . . . . . . . . . . . . . . . . . . . . . . . . . . . . . . . . . . . . . . . . . . . . . . . . . . . . . . . . . . . . . . . . . . . . . . . . . . . . . . . . . . . . . . . . . 0.0325Greater than $13 billion . . . . . . . . . . . . . . . . . . . . . . . . . . . . . . . . . . . . . . . . . . . . . . . . . . . . . . . . . . . . . . . . . . . . . . . . . . . . . . . . . . . . . . . . . . . . . . . . . . . . . . . . . . . . . . . . . . . . . . . . . . . . . . . . . . 0.0300
In addition, the Manager charges each of the share classes an administration fee, which is shown as administration — class specific in the Consolidated Statement ofOperations, at an annual rate of 0.02% of the average daily net assets of each respective class.
For the six months ended November 30, 2020, the Fund paid the following to the Manager in return for these services, which are included in administration — class specific inthe Consolidated Statement of Operations:
Institutional Investor A Investor C Class K Total
Administration fees — class specific . . . . . . . . . . . . . . . . . . . . . . . . . . . . . . . . . . . . . $ 13,143 $ 3,317 $ 545 $ 2,758 $ 19,763
Transfer Agent: Pursuant to written agreements, certain financial intermediaries, some of which may be affiliates, provide the Fund with sub-accounting, recordkeeping,sub-transfer agency and other administrative services with respect to servicing of underlying investor accounts. For these services, these entities receive an asset-based feeor an annual fee per shareholder account, which will vary depending on share class and/or net assets. For the six months ended November 30, 2020, the Fund did not pay anyamounts to affiliates in return for these services.
The Manager maintains a call center that is responsible for providing certain shareholder services to the Fund. Shareholder services include responding to inquiries andprocessing purchases and sales based upon instructions from shareholders. For the six months ended November 30, 2020, the Fund reimbursed the Manager the followingamounts for costs incurred in running the call center, which are included in transfer agent — class specific in the Consolidated Statement of Operations:
Institutional Investor A Investor C Class K Total
Reimbursed amounts . . . . . . . . . . . . . . . . . . . . . . . . . . . . . . . . . . . . . . . . . . . . . . . . . . . $ 220 $ 578 $ 69 $ 33 $ 900
Notes to Consolidated Financial Statements (unaudited) (continued)
28 2 0 2 0 B L A C K R O C K S E M I - A N N U A L R E P O R T T O S H A R E H O L D E R S

For the six months ended November 30, 2020, the following table shows the class specific transfer agent fees borne directly by each share class of the Fund:
Institutional Investor A Investor C Class K Total
Transfer agent fees — class specific . . . . . . . . . . . . . . . . . . . . . . . . . . . . . . . . . . . . . $ 74,132 $ 24,149 $ 5,457 $ 3,226 $ 106,964
Other Fees: For the six months ended November 30, 2020, affiliates earned underwriting discounts, direct commissions and dealer concessions on sales of the Fund’sInvestor A Shares of $3,363.
For the six months ended November 30, 2020, affiliates received CDSCs as follows:
Share Class Amounts
Investor A . . . . . . . . . . . . . . . . . . . . . . . . . . . . . . . . . . . . . . . . . . . . . . . . . . . . . . . . . . . . . . . . . . . . . . . . . . . . . . . . . . . . . . . . . . . . . . . . . . . . . . . . . . . . . . . . . . . . . . . . . . . . . . . . . . . . . . . . . . . . . . . . . . . . . . . . . . . . $ 450Investor C. . . . . . . . . . . . . . . . . . . . . . . . . . . . . . . . . . . . . . . . . . . . . . . . . . . . . . . . . . . . . . . . . . . . . . . . . . . . . . . . . . . . . . . . . . . . . . . . . . . . . . . . . . . . . . . . . . . . . . . . . . . . . . . . . . . . . . . . . . . . . . . . . . . . . . . . . . . . 787
$ 1,237
Expense Limitations, Waivers and Reimbursements: The Manager contractually agreed to waive its investment advisory fees by the amount of investment advisory feesthe Fund pays to the Manager indirectly through its investment in affiliated money market funds (the “affiliated money market fund waiver”) through September 30, 2021. Thecontractual agreement may be terminated upon 90 days’ notice by a majority of the trustees who are not “interested persons” of the Trust, as defined in the 1940 Act(“Independent Trustees”), or by a vote of a majority of the outstanding voting securities of the Fund. The amount of waivers and/or reimbursements of fees and expenses madepursuant to the expense limitation described below will be reduced by the amount of the affiliated money market fund waiver. This amount is included in fees waived and/orreimbursed by the Manager in the Consolidated Statement of Operations. For the six months ended November 30, 2020, the amount waived was $1,299.
The Manager has contractually agreed to waive its investment advisory fee with respect to any portion of the Fund’s assets invested in affiliated equity and fixed-income mutualfunds and affiliated exchange-traded funds that have a contractual management fee through September 30, 2021. The contractual agreement may be terminated upon90 days’ notice by a majority of the Independent Trustees, or by a vote of a majority of the outstanding voting securities of the Fund. For the six months ended November 30,2020, there were no fees waived and/or reimbursed by the Manager pursuant to this arrangement.
The Manager contractually agreed to waive and/or reimburse fees or expenses in order to limit expenses, excluding interest expense, dividend expense, tax expense, acquiredfund fees and expenses, and certain other fund expenses, which constitute extraordinary expenses not incurred in the ordinary course of the Fund’s business (“expenselimitation”). The expense limitations as a percentage of average daily net assets are as follows:
Institutional Investor A Investor C Class K
0.72% 0.97% 1.72% 0.67%
The Manager has agreed not to reduce or discontinue these contractual expense limitations through September 30, 2021, unless approved by the Board, including a majorityof the Independent Trustees, or by a vote of a majority of the outstanding voting securities of the Fund. For the six months ended November 30, 2020, the Manager waivedand/or reimbursed $181,445, which are included in fees waived and/or reimbursed by the Manager in the Consolidated Statement of Operations.
In addition, these amounts waived and/or reimbursed by the Manager are included in administration fees waived — class specific and transfer agent fees waived and/orreimbursed — class specific, respectively, in the Consolidated Statement of Operations. For the six months ended November 30, 2020, class specific expense waivers and/orreimbursements are as follows:
Institutional Investor A Investor C Class K Total
Administration fees waived — class specific . . . . . . . . . . . . . . . . . . . . . . . . . . . . . . . . . . . . . . . . . . . . . . . . . . . . . . . . . . . . $ 13,143 $ 3,317 $ 545 $ 2,758 $ 19,763Transfer agent fees waived and/or reimbursed — class specific. . . . . . . . . . . . . . . . . . . . . . . . . . . . . . . . . . . . . . . . . . 41,225 15,783 4,017 3,226 64,251
Securities Lending: The U.S. Securities and Exchange Commission (“SEC”) has issued an exemptive order which permits BIM, an affiliate of the Manager, to serve assecurities lending agent for the Fund, subject to applicable conditions. As securities lending agent, BIM bears all operational costs directly related to securities lending. TheFund is responsible for expenses in connection with the investment of cash collateral received for securities on loan (the “collateral investment expenses”). The cash collateralis invested in a private investment company, SL Liquidity Series, LLC (“Money Market Series”), managed by the Manager or its affiliates. However, BIM has agreed to cap thecollateral investment expenses of the Money Market Series to an annual rate of 0.04%. The investment adviser to the Money Market Series will not charge any advisory feeswith respect to shares purchased by the Fund. The Money Market Series may, under certain circumstances, impose a liquidity fee of up to 2% of the value withdrawn ortemporarily restrict withdrawals for up to 10 business days during a 90 day period, in the event that the private investment company’s weekly liquid assets fall below certainthresholds.The Money Market Series seeks current income consistent with maintaining liquidity and preserving capital. Although the Money Market Series is not registeredunder the 1940 Act, its investments may follow the parameters of investments by a money market fund that is subject to Rule 2a-7 under the 1940 Act.
Securities lending income is equal to the total of income earned from the reinvestment of cash collateral, net of fees and other payments to and from borrowers of securities,and less the collateral investment expenses. The Fund retains a portion of securities lending income and remits a remaining portion to BIM as compensation for its services assecurities lending agent.
Pursuant to the current securities lending agreement, the Fund retains 82% of securities lending income (which excludes collateral investment expenses), and this amountretained can never be less than 70% of the total of securities lending income plus the collateral investment expenses.
Notes to Consolidated Financial Statements (unaudited) (continued)
N O T E S T O C O N S O L I D A T E D F I N A N C I A L S T A T E M E N T S 29

In addition, commencing the business day following the date that the aggregate securities lending income earned across the BlackRock Multi-Asset Complex in a calendaryear exceeds a specified threshold, the Fund, pursuant to the securities lending agreement, will retain for the remainder of that calendar year securities lending income in anamount equal to 85% of securities lending income (which excludes collateral investment expenses), and this amount retained can never be less than 70% of the total ofsecurities lending income plus the collateral investment expenses.
The share of securities lending income earned by the Fund is shown as securities lending income — affiliated — net in the Consolidated Statement of Operations. For the sixmonths ended November 30, 2020, the Fund paid BIM $839 for securities lending agent services.
Interfund Lending: In accordance with an exemptive order (the “Order”) from the SEC, the Fund may participate in a joint lending and borrowing facility for temporarypurposes (the “Interfund Lending Program”), subject to compliance with the terms and conditions of the Order, and to the extent permitted by the Fund’s investment policiesand restrictions. The Fund is currently permitted to borrow and lend under the Interfund Lending Program.
A lending BlackRock fund may lend in aggregate up to 15% of its net assets, but may not lend more than 5% of its net assets to any one borrowing fund through the InterfundLending Program. A borrowing BlackRock fund may not borrow through the Interfund Lending Program or from any other source more than 33 1/3% of its total assets (or anylower threshold provided for by the fund’s investment restrictions). If a borrowing BlackRock fund’s total outstanding borrowings exceed 10% of its total assets, each of itsoutstanding interfund loans will be subject to collateralization of at least 102% of the outstanding principal value of the loan. All interfund loans are for temporary or emergencypurposes and the interest rate to be charged will be the average of the highest current overnight repurchase agreement rate available to a lending fund and the bank loan rate,as calculated according to a formula established by the Board.
During the six months ended November 30, 2020, the Fund did not participate in the Interfund Lending Program.
Trustees and Officers: Certain trustees and/or officers of the Trust are directors and/or officers of BlackRock or its affiliates. The Fund reimburses the Manager for a portionof the compensation paid to the Trust’s Chief Compliance Officer, which is included in Trustees and Officer in the Consolidated Statement of Operations.
7. PURCHASES AND SALES
For the six months ended November 30, 2020, purchases and sales of investments, excluding short-term investments, were $53,975,301 and $31,626,674, respectively.
8. INCOME TAX INFORMATION
It is the Fund’s policy to comply with the requirements of the Internal Revenue Code of 1986, as amended, applicable to regulated investment companies, and to distributesubstantially all of its taxable income to its shareholders. Therefore, no U.S. federal income tax provision is required.
The Fund files U.S. federal and various state and local tax returns. No income tax returns are currently under examination. The statute of limitations on the Fund’s U.S. federaltax returns generally remains open for a period of three fiscal years after they are filed. The statutes of limitations on the Fund’s state and local tax returns may remain openfor an additional year depending upon the jurisdiction.
Management has analyzed tax laws and regulations and their application to the Fund as of November 30, 2020, inclusive of the open tax return years, and does not believe thatthere are any uncertain tax positions that require recognition of a tax liability in the Fund’s consolidated financial statements.
As of May 31, 2020, the Fund had non-expiring capital loss carryforwards available to offset future realized capital gains of $ 179,049,021.
As of November 30, 2020, gross unrealized appreciation and depreciation based on cost of investments (including short positions and derivatives, if any) for U.S. federalincome tax purposes were as follows:
Amounts
Tax cost. . . . . . . . . . . . . . . . . . . . . . . . . . . . . . . . . . . . . . . . . . . . . . . . . . . . . . . . . . . . . . . . . . . . . . . . . . . . . . . . . . . . . . . . . . . . . . . . . . . . . . . . . . . . . . . . . . . . . . . . . . . . . . . . . . . . . . . . . . . . . . . . . . . . . . . . $ 203,788,459
Gross unrealized appreciation. . . . . . . . . . . . . . . . . . . . . . . . . . . . . . . . . . . . . . . . . . . . . . . . . . . . . . . . . . . . . . . . . . . . . . . . . . . . . . . . . . . . . . . . . . . . . . . . . . . . . . . . . . . . . . . . . . . . . . . . . . . . . . . . . . . $ 30,250,450Gross unrealized depreciation. . . . . . . . . . . . . . . . . . . . . . . . . . . . . . . . . . . . . . . . . . . . . . . . . . . . . . . . . . . . . . . . . . . . . . . . . . . . . . . . . . . . . . . . . . . . . . . . . . . . . . . . . . . . . . . . . . . . . . . . . . . . . . . . . . . (2,731,521)
Net unrealized appreciation (depreciation) . . . . . . . . . . . . . . . . . . . . . . . . . . . . . . . . . . . . . . . . . . . . . . . . . . . . . . . . . . . . . . . . . . . . . . . . . . . . . . . . . . . . . . . . . . . . . . . . . . . . . . . . . . . . . . . . . . . . . . . $ 27,518,929
9. BANK BORROWINGS
The Trust, on behalf of the Fund, along with certain other funds managed by the Manager and its affiliates (“Participating Funds”), is a party to a 364-day, $2.25 billion creditagreement with a group of lenders. Under this agreement, the Fund may borrow to fund shareholder redemptions. Excluding commitments designated for certain individualfunds, the Participating Funds, including the Fund, can borrow up to an aggregate commitment amount of $1.75 billion at any time outstanding, subject to asset coverage andother limitations as specified in the agreement. The credit agreement has the following terms: a fee of 0.10% per annum on unused commitment amounts and interest at a rateequal to the higher of (a) one-month LIBOR (but, in any event, not less than 0.00%) on the date the loan is made plus 0.80% per annum or (b) the Fed Funds rate (but, in anyevent, not less than 0.00%) in effect from time to time plus 0.80% per annum on amounts borrowed. The agreement expires in April 2021 unless extended or renewed. Thesefees were allocated among such funds based upon portions of the aggregate commitment available to them and relative net assets of Participating Funds. During the sixmonths ended November 30, 2020, the Fund did not borrow under the credit agreement.
Notes to Consolidated Financial Statements (unaudited) (continued)
30 2 0 2 0 B L A C K R O C K S E M I - A N N U A L R E P O R T T O S H A R E H O L D E R S

10. PRINCIPAL RISKS
In the normal course of business, the Fund invests in securities or other instruments and may enter into certain transactions, and such activities subject the Fund to variousrisks, including among others, fluctuations in the market (market risk) or failure of an issuer to meet all of its obligations. The value of securities or other instruments may alsobe affected by various factors, including, without limitation: (i) the general economy; (ii) the overall market as well as local, regional or global political and/or social instability;(iii) regulation, taxation or international tax treaties between various countries; or (iv) currency, interest rate and price fluctuations. Local, regional or global events such as war,acts of terrorism, the spread of infectious illness or other public health issues, recessions, or other events could have a significant impact on the Fund and its investments. TheFund’s prospectus provides details of the risks to which the Fund is subject.
The Fund may be exposed to additional risks when reinvesting cash collateral in money market funds that do not seek to maintain a stable NAV per share of $1.00, which maybe subject to redemption gates or liquidity fees under certain circumstances.
Market Risk: An outbreak of respiratory disease caused by a novel coronavirus has developed into a global pandemic and has resulted in closing borders, quarantines,disruptions to supply chains and customer activity, as well as general concern and uncertainty. The impact of this pandemic, and other global health crises that may arise in thefuture, could affect the economies of many nations, individual companies and the market in general in ways that cannot necessarily be foreseen at the present time. Thispandemic may result in substantial market volatility and may adversely impact the prices and liquidity of a fund’s investments. The duration of this pandemic and its effectscannot be determined with certainty.
Valuation Risk: The market values of equities, such as common stocks and preferred securities or equity related investments, such as futures and options, may decline dueto general market conditions which are not specifically related to a particular company. They may also decline due to factors which affect a particular industry or industries. TheFund may invest in illiquid investments. An illiquid investment is any investment that the Fund reasonably expects cannot be sold or disposed of in current market conditionsin seven calendar days or less without the sale or disposition significantly changing the market value of the investment. The Fund may experience difficulty in selling illiquidinvestments in a timely manner at the price that it believes the investments are worth. Prices may fluctuate widely over short or extended periods in response to company,market or economic news. Markets also tend to move in cycles, with periods of rising and falling prices. This volatility may cause the Fund’s NAV to experience significantincreases or decreases over short periods of time. If there is a general decline in the securities and other markets, the NAV of the Fund may lose value, regardless of theindividual results of the securities and other instruments in which the Fund invests.
The price the Fund could receive upon the sale of any particular portfolio investment may differ from the Fund’s valuation of the investment, particularly for securities that tradein thin or volatile markets or that are valued using a fair valuation technique or a price provided by an independent pricing service. Changes to significant unobservable inputsand assumptions (i.e., publicly traded company multiples, growth rate, time to exit) due to the lack of observable inputs may significantly impact the resulting fair value andtherefore the Fund’s results of operations. As a result, the price received upon the sale of an investment may be less than the value ascribed by the Fund, and the Fund couldrealize a greater than expected loss or lesser than expected gain upon the sale of the investment. The Fund’s ability to value its investments may also be impacted bytechnological issues and/or errors by pricing services or other third party service providers.
Counterparty Credit Risk: The Fund may be exposed to counterparty credit risk, or the risk that an entity may fail to or be unable to perform on its commitments related tounsettled or open transactions, including making timely interest and/or principal payments or otherwise honoring its obligations. The Fund manages counterparty credit risk byentering into transactions only with counterparties that the Manager believes have the financial resources to honor their obligations and by monitoring the financial stability ofthose counterparties. Financial assets, which potentially expose the Fund to market, issuer and counterparty credit risks, consist principally of financial instruments andreceivables due from counterparties. The extent of the Fund’s exposure to market, issuer and counterparty credit risks with respect to these financial assets is approximatelytheir value recorded in the Consolidated Statement of Assets and Liabilities, less any collateral held by the Fund.
A derivative contract may suffer a mark-to-market loss if the value of the contract decreases due to an unfavorable change in the market rates or values of the underlyinginstrument. Losses can also occur if the counterparty does not perform under the contract.
Concentration Risk: A diversified portfolio, where this is appropriate and consistent with a fund’s objectives, minimizes the risk that a price change of a particular investmentwill have a material impact on the NAV of a fund. The investment concentrations within the Fund’s portfolio are disclosed in its Consolidated Schedule of Investments.
LIBOR Transition Risk: The United Kingdom’s Financial Conduct Authority announced a phase out of the London Interbank Offered Rate (“LIBOR”) by the end of 2021, andit is expected that LIBOR will cease to be published after that time. The Fund may be exposed to financial instruments tied to LIBOR to determine payment obligations,financing terms, hedging strategies or investment value. The transition process away from LIBOR might lead to increased volatility and illiquidity in markets for, and reduce theeffectiveness of new hedges placed against, instruments whose terms currently include LIBOR. The ultimate effect of the LIBOR transition process on the Fund is uncertain.
Notes to Consolidated Financial Statements (unaudited) (continued)
N O T E S T O C O N S O L I D A T E D F I N A N C I A L S T A T E M E N T S 31

11. CAPITAL SHARE TRANSACTIONS
Transactions in capital shares for each class were as follows:
Six Months Ended 11/30/20Period from
08/01/19 to 05/31/20 Year Ended 07/31/19
Share Class Shares Amounts Shares Amounts Shares Amounts
Institutional
Shares sold . . . . . . . . . . . . . . . . . . . . . . . . . . . . . . . . . . . . . . . . . . . . . . . 8,434,382 $ 58,330,066 9,396,421 $ 62,882,038 12,870,944 $ 93,580,547
Shares issued in reinvestment of distributions . . . . . . . . . . . . . . . 67,332 449,107 378,445 2,637,758 453,494 3,192,599
Shares redeemed . . . . . . . . . . . . . . . . . . . . . . . . . . . . . . . . . . . . . . . . . (4,144,234) (28,907,651) (13,528,489) (88,937,397) (18,771,252) (134,640,850)
4,357,480 $ 29,871,522 (3,753,623) $ (23,417,601) (5,446,814) $ (37,867,704)
Investor A
Shares sold and automatic conversion of shares . . . . . . . . . . . . 2,959,022 $ 20,314,924 1,476,313 $ 9,624,137 1,764,219 $ 12,770,471
Shares issued in reinvestment of distributions . . . . . . . . . . . . . . . 13,508 89,421 73,543 509,654 95,139 665,024
Shares redeemed . . . . . . . . . . . . . . . . . . . . . . . . . . . . . . . . . . . . . . . . . (1,233,742) (8,526,169) (2,544,256) (16,965,095) (4,415,836) (31,792,414)
1,738,788 $ 11,878,176 (994,400) $ (6,831,304) (2,556,478) $ (18,356,919)
Investor C
Shares sold . . . . . . . . . . . . . . . . . . . . . . . . . . . . . . . . . . . . . . . . . . . . . . . 275,530 $ 1,773,534 142,139 $ 868,665 270,196 $ 1,870,867
Shares issued in reinvestment of distributions . . . . . . . . . . . . . . . 637 4,064 7,323 48,989 11,517 77,623
Shares redeemed and automatic conversion of shares . . . . . . (138,461) (919,967) (298,517) (1,919,895) (443,539) (3,045,182)
137,706 $ 857,631 (149,055) $ (1,002,241) (161,826) $ (1,096,692)
Class K
Shares sold . . . . . . . . . . . . . . . . . . . . . . . . . . . . . . . . . . . . . . . . . . . . . . . 651,074 $ 4,494,882 2,126,739 $ 14,361,196 1,112,421 $ 8,116,553
Shares issued in reinvestment of distributions . . . . . . . . . . . . . . . 16,214 108,146 85,028 593,492 63,350 445,982
Shares redeemed . . . . . . . . . . . . . . . . . . . . . . . . . . . . . . . . . . . . . . . . . (722,074) (4,976,960) (1,355,056) (8,964,055) (949,266) (6,876,833)
(54,786) $ (373,932) 856,711 $ 5,990,633 226,505 $ 1,685,702
6,179,188 $ 42,233,397 (4,040,367) $ (25,260,513) (7,938,613) $ (55,635,613)
12. SUBSEQUENT EVENTS
Management has evaluated the impact of all subsequent events on the Fund through the date the consolidated financial statements were issued and has determined that therewere no subsequent events requiring adjustment or additional disclosure in the consolidated financial statements.
Notes to Consolidated Financial Statements (unaudited) (continued)
32 2 0 2 0 B L A C K R O C K S E M I - A N N U A L R E P O R T T O S H A R E H O L D E R S

In compliance with Rule 22e-4 under the Investment Company Act of 1940, as amended (the “Liquidity Rule”), BlackRock FundsSM (the "Trust") has adopted and implementeda liquidity risk management program (the "Program") for BlackRock Commodity Strategies Fund (the "Fund"), a series of the Trust, which is reasonably designed to assess andmanage the Fund’s liquidity risk.
The Board of Trustees (the "Board") of the Trust, on behalf of the Fund, met on November 10-11, 2020 (the “Meeting”) to review the Program. The Board previously appointedBlackRock Advisors, LLC or BlackRock Fund Advisors (“BlackRock”), each an investment adviser to certain Funds, as the program administrator for each Fund’s Program, asapplicable. BlackRock also previously delegated oversight of the Program to the 40 Act Liquidity Risk Management Committee (the “Committee”). At the Meeting, theCommittee, on behalf of BlackRock, provided the Board with a report that addressed the operation of the Program and assessed its adequacy and effectiveness ofimplementation, including the operation of each Fund’s Highly Liquid Investment Minimum (“HLIM”) where applicable, and any material changes to the Program (the “Report”).The Report covered the period from October 1, 2019 through September 30, 2020 (the “Program Reporting Period”).
The Report described the Program’s liquidity classification methodology for categorizing a Fund’s investments (including derivative transactions) into one of four liquiditybuckets. It also referenced the methodology used by BlackRock to establish a Fund’s HLIM and noted that the Committee reviews and ratifies the HLIM assigned to each Fundno less frequently than annually. The Report also discussed notable events affecting liquidity over the Program Reporting Period, including the impact of the coronavirusoutbreak on the Funds and the overall market.
The Report noted that the Program complied with the key factors for consideration under the Liquidity Rule for assessing, managing and periodically reviewing a Fund’sliquidity risk, as follows:
a) The Fund’s investment strategy and liquidity of portfolio investments during both normal and reasonably foreseeable stressed conditions. During theProgram Reporting Period, the Committee reviewed whether each Fund’s strategy is appropriate for an open-end fund structure with a focus on Funds with moresignificant and consistent holdings of less liquid and illiquid assets. The Committee also factored a Fund’s concentration in an issuer into the liquidity classificationmethodology by taking issuer position sizes into account. Where a Fund participated in borrowings for investment purposes (such as tender option bonds andreverse repurchase agreements), such borrowings were factored into the Program’s calculation of a Fund’s liquidity bucketing. Derivative exposure was alsoconsidered in such calculation.
b) Short-term and long-term cash flow projections during both normal and reasonably foreseeable stressed conditions. During the Program Reporting Period,the Committee reviewed historical net redemption activity and used this information as a component to establish each Fund’s reasonably anticipated trading size(“RATS”). Each Fund has adopted an in-kind redemption policy which may be utilized to meet larger redemption requests. The Committee may also take intoconsideration a Fund’s shareholder ownership concentration (which, depending on product type and distribution channel, may or may not be available), a Fund’sdistribution channels, and the degree of certainty associated with a Fund’s short-term and long-term cash flow projections.
c) Holdings of cash and cash equivalents, as well as borrowing arrangements. The Committee considered the terms of the credit facility committed to the Funds,the financial health of the institution providing the facility and the fact that the credit facility is shared among multiple Funds (including that a portion of the aggregatecommitment amount is specifically designated for BlackRock Floating Rate Income Portfolio, a series of BlackRock Funds V). The Committee also considered othertypes of borrowing available to the Funds, such as the ability to use reverse repurchase agreements and interfund lending, as applicable.
There were no material changes to the Program during the Program Reporting Period. The Report provided to the Board stated that the Committee concluded that based onthe operation of the functions, as described in the Report, the Program is operating as intended and is effective in implementing the requirements of the Liquidity Rule.
Statement Regarding Liquidity Risk Management Program
S T A T E M E N T R E G A R D I N G L I Q U I D I T Y R I S K M A N A G E M E N T P R O G R A M 33

General Information
Householding
The Fund will mail only one copy of shareholder documents, including prospectuses, annual and semi-annual reports, Rule 30e-3 notices and proxy statements, toshareholders with multiple accounts at the same address. This practice is commonly called “householding” and is intended to reduce expenses and eliminate duplicatemailings of shareholder documents. Mailings of your shareholder documents may be householded indefinitely unless you instruct us otherwise. If you do not want the mailingof these documents to be combined with those for other members of your household, please call the Fund at (800) 441-7762.
Availability of Quarterly Schedule of Investments
The Fund files its complete schedule of portfolio holdings with the SEC for the first and third quarters of each fiscal year as an exhibit to its reports on Form N-PORT. The Fund’sForm N-PORT is available on the SEC’s website at sec.gov. Additionally, the Fund makes its portfolio holdings for the first and third quarters of each fiscal year available atblackrock.com/fundreports.
Availability of Proxy Voting Policies and Procedures
A description of the policies and procedures that the Fund uses to determine how to vote proxies relating to portfolio securities is available upon request and without charge(1) by calling (800) 441-7762; (2) at blackrock.com; and (3) on the SEC’s website at sec.gov.
Availability of Proxy Voting Record
Information about how the Fund voted proxies relating to securities held in the Fund’s portfolio during the most recent 12-month period ended June 30 is available upon requestand without charge (1) at blackrock.com; or by calling (800) 441-7762 and (2) on the SEC’s website at sec.gov.
BlackRock’s Mutual Fund Family
BlackRock offers a diverse lineup of open-end mutual funds crossing all investment styles and managed by experts in equity, fixed-income and tax-exempt investing. Visitblackrock.com for more information.
Shareholder Privileges
Account Information
Call us at (800) 441-7762 from 8:00 AM to 6:00 PM ET on any business day to get information about your account balances, recent transactions and share prices. You can alsovisit blackrock.com for more information.
Automatic Investment Plans
Investor class shareholders who want to invest regularly can arrange to have $50 or more automatically deducted from their checking or savings account and invested in anyof the BlackRock funds.
Systematic Withdrawal Plans
Investor class shareholders can establish a systematic withdrawal plan and receive periodic payments of $50 or more from their BlackRock funds, as long as their accountbalance is at least $10,000.
Retirement Plans
Shareholders may make investments in conjunction with Traditional, Rollover, Roth, Coverdell, Simple IRAs, SEP IRAs and 403(b) Plans.
Additional Information
34 2 0 2 0 B L A C K R O C K S E M I - A N N U A L R E P O R T T O S H A R E H O L D E R S

BlackRock Privacy Principles
BlackRock is committed to maintaining the privacy of its current and former fund investors and individual clients (collectively, “Clients”) and to safeguarding their non-publicpersonal information. The following information is provided to help you understand what personal information BlackRock collects, how we protect that information and why incertain cases we share such information with select parties.
If you are located in a jurisdiction where specific laws, rules or regulations require BlackRock to provide you with additional or different privacy-related rights beyond what is setforth below, then BlackRock will comply with those specific laws, rules or regulations.
BlackRock obtains or verifies personal non-public information from and about you from different sources, including the following: (i) information we receive from you or, ifapplicable, your financial intermediary, on applications, forms or other documents; (ii) information about your transactions with us, our affiliates, or others; (iii) information wereceive from a consumer reporting agency; and (iv) from visits to our websites.
BlackRock does not sell or disclose to non-affiliated third parties any non-public personal information about its Clients, except as permitted by law or as is necessary to respondto regulatory requests or to service Client accounts. These non-affiliated third parties are required to protect the confidentiality and security of this information and to use it onlyfor its intended purpose.
We may share information with our affiliates to service your account or to provide you with information about other BlackRock products or services that may be of interest toyou. In addition, BlackRock restricts access to non-public personal information about its Clients to those BlackRock employees with a legitimate business need for theinformation. BlackRock maintains physical, electronic and procedural safeguards that are designed to protect the non-public personal information of its Clients, includingprocedures relating to the proper storage and disposal of such information.
Fund and Service Providers
Investment Adviser and AdministratorBlackRock Advisors, LLCWilmington, DE 19809
Sub-AdviserBlackRock International LimitedEdinburgh, EH3 8BLUnited Kingdom
Accounting Agent and Transfer AgentBNY Mellon Investment Servicing (US) Inc.Wilmington, DE 19809
CustodianThe Bank of New York MellonNew York, NY 10286
DistributorBlackRock Investments, LLCNew York, NY 10022
Independent Registered Public Accounting FirmDeloitte & Touche LLPBoston, MA 02116
Legal CounselSidley Austin LLPNew York, NY 10019
Address of the Trust100 Bellevue ParkwayWilmington, DE 19809
Additional Information (continued)
A D D I T I O N A L I N F O R M A T I O N 35

Currency Abbreviation
CAD Canadian Dollar
USD United States Dollar
Portfolio Abbreviation
ADR American Depositary Receipt
BCOMAGTR Bloomberg Agriculture SubindexSM
BCOMENTR Bloomberg Select Energy Subindex Total ReturnSM
BCOMINTR Bloomberg Industrial Metals SubindexSM
BCOMLITR Bloomberg Livestock SubindexSM
BCOMPRTR Bloomberg Precious Metals SubindexSM
BCOMRAGT Bloomberg Roll Select Agriculture Subindex Total ReturnSM
BCOMRENT Bloomberg Roll Select Energy Subindex Total Return SM
BCOMRINT Bloomberg Roll Select Industrial Metals Subindex Total ReturnSM
BCOMRLIT Bloomberg Roll Select Livestock Subindex Total ReturnSM
BCOMRPRT Bloomberg Roll Select Precious Metals Subindex Total ReturnSM
BCOMRST Bloomberg Roll Select Commodity Total Return IndexSM
BCOMTR Bloomberg Commodity Index Total ReturnSM
GDR Global Depositary Receipt
OTC Over-the-Counter
Glossary of Terms Used in this Report
36 2 0 2 0 B L A C K R O C K S E M I - A N N U A L R E P O R T T O S H A R E H O L D E R S

THIS PAGE INTENTIONALLY LEFT BLANK.

THIS PAGE INTENTIONALLY LEFT BLANK.

THIS PAGE INTENTIONALLY LEFT BLANK.

Want to know more?blackrock.com | 800-441-7762
This report is intended for current holders. It is not authorized for use as an offer of sale or a solicitation of an offer to buyshares of the Fund unless preceded or accompanied by the Fund’s current prospectus. Past performance results shown inthis report should not be considered a representation of future performance. Investment returns and principal value ofshares will fluctuate so that shares, when redeemed, may be worth more or less than their original cost. Statements and otherinformation herein are as dated and are subject to change.
CSF-11/20-SAR
Go to www.blackrock.com/edelivery.