Selecting International Business Opportunities … · · 2015-07-13Retrieved February 11, 2015,...
29
64– ▼ 5 Selecting International Business Opportunities Profile: YPlan Named as one of the “Hottest Global Startups of 2013,” YPlan is a mobile app developed for spontaneous customers looking for a fun night out. The app allows customers in San Francisco, London, and New York to browse through a list of events that are happening that same evening, pay for their tickets securely, and use the information provided by the app to redeem their ticket at the venue: No printing of tickets is required. The list of events is compiled by YPlan’s team of entertainment experts, who “only work with the best venues, artists, and promoters. Partners include Beyoncé, The Royal Albert Hall, and Southbank Centre. YPlan currently works with over 550 event partners in London alone. YPlan aims to develop such a reputable brand that its “YPlan stamp of approval” becomes trustworthy to a global audience. By offering its customers a unique deal, YPlan hopes to become the entertainment specialist. The app also offers unique “YPlan perks such as: access to a sold-out show, invitation-only events, free something with your booking, or a mouth-watering discount.” Customers are offered safe checkout, can pay with various credit cards, and can purchase their event tickets from the well-known STAR (Society of Ticket Agents and Retailers). Since its foundation, the company has received much attention from various media, including The Wall Street Journal, London’s Evening Standard, and Business Insider. The firm’s team claims that the app has a presence on one in every five smart phones in London and had over 500,000 users globally only one year after its launch in London in November 2012. Founded by two Lithuanian finance-workers-turned-entrepreneurs, Rytis Vitkauskas and Viktoras Jucikas, YPlan raised $13.7 million in funding. With London as its hub for European expansion, YPlan initially targeted the North American market, Chicago and Austin in particular. These entrepreneurs have brought some new technology to Silicon Valley and have reinforced London’s position as “the digital capital of Europe.” With this exciting new business model, YPlan is a textbook example of why global companies must localize to satisfy local customers’ needs and wants. It may seem obvious to a company such as YPlan that events, audience tastes, and trends are different in different locations. Companies for whom this seems less obvious, though, might benefit from the realization that tailoring products or services to local Copyright ©2016 by SAGE Publications, Inc. This work may not be reproduced or distributed in any form or by any means without express written permission of the publisher. Do not copy, post, or distribute
Transcript of Selecting International Business Opportunities … · · 2015-07-13Retrieved February 11, 2015,...

64–
▼
5
Selecting International Business Opportunities
Profile: YPlan
Named as one of the “Hottest Global Startups of 2013,” YPlan is a mobile app developed for spontaneous customers looking for a fun night out. The app allows customers in San Francisco, London, and New York to browse through a list of events that are happening that same evening, pay for their tickets securely, and use the information provided by the app to redeem their ticket at the venue: No printing of tickets is required. The list of events is compiled by YPlan’s team of entertainment experts, who “only work with the best venues, artists, and promoters.� Partners include Beyoncé, The Royal Albert Hall, and Southbank Centre. YPlan currently works with over 550 event partners in London alone.
YPlan aims to develop such a reputable brand that its “YPlan stamp of approval” becomes trustworthy to a global audience. By offering its customers a unique deal, YPlan hopes to become the entertainment specialist. The app also offers unique “YPlan perks such as: access to a sold-out show, invitation-only events, free something with your booking, or a mouth-watering discount.” Customers are offered safe checkout, can pay with various credit cards, and can purchase their event tickets from the well-known STAR (Society of Ticket Agents and Retailers).
Since its foundation, the company has received much attention from various media, including The Wall Street Journal, London’s Evening Standard, and Business Insider. The firm’s team claims that the app has a presence on one in every five smart phones in London and had over 500,000 users globally only one year after its launch in London in November 2012. Founded by two Lithuanian finance-workers-turned-entrepreneurs, Rytis Vitkauskas and Viktoras Jucikas, YPlan raised $13.7 million in funding. With London as its hub for European expansion, YPlan initially targeted the North American market, Chicago and Austin in particular. These entrepreneurs have brought some new technology to Silicon Valley and have reinforced London’s position as “the digital capital of Europe.”
With this exciting new business model, YPlan is a textbook example of why global companies must localize to satisfy local customers’ needs and wants. It may seem obvious to a company such as YPlan that events, audience tastes, and trends are different in different locations. Companies for whom this seems less obvious, though, might benefit from the realization that tailoring products or services to local
Copyright ©2016 by SAGE Publications, Inc. This work may not be reproduced or distributed in any form or by any means without express written permission of the publisher.
Do not
copy
, pos
t, or d
istrib
ute

Selecting International Business Opportunities– ▼ –65
markets is essential and does take a great deal of time. Yet these localized details are precisely what make entrepreneurial ventures such as YPlan so successful: The customer feels understood and can there-fore develop a connection with the brand.
SOURCES: Williams-Grut, O. (2014, February 25). London goes to Silicon Valley as YPlan launches in San Francisco. Retrieved April 28, 2014, from http://www.standard.co.uk/business/business-news/london-goes-to-silicon-valley-as-yplan-launches-in-san-francisco-9151077.html
YPlan [website]. (n.d.). Retrieved February 11, 2015, from http://yplanapp.com/
YPlan. (2013). Forbes. Retrieved April 28, 2014, from http://www.forbes.com/pictures/emjl45himf/yplan/
Ch a p t e r Ob j e C t i v e s
1. To develop an understanding of how to select the most appropriate foreign market for each venture
2. To determine the best indicators for entry into a foreign market
3. To identify primary and secondary sources of information on foreign market industries or consumers
4. To understand how to collect country market data
5. To learn how to assess competitive strengths and weaknesses in foreign markets and determine a strat-egy to establish a competitive market position
✤ ✤ ✤
Introduction
With so many potential markets and prospective countries available, a most critical issue for the global entrepreneur is foreign market selection (the focus of this chapter) and the entry strategy (the focus of Chapter 8). Should the global entrepreneur enter the top pro-spective country or should he or she employ a part of a country or multicountry approach? Should he or she choose the largest market possible or one that is easier to understand and navigate? Is a more-developed foreign market preferable to one that is developing?
These are just some of the questions confronting the global entrepreneur when deciding which market to enter. The market selection decision should be based on past sales and competitive positioning as well as assessment of each foreign market alterna-tive. Data need to be systematically collected on both a regional and a country basis. A region can be a collection of countries, such as the European Union, or an area within a country, such as the southeastern part of China.
A systematic process is needed to select the best market in terms of market potential, ease of entry, and ease of doing business. This allows the global entrepreneur to avoid
Copyright ©2016 by SAGE Publications, Inc. This work may not be reproduced or distributed in any form or by any means without express written permission of the publisher.
Do not
copy
, pos
t, or d
istrib
ute

66–
▼
–ENTERING THE GLOBAL MARKET
relying on assumptions and gut feelings. Any statistical data should be collected for at least a three-year period so any trends are evident. This collected data will also be used to develop the marketing plan and appropriate entry strategy.
Foreign Market Selection Model
Although there are several market selection models available, a good method employs a five-step approach: (1) develop appropriate indicators, (2) collect data and convert into comparable indicators, (3) establish an appropriate weight for each indicator, (4) analyze the data, and (5) select the appropriate market from the market rankings.
In Step 1, appropriate indicators are developed based on past sales, competitive research, experience, and discussions with other global entrepreneurs. Specific indicators for the new company are needed in three general areas: overall market indicators, market growth indicators, and product indicators in the business to business (BtoB). Market size indicators in the business to consumer (BtoC) generally center on population, per capita income, market for the specific product for consumer products and sales, and profits of particular companies for industrial products. In terms of market growth, the overall country growth should be determined as well as the growth rate for the particular market of the venture. Finally, appropriate product indicators, such as existing exports of the specific prod-uct category to the market and the number of sales leads and interest, should be established.
In Step 2, data for each of the indicators are collected and converted to facilitate com-parison. Both primary data (original information collected for the particular requirement) and secondary data (published data already existing) need to be collected. Typically, secondary data are gathered first to establish what information needs to be collected through primary research. When collecting international secondary data, there are several problems that vary to some extent based on the stage of economic development of the country. These problems include (a) comparability (the data can be grouped differently in each country), (b) availability (some countries have much more country data than others, usually reflecting the stage of economic development), (c) accuracy (sometimes the data have not been collected using rigorous standards or are biased due to the interests of the government of the country; the latter is particularly a problem in nonmarket-oriented economies), and (d) cost of the data. The United States, with its Freedom of Information Act, makes all government-collected data that do not pertain to security or defense avail-able to all. This is not the case in all countries. For example, one global entrepreneur was interested in opening the first Western health club in Moscow. He was going to charge two rates: a higher hard currency rate to foreigners and a lower ruble rate to Russians and other citizens of countries in the former Soviet Union. In determining the best location, he was interested in finding areas of the city where most foreigners lived. After significant searching to no avail and a high degree of frustration, he finally was able to buy the data needed from the former KGB (Soviet Union security branch).
When researching foreign markets, you will usually want economic and demographic data such as population, gross domestic product (GDP), per capita income, inflation rate, literacy rate, unemployment rate, and education levels. There are many sources for this and other foreign information at government agencies, websites, and embassies. One important source of data is the government of the country. There are also a large number
Copyright ©2016 by SAGE Publications, Inc. This work may not be reproduced or distributed in any form or by any means without express written permission of the publisher.
Do not
copy
, pos
t, or d
istrib
ute

Selecting International Business Opportunities– ▼ –67
of international reports—country reports, country analysis briefs (CABs), country commer-cial guides (CCGs), food market reports, international reports and reviews, Department of State background notes, and import/export reports. Other good sources of country data are trade associations and embassies.
The data for each selected indicator are then converted to point scores so each indi-cator from each country can be numerically ranked against the others. Various methods can be used to assign these values, each of which involves some judgment by the global entrepreneur. Another method is to compare country data for each indicator against global standards.
Step 3 establishes appropriate weights for the indicators that reflect the importance of each in predicting foreign market potential. For one company manufacturing hospital beds, the number and types of hospitals, the age of the hospitals and their beds, and the government expenditure on health care were the best country indicators in selecting a foreign market. This procedure results in each indicator receiving a weight that reflects its relative importance. The assignment of points and weights as well as the selection of indicators varies greatly from one global entrepreneur to another and, indeed, is some-what arbitrary. Regardless, this requires intensive thinking and internal discussion, which results in better market selection decisions.
Step 4 involves analyzing the results. When looking at the data, the global entrepre-neur needs to evaluate them carefully. A “what if” analysis can be conducted by changing some of the weights and seeing how the results vary.
Step 5 is the selection of a market to enter and follow-up markets so that an appropri-ate entry strategy can be determined and a market plan developed. China, India, Ireland, and Germany are countries that ICU Global, a videoconferencing provider, is targeting, according to founder and chief executive Stephen McKenzie. McKenzie feels it is easy to expand into other countries even when you are a small business as long as you can pro-vide “the same quality assurance to end users” (Woods, 2008). He adds, “Technology allows you to provide full-support, virtual operations in other countries.” The countries in question have been selected because they offer the greatest opportunities for ICU Global. “It’s good to have a base in Germany because you can easily access the rest of Europe,” McKenzie says. “Meanwhile, Ireland has a large number of companies from continental Europe and the United States investing in it, so there is good opportunity in the context of new technology. Then, there’s a thriving technology center in India.”
Developing Foreign Market Indicators
While some global entrepreneurs, especially those who have had success in their domes-tic markets, have an idea of the best foreign markets to enter based on sales or past experience, most do not. Thus, for those in this latter group, it is important to identify some indicators for potential success in foreign markets to assist in the selection process.
Internal Company Indicators
Several internal company indicators can be used to develop foreign market indicators, including competitive information, information from fellow global entrepreneurs, previous
Copyright ©2016 by SAGE Publications, Inc. This work may not be reproduced or distributed in any form or by any means without express written permission of the publisher.
Do not
copy
, pos
t, or d
istrib
ute

68–
▼
–ENTERING THE GLOBAL MARKET
leads and sales, and trade show information. Foreign markets with good potential are ones that a company’s competitors are entering.
Another good internal way to establish foreign market indicators is to discuss the various markets with noncompeting global entrepreneurs. These individuals can provide significant information based on their experience in specific foreign markets and advice on the potential of your company’s product success in those markets. Sometimes you can even establish a mentoring relationship with a more experienced global entrepreneur.
A third source for developing marketing indicators is your company’s past sales and leads. Leads and actual sales, while doing business domestically, from out-of-country markets are by far the best indicators of foreign market potential. Care needs to be taken to ensure that potential leads really are meaningful and not just distributors trying to establish product lines for their country. A sale in a foreign country signifies that at least for one customer, your product can compete.
The final sources for developing foreign market indicators are leads from domestic and foreign trade shows. These gather firms and buyers in a particular product area and provide a great opportunity to gather market information to determine market potential in various countries. They also provide an opportunity to gather competitive information on both domestic and foreign products.
Primary Versus Secondary Foreign Market Data
One of the most important aspects of any market selection decision is market and demo-graphic information on the foreign country. This can be secondary data (data that are already published) or primary data (original data gathered specifically for the particular decision). Although primary data are generally more accurate, they are also more costly and time con-suming to collect versus data that already exist and have been collected by third parties. It is usually best for the global entrepreneur to start the data-gathering process by first identifying the secondary data available about the foreign country.
Secondary Data
The first step in obtaining secondary data is to identify the classification codes associ-ated with the company’s product/service. These include the Standard Industrial Classification (SIC), the North American Industry Classification System (NAICS), the Standard International Trade Classification (SITC), and the International Harmonized Commodity Description and Coding System (International Harmonized Commodity Code), each of which will be discussed in turn.
The SIC code is appropriate for an initial appraisal of the extent and nature of the need in a foreign market, particularly for industrial products. SIC codes—the means by which the U.S. government classifies manufacturing industries—are based on the product produced or operation performed. Each industry is assigned a 2-, 3-, or, where needed for further breakdown, 4-digit code.
To determine the primary market demand using the SIC method, first determine all potential customers that have a need for the product/service being considered. Once the
Copyright ©2016 by SAGE Publications, Inc. This work may not be reproduced or distributed in any form or by any means without express written permission of the publisher.
Do not
copy
, pos
t, or d
istrib
ute

Selecting International Business Opportunities– ▼ –69
groups have been selected, the appropriate basis for demand determination is established and the published material on the industry groups obtained from the Census of Manufacturers. Then, the primary demand can be determined based on the size of the group and the expenditure in the product area. The website for using the SIC code is http://www.osha.gov/oshstats/sicser.html.
The NAICS is a newer system replacing the SIC system. This newer system is based on a 6-digit code versus the 4-digit code of the SIC system and has new industries, par-ticularly in the service and technology sectors, that were not included in the SIC system. The NAICS system is used in the United States, Canada, and Mexico, allowing for greater country comparisons than previously available. The website for the NAICS system is http://www.census.gov/eos/www/naics/.
Once the global entrepreneur has obtained the codes for his or her product/service, these can be converted to the code system used in the European Union. Each NAICS Rev. 1.1 code is shown with its corresponding International Standard Industrial Classification (ISIC) Rev. 3.1 code on an easily accessible website (http://unstats.un.org/unsd/cr/regis try/regso.asp?Ci=26&Lg=1).
The final two coding systems are more useful for international data. The SITC, devel-oped by the United Nations in 1950, is used to report international trade statistics. It classifies products and services based on a 5-digit code, but frequently, data are available at only the 2- or 3-digit code level. Each year, approximately 140 countries report their import and export trade statistics to the United Nations. The data are compiled and printed in the United Nations’ International Trade Statistics Yearbook. The data are also available at their website (http://unstats.un.org/unsd).
The final and perhaps best system for obtaining international data is the Harmonized Commodity Description and Coding System, better known as the International Harmonized Commodity Codes. Each product or service is identified by a 10-digit number that is broken down by chapter (first two digits), heading (first four digits), subheading (first six digits), and the commodity code (all 10 digits). Here are some sample codes:
Name International Harmonized Commodity Code
Peanut butter 2008.11.1000
Grand pianos 9201.20.0000
Farmed Atlantic salmon 0302.12.0003
Care must be taken when using the International Harmonized Commodity Codes because there may be differences between countries as well as variance within a country, depending on whether the codes are used for exporting or importing products. In the United States, for example, the purpose of the commodity codes is different for importing and exporting. For importing, the code is used to determine the import duty (if any); for exporting, the primary use of the code is for statistical reporting. This results in two sets of commodity codes in the United States: one set for importing and one set for exporting.
Copyright ©2016 by SAGE Publications, Inc. This work may not be reproduced or distributed in any form or by any means without express written permission of the publisher.
Do not
copy
, pos
t, or d
istrib
ute

70–
▼
–ENTERING THE GLOBAL MARKET
The exporting system of classification is labeled Schedule B, and the importing system of classification is called the Harmonized Tariff Schedule, maintained by the Office of Tariff Affairs and Trade Agreements.
Problems in Collecting Secondary Data
There are several problems in collecting international secondary data. The first, and perhaps the most troublesome one, is accuracy. Often, countries are not particularly rigor-ous in their data collection, resulting in data not reflective of the true situation in a country. Sometimes, particularly in more controlled countries, the data are collected to satisfy a political agenda rather than statistical reliability.
The second problem is comparability—the data available in one country may not be comparable to the data collected in another country. This may be due to the different meth-odologies used, errors in the data collection, or differences in applying the commodity coding system.
Lack of current data in a country is a third problem. In many growing countries, the frequency of data collection is much more sporadic than in more developed countries. In dynamically changing economies, four- to five-year-old data are obsolete and not very valuable in decision making.
The final problem in secondary data is the cost. In many countries, the data may only be available at a fairly high price.
Sources of Country Market Data
Finding useful, accurate data for your country selection decision can sometimes be chal-lenging. Even for the global entrepreneur who has had experience collecting data in the United States, the process of collecting data in other countries is much more difficult and usually more expensive. There are several sources for both country market and industry data, discussed in the following sections.
Country Industry Market Data
Economic and country data on such things as age, population, GDP, inflation, literacy, and per capita income is often available from a variety of sources, depending on the country. The Central Intelligence Agency’s World Factbook provides data on various aspects of a coun-try, such as demographics of population, economic indicators, geography, military, politics, and resources available. CCGs are produced for most countries on a yearly basis. Each guide contains the following information on a country: executive summary, economic trends and outlook, political environment, marketing U.S. products and services, leading sectors for U.S. exports and investments, trade regulations and standards, investment climate, trade and proj-ect financing, and business travel. It also has numerous appendices in such areas as country data, domestic economy, trade, investment statistics, U.S. and country contacts, market research, and trade event schedules. These are invaluable to the global entrepreneur in understanding the numbers and trade possibilities in a country. Even though these data are
Copyright ©2016 by SAGE Publications, Inc. This work may not be reproduced or distributed in any form or by any means without express written permission of the publisher.
Do not
copy
, pos
t, or d
istrib
ute

Selecting International Business Opportunities– ▼ –71
mainly focused on the United States, the reports contain valuable information for global entrepreneurs regardless of country. The National Trade Data Bank (NTDB), maintained by the U.S. Department of Commerce, is also an important database available to the global entrepreneur at virtually no cost. The NTDB database comprises international reports, trade statistics, research, and leads on trading opportunities.
Another source of country market data is STAT-USA (Statistics USA). This international data source, managed by an agency of the U.S. Department of Commerce, is enormous and includes the just-discussed NTDB, Global Business Opportunities (GLOBUS) database, and the State of the Nation database. Contributed to by many governmental agencies, the STAT-USA has a multitude of international and national reports available, including the following:
• African Development Bank Business Opportunities• Asia Commerce Overview• Bureau of Export Administration (BXA) Annual Report• Computer Markets• CABS• Directory of Feasibility Studies and Projects• Fish and Fishery Product Imports and Exports• Food Market Reports• Foreign Labor Trends• International Automotive Industry• Latin American/Caribbean Business Bulletin• Minerals Yearbook• Steel Monitoring Report• Telecommunications Information and Reports• Trade Associations and Publications• U.S. Foreign Trade Reports• U.S. International Trade in Goods and Services• World Agricultural Production Reports• World Bank International Business Opportunities
Because this is just a small sampling of the reports and data available, it is important that every global entrepreneur look into STAT-USA when collecting the needed interna-tional data. Each country also has data on its STAT-(country name), such as STAT-Brazil.
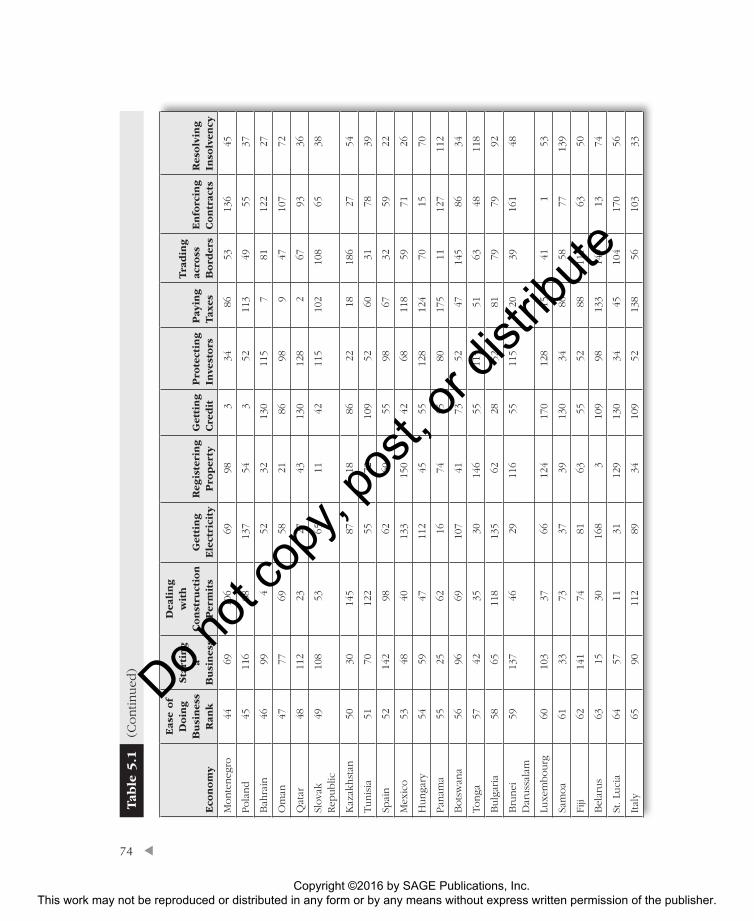
One of the best sources of information is the World Bank, which uses various criteria to rank every country on the ease of doing business there. The index ranks countries (economies) from 1 to 178 and is calculated by averaging the percentile rankings on each of the 10 topics covered in Doing Business: Economy Rankings (2014). The criteria being ranked include ease of doing business, ease of starting a business, dealing with licenses, registering property, getting credit, protecting investors, paying taxes, trading across borders, enforcing contracts, and closing a business. The rankings for selected countries are shown in Table 5.1. Singapore, Hong Kong SAR China, New Zealand, and the United States were ranked 1, 2, 3, and 4, respectively, on the ease of doing business. New Zealand, Canada, Singapore, and Australia were ranked 1, 2, 3, and 4, respectively, on the ease of starting a business.
Copyright ©2016 by SAGE Publications, Inc. This work may not be reproduced or distributed in any form or by any means without express written permission of the publisher.
Do not
copy
, pos
t, or d
istrib
ute

72–
▼
Eco
nom
y
Eas
e of
Doin
g
Busi
nes
s R
ank
Sta
rtin
g
a B
usi
nes
s
Dea
ling
wit
h
Const
ruct
ion
Per
mit
sG
etti
ng
Ele
ctri
city
Reg
iste
ring
Pro
per
tyG
etti
ng
Cre
dit
Pro
tect
ing
Inve
stors
Pay
ing
Tax
es
Tra
din
g
acro
ss
Bord
ers
Enfo
rcin
g
Contr
acts
Res
olv
ing
Inso
lven
cy
Singa
pore
13
36
283
25
112
4
Hong
Kong
SAR, Chin
a2
51
589
33
42
919
New
Zea
land
31
1245
23
123
2118
12
Unite
d S
tate
s4
2034
1325
36
6422
1117
Den
mar
k5
408
187
2834
128
3210
Mal
aysi
a6
1643
2135
14
365
3042
Kore
a, R
ep.
734
182
7513
5225
32
15
Geo
rgia
88
254
13
1629
4333
88
Norw
ay9
5328
1710
7322
1726
42
Unite
d
Kin
gdom
1028
2774
681
1014
1656
7
Aust
ralia
114
1034
403
6844
4614
18
Finla
nd
1255
3622
2642
6821
98
3
Icel
and
1352
411
1242
5237
503
11
Swed
en14
6124
938
4234
416
2520
Irel
and
1512
115
100
5713
66
2062
8
Taiw
an, Chin
a16
177
731
7334
5818
8416
Lith
uan
ia17
1139
756
2868
5615
1744
Thai
land
1891
1412
2973
1270
2422
58
Can
ada
192
116
145
5528
48
4558
9
Mau
ritiu
s20
1912
348
6542
1213
1254
61
Ger
man
y21
111
123
8128
9889
145
13
Tab
le 5
.1
Ran
kings
of
Countrie
s on V
ario
us
Busi
nes
s Crite
ria
Copyright ©2016 by SAGE Publications, Inc. This work may not be reproduced or distributed in any form or by any means without express written permission of the publisher.
Do not
copy
, pos
t, or d
istrib
ute

▼ –73
(Con
tin
ued
)
Eco
nom
y
Eas
e of
Doin
g
Busi
nes
s R
ank
Sta
rtin
g
a B
usi
nes
s
Dea
ling
wit
h
Const
ruct
ion
Per
mit
sG
etti
ng
Ele
ctri
city
Reg
iste
ring
Pro
per
tyG
etti
ng
Cre
dit
Pro
tect
ing
Inve
stors
Pay
ing
Tax
es
Tra
din
g
acro
ss
Bord
ers
Enfo
rcin
g
Contr
acts
Res
olv
ing
Inso
lven
cy
Est
onia
2261
3856
1542
6832
726
66
Unite
d A
rab
Em
irat
es23
375
44
8698
14
100
101
Latv
ia24
5779
8333
368
4917
2143
Mac
edonia
, FY
R25
763
7684
316
2689
9552
Saudi A
rabia
2684
1715
1455
223
6912
710
6
Japan
2712
091
2666
2816
140
2336
1
Net
her
lands
2814
9770
4773
115
2813
295
Switz
erla
nd
2910
458
816
2817
016
3520
47
Aust
ria
3013
894
2836
2898
7919
614
Portuga
l31
3276
3630
109
5281
2524
23
Rw
anda
329
8553
813
2222
162
4013
7
Slove
nia
3338
5932
8310
914
5448
5241
Chile
3422
101
4355
5534
3840
6410
2
Isra
el35
3514
010
315
113
693
1093
35
Bel
gium
3649
100
9018
073
1676
2816
6
Arm
enia
376
7910
95
4222
103
117
112
76
Fran
ce38
4192
4214
955
8052
367
46
Cyp
rus
3944
8610
810
355
3433
2711
024
Puer
to R
ico
(U.S
.)40
1817
238
131
1316
110
8710
121
South
Afr
ica
4164
2615
099
2810
2410
680
82
Peru
4263
117
7922
2816
7355
105
110
Colo
mbia
4379
2410
153
736
104
9415
525
Copyright ©2016 by SAGE Publications, Inc. This work may not be reproduced or distributed in any form or by any means without express written permission of the publisher.
Do not
copy
, pos
t, or d
istrib
ute
74–
▼
Eco
nom
y
Eas
e of
Doin
g
Busi
nes
s R
ank
Sta
rtin
g
a B
usi
nes
s
Dea
ling
wit
h
Const
ruct
ion
Per
mit
sG
etti
ng
Ele
ctri
city
Reg
iste
ring
Pro
per
tyG
etti
ng
Cre
dit
Pro
tect
ing
Inve
stors
Pay
ing
Tax
es
Tra
din
g
acro
ss
Bord
ers
Enfo
rcin
g
Contr
acts
Res
olv
ing
Inso
lven
cy
Monte
neg
ro44
6910
669
983
3486
5313
645
Pola
nd
4511
688
137
543
5211
349
5537
Bah
rain
4699
452
3213
011
57
8112
227
Om
an47
7769
5821
8698
947
107
72
Qat
ar48
112
2327
4313
012
82
6793
36
Slova
k Rep
ublic
4910
853
6511
4211
510
210
865
38
Kaz
akhst
an50
3014
587
1886
2218
186
2754
Tunis
ia51
7012
255
7210
952
6031
7839
Spai
n52
142
9862
6055
9867
3259
22
Mex
ico
5348
4013
315
042
6811
859
7126
Hunga
ry54
5947
112
4555
128
124
7015
70
Panam
a55
2562
1674
5580
175
1112
711
2
Bots
wan
a56
9669
107
4173
5247
145
8634
Tonga
5742
3530
146
5511
551
6348
118
Bulg
aria
5865
118
135
6228
5281
7979
92
Bru
nei
D
aruss
alam
5913
746
2911
655
115
2039
161
48
Luxe
mbourg
6010
337
6612
417
012
815
411
53
Sam
oa
6133
7337
3913
034
8658
7713
9
Fiji
6214
174
8163
5552
8811
163
50
Bel
arus
6315
3016
83
109
9813
314
913
74
St. Lu
cia
6457
1131
129
130
3445
104
170
56
Ital
y65
9011
289
3410
952
138
5610
333
Tab
le 5
.1
(Contin
ued
)
Copyright ©2016 by SAGE Publications, Inc. This work may not be reproduced or distributed in any form or by any means without express written permission of the publisher.
Do not
copy
, pos
t, or d
istrib
ute

▼ –75
(Con
tin
ued
)
Eco
nom
y
Eas
e of
Doin
g
Busi
nes
s R
ank
Sta
rtin
g
a B
usi
nes
s
Dea
ling
wit
h
Const
ruct
ion
Per
mit
sG
etti
ng
Ele
ctri
city
Reg
iste
ring
Pro
per
tyG
etti
ng
Cre
dit
Pro
tect
ing
Inve
stors
Pay
ing
Tax
es
Tra
din
g
acro
ss
Bord
ers
Enfo
rcin
g
Contr
acts
Res
olv
ing
Inso
lven
cy
Trin
idad
and
Tobag
o66
6777
1017
828
2297
7317
411
4
Ghan
a67
128
159
8549
2834
6810
943
116
Kyr
gyz
Rep
ublic
6812
6618
09
1322
127
182
7013
2
Turk
ey69
9314
849
5086
3471
8638
130
Aze
rbai
jan
7010
180
181
1355
2277
168
2886
Antig
ua
and
Bar
buda
7192
2120
128
130
3415
193
6580
Gre
ece
7236
6661
161
8680
5352
9887
Rom
ania
7360
136
174
7013
5213
476
5399
Van
uat
u74
126
5012
911
055
8030
119
7257
Cze
ch
Rep
ublic
7514
686
146
3755
9812
268
7529
Mongo
lia76
2510
716
227
5522
7418
130
133
Dom
inic
a77
5122
6411
986
3475
8817
210
5
Mold
ova
7881
174
165
1913
8095
150
2391
Guat
emal
a79
145
6134
2313
157
8511
697
109
Seyc
hel
les
8011
868
147
6917
068
1929
8265
San M
arin
o81
155
120
1015
818
652
4075
3449
St. Vin
cent
and the
Gre
nad
ines
8268
625
153
130
3472
3890
189
Zam
bia
8345
5715
210
213
8068
163
120
73
Bah
amas
, The
8483
7545
182
8611
545
7212
532
Sri La
nka
8554
108
9114
573
5217
151
135
59
Copyright ©2016 by SAGE Publications, Inc. This work may not be reproduced or distributed in any form or by any means without express written permission of the publisher.
Do not
copy
, pos
t, or d
istrib
ute

76–
▼
Eco
nom
y
Eas
e of
Doin
g
Busi
nes
s R
ank
Sta
rtin
g
a B
usi
nes
s
Dea
ling
wit
h
Const
ruct
ion
Per
mit
sG
etti
ng
Ele
ctri
city
Reg
iste
ring
Pro
per
tyG
etti
ng
Cre
dit
Pro
tect
ing
Inve
stors
Pay
ing
Tax
es
Tra
din
g
acro
ss
Bord
ers
Enfo
rcin
g
Contr
acts
Res
olv
ing
Inso
lven
cy
Koso
vo86
100
136
121
5828
9843
121
138
83
Moro
cco
8739
8397
156
109
115
7837
8369
Uru
guay
8843
154
2316
773
9814
690
105
51
Cro
atia
8980
152
6010
642
157
3499
4998
Alb
ania
9076
189
158
119
1314
146
8512
462
Bar
bad
os
9177
5683
142
8617
011
230
110
28
Russ
ian
Feder
atio
n92
8817
811
717
109
115
5615
710
55
Serb
ia93
4518
285
4442
8016
198
116
103
Jam
aica
9423
5213
211
410
980
168
118
131
31
Mal
div
es95
7118
131
161
109
8011
513
890
40
Chin
a96
158
185
119
4873
9812
074
1978
Solo
mon
Isla
nds
9782
8113
017
286
5230
7810
912
7
Nam
ibia
9813
231
7217
855
8011
414
169
85
Vie
tnam
9910
929
156
5142
157
149
6546
149
Pala
u10
012
945
7820
8617
884
9614
196
St. K
itts
and
Nev
is10
173
1519
169
130
3414
566
112
189
Cost
a Ric
a10
210
282
4746
8617
013
644
130
124
Mal
ta10
316
116
311
577
180
6827
3412
264
Kuw
ait
104
152
133
5990
130
8011
112
119
94
Nep
al10
597
105
9824
5580
126
177
139
125
Bel
ize
106
167
1657
143
130
128
4810
117
330
Gre
nad
a10
772
971
157
130
3490
6116
618
9
Tab
le 5
.1
(Contin
ued
)
Copyright ©2016 by SAGE Publications, Inc. This work may not be reproduced or distributed in any form or by any means without express written permission of the publisher.
Do not
copy
, pos
t, or d
istrib
ute

▼ –77
(Con
tin
ued
)
Eco
nom
y
Eas
e of
Doin
g
Busi
nes
s R
ank
Sta
rtin
g
a B
usi
nes
s
Dea
ling
wit
h
Const
ruct
ion
Per
mit
sG
etti
ng
Ele
ctri
city
Reg
iste
ring
Pro
per
tyG
etti
ng
Cre
dit
Pro
tect
ing
Inve
stors
Pay
ing
Tax
es
Tra
din
g
acro
ss
Bord
ers
Enfo
rcin
g
Contr
acts
Res
olv
ing
Inso
lven
cy
Phili
ppin
es10
817
099
3312
186
128
131
4211
410
0
Para
guay
109
113
7150
7186
6812
515
410
215
2
Paki
stan
110
105
109
175
125
7334
166
9115
871
Leban
on
111
120
179
5111
210
998
3997
126
93
Ukr
aine
112
4741
172
9713
128
164
148
4516
2
Papua
New
G
uin
ea11
310
116
524
8786
6811
613
416
812
8
Mar
shal
l Is
lands
114
5632
7718
986
157
9662
6113
8
Guya
na
115
9433
155
111
170
8011
071
7314
1
Bra
zil
116
123
130
1410
710
980
159
124
121
135
Dom
inic
an
Rep
ublic
117
144
121
127
115
8698
106
3381
159
El Sa
lvad
or
118
148
144
154
5955
170
165
6468
90
Jord
an11
911
711
141
104
170
170
3557
133
113
Indones
ia12
017
588
121
101
8652
137
5414
714
4
Cab
o V
erde
121
6613
515
164
109
138
8095
3518
9
Kirib
ati
122
156
133
159
7316
552
1077
7418
9
Swaz
iland
123
172
5116
313
055
128
5912
717
668
Nic
arag
ua
124
123
152
114
135
109
138
163
8247
84
Eth
iopia
125
166
5591
113
109
157
109
166
4475
Arg
entin
a12
616
418
180
138
7398
153
129
5797
Hondura
s12
716
283
125
9413
170
144
8418
213
6
Egy
pt,
Ara
b
Rep
.12
850
149
105
105
8614
714
883
156
146
Copyright ©2016 by SAGE Publications, Inc. This work may not be reproduced or distributed in any form or by any means without express written permission of the publisher.
Do not
copy
, pos
t, or d
istrib
ute

78–
▼
Eco
nom
y
Eas
e of
Doin
g
Busi
nes
s R
ank
Sta
rtin
g
a B
usi
nes
s
Dea
ling
wit
h
Const
ruct
ion
Per
mit
sG
etti
ng
Ele
ctri
city
Reg
iste
ring
Pro
per
tyG
etti
ng
Cre
dit
Pro
tect
ing
Inve
stors
Pay
ing
Tax
es
Tra
din
g
acro
ss
Bord
ers
Enfo
rcin
g
Contr
acts
Res
olv
ing
Inso
lven
cy
Ken
ya12
913
447
166
163
1398
166
156
151
123
Ban
glad
esh
130
7493
189
177
8622
100
130
185
119
Bosn
ia a
nd
Her
zego
vina
131
174
175
164
9673
115
135
107
115
77
Uga
nda
132
151
143
178
126
4211
598
164
117
79
Yem
en, Rep
.13
311
410
111
661
170
138
129
128
8512
6
India
134
179
182
111
9228
3415
813
218
612
1
Ecu
ador
135
176
6413
891
8613
891
122
9914
3
Leso
tho
136
8914
513
688
159
9810
114
414
410
4
Cam
bodia
137
184
161
134
118
4280
6511
416
216
3
Wes
t B
ank
and G
aza
138
143
131
8712
216
580
6212
388
189
Moza
mbiq
ue
139
9577
171
152
130
5212
913
114
514
8
Buru
ndi
140
2712
616
152
170
3414
317
517
716
4
Bhuta
n14
186
132
9186
109
147
104
172
3718
9
Sier
ra L
eone
142
7517
617
917
086
2212
814
014
915
8
Tajik
ista
n14
387
184
186
7815
922
178
188
3981
Liber
ia14
431
129
142
181
8614
742
142
165
161
Tanza
nia
145
119
177
102
146
130
9814
113
942
134
Uzb
ekis
tan
146
2115
917
313
613
013
816
818
940
63
Nig
eria
147
122
151
185
185
1368
170
158
136
107
Mad
agas
car
148
2915
718
715
518
068
6111
516
015
7
Sudan
149
131
167
113
4117
015
710
815
515
489
Gam
bia
, The
150
130
104
120
117
165
178
184
9960
108
Tab
le 5
.1
(Contin
ued
)
Copyright ©2016 by SAGE Publications, Inc. This work may not be reproduced or distributed in any form or by any means without express written permission of the publisher.
Do not
copy
, pos
t, or d
istrib
ute

▼ –79
(Con
tin
ued
)
Eco
nom
y
Eas
e of
Doin
g
Busi
nes
s R
ank
Sta
rtin
g
a B
usi
nes
s
Dea
ling
wit
h
Const
ruct
ion
Per
mit
sG
etti
ng
Ele
ctri
city
Reg
iste
ring
Pro
per
tyG
etti
ng
Cre
dit
Pro
tect
ing
Inve
stors
Pay
ing
Tax
es
Tra
din
g
acro
ss
Bord
ers
Enfo
rcin
g
Contr
acts
Res
olv
ing
Inso
lven
cy
Iraq
151
169
2039
108
180
128
6317
914
218
9
Iran
, Is
lam
ic
Rep
.15
210
716
916
916
886
147
139
153
5112
9
Alg
eria
153
164
147
148
176
130
9817
413
312
960
Burk
ina
Faso
154
125
6014
112
313
014
716
017
410
811
7
Mal
i15
513
611
311
899
130
147
157
160
140
131
Mic
rones
ia,
Fed. St
s.15
610
654
106
189
130
178
9410
315
216
8
Togo
157
168
114
9615
913
014
717
211
015
311
1
Com
oro
s15
816
344
109
7915
913
812
314
615
918
9
Lao P
DR
159
8596
140
7615
918
711
916
110
418
9
Djib
outi
160
127
157
144
133
180
182
6660
163
147
Surinam
e16
118
149
4017
317
018
650
105
184
160
Boliv
ia16
218
013
612
814
413
013
818
512
613
167
Gab
on
163
153
7113
816
610
915
715
213
515
715
3
Afg
han
ista
n16
424
167
104
175
130
189
9818
416
811
5
Syrian
Ara
b
Rep
ublic
165
135
189
8282
180
115
120
147
179
120
Equat
orial
G
uin
ea16
618
512
599
109
109
147
177
137
5018
9
Côte
d’Iv
oire
167
115
162
153
127
130
157
173
165
8895
Cam
eroon
168
132
127
6215
910
912
818
015
917
515
1
São T
om
é an
d P
rínci
pe
169
9810
373
165
186
157
156
102
183
166
Zim
bab
we
170
150
170
157
9310
912
814
216
711
815
6
Copyright ©2016 by SAGE Publications, Inc. This work may not be reproduced or distributed in any form or by any means without express written permission of the publisher.
Do not
copy
, pos
t, or d
istrib
ute

80–
▼
Tab
le 5
.1
(Contin
ued
)
Eco
nom
y
Eas
e of
Doin
g
Busi
nes
s R
ank
Sta
rtin
g
a B
usi
nes
s
Dea
ling
wit
h
Const
ruct
ion
Per
mit
sG
etti
ng
Ele
ctri
city
Reg
iste
ring
Pro
per
tyG
etti
ng
Cre
dit
Pro
tect
ing
Inve
stors
Pay
ing
Tax
es
Tra
din
g
acro
ss
Bord
ers
Enfo
rcin
g
Contr
acts
Res
olv
ing
Inso
lven
cy
Mal
awi
171
149
173
183
8513
080
8117
614
515
0
Tim
or-
Lest
e17
215
412
844
189
165
115
5592
189
189
Mau
rita
nia
173
173
123
124
6717
014
718
115
275
189
Ben
in17
413
995
160
137
130
157
179
119
181
140
Guin
ea17
514
615
591
140
159
178
186
136
134
145
Nig
er17
615
916
412
380
130
157
162
178
143
154
Hai
ti17
718
714
167
138
165
170
132
151
9618
9
Seneg
al17
811
016
518
217
413
017
018
280
167
122
Ango
la17
917
865
170
132
130
8015
516
918
718
9
Guin
ea-B
issa
u18
015
911
918
817
013
013
815
312
514
818
9
Ven
ezuel
a,
RB
181
157
110
167
9513
018
218
717
392
165
Mya
nm
ar18
218
915
012
615
417
018
210
711
318
815
5
Congo
, D
em.
Rep
.18
318
590
142
133
159
147
176
171
177
167
Eritrea
184
188
189
9518
418
611
515
017
067
189
Congo
, Rep
.18
518
214
217
516
410
915
718
318
016
414
2
South
Sudan
186
140
171
184
183
180
182
9218
787
189
Libya
187
171
189
6818
918
618
711
614
315
018
9
Cen
tral
A
fric
an
Rep
ublic
188
177
156
177
141
109
138
188
185
180
189
Chad
189
183
139
149
146
130
157
189
183
171
189
SOU
RCE: D
oin
g B
usi
nes
s. (
2013
). E
con
omy
ran
kin
gs. Ret
riev
ed A
pril 29
, 20
14, fr
om
http:/
/ww
w.d
oin
gbusi
nes
s.org
/ran
kings
Copyright ©2016 by SAGE Publications, Inc. This work may not be reproduced or distributed in any form or by any means without express written permission of the publisher.
Do not
copy
, pos
t, or d
istrib
ute

Selecting International Business Opportunities– ▼ –81
Trade Associations
Trade associations in the United States and throughout the world are also a good source for industry data about a particular country. Some trade associations do market surveys of their members’ international activities and are strategically involved in interna-tional standards issues for their particular industry.
Trade Publications and Periodicals
There are numerous domestic and international publications specific to particular industries that are also good sources of information. The editorial content of these jour-nals can provide interesting information and insights on trends, companies, and trade shows by giving a more local perspective on the particular market and market conditions. Sometimes trade journals are the best and often the only source of information on com-petition and growth rates in a particular country.
Competitive Positioning
One aspect of success in both international and domestic markets is competitive positioning—knowing the competition very well and being able to position your company and product in that product/market space. In positioning your company internationally, it is even more impor-tant to identify the strategy of each competitive company. The strategy will significantly affect the manner and commitment of a company in an international market, which in turn affects the nature and degree of its competitive behavior in that market. A competitive company’s international strategy may not be the same as yours. If the global entrepreneur emphasizes the competitive analysis too much without taking into account the competitive company’s strategy, then he or she can create a reactive strategy that can be totally ineffective and inappropriate. This is particularly important in developing economies where some companies use a “hit or miss” strategy, realizing that many of the markets will lose money and will not be viable over a long period of time.
The global entrepreneur should begin competitive positioning by first documenting the current strategy of each primary competitor. This can be organized by using the form method indicated in Table 5.2. Information on competitors can be gathered initially by using as much public information as possible and then by complementing this with a mar-keting research project. Newspaper articles, websites, catalogs, promotions, interviews with distributors and customers, and any other marketing or company information available should be reviewed. Articles that have been written on competitors can be found by using a computer search in any university or local library. These articles should be analyzed for information on competitor strategies and should identify the names of individuals who were interviewed, referenced, or even mentioned in the articles. Any of these individuals, as well as the author of the article, can then be contacted to obtain further information. All the information can then be summarized in the form in Table 5.3. Once the competitors’ strategies have been summarized, the global entrepreneur should begin to identify the strengths and weaknesses of each competitor, as shown in the table.
Copyright ©2016 by SAGE Publications, Inc. This work may not be reproduced or distributed in any form or by any means without express written permission of the publisher.
Do not
copy
, pos
t, or d
istrib
ute

82–
▼
–ENTERING THE GLOBAL MARKET
The information in Table 5.2 can then be used to formulate the market positioning strategy of the new venture. Will the new venture imitate a particular competitor or will it try to satisfy needs in the market that are not being filled by any other company? This analysis will enlighten the global entrepreneur and provide a solid basis for developing the market entry plan for the international market.
One method for analyzing a market opportunity and determining your competitive position is indicated in Table 5.3. Using this evaluation process, various elements of the opportunity are evaluated, such as (1) the creation and length of the opportunity, (2) its real and perceived value(s), (3) its risks and returns, (4) its competitive environment, (5) its industry, and (6) its fit with the personal skills and goals of the entrepreneur.
It is important that the global entrepreneur understand the nature and root cause of the opportunity. Is it technological change, market shift, government regulation, or compe-tition? These factors and the resulting opportunity result in a different market size and time dimension. The market size and the length of the window of international opportunity form the primary basis for determining the risks and rewards involved. The amount of capital needed determines the returns and rewards.
In this evaluation, the competition is carefully analyzed. Features and potential price for the product/service need to be evaluated against those of competitive products pres-ently in the product/market space in the country. If any major problems and competitive disadvantages are identified, modifications can be made or a new market investigated.
The relative advantages of the product/service versus competitive products can be determined through use of the following questions: How does the new idea compare with competitive products in terms of quality and reliability? Is the idea superior or defi-cient compared with products currently available in the market? Is this a good market opportunity? These questions and others can be used in a conversational interview. Here, selected individuals are asked to compare the idea against products presently filling that need. By comparing the characteristics and attributes of the new idea, some uniqueness of the idea can be determined.
Table 5.2 An Assessment of Competitor Market Strategies and Strengths and Weaknesses
Competitor A Competitor B Competitor C
Product or service strategies
Pricing strategies
Distribution strategies
Promotion strategies
Strengths and weaknesses
SOURCE: Hisrich, R. D., Peters, M. P., & Shepherd, D. A. (2013). Entrepreneurship: Starting, developing, and managing a new enterprise (9th ed., p. 212). New York, NY: McGraw-Hill.
Copyright ©2016 by SAGE Publications, Inc. This work may not be reproduced or distributed in any form or by any means without express written permission of the publisher.
Do not
copy
, pos
t, or d
istrib
ute

Selecting International Business Opportunities– ▼ –83
To accurately evaluate the idea, it is helpful to define the potential needs of the mar-ket in terms of timing, satisfaction, alternatives, benefits and risks, future expectations, price-versus-product performance features, market structure and size, and economic conditions (see Table 5.3). These factors need to be evaluated in terms of the idea’s com-petitive strength relative to each factor. This comparison with competitive products will indicate the strengths and weaknesses of the idea.
Factor
Your Idea/ Capability
Competitive Company A’s Idea/Capability
Competitive Company B’s Idea/Capability
Differential Advantage
Unique Selling Proposition
Type of Need Continuing need Declining need Emerging need Future need
Timing of Need Duration of need Frequency of need Demand cycle Position in life cycle
Competing Ways to Satisfy Need Doing without Using present way Modifying present way
Perceived Benefits/Risks Utility to customer Appealing characteristics Customer tastes and preferences Buying motives Consumption habits
Table 5.3 Determining the Company’s Competitive Position
(Continued)
Copyright ©2016 by SAGE Publications, Inc. This work may not be reproduced or distributed in any form or by any means without express written permission of the publisher.
Do not
copy
, pos
t, or d
istrib
ute

84–
▼
–ENTERING THE GLOBAL MARKET
SOURCE: Adapted from Hisrich, R. D. (1991). Marketing decisions for new and mature products (2nd ed.). Copyright 1991. Upper Saddle River, NJ: Prentice Hall.
Factor
Your Idea/ Capability
Competitive Company A’s Idea/Capability
Competitive Company B’s Idea/Capability
Differential Advantage
Unique Selling Proposition
Price Versus Performance Features Price-quantity relationship Demand elasticity Stability of price Stability of market
Market Size Potential Market growth Market trends Market development requirements Threats to market
Availability to Customer Funds General economic conditions Economic trends Customer income Financing opportunities
Table 5.3 (Continued)
Once the idea has been evaluated in terms of the need and the market, an initial value determination should be done. Financial issues such as cash outflow, cash inflow, contribution to profit, and return on investment need to be evaluated versus similar numbers and returns for other ideas. Using the form in Table 5.4, the dollar amount of each of the aspects can be determined as accurately as possible so that a quantitative evaluation can be performed. These figures will be revised many times as new informa-tion becomes available.
Copyright ©2016 by SAGE Publications, Inc. This work may not be reproduced or distributed in any form or by any means without express written permission of the publisher.
Do not
copy
, pos
t, or d
istrib
ute

Selecting International Business Opportunities– ▼ –85
Value Consideration Cost (in dollars)
Cash Outflow Research and development costs Marketing costs Capital equipment costs Other costs
Cash Inflow Sales of new product Effect on additional sales Salvageable value
Net Cash Flow Maximum exposure Time to maximum exposure Duration of exposure Total investment Maximum net cash in a single year
Profit Profit from new product Profit affecting additional sales of existing products Fraction of total company profit
Relative Return Return on shareholders’ equity (ROE) Return on investment (ROI) Cost of capital Present value (PV) Discounted cash flow (DCF) Return on assets employed (ROA) Return on sales
Comparisons Compared to other investments Compared to other product opportunities Compared to other investment opportunities
Table 5.4 Determining the Value of the Product/Service in the International Market
SOURCE: Hisrich, R. D. (1991). Marketing decisions for new and mature products (2nd ed.). Copyright 1991. Upper Saddle River, NJ: Prentice Hall.
Copyright ©2016 by SAGE Publications, Inc. This work may not be reproduced or distributed in any form or by any means without express written permission of the publisher.
Do not
copy
, pos
t, or d
istrib
ute

86–
▼
–ENTERING THE GLOBAL MARKET
I was living in Colombia and one of the vice presidents from the Argentina headquarters had just arrived. It was just 10:00 a.m. and an assistant offered him a tinto.
In Spanish, vino tinto means “red wine.” The VP was confused and could not understand how Colom-bians could start drinking so early, not to mention at work! He later discovered that tinto is the slang for “coffee”—at least in the city of Medellin.
SOURCE: Alanis, B. (2011, March 30). Tinto time! Retrieved January 22, 2015, from http://culturalconfusions .com/2011/03/30/tinto-time/
CULTURAL STORY
Finally, the product/service/international market must fit the personal skills and goals of the global entrepreneur. It is particularly important that the global entrepreneur be culturally sensitive to make the venture succeed. The global entrepreneur also needs to have the desire to go global. A global entrepreneur must believe in the idea so much that he or she will make the necessary sacrifices to develop the idea into a sound business model that will be the basis for a successful new venture in the international market.
International Competitive Information
There are many good international sources for competitive information. These include company information, databases, journals, newspapers, trade associations, and personal interviews.
Company Information
Particularly with publicly traded companies, the competitive companies provide a sig-nificant amount of data useful to the global entrepreneur. This is often the best and easiest source of competitive information and is usually very accurate, particularly for companies in developed economies. All company literature and information regarding their interna-tional activities should be collected. Sometimes this is very easily obtained at international trade shows, where more detailed information is available from the individuals staffing the company’s booth. The website of the company should be thoroughly explored as well as the websites of overseas customers and distributors. Companies continually put more and more important information on their websites.
The international advertising of each competitive company should also be examined. This will help develop the market entry strategy and marketing campaign. This is also par-ticularly helpful in providing much-needed pricing information. When possible, be sure to determine whether the advertisement was placed by the company or the distributor in the international market. If the advertisement mentions only one distributor as the contact and
Copyright ©2016 by SAGE Publications, Inc. This work may not be reproduced or distributed in any form or by any means without express written permission of the publisher.
Do not
copy
, pos
t, or d
istrib
ute

Selecting International Business Opportunities– ▼ –87
provides no details on how to reach the company or if there are products featured from more than one manufacturer, the advertisement was probably placed by the distributor. This is important because the manufacturer’s direct involvement in the placement of the advertisement suggests that this particular market is a priority. Direct placement of adver-tisements in a market indicates a higher level of commitment and involvement in the par-ticular market. The advertisements also provide insight into how the competitive company is competing in the particular market; a company’s competitive strategies may vary from one international market to the next.
International Databases
Four primary databases provide good sources of international competitive informa-tion. These are the Directory of United States Exporters, Port Import Export Report Service (PIERS), United Nations’ International Trade Statistics Yearbook, and United States Exports by Commodity.
The Directory of United States Exporters, published each year by the Journal of Commerce, is a combination of some information from PIERS and company responses to a questionnaire. The data for each company include the following:
• Address• Telephone and fax numbers• Number of employees• Year established• Bank SIC code• Modes of transportation used• Contact names and titles• Commodity code and description of products exported• Destination countries• Annual 20-foot equivalent units (TEUs) of containers• Annual number of shipments• Company PIERS identification numbers
Sometimes one of the most important pieces of information—destination country—is not reported directly but simply indicated as “worldwide.” The Directory of United States Exporters is available in both print and CD-ROM versions directly from the Journal of Commerce and can often be used at the state trade assistance center.
The second useful database is the PIERS. The information in this database comes from the manifests of vessels loading international cargo outbound from the United States as well as the manifests of all inbound shipments (imports). Although not every item is available in every situation, the information in the PIERS database includes the following:
• Product description• PIERS product code• Harmonized tariff code and description• U.S. and overseas port name
Copyright ©2016 by SAGE Publications, Inc. This work may not be reproduced or distributed in any form or by any means without express written permission of the publisher.
Do not
copy
, pos
t, or d
istrib
ute

88–
▼
–ENTERING THE GLOBAL MARKET
• Container size, quantity, TEU count, and cubic feet• Steamship line and vessel name• Manifest number• Cargo quantity and unit of measure• Cargo weight• Voyage number• Estimated cargo value• Payment type• Bank name• Shipment direction• U.S. and overseas origins and destinations• Marks and numbers• Name and address of U.S. importer (imports only)• Bill of lading number• Name and address of U.S. exporter• Container number• Name and address of foreign shipper (imports only)• Customs clearing district (imports only)• Name and address of notify party• Arrival and departure dates in U.S. ports
The PIERS database has been expanded to include the shipping activities of most ports of Latin American countries and Mexico.
Other good databases for industry, market, and competitive analysis are indicated in Table 5.5.
Table 5.5 Some Example Databases
• Industry Analysis
{ IBISWorld (http://www.ibisworld.com) { Business Source Complete (http://www.ebscohost.com/academic/business-source-
complete) { Datamonitor (http://datamonitor.com) { Plunkett Research (http://www.plunkettresearch.com) { Hoovers (http://www.hoovers.com)
• Competitive Landscape and Trends
{ Mint Global (http://mintglobal.bvdinfo.com; best for private firms) { Frost & Sullivan (http://ww2.frost.com/) { Gartner (http://www.gartner.com/) { Trade journals { Trade Show News Network (http://www.tsnn.com)
Copyright ©2016 by SAGE Publications, Inc. This work may not be reproduced or distributed in any form or by any means without express written permission of the publisher.
Do not
copy
, pos
t, or d
istrib
ute
Selecting International Business Opportunities– ▼ –89
Journals, Newspapers, and Trade Associations
Journals, newspapers, and trade associations provide another very valuable source of information on competition. Most trade journals are very industry specific and can focus on international activities in that industry. There are also industry trade journals in foreign markets. From these, competitive product and other competitive information, distribution lists, advertise-ments, and other industry data can be easily obtained at little or no cost through the various search and retrieval options available. Many are available on the Internet.
While not usually as valuable, newspapers can also provide competitive information, particularly the local newspaper in the city where the competitive company is headquartered. The local newspaper often provides information not found anywhere else in its coverage of the company and interviews with company managers.
Finally, trade associations in the industry often have summary data on sales and pric-ing in the industry. Most trade associations track international trends and data. Even just a list of association members provides information about the companies interested in a particular industry.
Personal Interviews
Probably the best and most comprehensive source of competitive information comes from personal interviews with individuals who really know the competitor company and international market. By interviewing these individuals and staff writers of journals and newspapers, the global entrepreneur can obtain up-to-date information. Even though
{ Economist Intelligent Unit (http://www.eiu.com/; country database) { ISI Emerging Markets
• Market Analysis
{ SRDS (http://next.srds.com/home; local market analysis) { Euromonitor (http://www.euromonitor.com/; consumer data by country) { Corporate Affiliations (http://www.corporateaffiliations.com/) { Census reports
� http://www.factfinder.census.gov � http://www.census.gov/econ/cbp/ (country business patterns)
{ D&B Million Dollar database (http://www.mergentmddi.com/; supplies and distribution)
{ Kompass (http://kompass.com/; suppliers and databases)
• Financial Ratios
{ RAM E-statement { Bizstats (http://bizstats.com) { IBIS World (http://ibisworld.com/)
Copyright ©2016 by SAGE Publications, Inc. This work may not be reproduced or distributed in any form or by any means without express written permission of the publisher.
Do not
copy
, pos
t, or d
istrib
ute

90–
▼
–ENTERING THE GLOBAL MARKET
sometimes they are not company specific, government contacts in a particular country can provide information about competitive trends and challenges. Industry experts can provide detailed information on the industry and usually on companies in that industry. And, best of all, foreign customers and distributors can provide detailed information about the local market and the activities of competitors.
While you need to analyze foreign markets and the competition and adapt your product/service to meet local market needs to expand internationally, you will also need a person to run the operation. No one knows this better than Bruce McGaw, president of Bruce McGaw Graphics, a West Nyack, New York, fine-arts poster publisher. “As smart as I am about the American market, my knowledge doesn’t necessarily apply abroad,” admits McGaw (Fenn, 1995). Rather than sending one of his U.S. employees to establish a London distributorship, he decided to search for a local manager to run his United Kingdom operation. Because he did not want to “run over there every other week,” he began searching for “someone talented, who would take the ball and run with it.” The individual needed the following:
• Significant industry experience and real marketplace intelligence• An understanding that customer service was central to the company’s success• The ability to take charge and run the business as if it were “his own little business”
McGaw found the right individual—a customer whose business was struggling. McGaw Graphics bought the company and the individual became the UK manager. Five years later, European sales accounted for $3.5 million of the company’s total $15 million in revenue; the UK operation was considered a market leader. McGaw used a similar strategy in France when he acquired a business run by an American. “Where you set up your business is not as important as finding the right person to run it,” says McGaw. Although his strategic plan includes expansion into Germany, Italy, and Spain, McGaw will not move until he finds the right managers.
SUMMARY
This chapter discusses researching and selecting the best foreign market(s) to launch a company internationally. Finding the best market is only possible with thorough research using multiple resources. The chapter describes an effective five-step foreign market selection process: (1) develop appropriate indicators, (2) collect data and convert into comparable indicators, (3) establish an appropriate weight for each indicator, (4) analyze the data, and (5) select the appropriate market from the market rankings. A global entrepreneur must determine the best indicators for whether or not the company will do well in the foreign market and then collect information based on those indicators from federal and international commerce and trade institutions as well as from competitors and other global entrepreneurs that are working in the same market. At least three years of detailed information needs to be collected and analyzed to develop a trend. The information will be either from primary sources, which is a more costly and time-consuming process, or secondary sources, which normally take much less time to access. The main problems that a global entrepreneur will find with secondary data are the
Copyright ©2016 by SAGE Publications, Inc. This work may not be reproduced or distributed in any form or by any means without express written permission of the publisher.
Do not
copy
, pos
t, or d
istrib
ute

Selecting International Business Opportunities– ▼ –91
comparability between countries/regions and lack of specificity. Analyzing the strengths and weaknesses of the competitors’ strategies can provide guidelines for developing the best strategy and determining the most appropriate market.
QUESTIONS FOR DISCUSSION
1. What types of information should global entrepreneurs seek out before deciding which foreign market to enter?
2. What are the different types and sources of information that are available?
3. What are some potential problems with data collected in another country?
4. Jean-Marie is considering expanding her bakery business from France into Croatia. What information would help her determine a good location to start her business there?
CHAPTER EXERCISES
1. Pick a business and create the key indicators that you will use to analyze the new market.
2. Using the same business you chose for Exercise 1, outline the information that you will need to collect about the new market.
3. Finally, create a list of competitors in the new market and identify primary sources to interview about these competitors.
REFERENCES
Doing Business. (2014). Economy rankings. Retrieved April 29, 2014, from http://www.doingbusiness .org/rankings
Fenn, D. (1995, June). Opening up an overseas operation. Inc., 17(8), 89.Woods, C. (2008, April 8). ICU Global grabs international opportunities. Real Business. Retrieved
January 21, 2015, from http://realbusiness.co.uk/article/737-icu_global_grabs_international_opportunities
SUGGESTED READINGS
Butler, J. E., Doktor, R., & Lins, F. A. (2010). Linking international entrepreneurship to uncertainty, opportunity discovery, and cognition. Journal of International Entrepreneurship, 8(2), 121–134. Business Source Complete. Web. 29 Oct. 2013.
This article presents a cognitive model for realizing opportunities and dealing with uncer-tainty in international entrepreneurial ventures. Cognitive processes of international entrepre-neurs, along with cultural differences, are described in terms of how they influence the global entrepreneur’s ability to identify opportunities as well as to tolerate risk.
Copyright ©2016 by SAGE Publications, Inc. This work may not be reproduced or distributed in any form or by any means without express written permission of the publisher.
Do not
copy
, pos
t, or d
istrib
ute

92–
▼
–ENTERING THE GLOBAL MARKET
Chandra, Y., Styles, C., & Wilkinson, I. F. (2012). An opportunity-based view of rapid international-ization. Journal of International Marketing, 20(1), 74–102. Business Source Complete. Web. 29 Oct. 2013.
The authors suggest using an “opportunity-based view” (OBV) rather than a firm-based view to better comprehend rapid internationalization patterns. They describe historical patterns of dynamic entrepreneurial processes to show how path-dependent opportunity developments are influenced by international and domestic networks.
Liesch, P., Welch, L., & Buckley, P. (2011). Risk and uncertainty in internationalisation and interna-tional entrepreneurship studies. Management International Review (MIR), 51(6), 851–873. Business Source Complete. Web. 29 Oct. 2013.
This article explains risk and uncertainty in international expansion. In international entre-preneurship literature, high levels of risk and uncertainty restrain forward momentum. The article aims to describe concepts of “risk accommodation and uncertainty acclimatization” in order to appreciate how uncertainty and risk change over time.
Reuber, A. R., & Fischer, E. (2011). International entrepreneurship in Internet-enabled markets. Journal of Business Venturing, 26(6), 660–679. Business Source Complete. Web. 29 Oct. 2013.
The article describes the latent potential for using the Internet to pursue global oppor-tunities. It explains how online reputation, technological capabilities, and Internet-brand communities are correlated to success in the pursuit of global opportunities in online markets.
Copyright ©2016 by SAGE Publications, Inc. This work may not be reproduced or distributed in any form or by any means without express written permission of the publisher.
Do not
copy
, pos
t, or d
istrib
ute


![Forbes D, Thiessen EJ, Blake CM, Forbes SC, Forbes S · [Intervention Review] Exercise programs for people with dementia Dorothy Forbes 1, Emily J Thiessen , Catherine M Blake2, Scott](https://static.fdocuments.us/doc/165x107/5e80e3196ae8753b9772e3b4/forbes-d-thiessen-ej-blake-cm-forbes-sc-forbes-s-intervention-review-exercise.jpg)