Seismic Liquefaction Hazard and Site Response for Design of Piles in Mumbai City
17
ORIGINAL PAPER Seismic Liquefaction Hazard and Site Response for Design of Piles in Mumbai City Deepankar Choudhury • V. S. Phanikanth • Sumedh Y. Mhaske • Reshma R. Phule • Kaustav Chatterjee Received: 29 June 2012 / Accepted: 11 February 2014 Ó Indian Geotechnical Society 2014 Abstract Mumbai city is the financial capital of India with the highest population density and formed by recla- mation of land over time from original seven different islands. As per Indian seismic design code IS 1893-Part 1, Mumbai city is located in Zone III, hence may experience moderate intensity earthquake which may lead to lique- faction of some typical soil sites of Mumbai city. In this paper, using available recent procedures for liquefaction analysis, seismic liquefaction hazard maps for Mumbai city are prepared. Also the typical coastal soft soil strata of Mumbai may be prone to soil amplification for dif- ferent bed rock earthquake motions and the present study shows that typical ranges of soil amplification factor for bed rock acceleration are 1.2–3.5. Hence, construction of pile foundation, which is mostly used for the effective use of the most precious land of Mumbai city for construction of high rise buildings, need special attention in design when such possibly liquefied soil strata with soil ampli- fication during moderate earthquake intensity is consid- ered. Present study shows the response of pile foundation in both non-liquefied and liquefied soil by considering both kinematic and inertial responses in terms of dis- placement and bending moments of piles, which are necessary to consider for seismic design of pile foundation in typical Mumbai soil. Keywords Seismic liquefaction hazard Ground response analysis Soil amplification Pile Earthquake motion Mumbai Introduction For urban cities with high population, the infrastructural growth demands several high rise constructions which are challenging tasks for civil engineers to provide safe and economic design for such structures. This task becomes more complex in earthquake prone areas. Apart from using country specific seismic design codes, like the Indian standard code IS 1893-Part 1 [1], use of various seismicity factors for design and analysis of pile foundation for high rise constructions need special zone and case specific attention. Hence, the study of seismic hazard, possibility of liquefaction, preparation of seismic liquefaction hazard map for starting the basic design are topics of research around the world. Moreover, not only the seismic design approaches developed some parts of the world may not D. Choudhury (&) V. S. Phanikanth S. Y. Mhaske R. R. Phule K. Chatterjee Department of Civil Engineering, Indian Institute of Technology Bombay (IIT Bombay), Powai, Mumbai 400076, India e-mail: [email protected]; [email protected] V. S. Phanikanth e-mail: [email protected] S. Y. Mhaske e-mail: [email protected] R. R. Phule e-mail: [email protected] K. Chatterjee e-mail: [email protected] D. Choudhury Academy of Scientific and Innovative Research (AcSIR), New Delhi, India V. S. Phanikanth CED, B.A.R.C., Mumbai 400085, India S. Y. Mhaske Civil and Environmental Engineering Department, V.J.T.I., Matunga (East), Mumbai 400019, India 123 Indian Geotech J DOI 10.1007/s40098-014-0108-4
Transcript of Seismic Liquefaction Hazard and Site Response for Design of Piles in Mumbai City

ORIGINAL PAPER
Seismic Liquefaction Hazard and Site Response for Design of Pilesin Mumbai City
Deepankar Choudhury • V. S. Phanikanth •
Sumedh Y. Mhaske • Reshma R. Phule •
Kaustav Chatterjee
Received: 29 June 2012 / Accepted: 11 February 2014
� Indian Geotechnical Society 2014
Abstract Mumbai city is the financial capital of India
with the highest population density and formed by recla-
mation of land over time from original seven different
islands. As per Indian seismic design code IS 1893-Part 1,
Mumbai city is located in Zone III, hence may experience
moderate intensity earthquake which may lead to lique-
faction of some typical soil sites of Mumbai city. In this
paper, using available recent procedures for liquefaction
analysis, seismic liquefaction hazard maps for Mumbai
city are prepared. Also the typical coastal soft soil strata
of Mumbai may be prone to soil amplification for dif-
ferent bed rock earthquake motions and the present study
shows that typical ranges of soil amplification factor for
bed rock acceleration are 1.2–3.5. Hence, construction of
pile foundation, which is mostly used for the effective use
of the most precious land of Mumbai city for construction
of high rise buildings, need special attention in design
when such possibly liquefied soil strata with soil ampli-
fication during moderate earthquake intensity is consid-
ered. Present study shows the response of pile foundation
in both non-liquefied and liquefied soil by considering
both kinematic and inertial responses in terms of dis-
placement and bending moments of piles, which are
necessary to consider for seismic design of pile foundation
in typical Mumbai soil.
Keywords Seismic liquefaction hazard �Ground response analysis � Soil amplification � Pile �Earthquake motion � Mumbai
Introduction
For urban cities with high population, the infrastructural
growth demands several high rise constructions which are
challenging tasks for civil engineers to provide safe and
economic design for such structures. This task becomes
more complex in earthquake prone areas. Apart from using
country specific seismic design codes, like the Indian
standard code IS 1893-Part 1 [1], use of various seismicity
factors for design and analysis of pile foundation for high
rise constructions need special zone and case specific
attention. Hence, the study of seismic hazard, possibility of
liquefaction, preparation of seismic liquefaction hazard
map for starting the basic design are topics of research
around the world. Moreover, not only the seismic design
approaches developed some parts of the world may not
D. Choudhury (&) � V. S. Phanikanth �S. Y. Mhaske � R. R. Phule � K. Chatterjee
Department of Civil Engineering, Indian Institute of Technology
Bombay (IIT Bombay), Powai, Mumbai 400076, India
e-mail: [email protected]; [email protected]
V. S. Phanikanth
e-mail: [email protected]
S. Y. Mhaske
e-mail: [email protected]
R. R. Phule
e-mail: [email protected]
K. Chatterjee
e-mail: [email protected]
D. Choudhury
Academy of Scientific and Innovative Research (AcSIR), New
Delhi, India
V. S. Phanikanth
CED, B.A.R.C., Mumbai 400085, India
S. Y. Mhaske
Civil and Environmental Engineering Department, V.J.T.I.,
Matunga (East), Mumbai 400019, India
123
Indian Geotech J
DOI 10.1007/s40098-014-0108-4

suite at another site but also the country specific study is
too broad to consider in design.
In India, various researchers like Raghukanth and
Iyengar [2], Rao and Satyam [3], Sitharam and Anbazha-
gan [4], Hanumanthrao and Ramana [5], Maheswari et al.
[6], Mhaske and Choudhury [7, 8], Shukla and Choudhury
[9, 10], Chatterjee and Choudhury [11], Kolathayar et al.
[12], Desai and Choudhury [13] and few others showed the
need for location specific study of seismic soil properties
and liquefaction analysis. Hence, location or city specific
seismic hazard study with ground response analysis by
considering local soil properties are needed for important
areas across the world.
Post earthquake investigations on damages of piles are
well documented by Tazoh et al. [14], Madabushi et al.
[15] and few others. Also laboratory test results for piles
under seismic conditions by using centrifuge and shaking
table are available [16–18]. These results show the need of
rigorous soil–pile interaction for accurate prediction of pile
response under earthquake conditions. EN 1998-1 Euro-
code 8 [19] recommends the consideration of both kine-
matic and inertial interactions. Additionally, piles in
liquefying soils are subjected to both vertical and lateral
loads and the presence of liquefying soil due to vertical
loading makes the pile vulnerable to buckling due to sig-
nificant stiffness degradation [20]. A number of simplified
procedures are available in literature for evaluation of
kinematic bending moments along piles, such as dynamic
Winkler models and the P–Y static models [21–24]. Ma-
heswari and Sarkar [25] performed parametric studies on
seismic behavior of soil–pile–super structure interaction in
liquefiable soils. Hence, the importance of such study on
piles in liquefiable soil is well documented.
However, such seismic design procedure for pile in one
of the most important city like Mumbai by considering
local soil conditions, ground motions, liquefaction and
seismic hazard is scarce in literature. Hence, in the present
paper, an attempt has been made to study and prepare the
seismic liquefaction hazard map for Mumbai city, which
was originated from seven different islands with sur-
rounding marshy lands and comes under seismic zone III as
per IS 1893-Part 1 [1]. Since reclaimed marshy lands,
which are prone to liquefaction during the occurrence of a
strong earthquake, may also be prone to soil amplification
which can be obtained by using site-specific seismic
ground response analysis. Finally the above information
from the site-specific ground response analysis and seismic
liquefaction hazard study for Mumbai city, can be utilized
for seismic design of pile foundations in both liquefied and
non-liquefied soils of Mumbai city. It has been aimed to
obtain the seismic response of piles in terms of pile
bending moment and pile deflection considering both
kinematic and inertial interactions.
Study Area and Need for Study
For the present study, the area of Mumbai city bounded
between latitude of about 19�150N to 18�540N and longitude
of about 72�470E to 73�000E is chosen. Mumbai is the
financial (economical) capital of India, which is located in
the western part of India and it is the capital of Maharashtra
state of India. Mumbai city covers an area of about 437 sq.
km. with the population of about 12.5 million as per census
data of 2011. In India, Mumbai is the most populous city
being the financial hub of the country. This city is subjected
to tropical climate with average annual rainfall of about
250 cm but concentrated during three months of the year
and hence heavy rainfall intensity is experienced in this
city. Being the most populous and financial hub of India,
Mumbai city is having maximum number of high rise
buildings in India due to scarcity of vacant land. All these
high rise structures are mostly founded on pile foundation
due to typical soft nature of soil strata in Mumbai which is a
typical coastal city. Also all modes of transport system like
bus, train, metro, ship, airplanes, cars etc. are available in
Mumbai for commuters. All these characteristics of the city
already show the amount of possible hazards which may
occur due to any earthquake disaster in this city [26].
Moreover, Mumbai city was originated from original
seven different islands that were joined together to create a
single island which is called as present day Mumbai city.
As per seismic zonation map of India [1], Mumbai city
comes under seismic zone III. Figure 1 is showing the
seismic zonation map of India with a highlight on Mumbai
city which was originated from seven islands with sur-
rounding marshy lands [7]. The original seven islands were
lush green thickly wooded, and dotted with 22 hills; with
the Arabian Sea washing through them at high tide. It has
been a natural shipping and trading centre throughout its
history and has grown in spite of lying in a seismically
active zone. The original island of Mumbai was only
24 km long and 4 km wide from Dongri to Malabar hill
and the other six islands were Colaba, Old Woman’s
island, Mahim, Parel, Worli and Mazgaon. From past his-
tory, it has been found that Mumbai and surrounding area
had experienced earthquakes of various magnitudes/inten-
sity from time to time as shown in Table 1 (Modified after
[7]). Also the seismic zoning map of India [1] provides the
information that for seismic zone III, an earthquake of
intensity between 5.5 and 6.5 can be expected. Moreover a
reclaimed land can easily liquefy during a major earth-
quake. Hence, in this study, Mumbai and surrounding city
area are chosen as the study area for the preparation of
seismic liquefaction hazard map followed by site-specific
ground response analysis which in turn can be used for
design of pile foundation in liquefied and no-liquefied soil
under seismic conditions.
Indian Geotech J
123

Liquefaction Hazard Map for Mumbai
After knowing the importance of the present study from
above section, the next step is to identify the possible areas
within Mumbai city which may prone to liquefaction under
different magnitudes of earthquake. To carry out the liq-
uefaction analysis for any particular soil site, the necessary
basic soil data and dynamic soil properties need to be
obtained. Over 500 borehole data and soil testing reports
for entire Mumbai was collected / obtained from different
government and private institutions and consultants. The
thematic maps of soil index properties such as moisture
content, specific gravity, liquid limit, plastic limit etc. were
generated by Mhaske and Choudhury [27] by using vector
analysis module of Geographic Information System (GIS)
GRAM?? software (version 1.4) [28]. GRAM?? (v1.4)
[28] is relatively costeffective than other available com-
mercial GIS software with similar quality of outputs. These
will be very helpful to know the variation of soil profile
from place to place and in varying depth to depth. Geo-
technical engineers can very easily locate the suitable soil
strata for laying foundation of structures.
The typical subsurface soil profiles for Mumbai city is
shown in Fig. 2. It is found that there are a lot of variations in
soil of Mumbai city. In the south-west part of Mumbai city
(Girgaon), it is found that the soil having yellowish sand is
overlaying on black to yellowish clay and hard rock is
observed at the depth of 10 m. In the south-east part of
Mumbai city (Wadala), it is found that the overburden soil is
consisting of sand and gravel overlaying on medium stiff
grayish black marine clay and slightly weathered to
moderately weathered rock is observed at the depth of 13 m
onwards. In the extreme north-west part of Mumbai city
(Andheri), it is found that the gray stiff clay, brown plastic
sandy clay is sandwiched between the overburden soil con-
sisting of sand and gravel and brown silty sand and moderately
weathered rock is observed at the depth of 5 m onwards. The
ground water table is observed to fluctuate from the depth of
1.5–4 m during the period from October to April.
Table 2 shows the typical details of average shear wave
velocity of overburden soil at various sites in Mumbai city,
which are calculated by using the co-relationship between
SPT ‘N’ value and shear wave velocity (Vs) for typical
Mumbai soil, that has been proposed by Mhaske and
Choudhury [8] as given below,
Vs ¼ 72 Nð Þ0:4 for all soilsð Þ ð1Þ
where Vs is the shear wave velocity of soil (m/s), N is the
measured SPT value.
Also the empirical relation between corrected SPT value
with clean-sand condition [(N1)60,cs] and shear wave
velocity was given as [8],
Vs ¼ 40 N1ð Þ60; cs
h i0:47
ð2Þ
These Eqs. (1) and (2) can be used for further site-
specific ground response analysis or liquefaction study for
Mumbai city. Table 2 also shows the classification of
typical Mumbai soil sites in terms of seismic classification
as proposed by NEHRP [29]. It may be noticed that as per
NEHRP [29], typical Mumbai soil mostly belongs to class
D or class E types of soil as per average shear wave
Fig. 1 Seismic zonation map of India with highlight on Mumbai city, which was originated from seven islands with surrounding marshy lands
(Modified after [7])
Indian Geotech J
123

velocity of overburden soil. This information is extremely
useful for determination of design acceleration spectra as
per codal provisions for earthquake resistant design of
super and sub-structures in and around Mumbai city.
Table 3 shows typical ranges of SPT ‘N’ values and
estimated average shear wave velocities of soil in Mumbai
city. It will be very useful for design and site engineers for
preliminary analysis for foundations in Mumbai city.
Figure 3 shows geospatial contour map of average shear
wave velocity (Vs) of soil for Mumbai city at an interval of
Fig. 2 Typical subsurface soil profiles of Mumbai city
Table 1 Tremors that shook
Mumbai city in the past
(Modified after [7])
Year Month Earthquake magnitude/intensity Scale
1906 March VI Modified Mercalli Intensity (MMI)
1929 February V
1933 July V
1951 April VIII
1966 May V
1967 April 4.5 (R) Richter/local magnitude (R)
1967 June 4.2 (R)
1993 September 6.4 (R)
1998 May Mw = 3.8 Moment magnitude (Mw)
2005 March Mw = 5.1
2005 June Mw = 3.7
2005 August Mw = 4.1
2010 July Mw = 2.5
2010 August Mw = 2.6
2011 September Mw = 3.1
2012 April Mw = 4.6
2013 November Mw = 3.3
Indian Geotech J
123

100 m/s. This information will be highly useful for further
dynamic analysis and design in Mumbai city. Figure 4
provides the correlations between shear wave velocity (Vs)
and SPT ‘N’ value for various Indian soils as done by
different researchers like Hanumantharao and Ramana [5]
for Delhi city, Anbazhagan and Sitharam [30] for Banga-
lore city, Maheswari et al. [6] for Chennai city, Mhaske
and Choudhury [8] for Mumbai city and Chatterjee and
Choudhury [11] for Kolkata city. It may be noted that the
proposed empirical relation for Mumbai soil is similar to
that of Chennai soil and the reason may be attributed to the
fact that both the cities are coastal city with similar type of
soil profile at various locations.
It is well known that Youd et al. [31] approach is widely
accepted worldwide for the calculation of seismic lique-
faction potential at any depth of soil. However, it may be
noted that other recent developments are further going on
for computation of liquefaction potential by considering
various other aspects like effect of fine grained soil as
proposed by Boulanger and Idriss [32], for probabilistic
estimation of liquefaction as proposed by Cetin et al. [33]
etc. (see [34, 35]). The estimation of soil liquefaction due
Table 2 Typical average shear wave velocity of overburden soil and soil type at various locations of Mumbai city
Bore
log no.
Latitude
(N)
Longitude
(E)
Station Depth
of SPT
(m)
SPT
‘N’
value
Shear wave
velocity of
soil Vs =
72(N)0.40
(m/s)
Average shear
wave velocity of
overburden soil
above the rock
VsOBS in (m/s)
Soil class
as per
NEHRP
[29]
Type of soil
as per
NEHRP
[29]
BL1 19�050400 72�5401900 LBS Marg to
Ghatkopar
5.0 34 295 334 D Stiff soil
BL109 19�0605000 72�5105000 Chakala 3.6 23 252 234 D Stiff soil
BL11 19�0503500 72�540600 Subhash Nagar to
as alpha
3.6 25 261 235 D Stiff soil
BL110 19�0604100 72�5201100 Chakala to Airport
Road
6.6 39 312 268 D Stiff soil
BL117 18�0304100 72�5402900 Chembur 4.6 10 181 141 E Soft soil
BL141 19�0703600 72�4905900 D N Nagar Yard 5.1 18 229 173 E Soft soil
BL15 19�0601100 72�5301700 Sakinaka to Subhas
Nagar
2.1 14 207 99 E Soft soil
BL317 19�0205600 72�5005300 Mahim 6.55 55 358 360 C Very dense soil
and soft rock
BL35 19�0705400 72�4901600 Andheri 15.4 16 218 184 D Stiff soil
BL300 18�5903900 72�4904900 Lower Parel 2.6 15 213 216 D Stiff soil
Table 3 Typical ranges of SPT ‘N’ values and estimated average shear wave velocities of soil in Mumbai city (Modified after [8])
Location Soil type Depth
(m)
Range of SPT
‘‘N’’ value
Range of shear wave velocity (m/s) of soil
for Mumbai city Vs = 72(N)0.40Range of soil class as
per NEHRP [29]
Andheri Stiff clay 3–8 6–24 140–250 E–D
Bandra-Kurla
Complex
Black marine clay/stiff clay 2.5–5.5 3–50 110–350 E–D
Charni road Stiff clay 2–9 11–34 185–290 D
Chembur Stiff clay 1.5–5 6–35 140–300 E–D
Tulpule
chowk
Very stiff yellowish brown
silty clay with gravel
3.1–5.6 12–25 194–305 E–D
Vikhroli Yellowish hard Murrum 1.5–12 9–50 170–340 E–D
Walkeshwar Backfilled soil 1.1–3.1 12–15 190–210 D
Azad nagar Filled up soil consisting of silt
clay with gravel
2.1–3.8 5–45 137–330 E–D
Girgaon Yellowish loose sand 1.5–6 9–16 170–210 E–D
Goregaon Yellowish clayey soil 2.1–3.6 4–16 125–220 E–D
Indian Geotech J
123
to earthquake can be expressed in terms of factor of safety
against liquefaction (FSL), which is expressed as,
FSL ¼ CRR7:5=CSR ð3Þ
In Eq. (3), CRR7.5 = Cyclic resistance ratio at
earthquake moment magnitude Mw = 7.5 as defined by
Youd et al. [31] and CSR = Cyclic stress ratio as defined
by Seed and Idriss [36]. But the estimation of CSR as
function of stress reduction coefficient (rd), which varies
with depth of soil layer is still thoroughly researched by
various experts worldwide. To name a few, Idriss (see [37])
had modified the expression of rd and later Cetin et al. [33]
and Kishida et al. [38] had updated the variation of rd with
depth. As very recently reported by Idriss and Boulanger
[37], the effect of earthquake magnitudes and shear wave
velocity also should be taken into consideration for
estimation of rd with depth instead of taking it as
function of depth only as was originally proposed by
Seed and Idriss [36]. Figure 5 shows the comparison of
variation of rd with depth as proposed by various
researchers for earthquake moment magnitude of 7.5. It
may be noted that Youd et al. [31] and Idriss and
Boulanger [37] relationships are identical at depth below
12 m but deviate significantly with increasing depth
beyond 12 m. Curve given by Idriss (see [37]) showed
the greater spread than other relationships because it was
developed to represent about the 67th percentile values.
Relationships given by Cetin et al. [33] and Kishida et al.
[38] for peak acceleration of 0.2 g and shear wave velocity
of 160 m/s yields lower rd values than that proposed by
others. At greater depths ([15 m), all the procedures vary
significantly from each other and hence showing increased
uncertainty in rd values at larger depths. However, at
depths larger than about 12 m (i.e., beyond the range
covered by the available case histories), the rd relationship
should play a relatively minor role because dynamic site
response analyses are often warranted when liquefaction at
large depths is of concern as stated by Idriss and Boulanger
[37]. These latest findings should be considered for
computation of liquefaction potential at a soil site.
Table 4 indicates the complexity of the relationships for
the estimation of CSR in computation of liquefaction
potential. Keeping all these aspects in mind, for the present
study, approaches given by Youd et al. [31] and Idriss and
Boulanger [39] are used to estimate CRR values from field
data of SPT ‘N’ values after carrying out suitable
Fig. 3 Geospatial contour map of shear wave velocity (Vs) of soil for Mumbai city at an interval of 100 m/s
Indian Geotech J
123

corrections. Moreover, amax value of 0.16 g is considered
for different magnitudes of earthquakes (based on the
concept of design basis earthquake as per design code
provision) since Mumbai city is located in seismic zone III
according to IS 1893-Part 1 (2002). The results obtained
from the analysis of factor of safety against liquefaction of
soil under various earthquake moment magnitudes by using
simplified procedure of Youd et al. [31] and Idriss and
Boulanger [39] are divided into three different categories
as shown in Table 5. Table 6 gives the typical lowest
values of factor of safety against liquefaction using Youd
et al. [31] approach at various locations in Mumbai city for
earthquake moment magnitudes (Mw) ranging from 5.5 to
7.5. These moment magnitudes are selected in the present
study for Mumbai soil sites which is located in seismic
zone III as per IS 1893-Part 1 (2002) because, the
earthquake motions which have been later considered for
seismic ground response analysis and analysis and design
of piles in liquefied soil, i.e., 1989 Loma Gilroy, 1989
Loma Prieta, 1995 Kobe and 2001 Bhuj motions, typically
had their moment magnitudes in this considered range.
Further, the seismic zonation map of India as per IS
1893-Part 1 (2002) provides the information that for
seismic zone III, an earthquake of intensity between 5.5
and 6.5 can be expected, which justifies the selection of Mw
of 5.5–7.5 in the present study. Table 7 shows the
comparison of typical lowest values of factor of safety
against liquefaction obtained by using Youd et al. [31] and
Idriss and Boulanger [39] procedures at various locations in
Mumbai city for earthquake of moment magnitudes (Mw)
as 5.5.
Finally, a GIS map of Mumbai city based on the cal-
culation soil liquefaction potential using the simplified
procedure of Youd et al. [31] is generated by using soft-
ware GRAM?? (version 1.4) [28]. Figure 6a shows the
typical map of the critically liquefiable areas in Mumbai
city at earthquake moment magnitude Mw = 7.0. Also
Fig. 6b shows the typical variation of factor of safety
against liquefaction with depth as obtained by using Youd
et al. [31] procedure for earthquake moment magnitude
Mw = 7.0. Similarly GIS maps for liquefaction of soils of
Mumbai city by adopting the procedure of Idriss and
Boulanger [39] are also generated by using Quantum GIS
(QGIS) (version 1.8.0-Lisboa) [40], which is a free open
source software as compared to GRAM?? which is a
licensed GIS software. Figure 7a shows the typical map of
the critically liquefiable areas in Mumbai city at earthquake
moment magnitude Mw = 5.5. Figure 7b shows the com-
parison of typical variation of factor of safety with depth as
obtained by using procedures of Youd et al. [31] and Idriss
and Boulanger [39] for earthquake moment magnitude
Mw = 5.5. It can be seen that the factor of safety values
predicted by both the procedures are nearly identical for an
earthquake of magnitude (Mw) 5.5. It is also observed that
the typical depth and thickness of the liquefiable soil layers
at different locations of Mumbai city varies depending on
0
100
200
300
400
500
0 10 20 30 40 50 60 70
Shea
r w
ave
Vel
ocit
y 'V
s' (
m/s
)
SPT 'N' value
Hanumantharao and Ramana [5] [Delhi]
Anbazhagan and Sitharam [30] [Bangalore]
Maheshwari et al. [6] [Chennai]
Mhaske and Choudhury [8] [Mumbai]
Mhaske and Choudhury [8] [Mumbai]
Chatterjee and Choudhury [11] [Kolkata]
Vs=82.6N0.43
Vs=78[(N60)CS]0.4
Vs=95.64N0.301
Vs=72N0.4
Vs=40[(N1)60,CS]0.47
Vs=78.21N0.38
Fig. 4 Correlations between
shear wave velocity (Vs) and
SPT ‘N’ value for soils of
various Indian cities
0
50
100
150
200
0
5
10
15
20
25
30
0.00 0.20 0.40 0.60 0.80 1.00E
ffec
tive
Ver
tica
l Str
ess,
σ'v
o (k
Pa)
Dep
th b
elow
gro
und
leve
l (m
)
Stress reduction coefficient, rd
Youd et al.[31]
Cetin et al. [33](amax=0.2,Vs=160,Mw=7.5)Idriss and Boulanger [37]
Idriss [see 31]
Kishida et al. [38](amax=0.2,Vs=160,Mw=7.5)
Fig. 5 Comparison between various relationships for stress reduction
coefficient (rd) with depth as proposed by different researchers
Indian Geotech J
123

Table 4 Evaluation of the complexity of the relationships for the estimation of CSR in computation of liquefaction potential
Criteria Input parameters Different cases Applicability
Liao and Whitman (1986) (see [31]) z Yes Easy
Blake (1996) (see [31]) z No Relatively easy
Youd et al. [31] z Yes Easy
Cetin et al. [33] z, ML, amax, Vs Yes Complicate
Idriss and Boulanger [39] z, ML No Relatively easy
Kishida et al. [38] z, ML, amax, Vs No Complicate
Different cases Different equations according to the depth, applicability the relationships are more difficult to use when the number of input
parameters and functions (sine, exponential…) increase, z depth, ML local magnitude, amax peak horizontal acceleration, Vs relative shear wave
velocity
Table 5 Classification of soil based on lowest factor of safety against liquefaction (Modified after [7])
Sr.
no.
Lowest factor of safety against
liquefaction of soil FSL
Remark Recommendation
1 FSL B 1.0 Critically
liquefiable
soil
Unsafe, hence no foundation is recommended without proper and significant design
care including soil improvements
2 1.0 \ FSL B 1.3 Moderately
liquefiable
soil
Marginally safe, hence limited foundation is recommended with least importance
factor with marginal design care and/or soil improvement
3 FSL [ 1.3 Non liquefiable
soil
Safe, hence foundation can be installed without any liquefaction related problem
Table 6 Typical lowest values of factor of safety against liquefaction of soil at Mumbai for earthquake magnitude from Mw = 5.5 to 7.5
Sr.
no
Site address Factor of safety
against liquefaction
at Mw = 5.5
Factor of safety
against liquefaction
at Mw = 6.0
Factor of safety
against liquefaction
at Mw = 6.5
Factor of safety
against liquefaction
at Mw = 7.0
Factor of safety
against liquefaction
at Mw = 7.5
FSL FSL FSL FSL FSL
1. Ashajeevan CSH plot no.
24 Mhada malvani [BL
321]
1.24 0.99 0.81 0.67 0.561
2. Prathmesh view Bhandup
[BL 86]
1.14 0.91 0.74 0.62 0.516
3. Saraswati Apt Chikuwadi
Borivali (W) [BL 105]
1.56 1.25 1.02 0.84 0.706
4. Shivam Enterprises
Chikuwadi Borivali
(W) [BL 106]
1.61 1.29 1.05 0.87 0.729
5 Vishwanath Construction
Kandarpada Dahisar
(w) [BL 170]
1.45 1.16 0.95 0.78 0.656
6 Incubatation Centre for
Nirton Ltd. Goregaon
[BL 220]
1.74 1.40 1.14 0.94 0.789
7 Krishna Niwas Roshan
Nagar Borivali
(W) [BL 107]
1.58 1.26 1.03 0.85 0.712
8 Extn Industrial bldg
charkop Kandivali
(w) [BL 262]
2.62 2.10 1.71 1.41 1.184
Indian Geotech J
123

soil profile at various borehole locations. However
depending on magnitude of earthquake, soil and ground
water table conditions etc. the lowest factor of safety
against liquefaction were observed typically within top
10 m from ground surface at selected locations. Hence it
can be concluded that several locations in Mumbai city
may be prone to moderate to critical liquefaction at dif-
ferent magnitudes of earthquakes as shown in Figs. 6a and
7a. As a result, the site specific equivalent-linear and non-
linear seismic ground response analyses of some typical
soil sites of Mumbai city are conducted to study the per-
formance of pile foundation placed in liquefied soil, the
failure mechanism and behavior of which is well known
from literature and given in Choudhury et al. [41]. Hence, a
proper design of pile foundation for high rise structures in
Mumbai city is essential.
Site-Specific Ground Response Analysis for Mumbai
Site-specific ground response analysis is the next step at
any soil site to understand the effect of bed rock motion
when it passes through various soil layers. Mumbai city is
typically having from medium to thick soil layer and hence
such site-specific ground response analysis of bed rock
earthquake motion is necessary for Mumbai city. Various
researchers worldwide had given different techniques to
carry out such analysis. Also linear, equivalent-linear and
non-linear ground response analyses are three different
options to carry out site-specific ground response analysis
[42, 43].
A typical soil borehole data of Mangalwadi site at
Mumbai (MBH#1) which has been considered in the soil–
pile interaction analysis under non-liquefied conditions is
given in Table 8. By using 2001 Bhuj earthquake motion,
the equivalent-linear [44] and non-linear site-specific
ground response analyses are carried out by using geo-
technical software DEEPSOIL v3.5 [45]. The acceleration–
time history of 2001 Bhuj earthquake motion as was given
by Govindaraju et al. [46] with maximum horizontal
acceleration (MHA) = 0.106 g and mean time period
Tm = 0.603 s is used as input data for ground response
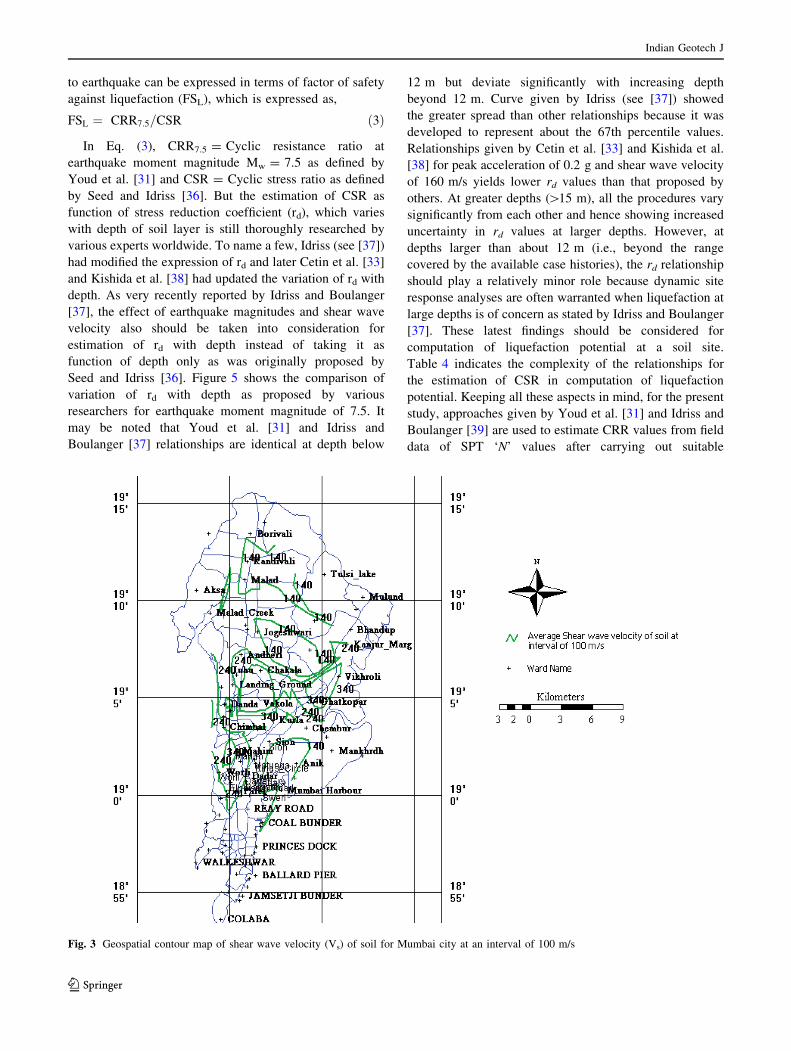
analysis. Figure 8 gives the results of acceleration–time
history of 2001 Bhuj earthquake motion at soil site MBH#1
in Mumbai city by using equivalent-linear and non-linear
ground response analyses. It may be noted that for com-
plete picture on the site-specific ground response analysis
of typical Mumbai soil sites, other available earthquake
input motions, like 1995 Kobe earthquake, 1989 Loma
Prieta earthquake and 1989 Loma Gilory earthquake
motions are also chosen for the present study. Consider-
ation for the wide ranges of MHA and Tm values had been
given for selection of such four different types of earth-
quake motion in the present analysis. Figure 9a, b gives the
acceleration response spectra for equivalent-linear ground
response analysis and non-linear ground response analysis,
respectively at the ground level with 5 % damping for soil
site MBH#1 subjected to four different earthquake
motions. From Fig. 9, the peak responses can be observed
for 1989 Loma Gilroy earthquake motion with acceleration
response of 3.75 g at a period of 0.23 s using equivalent-
linear ground response analysis, whereas by using non-
linear ground response analysis, 1995 Kobe motion is
producing an acceleration response of 5.43 g at a period of
0.38 s. These acceleration response spectrum curves will
be beneficial to design engineers for the earthquake resis-
tant design of various geotechnical structures in and across
Mumbai city. Figure 10 shows the typical soil amplifica-
tion for earthquake acceleration at various soil sites in
Mumbai city subjected to four different earthquake
motions. As experienced from 1985 Mexico city earth-
quake, it may be noted from the results given in Fig. 10
Table 7 Comparison of typical lowest values of factor of safety against liquefaction of soil by using procedures of Youd et al. [31] and Idriss
and Boulanger [39] for Mumbai city for earthquake magnitude of Mw = 5.5
Sr. no. Bore log no. Site address Factor of safety against
liquefaction at Mw = 5.5
using procedure of Idriss
and Boulanger [39]
Factor of safety against
liquefaction at Mw = 5.5
using procedure of
Youd et al. [31]
FSL FSL
1 BL321 Ashajeevan CSH plot no 24 Mhada malvani, Malad 1.27 1.24
2 BL86 Prathmesh view Bhandup 1.22 1.14
3 BL105 Saraswati Apt Chikuwadi Borivali (W) [BL 105] 1.50 1.56
4 BL106 Shivam Enterprises Chikuwadi Borivali (W 1.50 1.61
5 BL170 Vishwanath Construction Kandarpada Dahisar (w) 1.45 1.45
6 BL220 Incubatation Centre for Nirton Ltd. Goregaon 1.60 1.74
7 BL107 Krishna Niwas Roshan Nagar Borivali (w) 1.53 1.58
8 BL262 Extn Industrial bldg charkop Kandivali (w) 1.82 2.62
Indian Geotech J
123

Fig. 6 a Map of the critically liquefiable areas in Mumbai city for earthquake magnitude Mw = 7.0. b Typical variation of factor of safety
against liquefaction with depth for earthquake magnitude Mw = 7.0 using simplified procedure of Youd et al. [31]
Fig. 7 a GIS Map of Mumbai city showing the variation of lowest
factor of safety against liquefaction using Idriss and Boulanger [39]
procedure for Mw = 5.5. b Typical variation of factor of safety
against liquefaction with depth at Mw = 5.5 using simplified
procedures of Youd et al. [31] and Idriss and Boulanger [39]
Indian Geotech J
123
that in Mumbai also at soil site with thick soft clay layer
experiences high value of amplification of bed rock motion.
The values of soil amplification ranges varying between 1.2
and 3.5 for typical soil sites in Mumbai city, are obtained in
the present study. Moreover the amplification due to 2001
Bhuj motion is maximum when compared to that due to
1995 Kobe motion, although the later one had a higher
MHA. This is due to the higher frequency content and
duration of 2001 Bhuj motion, resulting in more load
reversals, when compared to the other input motion. It may
be noted that for carrying out seismic ground response
study, the recorded ground motion of a particular earth-
quake should be applied by deconvoluting it till bed rock
and then by convoluting one can obtain soil amplification
in realistic manner. Hence proper care for such soft soil
sites where large amplification is expected during an
earthquake must be considered for seismic design of pile
foundations.
Table 8 Typical soil profile of Mangalwadi site at Mumbai (MBH#1) considered in the soil–pile interaction analysis under non-liquefied
conditions
Layer
no.
Stratum Layer
thickness (m)
Depth below
GL (m)
SPT
value (N)
Eo (MPa) B = D=pile
dia. (cm)
khn
(MN/m3)
sf kh = khnsf
(kN/m3)
Ip
(m4)
1 Filled up soil 1.5 1.5 10 7 50 29.78 1.0 29,782.46 0.0031
2 Yellowish loose
sand
1.5 3 12 8.4 50 35.74 1.0 35,738.95 0.0031
1.5 4.5 13 9.1 50 38.72 1.0 38,717.19 0.0031
1.5 6 16 11.2 50 47.65 1.0 47,651.93 0.0031
3 Black clayey soil 2 8 20 14 50 59.57 1.0 59,564.91 0.0031
4 Yellowish clayey
soil
1.8 9.8 25 17.5 50 74.46 1.0 74,456.14 0.0031
5 Greyish hard rock – [9.8 – – – – – – –
‘–’ indicates not reported or relevant
Fig. 8 a Acceleration–time
history of 2001 Bhuj earthquake
motion at soil site MBH#1 in
Mumbai city using equivalent-
linear ground response analysis
(Modified after [44]).
b Acceleration–time history of
2001 Bhuj earthquake motion at
soil site MBH#1 in Mumbai city
using non-linear ground
response analysis
Indian Geotech J
123

Fig. 9 a Acceleration response
spectra obtained from
equivalent-linear ground
response analysis at ground
level with 5 % damping for soil
site MBH#1 under various
earthquake motions (Modified
after [44]). b Acceleration
response spectra obtained from
non-linear ground response
analysis at ground level with
5 % damping for soil site
MBH#1 under various
earthquake motions
Fig. 10 Typical soil
amplification for earthquake
acceleration at various soil sites
in Mumbai under different
earthquake motions (Modified
after [44])
Indian Geotech J
123

Piles in Liquefied Soil
It is now well understood that for Mumbai city, piles
subjected to earthquake motion and passing through both
non-liquefiable and liquefiable soil layers are important
areas of study. Current design methods are based on
bending failure due to lateral inertial load and loads due
to lateral spreading during earthquake in a liquefiable soil
strata as discussed by researchers like Liyanapathirana
and Poulos [47], Bhattacharya [48] etc. Again Dobry
et al. [49] proposed simplified limit equilibrium method
for computing maximum bending moment in a pile in
liquefied soil under earthquake condition. In case of liq-
uefying soils, the subgrade modulus (kh) of soil is
degraded and the degradation of khn is expressed as [50,
51, 58],
L1
L2
L3
x
Non-liquefied soil layer
Liquefied soil layer
Non-liquefied soil layer
y
Single pile
L
Fig. 11 Schematic diagram of a
single pile passing through
liquefied and non-liquefied soil
layers (Modified after [58])
0
2
4
6
8
10
12
-1000 -500 0 500 1000 1500 2000 2500 3000
-1000 -500 0 500 1000 1500 2000 2500 3000
Deflection(combined)-mm
MBH#1,Bhuj(2001);H=222.0 kN
MBH#1, Kobe (1995);H=810.0 kN
MBH#1, Loma Prieta(1989);H=567.0 kN
MBH#1, Loma Gilroy (1989); H=1003.0 kN
Dis
tanc
e fr
om to
p(m
)
L=10.0m; r=0.25m; E=2.74×10⁷kN/m 2; sf=0.01;
0
2
4
6
8
10
12
Deflection(Inertial)-mm
MBH#1,Bhuj(2001);H=222.0 kN
MBH#1, Kobe (1995);H=810.0 kN
MBH#1, Loma Prieta(1989);H=567.0 kN
MBH#1, Loma Gilroy(1989); H=1003.0 kN
Dis
tanc
e fr
om to
p(m
)
L=10.0m; r=0.25m; E=2.74×10⁷ kN/m 2;sf=0.01
(a)
(b)
Fig. 12 a Pile deflections
(combined) in liquefied soils
considering various ground
motions for free headed pile
with floating tip. b Pile
deflections (inertial) in liquefied
soils considering various ground
motions for free headed pile
with floating tip
Indian Geotech J
123
kh ¼ khnsf ð4Þ
where sf is the scaling factor for the liquefied soil. It has
been observed from various case-studies that sf varies from
0.001 to 0.01 [52].
The subgrade modulus for non-liquefied soil, khn pro-
posed by AIJ [53], JRA [54] as mentioned in [58] can be
reported as,
khn ¼ 80 EoB�0:75o ð5Þ
Eo ¼ 0:7N ð6Þ
where khn is in MN/m3, and Eo is the modulus of defor-
mation in MN/m2, N is the SPT value, and Bo is the
diameter of the pile in cm.
Recently, Haldar and Babu [55] carried out parametric
studies on the failure mechanisms of pile foundations in
liquefiable soils by using geotechnical software FLAC.
Liyanapathirana and Poulos [56] considered the effect of
two layer soil deposit with liquefying and non-liquefying
layers on behavior of single pile using numerical analysis.
Abdoun et al. [57] conducted dynamic centrifuge tests and
compared the maximum bending moment on single pile
with results of Liyanapathirana and Poulos [56] which was
found within a difference of 15 %. Figure 11 shows a
schematic diagram of a single pile passing through both
liquefied and non-liquefied soil layers (modified after [58]).
Peak ground accelerations obtained from equivalent-linear
ground response analysis are 0.251 g for 2001 Bhuj
motion, 0.641 g for 1989 Loma Prieta motion, 1.136 g for
1989 Loma Gilroy motion, and 0.917 g for 1995 Kobe
motion for typical MBH#1 soil site in Mumbai city. The
modulus of subgrade reaction approach based on finite
difference technique by considering Winkler springs for
pile–soil interaction is used in the present study. The code
using finite difference approach [59] is written using
MATLAB [60]. A pile with radius of 0.25 m is considered
in the present study, while a typical single pile length (L) of
10 m is considered based on the depth of the soil profile in
the borehole dimensions MBH#1. Young’s modulus of the
pile is considered as 2.74 9 107 kN/m2. It is first assumed
that the soil is non-liquefying and hence stiffness degra-
dation effects are not considered (sf = 1.0) for evaluating
the pile response. Later, for liquefiable soil layer, such
stiffness degradation is considered in the analysis. Recently
Phanikanth et al. [58] used the following notations for the
study which are also adopted in the present analysis. For
0
2
4
6
8
10
12
MBH#1,Bhuj (2001); L2/L=0.20; H=222.0 kN
MBH#1, Bhuj(2001); L2/L=0.40; H=222.0 kN
MBH#1, Bhuj(2001); L2/L=0.60; H=222.0 kN
MBH#1, Bhuj(2001); L2/L=0.80; H=222.0 kN
MBH#1, Bhuj(2001); L2/L=1.0; H=222.0 kN
Pile deflection (combined)-mm
Dis
tanc
e fr
om to
p(m
)
L=10.0m; r=0.25m; E=2.74×10⁷ kN/m2;sf=0.01
0
2
4
6
8
10
12
-300 -200 -100 0 100 200 300 400 500 600
-200.0 0.0 200.0 400.0 600.0 800.0 1000.0 1200.0 1400.0 1600.0 1800.0
MBH1,Bhuj (2001);H=222.0 kN;sf=0.01
MBH1,Bhuj(2001); H=222.0 kN;sf=1.0
MBH#1,Loma Prieta(1989); H=567.0 kN; sf=1.0
MBH#1,Loma Prieta(1989);H=567.0 kN;sf=0.01
MBH#1,Loma Gilroy(1989);H=1003.0 kN;sf=1.0
MBH#1,loma Gilroy(1989);H=1003.0 kN;sf=0.01
MBH#1,Kobe(1995); H=810.0 kN;sf=1.0
MBH#1,Kobe(1995); H=810.0 kN;sf=0.01
Bending Moment (combined)-kNm
Dis
tanc
efro
m to
p(m
)
L=10.0m; r=0.25m;E=2.74×10⁷ kN/m2
(a)
(b)
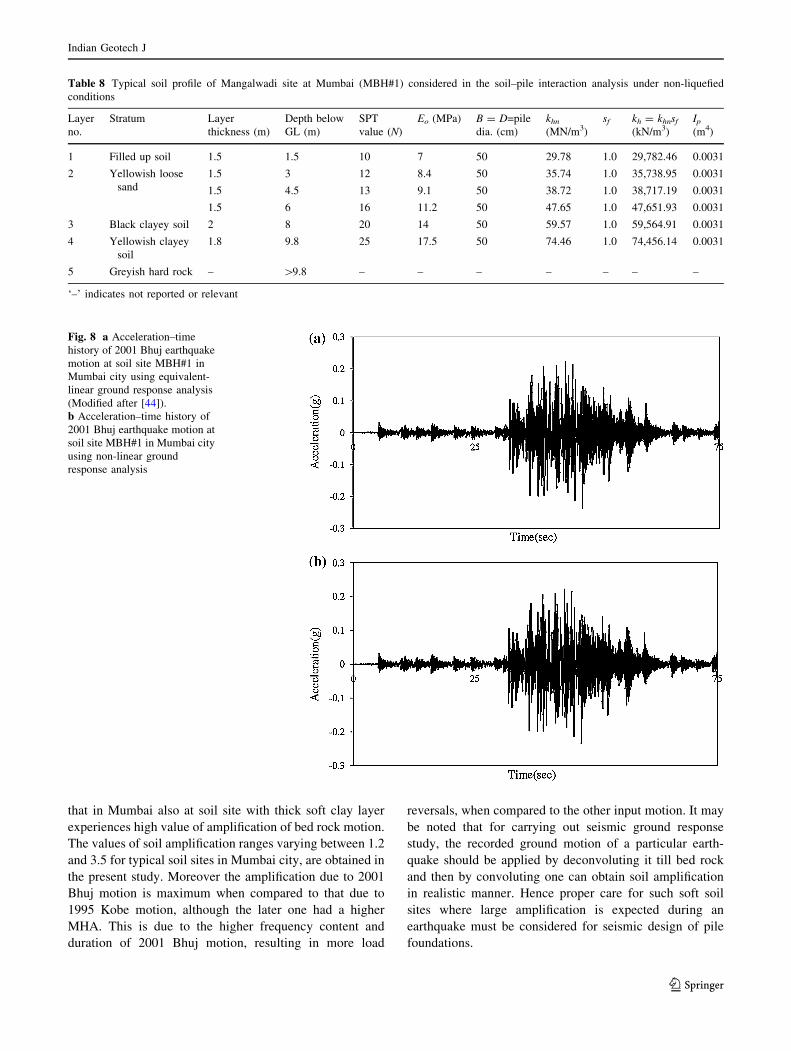
Fig. 13 a Typical effect of
thickness of liquefiable soil
layer on pile deflections
(combined) along depth for free
headed single pile with floating
tip subjected to 2001 Bhuj
motion. b Typical pile bending
moments (combined) with and
without soil liquefaction for
various earthquake motions for
free headed pile with floating tip
Indian Geotech J
123

example, non-liquefied depth factor r (=L1/L), liquefied
depth factor s (=L2/L), embedded depth factor t (=L3/L),
pile flexibility factor R [=EpIp/(EsL4)], ratio of Young’s
modulus of the pile to the soil modulus K (=Ep/Es), the pile
length to pile diameter ratio L/D (slenderness ratio), soil
modulus to soil strength ratio Q (=Es/su),vertical load factor
V(=4P/pD2Es), horizontal load factor H (=HT/suD2),
moment factor M(=MT/suD3), ratio of distance of location
of pile from the waterfront to the effected distance of lat-
eral spreading, i.e., location factor Lx (=x/Ls), scale factor
for liquefied soil (sf) and gradient of surface topography
(sl). The non-dimensional deflection coefficient, is Y* = y/
D, where y is pile deflection, D is diameter of pile and non-
dimensional bending moment coefficient is, M* = M/
(suD3), where M is the bending moment developed at the
pile soil interface, su is the shear strength of soil. Phanik-
anth et al. [58] validated the results for kinematic response
by comparing with the similar results obtained by Meera
and Basudhar [61]. It was observed that for single pile,
both the maximum deflection and maximum bending
moment increases many folds in liquefiable layer compared
to non-liquefiable layer, as expected.
In the present study, individually kinematic and inertial
loads are imposed and finally the combined displacement
and bending moment of pile are obtained by superimposing
these two cases. The kinematic interaction response is
obtained by considering the ground deformations alone.
For inertial effect, horizontal earthquake load is applied at
the pile top as pseudo-static load and the pile bending
response is obtained. The pile deflections are presented for
liquefying soils in Fig. 12a for combined effect i.e., both
kinematic and inertial interactions and in Fig. 12b only for
inertial interactions. It can be observed from Fig. 12a that
for combined interactions, the maximum and minimum
values of pile head displacements are 2,500 mm for 1989
Loma Gilroy motion and 525 mm for 2001 Bhuj earth-
quake motion. However for inertial loading only, the cor-
responding values are obtained as 2,450 and 510 mm,
respectively. Hence it can be concluded that, the pile
deflections due to inertial loads are significant and also
from the load deflection curve, the pile behavior was
observed to be rigid. Further it can be seen that the relative
movement between the soil and the pile is significant. It
gives a design guideline for estimation of important com-
ponent of pile deflection under seismic loading.
Figure 13a shows the typical results for the effect of
thickness of liquefiable soil layer on combined (inertial and
kinematic) pile deflection profile of free headed single pile
with floating tip when subjected to 2001 Bhuj earthquake
motion at typical soil site MBH#1 in Mumbai city. As
expected, with increase in the thickness of liquefiable soil
layer, the displacement of pile is significantly increasing.
The pile head deflection increases from 45 to 537 mm
when liquefied depth factor (s = L2/L) is changed from 0.2
to 1.0. Figure 13b shows typical combined (inertial and
kinematic) pile bending moments when passing through
either in non-liquefied or in liquefied soil during various
earthquake motions for free headed pile with floating tip.
As expected, huge increase in the design bending moment
in pile is observed for pile passing through liquefied soil
layer compared to non-liquefied soil. Hence, proper tech-
niques must be taken during design of piles in Mumbai city
under possible liquefied zones in different earthquake
motions.
Conclusions
From the present study the following major conclusions
can be obtained,
GIS based thematic maps of seismic liquefaction hazard
for Mumbai city under three categories of critically,
moderately and non liquefiable are developed for
earthquake moment magnitudes of 5.5 and 7.5 for entire
Mumbai city. It has been noticed that the reclaimed areas
of Mumbai city may be prone to liquefaction at moderate
earthquake of magnitude 6.0 and above only.
It is observed that the seismic ground response depends
not only on amplitude of MHA but also on frequency
content and duration of earthquake. It is observed that
2001 Bhuj earthquake had low MHA, but due to high
frequency content and higher duration the soil sites
experienced higher ground amplifications compared to
1995 Kobe earthquake motion with high MHA and low
frequency content, duration.
The acceleration response spectrum along various soil
layers using four strong motion earthquakes having wide
variations in MHA and mean time periods are obtained
which are useful for designers for earthquake resistant
geotechnical constructions at Mumbai city with an
emphasis for high rise buildings.
It can be concluded that non-linear ground response
analysis is mostly giving critical design value of soil
amplification for Mumbai city compared to that obtained
by using equivalent-linear ground response analysis.
Soil amplification factor for typical Mumbai soil sites
varies between 1.2 and 3.5 for different available
earthquake ground motions.
The pile response in liquefied soils is significantly
amplified compared to that in non-liquefying soil and the
amplification in peak bending moment is found as high
as 2.50.
It is observed that the effect of depth of liquefying layer
has significant influence on the pile bending response.
Peak bending moment occurs at the interface of
Indian Geotech J
123

liquefying and non-liquefying layer for typical pile
foundation in Mumbai soil.
Hence, the present analysis and results for seismic
design of pile in Mumbai city by considering local soil
effect will be useful for engineers in practice.
References
1. IS 1893-Part 1 (2002) Criteria for earthquake resistant design of
structure. Bureau of Indian Standards, New Delhi, India
2. Raghukanth STG, Iyengar RN (2006) Seismic hazard estimation
for Mumbai city. Curr Sci 91(11):1486–1494
3. Rao KS, Satyam ND (2007) Liquefaction studies for seismic
microzonation of Delhi region. Curr Sci 92(5):646–654
4. Sitharam TG, Anbazhagan P (2007) Seismic hazard analysis for
the Bangalore region. Nat Hazards 40(2):261–278
5. Hanumanthrao C, Ramana GV (2008) Dynamics soil properties
for microzonation of Delhi, India. J Earth Syst Sci 117(S2):
719–730
6. Maheswari UR, Boominathan A, Dodagoudar GR (2010) Use of
surface waves in statistical correlations of shear wave velocity
and penetration resistance of Chennai soils. Geotech Geol Eng
28:119–137
7. Mhaske SY, Choudhury D (2010) GIS-based soil liquefaction
susceptibility map of Mumbai city for earthquake events. J Appl
Geophys 70(3):216–225
8. Mhaske SY, Choudhury D (2011) Geospatial contour mapping of
shear wave velocity for Mumbai city. Nat Hazards 59(1):
317–327. doi:10.1007/s11069-011-9758-z
9. Shukla J, Choudhury D (2012) Estimation of seismic ground
motions using deterministic approach for major cities of Gujarat.
Nat Hazards Earth Syst Sci 12:2019–2037
10. Shukla J, Choudhury D (2012) Seismic hazard and site-specific
ground motion for typical ports of Gujarat. Nat Hazards 60(2):
541–565
11. Chatterjee K, Choudhury D (2013) Variations in shear wave
velocity and soil site class in Kolkata city using regression and
sensitivity analysis. Nat Hazards 69(3):2057–2082. doi:
10.1007/s11069-013-0795-7
12. Kolathayar S, Sitharam TG, Vipin KS (2013) Probabilistic liq-
uefaction potential evaluation for India and adjoining areas.
Indian Geotech J. doi:10.1007/s40098-013-0079-x
13. Desai SS, Choudhury D (2014) Spatial variation of probabilistic
seismic hazard for Mumbai and surrounding region. Nat Hazards.
doi:10.1007/s11069-013-0984-4
14. Tazoh T, Shmizu K, Wakahata T (1987) Seismic observations
and analysis of grouped piles. Dynamic response of pile foun-
dations: experiments, analysis and observation. Geotechnical
Special Publication No. 11, ASCE (in CD)
15. Madabhushi SPG, Knappett J, Haigh S (2010) Design of pile
foundation in liquefiable soils. Imperial College Press, London
16. Wilson DW (1998) Soil–pile superstructure interaction in lique-
fying sand and soft clay. Ph.D. thesis, University of California,
Davis, USA
17. Meymand PH (1998) Shaking table model tests of nonlinear soil
pile superstructure interaction in soft clay. Ph.D. thesis, Univer-
sity of California, Berkley, USA
18. Tokimatsu K, Suzuki H, Sato M (2004) Effects of inertial and
kinematic forces on pile stresses in large shaking table tests. In:
Proceedings of the 13th world conference on earthquake engi-
neering, Vancouver, Canada, Paper No. 1322
19. EN 1998-1 Eurocode-8 (2004) Design of structure for earthquake
resistance—Part 1: general rules, seismic actions and rules for
buildings
20. Dash SR, Bhattacharya S, Blakeborough A (2010) Bending–
buckling interaction as a failure mechanism of piles in liquefiable
soils. Soil Dyn Earthq Eng 30(1–2):32–39
21. Novak M (1974) Dynamic stiffness and damping of piles. Can
Geotech J 4(11):574–597
22. Nogami T, Chen HL (1987) Prediction of dynamic lateral
response of nonlinear single pile by using Winkler soil model. In:
Proceedings of the session on dynamic response of pile founda-
tions—experiments, analysis and observation: Geotechnical
Special Publication No. 11, Atlantic City, NJ, ASCE pp 39–52
23. Markis N, Gazetas G (1992) Dynamic pile–soil–pile interac-
tion—part II: lateral and seismic response. Earthq Eng Struct Dyn
21(2):145–162
24. Maheshwari BK, Watanabe H (2009) Seismic analysis of pile
foundations using simplified approaches. Int J Geotech Eng
3(3):387–404
25. Maheshwari BK, Sarkar R (2011) Seismic behavior of soil–pile–
structure interaction in liquefiable soils: parametric study. Int J
Geomech ASCE 11(4):335–347
26. Desai S, Choudhury D (2014) Deterministic seismic hazard
analysis for greater Mumbai, India. In: Proceedings of the 2014
geo-congress, geo-characterization and modeling for sustain-
ability, Geotechnical Special Publication No. 234, ASCE,
Atlanta, Georgia, USA, 23–26 Feb 2014, GSP 234:389–398
27. Mhaske SY, Choudhury D (2011) GIS–GPS based map of soil
index properties for Mumbai. Geo-Frontiers 2011, Geotechnical
Special Publication No. 211, ASCE pp 2366–2375. doi:
10.1061/41165(397)242
28. Venkatachalam P, Mohan BK (2007) GRAM?? (1.4)—indige-
nous GIS software suite. CSRE, IIT Bombay
29. NEHRP (2000) Commentary, Federal Emergency Management
Agency, USA, 369 for seismic regulations for new buildings and
other structures. National Earthquake Hazards Reduction Pro-
gram, USA
30. Anbazhagan P, Sitharam TG (2010) Correlation between low
strain shear modulus and standard penetration test ‘N’ value’. In:
Proceedings of fifth international conference on recent advances
in geotechnical earthquake engineering and soil dynamics, San
Diego, CA. Paper No. 1.13b: p 10
31. Youd TL, Idriss IM, Andrus RD, Arango I, Castro G, Christian
JT, Dobry R, Finn WDL, Harder LF Jr, Hynes Mary Ellen,
Ishihara K, Koester Joseph P, Liao Sam SC, Marcuson William F
III, Martin Geoffrey R, Mitchell JK, Moriwaki Y, Power MS,
Robertson PK, Seed RB, Stokoe KH II (2001) Liquefaction
resistance of soils: Summary report from the 1996 NCEER and
1998 NCEER/NSF workshops on evaluation of liquefaction
resistance of soils. J Geotech Geoenviron Eng ASCE 127(10):
817–833
32. Boulanger RW, Idriss IM (2006) Liquefaction susceptibility cri-
teria for silts and clays. J Geotech Geoenviron Eng ASCE
132(11):1413–1426
33. Cetin KO, Seed RB, Kiureghian AD, Tokimatsu K, Harder LF,
Kayen RE, Moss RES (2004) Standard penetration test-based
probabilistic and deterministic assessment of seismic soil lique-
faction potential. J Geotech Geoenviron Eng ASCE 130(12):
1313–1340
34. Prakash S, Puri VK (2010) Past and future of liquefaction, vol.
III. In: Proceedings of Indian geotechnical conference—2010,
GEOtrendz, IIT Bombay, Mumbai, India, pp 63–72
35. Katzenbach R, Clauss F, Rochee S, Choudhury D (2012) A
critical comparison of estimations of liquefaction potential using
recent methods. In: Proceedings of 2nd international conference
on performance-based design in earthquake geotechnical
Indian Geotech J
123

engineering, II PBD, Taormina, Italy, 28–30 May 2012, Paper
No. 6.08 in CD, pp 753–764
36. Seed HB, Idriss IM (1971) Simplified procedures for evaluating
soil liquefaction potential. J Soil Mech Found Div ASCE
97(SM9):1249–1273
37. Idriss IM, Boulanger RW (2010) SPT-based liquefaction trig-
gering procedures. Department of Civil Construction and Envi-
ronmental Engineering, University of California at Davis, USA
38. Kishida T, Boulanger RW, Abrahamson NA, Driller MW,
Wehling TM (2009) Seismic response of levees in Sacramento–
San Joaquin Delta. Earthq Spectra 25(3):557–582
39. Idriss IM, Boulanger RW (2008) Soil liquefaction during earth-
quakes. MNO-12, Earthquake Engineering Research Institute,
Oakland, CA
40. QGIS (2013) Version: 1.8.0-Lisboa, Free and open source soft-
ware, Copyright 2013 Free Software Foundation, Inc., Boston,
MA, USA
41. Choudhury D, Phanikanth VS, Reddy GR (2009) Recent advances
in analysis and design of pile foundations in liquefiable soils during
earthquake: a review. In: Proceedings of the national academy of
sciences, India (section A—physical sciences), 79(II): 141–152
42. Kramer SL (2005) Geotechnical earthquake engineering. Pearson
Education, Singapore
43. Towhata I (2008) Geotechnical earthquake engineering. Springer
Series in Geomechanics and Geoengineering, Heidelberg
44. Phanikanth VS, Choudhury D, Reddy GR (2011) Equivalent-
linear seismic ground response analysis of some typical sites in
Mumbai. Geotech Geol Eng 29(6):1109–1126. doi:10.1007/
s10706-011-9443-8
45. Hashash YMA, Groholski DR, Philips CA, Park D (2008)
DEEPSOIL v3.5beta, User manual and tutorial. University of
Illinois, UC
46. GovindaRaju L, Ramana GV, Hanumanta Rao C, Sitharam TG
(2004) Site specific ground response analysis. Curr Sci 87(10):
1354–1362
47. Liyanapathirana DS, Poulos HG (2005) Pseudo-static approach
for seismic analysis of piles in liquefying soil. J Geotech Geo-
environ Eng ASCE 131(12):1480–1487
48. Bhattacharya S (2007) Design of foundations in seismic areas:
principles and applications. National Information Centre for
Earthquake Engineering (NICEE), IIT Kanpur, India
49. Dobry R, Abdoun T, O’Rourke TD (2003) Single piles in lateral
spreads: field bending moment evaluation. J Geotech Geoenviron
Eng ASCE 129(10):879–889
50. Tokimatsu K, Oh-Oka H, Satake K, Shamoto Y, Asaka Y (1998)
Effects of lateral ground movements on failure patterns of piles in
the 1995 Hyogoken-Nambu earthquake. In: Geotechnical earth-
quake engineering and soil dynamics 3rd conference, ASCE
pp 1175–1186
51. Tokimatsu K (1999) Performance of pile foundations in later-
ally spreading soils. In: Proceedings of 2nd international
conference on earthquake geotechnical engineering, Lisbon,
Portugal, pp 957–964
52. Ishihara K, Cubrinovski M. (1998) Soil–pile interaction in liq-
uefied deposits undergoing lateral spreading. In: Maric B. et al.
(eds) Geotechnical hazards. Balkema p 51–64
53. AIJ (2001) Recommendations for designing of building founda-
tions. Architectural Institute of Japan, Japan
54. JRA (2002) Specification for highway bridges, Part V, seismic
design. Japanese Road Association, Japan
55. Haldar S, Babu GLS (2010) Failure mechanisms of pile foun-
dations in liquefiable soil: parametric study. Int J Geomech ASCE
10(2):74–84
56. Liyanapathirana DS, Poulos HG (2005) Seismic lateral response
of piles in liquefying soil. J Geotech Geoenviron Eng ASCE
131(12):1466–1479
57. Abdoun T, Dobry R, O’Rourke TD, Goh SH (2003) Pile response
to lateral spreads: centrifuge modeling. J Geotech Geoenviron
Eng ASCE 129(10):869–878
58. Phanikanth VS, Choudhury D, Reddy GR (2012) Behaviour of
single pile in liquefied deposits during earthquake. Int J Geomech
ASCE 13(4):454–462. doi:10.1061/(ASCE)GM.1943-5622.
0000224
59. Poulos HG, Davis EH (1980) Pile foundation analysis and design.
Wiley, New York
60. MATLAB (2004) Programming, version 7, The Math Works, Inc.
61. Meera RS, Basudhar PK (2008) Effect of soil liquefaction on
flexural behavior of axially and laterally loaded piles. Geotech-
nical earthquake engineering and soil dynamics IV, Geotechnical
Special Publication No. 181, ASCE (in CD)
Indian Geotech J
123