Geophysical Technologies – i Geophysical Technologies MODULE

ORIGINAL ARTICLE
Seismic assessment in southern Baromura hill, northeast India,considering geophysical aspects
Sudip Dey • Prasamita Sarkar • Chandrani Debbarma •
Sushmita Paul
Received: 29 March 2010 / Accepted: 15 July 2011 / Published online: 30 July 2011
� Springer-Verlag 2011
Abstract This paper aims to assess the geophysical sig-
natures like morphology and structure of a fault line, which
is situated in a part of southern Baromura hill of Tripura,
northeast India. In this work manual observations and
technical applications were adopted for understanding the
morphological and structural characters of the fault line. As
tectonic mapping is one of the main objectives of this
study, the remote sensing technique was used to prepare a
tectonic map of the study area. Geothermal range of the
area was measured by unsupervised classification of
Landsat TM thermal infrared band (band 6). The classified
thermal band was overlaid by another classified shortwave
infrared band (band 7 of Landsat TM), which explains the
structural evidences of the study area. In addition, an
automated digital elevation model (DEM) was prepared to
assess the morphological characters of the study area par-
ticularly near the confluence of R. Maharani and R. Gumti.
To analyse the structural condition of the faulted zone,
resistivity characters of the rocks were measured by
‘‘vertical electrical sounding’’ (VES) method. The electri-
cal resistivity character of this area strongly supports that a
displacement occurred in this place. Finally an attempt was
made to explain the character of faulting on the basis of
morphological signatures and structural evidences for
future disaster management planning.
Keywords Geophysical signature � Fault line �Unsupervised classification � Geothermal map �Structure-vertical electrical sounding
Introduction
Large-scale earthquakes occur due to movements of plates
along the destructive plate boundaries and faults that have
evolved through geological and tectonic processes.
Although occurrence of earthquake is a global phenome-
non, regional level geophysical setup is considered as a
very important factor from disaster management point of
view. Regional effect of tectonic hazards now has become
an important part in present geoscientific researches for
planning and management. During the current decade, the
concepts of probabilistic seismic risk assessment and
integrated approaches in disaster management have been
developed by many scholars like Asad et al (2001), Con-
sole and Murru (2001), Eftaxias et al. (2003), El-Hefnawy
et al. (2006), Korkmaz (2009, 2010), etc. In a very recent
work, Levi et al (2010) applied integrated approaches in
seismic disaster management using HAZUS-MH software
and successfully estimated earthquake loss in Israel. In
India, earthquake prediction researches started during the
early 1960s by the continuous efforts of seismologists and
several methods have been attempted for disaster mitiga-
tion (Tiwari 2000). However, it is a remarkable fact that
micro-regional to regional level authentic documentations
of all parts in India are still not available (Bilham 2004).
Thus, background studies on seismic hazards and associ-
ated natural disasters in India depend only on some current
S. Dey (&) � P. Sarkar � C. Debbarma � S. Paul
Department of Geography and Disaster Management, Tripura
University, Suryamaninagar 799130, India
e-mail: [email protected]
P. Sarkar
e-mail: [email protected]
C. Debbarma
e-mail: [email protected]
S. Paul
e-mail: [email protected]
123
Environ Earth Sci (2012) 66:421–431
DOI 10.1007/s12665-011-1249-8

references and many of them are not authentic at all.
Recent observations have shown that earthquake events in
India have been increased over the last hundred years or so
(Singh and Sing 2007; Table 1). Therefore, the present
scenario demands proper planning by micro-regional to
regional-scale assessments for earthquake mitigation in
tectonically sensitive zones of this country such as the
Himalayan seismic belt and northeast India. Early resear-
ches by Gupta and Singh (1982), Guha and Bhattacharya
(1984), Agarwal (1986), Kayal (1987), Gupta and Singh
(1989), Gupta (1993) Kayal (1996,1998) and Bhattacharjee
(1998) strongly support that geophysically the northeastern
part of India is one of the most active tectonic zones in the
world and experiences frequent catastrophic earthquakes.
Considering the importance of regional level tectonic
assessment for disaster management planning in the seis-
mic regions, the present authors decided to perform a study
to delineate geophysical signatures of a faulted zone of
southern part of Baromura Hill in Tripura, northeast India.
Study area
The present study area is in the southern part of the
Baromura fold belt, east to Udaipur town of Tripura
(Fig. 1). Earlier, Dey et al. (2009a) conducted a study in
this place and detected a fault line (Udaipur fault) on the
basis of morphological signatures using remote sensing
technique. R. Maharani, a tributary of Gumti, is flowing
along the eastern end of this area. A small village, Hirapur,
which is near the confluence of R. Maharani with R. Gumti,
was selected for geoelectrical survey.
Geological setup
Tectonically the northeastern part of India remained very
dynamic during Tertiary and Quaternary periods, which is
related to the movement of Indian plate (Smith and Hallam
1970; McKenzie and Sclater 1971; Curray and Moore
Table 1 Some severe earthquakes in India
Date Place Geographical
location
Magnitude
Lat. Long.
October 8,
2005
Kashmir 34.43�N 73.54�E 7.6
December
26, 2004
Indian Ocean 3.30�N 95.87�E 9.0–9.3
January 26,
2001
Kutchh 23.6�N 69.8�E 6.9/7.9
September
29, 1993
Latur-Killari, 18.08�N 76.52�E 6.2
August 15,
1950
Arunachal Pradesh-
China border
28.5�N 96.7�E 8.5
January 15,
1934
Bihar, India 25�N 85�E 8.7
June 12,
1897
Shillong Plateau 26�N 91�E 8.7
Fig. 1 Location, geology and
environs of the study area
422 Environ Earth Sci (2012) 66:421–431
123

1974; Sclater and Fisher 1974; Falvey 1974 Curray et al.
1982; Valdiya 1984; Hutchison 1989; Klootwijk et al.
1992; Lee and Lawver 1995; Acharyya 1998; Varga 1997).
Geological evidences support that landform development
in this part started by sediment deposition during the
middle of the Miocene epoch (Mitra et al. 1968; Sinha and
Sastri 1973; Akram et al. 2004; Dey 2005). Structurally,
the present study area consists of un-metamorphosed upper
Tertiary sediments belonging to Miocene and Pliocene
depositions along with some recent alluviums (Table 2).
This area is characterised by plane beddings, which
were folded by late Tertiary and early Quaternary tectonic
movements. The dips of the fold are alternatively westward
and eastward. Alteration of thin sand and clay bands are
very common characteristics in the Tipam formation. Some
wave born ripple marks are observed in the lower Tipam
layers. Tidal ripple marks are found in upper Bokabil
formation. This deposition is dominated by thick beds of
clay (grey, blue and occasional green) with little sandy
compositions. Quartz is a very common mineral compo-
sition in Bokabil, Tipam and Dupitila formations (Dey
et al. 2009b, 2010). Blue clay, glass sand, etc., along with
occasional gypsum and lignite are also found in those
depositions.
Seismic status
The present study area falls in Zone V in the seismic hazard
map of India updated in 2000 by the Bureau of Indian Stan-
dards (BIS). In an early study, Gupta and Singh (1986)
detected a wide range of variation in b value (1–1.26) among
the major tectonic zones of northeast India, which indicates a
remarkable stress pattern variation (Steacy et al. 1996). In a
quantitative study, Dasgupta et al. (1998) systematically
assessed the level of spatial scale seismo-tectonic hazards in
the northeastern and eastern parts of India. Tiwari et al. (2004)
mentioned an alternative physical mechanism of earthquakes
like seasonal effect due to pore pressure generated by a sudden
change in water filtration. A spatial scale seismic microzo-
nation in some selected parts of northeast India (Sikkim
Himalayas and Gouhati region) was attempted by Nath et al.
(2008). Thingbaijam et al. (2008) assessed the recent seismic
character of northeast India on the basis of b value (for spatial
seismicity pattern) and fractal correlation dimension of
earthquake (DC) and finally divided northeast India into four
broad seismic zones namely Eastern Himalayas Zone (EHZ),
Mishmi Block Zone (MBZ), Eastern Boundary Zone (EBZ)
and Shillong Zone (SHZ). The EHZ is characterised by nor-
mal faulting mechanism and shallow earthquakes. MBZ and
SHZ are dominantly characterised by strike slip focal mech-
anism and shallow occurrence of earthquake. The Eastern
Boundary Zone (EBZ) is characterised by oblique reverse
faulting and intermediate depth epicentres.
The area under study in this research is a part of EBZ.
According to the available data, it can be stated that
earthquake activity in EBZ is mainly medium magnitude.
Some recent earthquake experiences of EBZ and adjoining
areas are shown in Table 3.
Methodology
Materials and data sources
The present work concentrates on identification of the
morphological as well as structural characters of a fault line
based on manual observation and technical applications.
Intensive field observations were done in the selected study
area from January 2008 to February 2010. Exposed struc-
tures were studied and some basic field maps were pre-
pared during the fieldwork. Dip angles and directions were
Table 2 Geological succession
of southern part of Tripura
Source Extracted from a
unpublished report of
Geological Survey of India,
Agartala, 2004 and field data)
Geological period Epoch Time Group Lithology
Quaternary Holocene 10,000 years Alluvium River born clayey silt,
clay with silt, sands, etc.Pleistocene 1.6 million years
Tertiary Pliocene 5.3 million years Dupi Tilla Estuarine brown clay sand,
mettled silty clay, white to
gray sandrock with silt band,
white clay
Line of unconformity
Tipam Marine-coastal and estuarine sand
rocks with shale and fossil
wood
Line of unconformity
Miocene 23.3 million years Bokabil Marine-coastal shale with minor
sandstone
Base not seen
Environ Earth Sci (2012) 66:421–431 423
123

measured by clinometer from the profiles of road cutting
and a dry and deep man-made channel. Ground control
points were fixed by GPS tool.
In this study technical work was directed towards the
assessment of fault morphology by applying remote sens-
ing and GIS technique and measurement of electrical
resistivity of rocks for understanding the structure of the
selected area. Several maps and images along with the field
maps were consulted (Table 4). Multi- sources data such as
Survey of India (SOI) topographic sheets (Scale: 1:50,000
and 1:63,360) and Geological map of Tripura (unpublished
map prepared by Geological Survey of India, scale:
1:50,000) were consulted. Apart from these, Landsat TM
images and Google Earth view were also studied primarily
for assessing morphological signatures. A tectonic map of
south Tripura prepared by Dey et al. (2009a) was also
consulted by the present authors.
Digital operation and digital data analysis
Applications of remote sensing and GIS techniques for
detecting the geological and tectonic features are very
common from the later parts of twentieth century and since
then it has played a remarkable role in hazard zoning and
planning for management (Gupta 1991). Henderson et al.
(1996) attempted to extract lineaments (faults and frac-
tures) from aerial photographs and satellite images.
Masoud and Koike (2006) used Landsat-7 ETM?/SRTM
DEM for assessing lineaments and their relationship with
hydrogeological setting in Siwa region of northwest Egypt.
Abdullah et al. (2009) worked with Landsat-5 TM and,
SPOT-5 satellite sensors and compared them for lineament
mapping in Hulu Lepar area. In the present research dif-
ferent bands of Landsat TM were used for detecting the
overall morphological signatures of tectonic structure in
the study area. As thermal radiance of the earth’s surface is
sensitive to the interrelated factors like vegetation cover,
slope, soil moisture, etc. (Doran and Parkin 1994; Bern-
stone et al. 1997), thermal range of the surface was con-
sidered as an effective tool for measuring morphological
signatures. It is well accepted that the pattern of vegetation
cover is changed sharply with the change of slope in the
hilly areas of Tripura (Dey et al. 2007). During the field-
work it has been observed that the high angle slopes (\50�)
are covered by dense mixed deciduous type forest while the
hill topes are mainly covered by dry type grasses and some
isolated trees. The low lands and river basins are covered
by dense grasses, bushes and some tropical trees. Thus,
geothermal mapping was adopted for assessing the mor-
phological condition of the study area.
Digital operation comprises four stages: (a) image
enhancement using linear stretching to obtain better visu-
alisations, (b) masking and preparing the digital classes/
groups (c) overlay operation and (d) vectorisation of
delineated fault lineament. In this research unsupervised
image classifications were done on thermal infrared band
of Landsat TM (band 6) to measure the spectral ranges of
the image, which indicates apparent temperature of the
surface. Short-wave infrared band (band-7) of the same
image was used to measure the geological pattern by
Table 3 Last hundred years earthquakes in Eastern Boundary Zone and its adjoining areas
Year Place Geographical locations Magnitude Severity
1920 West of Saitlan, Chin Division (Indo-Myanmar Border region) 22.20�N, 93.20�E 6.0 High
1950 NW of Srimangal, Chittagong Division (Bangladesh) 24.40�N, 91.70�E 6.3 High
1957 South of Silchar, Cachar District (Assam-Mizoram Border region) 24.50�N, 93.00�E 6.0 High
1967 NE of Agartala (Indo-Bangladesh Border region) Tripura 24.00�N, 91.50�E 5.1 Moderate
1968 NE of Agartala (Indo-Bangladesh Border region) Tripura 24.10�N, 91.60�E 5.2 Moderate
1971 East of Agartala (Tripura) 23.80�N, 91.80�E 5.4 Moderate
1984 SE of Agartala (Tripura) 23.6573�N, 91.5078�E 5.3 Moderate
1984 South of Silchar (Assam–Mizoram border region) 24.64�N, 92.89�E 6.0 High
1989 Tripura–Mizoram–Assam border region 24.4041�N, 92.4312�E 5.1 Moderate
1997 Southern Mizoram 22.212�N, 92.702�E 6.1 High
Table 4 Basic cartographic materials used in the present study
Sl no Cartographic materials Year of
publication
1. Survey of India Toposheet Nos
79M/10 and 79M/11
1968
2. Geological map (Geological survey
of India)
2002
3. Landsat TM Band 6a (Thermal infrared) 2008
4. Landsat TM Bands 4, 3, 2 and 2008
5 Band 7a and Band 5 2008
6. Tectonic map of southern Tripura
by Dey et al
2009
7. Google Earth view 2009
a Digital operation done on those bands
424 Environ Earth Sci (2012) 66:421–431
123

assessing hydrothermal alteration. On the basis of field
data, the numbers of classes were selected and again
unsupervised classification was done on band-7. For ther-
mal band, four main classes were selected on the basis of
vegetation cover and pattern of land objects. In case of
short-wave infrared band, a total of six classes were
selected. Overlay operation was performed with both the
classified raster images to delineate the structural influ-
ences on morphology (Fig. 2). In addition, an automated
digital elevation model (DEM) was prepared from SRTM
data, which was overlaid by Landsat TM band combina-
tions 7-5-4 (suitable to visualising water bodies; lower 50%
transparent,) and 5-4-3 (suitable for visualising geomor-
phology; upper 50% transparent).
Electrical resistivity survey
Electrical conductivity is a significant physical character
for understanding the resistivity nature of rocks. Earlier,
many investigations have been carried out on electric/
electromagnetic conductivity of various soils by McNeil
(1980), Palacky (1987), Dahlin (1993), Alfano (1993),
Dahlin (1996), Christensen and Sørensen (1996), Dahlin
and Loke (1997), George et al. (2008) and Akpan et al.
(2009), which strongly support the efficiency of this tech-
nique. The present authors applied ‘‘vertical electrical
sounding’’ (VES) method by earth resistivity meter
instrument for understanding the structural variation of this
area. After detailed observation of the exposed rock
structure of the study area, two places within 30 m distance
were selected for structural study by vertical electrical
sounding. Wenner’s configuration was adopted for vertical
electrical sounding and instrumental reading was taken up
to 15 m depth. The instrument was calibrated carefully.
Range of the instrument was fixed 910 (current 100 mA).
The resistivity was calculated by the simple formula:
q ¼ 2PAR ð1Þ
where q = resistivity of rocks in X m, A = spacing of
electrodes, R = range of the instrument 9 instrumental
reading
On the basis of the recorded resistivity characters, the
soil/rocks of this area were divided into four classes,
namely: topsoil layer (resistivity up to 15 X m), soft rocks
(resistivity below 60 X m), medium rocks (resistivity
below 100 X m) and hard rocks (resistivity 100 X m and
above) (Table 5; Fig. 3). In the western part of survey site,
a water bearing strata has been detected at 4 m depth. At
this depth the resistivity measured 07.536 X m (instrument
reading 0.303). Here, the upper layer resistivity is recorded
23.173 X m and lower layer resistivity is 16.328 X m.
Below 14 m of this side another water-bearing strata was
assumed where the resistivity has been measured
47.100 X m (instrument reading 0.05). In the eastern part,
water level assumed at 10 m-depth (measured resistivity
62.172 X m from instrument reading 0.106).
Results
Morphological signatures of fault line
Many misfit streamlets are found in this area, which is a
strong evidence of regional level complex geological
condition. From the classified geothermal image (Fig. 4) it
has been observed that R. Maharani extends northward
Fig. 2 Flow chart showing the
methodology of digital
operation
Environ Earth Sci (2012) 66:421–431 425
123

along a very straight line (Udaipur fault) before meeting
R. Gumti, which flows from an east to west direction across
the fault line. Remarkably no evidence of control of this
fault line on R. Gumti has been detected from field data and
digital data. It is quite evident that the R. Gumti was born
later than the development of this fault line. However,
some old channels of the river near Hirapur prove that
Gumti has changed its track several times in this past. This
Fig. 3 Resistivity characters of
western and eastern parts of the
surveyed areas in Hirapur
Table 5 Resistivity of rocks in
different depths
Source Field data generation
Western side Eastern side
Depth in
(m)
Instrument
reading
R in X q Depth in
(m)
Instrument
reading
R in X q
1 0.445 4.45 27.946 Erosion of upper alluvium by R. Maharani
2 0.205 2.05 25.748 1 0.079 0.79 04.961
3 0.123 1.23 23.173 2 0.096 0.96 12.058
4 0.303 0.3 07.536 3 0.258 2.58 48.607
5 0.052 0.52 16.328 4 0.243 2.43 45.781
6 0.091 0.91 34.289 5 0.198 1.98 62.172
7 0.126 1.26 55.399 6 0.182 1.82 68.578
8 0.094 0.94 47.226 7 0.159 1.59 69.896
9 0.069 0.69 38.999 8 0.152 1.52 76.365
10 0.054 0.54 33.912 9 0.148 1.48 83.649
11 0.068 0.68 46.974 10 0.106 1.06 66.568
12 0.087 0.87 65.563 11 0.163 1.63 112.60
13 0.109 1.09 88.988 12 0.119 1.19 89.768
14 0.199 1.99 174.96 13 0.106 1.06 86.538
15 0.05 0.5 47.100 14 0.091 0.91 80.007
15 0.089 0.89 83.838
426 Environ Earth Sci (2012) 66:421–431
123

may be due to the reactivation of the fault. On the basis of
the geological structure and associated morphological sig-
natures, it has been observed that this fault line extends
25 km from north to south (about 19 km is shown in
Fig. 4).
Characteristically, Maharani is a very narrow streamlet
(maximum 30 m wide near its confluence with R. Gumti)
and very few wide meanders are observed in its flow.
Interestingly, the valley of this narrow streamlet is 2.5 km
wide in the northern part and towards the south it gradually
becomes narrower. The streamlet is flowing along the
eastern corner of the wider valley near its confluence with
Gumti (Fig. 5). This might be due to the change of slope by
the early displacement, which resulted in eastward shifting
of the main flow of Maharani. Evidences of alluvial
depositions strongly support that once the streamlet used to
flow along the western margin of this valley. Spatial var-
iation of vegetation cover and elevation (57 m difference
has been measured during fieldwork) along the western
margin of the valley also support the geological compli-
cation between the western side and the eastern side of the
study area (Maharani Valley).
Fig. 4 Geothermal map
overlaid by geological map
showing geophysical condition
of the study area (base images:
Landsat TM band 6 and band 7
2008)
Fig. 5 DEM shows the
geomorphic condition and the
flow of maharani along the
eastern margin of its basin near
its confluence with R. Gumi
Environ Earth Sci (2012) 66:421–431 427
123
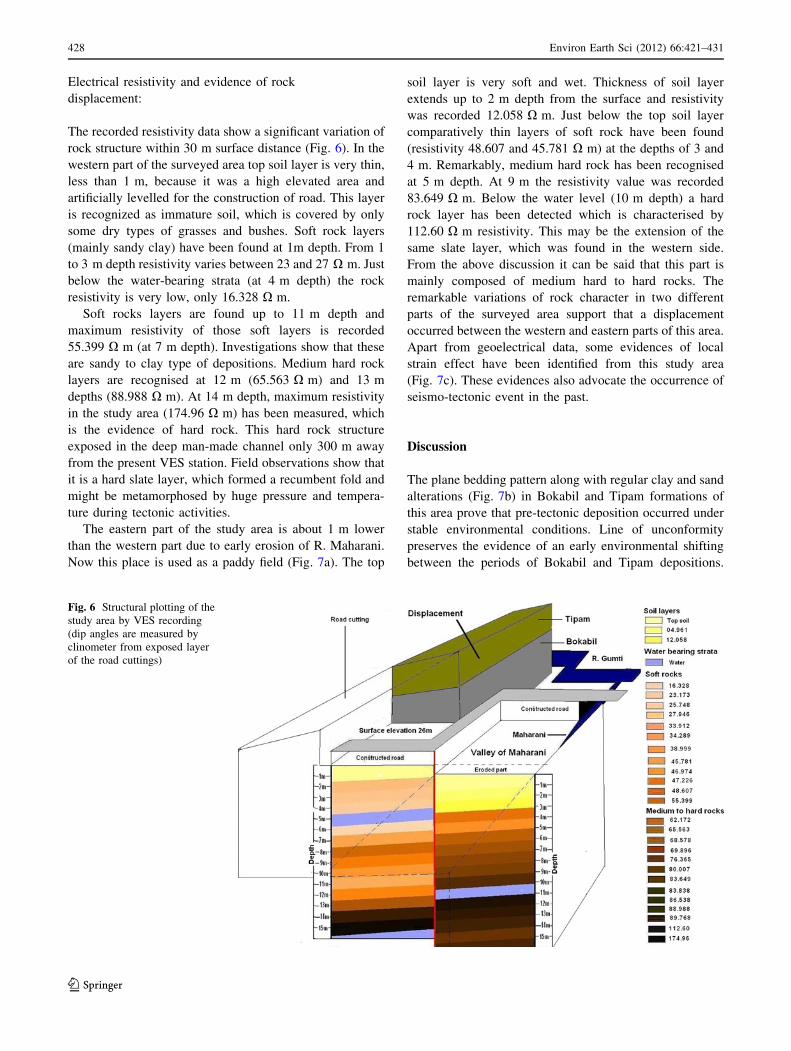
Electrical resistivity and evidence of rock
displacement:
The recorded resistivity data show a significant variation of
rock structure within 30 m surface distance (Fig. 6). In the
western part of the surveyed area top soil layer is very thin,
less than 1 m, because it was a high elevated area and
artificially levelled for the construction of road. This layer
is recognized as immature soil, which is covered by only
some dry types of grasses and bushes. Soft rock layers
(mainly sandy clay) have been found at 1m depth. From 1
to 3 m depth resistivity varies between 23 and 27 X m. Just
below the water-bearing strata (at 4 m depth) the rock
resistivity is very low, only 16.328 X m.
Soft rocks layers are found up to 11 m depth and
maximum resistivity of those soft layers is recorded
55.399 X m (at 7 m depth). Investigations show that these
are sandy to clay type of depositions. Medium hard rock
layers are recognised at 12 m (65.563 X m) and 13 m
depths (88.988 X m). At 14 m depth, maximum resistivity
in the study area (174.96 X m) has been measured, which
is the evidence of hard rock. This hard rock structure
exposed in the deep man-made channel only 300 m away
from the present VES station. Field observations show that
it is a hard slate layer, which formed a recumbent fold and
might be metamorphosed by huge pressure and tempera-
ture during tectonic activities.
The eastern part of the study area is about 1 m lower
than the western part due to early erosion of R. Maharani.
Now this place is used as a paddy field (Fig. 7a). The top
soil layer is very soft and wet. Thickness of soil layer
extends up to 2 m depth from the surface and resistivity
was recorded 12.058 X m. Just below the top soil layer
comparatively thin layers of soft rock have been found
(resistivity 48.607 and 45.781 X m) at the depths of 3 and
4 m. Remarkably, medium hard rock has been recognised
at 5 m depth. At 9 m the resistivity value was recorded
83.649 X m. Below the water level (10 m depth) a hard
rock layer has been detected which is characterised by
112.60 X m resistivity. This may be the extension of the
same slate layer, which was found in the western side.
From the above discussion it can be said that this part is
mainly composed of medium hard to hard rocks. The
remarkable variations of rock character in two different
parts of the surveyed area support that a displacement
occurred between the western and eastern parts of this area.
Apart from geoelectrical data, some evidences of local
strain effect have been identified from this study area
(Fig. 7c). These evidences also advocate the occurrence of
seismo-tectonic event in the past.
Discussion
The plane bedding pattern along with regular clay and sand
alterations (Fig. 7b) in Bokabil and Tipam formations of
this area prove that pre-tectonic deposition occurred under
stable environmental conditions. Line of unconformity
preserves the evidence of an early environmental shifting
between the periods of Bokabil and Tipam depositions.
Fig. 6 Structural plotting of the
study area by VES recording
(dip angles are measured by
clinometer from exposed layer
of the road cuttings)
428 Environ Earth Sci (2012) 66:421–431
123

Though Bokabil layer is characterised by thick marine-
coastal clayey depositions with prominent ripple marks,
two different folding evidences in different depths of this
formation prove the early tectonic activations during the
late Miocene. In the lower Bokabil a fold bed has been
observed which is followed by plane beddings. Another
fold layer (recumbent fold structure) was found in the
lower-middle Bokabil layer. Tipam layers formed there-
after under a very stable depositional environment, which
continued up to the latest tectonic activities.
Late Tertiary and Quaternary tectonic activities played a
very vital role for the development of upper (recent)
folding. The influence of the latest or late Tertiary–Qua-
ternary tectonic activities on the present geomorphology is
very clear in the study area. Generally, folds of this area are
characterised by alternatively eastward dips and westward
dips; however, along the western margin of the Maharani
Valley, only westward dip has been observed. In this place
no eastward dip has been found. It may be another valuable
evidence of geological complexity of this area.
In a very recent review work De and Bandyopadhyaya
(2010) attempted to explain the geophysical characters of
Maharani Valley on the only basis of surface erosion nat-
ure. However, structural analysis by electrical resistivity
data in this study area exposed the geological fact of sub-
surface displacement and nature of faulting along Maharani
Valley, which was earlier defined as Udaipur fault line by
Dey et al. (2009a). Observing the morphological characters
(misfits), it can be explained simply that the eastern side
might be slipped downward along the fault line; but the
resistivity data show a reverse feature beneath the soil
layers. A very close similarity was found between the rock
structures below 10 m depth of western side and rock
structures below 3 m depth of the eastern side. From that
structural condition a hypothetical conception has been
developed by the present authors, e.g. either the western
side moved downward or the eastern side moved upward
by faulting. Later Maharani might start eroding and the
eastern side became lower than the western block. It is
remarkable that Thingbaijam et al. (2008) also advocated
for the reverse faulting character in Eastern Boundary
Zone. Apart from the early tectonic evidences, some recent
evidence of active tectonic character has been detected in
this area from the changing nature R. Gumti. A compara-
tive study using SOI Toposheets of 1934, 1968, and current
satellite data show that R. Gumti remained very dynamic
even during the recent times in the present study area
particularly around Hirapur. Climatic factors and geomor-
phic process may play an additional role; but the influence
of tectonic factors cannot be ignored for shifting of this
river during the recent time as structural evidences shows
the probability of tectonic activeness.
Fig. 7 a Alluvial land on the eastern side of Maharani valley, b the exposed face along the line of displacement, c evidence of local strain effect
by early tectonic movement, d layer of recumbent fold
Environ Earth Sci (2012) 66:421–431 429
123

Conclusion and remark
The origin of a devastating earthquake depends on many
geophysical factors but proximity of the fault line in the
present study area may render a high-level hazard anytime.
From that standpoint, fault zonation mapping by satellite
data analysis strongly suggests that still though no big
tectonic occurrence has been found in this part of southern
Baromura hill from the available records, there remains a
certain possibility of an earthquake. It is a fact that due to
the lack of sufficient authentic data no awareness about the
risk from tectonic hazards has been developed in this area
at any level. As micro-regional scale geological complexity
was not reported previously, field data generated by elec-
trical survey along with the application of remote sensing
technique would be very helpful for developing a multi-
dimensional geophysical record and tectonic risk assess-
ment in the surroundings of Maharani basin. From meth-
odological point of view this study proves that without
multi-sources data it is very difficult to assess the risk
probability particularly in tectonically complicated zones.
It should be noted that the accuracy does not only mean the
technical accuracy but also appropriate simulation of
methodological application for field data generation.
Although the result worked out through the above-men-
tioned process of data simulation is satisfactory, some
further addition of data from different sources for geo-
processing is needed for a future version of advancement.
Hence, regular seismic data generation and change detec-
tion mapping by establishing permanent monitoring sta-
tions equipped by satellite technologies such as Geodetic
GPS and remote sensing in some selected places are
needed for more efficient earthquake disaster planning.
Acknowledgements The authors are grateful to Centre for Social
Exclusion and Inclusive Policy, Tripura University for partial funding
in this research and Global Land Cover Facility (GLCF) for providing
free satellite data. The authors are also grateful to the anonymous
reviewers whose technical advices helped to improve the manuscript.
References
Abdullah A, Akhir JM, Abdullah I (2009) A comparison of Landsat
TM and SPOT Data for lineament mapping in Hulu Lepar Area,
Pahang, Malaysia. Eur J Sci Res 34(3):406–415
Acharyya SK (1998) Break-up of the greater Indo-Australian
continent and accretion of blocks framing south and east Asia.
J Geodyn 26:149–170
Agarwal PN (1986) A recent earthquake in Northeast India. In: Friedr,
Veiweg, Sohn (eds) Proceedings of 2nd international seminar on
earthquake prognostic, Berlin, June 24–27, 1986
Akpan AE, George NJ, George AM (2009) Geophysical investigation
of some prominent gully erosion sites in Calabar, southeastern
Nigeria and its implications to hazard prevention. J Disaster Adv
2(3):46–50
Akram SM, Mudiar B, Sahu A (2004) Geodata integration leads to
reserve accretion in baramura gas field of Tripura, Assam-
Arakan Fold Belt—a case study. In: 5th conference &
exposition on petroleum geophysics, Hyderabad, India,
pp 767–771
Alfano L (1993) Geoelectrical methods applied to structures of
arbitrary shapes. J Appl Geophys 29 (3/4)
Asad T, Baba H, Kawazoe M, Sugiura M (2001) An attempt to
delineate very low frequency electromagnetic signals associated
with earthquakes. Earth Planets Space 53:55–62
Bernstone C, Dahlin T, Bjulemar L, Brorsson J (1997) Identification
of poor ground with the aid of DC resistivity: results from work
on the Oresund bridge connections. In: Proceedings of 3rd
meeting environmental and engineering geophysics. Environ-
mental and Engineering Geophysical Society, European Section,
Aarhus, Denmark, pp 431–434
Bhattacharjee S (1998) Earthquakes in northeast India Mitigation-a
possible approach. In: Sharma GD (ed) Status of landslides in
northeast India and Natural Disaster Management, Assam
University Press, pp 77–84
Bilham R (2004) Historical studies of earthquakes in India. Ann
Geophys 47(2/3):839–858
Console R, Murru M (2001) A simple testable model for earthquake
clustering. J Geophys Res 106B:8699–8711
Christensen NB, Sørensen K (1996) Pulled array continuous electrical
sounding PA-CVES, with an additional inductive source. In:
Proceedings of SAGEEP’96 (symposium on the application of
geophysics to engineering and environmental problems). Envi-
ronmental and Engineering Geophysical Society, Wheat Ridge,
USA, pp 1–10
Curray JR, Moore DG (1974) Sedimentary and tectonic processes in
Bengal deep-sea fan and geosyncline. In: Burk CA, Drake CL
(eds) The geology of continental margins. Springer, New York,
pp 617–628
Curray JR, Emmel FJ, Moore DG, Raitt RW (1982) Structure,
tectonics and geological history of the northeastern Indian
Ocean. In: Nairn AEM, Stehli FG (eds.), The ocean basins and
margins. The Indian Ocean, vol 6. Plenum, New York,
pp 399–450
Dahlin T (1993) On the automation of 2D resistivity surveying for
engineering and environmental applications. (PhD Thesis) Lund
University
Dahlin T (1996) 2D resistivity surveying for environmental and
engineering applications. First Break 14:275–283
Dahlin T, Loke MH (1997) Quasi-3D resistivity imaging—mapping
of three dimensional structures using two dimensional DC
resistivity techniques. In: Proceedings of 3rd meeting environ-
mental and engineering geophysics. Environmental and Engi-
neering Geophysical Society, European Section, Aarhus,
Denmark, pp 143–146
Dasgupta S, Bhattacharya A, Jana K (1998) Quantitative assessment
of seismic hazard in Eastern-Northeastern. J Geol Soc India
52:181–194
Dey S, Debbarma C, Sarkar P, Marfai M A (2010) Experiment on
visualizing micro-level surface characters of sediment sections: a
methodological approach to reflectance-based alternative petro-
graphic image analysis. Arab Geosci. doi:10.1007/s12517-
010-0122-5
Dey S, Sarkar P, Debbarma C (2009a) Morphological signatures of
fault lines in an earthquake prone zone of southern Baromura
hill, north-east India: a multi sources approach for spatial data
analysis. Environ Earth Sci 59(2):353–361
Dey S, Debbarma C, Sarkar P (2009b) Imaging and visualiz-
ing nanometer scale surface geometry of a crystalline
mineral (SiO2)in monochromatic spectra. J Appl Nat Sci
191:31–35
430 Environ Earth Sci (2012) 66:421–431
123
Dey S, Choudhuri D, Debbarma C, De SK (2007) Micro-environ-
mental status of a highland (College Tilla) of Agartala City,
North East India. Indonesian J Geogr Yogyakarta 39(2):137–156
Dey S (2005) Conceptual models for the assessment of Tertiary–
Quaternary geomorphic evolution of Paleo-coastal Tripura.
annals of the national association of geographers, INDIA XXV
(1) June:73–80
De, SK, Bandyopadhyaya, S (2010) Morphological signatures of fault
lines in an earthquake prone zone of southern Baromura hill,
north-east India: a multi sources approach for spatial data
analysis. A critical review. Environ Earth Sci. doi:10.1007/
s12665-010-0691-3
Doran JW, Parkin TB (1994) Defining and assessing soil quality. In
J.W. Doran et al (ed.) Defining soil quality for a sustainable
environment. SSSA Spec. SSSA, Madison, WI, Publ 35:3–21
Eftaxias K, Kapiris P, Polygiannakis J, Peratzakis A, Kopanas J,
Antonopoulos G, Rigas D (2003) Experience of short term
earthquake precursors with VLFVHF electromagnetic emissions,
Natural Hazards and Earth System. Science 3:217–228
El-Hefnawy M, Deif A, El-Hemamy ST, Gomaa NM (2006)
Probabilistic assessment of earthquake hazard in Sinai in relation
to the seismicity in the eastern Mediterranean region. Bull Eng
Geol Env 65:309–319
Falvey DA (1974) The development of continental margins in plate
tectonic theory. J Aust Pet Explor Assoc 14:95–106
George NJ, Akpabio GT, Evans UF (2008) Study of failed tarred
roads using earths resistivity values from local communities in
Ukanafun local government area, Akwa Ibom state, Nigeria.
Integr J Phys Sci 3(1):1–5
Gupta HK, Singh VP (1982) Is Shillong region, northeast India,
undergoing dilatancy stage precursory to a large earthquake?
Tectonophysics 85:31–33
Gupta HK, Singh HN (1986) Seismicity of northeast India region:
Part II: Earthquake swarm precursory to moderate magnitude to
great earthquakes. J Geol Soc India 28:367–406
Gupta HK, Singh HN (1989) Earthquake swarm precursory to
moderate magnitude to great earthquakes in northeast India
region. Tectonophysics 167:255–298
Gupta HK (1993) Patterns preceding major earthquakes in northeast
India. Curr Sci 64((11&12)):889–893
Guha SK, Bhattacharya U (1984) Studies on prediction of seismicity
in northeast India. In: Proceedings of world conference on
earthquake engineering, San Francisco, USA, July, pp 21–27
Gupta RP (1991) Remote sensing geology. Springer, Berlin
Henderson DB, Ferrill DA, Clarke KC (1996) Mapping geological
faults using image processing techniques applied to hill-shaded
digital elevation models. IEEE Trans 8:240–245
Hutchison CS (1989) Geological evolution of South-East Asia.
Clarendon Press, London, p 368
Kayal JR (1987) Microseismicity and source mechanism study:
Shillong Plateau, Northeast India. Bull Seismol Soc Am
77(1):184–194
Kayal JR (1996) Earthquake source process in Northeast India: a
review. Him Geol 17:53–69
Kayal JR (1998) Seismicity of Northeast India and surroundings—
development over the past 100 years. J Geophys 19(1):9–34
Klootwijk CT, Gee JS, Peirce JW, Smith GM (1992) Neogene
evolution of the Himalayan-Tibetan region: constraints from
ODP Site 758, northern Ninetyeast Ridge; bearing on climatic
change. Palaeogeogr Palaeoclim Palaeoecol 95(1–2):95–110
Korkmaz KA (2009) Earthquake disaster risk assessment and
evaluation for Turkey. Environ Geol 57:307–320
Korkmaz KA (2010) Integrated seismic hazard evaluation and
disaster management approach for Turkey. Environ Earth Sci
61:467–476
Levi T, Tavron B, Katz O, Amit R, Segal D, Hamiel Y, Bar-Lavi Y,
Romach S, Salamon, A (2010) Earthquake loss estimation in
Israel using the new HAZUS-MH software: preliminary imple-
mentation (Report GSI/11/2010) The Ministry of National
Infrastructures, Geological Survey Of Israel
Lee TT, Lawver LA (1995) Cenozoic plate reconstruction of
Southeast Asia. Tectonophysics 251:85–138
Masoud A, Koike K (2006) Tectonic architecture through Landsat-7
ETM?/SRTM DEM- derived lineaments and relationship to the
hydrogeologic setting in Siwa region, NW Egypt. J Afr Earth Sci
45:467–477
McKenzie D, Sclater JG (1971) The evolution of the Indian Ocean
since the late cretaceous. R Astron Soc Geophys J 24:437–528
Mc Neil JD (1980) Electrical conductivity of soils and rocks.
Technical Note TN-5. Geonics Limited, Mississauga
Mitra RN, Mishra GS, Rahaman AA (1968) Geology of Baramura
Anticline: Unpublished Geological Field Party report. ONGC,
Dehradun
Nath SK, Thingbaijam KKS, Raj A (2008) Earthquake hazard in
Northeast India—A seismic microzonation approach with typical
case studies from Sikkim Himalaya and Guwahati city. J Earth
Syst Sci 117((S2)):809–831
Palacky GJ (1987) Resistivity characteristics of geologic targets. In:
Nabighian MN (ed) Electromagnetic methods in applied geo-
physics. Soc Explor Geophys, Tulsa
Sclater JG, Fisher RL (1974) Evolution of the east central Indian
Ocean, with emphasis on the tectonic setting of the Ninetyeast
Ridge. Geol Soc Am Bull 85:683–702
Sinha RN, Sastri VV (1973) Correlation of the Tertiary geosynclinal
sediments of the Surma Valley, Assam and Tripura state (India).
Sedim Geol 10(2):107–137
Singh RD, Sing P (2007) Geo-tectonic movement and natural
hazards: strategy for disaster preparedness and mitigation.
J India Geophys Soc 11(3):171–173
Smith AG, Hallam A (1970) The fit of Southern continents. Nature
225:139–144
Tiwari RK (2000) Earthquake hazards and mitigation in india with
special reference to north eastern region. ENVIS Bull Himal
Ecol 8(2):15–21
Tiwari RK, Sri Lakshmi S, Rao KNN (2004) Characterization of
earthquake dynamics in Northeastern India Regions: a modern
nonlinear forecasting approach. Pure appl geophys 161:865–880
Thingbaijam KKS, Nath SK, Yadav A, Raj A, Walling MY, Mohanty
WK (2008) Recent seismicity in Northeast India and its
adjoining region. J Seismol 12:107–123
Steacy S, mccloskey J, Bean CJ, Ren J (1996) Heterogeneity in a self-
organized critical earthquake model. Geophys Res Lett
23(7):383–386
Valdiya KS (1984) Aspects of Tectonics. Focus on South-Central
Asia. Tata McGraw-Hill, New Delhi
Varga RJ (1997) Burma. In: Moores EM, Fairbridge RW (eds)
Encyclopedia of European and Asian regional geology. Chapman
& Hall, London, pp 109–121
Environ Earth Sci (2012) 66:421–431 431
123