Sedimentation. Most wastewaters and waters contain solids, and in many treatment processes solids...
78
Sedimentation
-
date post
21-Dec-2015 -
Category
Documents
-
view
217 -
download
1
Transcript of Sedimentation. Most wastewaters and waters contain solids, and in many treatment processes solids...
Sedimentation

Most wastewaters and waters contain solids, and
in many treatment processes solids are generated
e.g., phosphate precipitation, coagulation and
activated sludge bioxidation. Particles in water
and wastewater that will settle by gravity within a
reasonable period of time can be removed by
"sedimentation" in sedimentation basins (also
known as "clarifiers").
“Settleable” doesn’t necessarily mean that these
particles will settle easily by gravity. In many
cases they must be coaxed out of suspension or
“solution” by the addition of chemicals or
increased gravity (centrifugation or filtration).
Because of the high volumetric flow rates
associated with water and wastewater treatment
systems, gravity sedimentation is the only
practical, economical method to remove these
solids. i.e., processes such as centrifugation are
not economical, in most cases.
Gravity separation can obviously be applied only to
those particles which have density greater than water.
But this density must be significantly greater than that
of water due to particle surface effects and turbulence
in the sedimentation tanks.
Goals of gravity sedimentation:
1) Produce a clarified (free of suspended solids)
effluent.
2) Produce a highly concentrated solid sludge
stream.

Review of Type I and II sedimentation
Type I (Discrete sedimentation):
•Occurs in dilute suspensions, particles which have very little interaction with each other as they settle.
•Particles settle according to Stokes law
•Design parameter is surface overflow rate (Q/As)
Type II (flocculent sedimentation)
• Particles flocculate as they settle• Floc particle velocity increase with time• Design parameters:
1. Surface overflow rate2. Depth of tankor, 3. Hydraulic retention time

Comparison of Type I and II sedimentation
Zone Settling &Compression (Type III and IV)
Zone settling occurs when a flocculent suspensions with high initial concentration (on the order of 500 mg/L) settles by gravity. Flocculant forces between particles causes settling as a matrix (particles remain in a fixed position relative to each other as they settle). When matrix sedimentation is constrained from the bottom the matrix begins to compress. Such a situation occurs when the matrix encounters the bottom of tank in which it is settling. This is called compression (Type IV) settling.

These settling types are demonstrated in a batch settling test as illustrated below:
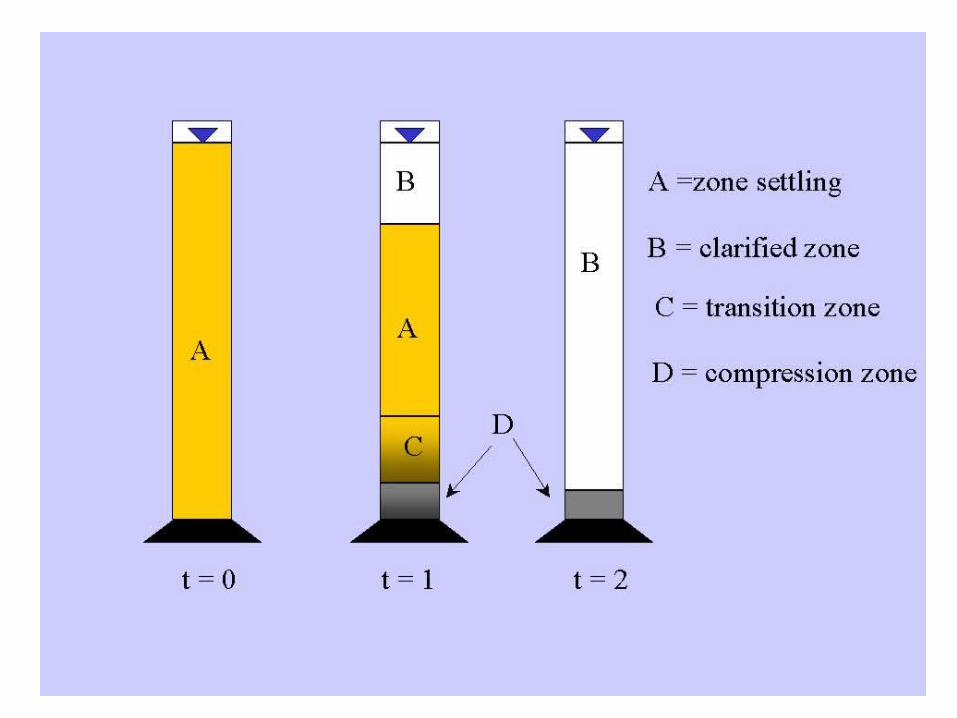
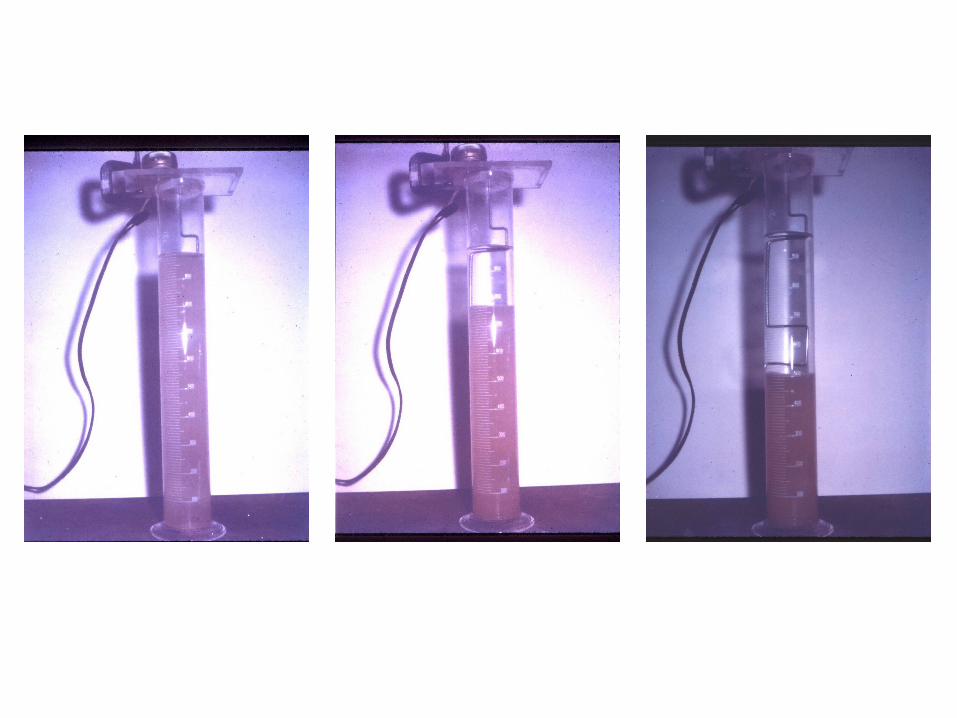
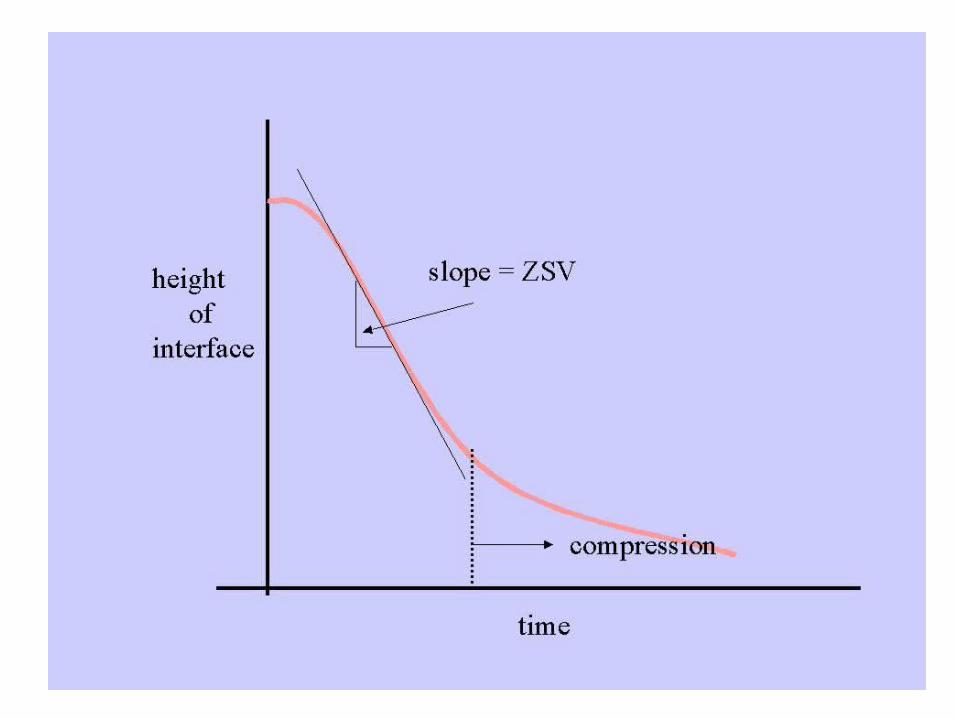
The height of the interface (between the clarified
zone and the zone settling zone) versus time is
plotted in the figure below to determine the "zone
settling velocity" (ZSV). Velocity of this interface
is steady after some induction period but changes
with time as compression begins. The slope of the
steady interface subsidence rate represents zone
settling velocity.
Initial suspended solids concentration has a
significant effect on the ZSV because the higher
the suspended solids concentration the more
difficult it is to pass water through the pore
spaces in the settling matrix. (The only way a
matrix can settle is if the water below it is
allowed to pass upward through the matrix). A
typical relationship between initial suspended
solids and ZSV is shown here.

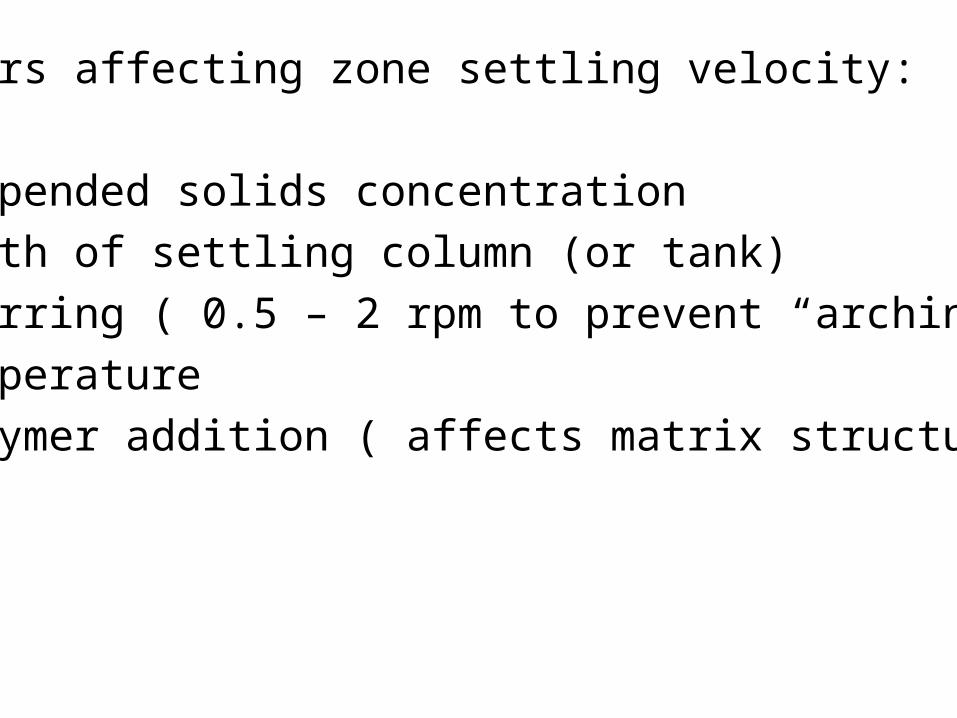
Factors affecting zone settling velocity:
1. Suspended solids concentration
2. Depth of settling column (or tank)
3. Stirring ( 0.5 – 2 rpm to prevent “arching”)
4. Temperature
5. Polymer addition ( affects matrix structure)
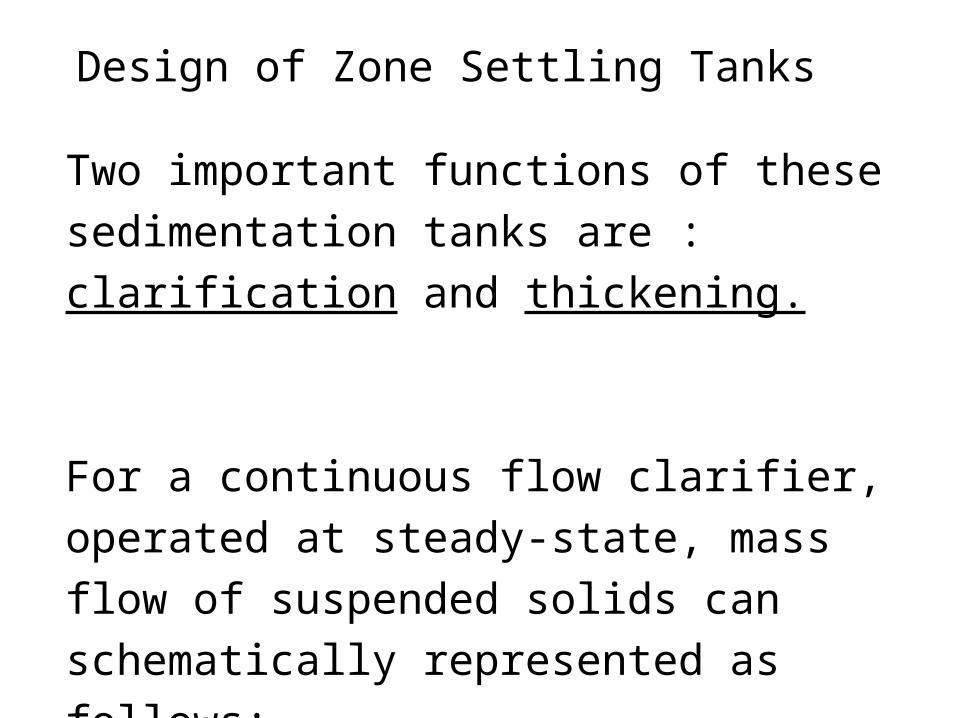
Design of Zone Settling Tanks
Two important functions of these sedimentation
tanks are : clarification and thickening.
For a continuous flow clarifier, operated at
steady-state, mass flow of suspended solids can
schematically represented as follows:
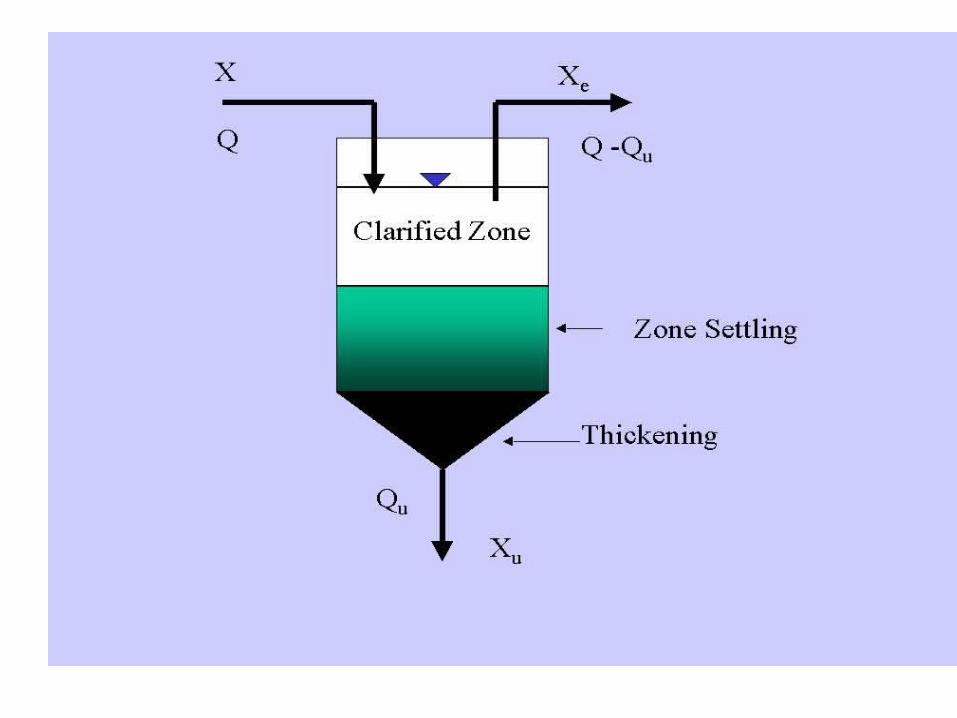
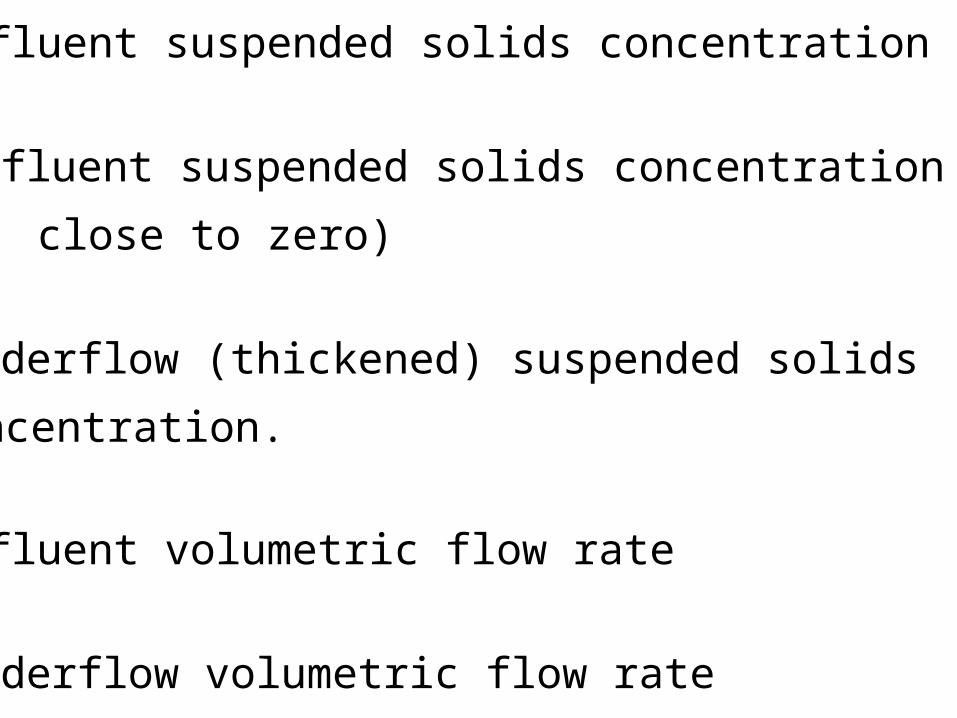
X = influent suspended solids concentration
Xe = effluent suspended solids concentration (often
close to zero)
Xu = underflow (thickened) suspended solids
concentration.
Q = influent volumetric flow rate
Qu = underflow volumetric flow rate
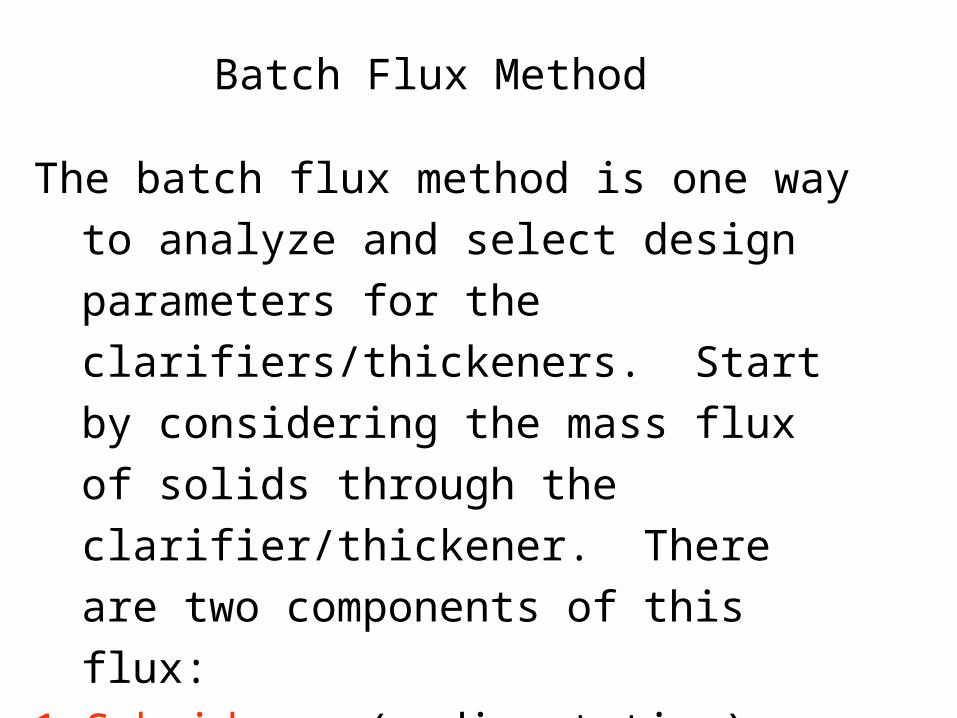
Batch Flux Method
The batch flux method is one way to analyze
and select design parameters for the
clarifiers/thickeners. Start by considering the
mass flux of solids through the
clarifier/thickener. There are two
components of this flux:
1. Subsidence (sedimentation)
2. Bulk transport (due to sludge withdrawal
from bottom of tank)
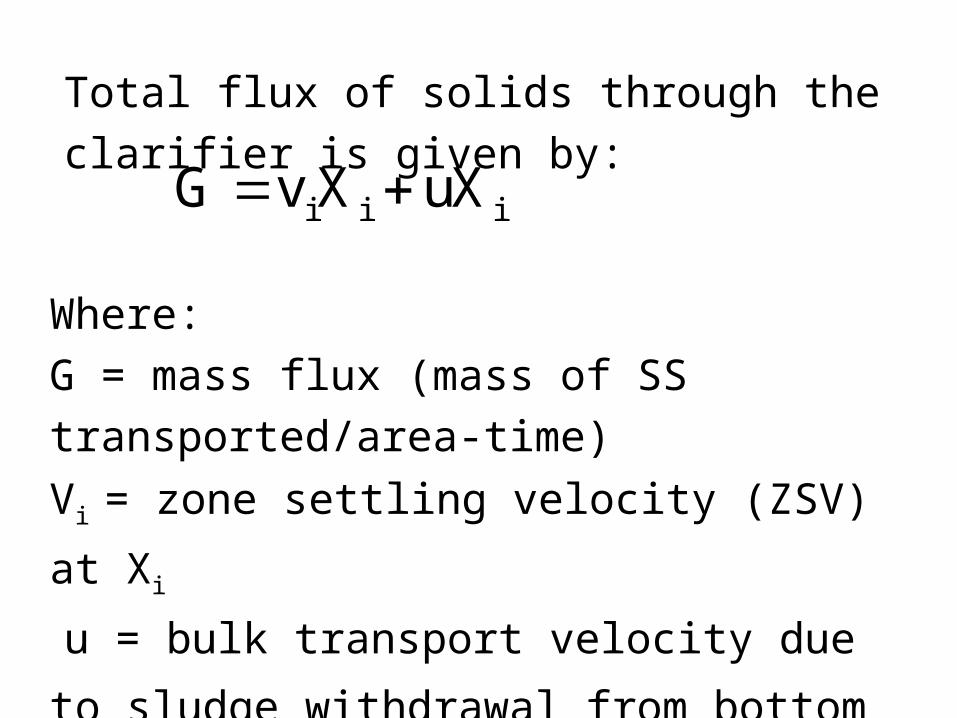
Total flux of solids through the clarifier is given
by:i i iG v X uX
Where:
G = mass flux (mass of SS transported/area-
time)
Vi = zone settling velocity (ZSV) at Xi
u = bulk transport velocity due to sludge
withdrawal from bottom of the tank.

u = Qu/As
Qu = underflow rate (withdrawal rate)
As = cross-sectional area of clarifier
Zone settling velocity is highly dependent on Xi,
so to calculate the flux due to subsidence we
need to assume a typical relationship (as shown
above) between zone settling velocity and Xi to
get:
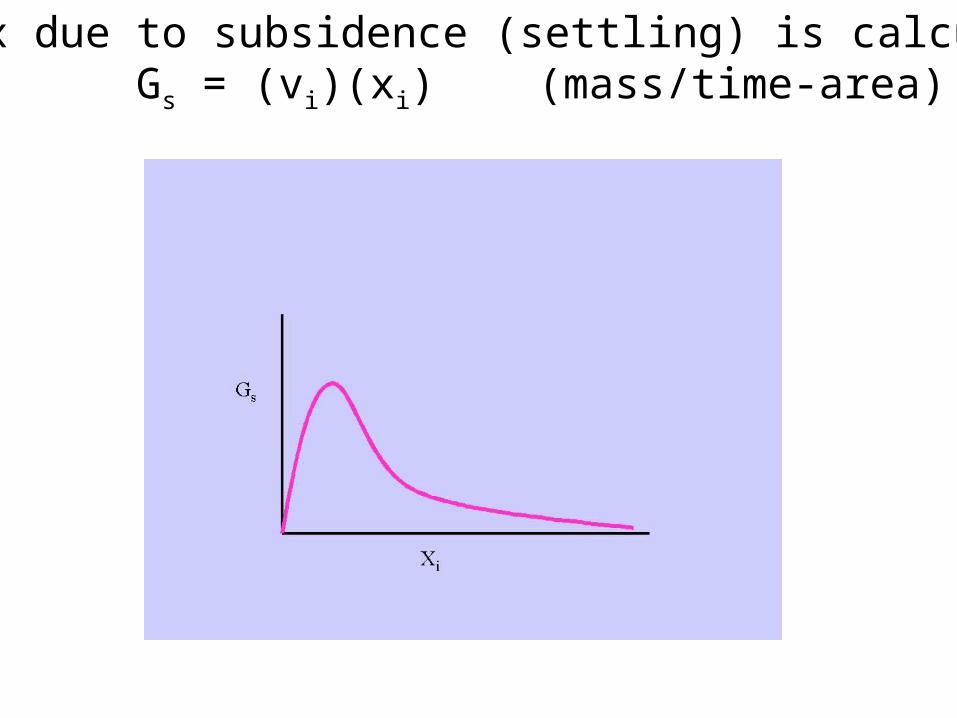
Solid flux due to subsidence (settling) is calculated by: Gs = (vi)(xi) (mass/time-area)
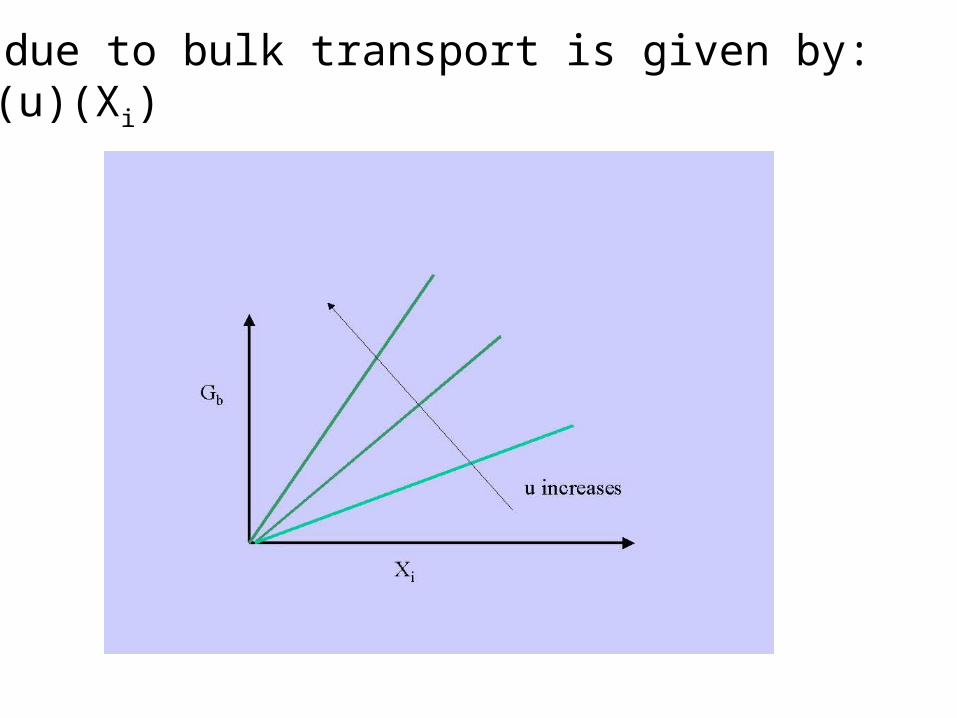
Flux due to bulk transport is given by: Gb = (u)(Xi)
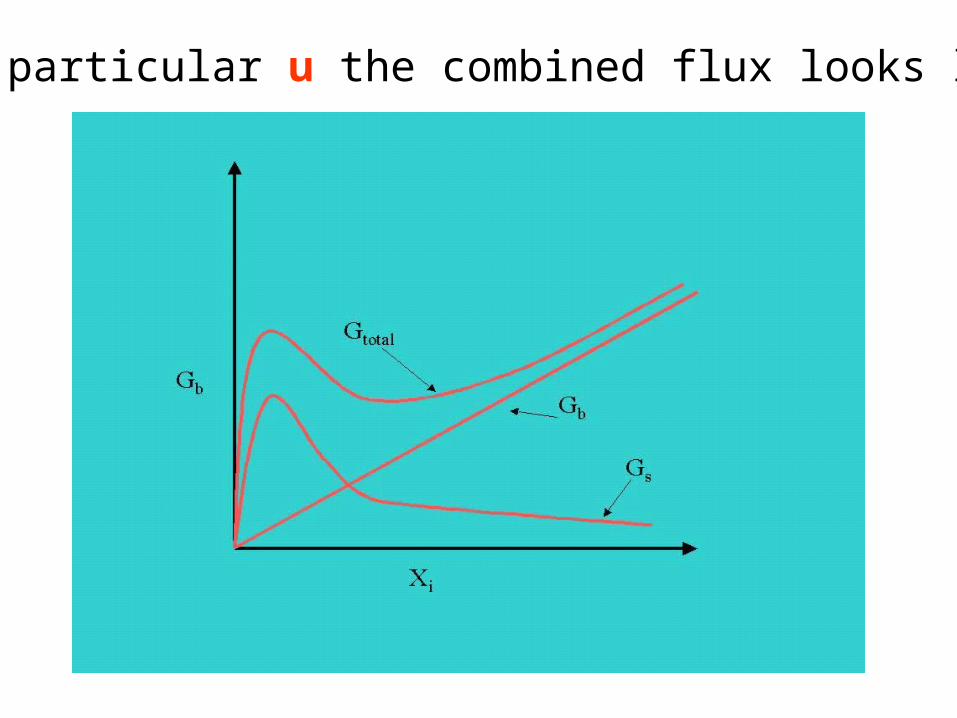
For a particular u the combined flux looks like:

• For a particular underflow rate u there is a
minimum in the flux capacity of the clarifier. This
minimum occurs at Xi = XL. (Note there is also a
minimum G at the origin, but this has no relevance
since even after the influent X is diluted Xi never
gets this low). Therefore for a given underflow rate
there is a "limiting flux" which can be transmitted
through the clarifier. As Xi passes from Xf
(suspended solids concentration in the influent ) to
Xu it must pass through this bottleneck Xi = XL. This
controls the solids loading rate to the clarifier.

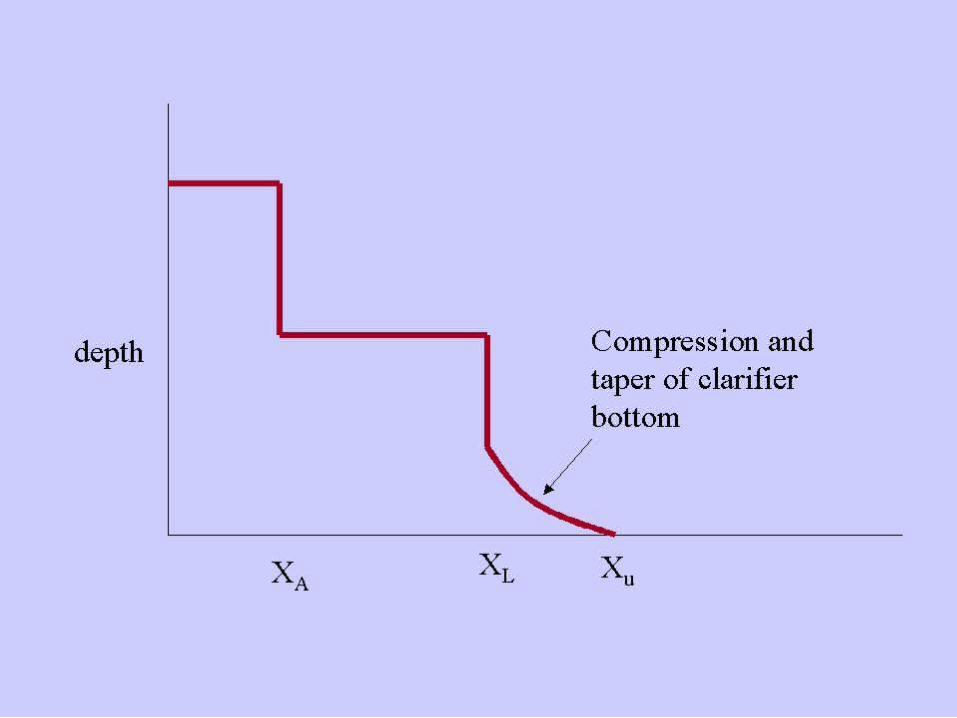
•Essentially for a critically loaded clarifier there
exists only two suspended solid concentrations,
XL and XA if the compression zone is ignored.
An explanation of "two concentration" critically
loaded clarifier follows. Suspended solids enter
the clarifier at some initial concentration Xf.
These solids are diluted by clarified effluent. As
the solids settle they concentrate and ultimately
reach XL.

•Suspended solids cannot be transmitted as fast
through this layer as in the layers above (because
the influent has lower suspended solids
concentration and therefore higher zone settling
velocity) so there is a build up of suspended
solids at XL.
•At steady state the influent suspended solids have to
be diluted to XA to balance fluxes through the
clarifier(at steady-state all the solids fluxes must be
equal at all depths). Any other concentrations will
cause the layers to disappear, either by washing out
over the effluent or by being drawn through the
bottom of the clarifier

When the clarifier is critically loaded. i.e., when
the loading rate equals the flux capacity of the
clarifier, the resultant concentration profile in
the clarifier is given by :
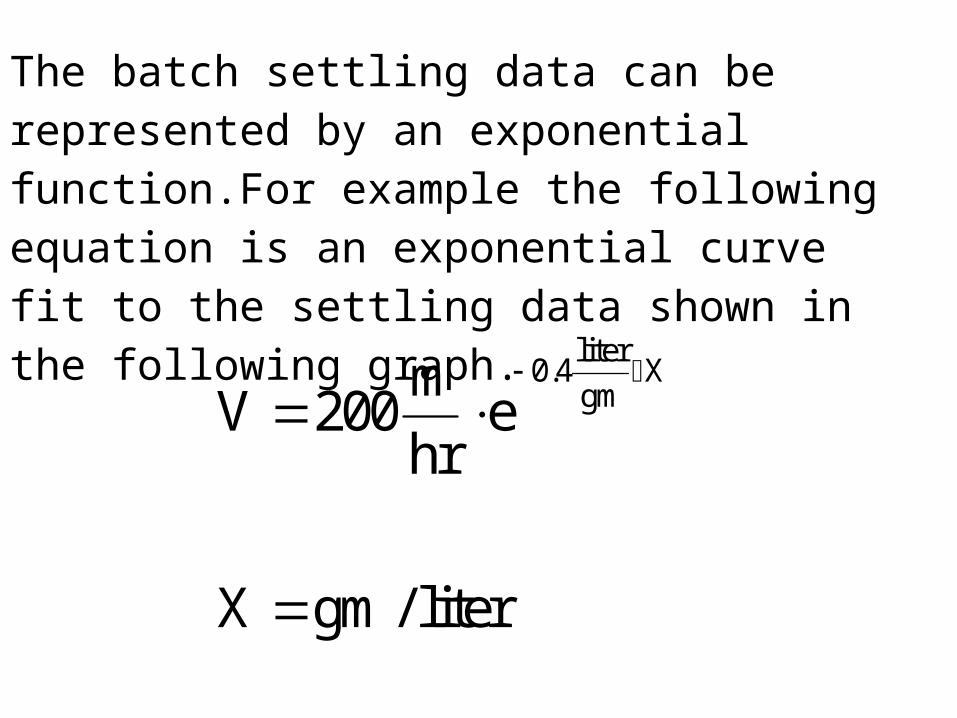
The batch settling data can be represented by an exponential function.For example the following equation is an exponential curve fit to the settling data shown in the following graph.
liter0.4 X
gmmV 200 e
hr
X gm / liter
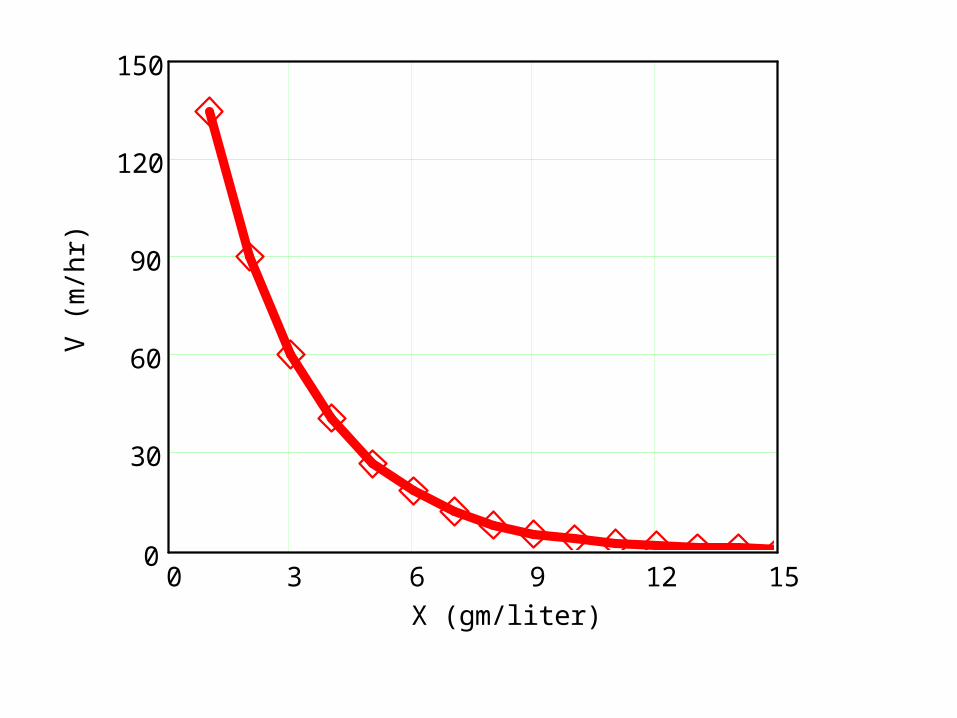
0 3 6 9 12 150
30
60
90
120
150
X (gm/liter)
V (
m/h
r)

Flux due to subsidence can then be calculated:
liter0.4 X
gms
mG X 200 e
hr
Be sure to make units consistent. Typical units = kg/m2-hr

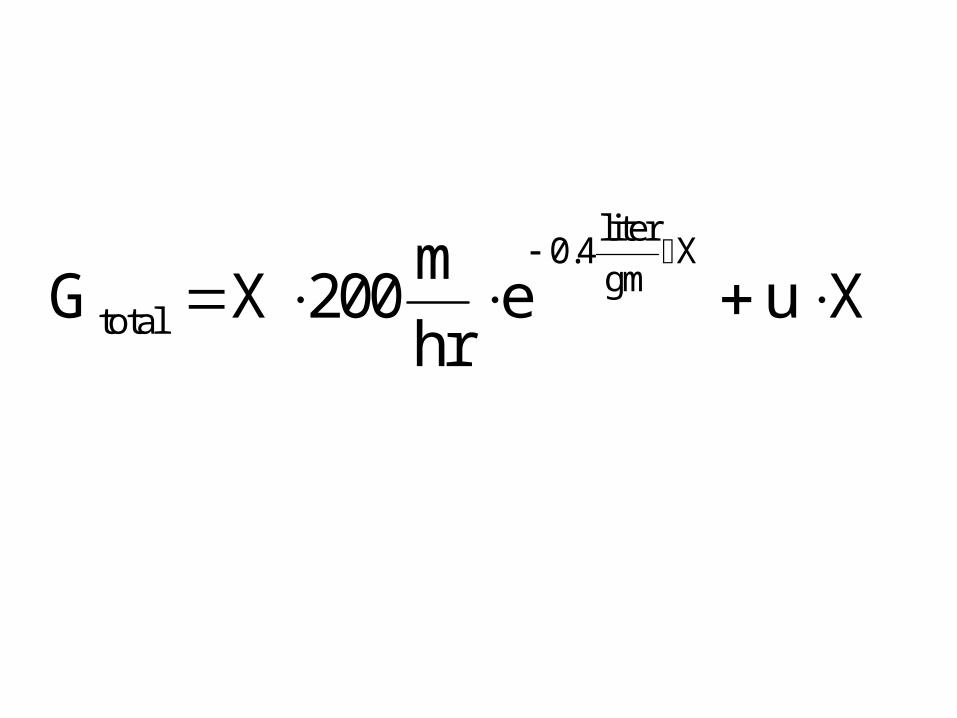
liter0.4 X
gmtotal
mG X 200 e u X
hr
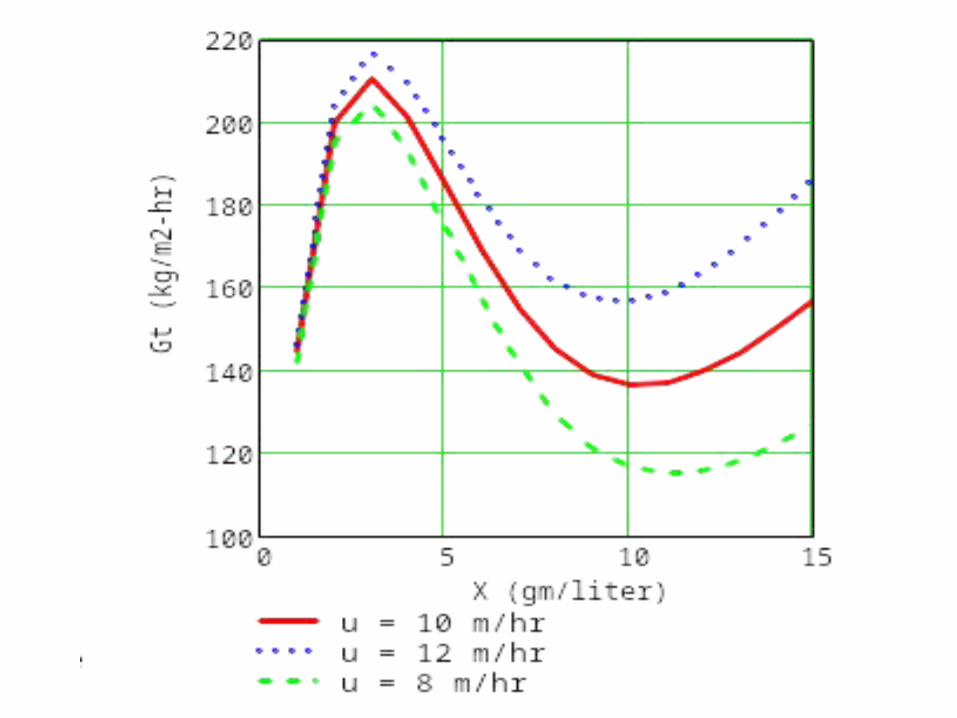
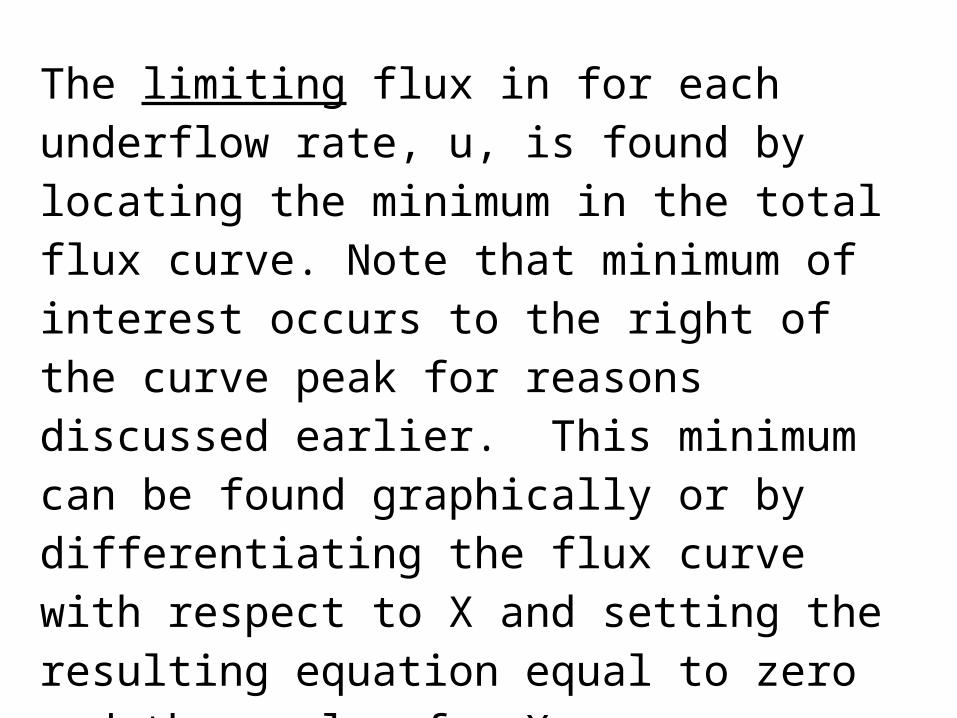
The limiting flux in for each underflow rate, u, is found by locating the minimum in the total flux curve. Note that minimum of interest occurs to the right of the curve peak for reasons discussed earlier. This minimum can be found graphically or by differentiating the flux curve with respect to X and setting the resulting equation equal to zero
and then solve for XL.
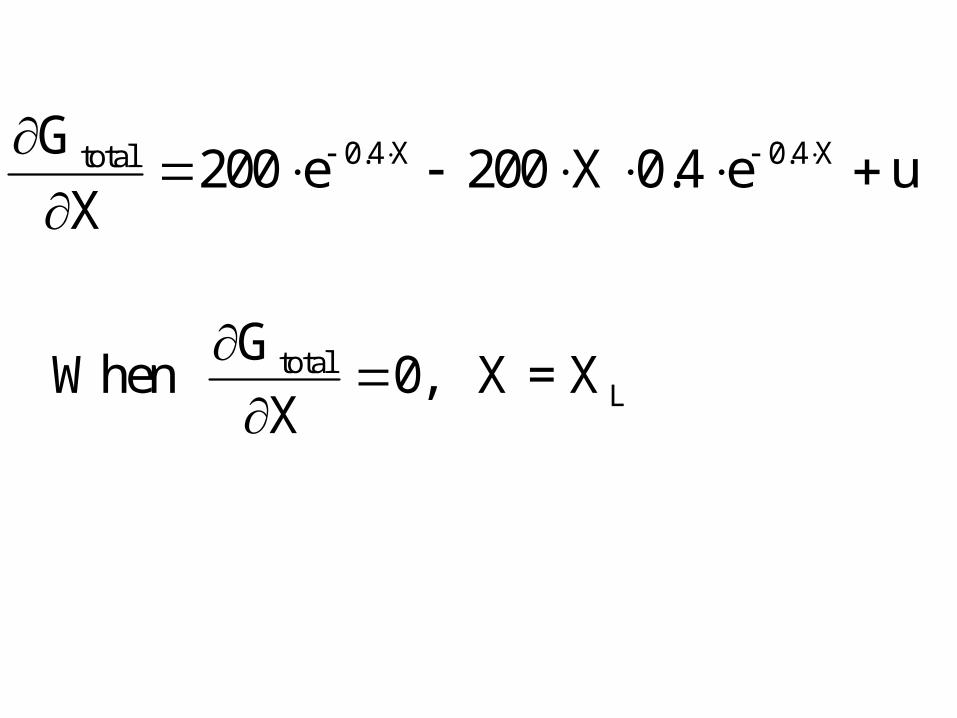
0.4 X 0.4 XtotalG200 e 200 X 0.4 e u
X
totalL
GWhen 0, X = X
X
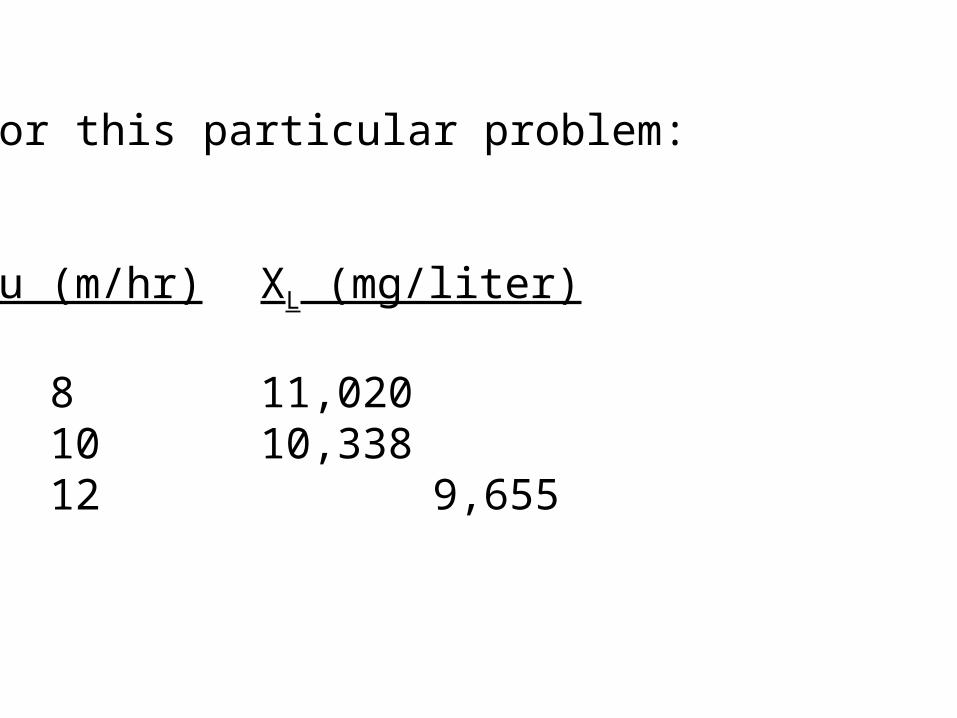
For this particular problem:
u (m/hr) XL (mg/liter)
8 11,020 10 10,338 12 9,655

This means that if we choose to operate a clarifier with an underflow rate of 8 m/hr (Qu/As) then the flux limiting concentration will be at 11,020 mg/L. In other words the subsidence flux will be:
liter gm0.4 (11.02 )
gm Ls
32
gm mG (11.02 ) 200 e
L hrkg
7.5 10m sec

And the bulk transport flux will be:
b L
2
m mgG u X 8 11,020
hr Lkg
0.024m sec
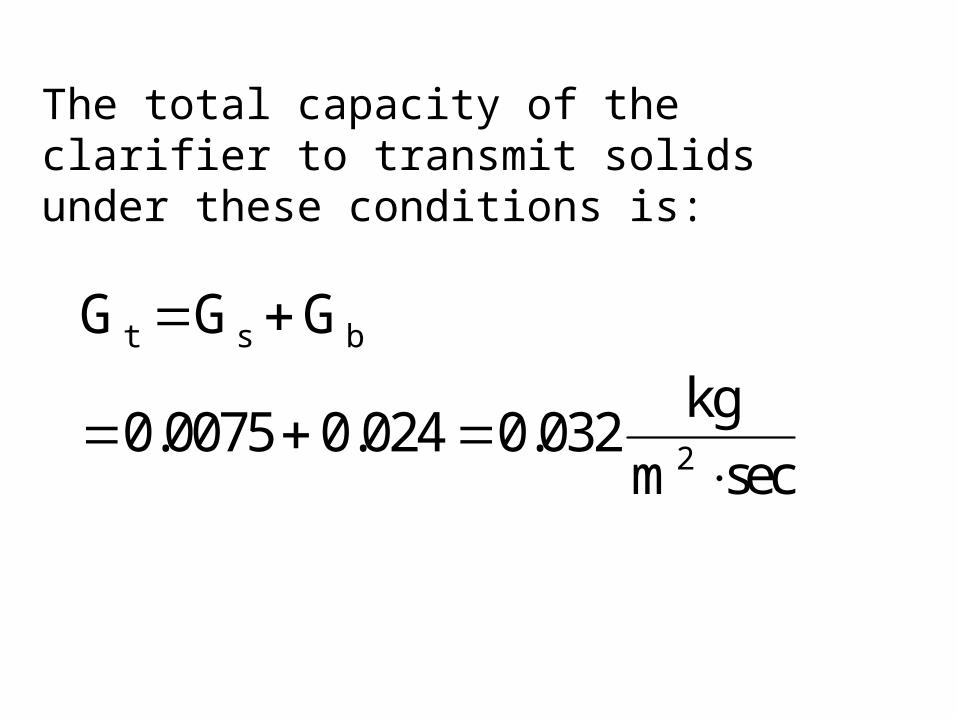
The total capacity of the clarifier to transmit solids under these conditions is:
t s b
2
G G G
kg0.0075 0.024 0.032
m sec

This same information can be obtained graphically.
In fact once the subsidence flux curve is drawn a
straight line at slope u drawn tangent to the
subsidence curve will give all the required
information. One important point is that the tangent
line must remain below the subsidence curve
otherwise the flux limiting capacity will be exceeded
and the clarifier will fail.
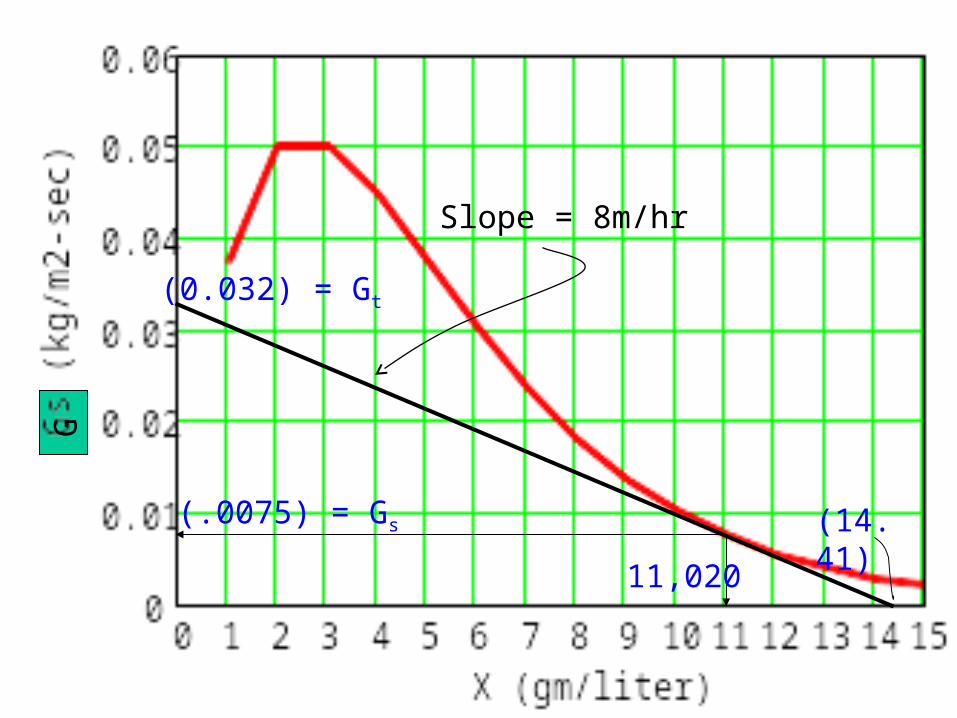
(.0075) = Gs
11,020
(0.032) = Gt
(14.41)
Slope = 8m/hr
G
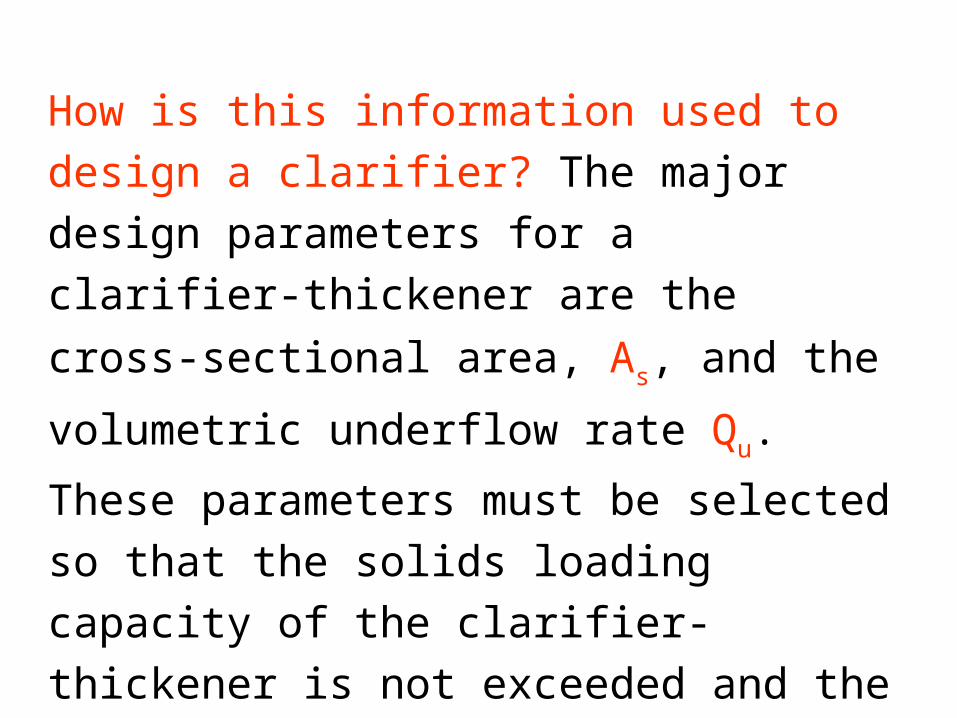
How is this information used to design a clarifier?
The major design parameters for a clarifier-
thickener are the cross-sectional area, As, and the
volumetric underflow rate Qu. These parameters
must be selected so that the solids loading
capacity of the clarifier-thickener is not exceeded
and the solids concentration of the underflow is
adequate. These parameters can be selected by
the following procedure.
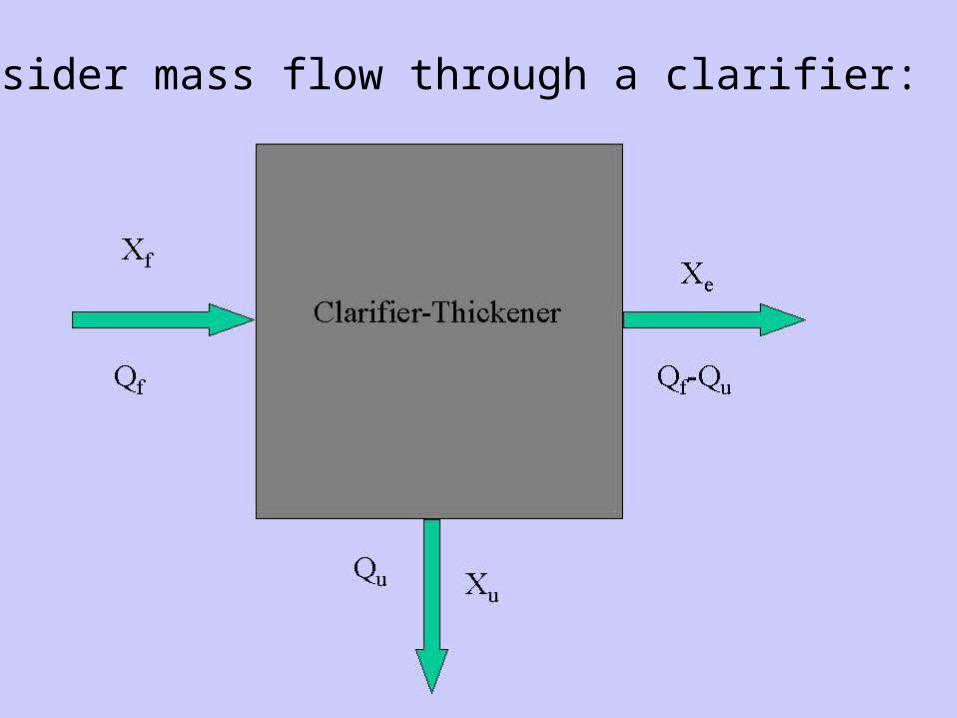
Consider mass flow through a clarifier:

Perform a solids mass balance around the
clarifier:
u u f f e f uQ X Q X X (Q Q )
Typically Xe is approximately zero so the last term can be ignored.
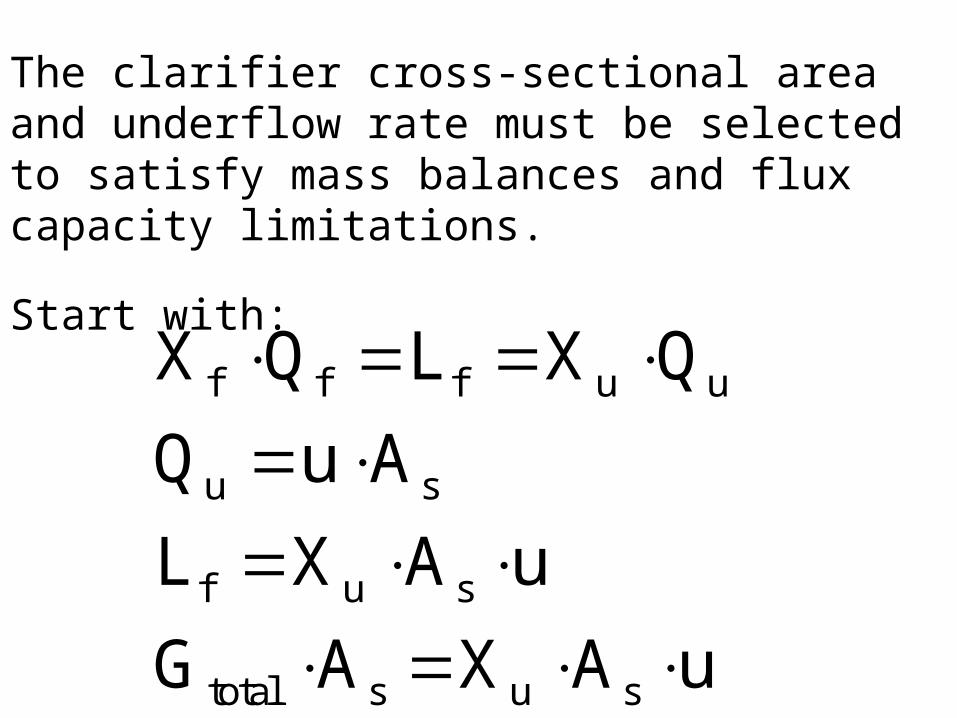
The clarifier cross-sectional area and underflow rate must be selected to satisfy mass balances and flux capacity limitations.
Start with:
f f f u u
u s
f u s
total s u s
X Q L X Q
Q u A
L X A u
G A X A u
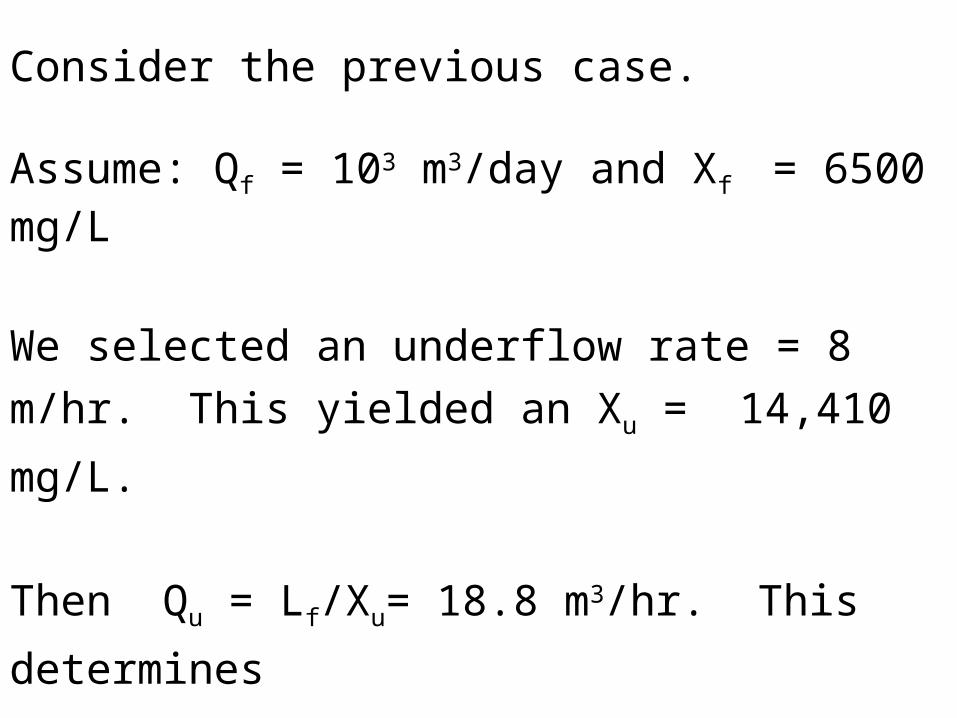
Consider the previous case.
Assume: Qf = 103 m3/day and Xf = 6500 mg/L
We selected an underflow rate = 8 m/hr. This yielded
an Xu = 14,410 mg/L.
Then Qu = Lf/Xu= 18.8 m3/hr. This determines
As = Qu/u = 2.355 m2
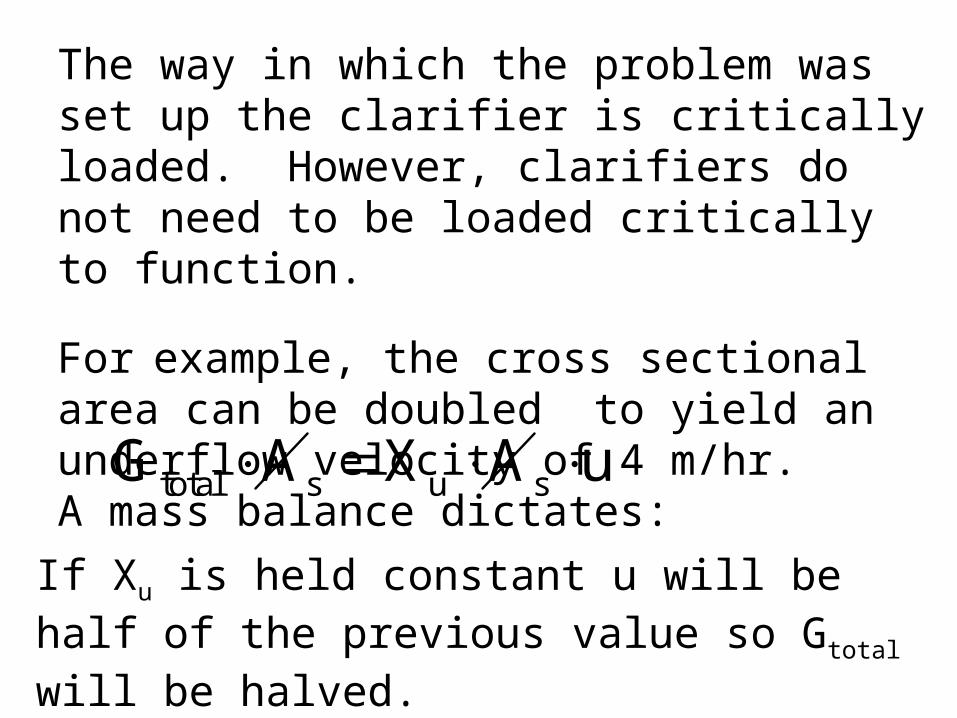
The way in which the problem was set up the clarifier is critically loaded. However, clarifiers do not need to be loaded critically to function.
For example, the cross sectional area can be doubled to yield an underflow velocity of 4 m/hr.A mass balance dictates:
total s u sG A X A u
If Xu is held constant u will be half of the previous value so Gtotal will be halved.

Assuming Lf (Qf * Xf) is constant then lowering Gtotal
by ½ is exactly compensated by doubling As. This
analysis can be extended to any combination of
changes in Xu, u, Qu, etc. as long as the mass balance
is met and as long as the line connecting Gtotal and Xu
remains below the subsidence flux curve.
In the following graph black lines are acceptable
operating conditions whereas blue lines are
unacceptable conditions.
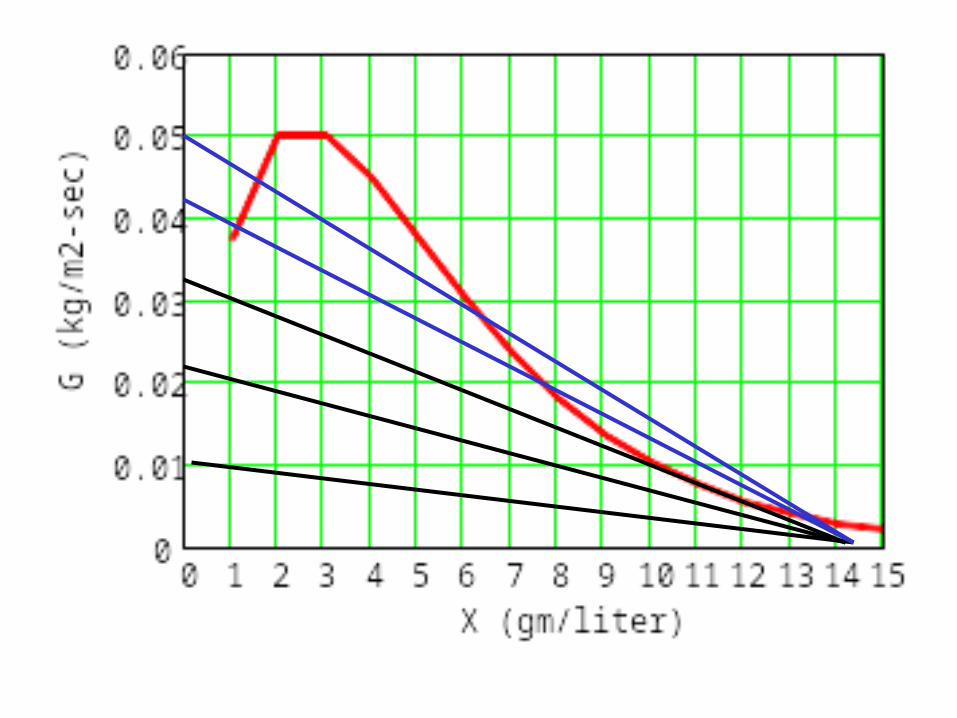
There are an infinite number of “non-critically
loaded” conditions a few of which are shown in
the following graph. All variations in Xu or u or
Gtotal are allowed as long as mass balances are
satisfied.


Critically loaded design can be accomplished
graphically using the “Batch Flux: technique.
•Construct a batch flux curve for
subsidence alone.
(GS = viXi).
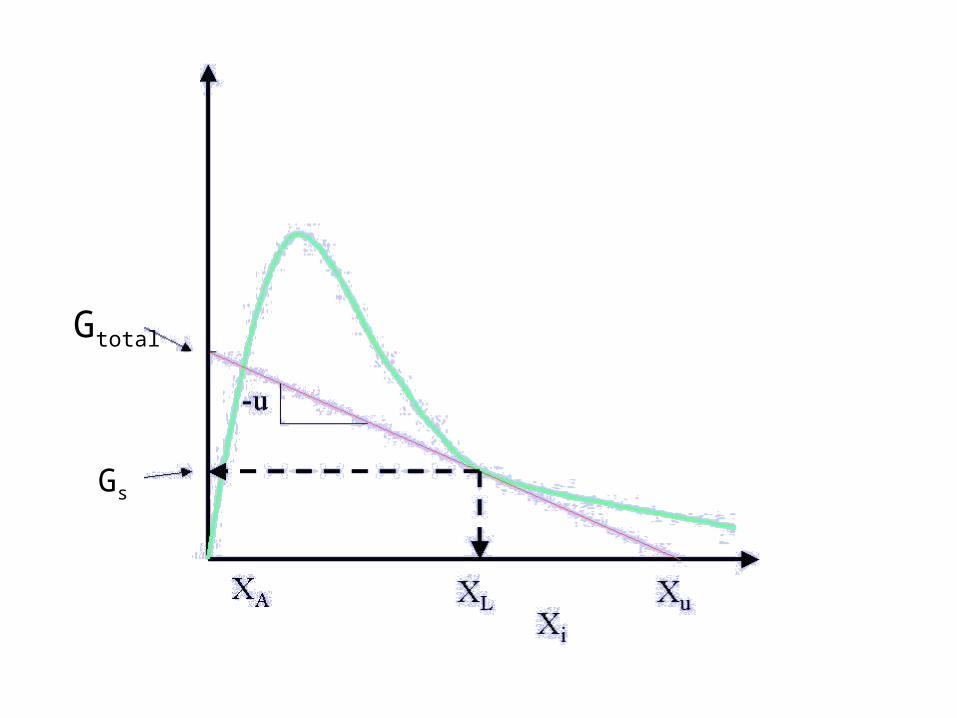
• Select an Xu . Draw a line tangent to the subsidence
batch curve which originates at G = 0, X = Xu. Extend
this line to the ordinate. The ordinate intercept is Gtotal.
The G value at the point of tangency is Gs.

•The slope of the tangent line is the negative of the underflow rate u.
Gtotal
Gs
Justification for this procedure can be shown from geometry or the Kynch analysis.
First use the Kynch analysis. Consider two layers (at different concentrations and, therefore, different settling rates) of zone settling solids. These layers are shown schematically here.
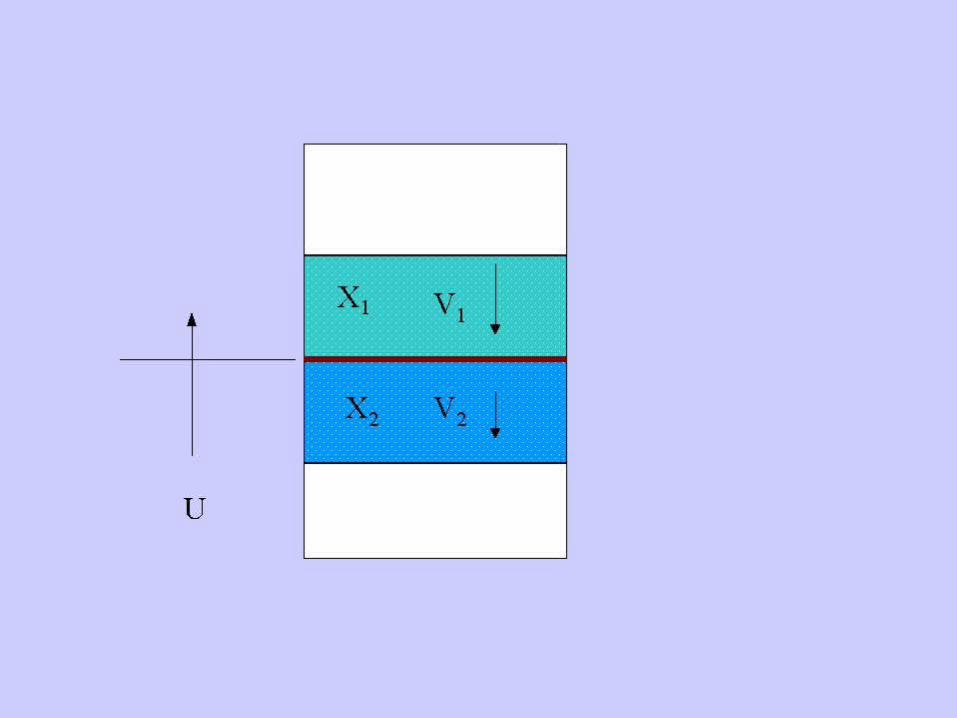
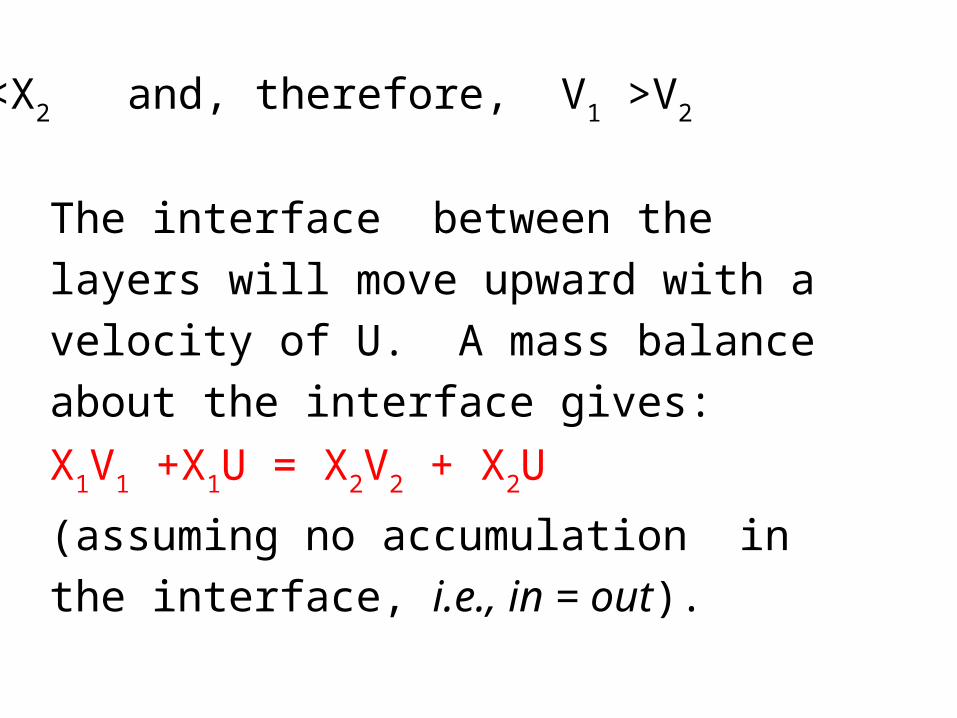
X1<X2 and, therefore, V1 >V2
The interface between the layers will move
upward with a velocity of U. A mass balance
about the interface gives:
X1V1 +X1U = X2V2 + X2U (assuming no
accumulation in the interface, i.e., in = out).
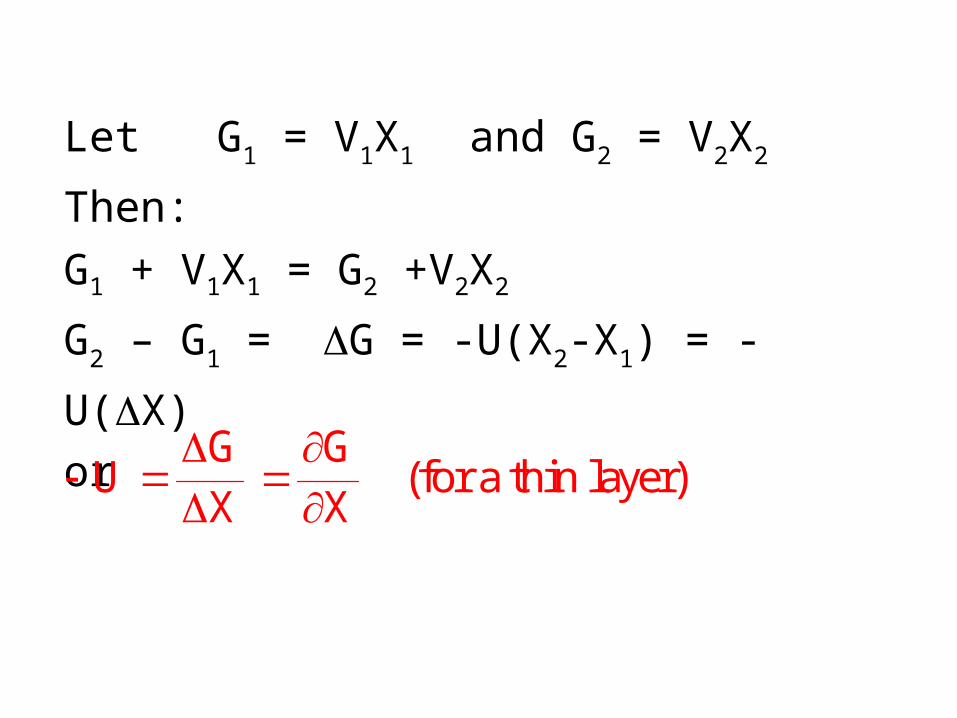
Let G1 = V1X1 and G2 = V2X2
Then:
G1 + V1X1 = G2 +V2X2
G2 – G1 = G = -U(X2-X1) = -U(X)
orG G
U (for a thin layer)X X
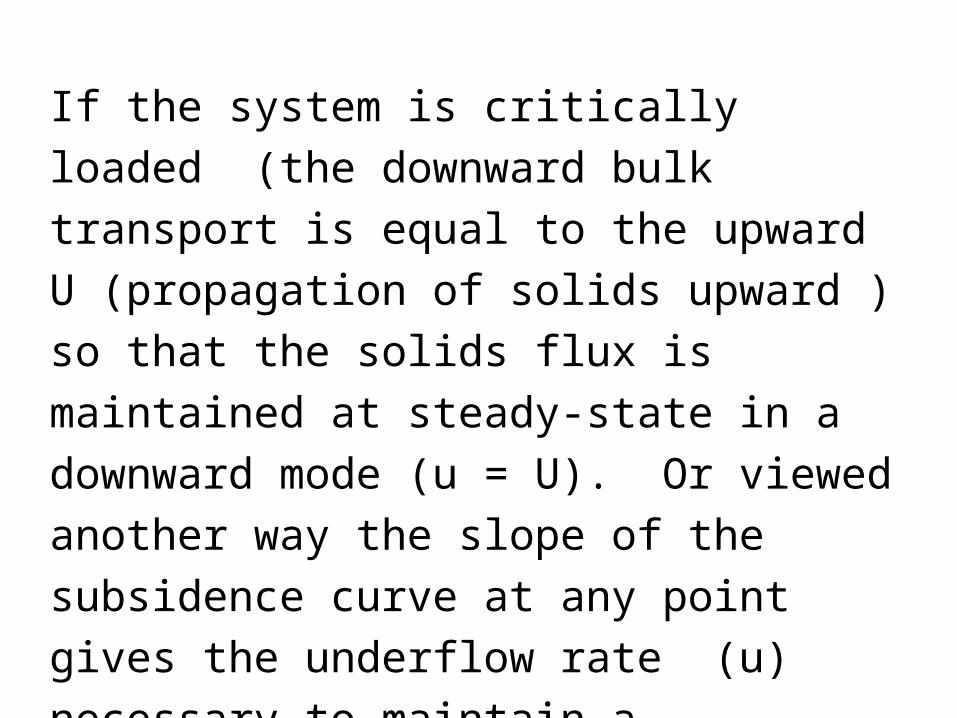
If the system is critically loaded (the downward
bulk transport is equal to the upward U
(propagation of solids upward ) so that the solids
flux is maintained at steady-state in a downward
mode (u = U). Or viewed another way the slope
of the subsidence curve at any point gives the
underflow rate (u) necessary to maintain a
critically loaded system at a selected Xu .
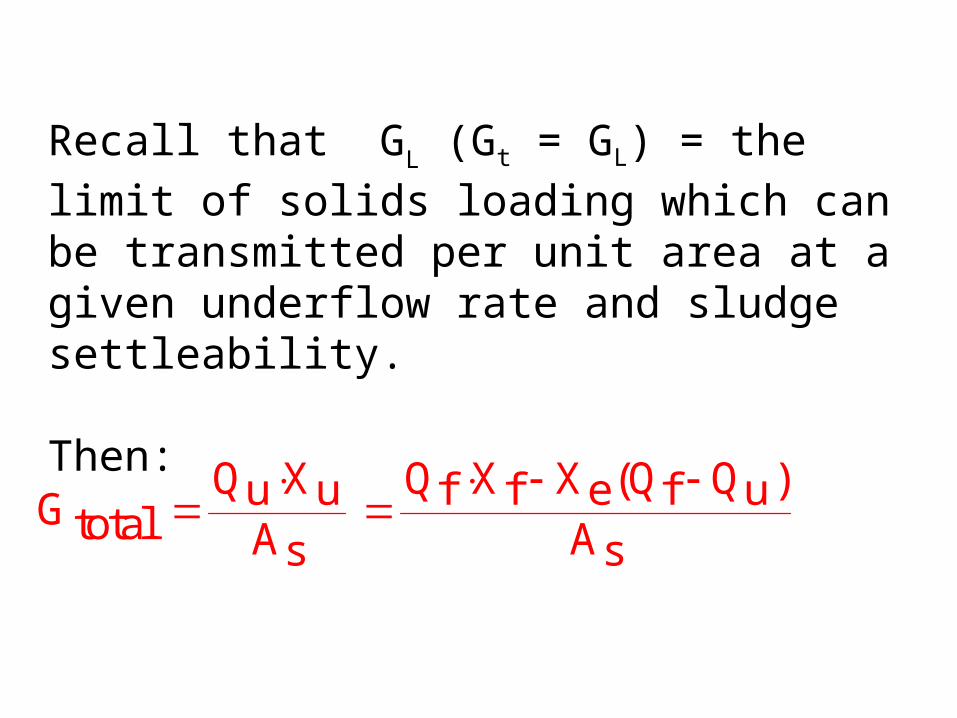
Recall that GL (Gt = GL) = the limit of solids
loading which can be transmitted per unit area at a given underflow rate and sludge settleability.
Then:
Q X Q X X (Q Q )u u f f e f uGtotal A As s
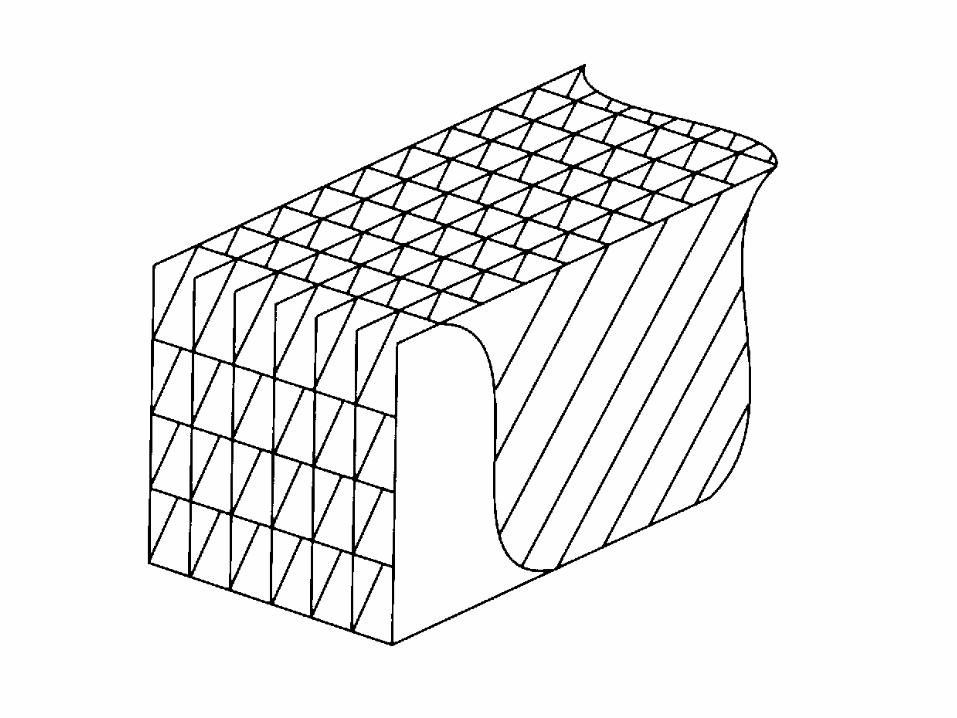
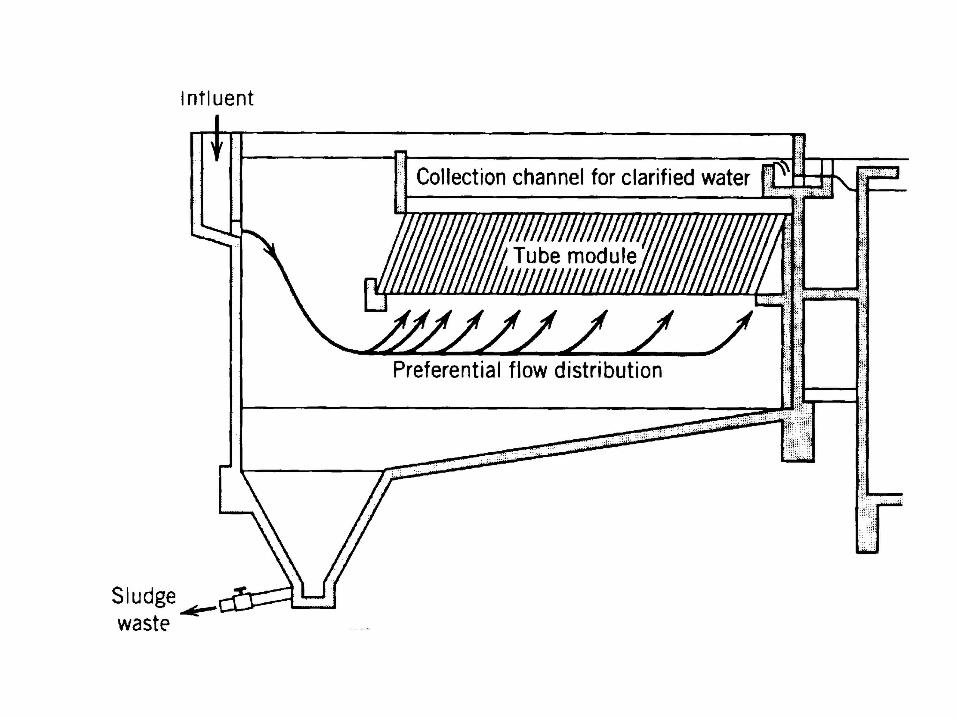
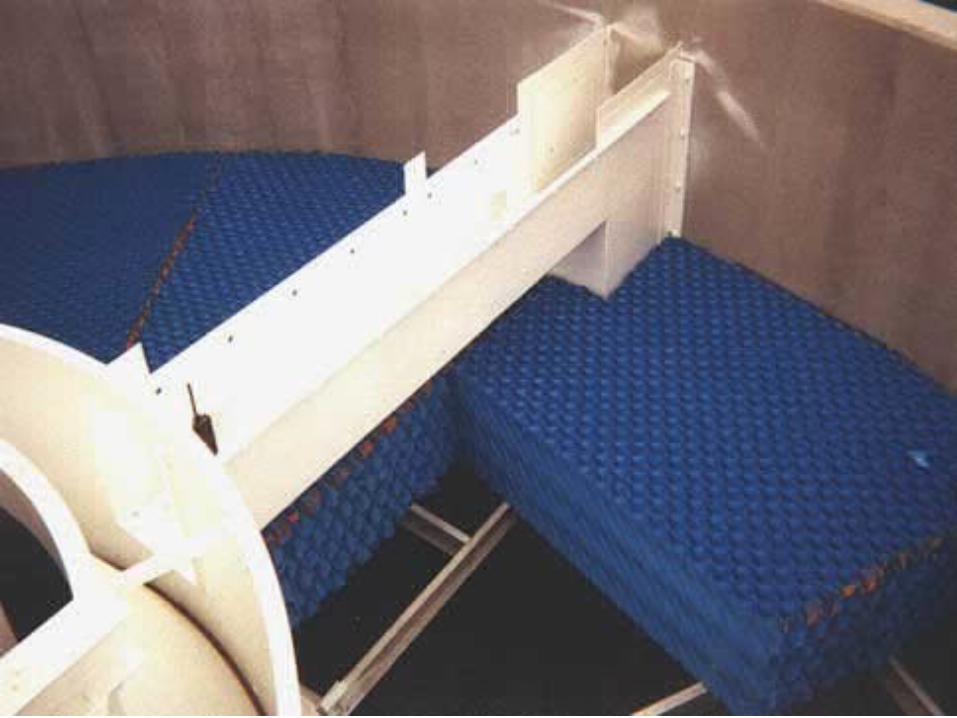
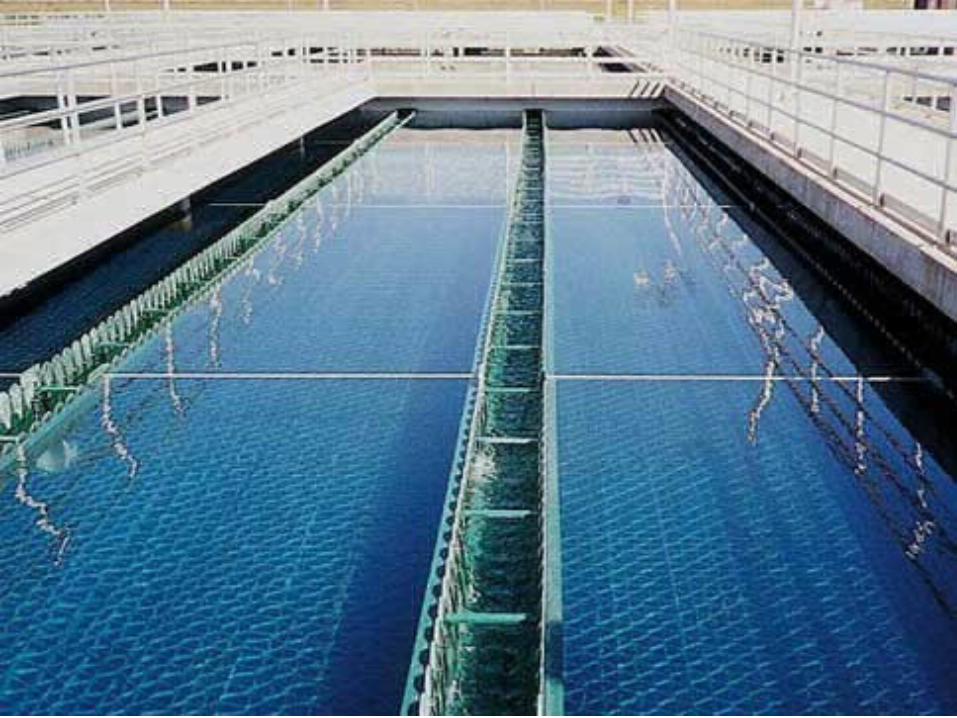
Tube Settlers:
One method to increase the efficiency or increase
the capacity of clarifiers is to install "false
bottoms" in the clarifiers. For example in a
rectangular clarifier such a "false bottom" would
look like:
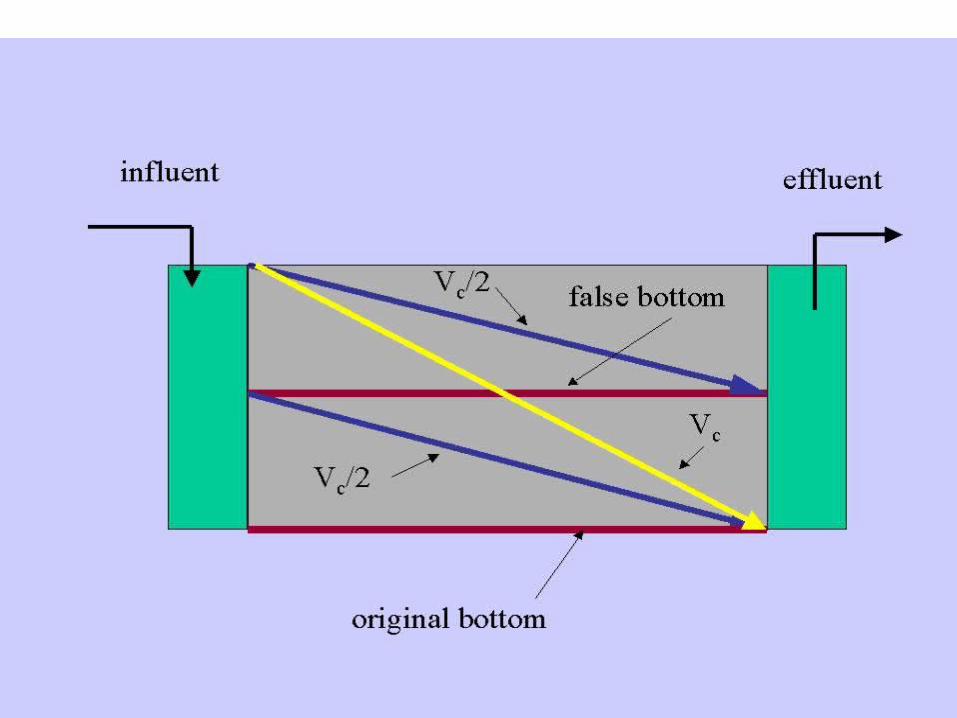
Using Type I settling analysis, the effect of
providing a single false bottom (of equal area of
the original bottom) is to effectively reduce the
critical velocity, Vc , by half if the false bottom is
located at mid-depth.
It will be assumed that particle settling velocity
is vertical (in direction perpendicular to the
original bottom of the clarifier) therefore the
distance a particle need to fall to be removed is
increased by 1/cosWhere is angle of
incline.
If the false bottoms are replaced by a series of
inclined tubes turbulence is minimized
(particularly lateral turbulence) and the physical
integrity of the false bottoms is increased
compared to long flat sheets. Hence the term "tube
settlers". Tube settlers are often used in retrofit
situations.