Hospital wastewaters treatment: upgrading water systems ...
249
HAL Id: tel-01133490 https://tel.archives-ouvertes.fr/tel-01133490 Submitted on 19 Mar 2015 HAL is a multi-disciplinary open access archive for the deposit and dissemination of sci- entific research documents, whether they are pub- lished or not. The documents may come from teaching and research institutions in France or abroad, or from public or private research centers. L’archive ouverte pluridisciplinaire HAL, est destinée au dépôt et à la diffusion de documents scientifiques de niveau recherche, publiés ou non, émanant des établissements d’enseignement et de recherche français ou étrangers, des laboratoires publics ou privés. Hospital wastewaters treatment: upgrading water systems plans and impact on purifying biomass Mousaab Alrhmoun To cite this version: Mousaab Alrhmoun. Hospital wastewaters treatment: upgrading water systems plans and impact on purifying biomass. Environmental Engineering. Université de Limoges, 2014. English. NNT : 2014LIMO0042. tel-01133490
Transcript of Hospital wastewaters treatment: upgrading water systems ...

HAL Id: tel-01133490https://tel.archives-ouvertes.fr/tel-01133490
Submitted on 19 Mar 2015
HAL is a multi-disciplinary open accessarchive for the deposit and dissemination of sci-entific research documents, whether they are pub-lished or not. The documents may come fromteaching and research institutions in France orabroad, or from public or private research centers.
L’archive ouverte pluridisciplinaire HAL, estdestinée au dépôt et à la diffusion de documentsscientifiques de niveau recherche, publiés ou non,émanant des établissements d’enseignement et derecherche français ou étrangers, des laboratoirespublics ou privés.
Hospital wastewaters treatment : upgrading watersystems plans and impact on purifying biomass
Mousaab Alrhmoun
To cite this version:Mousaab Alrhmoun. Hospital wastewaters treatment : upgrading water systems plans and impacton purifying biomass. Environmental Engineering. Université de Limoges, 2014. English. �NNT :2014LIMO0042�. �tel-01133490�

i
UNIVERSITE DE LIMOGES
ECOLE DOCTORALE SCIENCES POUR L’ENVIRONNEMENT
GAY LUSSAC ED N° 523 PRES Limousin, Poitou-Charentes
Groupement de Recherche Eau Sol Environnement
(GRESE EA 4330)
Thèse
pour obtenir le grade de
DOCTEUR DE L’UNIVERSITÉ DE LIMOGES
Discipline / Spécialité : Eau, Sol, Environnement
Présentée et soutenue par
Mousaab ALRHMOUN
Ingénieur Eau et Environnement
le 29 Octobre 2014
Hospital wastewaters treatment: upgrading water systems plans
and impact on purifying biomass
Thèse dirigée par Magali CASELLAS et Christophe DAGOT
JURY :
Rapporteurs
Mme Marie-Noëlle Pons Directeur de recherche, Université de Lorraine, Nancy
M. Nicolas Roche Professeur, LM2P2 (UMR -CNRS) Université d'Aix-Marseille
Examinateurs
M. Michel Baudu Professeur, GRESE- Université de Limoges
M. Julien Laurent Maître de Conférences, ENGEES- Université de Strasbourg
Mme. Magali CASELLAS Maître de Conférences, Université de Limoges
M. Christophe DAGOT Professeur, Université de Limoges
Th
èse
de
do
cto
rat

ii
“With A Valiant Heart, Nothing
Is Impossible”
Jacques Cœur (vers 4 -1461)
To my parents
To flowers of my life: Hadil, Asmaa, Alnabil- Bachar and Ahmad
To my beloved wife

iii
Acknowledgments
First and foremost, I would like to express my deep respects and sincere gratitude to my
supervisors Dr Magali Casellas and Professor Christophe Dagot for their creative guidance,
numerous valuable suggestions, and encouragement throughout this work. Professor Dagot
tried to guide me to enhance the quality of this work and present it in the best possible way.
He was always there when I needed hem. He taught me how to be a good researcher and
how to be always optimistic, even in the dark. You are one of few people have influenced me
personally and academically over the years that culminate in my life. I thank you for helping
me how to handle heavy work and life loads. For all, thank you Prof. Dagot.
My thanks also go to laboratory of (GRESE) at faculty of sciences and techniques, sincere
thanks are given to prof. Michel Baudu for the grant they awarded me and with which I first
came to Limoges for a year of advanced aste ’s studies. During this stay I met the people
who inspired me to stay in Limoges to reach my dream in research and we got there in the
end! Thanks to you.
Indebtedness and appreciation are due to my committee members Prof. Marie-Noëlle Pons,
Prof. Nicolas Roche, Prof. Michel Baudu and Dr. Julien Laurent for their interest in my work
and their valuable comments, suggestions and supports.
I would like thank the association (L’ADER-LPC) and sincere thanks to Prof. Jean-Marie
Baronnet for his help and support me in difficult times of this thesis. Thank you for your
humanity.
Every result described in this thesis was accomplished with the help and support of fellow
lab mates and collaborators: Dr. Jean noel- Louvet and I worked together on phases of this
thesis and without his efforts my job would have undoubtedly been more difficult. I greatly
benefited from his keen scientific insight, his knack for solving seemingly intractable practical
difficulties, and his ability to put complex ideas into simple terms. Claire Carrion during all
three years of thesis allowed us to utilize the confocal microscopy, and he fully supported
our efforts with her time, her interest, and her extensive knowledge of light scattering

iv
experiments. Thibault Stalder and I worked together on two years (Master and thesis) in the
first experiment of my research. I gained a lot from his vast microbiologic knowledge and
scientific curiosity. Corrine Meftah, Thank you for your help in bimolecular analyses.
I would like to thank the various members of GRESE group with whom I had the opportunity
to work and have not already mentioned for their help, moral support and cooperation
which contributed in various ways to the completion of this dissertation: Serge, Genevieve,
Aurély, Audrey, Philippe, Virginie, Marie-Line, Jerome, Patrick and all PhD students, post-
docs or contractors who accompanied me on this work: Délphine, Maud, Naïma, Cam tu,
Camille, lien, Ibrahim, Kais, Thouraya, Junfeng, Edem, Sava tudor, Mathieu, Karine, Sophie,
Patrice, Emeline, Jean-François. David chaismertin for his efforts in installations the pilots-
scales in the laboratory and his availability all the time to bring the hospital effluents from
hospital of Limoges in difficult conditions of weather, in addition to his important scientific
experience which provided me during all this study. Sincere thanks are given to Lourdes for
her efforts and for her administrative assistance with all my international and national
scientific conferences; thank you Lourdes, and for all your efforts and all who I have
forgotten from our laboratory staff.
Finally, I would like to acknowledge friends and family who supported me during my time
here. First and foremost I would like to thank Mom, Dad, for their constant love and support.
I wish to express my deepest appreciation to my beloved wife Manar I thank her for her
friendhip, love, unyielding support, patience and understanding throughout the whole
period of study. I would like thank my sisters and brothers for their endless love,
encouragement and spiritual support during 3 years of hard work. I owe a debt of gratitude
to my brother Dr Moaid who supported me during my first studying in the university to
reach here in this area. Thank you my brother! Thanks for everything that helped me get to
this day.

v
1. Alrhmoun M., Casellas M., Dagot C: Evaluation of the Extracellular Polymeric Substances
(EPS) by Confocal laser scanning microscopy in Conventional Activated Sludge (CAS) and
advanced membrane bioreactor (MBR) treating hospital wastewater. Water Science and
Technology, 2014- 69.11 (2287-2294).
2. Alrhmoun M., Carrion C., Casellas M., Dagot C: Upgrading the performances of ultrafiltration
membrane system coupled with activated Sludge reactor by addition of biofilm supports for
the treatment of hospital effluents. Chemical Engineering Journal. Accepted in 20-9-2014.
3. Stalder T., Alrhmoun M., Louvet J.N., Casellas M., Maftah C., Carrion C., Pons M.N., Ploy
M.C., Dagot C. Dynamic assessment of the floc morphology, the bacterial diversity and a
specific bacterial genetic support constitutive of an activated sludge processing an hospital
effluent. Environment Science and technology, 2013- 47(7909-7917).
4. Alrhmoun M., Casellas M., Baudu M., Dagot C: Efficiency of modified granular activated
carbon coupled with membrane bioreactor for trace organic contaminants removal.
International Journal of Chemical, Nuclear, Metallurgical and Materials Engineering Vol:8
No:1, 2014
5. Alrhmoun M., Carrion C., Casellas M., Dagot C: Impact of hospital effluents on the EPS in
submerged membrane bioreactor (MBR) and conventional activated sludge treatment.
Bioresource Technology Journal. Written to be submitted.
6. Alrhmoun M., Carrion C., Casellas M., Dagot C: Application of membrane biofilm bioreactor
(MBBR) for hospital wastewater treatment: Performances and efficiency for organic
micropollutant elimination. Written to be submitted.
7. Alrhmoun M., Casellas M., Dagot C: Effect of PAC addition on UF-AS process for hospital
wastewater treatment. Written to be submitted.
8. Alrhmoun M., Maftah C., Casellas M., Dagot C: Multi- level Approach for the integrated
assessment of bacterial distribution and their integron in different systems for treating
hospital wastewater. Written to be submitted.
List of publications

vi
2011
1. Alrhmoun M., Stalder T., Barraoud O., Casellas M., Ploy Marie-Cécile., Dagot C.: Fate of
amoxicillin on an activated sludge system. Colloque SFGP 2011 XIII Congress of the French
Society of Process Engineering, Lille- grand palais from 29 November to 1 December
2011. Oral presentation. (Article)
2012
2. Alrhmoun M., Louvet J N., Stalder T., Maftah C., Pons M. N., Casellas M., Dagot C.: Treatment
at the source of hospital wastewater activated sludge: feasibility and impact on biomass.
SFGP 2012 the French Society of Process Engineering, Nantes 1- 2 Feb. 2012. Oral
presentation. (Article)
3. Alrhmoun M., Louvet J N., Stalder T., Pons M. N., Casellas M., Dagot C.: Effects of hospital
effluents in activated sludge biomass on: structures and sustainability. Congress APTEN,
Poitiers du 25 au 28 September 2012. Oral presentation. (Article)
4. Alrhmoun M., Casellas M., Dagot C.: Comparison of hospital effluent treatment in a
conventional system (activated sludge) and a BRM: purification performance, polymer
structure and extracellaires mud. L’EAU, o je tif : essou es, usages, solutio s. Le
9ème Congrès International (GRUTTEE), Aix- en- Provence du 29 au 31 octobre 2012. Oral
presentation. (Long abstract)
2013
5. Alrhmoun M., Casellas M., Dagot C.: A performance evolution of suspended and attached
growth MBR systems in treating Hospital wastewater. Membrane conference technology,
Texas, USA from 25 to 28 Feb. 2013. Poster.
6. Alrhmoun M., Casellas M., Dagot C: Application of support media for the best biological
nutrient removal in au submerged mbr for treating the hospital effluent. Congress
symposium biofouling membrane processes: characterization, anticipation, control from 28 to 29 -5- 2013, Faculty of Science and Technology Limoges, France. Poster.
(Abstract)
7. Alrhmoun M., Casellas M., Dagot C.: TREATMENT at source hospital wastewater by extern
membrane bioreactor: performance and impact on the biomasses. PLUMEE 2013, Bacau,
Romania. Oral presentation. (Article)
8. Alrhmoun M., Casellas M., Dagot C: Evaluation of the Extracellular Polymeric Substances
(EPS) by Confocal laser scanning microscopy in Conventional Activated Sludge (CAS) and
advanced membrane bioreactor (MBR) treating hospital wastewater, 7th IWA Specialised
Membrane Technology Conference and Exhibition for Water and Wastewater Treatment
and Reuse 24-29 August 2013, Toronto, Canada. Oral presentation. ( Article)
9. Alrhmoun M., Casellas M., Dagot C.: Performance comparison between suspended and
attached growth MBR systems in treating hospitals wastewater. The XIVeme Congress SFGP,
(Lyon) from 8 to 10 October 2013. Oral presentation. (Article)
10. Alrhmoun M., Casellas M., Dagot C: Morphological and biochemical characterization biofilm
fixed on media supports in extern membrane bioreactor. Biofilm Congress 2013 from 19 to
21 November 2013, Pau, France. (Abstract)
List of national and international conferences
vii
11. Alrhmoun M., Casellas M., Dagot C: Removal of trace organic contaminants in conventional
and membranes bioreactors systems, European chemistry meeting conference de 4 au 7
December 2013 en Montenegro.
2014
12. Alrhmoun M., Casellas M., Baudu M., Dagot C: Efficiency of modified granular activated
carbon coupled with membrane bioreactor for trace organic contaminants removal, ICCEBS
2014: International Conference on Chemical, Environmental and Biological Sciences,
London 19-20 January 2014.
13. Alrhmoun M., Casellas M. , Dagot C: the effect of support media on process performance and
membrane fouling in submerged and extern membrane bioreactors treating hospital
wastewater. Membrane conference technology, Las Vegas, NV, USA from 10 to 13 March-
2014. Poster. (Abstract+ Article)
14. Alrhmoun M., Casellas M., Dagot C: Hospital wastewater treatment by Membrane
Bioreactor: Performance and Impact on the biomasses, IICBE in Dubai, 17-18 March 2014.
Oral Presentation. ( Article)
15. Alrhmoun M., Casellas M., Dagot C: Efficiency of modified granular activated carbon coupled
with membrane bioreactor for trace organic contaminants removal scientific day (GEIST), 5-
September 2014. Oral presentation. (Abstract)
16. Alrhmoun M., Casellas M., Dagot C: hospital wastewater treatment by activated sludge
coupled with microfiltration: performance and impact on the biomasses. The 10 Congress
International (GRUTTEE), Limoges from 29 to 31 October 2012. Oral presentation.

viii
Table of Contents
Title Page
Title Page…………………………………………………………………………………………………………..i A k o ledge e ts…………………………………………………………………………………………iii List of pu li atio s…………………………………………………………………………………………..v
List of national and international conferences………………………………………………… i Ta le of Co te ts…………………………………………………………………………………………..viii
List of Ta les…………………………………………………………………………………………………..xii
List of Figu es…………………………………………………………………………………………………xiv
List of Abbreviatio s…………………………………………………………………………………….xviii
Introductio ……………………………………………………………………….
Chapter 1- Literature Review
1. Hospital Waste ate …………………………………………………………….
. . Co su ptio of pha a euti als…………………………………………………………….
. . Pha a euti al a d pe so al a e p odu ts PPCPs ………………………………. 1.2.1. Anti ioti s…………………………………………………………………………………………………………………
. . . A ti eoplasti d ugs………………………………………………………………………………………………….
. . . E do i e dis upte s EDCs ………………………………………………………………………………………
1.2.4. Ge e al pha a euti als…………………………………………………………………………………………..17
. . . Musk f ag a es……………………………………………………………………………………………………….
. . . Su s ee Age ts SSAs ……………………………………………………………………………………………
. . . Diag osti o t ast edia………………………………………………………………………………………..
. . Sou es, path a s a d fates the PPCPs…………………………………………………
. . Che i al a d ph si al p ope ties of PPCPs..……………………………………………
1.5. Problematic statement and toxicity of hospital wastewater to the
e i o e t…………………………………………………………………………………………………..
2. Removal of Pharmaceutics Compounds by Treatment
Tech ologies ……………………………………………………………………………….
. . Re o al e ha is ………………………………………………………………………………. . . . Volatilizatio …………………………………………………………………………………………………………….
. . . So ptio ……………………………………………………………………………………………………………………
2.1.3. Biologi al deg adatio ………………………………………………………………………………………………

ix
Title Page
. . T eat e t te h ologies fo hospital aste ate s…………………………………..
. . . Co e tio al A ti ated Sludge P o ess CAS …………………………………………………………….
2.2.1.1. Removal of pharmaceutics compounds by Conventional Activated Sludge CAS ……
2.2.2. Membrane Bioreactors MBR …………………………………………………………………………………..
. . . . T pes of Me a e Modules…………………………………………………………………………………
. . . . MBR T pes………………………………………………………………………………………………………………
. . . . MBR Pe fo a e i t eati g the o ga i polluta ts………………………………………………
. . . . Me a e Ope atio Pa a ete s………………………………………………………………………….
. . . . Me a e fouli g………………………………………………………………………………………………….
2.2.2.6. Membrane Bioreactors appli atio fo t eati g the hospital aste ate ……………….
. . . Atta hed g o th iologi al t eat e t te h olog ……………………………………………………
. . . . Appli atio of atta hed g o th iofil s ith e a e io ea to s…………………… 2.2.4. Activated carbon adso ptio …………………………………………………………………………………….
. . . . Appli atio of a ti ated a o ………………………………………………………………………………
. . . . Re o al of Mi opolluta ts i A ti ated Ca o ……………………………………………………
. Cha acte istics of acti ated sludge Flocs…………………………………..
. . Flo o pholog a d o positio …………………………………………………………..
. . E t a ellula Pol e i Su sta es…………………………………………………………. . . . E t a tio of EPS of a ti ated sludge ………………………………………………………………………..
3.2.2. Effect of hospital wastewaters on extracellular polymeric substances formation in
u i ipal aste ate …………………………………………………………………………………………………………
. . Ph si pa a ete s of a ti ated sludge…………………………………………………….
. A alyses i st u e ts ………………………………………………………………
4.1. Activated sludge mo pholog ………………………………………………………………….
. . Mi o ial o positio a d a ti it ………………………………………………………….
. . Mi os opi te h i ues………………………………………………………………………..... . . . I age A al sis p o edu e………………………………………………………………………………………….
4.3.2. Confocal Laser Scanning Mi os op …………………………………………………………………………
. . . . P i iples of Co fo al Mi os op ………………………………………………………………………….
. . . . Ad a tages a d disad a tages of o fo al i os op …………………………………………
4.3.2.3. Fluorophores for confocal i os op ……………………………………………………………………
. . . . Basi ha a te isti s of fluo opho es………………………………………………………………………

x
Title Page
. . . . T aditio al fluo es e t d es……………………………………………………………………………………
4.3.2.6. EPS analysis with confocal laser scanning microscopy and chemical
a al sis……………………………………………………………………………………………………………………………….
. . . . Digital i age a al sis…………………………………………………………………………………………….
4.3.3. Fluorescence spe t os op ………………………………………………………………………………………..
. . . IR spe t os op ………………………………………………………………………………………………………….
. . . Io E ha ge Ch o atog aph ………………………………………………………………………………….
. . Dosage the pha a euti als o pou ds i aste ate s………………………..
. Co clusio …………………………………………………………………………… …
Refe e es Lite atu e Re ie ………………………………………………………………………..
Chapter 2 - Materials and Methods
. Study a ea a d aste ate cha acte istics…………………………….
. Reacto s a d ope ati g co ditio s ……………………………………… . . Ae o i a d a ae o i ea to s Bat h ode ………………………………………
2.2. Co e tio al a ti ated sludge s ste tests CAS …………………………………
. . Me a e io ea to MBR ……………………………………………………………… . . . Clea i g p oto ol…………………………………………………………………………………………………….
2.4. Ultrafiltration system (AS-UF ……………………………………………………………….. 26
. A alytical ethods ………………………………………………………………. 128
. Cha acte istics of acti ated sludge Flocs………………………………………………. 4.1. Sludge ha a te izatio s………………………………………………………………………..
. . EPS a al sis…………………………………………………………………………………………… 4.2.1. EPS e t a tio a d he i al a al sis………………………………………………………………………
. . . A al sis of total p otei , hu i su sta es a d pol sa ha ides……………………………
. Mic oscopic tech i ues…………………………………………………………. . . Co fo al lase s a i g i os op ………………………………………………………
. . Digital i age a al sis……………………………………………………………………………
. Bi olecula a alyses……………………………………………………………… . . DNA e t a tio ………………………………………………………………………………………
6.2. PCR-DGGE e pe i e t…………………………………………………………………………..
. .P ose ue i g……………………………………………………………………………………
. . Di e sit a al ses………………………………………………………………………………….
6.5. Quantitative PCR proto ol………………………………………………………………….….

xi
. Dosage the pha aceuticals co pou ds i aste ate s……….
. . Sa ple p epa atio ……………………………………………………………………………….
Title Page
. . Dete tio ……………………………………………………………………………………………….
. . Dosage the PPCP i the aste ate ………………………………………………………
Chapter 3 – Results and Discussion
Article 1: Evaluation of the extracellular polymeric substances by confocal laser scanning
microscopy in conventional activated sludge and advanced membrane bioreactors treating
hospital aste ate ………………………………………………………………………………………………………… 41
Article 2: Dynamic Assessment of the Floc Morphology, Bacterial Diversity, and Integron
Co te t of a A ti ated Sludge Rea to P o essi g Hospital Efflue t……………………………… 52
Article 3: Performances and effects on the EPS of submerged membrane bioreactor (MBR)
compared to conventional activated sludge treatment during hospital effluents
treatment ……………………………………………………………………………………………………………………… 163
Article 4: Upgrading the performances of Ultrafiltration Membrane system coupled with
Activated Sludge Reactor by addition of biofilm supports for the treatment of hospital
efflue ts……………………………………………………………………………………………………………………………186
Article 5: Efficiency of Modified Granular Activated Carbon Coupled with Membrane
Bioreactor for Trace Organic Contaminants Re o al………………………………………………………. 214
Conclusions and Recommendations
Conclusio s ………………………………………………………………………………………………… 22
Re o e datio s fo Fu the Stud …………………………………………………………… 27

xii
Table Title Page
Literature Review
1 Average values in HWWs and UWWs. (Verlicchi et al., ……………………………… 2 Consumption of pharmaceuticals for European countries (Sheyla et al., …… 3 Ph si al a d Che i al P ope ties of Sele ted E e gi g Co ta i a ts………………….
4 Membrane configurations and application in different separation
p o esses Bake , …………………………………………………………………………………………
Material and Methods
1 Physicochemical characteristics of the HE and UE feed wastewaters overall
the study, as well as the activated sludge inoculum used at the beginning of
the experiment for the both reactors. Standard deviation values are in
a kets………………………………………………………………………………………………………………..
2 Concentration (ng.l-1 of so e ele a t pha a euti als…………………………………….
3 Key operational parameters of CAS and MBR syste s i estigated……………………..
4 Co ditio s of io ea to ope atio ………………………………………………………………………
A al ti al ethods a d p e isio of easu e e t……………………………………………..
Results Article 1
1 Stabilized COD, N and SS removal efficiencies for AG-MBR and SG-MBR…………….. 6
Article 2
1 Proportion (in %) of OTU, Defined for a 3% Sequence Identity Cutoff, and
thei Affiliated Ge us, I t odu ed HE i to the A ti ated Sludge……………………… 8
Article 3
1 Shows physicochemical characteristics of the hospital effluents (HE) and
a ti ated sludge AS …………………………………………………………………………………………… 8
2 Organic pollutants removal efficiencies for CAS and MBR………………….………………. 73
3 Physico-chemical characteristics and average removal efficiencies of
selected pharmaceuticals i CAS a d MBR………………………………………………………….176
Article 4
1 Ph si o he i al ha a te isti s of the hospital efflue ts HE a d sludge………….207
2 Cycle of ope atio du i g the e pe i e t………………………………………………………….208
3 Stabilized COD, N and TSS removal efficiencies for AG-MBR and SG-MBR………….209
Article 5
1 Physicochemical characteristics of the hospital effluent (HE), and activated
sludge AS ……………………………………………………………………………………………………………216
Ke ope atio al pa a ete s of MBR s ste s i estigated…………………………………..216
3 Characteristics of the GAC- Plus……………………………………………………………………217
List of Tables

xiii
E olutio the effi ie e o al of o ga i s polluta ts MBR………………………….218
5 Trace organic contaminant removal efficiency of the MBR over 275 days
of ope atio ………………………………………………………………………………………………………..218

xiv
Figure Title Page
1 Chemical Structure of selected PPCPs (http://pubchem.ncbi.nlm.nih.gov …………
2 Pathways of emerging contaminants (Buttiglieri et al., ……………………………..
3 Kinetic degradation constant of 35 pharmaceuticals, hormones, and
personal care products. (Joss et al., …………………………………………………………..
S he ati o e ie of a t pi al o e tio al a ti ated sludge p o ess………………
5 Typical membrane bioreactor system (Pombo et al., …………………………………
6 Schematic shapes for mem a e filt atio p o ess……………………………………………..
7 Examples of commercially available membranes, applied in cross flow
filt atio EVENBLIJ, …………………………………………………………………………………..
8 Relationship between transmembrane pressu e a d flu Gü de , ……………
9 Fouling mechanisms in a membrane filtration (Radjenovic et al., ……………… 10 Photo of (from left to right) Kaldnes type K1, K2 and K3 biofilm carriers and
schematic of the moving-bed-biofilm reactor (MBBR). (Rusten et al., 2006; Leiknes
a d Ødegaa d, ……………………………………………………………………………………………………..52
11 Typical schematics of a attached membrane bioreactor (Lee et al., 2001;
Leik es a d Ødegaa d, …………………………………………………………………………….. 54
12 Activated carbon: surface and pores – scanning electron microscope
image magnification increases from left to right. (Courtesy of Roplex Engineering
Ltd. …………………………………………………………………………………………………………………….55
13 Schematic example of the structure of an activated sludge floc including
single bacteria, bacterial colonies, absorbed organic and inorganic particles
and organic fibres surrounded by the EPS matrix, Adapted from
Mikkelse , ………………………………………………………………………………………………..60
14 Floc breakage involves either large scale fragmentation or surface erosion,
adapted from (Jarvis et al., 2005)………………………………………………………………………..61
15 Experimental setup of the system for digital i age e o di g…………………………….73
16 (a) Original and (b) gradient microscopic images of a ulki g sludge…………………..74
17 Schematic diagram of the optical pathway and principal components in a
laser canni g o fo al i os ope …………………………………………………………………….76
18 Fluorescent spectral profiles, plotted as normalized absorption or emission
as a function of wavelength, for popular synthetic fluorophores emitting in
the blue, green, and red regions of the visible spectrum. Each profile i identified
with a colored bulle in (a), which illustrates excitation spectra. (b) The emission
spectra for fluorophores ac o di g to the lege d a ………………………………………….79
List of Figures
Literature Review

xv
1 Photo of pilot pla ith ae o i a d a ae o i ea to s………………………………….
2 Des iptio of the o e tio al a ti ated sludge p o ess used..………………………..
Figure Title Page
S he ati diag a of the e a e io ea to ………………………………………………..
4 Schematic of Activated sludge followed by ultrafiltration system (AS-UF …………..
Article 1 EPS o e t atio i the i ed li uo fo SMBR, EMBR a d CAS s ste s………….. 6
2 CLSM image of live cell distribution within CAS and SMBR flocs. Flocs were
stained with SYTO® 9 for total available DNA (viable bacteria; green) and
stained with PPI for DNA of dead cells and EPS DNA (dying bacteria; red).
Images obtained at x100 magnification. These representative images are
based upon the examination of 5–10 flocs per sample. The full colour version
of this figure in available online at http://www.iwaponline.com/wst/toc.htm......147
3 CLSM images of the BEPS distribution within EMBR flocs. Images were
obtained at x10 magnification. FITC staining universal protein is in green and
ConA staining α-mannopyranosyl and α glucopyranosyl is in red.
Images are representative of 5–10 flocs examined. Images (a, b, c), (d, e, f),
(g, h, i), (j, k, l) are for 2, 20, 45 and 65 days, respectively. (1), (2), (3) represent
the distribution of the EPS constituent versus the time in the sludge from
the experimental tests. In right-hand boxes, 'Red' denotes polysaccharides,
'Green' denotes proteins, and 'Blue' denotes humic-like substances. The ful
olou e sio of this figu e i a aila le o li e…………………………………………………..148
4 CLSM images of the SEPS distribution within EMBR flocs. Images were obtained
at x10 magnification. FITC staining universal protein is in green and ConA staining
α-mannopyranosyl and α glucopyranosyl is in red. Images are representative of
5–10 flocs examined. Images (a, b, c), (d, e, f), (g, h, i), (j, k, l) are for 2, 20, 45
and 65 days, respectively. In right-hand boxes, 'Red' denotes polysaccharides,
'Green' denotes proteins, and 'Blue' denotes humic-like su sta es. ………………… 49
5 Relative number of live cells in two reactors (CAS and SMBR). The percentage
was determined by measuring fluorescent intensities of SYTO® 9, which labels
all DNA in a sample, and PPI, which labels DNA from cells with compromized
membranes and extracellular DNA. The calculation is based on measurements
of 5– flo s f o ea h sa pli g site………………………………………………………………… 50
6 Percentage of protein and carbohydrate intensity versus the time within
EMBR flo s fo the ou d phase a a d solu le phase ¼ ……………………… 51
Article 2 1 (A) Ratio of fragments of flocs (number of small fragments total floc area) and
(B) ratio of filaments (filament length/total floc area) over time in the HE (◆) a d UE ◊ ea to . E a ples of phase o t ast i og aph of a ti ated sludge floc morphology at the end of the experiments in the HE (C) and the UE
feed reactor (D). The arrows indicate fragments of floc in the activated sludge
Material and Methods
Results and Discussions

xvi
Figure Title Page of the HE ea to ……………………………………………………………………………………………156
2 CLSM images of activated sludge at t = 40 days in the UE reactor showing
(A) autofluorescence; (B) viability staining; (C) merge of autofluorescence
andviability staining; and in the HE reactor showing (D) autofluorescence;
(E) Viability staining; (F) merge of autofluorescence and viability staining.
The green and red fluorescences correspond to living and damaged
bacteria, espectively. The blue fluorescence corresponds to the fluorescence
of EPS………………………………………………………………………………………………………………… 7
3 (A) 2D-nMDS map based on the semiquantitative analysis of the DGGE
profiles showing the evolution of the activated sludge bacterial community
i oth ea to s ◊ UE, ◆ HE). This 2D projection of the BC similarity matrix
allowed visualization of the similarity between each bacterial community over
time, i.e. the distance between diamonds. Plain and dashed lines represent
the differing percentage of similarities. (B Proportion of bacteria classes and
phyla recovered from the HE and UE feed to the reactors (HE-Feed and
UE-Feed) and from the HE and UE reactor sludges at the beginning (HE-T0 and
UE-T0) and the end (HE-TF and UE-TF of the e pe i e t…………………………………. 7
4 Major positive or negative variations (in excess of 1%) of the proportion of
bacterial genus in (A) the HE reactor and (B) the UE reactor between the
beginning and the end of the experiment. * corresponds to genus found also
i the efflue ts used fo the feed of the ea to s………………………………………………. 8
5 Evolution of the relative abundance of class 1 RIs over time in the HE (◆) and
UE ◊ ea to s……………………………………………………………………………………………………158
Article 3 1 Shematic diagrams of CAS (A) and MBR (B) systems treatment …………………..…… 9
2 Removal efficiencies (%) for 35 PPCPs in MBR (A) and CAS (B) reactors. Minimum
and maximum removal efficiencies according to (Sipma et al., 2009)……………….174
3 Removal efficiency with the Kbio (A) and the Kd (B)…………………………………………. 7
4 The Evolution of alive and dead cells and EPS in MBR (1) and CAS (2) ……………… 8
5 (A, B) EEM fluorescence spectra of the soluble-EPS. (C) The ratio tryptophan/fulvic-
like fluorescence intensity versus time in CAS and MBR reactors treating the
hospital wastewater………………………………………………………………………………………….. 9
6 The relation between the chemical dosage for the proteins and humic-like
substances and tryptophan-like fluo es e e λ e = , = , ful i -like
fluo es e e λ e = , = e sus ti e du i g the ti e of the A MBR and (B) CAS………………………………………………………………………………………………..
7 EPS concentration variation in supernatant (MBR and CAS)………………………………. 1
Article 4 1 Activated sludge followed by ultrafiltration system (AS-UF ……………………………….207
2 Microscopic Images represent the biofilms fixed on supports with the time
(B) CLSM images of the EPS distribution within biofilms attached on the

xvii
supports media. Protein was in (Green) and ConcA staining α-mannopyranosyl
a d α glu op a os l ed …………………………………………………………………………………209
3 Concentrations and removal rates of PPCPs in both AS-UF and
BBR-UF s ste s………………………………………………………………………………………………...
4 TSS (mg/L) in the bioreactor and in the outlet before and after introduction
the iofil suppo ts edia…………………………………………………………………………………210
5 Transmembrane pressures and permeate flux of BBR- UF and classical MBR
as fu tio of ope atio ti e …………………………………………………………………………….211
6 Evolution of the thickness and attached biomasses on supports media versus
Ti e……………………………………………………………………………………………………………………211
7 Variation of concentration of total EPS (A) and soluble EPS (B) in versus
of ope atio s ti e da …………………………………………………………………………………….212
8 CLSM images of the EPS distribution within AS-UF and BBR-UF flocs.
Images were obtai ed at X ag ifi atio ………………………………………………………212
9 Average fluorescence intensity in different periods of operation statistical
analyses of the Z stach analysis by image J (three-di e sio al st u tu e ………….213
Article 5 1 S he ati diag a of the e a e io ea to ……………………………………………….216
2 Represented the pressure Drop Curve and the bed expansion curve for
GAC plus……………………………………………………………………………………………………..217
3 Ph sio he i al p ope ties of t a es o ga i s fou d i hospital aste ate ……..219

xviii
LIST OF ABBREVIATIONS WWTP Wastewater treatment plants
UWWs Urban Wastewaters
HWWs Hospital Wastewaters
CAS Conventional activated sludge
MBR Membrane bioreactor
MBBR Membrane biofilm bioreactor
AS- UF Activated sludge- Ultrafiltration
MF Microfiltration
UF Ultrafiltration
GAS Granular activated carbon
PAC Powder activated carbon
COD Chemical oxygen demand
BOD Biological oxygen demand
TSS Total suspended solids
VSS Volatiles suspended solids
TN Total nitrogen
SN Soluble Nitrogen
EPS Extracellular polymeric substances
PN Proteins
PS Polysaccharides
HA Humic Acid - like substances
SMBR Submerged Membrane bioreactor
EMBR Extern membrane bioreactor
HRT Hydraulic retention time
AS Activated sludge
HE Hospital effluent
SRT Sludge retention time
NH4-N Ammonium nitrogen
NO3—N Nitrate nitrogen
NO2-N Nitrite Nitrogen
TMP Trans-membrane pressure
UV Ultraviolet
PPCPs Pharmaceutically active compounds and personal care products
DO Dissolved oxygen
BSA Bovine Albumin Serum
AS Activated Sludge
IF Indic of Fluorescence
TOC Total organic carbon

xix
Log Kow Octanol/ water partition coefficient
Log D Octanol/ water partition coefficient
Kd Sludge adsorption coefficient
pka logarithmic constant of ionization
KPa Kilo Pascal
L Litter
M Meter
Mg/L Milligram par litter
Kg Kilogram
Rc Cake resistance
Rm Intrinsic membrane resistance
Rf Fouling Resistance
Rt Total resistance
rpm Rotations par minute
RNA Ribonucleic Acid
s second
SVI Sludge Volume Index
∆P Transmembrane pressure
µ Viscosity
µm Micrometer
V Volume of reactor
J Permeate flux
Jc Critical flux
EDCs Endocrine Disrupting Compounds
y Year
h habitant
ng nanogram
LC50 Limit of Ecotoxicity
EC50 Ecotoxicity
H Hennery coefficient
Q air Flow of air
C Concentration
Ø The fraction of compound volatilized
SS Suspended solids concentration
Kbiol The degradation constant
FBR Fluidized Bed Reactor
MLSS Mixed Liquor Suspended Solids
POPs Persistent Organic Pollutants
SAGB Submerged Attached Growth Membrane
PVC Polyvinyl Chloride

xx
AEBR Aerobic expended bed reactor
SAFF Submerged Aerated Fixed Films
F/M Ratio Food/ Microorganism
TMR Tetraethyl rhodamine
TRITC Isothiocyanate derivative
EEM Extraction- Emission matrix
IR Infra red
A Absorbance
Mola a so pti it LC/MS Liquid Chromatography combined with mass spectrometry
GC Gas Chromatography
GC/MC Gas Chromatography- mass spectrometry
HPLC High Performance Liquid Chromatography
UPLC Ultra Performance Liquid Chromatography
HILIC Hydrophilic Interaction Liquid Chromatography
NPLC Normal Phase Chromatography
RPLC Reversed- Phase Liquid Chromatography.
MS Mass Spectrometry
LOQ Lower limits of Quantitation
UE Urban Effluents
d day
°C Celsius
mm millimetre
IM Indication Molhman
IB Indication of sludge
DNA Deoxyribonucleic acid
PCR Polymerase Chain Reaction
DGGE Denaturing Gradient Gel Electrophoresis
qPCR Quantative PCR
R Reactor
SPE Liquid- Solid Phase
CLSM Confocal Laser Scanning Microscopy
AG-MBR Attached Growth Membrane Bioreactor
SG-MBR Suspended Growth Membrane Bioreactor
ARD Antibiotic resistance determinate
Qc Quality Control
AMX Amoxicillin
Mw Molecular weight
pKd -log 10[Kd]

Introduction
1
Foreword
This is a thesis on organic micropollutants in the aquatic environment. At the beginning of
such a thesis it may be adequate to deal with some basic questions regarding the reason
why I have spend three years of time to study organic micropollutants in the environment
and specially in the hospital wastewater and technologic treatment systems for the
wastewater ! I think you may have a quick answer to such a question: "We as scientists care
for the environment, and micropollutants are a threat."
Yet, this statement provokes the next question: "How does the environment benefit if we
study micropollutants in the aquatic environment and report on the results for the people
without find new techniques or development of technical concepts to eliminate or avoid
damage in the environment?
Problem statement
There are 60 to 80 thousand chemicals in regular use entering millions of different
"environmental systems" (lakes, rivers, groundwater, soil, organisms).
In 2005, EPA began studying environmental contamination by pharmaceuticals, detergents,
natural and synthetic hormones, and other chemicals. These contaminants are commonly
referred to collectively as contaminants of emerging concern.
Many organic micropollutants are believed to enter municipal wastewater through
numerous industrial, commercial and domestic applications (bathing, cleaning, laundry, and
the disposal of unused pharmaceuticals and human waste).
Normally, the hospital wastewaters (HWWs) are assimilated to urban wastewaters (UWWs)
in many countries where they are discharged into municipal sewage and collected to a
wastewater treatment plant (WWTP) where they are co-treated with urban or/and industrial
effluents. This practice, considers that hospital and urban wastewaters are similar in terms
INTRODUCTION

Introduction
2
of pollutants, concentrations and loads. Decidedly, this is not a correct assumption, because
these HWWs are really different. As a result, the collection of hospital wastewater together
with domestic wastewater has been criticised and a dedicated pre-treatment of hospital
wastewater has been recommended (Verlicchi et al., 2010; Gupta et al., 2009; Pauwels and
Verstraete, 2006).
Persistent substances may pass the wastewater treatment plant (WWTP) unchanged. In
addition, input of easy degradable substances occurs through WWTPs that are not state of
the art and periodically through storm water or combined sewer overflows. If several
WWTPs drain into the same water body, micropollutants can accumulate along the stretch
or in lakes. Even groundwater used as drinking water may be contaminated by
micropollutants from urban drainage via infiltration of polluted surface water.
Micropollutants may have adverse effects on aquatic life even at very low concentrations.
Usage, physical-chemical and ecotoxicological properties determine whether a substance
causes problems in the aquatic environment. The concentration of a compound in the
WWTP effluent is determined by the load into the wastewater treatment plant and the
physico-chemical properties of the compound. Generally, substances that are water soluble
and persistent are not removed in WWTPs and can therefore be detected in natural waters.
High concentrations occur principally in small streams with a high fraction of treated
wastewater. The comparison of the exposure with ecotoxicologically based thresholds
allows to asses the risk to affect the aquatic life. In this detail we can really estimate the
importance to research for another technology more effective as, by example, the
membrane bioreactor (MBR).
The membrane bioreactor (MBR) for wastewater treatment has been currently one of the
new technologies for both municipal and industrial wastewater treatments, especially when
the effluent is intended for water reuse (Chang et al., 2002).
The membrane bioreactor technology has been available for around 40 years. But only the
last 20 years that has seen a rapid growth on its implementation and subsequent significant
penetration of the municipal market, coinciding with the introduction of the submerged
configuration (SMBR) (Judd and Judd, 2006; Yamamoto et al., 1989).

Introduction
3
The use of Membrane Bioreactors (MBR) in hospital wastewater treatment has grown widely
in the past decades. The MBR technology combines conventional activated sludge treatment
with low-pressure membrane filtration, thus eliminating the need for a clarifier or polishing
filters. The membrane separation process provided a physical barrier to contain
microorganisms and assures consistent high quality reuse water. Few studies was found in
the literature explained the efficiency of MBR in treating the hospital wastewater and
removal the pharmaceutical s compounds. The wastewater treatment technologies analyzed
included microfiltration, ultrafiltration, Nanofiltration, granular activated carbon, powdered
activated carbon, reverse osmosis, electro dialysis reversal, membrane bioreactors, and
combinations of these technologies in series. But, the principal problem concern the
membrane bioreactor was the fouling which decreased the performance and increased the
economic cost. Many studies were attributed to numbers of parameters and important one
was presence the extracellular polymeric substances (EPS) and fouling rate. (Bourgeous et
al., 2001; Bouhabila et al., 2001; Nagaoka et al., 1996). For that the EPS was important key
for studding performance the MBR in treating the Hospital wastewater.
Objectives of this study
Real conditions study for impact and effects the hospital effluents on the treatment systems
process and the microorganisms in different technologies was required, in addition to
improving the organic micropollutants removal process in membrane bioreactor technology.
In the present study, conventional activated sludge pilot and membrane bioreactor systems
in submerged and extern membrane (SMBR, EMBR) was proposed for the simultaneous
removal of organics micropollutants contained in hospital wastewater.
The performance of these laboratory-scales (CAS and hybrid MBR systems) was investigated.
In addition, the membrane fouling phenomenon was also studied. The effects of hospital
effluents on the sludge were tested in different technologies and confirmed by optical
analyses instruments as confocal microscopy, Infra red and Fluorometry. The influence of
Extracellulair polymeric (EPS) and their compounds as polysaccharides, humic substances-

Introduction
4
like and proteins on membrane fouling was also investigated. In additions to development
the MBR technologies for reach a high removal for the organic micropollutants was required.
In summary, the objectives of the present study are:
1. To examine the effects of hospital wastewater on the treatment performance of the
MBR and CAS systems.
2. To study the toxic impact of hospital effluent on the microorganisms and characterize
the changes in composition the sludge to decrease the membrane fouling
phenomenon under different reel operating conditions.
3. To develop a MBR system to achieve high removal of organic micropollutants in
treating the hospital effluents and produce a high quality effluent in the outlet.
Scope of this study
This research was conducted with a focus on the development of a MBR system for organic
micropollutants removal from the hospital wastewater and on the investigation of the main
effects in the sludge suspension that worsens the performance of membrane bioreactor and
increasing the membrane fouling problem.
Assessment of the state of the art
The introduction gives a brief description on the background and motivation of the research.
This parte also points out the aims and objectives of the study. The scope of the research as
well as the overall structure of the thesis is also outlined in these pages.
In Chapter 1, previous studies on hospital wastewater: presence in the environment,
composition and groups, treatments systems process (CAS and MBR) and their capacity in
removal the organics micropollutants in wastewater, development the MBR used for high
removal in wastewater in addition to characterise the EPS compounds and their role in
membrane fouling process and control are reviewed.

Introduction
5
Chapter 2 describes the materials and methods used in this laboratory study, including the
experimental setup, characterisation the reel influent wastewater, operating conditions, and
analytical methods.
Chapter 3 present experimental results on:
1. Evaluation of the extracellular polymeric substances by confocal laser scanning
microscopy in conventional activated sludge and advanced membrane bioreactors
treating hospital wastewater (Article 1 published in Water Science and Technology,
2014).
2. Dynamic Assessment of the Floc Morphology, Bacterial Diversity, and Integron
Content of an Activated Sludge Reactor Processing Hospital Effluent (Published in
Environment Science and Technology, 2013).
3. Impact of hospital effluents on the EPS in submerged membrane bioreactor (MBR)
and conventional activated sludge treatment ( Accepted in Biocenology Advances)
4. Application of membrane biofilm bioreactor (MBBR) for hospital wastewater
treatment: Performances and Efficiency for Organic Micropollutant Elimination (
Accepted in Biorescource Technology)
5. Upgrading the performances of Ultrafiltration Membrane system coupled with
Activated Sludge Reactor by addition of biofilm supports for the treatment of hospital
effluents (Accepted in Chemical Engineering Journal, 2014l)
6. Efficiency of Modified Granular Activated Carbon Coupled with Membrane Bioreactor
for Trace Organic Contaminants Removal (Published in International Journal of
Chemical, Nuclear, Metallurgical and Materials Engineering, 2014).
7. Effect of PAC addition on UF-AS process for hospital wastewater treatment. (Written
to be submitted).
8. Multi- level Approach for the integrated assessment of bacterial distribution and
their integron in different systems for treating hospital wastewater. (Written to be
submitted).
9. Appendix (A): Investigations of effects the amoxicillin on activated sludge, and on
antibiotic resistance (Written to be submitted).
Introduction
6
10. Appendix (B): Effect of internal heterogeneity of activated sludge flocs on sorption of
antibiotics. CLSM study of preferential sorption of vancomycin on Gram+ bacteria
(Written to be submitted).
Finally, the conclusion summarizes the work of this research on innovative organic
micropollutants removal MBR system, reviews the achievements of the research objectives
and highlights the main findings. It concludes by giving recommendations on potential areas
for further research.

Introduction
7
Table chronological of thesis
2011-2012 Octobre- Novembre 2011
Article 2 :
Pilote : BA- Effluents : CHU+
domestique –
Objectifs : 1. Etude des effets des
effluents hospitaliers sur le procédé
et les boues activées. 2. Analyses
microscopiques et statiques sur la
composition des flocs dans les
recteurs.
Prélèvement : CHU Limoges + assin-
sement doméstique de Limoges
environ 380L / Semaine
Article 3 : Deux pilotes : BRM Immergé
+ BA- Effluents : CHU– Objectifs : 1.
Etude des effets des effluents
hospitaliers sur le MBR et les boues
activées (EPS...)
2. Performance des deux procédés à
éliminer les micropolluants organiques
3. Analyses microscopiques et
statiques sur la composition des flocs
dans les reacteurs. Prélèvement : CHU
Limoges- environ 440 L / Semaine
Janvier- mars 2012
Méthodes :
Colorimétrique Hach gamme 0-1500
mg O2/L + Cône d’I hoff ( 00 mL)
+chromatographie ionique +
microscopie optique +
spectroscopie UV- visible+
microscopie confocal+ PCR+..
Méthodes :
Colorimétrique Hach gamme 0-1500
mg O2/L + chromatographie ionique +
microscopie optique + spectroscopie
UV- visible+ microscopie confocale+
PCR+ Lowry et al. (1951) modifié par
Frølund et al. (1995)+ Dubois et al.,
9 + Cô e d’I hoff ( L+ Chromatographie liquide +
Spectrofluorimétrie
2011-2012 Mai- juin 2012
Article 4 :
Pilote : Deux pilotes : BRM Immergé
+ BA- avec couplage des biofilms
sur supports Effluents : CHU
Objectifs : 1. Etudier le rôle efficace
de culture fixée des biofilms sur
traitement des effluents
hospitaliers. 2. Analyses
microscopiques et statiques sur la
composition des flocs dans les
réacteurs. 3. Etudier le changement
et la distribution des EPS et le
colmatage Prélèvement : CHU
Limoges - environ 440L / Semaine
Juillet 2012
Article 8 :
Pilote : Deux pilotes : BRM Immergé
+ BA- avec couplage des biofilms
supports Effluents : CHU
Objectifs : 1. Etudier la sorption de
la vancomycine sur les flocs
bactériens de boues activées
2. Analyses microscopiques et
statiques sur la composition des
flocs dans les réacteurs.
Novembre- 2012 au mars 2013
Méthodes :
Colorimétrique Hach gamme 0-1500
mg O2/L + chromatographie ionique
+ microscopie optique +
spectroscopie UV- visible+
microscopie confocal+ PCR+ Lowry
et al. (1951) modifiée par Frølund et
al. (1995)+ Dubois et al., 1956+
Cô e d’I hoff ( L+ Chromatographie liquide +
Spectromètre de mass (LC/MS)
Méthodes :
Colorimétrique Hach gamme 0-1500
mg O2/L + chromatographie ionique
+ microscopie optique +
spectroscopie UV- visible+
microscopie confocal+ PCR+ Lowry
et al. (1951) modifiée par Frølund et
al. (1995)+ Dubois et al., 1956+
Cô e d’I hoff ( L +Chromatographie liquide +
Spectromètre de mass (LC/MS)
Article 3 : Trois pilotes : Batch
Réacteur+ BRM Immergée + BA-
Effluents : KSO+ injection de
solution Amoxicillin en 100µg/L–
Objectifs : 1. Etude des effets
l’A oxi illi sur fo tio e e t des procédés et les boues activées
2. Performance des deux procédés à
éliminer l’A oxi illi Prélèvement : KSO Limoges-
environ 380 L / Semaine
Méthodes :
Colorimétrique Hach gamme 0-1500
mg O2/L + chromatographie ionique
+ microscopie optique +
spectroscopie UV- visible+ PCR+
Cô e d’I hoff ( L+ Chromatographie liquide +
Spectromètre de mass (LC/MS)
+Spectrofluorimétrie+ Ph métrie +
test d’adsorptio ave e ra e
Novembre- décembre 2011
Article 5 :
Pilotes : BRM Externe –Taille 500L
Effluents : CHU
Objectifs : . Etudier l’effi acité du
traitement des effluents hospitaliers,
impact sur les biofilms et le
changement et la distribution des EPS
avec le colmatage
Prélèvement : CHU Limoges - environ
550L / Semaine
Méthodes :
Colorimétrique Hach gamme 0-1500
mg O2/L + chromatographie ionique +
microscopie optique + spectroscopie
UV- visible+ microscopie confocal+
PCR+ Lowry et al. (1951) modifiée par
Frølund et al. (1995)+ Dubois et al.,
9 + Cô e d’I hoff ( L+ Chromatographie liquide +
Spectromètre de masse (LC/MS)
+Spectrofluorimétrie

Introduction
8
Article 7 :
Pilotes : BRM Externe –Taille 500L+
Poste de traitement par Charbon
actif en poudre (réacteur séparé
après le bioréacteur et avant la
membrane externe)
Effluents : CHU
Objectifs : . Etudier l’effi a ité de traitement des effluents
hospitaliers, impact sur les biofilms
et l changement, distribution des
EPS avec colmatage
2. Etudier efficacité le charbon
active en poudre à éliminer les
micropolluants organiques. Test
d’adsorptio - Analyses
isométriques. + teste du colmatage
pour étudier rôle le charbon actif à
diminuer ou augmenter le
colmatage ;. Prélèvement : CHU
Limoges 550L/S environ 550L /
Semaine
Méthodes :
Colorimétrique Hach gamme 0-1500
mg O2/L + chromatographie ionique
+ microscopie optique +
spectroscopie UV- visible+
microscopie confocal+ PCR+ Lowry
et al. (1951) modifiée par Frølund et
al. (1995)+ Dubois et al., 1956+
Cô e d’I hoff ( L+ Chromatographie liquide +
Spectromètre de mass (LC/MS)
+Spectrofluorimétrie+ Ph métrie..
Méthodes :
Colorimétrique Hach gamme 0-1500
mg O2/L + chromatographie
ioniques + microscopie optique +
spectroscopie UV- visible+
microscopie confocal+ PCR+ Lowry
et al. (1951) modifiée par Frølund et
al. (1995)+ Dubois et al., 1956+
Cô e d’I hoff ( L+ Chromatographie liquide +
Spectromètre de mass (LC/MS)
+Spectrofluorimétrie+ Ph métrie..
2012-2013 Mars au mai 2013
Article 5 :
Pilotes : BRM Externe+ biofilms sur
supports–Taille 500L
Effluents : CHU
Objectifs : 1. Etudier le rôle de
culture fixée sur le traitements des
effluents hospitaliers.
, impact sur les biofilms et le
changement et la distribution des
EPS avec le colmatage – Mesurer
les biomasses fixées sur les supports
et faire une relation avec EPS et
colmatage. Prélèvement : CHU
Limoges - environ 550L / Semaine
Méthodes :
Colorimétrique Hach gamme 0-1500
mg O2/L + chromatographie ionique
+ microscopie optique +
spectroscopie UV- visible+ micro -
scopie confocal+ PCR+ Lowry et al.
(1951) modifiée par Frølund et al.
(1995)+ Dubois et al., 1956+ Cône
d’I hoff ( L+ Chro a-
tographie liquide + Spectromètre de
masse (LC/MS)
+Spectrofluorimétrie+ Mesurer le
sépaisseurs des biofilms sur les
supports (Microscopie fucales
inverse avec logiciel ..)
Article 6 :
Pilotes : BRM Externe –Taille 500L+
Poste de traitement par Charbon
actif en grain modifié (deux
colonnes longueur : 75 cm et
largeur 5 cm)
Effluents : CHU
Objectifs : . Etudier l’effi a ité de traitement des effluents
hospitaliers, impact sur les biofilms
et changement, distribution des EPS
avec le colmatage
2. Etudier efficacité le charbon actif
modifié à éliminer les
micropolluants organiques. Test
d’adsorption- Analyses
isométriques.
Prélèvement : CHU Limoges -
environ 550L / Semaine
Juin- juillet 2013

Literature Review Chapter I
9
Chapter I
Literature Review

Literature Review Chapter I
10
1. Hospital Wastewaters Hospital wastewater represents a particular type of effluent; this assumption has been often
objected and rejected since 1980. Scientists as Pauwels and Verstraete, 2006) and analytical
campaign have been demonstrated and confirmed that the hospital effluents presents really
different qualitative and quantitative characteristics (Altin et al., 2003; kosma et al., 2010;
Liu et al., 2010; Verlicchi et al., 2010a) in compared with the urban wastewater. Hospitals
generate on average 750 L of wastewater by bed and by day so they are 2-5 times higher
than urban flow rates, which refer to one inhabitant equivalent (typically included in the
interval 120-250 L). These effluents are loaded with pathogenic microorganisms,
pharmaceutical partially metabolized, radioactive elements and other toxic chemical
substances. Moreover, in hospital effluents, conventional pollutant (Among them BOD5,
COD, TSS) is in general higher than in urban wastewaters (UWWs) (Verlicchi et al., 2010a).
Altin et al., 2003; Chiang et al., 2003; Brown et al., 2006; Pauwels et al., 2006;
Kajitvichyanukul and Suntronvipart, 2006; Gautam et al., 2007; Machado et al., 2007;
Sarafraz et al., 2007; Tsakona et al., 2007; Verlicchi et al., 2008; Mesdaghinia et al., 2009)
observed that in hospital wastewaters (HWWs) BOD5, COD and SS keep 2–3 times higher
than in (UWWs). The averages values in HWWs and UWWs are in (table 1).
Table 1: Average values in HWWs and UWWs. (Verlicchi et al., 2009)
Parameter UWWs HWWs Ratio
BOD5 mg L-¹ 90 200 2,2 COD mg L-¹ 170 500 3 TSS mg L-¹ 60 160 2,7
Normally, the hospital wastewaters (HWWs) are assimilated to urban wastewaters (UWWs)
in many countries where they are discharged into municipal sewage and collected to a
wastewater treatment plant (WWTP) where they are co-treated with urban or/and industrial
effluents. This practice, considers that hospital and urban wastewaters are similar in terms
of pollutants, concentrations and loads. Decidedly, this is not a correct assumption, because
these HWWs are really different. As a result, the collection of hospital wastewater together
with domestic wastewater has been criticised and a dedicated pre-treatment of hospital
wastewater has been recommended (Verlicchi et al., 2010; Pauwels and Verstraete, 2006).
Indeed, more recently, with the development of sensitive analytical techniques, which make
possible the detection of more and more active pharmaceutical compounds, it is now well

Literature Review Chapter I
11
established that pharmaceuticals and their metabolites are present in the environment
(Kümmerer, 2004b) with wastewater being the primary entry route. Sources include
households agri ulture a d phar a euti al i dustries Kü erer, a d hospitals are
often pointed out as a hot spot to pharmaceutical residues in influents of municipal
wastewater treatment plant (WWTP) (Ternes et al., 2006; Hawkshead, 2008). Hospital
wastewaters mainly comprise products used in everyday life in large quantities, such as
endocrine disrupting compounds (EDCs), pharmaceutical and personal care products
(PPCPs), surfactants and surfactants residues, and various industrial additives.
1.1. Consumption of pharmaceuticals
Referring to pharmaceuticals, large amounts of different compounds are used worldwide
and, in the last decade, their sales have been continuously increasing (Kummerer, 2001;
Ternes and Joss, 2006; Jjemba, 2006; Lienert et al., 2007b). In particular, the annual
consumption of ibuprofren (an analgesic) was equal to 166 t year-¹ in 1998 in France
(population of 55.5 millions), 128 t year-¹ in 2001 in Germany (population of 82.4 millions),
276 t year-¹ in 2003 in Spain (population of 43.2 million), 180 t year-¹ in 2001 in Canada
(population of 30 millions); the annual consumption of sulphamehoxazole (an antibiotic) was
equal to 22.4 t year-¹ in France, 47 t year-¹ in Germany, 12.7 t year-¹ in Spain, the annual
consumption of amoxicillin (another antibiotic) was equal to 110 t year-¹ in 2001 in Germany
as well as in Italy (population of 58 millions). In the USA, approximately 23,000 t antibiotics
are used in total per year (Ternes and Joss, 2006). Thousands of pharmaceutical chemicals
are in use today, particularly in developed countries (Rounds et al., 2009); approximately
3000 to 4000 different pharmaceuticals ingredients are used in the EU today, including
painkillers, antibiotics, blockers, contraceptives, lipid regulators, antidepressants,
antineoplastics, tranquilizers, impotence drugs and cytostatic agents, (see table 2).

Literature Review Chapter I
12
Table 2: Consumption of pharmaceuticals for European countries (Sheyla et al., 2012)
Compound Germany Switzerland France Sweden Spain
(Kg y-¹) (mg y-¹ inh-¹) (Kg y-¹) (mg y-¹ inh-¹) (Kg y-¹) (mg y-¹ inh-¹) (mg y-¹ inh-¹) (mg y-¹ inh-¹)
Acetaminophen n.a. n.a. n.a. n.a. 3, 303,077d 54, 389,5 n.a. n.a.
Acetylsalicylic n.a. n.a. n.a. n.a. 396,212d 6524.2 n.a. n.a.
Alprazolam n.a. n.a. n.a. n.a. 178d 2.9 n.a. n.a.
Amoxicillin n.a. n.a. n.a. n.a. 333,233d 5487.0 n.a. n.a.
Atorvastatin n.a. n.a. n.a. n.a. 7924d 130.5 n.a. n.a.
Azithromycin n.a. n.a. n.a. n.a. 4073d 67.1 n.a. n.a.
Bezafibrate 39,158e 475,2 1574e 215.6 20,852d 343.4 66.7 92.6
Bromazepam n.a. n.a. n.a. n.a. 2604d 42.9 n.a. n.a.
Carbamazepine 83,299e 1010.9 6260e 857.5 33,364e 554.3 820.2 463.0
Clarithromycin 12,36 150.0 1700e 232.9 16,889e 276.1 n.a. n.a.
Ciprofloxacin n.a. n.a. n.a. n.a. 12,186d 200.7 n.a. n.a.
Cyclophosphamide n.a. n.a. n.a. n.a. 305.7f 4.9 n.a. n.a.
Diclofenac 78,579 953.6 6819e 934.1 22,640e 370.1 375.9 747.7
Escitalopram n.a. n.a. n.a. n.a. 4.6d 0.08 n.a. n.a.
Fluoxetine n.a. n.a. n.a. n.a. 3740d 61.6 n.a. 97.2
Flutamide n.a. n.a. n.a. n.a. 521f 8,3 n.a. n.a.
Fluvoxamine n.a. n.a. n.a. n.a. 1121d 18,5 n.a. n.a.
Gemcitabine n.a. n.a. n.a. n.a. 379.3f 6,1 n.a. n.a.
Ibuprofen 250,792 3043.6 22,471e 3078,2 58,353e 953,8 7864.3 6391,2
Ifosfamide n.a. n.a. n.a. n.a. 121,4f 1,9 n.a. n.a.
Iohexol 8053e 97,9 4614e 632,1 46,774e 764,5 n.a. n.a.
Iopamidol 38,165 463.2 2739e 375.2 34,540e 564,6 n.a. n.a.
Iopromide 97,817e 1187.1 8965e 1228.1 12,810e 209,4 n.a. 463
Levonorgestrel n.a. n.a. n.a. n.a. 90g 1.38 n.a. n.a.
Lorazepam n.a. n.a. n.a. n.a. 585d 9.6 n.a. n.a.
Mitomycin n.a. n.a. n.a. n.a. 3.01f 0.05 n.a. n.a.
Naproxen n.a. n.a. n.a. n.a. 37,332d 614.7 n.a. 986.1
Omeprazole n.a. n.a. n.a. n.a. 8045d 132.5 n.a. n.a.
Pantoprazole n.a. n.a. n.a. n.a. 5287d 87.1 n.a. n.a.
Paroxetine n.a. n.a. n.a. n.a. 5515d 90.8 n.a. n.a.
Progesterone n.a. n.a. n.a. n.a. 10,000g 153.7 n.a. n.a.
Roxythromycin 7359e 89,3 149e 20.4 4182e 68.4 n.a. 9.3
Sertraline n.a. n.a. n.a. n.a. 6224d 102.5 n.a. n.a.
Simvastatin n.a. n.a. n.a. n.a. 6943d 114.3 n.a. n.a.
Sulfamethoxazole 53,600e 650.5 2300e 315.1 17,519e 286,4 160,4 294.0
Tamoxifen n.a. n.a. n.a. n.a. 377f 6 n.a. n.a.
Trimethoprim 12,183e 147.8 520e 71.2 20,603e 336.8 n.a. n.a.
17-αth lestradiol 48.2b 0,58 3.96b 0,54 n.a. n.a. 0.11 0.3
n.a.: Data not available. b Data from (Carballa et al., 2008) for 2005 in Sweden for 2001 in Germany, for 2000 in Switzerland and for 2003 in Spain. c Data calculated in this study for Spanish population in January 2010: 47.02×10⁶ inhabitants. d Data from (Besse et al., 2008) for 2004 in France. e Data from (ter Laak et al., 2010) for Germany, Switzerland and France. f Data from (Besse et al., 2012) for 2008 in France. g Data from (Vulliet and Cren-Olivé , 2011) for 2008 in France.
Literature Review Chapter I
13
1.2. Pharmaceutical and personal care products (PPCPs)
Pharmaceuticals are a set of compounds, which have obtained increasing attention over the
past decade. Pharmaceutical and Personal Care Products (PPCPs) are a set of chemical
pollutants resulting from pharmaceutical and products for personal hygiene. They include a
wide and diverse range of chemicals, including prescription drugs and medicines, perfumes,
cosmetics, sunscreens, cleansers, shower gel, shampoo, deodorant and other. When these
substances are freely discharged into the environment, they could cause some impact on
aquatic and terrestrial organisms (Fent et al., 2006; Jjemba, 2006), since they have been
specifically designed to produce biological effects even at very low concentrations. This
broad collection of substances includes any products consumed by individuals or domestic
animals for any number of countless reasons pertinent to health, performance, cognitive
and physical function, or appearance (Petrovic and Barcelo, 2007).
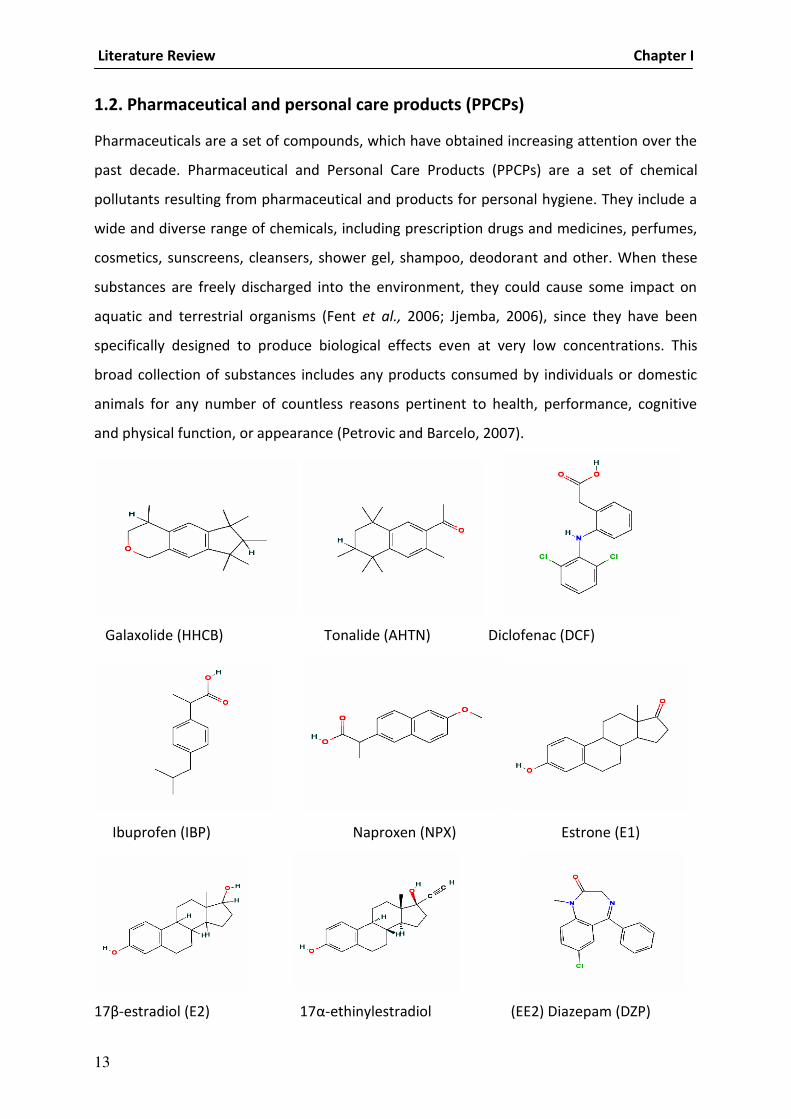
Galaxolide (HHCB) Tonalide (AHTN) Diclofenac (DCF)
Ibuprofen (IBP) Naproxen (NPX) Estrone (E1)
17β-estradiol (E2) 17α-ethinylestradiol (EE2) Diazepam (DZP)

Literature Review Chapter I
14
Carbamazepine (CBZ) Sulfamethoxazole (SMX) Iopromide (IPM)
Figure1: Chemical Structure of selected PPCPs (http://pubchem.ncbi.nlm.nih.gov).
A few compound classes will be highlighted, either because the concentrations found in
water are high, because of their (increasing) high volume usage or because of the
persistence of these compounds.
1.2.1. Antibiotics
Antibiotics are widely used. Hospital wastewater effluents are one source of antibiotics,
although wastewater effluents from tropical fish farm plants appeared to be also an
important source of antibiotics (Kobayashi et al., 2006). Some of these substances
sometimes show low absorbance to sewage sludge (log Kow = 1 – 6) (Brown, 2004).
Antibiotics such as sulfamethoxazole, trimethoprim, penicillin and caffeine were detected in
hospital wastewater at high levels (0.3 – 35 g/l). Only sulfamethoxazole, trimethoprim and
ofloxacin were present in WWTP treated effluent in concentrations ranging from 0.11 to
0.47 g/l. The substances trimethoprim and ofloxacin are part of the quinolone antibiotics
(QAs) which have been widely used for the last 20 years in Europe and the United States
(Nakata et al., 2005). QAs consists of compounds such as pipemidic acid (PIP), ofloxacin
(OFL), norfloxacin (NOR), ciprofloxacin (CIP), lomefloxacin (LOM), enrofloxacin (ENR),
difloxacin (DIF), sarafloxacin (SAR), and tosufloxacin (TOS). Also antibiotics belonging to the
quinolone group, including fluoroquinolones (FQs), are of particular environmental concern,
because of the potential inhibition of DNA gyrase, a key enzyme in DNA replication (Bryan et
al., 1989). Ofloxacin, lomefloxacin, norfloxacin and ciprofloxacin are the QAs which are
frequently found in WWTP effluents across Europe up to concentrations of 0.3 ug/L.
Removal efficiencies of antibiotics in general were estimated between 20 to 70 percent in
WWTPs, mainly due to the low (Kow) value of antibiotics (Log Kow ~ 1). Sulfamethoxazole,

Literature Review Chapter I
15
found in relatively high concentrations in hospital wastewater, displayed high persistence
and is detected at concentrations up to 0.3 g/L in WWTP effluents.(Schrap et al., 2003).
1.2.2. Antineoplastic drugs
During the past years, the growing use of antineoplastic drugs in cancer therapy is an
emerging issue in environmental research and it can be expected, that consumption will
increase due to a developing health care system and a higher life expectancy. Cytostatics
belong to the CMR (carcinogenic, mutagenic and reprotoxic) drugs. They usually enter the
hospital effluents partially transformed or even unchanged via urine and faeces of patients
under medical treatment. Therefore, they are assumed to be environmentally relevant
compounds. As hospital effluents reach the municipal sewer network generally without any
preliminary treatment, hospitals may represent an incontestable release source of
anticancer agents. Besides, nearly 80% of cancers therapies are administered in the
outpatient treatment ward, i.e. patients leave the hospital after drug application (Mahnik et
al., 2007). Subsequently, the drugs are also directly excreted into the municipal sewer
network. Their quantification in hospital effluents may serve as a starting point to
individualize the magnitude of potential pollution problems. Especially in Germany,
investigators have been active in monitoring the fate of cytostatics in the environment after
administration to patients. The concentrations of the antineoplastics cyclophosphamide and
ifosfamide in the effluents of domestic WWTPs in Germany were determined to be between
6.2–8.5 ng/L and 6.5-9.3 ng/L respectively.64 In a WWTP of an oncologic hospital in
Germany, much higher concentrations in the effluent were observed (0.006–1.9 g/L and
0.02-4.5 g/L respectively). No significant reduction during sewage treatment was observed.
Treatment of oncologic wastewater in a membrane bioreactor resulted in concentrations
below the limit of detection. Most anticancer drugs could be eliminated to a major extent
(80%) by sewage treatment plants, either by biodegradation or adsorption.
1.2.3. Endocrine disrupters (EDCs)
Endocrine disrupters (also called hormonally active agents) are any type of chemical or
mixture of chemicals that affect the endocrine system, and cause negative reproductive and
developmental health effects for the human or animal and/or their offspring. The endocrine
system is a complex network of organs, including the thyroid, pancreas, pituitary, ovaries,

Literature Review Chapter I
16
testes, and adrenal glands, which secrete hormones into the bloodstream to target cell
receptors in other organs or tissues, where the hormone has a specific effect. (Pontius, 2001;
Symons et al., 2000). In general, there are three major classes of endocrine disrupting
compounds, which are estrogenic (compounds that mimic or block natural testosterone),
androgenic (compounds that mimic or block natural testosterone), and thyroidal
(compounds with direct or indirect impacts to the thyroid).
Estrogens
The most studied endocrine disruptors are those organic compounds, which mimic the
hormone oestrogen. Oestrogenic steroids such as the synthetic steroid hormone 17a-
ethynylestradiol (EE2) prescribed as oral contraceptive for birth control or oestrogen
substitution therapies and the natural hormone 17s-estradiol (E2) and its main metabolite
oestrone (E1) are among the most potent EDCs causing effects in aquatic organisms (Zuehlke
et al., 2005). Several studies have been performed on the determination of the oestrogen
activity in WWTP effluents (Zuehlk et al., 2005; Asmaa et al., 2003; Johnson et al., 2005;
Desbrow et al., 2011; Joss et al., 2004) On several locations in Europe, (Belgium, Finland,
France, Germany, Norway, Sweden, Switzerland and The Netherlands), the WWTP effluents
and surface water have been studied for the presence of estrogens (STOWA, 2003).
Treatment processes included primary and chemical treatment only, but also more
advanced treatment processes (e.g. ozone) have been studied. In all studies, significant
levels of estrogens are detected in both WWTP influent- and effluent water, ranging from 2
up to 51 ng/L and from 0.5 to 3 ng/L, respectively. The highest estrogen values were
detected in the effluent of the WWTPs which only used primary treatment (35 ng/L E1, 13
ng/L E2 and 0.05-1,6 ng/L EE2). For WWTPs equipped with a secondary treatment, the
concentration of E1 and E2 in the effluent was between 0.7–5.7 ng/L and 0.8-3.0 ng/L
respectively. The removal efficiency of E1 and EE2 clearly depends on the redox conditions
of the purification process. This is partially due to the reduction during this process of E1 into
E2. A biological degradation of more than 90% of the E1, E2, and EE2 load can be expected
from conventional activated sludge plants and membrane bioreactors. The removal
efficiency of estrogens is improved when sludge retention times increases (Joss et al., 2004).
This can be ascribed to the relatively moderate (log Kow) values of estrogens of 3-4 and a

Literature Review Chapter I
17
very low vapour pressure (Henry constant). The concentration of estrogens in WWTP
effluents is found to be proportional to the population numbers of the city associated with
the specific WWTP. For example, the stretch of the River Elbe between Dresden and
Magdeburg has some big population centres and associated endocrine disrupting effects in
the resident fish in some regions have now been detected. In these areas, the addition of
tertiary treatments, known to reduce micro-organic pollutants in drinking water purification,
such as ultra filtration, ozonation, UV treatment, activated charcoal etc. may need to be
considered for the removal of estrogens.
1.2.4. General pharmaceuticals
Anti-inflammatories and analgesics, lipid regulators and s-blockers are the major groups
detected in WWTP effluents across Europe and among them are acetaminophen,
ketoprofen, ibuprofen, diclofenac, mevastatin, atenolol, propranolol, sulfamethoxazole,
bezafibrate and trimetroprim as the most abundant, with concentrations at levels (Petrovic
et al., 2006; Lishman et al., 2006). The highest concentrations were detected for
acetaminophen (paracetamol) and for trimethoprim, with average concentrations in WWTP
effluent of 2.1 g/L and 0.29 g/L respectively, (Meritxell et al., 2006). Other compounds
frequently detected in WWTP samples were carbamazepine and ranitidine, with average
concentrations of 400 ng/L for carbamazepine and 135 ng/L for ranitidine in effluent
(Ternes, 1998). Different removal behaviour was observed for the investigated compounds.
Some compounds as the antiepileptic drug carbamazepine were not removed at all in any of
the sampled treatment facilities and effluent concentrations in the range of influent
concentrations were measured. Other compounds as bisphenol- A, the analgesic ibuprofen
or the lipid regulator bezafibrate were nearly completely removed. The drugs detected in
the environment were predominantly applied in human medicine. Due to their widespread
presence in the aquatic environment many of these drugs have to be classified as relevant
environmental chemicals (Vogelsang et al., 2006).
1.2. 5. Musk fragrances
Synthetic musks are a group of chemicals possessing a chemical structure that is not readily
biodegradable they are capable of being bio- concentrated in aquatic organisms (Clara et al.,
2005 a; Balk and Ford, 1999; Carlson et al., 200). The most frequently used synthetic musks

Literature Review Chapter I
18
are Musk ketone: 1-tert.-Butyl-3,5-dimethyl-2,6-dinitro-4-acetylbenzene (MK); Musk
moskene: 4,6-Dinitro-1,1,3,3,5-pentamethylindane (MM); Musk ambrette: 2,6-Dinitro- 3-
methoxy-4-tert.-butyltoluene (MA); Musk xylene: 1-tert.-Butyl-3,5-dimethyl-2,4,6-trinitrobe-
nzene (MX) and Musk tibeten: 1-tert.-Butyl-2,6-dinitro-2,4,5-trimethylbenzene (MT).
The Log Kow values of these compounds and their metabolites vary from 4.3 to 6.3 and from
4.8 to 5.1 respectively. These synthetic compounds are used as more affordable substitutes
for the expensive natural musks (e.g., muscone, civetone, and ambrettolide) present in many
perfumes. Based on this (Log Kow) most of these musks will be more or less efficiently
removed by a WWTP treatment. Many manufacturers voluntary are replacing the older and
more toxic substances for newer, such as tonalide (AHTN) and galaxolide (HHCB).
There are four synthetic musk fragrances accounting for 95% of the total amount used.
These are the nitro-musks (musk xylene, used in detergents and soaps, and musk ketone,
used in cosmetics) and two polycyclic musks HHCB and AHTN. Synthetic musks enter city
sewage systems (presumably from bathing, laundry detergents, and other washing
activities), and then the aquatic ecosystem, where they may potentially bio-concentrate and
bio-magnify in the tissues of aquatic organisms. Fragrances are reported in several studies
and they are identified in effluents and surface water (Bitsch et al., 2002; Jossa et al., 2005).
Concentrations up to 0, 73 mg/l are found in effluents of domestic WWTP (Jossa et al.,
2005). Two nitro musks (musk xylene, musk ketone), a major metabolite of musk xylene and
the polycyclic musk fragrance tonalide (AHTN) are suspected of having estrogenic activity
(Bitsch et al., 2002). It has been established that the partial removal observed for the two
fragrances AHTN and galaxolide (HHCB) during wastewater treatment is mainly due to
sorption (log KOW > – 4.9) onto sludge and not to biological transformation. Due to the
incomplete removal of fragrances in conventional WWTP, the ozonation has been tested as
a possible tool for the enhanced removal of fragrances. By applying 10 –15 mg/l of ozone
(contact time: 18 min), most of the musk fragrances were no longer detected (Bitsch et al.,
2002).
Literature Review Chapter I
19
1.2.6. Sunscreen Agents (SSAs)
Sunscreen agents (SSAs) are more and more widely used for protection against harmful UV
radiation. The concentration of these sunscreen agents in water is limited (0.004 g/L) and
considerable concentrations are found in aquatic organisms (21 g/kg) indicating that SSAs
are able to bio-concentrate (Nagtegaal et al., 1997). The fact that SSAs (e.g., oxybenzone (2-
hydroxy-4-methoxybenzophenone) and 2-ethylhexyl-4-methoxycinnamate) can be detected
in human breast milk shows the potential for (dermal) absorption and bioconcentration in
aquatic species (Hany and Nagel, 1995). No data have been published on more recently
used SSAs such as avobenzene.
1.2. 7. Diagnostic contrast media
There are two basic types of contrast agents used; one type is based on barium sulfate, the
other type on iodine. Triiodinated benzene derivatives are widely used as X-ray contrast
agents. The preferential uptake of triiodinated compounds in specific organs enhances the
contrast between those organs and the surrounding tissues and enables the visualization of
organ details which otherwise could not be investigated. The compounds may be bound
either as an organic (non-ionic) compound or as an ionic compound. Ionic agents were
developed first and are still in widespread use depending on the examination they are
required for. Most commonly used X-ray contrast media are: Diatrizoate (Hypaque 50),
Metrizoate (Isopaque Coronar 370), Ioxaglate (Hexabrix), Iopamidol (Isovue 370), Iohexol
(Omnipaque 350), Iopromide, Iodixanol (Visipaque 320) (Putschew et al ., 2000). These
contrast media are applied by intravenous injection and are rapidly eliminated via urine or
faeces. Due to the high hydrophicity of the substituted benzene derivatives (Log Kow = -2)
they pass wastewater treatment plants without any cleavage and thus, are found in rivers,
lakes and even raw drinking water (Putschew et al., 2000; Daughton and ternes, 1999). The
contrast agent diatrizoate occurs with concentrations up to 5.2 g/L as is iopromide found in
concentrations up to 5.7 g/L in effluents of WWTPs, (Ternes et al., 2003). These are the
most abundant and most used iodated contrast media (ICMs). In specific effluents of WWTPs
near hospitals, the concentrations of ICMs can be much higher (up to 1200 g/L), (Schrap et
al., 2002).

Literature Review Chapter I
20
Secondary treatment and introduction of oxidation steps only enhance the removal
efficiency of these iodated agents in a limited way. Even with a 15 mg/L ozone dose, the
ionic diatrizoate only exhibited removal efficiencies not higher than 14%, while the non-ionic
ICM (diatrizoate, iopamidol, iopromide and iomeprol) were removed to a degree of higher
than 80%. Advanced oxidation processes (e.g. O3/H2O2), which were nonoptimized for
wastewater treatment, did not lead significantly to a higher removal efficiency for the ICM
than ozone alone. It is interesting to note the high variation of the influent concentrations
for iopromide: the fact that the influent load in a WWTP serving 120,000 population
equivalents can vary by more than a factor of seven from one 24 h composite sample to the
next suggests that most of this compound is emitted irregularly by a small number of point
sources (Jossa et al., 2005). The metabolites of these contrast media have not been
identified yet. The evaluation of the ecotoxicity of triiodinated contrast agents must include
the transformation products. No environmental risk has to be expected from the triiodinated
contrast media itself, Steger-Hartmann et al., 1999), but the metabolites may have an
ecotoxicological impact. Most likely, the transformation products carry free amino groups,
which might be mutagenical, thus, identification of the transformation products is very
important (Kalsch, 1999).
1.3. Sources, pathways and fates the PPCPs
After a chemical is created, the route that it takes between initial observation and final
observations is referred to as a pathway. Common pathways include manufacture to initial
use, initial used to disposal and initial use to release to the environment. The result of
interactions between a chemical compound and its environment over a series of events and
procedures is known as its fate. Even though a number of research publications have been
focused on the occurrence, fate, and effects of pharmaceuticals in the environment, we have
data on the occurrence of only 10% of the registered active compounds, and very little
information on their effects in the environment. There is even less information regarding the
occurrence and fate of the transformation/degradation products (active or not) of
pharmaceuticals. Both the qualitative and the quantitative analysis of pharmaceuticals in the
environmental matrices are definitely a starting point for the establishment of new
regulations for the environmental risk assessment of pharmaceutical products. Discharge of
PPCPs can occur from domestic wastewater, hospital wastewaters or industrial discharges.

Literature Review Chapter I
21
Hospitals are important sources of these compounds: a great variety of micro contaminants
result from diagnostic, laboratory and research activities on one side and medicine excretion
by patients on the other. They include active principles of drugs and their metabolites,
chemicals, heavy metals, disinfectants and sterilizants, specific detergents for endoscopes
and other instruments, radioactive markers and iodinated contrast media. But hospitals are
not the only source: residues of pharmaceuticals can be found in all wastewater treatment
plant (WWTP) effluents, due to their inefficient removal by conventional systems
(Kummerer, 2001; Petrovic et al., 2003; Carballa et al., 2004; Onesios et al., 2009).
Despite their specific nature, quite often hospital effluents are considered to be of the same
pollutant load as urban wastewaters (UWWs) and are discharged into public sewer
networks, collected to a WWTP and co-treated with UWWs. Before entering into the
municipal sewer, chlorination is sometimes required for the whole hospital wastewater flow
rate, sometimes only for the effluent from infectious disease wards (Emmanuel et al., 2004).
PPCPs eventually enter wastewater treatment plants (WWTP). During wastewater
treatment, a distribution occurs between the dissolved and solid phases. Influent suspended
solids are largely removed through primary clarification. The separation is relevant for the
most lipophilic compounds. As a result, non-degraded PPCPs will be discharged into the
environment not only through the final effluent of the plant, but also with biosolids. (Kinney
et al., 2006) showed that organic wastewater contaminants could be detected in the target
biosolids with high occur frequency and high concentration, which suggests that biosolids
can be an important source of organic wastewater contaminants to terrestrial environment.
(Xia et al., 2005) indicated that the PPCPs that enter wastewater treatment plants can
undergo partial or complete transformation and by-products can be discharged to the
environment in the final effluent or through biosolids being applied to land. One of the main
sources of emerging contaminants is untreated urban wastewater and effluents from
wastewater treatment plants. Most current wastewater treatment plants are not designed
to treat these compounds. (Heberer et al., 2002) identified diclofenac as one of the most
important pharmaceuticals in the water cycle, with low mg/L concentrations in both row and
treated wastewater (3.0 and 2.5 mg/L at the influent and effluent, respectively). Atenolol,
metoprolol, and propranolol have been frequently identified in wastewaters, where atenolol
was detected in the highest concentrations, in some cases ranging up to 1 mg/L. As a result

Literature Review Chapter I
22
of the incomplete removal during conventional wastewater treatment, these compounds
were also found in surface waters in the ng/L to low mg/L range (Ternes et al., 1998).
Antibiotics are destined to treat diseases and infection caused by bacteria. They are among
the most frequently prescribed drugs for humans and animals in modern medicine. Beta-
lactams, macrolides, sulfonamides, fluoroquinolones, and tetracyclines are the most
important antibiotic groups used in both human and veterinary medicine. High global
consumption of up to 200,000 tons per year (Kummerer, 2003) high percentage of
antibiotics that may be excreted without undergoing metabolism (up to 90%) result in their
widespread presence in the environment (Huang et al., 2001). Unmetabolized
pharmaceutically active forms of antibiotics concentrated in raw sludge may promote the
development of bacterial resistance. Bacteria in raw sludge are more resistant than bacteria
elsewhere (Jones et al., 2004). Many active antibiotic substances were found in raw sewage
matrices, including both aqueous and solid phase. Sulfonamides, fluoroquinolone, and
macrolide antibiotics show the highest persistence and are frequently detected in
wastewater and surface waters (Huang et al., 2001). Sulfamethoxazole is one of the most
detected sulfonamides (Brown et al., 2006; Yang et al., 2005) that was reported with various
concentrations and up to ca. 8mg/L (in raw influent in China) (Peng et al., 2006).
Sulfamethoxazole is often administrated in combination with trimethoprim, and commonly
analyzed together (Gobel et al., 2005). The class of tetracyclines, widely used broadspectrum
antibiotics, with chlortetracycline, oxytetracycline, and tetracycline as mostly used, was
detected in raw and treated sewage in many studies in the ng/L (Kim et al., 2005) to mg/L
concentrations (Yang et al., 2003). Tetracyclines and fluoroquinolones form stable
complexes with particulates and metal cations, showing the capacity to be more abundant in
the sewage sludge (Alexy et al., 2004; Daughton et al., 1999). Some of the most prescribed
antibiotics—macrolides clarithromycin, azithromycin, roxithromycin, and dehydro-
erythromycin were found in various environmental matrices in a variety of concentrations
from very low ng/L to few mg/L (Gobel et al., 2005; Karthikeyan et al., 2006).
While antiepileptic carbamazepine is one of the most studied and detected pharmaceuticals
in the environment, there is not much information on the occurrence and fate of other of
psychoactive drugs in WWTPs. Carbamazepine is one of the most widely prescribed and very
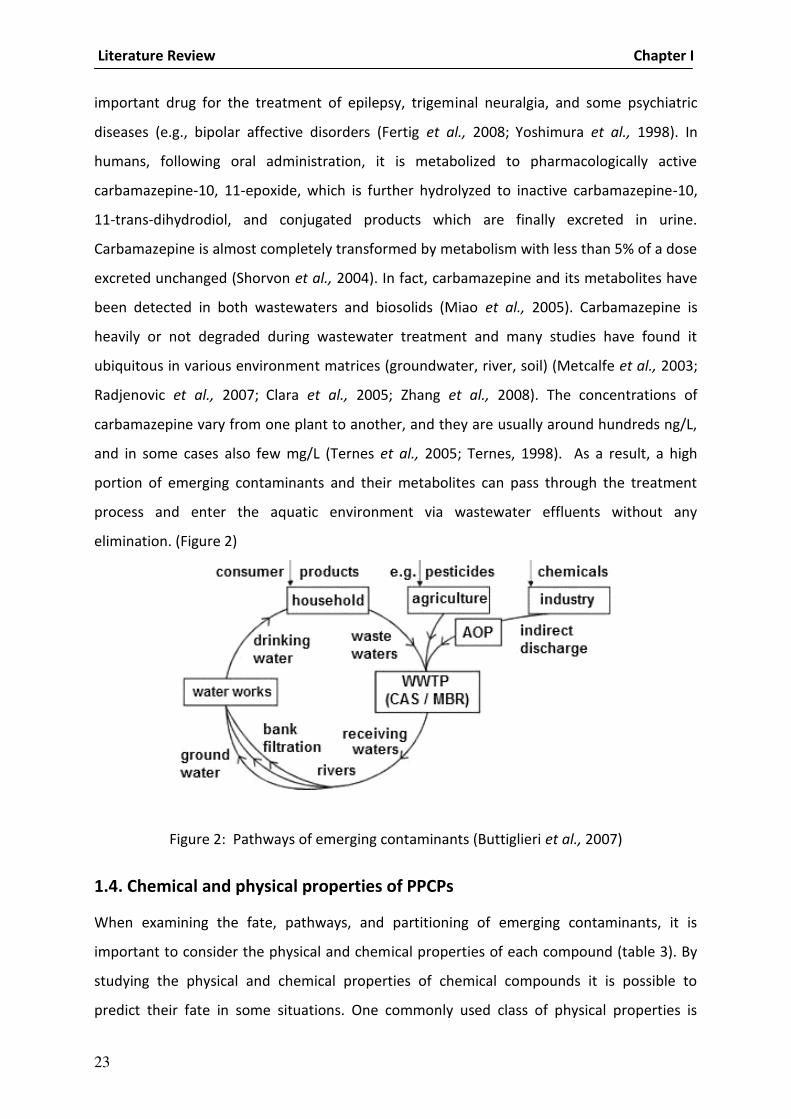
Literature Review Chapter I
23
important drug for the treatment of epilepsy, trigeminal neuralgia, and some psychiatric
diseases (e.g., bipolar affective disorders (Fertig et al., 2008; Yoshimura et al., 1998). In
humans, following oral administration, it is metabolized to pharmacologically active
carbamazepine-10, 11-epoxide, which is further hydrolyzed to inactive carbamazepine-10,
11-trans-dihydrodiol, and conjugated products which are finally excreted in urine.
Carbamazepine is almost completely transformed by metabolism with less than 5% of a dose
excreted unchanged (Shorvon et al., 2004). In fact, carbamazepine and its metabolites have
been detected in both wastewaters and biosolids (Miao et al., 2005). Carbamazepine is
heavily or not degraded during wastewater treatment and many studies have found it
ubiquitous in various environment matrices (groundwater, river, soil) (Metcalfe et al., 2003;
Radjenovic et al., 2007; Clara et al., 2005; Zhang et al., 2008). The concentrations of
carbamazepine vary from one plant to another, and they are usually around hundreds ng/L,
and in some cases also few mg/L (Ternes et al., 2005; Ternes, 1998). As a result, a high
portion of emerging contaminants and their metabolites can pass through the treatment
process and enter the aquatic environment via wastewater effluents without any
elimination. (Figure 2)
Figure 2: Pathways of emerging contaminants (Buttiglieri et al., 2007)
1.4. Chemical and physical properties of PPCPs
When examining the fate, pathways, and partitioning of emerging contaminants, it is
important to consider the physical and chemical properties of each compound (table 3). By
studying the physical and chemical properties of chemical compounds it is possible to
predict their fate in some situations. One commonly used class of physical properties is

Literature Review Chapter I
24
partitioning coefficients. Partitioning refers to the tendency of a chemical to concentrate in
one phase of a two-phase mixture at equilibrium. The mixture can be two liquid phases, a
liquid and a solid phase, a liquid and a gas phase, or a combination thereof. A partitioning
coefficient is the dimensionless ratio of concentrations present in the two different phases
of a two-phase mixture. The octanol-water partitioning coefficient is a measure of the
partitioning between octanol and water, which describes the hydrophobicity of a compound
and is inversely related to the solubility of a compound in water. Compounds with a high
Kow have been shown to preferentially adsorb to soil and sediment particles in water
(Karickhoff et al., 1979).
Similarly, a sludge adsorption coefficient or Kd, is a ratio of the amount of compound
adsorbed to sludge compared to the amount present in aqueous solution under the specific
conditions the measurement was taken. In water and wastewater treatment, the sludge
adsorption coefficient is commonly used to predict the extent to which a compound can be
removed by physical adsorption to sludge particles in a primary or secondary clarification
unit. A commonly use chemical property is the acid dissociation constant of Ka. It is a
measure of the strength of an acid in solution and is the concentration ratio of ionized to un-
ionized species of a compound at equilibrium. The Ka of a compound enables the
concentration of ionized or un-ionized versions of a chemical to be calculated for a given pH.
Due to the large range in magnitudes of Kas, the logarithmic constant (pKa) is commonly
used.

Literature Review Chapter I
25
Table 3: Physical and Chemical Properties of Selected Emerging Contaminants
1.5. Problematic statement and toxicity of hospital wastewater to the
environment
In 2011, the World Health Orga izatio pu lished a report e titled Phar a euti als i
drinking- ater hi h re ie s the risks to hu a health asso iated ith e posure to tra e
concentrations of pharmaceuticals in drinking-water. But, the effect and hazard of emerging
contaminants to public health and environment are poorly understood. Human and
veterinary applications are the main sources of PPCPs in the environment that are
introduced primarily through excretion and the subsequent transport in sewage, whereas
direct disposal of unwanted or expired drugs in the sewage is believed to be of minor
importance (Heberer, 2002a). These chemicals are designed to have a specific mode of
Compound or class Molecular Weight
(g/mol)
Acidity constant
(Pka)
Octanol- water
Coeffcient
(log Kow)
Water
solubility
(mg/L) at 25C°
Beta Blockers Sotalol 272,4 9.5 0.24 137
Atenolol 266.3 9.2 0.16-0.46 13,3 Metoprolol 267.4 9.7 1.69-1.88 4,78
Propranolol 259.3 9.45 3.48-3.03 70 Disinfectants
Triclosan 289.5 7.9 4.8 2- 4.9 Triclocarban 315.6 12.7 4.3 0.6-1.5 Antidepressants
Venlafaxine 277.41 9.24 0.43 - O-desmeth ylvenlafaxine 263.38 9.74 0.74 - Citalopram 324.4 9.5 3.74 - desmethylcitalopram 310.37 10.5 - - Musks
Musk ketone 294.3 - 4.3 1.9
Musk xylene 297.3 - 4.9 0.49 Galaxolide 258.4 - 5.9 - Tonalide 258.4 - 5.7 - Antibiotics
Erythromycin 733 8.9 3.06 2000 Pharmaceuticals
Naproxen 230.3 4.2 3.18 5.11 Carbamazepine 13.9 2.25 -
Ibuprofen 206.3 4.9 3.5 -
Estrogens
Estrone 270.4 10.7 3.13 800 Bisphenol A 228.3 10.3 2.2-3.4 120 Perfluorinated Compounds
Perfluorooctanoate 414.0 3.8 6.3 - PBDEs - 4-10.9 - -
Literature Review Chapter I
26
action, and they have varying persistence in the body. These features among others suggest
that it is important to evaluate the effect of pharmaceuticals on aquatic flora and fauna.
PPCPs in the environment lately have been acknowledged to constitute a major health risk
for humans and members of terrestrial and aquatic ecosystems (Bendz et al., 2005).
Ecotoxicity of emerging contaminants can be divided in to two aspects: acute and chronic.
The present research indicates that LC50 or EC50 concentrations for PPCPs such as
fluoxetine and diazepam are approximately 100 times greater than commonly observed
environmental concentrations. There is a general lack of chronic toxicity data on
pharmaceuticals, in particular in fish. Many pharmaceuticals need more investigation to
determine potential long-term ecotoxicological effects, particularly with respect to potential
disturbances in hormonal homeostasis (endocrine disruption), immunological status, or gene
activation and silencing during long-term exposure (Fent et al., 2006). Many PPCPs do not
exhibit an acute aquatic toxicity but have a significant cumulative effect on the metabolism
of nontarget organisms (Halling-Sorensen et al., 1998) and the ecosystem as a whole
(Daughton and Ternes, 1999). Many endocrine disruptors induce serious effects in low
concentrations (Heberer, 2002a; Halling-Sorensen et al., 1998; Jorgensen and Halling-
Sorensen, 1998) but also individual PhCs occurring in low concentrations may exhibit
synergistic and cumulative effects. In addition, the development of antibiotic resistance may
be stimulated in bacteria from exposure to low concentrations (Jorgensen and Halling-
Sorensen, 1998). (Baquero et al., 2008; Kummerer, 2004) investigated that HWW is a source
for undesirable constituents, such as (multi-)antibiotic-resistant bacteria. According to the
Centers for Disease Control and Prevention, about 2 million people in hospitals get infections
each year, which cause 90,000 deaths. Of these, more than 70 percent of the bacteria that
causes these infections are resistant to at least one common antibiotic that is typically used
to treat them.
(Emmanuel, 2001) was confirmed that the hospital effluents have generally a very weak
microbiological load resulting from the regular use of disinfectants. These bactericides can
have a negative influence on the biological processes of the WWTP. Even by considering that
these effluents are diluted after their discharge towards the municipal WWTP, it remains
evident that it is not necessary to neglect the possibility that certain substances present in

Literature Review Chapter I
27
the WWTP effluents can generate by cumulative effect a biological imbalance in aquatic
ecosystem. To protect the natural environment against the phenomenon of excess load in
the processes of the WWTP, it seems important to consider upstream treatments of hospital
wastewater before their discharge in the municipal sewage system. As a result, it has been
suggested in some studies that pre-treatment of HWW prior to discharge into the sewers
provides a reasonable solution (Gautam et al., 2007; Lenz et al., 2007b; Pauwels and
Verstraete, 2006).
Literature Review Chapter I
28
2. Removal of Pharmaceutics Compounds by Treatment
Technologies
2.1. Removal mechanism
2.1.1. Volatilization
Volatilization was an important removal mechanism for the low-molecular weight
compounds in the basins; between 30 and 70% of the chlorinated benzenes and 1- and 2-
carbon halogenated organic compounds were removed in this way (Yu et al., 2006). The
process converts a chemical substance from a liquid or solid state to a gaseous or vapour
state. The fraction of compound volatilized in the aeration tank depends on the flow of air
getting in contact with wastewater (Qair), type of aeration and Henry coefficient (H), as
shown in Eq. 1 (Suarez et al., 2008).
C soluble. H. Q air H. Q air
Ø = –––––––––––––––––––––––––––––––––––––– = –––––––––––––– (Eq.1) C soluble + C soluble. H. Q air + C soluble .K d. SS 1+H.Q air +K d. SS
Considering about the typical aeration rate and the Henry coefficient of selected PPCPs, the
removal for ADBI due to volatilization is quite significant, but is negligible for
pharmaceuticals, estrogens, AHTN, and HHCB.
2.1.2. Sorption
Solid-Water distribution coefficient is commonly used to determine the fraction of PPCPs
sorbed sludge solute is introduced into any two phase system, such as soild/water,
distribution coefficient (Kd, L/kg) is calculated as the ratio of the concentration of the PPCPs
in one phase to the concentration of the PPCPs in the other phase under equilibrium
conditions (Eq.2) (Ternes et al., 2004)

Literature Review Chapter I
29
Csorbed
Kd= ––––––––––– (Eq.2)
SS. Csoluble
Where C sorbed is the sorbed PPCP concentration onto sludge ( g/L), C soluble the dissolved
concentrate on of the compound ( g/L) and SS the suspended solids concentration (kg/L).
There are two main sorption mechanisms influenced by distribution coefficient:
Absorption: It is a process refers to the hydrophobic interactions of the aliphatic and
aromatic groups of a compound with the lipophilic cell membrane of the microorganisms
and the lipid fractions of the sludge. The lipophilicity of substances is related to the octanol-
water partition coefficient (Kow). Polycyclic musk fragrances (galaxolide, tonalide, and
Celestolide) are the most common lipophilic compounds among PPCPs.
Adsorption: it is the process of accumulating substances that are in solution on a suitable
interface. Electrostatic interactions of positively charged groups of chemicals with the
negatively charged surfaces of the microorganisms force ions and molecules to bind on the
surface or another molecule. Therefore, the tendency of a substance to be ionized or
dissociated will influence the efficiency of adsorption. The degree of ionization or
dissociation could be characterized by dissociation constant (Ka). In general, cationic species
of PPCPs will be more intend to be adsorbed due to Van der Waals interactions, and
negatively charged molecules will not be adsorbed. The sorption coefficient (Kd), pseudo
first-order degradation constant (kbiol), and octanol-water partition coefficient (Kow) values
of emerging contaminants frequently found in wastewater treatment plants are given in
Table (3). According the statement above, both octanol-water partition coefficient (Kow) and
dissociation constant (Ka) could affect the sorption intendancy of PPCPs. Comparing the
properties of selected PPCPs, several phenomena could be illustrated as following: (1)
Polycyclic musk fragrances (HHCB, AHTN, ADBI) have high log Kd values (33.3-3.9), which
consist with their low solubility in water. The strong lipophilic character could be indicated
by high log Kow values (4.6-6.6). (2) Compared with musk fragrances, the selected hormones
in Table 3 have both lower log Kow values (2.8-4.2) and sorption coefficients (log Kd of 2.3-
2.6). Therefore, they have weaker interaction with sludge. (3) The sorption capacity of the

Literature Review Chapter I
30
antibiotic trimethoprim (TMP) is similar to that of the previously cited hormones, although in
this case the interaction with sludge is mainly driven by adsorption, since this compound is
not lipophilic, but at circumneutral pH the dicationic species of TMP account for
approximately 50% of the total TMP concentration (Suarez et al., 2008).
(Park et al., 2009), but no clear correlation has yet been found due to the great variability of
compounds and their behaviour. Thus, graphs plotting the percentage removal rate vs.
molecular weight or vs. log Kow yield clouds of data, showing a wide variability in the
behaviour of the substances considered. For instance, some pharmaceuticals contain planar
aromatic structures, which favour intercalation, for example into the layers of some clay
minerals. Therefore, the sorption of such compounds depends not only on the log Kow,
which is the lipophilicity of the sorbed molecule, but is also governed by pH, redox potential,
stereochemical structure and the chemical nature of both the sorbent and the sorbed
molecule (Kummerer, 2009). Experimental data on PPCPs concentration in sludge are very
rare. The possible reason of that could be the difficulty of analysis these compounds
precisely in sludge. To overcome this problem, distribution coefficient (Kd) seems to be a
useful tool to predict distribution between solid and water phases. However, since Kd is
influenced wastewater farm by several parameters, such as the characteristics of the solid
phase (organic carbon content, particle size), and experimental conditions in which sorption
is studied (sorbate and sorbent concentrations, pH, salinity, ions content), an accurate
determination of this coefficient under several environmental conditions is needed (Carballa
et al., 2007).
2.1.3. Biological degradation
During biological degradation in wastewater treatment plants, pharmaceutical contaminants
may be transformed into either more hydrophobic compounds, which could be adsorbed
onto the solid surface of the activated sludge, or more hydrophilic compounds, which
remain in the liquid phase and will eventually be discharged into aquatic environment. Even
there are various groups of microorganisms in the activated sludge, it is unlikely that
pharmaceuticals present as micro contaminants in wastewater can be effectively removed
by biodegradation alone for three reasons. First, compared with other pollutants in
wastewater, pharmaceutical contaminants have relatively low concentration, which may be

Literature Review Chapter I
31
insufficient to induce enzymes that are capable of degrading pharmaceuticals. Second, since
many of the pharmaceutical contaminants are bioactive and this characteristic can inhibit
metabolism of microorganisms. As result, it is impossible that pharmaceutical contaminants
can be used as favourable carbon or energy sources by microorganisms.
Third, the nature of each compounds and the operating condition of wastewater treatment
plant will influence the performance of biodegradation.
(Joss et al., 2006) conveyed a research using activated sludge to investigate the
biodegradation of 25 pharmaceuticals, hormones and fragrances, including antibiotics,
antiphlogistic, contrast agent , lipid regulator, and nootoropics, in batch experiments at
typical concentration levels in a municipal wastewater treatment. He indicated that only a
few compounds, which were ibuprofen, paracetamol, 17β-estradiol, and estrone, could be
degraded by more than 90%, while half of the target compounds were removed by less than
50%. Joss also determined pseudo first-order degradation kinetics (kbiol) for all target
compounds down to ng/L levels.
Figure 3: Kinetic degradation constant of 35 pharmaceuticals, hormones, and personal care
products. (Joss et al., 2006)
Figure sho s the degradatio o sta t k iol of PPCPs o ser ed i Joss s stud .
According to the degradation constant (kbiol) of target compounds, the contaminants could

Literature Review Chapter I
32
be divided into three groups: (1) highly degradable, with Kbiol>10 Lg-1SSday-1, such as
paracetamol; (2) hardly degradable, with Kbiol<0.1 Lg-1SSday-1, such as carbamazepine; (3)
moderate degradable, with 0.1 < Kbiol<10 Lg-1SS.day-1, such as iohexol. It also seems that
anoxic conditions favour the biodegradation of micropollutants as they promote
biogeochemical reactions. (Park et al., 2009) suggest the necessity for further investigations
into the removal mechanisms of micropollutants via biodegradation under anoxic
conditions. For example, the biological transformation of amide and urea functional groups
(attached to atenolol, carbamazepine, dilantin) via mediated hydrolysis reactions has been
documented (Matamoros et al., 2008).
However, aerobic transformations are generally faster than anaerobic ones for low-
chlorinated compounds, while for polyhalogenated compounds aerobic degradation rates
are slower. Furthermore, highly chlorinated substances, like diclofenac, are known to be
biodegraded via a microbe-mediated reduction (Mohn and Tiedje, 1992; Schwarzenbach et
al., 2003; Matamoros et al., 2007b; Matamoros et al., 2008). These compounds
characterized by their low water solubility, become more soluble, and therefore more bio
available, after some initial reductive dechlorination steps. Under anaerobic conditions,
however, microbial degradation takes time and a subsequent aerobic degradation step is
necessary for breaking down the remaining carbon skeleton. According to (Jones et al.,
2005a), long and highly branched side chains render a compound more persistent, whereas
unsaturated aliphatic compounds are more biodegradable than saturated or aromatic ones
featuring complex ring structures and sulphate or halogen groups.
The Byrns model (Byrns, 2001) concerning xenobiotics degradation shows that at low SRTs,
most of the compounds are removed through sludge discharge. As the SRT increases, the
proportion of sludge wasted from system decreases and higher amount of less polar
micropollutants remain in the system for further degradation.
(Kloepfer et al., 2004a) was confirmed that two MBRs operated at high SRT of 26 d showed
removal efficacy of 43% for benzothiazoles. By varying the SRT in MBRs, (Lesjean et al.,
2005) noticed that the removal of pharmaceuticals residues increased with a high sludge age
of 26 d and inversely decreased at lower SRT of 8 d. (Ternes et al., 2004) demonstrated that

Literature Review Chapter I
33
SRT values between 5 and 15 d are required for biological transformation of some
pharmaceuticals, i.e., benzafibrate, sulfamethoxazole, ibuprofen, and acetylsalicylic acid.
(Urase et a., 2005) identified the pH value as critical parameter affecting the removal of
micropollutants during the MBR treatment, pH value varied from neutral to acidic as
nitrification became significant in the MBR At pH lower than 6, high removal rate (up to
90%) was observed for ibuprofen. Ketoprofen was removed from MBR up to 70% when the
pH dropped down below 5. (Kim et al., 2005) was found that at pH 6–7 tetracycline are not
charged and therefore, adsorption sludge becomes an important removal mechanism.
Studies investigating the removal of pharmaceutics compounds from wastewater have been
conducted. The various treatment technologies have been developed so far for treatment of
hospital wastewater. Some of these treatment technologies include Conventional Activated
Sludge (CAS), Membrane Bio-Reactor (MBR), Fluidized Bed Reactor (FBR), and membrane
bioreactor coupled with granular and powder activated carbon. A brief description of each
technology and their comparative analysis is given below.
2.2. Treatment technologies for hospital wastewaters
2.2.1. Conventional Activated Sludge Process (CAS)
CAS is very old technology. The basic mechanism of activated sludge process treatment is to
use microorganisms to feed on organic contaminants in wastewater, producing a high
quality effluent. The main principle behind all activated sludge processes is that as
microorganisms grow, they form particles that clump together. These particles (floc) are
allowed to settle to the bottom of the tank, leaving a relatively clear liquid free of organic
materials and suspended solids (Metcalf and Eddy, 2003). Screened wastewater is mixed
with varying amounts of recycled liquid containing a high proportion of organisms taken
from a secondary clarifying tank, and it becomes a product called mixed liquor. This mixture
is stirred and injected with large quantities of air, to provide oxygen and keep solids in
suspension. After a period of time, mixed liquor flows to a clarifier where it is allowed to

Literature Review Chapter I
34
settle. A portion of the bacteria is removed as it settles, and the partially cleaned water
flows on for further treatment. The resulting settled solids and the activated sludge are
returned to the first tank as the process continues.
The pollutants can be found in different forms, e.g. particulate, bound to colloids and
dissolved. Depending on the type of pre-treatment a certain amount of pollutants in a
certain form will enter the bioreactor. The treatment was originally designed for removal of
COD and suspended solids. Due to problems with eutrophication of surface waters further
treatment was required which included removal of nutrients like nitrogen and phosphorus.
Next to the nutrients there is a long list of micro pollutants that will have to be removed
from the wastewater. Special attention will have to be paid to the removal of medicine
residues as well as endocrine disruptors, pesticides and heavy metals. A schematic overview
of a typical conventional activated sludge process is presented in (Figure 4).
Figure 4: Schematic overview of a typical conventional activated sludge process
2.2.1.1. Removal of pharmaceutics compounds by Conventional Activated Sludge (CAS)
Municipal wastewater treatment plants were basically designed to remove pathogens and
organic and inorganic suspended and flocculated matter. Even though the new treatment
technologies have been developed to deal with health and environmental concerns
associated with findings of nowadays research, the progress was not as enhanced as the one

Literature Review Chapter I
35
of the analytical detection capabilities and the pharmaceutical residues remain in the output
of WWTPs. (Jelic´et al., 2012).
Ternes (1998) monitored 32 pharmaceutical drugs and 5 metabolites in municipal WWTP
influent and effluent, and in the receiving surface waters. The WWTP monitored in
Frankfurt/Main Germany had three principle treatment steps: preliminary clarification,
secondary aeration with Fe (II) chloride for phosphate elimination, and clarification.
Generally, the WWTP removed greater than 60% of the pharmaceuticals. Only
carbamazepine, clofibric acid, phenazone, and dimethylaminophenazone had lower than
average removal rates. The study did not differentiate whether removal occurred by
sorption or biodegradation. Over 80% of the pharmaceuticals were detectable in at least one
effluent sample. Twenty pharmaceuticals and 4 metabolites were detected in the receiving
surface water. Ternes found mainly the acidic drugs ubiquitously in surface waters in the
nanogram-per-liter range. Acidic drugs include lipid regulators (bezafibrate, gemfibrozil), the
antiphlogistics (diclofenac, ibuprofen, indomethacine, naproxen, phenazone, and the
metabolites clofibric acid, fenofibric acid and salicylic acid) as well as neutral or weakly basic
drugs such as the beta blockers (metoprolol, propranolol), and the antiepileptic drug
carbamazepine. Flocculation with iron (III) chloride showed no significant removal of any of
the five pharmaceuticals tested (Ternes et al., 2002).
Diclofenac (4%)
Clofibric acid (13%)
Bezafibrate (11%)
Carbamazepine (13%)
Primidone (10%)
(Khan and Ongerth, 2004) developed a conceptual model for determining which
pharmaceutical compounds would most likely be found in municipal sewage, as well as their
concentrations. They choose 50 pharmaceuticals based on their prescribing volumes, their
excretion rates, and the type of drug. The model predicted that 29 (58%) of the
pharmaceuticals would be present in the influent at concentrations of greater than or equal
to 1 g/l, and 20 (40%) of the pharmaceuticals would still be present in the wastewater at
concentrations greater than or equal to 1 g/l after secondary treatment.

Literature Review Chapter I
36
(Carballa et al., 2004) conveyed a study researching the removal efficiency of
pharmaceuticals, cosmetics, and hormones in a municipal wastewater treatment plant. The
researchers indicated that although during the primary treatment process, target
compounds were not removed efficiently (ranged from 20 to 50%), the aerobic activated
sludge process caused a significant reduction in all compounds detected, between 30 and
75%, with exception of iopromide, which remained in the aqueous phase. The overall
removal efficiencies of wastewater treatment plant could achieve 80% for galaxolide and
83% for onalide; 65% for ibuprofen, 50% for naproxen, approximately 65% for 17β-estradiol,
and 60% for sulfamethoxazole.
(Joss et al., 2005; Clara et al., 2005) report no significant elimination of diclofenac. In
contrast, (Ternes et al., 1998) observed elimination rates of up to 70%. Removal of
diclofenac might partially attribute to the elimination of sludge during primary treatment
and an enhanced sorption onto sludge during secondary treatment (log Kd2.7) with an
addition of inorganic salts for phosphorus precipitation (Ternes, 1998; Clara et al., 2005a).
The biological degradation of diclofenac is very low (<0.1 l g SS-¹ day-¹) (Joss et al., 2006).
(Joss et al., 2005) observed no evident correlation between the compound structure and
biological removal efficiency. The observed biological removal varied strongly from
compound to compound. Galaxeide were mainly removed by sorption onto sludge with
removal deficiency at least 50%. Ibuprofen is often removed beyond the quantification limit
(>90%); naproxen also shows significant removal (50–80%). Finally, no removal was seen for
Carbamazepine, which consists with other researches (Vieno et al., 2007; Clara et al., 2005).
(Joss et al., 2005; Jones et al., 2006; Nakada et al., 2006; Kreuzinger et al., 2004) confirmed
that Ibuprofen exhibits high value of biodegradation kinetic coefficient in range of 20, 9-35, l
g SS-¹ day-¹. The hydrophilic nature of this substance makes its sorption onto sludge
negligible, which means that the main removal mechanism of ibuprofen is biological
degradation and high removal efficiency of ibuprofen (>90%).
Diclofenac is only barely removable during conventional treatment. The removal rates of
ibuprofen and naproxen are commonly higher than 75% and 50%, respectively (Castiglioni et
al., 2006; Lindqvist et al., 2005). Partial removal was seen for diclofenac (20–40%) and (Clara
et al., 2005; Gomez et al., 2007; Joss et al., 2005; Lindqvist et al., 2005) confirmed that the
diclofenac shows rather low and very inconsistent removal rates, between 0 and 90%. Its

Literature Review Chapter I
37
persistence is attributed to the presence of chlorine group in the molecule. The elimination
of beta-blockers in WWTPs depends on the HRT, which could be a good explanation for the
variable removal reported in the literature. The highest average elimination rates can be
observed for atenolol and sotalol (around 60%). But for the same compounds low removals
were reported as well. (Maurer et al., 2007; Wick et al., 2009) reported removal rates lower
than 30% for sotalol, and (Castiglioni et al., 2006) reported a removal of 10% foratenolol
during the winter months. Concerning hormones, the removal efficiencies of estrone (E1),
17β-estradiol (E2), and 17α-ethinylestradiol (EE2) varied strongly between studies. Different
kinds of behaviours were observed. (1) (Carballa et al., 2004) observed an increase along
wastewater treatment plant. (2) (Clara et al., 2005) indicated that when SRT was higher than
10 days, natural estorgens could achieve around complete removal.
(Nakada et al., 2006) observed a high removal rate (80%) of estrone. High removal
efficiencies reported for E1, E2 and EE2 in activated sludge treatment were observed in the
range of 49–99%, 88–98% and 71–94%, respectively (Andersen et al., 2003; Joss et al., 2004).
(3) In contrast, (Ternes et al., 1999) indicated that there was no significant removal of
hormones. High removal rates were observed with increasing SRT, and the trend was most
obvious for ibuprofen, bisphenol A and estrogen. A possible explanation for the high removal
rates of ibuprofen is elimination in the form of metabolization of hydroxyl Ibrofen and
carboxyl-ibuprofen ( Clara et al., 2004).
(Castiglioni et al., 2006) found that the removal of ranitidine depends on season, and
showed 39% removal in winter and84% in summer. High removal of ranitidine during
activate sludge treatment (89%) was observed in a study of (Kasprzyk-Hordern et al., 2009).
Although there is still no certain research indicating the explanation of these deviations,
some observation can still be made (Suarez et al., 2008). (1) Different temperature of
operation might influence removal efficiency (Ternes et al., 1999; Brown et al., 2006;
Paxeus et al., 2004; Gros et al., 2006) reported that the removal of these antibiotics has been
reported to vary significantly. Due to their limited biodegradability and sorption properties,
sulfonamides and trimethoprim appear to be only partially removed by conventional
wastewater treatment. In case of trimethoprim, only minor removal was noticed during
primary and biological treatment, but the advanced treatment (Gobel et al., 2007) and

Literature Review Chapter I
38
nitrification organisms appear to be capable of degrading trimethorpim (Batt et al., 2006;
Perez et al., 2005). Also macrolide antibiotics are often incompletely removed during
biological wastewater treatment. Studies from different conventional WWTPs have revealed
that the removal of macrolides varied from high but negative values, to around 50% (Gobel
et al., 2007; Clara et al., 2005). Varying removal was reported for fluoroquinolone
antibiotics, as well. (Lindberg et al., 2006) found that norfloxacin and ciprofloxacin were
removed with 78% and 0%, respectively, where around 40% was removed during the
biological treatment. Ciprofloxacin and norfloxacin sorbed to sludge independently of
changes in pH during wastewater treatment, and more than 70% of the total amount of
these compounds passing through the plant was ultimately found in the digested sludge
(Lindberg et al., 2006).
According to (Suarez et al., 2008): the PPCPs could be distinguished into four categories
according to the kbiol and Kd values, and the behaviours of these compounds in biological
treatment:
1) Compounds with high kbiol and low Kd values, such as ibuprofen, could be almost
totally removed through biological degradation, regardless of SRT and HRT.
2) Compounds with low kbiol and low Kd values, such as carbamazepine, could not be
removed nor bio transformed independently of SRT and HRT.
3) Compounds with high kbiol and medium Kd values, such as E2 and E1, are
moderately transformed slightly dependant on SRT.
4) Compounds with low kbiol and high Kd values, such as musk fragrances, are removed
in the aeration tank by sorption and significantly transformed by biological
degradation when the SRT is long enough >10 days).
2.2.2. Membrane Bioreactors (MBR)
The Membrane Bioreactor combines the biological activated sludge process with a
membrane filtration step for sludge water separation. The membrane can be applied within
the bioreactor (submerged configuration) or externally through recirculation. Since external
settlers, or any other post treatment step, become super fluous by using a membrane for
the suspended solid and effluent separation, the required space for an installation is small
and sludge concentration in the aeration tanks can be two to three times higher than in
conventional systems. Furthermore, the effluent quality is significantly better as all

Literature Review Chapter I
39
suspended and colloidal material such as micro contaminants, bacteria and viruses are
removed (Ujang and Anderson, 2000; Trussell et al., 2005). In an MBR, biological processes
are often comparable or better than in conventional activated sludge systems (Ujang et. al.,
2005 a, b and c). Due to the long sludge ages, N-removal is more efficient because the slow
growing autotrophic bacteria are kept efficiently in the system. Denitrification can occur by
introducing anoxic tanks or intermittent aeration (Drews et. al., 2005; Gander et. al., 2000).
(Figure 5) shows a typical MBR system.
Figure 5: Typical membrane bioreactor system (Pombo et al., 2011)
Membrane filtration denotes the separation process in which a membrane acts as a barrier
between two phases. In water treatment the membrane consists of a finely porous medium
facilitating the transport of water and solutes through the membrane. It can be also defined
as a material that separates particles and molecules from liquids and gaseous. The
membrane separation process is based on the presence of semi permeable membrane. The
principle is quite simple: the membrane acts as a very specific filter that allows water to flow
through, while it catches suspended solids and other substances (Figure 6). There are two
factors that determine the effectiveness of a membrane filtration process; selectivity and
productivity. Selectivity is expressed as a parameter called retention or separation factor,
while productivity is expressed as a parameter called flux.

Literature Review Chapter I
40
Figure 6: Schematic shapes for membrane filtration process
2.2.2.1. Types of Membrane Modules
Membranes can be configured into membrane modules in different ways. Depending on the
production process the membrane can be in the form of sheets, hollow fibres and tubes
(Mulder, 1996). Flat sheet membranes are used to construct spiral wound modules or they
can be mounted on a frame, resulting in the plate and frame modules (Figure 7). Tubular
membranes are usually anisotropic membranes with the separating layer at the inside.
Hollow fibre membranes are often isotropic membranes that can be operated inside out or
outside in. Submerged hollow fibres can be oriented horizontally or vertically; for application
in MBR where air scouring is applied, vertical orientation seems favourable (Chang and Fane,
2000) For the treatment of suspensions flat sheet, tubular and capillary membranes (hollow
fibres) are preferred, see also Table 3. In recent years, membrane processes have found
wide application and nowadays membrane processes exist for most of the fluid separations
encountered in industry, (Bowen and Jenner, 1995).
Figure7. Examples of commercially available membranes, applied in cross flow filtration (EVENBLIJ, 2006)

Literature Review Chapter I
41
Table 4: Membrane configurations and application in different separation processes (Baker, 2000)
Membrane configuration Applied in:
RO NF UF MF
Spiral wound x x x
Tubular x x x Hollow fibre Inside - out Hollow fibre outside- x x in Plate and Frame x x
Membrane materials can be organics (polyethylene, polyethersulfone, polysulfone,
polyolefin, etc), inorganic (ceramic) or metallic and they should be inert and non-
biodegradable. Membrane materials should also be easily cleaned and withstand to cleaning
chemicals, high temperature and pressure. Moreover, membrane surface must be neutral or
negatively charged to avoid adsorption of microorganisms (Seung, 2004).
2.2.2.2. MBR Types
According to its position, MBR system can be classified into two major groups: internal
(submerged) and external. Based on the electron acceptor for the biological reaction, the
MBR system can be classified into two groups: aerobic and anaerobic MBR (Seung, 2004).
The first group is the internal (submerged) MBR, in which membrane filtration unit is
integrated into biological reactor to treat and separate biomass (Engelhardt et al., 1998).
Recently, this type of MBR has become a promising alternative to the conventional
treatment, thus it has been developed to simplify the system and reduce the operational
cost (Darren et al., 2006). The driving force across the membrane in the submerged MBR is
achieved by creating a negative pressure on the permeate side of the membrane unit
(Yamamoto et al., 1989 and Chiemchaisri et al., 1993). Despite, the popularity of submerged
MBR and its capability to treat high strength wastewater, it is still prevented by the obstacle
of membrane fouling, which causes declining permeate flux and increasing MBR operation
costs.
The second group, is the external MBR, in which, the mixed liquor is recirculated through a
membrane filtration unit. The driving force in external MBR is the pressure obtained by high
cross flow velocity through the membrane filtration unit. Although, the high cost of mixed

Literature Review Chapter I
42
liquor recirculation in external MBR, higher effluent fluxes, easier maintenance and less
complicated configuration make it desirable (Seung, 2004). Figure 4 (pombo et al., 2006),
simply shows the two types of MBR.
A. Aerobic MBR
The aerobic MBR has been applied quite widely to domestic, municipal wastewater
treatment instead of the conventional activated sludge system (Gander et al., 2000;
Jefferson et al., 2000; Ueda and Hata, 1999 and Murakami et al., 2000). (Darren et al., 2005)
reported that, their laboratory-scale aerobic MBR system managed to remove 98% of the
suspended solid and achieving a remarkable COD removal efficiency of 96% in treating high
strength synthetic wastewater. However, phosphorus removal in MBR varied from 12%
(Cote et al., 1997) to 74% (Ueda and Hata, 1999). The concentration of the MLSS is reported
to be 10 g/l in some analyses.
B. Anaerobic MBR
Although, the disadvantages of anaerobic MBR such as lower growth rate, high MLSS
concentration requirement and long HRT to prevent the biomass from washout, there are
advantages of the anaerobic MBR over the aerobic one, which are biogas recovery, lower
sludge production and lower energy consumption regarding to the absence of aeration
process (Seung, 2004). Although, anaerobic MBR to date is less explored than aerobic MBR,
it is a promising system for different strength wastewater treatment with simultaneous
energy recovery and less excess sludge production (Dongen et al., 2004).
2.2.2.3. MBR Performance in treating the organic pollutants
Low sludge production was observed in the MBR processes because of limited energy source
(Witzig et al., 2002), mechanical shear caused by pumping (Choo and Lee, 1996; Kang et al.,
2002; Kim et al., 2001), or attachment on to the surface of membrane (Choo and Lee, 1996).
In addition, the sludge age also influences the biomass production. Chaize and Huyard (1991)
demonstrated that sludge production was greatly reduced if the sludge age is between 50
and 100 days. The performance of MBR process has been shown to be satisfactory for at
least two months when the sludge is completely retained (Chiemchaisri et al., 1993).
However, it is unclear if the accumulation of inert material has a negative effect on the

Literature Review Chapter I
43
treatment performance. The ratio of VSS to total suspended solids (TSS) in MBR MLSS was
reported in the range of 0.46 – 0.55 (Seung, 2004), which is much lower than the 0.75 – 0.90
observed in activated sludge MLSS.
The MBR system is capable of achieving COD removal by both physical and biological
mechanisms. The biological COD removal occurs in the bioreactor. The biological COD
removal efficiency can be calculated from the difference of soluble CODs in the feed and the
mixed liquor divided by soluble COD in the feed (Ng et al., 2000). The membrane filter offers
the physical barrier against particulates and some soluble organic carbon and inert fractions
of the mixed liquor (Chang et al., 2001). The biological COD removal increases with time, but
the physical COD removal by membrane decreases over time because of the age of the
membrane and sloughing of some biomass on permeate side of the membrane (membrane
fouling). Chang et al. (2000) proposed the mechanisms of COD removal by membrane to be
due to three mechanisms; sieving method depending on membrane pore size and cutoff,
adsorption into membrane pores and surface, and sieving and/or adsorption onto the cake
layer, because of this physical removal, the COD concentration in the effluent become lower
(Chaize and Huyard, 1991). The difference between the membrane permeate COD and the
mixed liquor soluble COD indicates that a fraction of soluble COD components, probably
microbial metabolic matter with a relatively large molecular weight, could be removed by
the membrane together with biomass (Seung, 2004). The COD concentration also can be
reduced by gas production under anaerobic conditions (Anderson et al., 1986; Choo and Lee,
1996; Kang et al., 2002). The changes in HRT and SRT do not significantly influence the COD
removal in the MBR. The effect of high temperature on the removal efficiencies in MBR was
studied by (Zhang et al., 2006). (Wen et al., 2004) investigated the performance of a
submerged membrane bioreactor for treatment of a hospital wastewater. The bioreactor
was operated at the conditions of 7.2 h HRT, NH4+-N with average 17.7 mg/L and COD range
from 49 to 278 mg/L. They found that the removal efficiency for COD, NH4 +-N and turbidity
was 80, 93 and 83%, respectively. The bacteria removal was greater than 98% and the
effluent had no colour and odour.
The high nitrification can be observed in the aerobic MBR because membrane separation
entirely confines the nitrifying bacteria within the bioreactor independent of sludge
concentration. In addition, as sludge production is low in MBR, nitrifying bacteria face less

Literature Review Chapter I
44
competition from heterotrophic bacteria, which also consume ammonia. (Cote et al., 1997)
reported that ammonia removal efficiency was improved by increasing the sludge age from
10 days to 50 days. (Xing et al., 2002) observed a high nitrification rate at 3.75 hours of HRT
and 5 days of SRT.
2.2.2.4. Membrane Operation Parameters
Transmembrane pressure, flux and resistances
The transmembrane pressure is the driving force behind the filtration process. (Equation 3)
can be used to predict the permeate flux that remains proportional to hydraulic resistance
for porous membrane system. The flux is the quantity of materials passing through a unit
area of membrane per unit time and can be determined by both the driving force and the
interfacial region adjacent to it. Under the simplest operating conditions, the resistance to
flow is offered entirely by the membrane.
∆P
J = ––––––– Eq. 3 µRt
Where J: permeate flux (L/m2.h)
ΔP: transmembrane pressure (kPa)
: Viscosity of the permeate (Pa.s); (For example; Viscosity at 30ºC = 0.798*10-3 N.s/m2)
when Pa = N/m2
Rt: total resistance (1/m): Rt = Rm + Rc + Rf
Rm: intrinsic membrane resistance
Rc: Cake resistance from by the cake layer (reversible fouling)
Rf: fouling resistance caused by solute adsorption into the membrane pore and gel
formation (irreversible fouling).
All resistances shown in Equation 2.1 can be measured through a series of filtration
experiments by comparing pure water filtration, sludge filtration, and pure water filtration
after cake removal. However, the resistances are dependent on a number of experimental
conditions, such as biomass characteristic, membrane material and temperature. (Figure 8)
shows a relationship between transmembrane pressure and flux. It is observed that the

Literature Review Chapter I
45
higher the transmembrane pressure and the flux, the faster the particles deposit on the
membrane surface and to form a cake, then the flux is independent of the transmembrane
pressure and remains constant. (Günder, 2001)
Figure 8: Relationship between transmembrane pressure and flux (Günder, 2001)
2.2.2.5. Membrane fouling
Several definitions of fouling can be found in literature. A broad definition is given by
Cher a , Fouli g a ifests itself as a de li e i flu ith ti e of operatio , a d i its
strictest sense the flux decli e that o urs he all operati g para eters … are kept
o sta t . Lojki e a d o orkers also lea e out short ter phe o e a, a d defi e it
so e hat differe t: Fouli g is a la ket ter used to o er the ph si o he i al auses of
flux decline, which are NOT re ersed he the tra s e ra e pressure is rela ed Lojki e
et al., 1992). Different fouling mechanisms may occur during cross flow membrane
filtration, some of which were mentioned before (Figure 9) (vanden Berg and Smolders,
1990):

Literature Review Chapter I
46
Figure 9. Fouling mechanisms in a membrane filtration (Radjenovic et al., 2008)
Pore blocking
Particles enter the pore and get stuck in its opening, reducing the number of pore
channels available for permeation.
Pore narrowing, e.g. by adsorption. Substances and/or particles enter the pores and
are adsorbed to the pore wall, thus narrowing the pore channel, reducing the
permeate flow.
Gel or Cake layer formation. Particles and macromolecules accumulate at the
membrane surface, forming a more or less permeable layer. When its constituents
are non-interacting, the cake layer may disappear when TMP is released or cross flow
in increased. If there is an interaction the particles may form a cohesive gel layer,
which is difficult to remove. In both cases the fouling mechanism will lead to an
increase in total filtration resistance.
Since suspended solid are totally eliminated through membrane separation, the settle
ability of the sludge, which is a problem in conventional activated sludge, has absolutely no
effect on the quality of the treated effluent. Consequently, the system is easy to operate
and maintain.
The major advantages of the membrane separation bioreactors are:
Sludge retention time (SRT) is independent of hydraulic retention time (HRT).
Therefore a very long SRT can be maintained resulting in complete retention of
slowly growing microorganisms, such as nitrifying bacteria, in the system.
The overall activity level can be raised since it is possible to maintain high
concentrations in bioreactors while keeping the microorganisms dispersed as long as
desired and as a result, reactor volume will be reduced. In addition, the system
requires neither sedimentation nor any post-treatment equipment to achieve
reusable quality water, so the space saving is enormous.
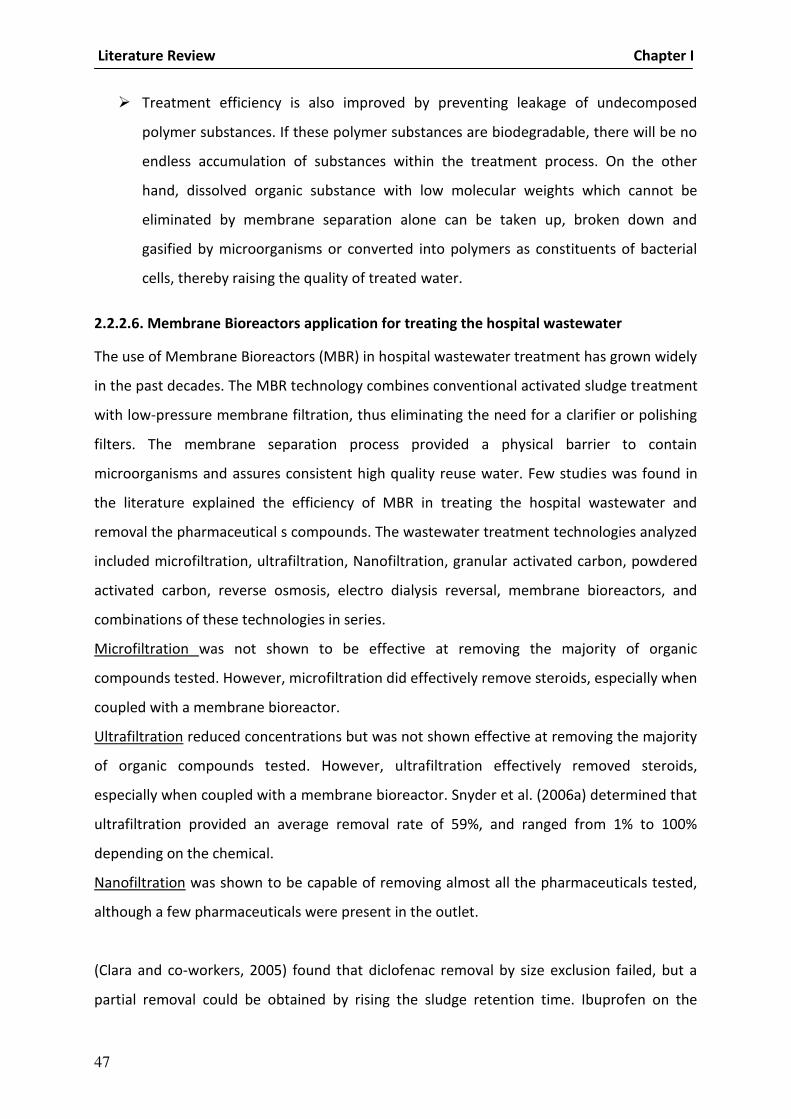
Literature Review Chapter I
47
Treatment efficiency is also improved by preventing leakage of undecomposed
polymer substances. If these polymer substances are biodegradable, there will be no
endless accumulation of substances within the treatment process. On the other
hand, dissolved organic substance with low molecular weights which cannot be
eliminated by membrane separation alone can be taken up, broken down and
gasified by microorganisms or converted into polymers as constituents of bacterial
cells, thereby raising the quality of treated water.
2.2.2.6. Membrane Bioreactors application for treating the hospital wastewater
The use of Membrane Bioreactors (MBR) in hospital wastewater treatment has grown widely
in the past decades. The MBR technology combines conventional activated sludge treatment
with low-pressure membrane filtration, thus eliminating the need for a clarifier or polishing
filters. The membrane separation process provided a physical barrier to contain
microorganisms and assures consistent high quality reuse water. Few studies was found in
the literature explained the efficiency of MBR in treating the hospital wastewater and
removal the pharmaceutical s compounds. The wastewater treatment technologies analyzed
included microfiltration, ultrafiltration, Nanofiltration, granular activated carbon, powdered
activated carbon, reverse osmosis, electro dialysis reversal, membrane bioreactors, and
combinations of these technologies in series.
Microfiltration was not shown to be effective at removing the majority of organic
compounds tested. However, microfiltration did effectively remove steroids, especially when
coupled with a membrane bioreactor.
Ultrafiltration reduced concentrations but was not shown effective at removing the majority
of organic compounds tested. However, ultrafiltration effectively removed steroids,
especially when coupled with a membrane bioreactor. Snyder et al. (2006a) determined that
ultrafiltration provided an average removal rate of 59%, and ranged from 1% to 100%
depending on the chemical.
Nanofiltration was shown to be capable of removing almost all the pharmaceuticals tested,
although a few pharmaceuticals were present in the outlet.
(Clara and co-workers, 2005) found that diclofenac removal by size exclusion failed, but a
partial removal could be obtained by rising the sludge retention time. Ibuprofen on the
Literature Review Chapter I
48
other hand was removed to a high degree (> 90%). Carbamazepine was not removed at all.
In contrast to (Clara et al., 2005 a) study by (Radjenovic et al., 2007) indicated a better
pharmaceutical removal in some cases (Diclofenac removal of 87.4% in MBR compared to
50.1% in conventional treatment; Metoprolol removal 58.7% compared to 0%; Clofibric Acid
removal 71.8% compared to 27.7%), compared to conventional treatment. But again, some
treatment results were similar to conventional treatment (e.g. for Ibuprofen, removal > 80%)
and carbamazepine passed both systems without degradation or transformation. For
sulfamethoxazole a variation of removal rates were found. Maybe there was some back
conversion of the human metabolite N4-acetylsulfamethoxazole to the initial compound
during treatment. Interestingly, the membrane pore size of 0.4 m decreased during
operation of the MBR to a size of 0.01 m due to microbial fouling.
(Sipma et al., 2010) confirmed that it can be seen that easily removed pharmaceuticals are
equally well removed in both systems, i.e. acetaminophen, ibuprofen and paroxetine.
Nevertheless, in most cases the removal efficiency of moderately or slightly removed
pharmaceuticals in CAS is better in an MBR, although the removal efficiency inmost cases
are far from complete. In some cases, i.e. sotalol and hydrochlorothiazide the removal
efficiencies reported in an MBR were worse than the reported values in a CAS. It should be
noted that for some pharmaceuticals the number of different treatment facilities analyzed is
rather limited.
(Snyder et al., 2007) reported that concentrations of caffeine, acetaminophen, sulfameth-
oxazole, carbamazepine, and gemfibrozil decreased as the compounds passed through the
pilot MBR with removal efficiencies varying between 99.1% (sulfamethoxazole) and 99.9%
(acetaminophen). (Radjenovic et al., 2009) found that the removal of acetaminophen from
the aqueous phase by the MBR was greater than 99% (similar to the CAS). No elimination of
gemfibrozil took place by CAS treatment, whereas 30-40% of this compound was eliminated
by the MBR. In the same study, carbamazepine remained untreated by both technologies.
Removal efficiencies of sulfamethoxazole were higher by the MBR technology (81%) than by
the conventional activated sludge (75%).
Literature Review Chapter I
49
(Kimura et al., 2005) investigated the ability of submerged MBR at a municipal WWTP to
remove six pharmaceuticals and one herbicide (dichlorprop). They compared this treatment
to the removal efficiency of an activated sludge process. The MBR demonstrated a better
removal rate for ketoprofen and naproxen. For the other compounds, the removal rate was
comparable with activated sludge. The authors attributed the poor removal of some
compounds in both treatment processes to either the inclusion of chlorine within their
chemical structure, or a double aromatic ring structure. Ibuprofen has a relatively simple
chemical structure with no chlorine molecules, and both treatment systems efficiently
removed it.
(Bernhard et al., 2006) reported that treatment by MBR resulted in significant better
removals compared to activated sludge treatment for poorly biodegradable persistent polar
pollutants, such as diclofenac, mecoprop and sulfophenylcarboxylates, which was ascribed
to the employed long sludge retention times.
Also (Radjenovic et al., 2009) reported that the removal of pharmaceuticals in an MBR was
superior for several compounds and at least similar for others, and furthermore, that the
range of variation of the removal efficiency in the MBR system was smaller for most of the
compounds. Obviously, non-degradable micro-pollutants, such as EDTA and carbamazepine
were not eliminated at all by any treatment process (Bernhard et al., 2006).
(Kimura et al., 2005) found that compounds with a complex chemical structure, e.g.
ketoprofen and naproxen, were not eliminated in a CAS treatment process, but could be
eliminated by a MBR. These authors found further that for several other pharmaceuticals the
treatment efficiencies were comparable. Others have also reported on similar removal
efficiencies between MBR and CAS (Joss et al., 2005; Clara et al., 2004).
In general MBR technology generally outperforms the CAS treatment in removing PhCs from
WWTPs (Radjenovic et al., 2009). From the aspect of the excess sludge produced, advanced
MBR technology would be attractive concept, not only in terms of the cost reduction of
sludge treatment due to its lowered production, but also because it diminishes the
environmental impact of WWTPs treatment, since the MBR sludge is less contaminated with
PhCs than the sludge produced during the conventional treatment. The amount of PhCs,

Literature Review Chapter I
50
sorbed onto sewage sludge may increase the environmental risk of these micropollutants,
since they can become bio available when conditions for desorption are created.
Moreover the literature in (Bouju et al., 2008) shows that MBRs should be more efficient on
Persistent organic pollutants (POPs) removal than CAS, especially on the substances which
are poorly biodegradable, while it does not improve the removal efficiency for the non-
degradable ones. The comparison with the removal obtained in a very large conventional
WWTP operating at quite high SRT will be particularly significant. Also (Hawkshead, 2008)
concludes that MBR system can represent an important alternative to CAS in the HWWs
treatments and, for a correct treatment of HWWs, (Beier et al., 2011) reports the design
requirements for MBRs. Based on the operational experience gained at this site and on
technical and economic optimisation, the following aspects should be considered in the
design of MBR treating hospital wastewaters in high density urban areas:
Separate rainwater collection to reduce dilution effects
Where applicable, separation of water streams with low pharmaceutical
concentrations (e.g. kitchen and laundry wastewaters) sludge age in the MBR > 100
days to allow for biomass adaptation
Thermal treatment of the waste activated sludge and screenings for complete
destruction of the adsorbed pharmaceuticals
Consideration of the special requirements on emission levels (noise and aerosols) for
hospital patients with a weak immune system and/or needing a quiet environment as
well as those of nearby residents.
Membrane Biological Reactors (MBR) have gained significant popularity in STPs and are
nowadays considered as a powerful (and expensive) technology able to produce higher
quality effluents in terms of conventional pollutants, which can be appropriate for direct
discharge, further postreatment or even reuse purposes. However, since membrane
filtration does not enhance the elimination of most micropollutants by means of a size-
exclusion mechanism it is still not clear if these systems may effectively enhance the removal
of organic micropollutants (Reif et al., 2008).
The need for compact wastewater treatment plants increasingly becomes a global concern
where the environmental impact by the population also sets high demands to treatment of
waste produced by the community as the hospital wastewaters. The attached growth
bioreactor coupled with membrane separation as attached growth membrane bioreactor

Literature Review Chapter I
51
(attached growth MBR) is an alternative way to achieve high effluent quality, compactness
treatment plants and economical management (Ødegaard, 2000).
2.2.3. Attached growth biological treatment technology
The removal of organic micropollutants from wastewater has become an increasingly
important consideration and has imposed new challenges in the design of wastewater
treatment plants. One such technology is the submerged attached growth bioreactor
(SAGB), which derives its name from the fact that the media is always submerged in the
process flow. Attached growth technologies work on the principle that organic matter is
removed from wastewater by microorganisms. These microorganisms are primarily aerobic,
meaning they must have oxygen to live. They grow on the filter media (materials such as
gravel, sand, peat, or specially woven fabric or plastic), essentially recycling the dissolved
organic material into a film that develops on the media. The two primary advantages of a
SAGB are the small volume requirement and the elimination of downstream clarification
(Grady et al., 1999). A submerged biofilter allows for a high biomass concentration leading
to a short hydraulic retention time and, thus, a significantly reduced reactor volume as
compared to a different fixed film reactor or a suspended growth reactor. In addition, the
media in a SAGB may be fine enough to provide physical filtration for solids separation.
Attached growth aerobic treatment reactors can be divided into two groups: with up flow
and down flow of treated water. Up flow attached growth aerobic treatment reactors differ
in the type of packing and the degree of bed expansion. Down flow attached growth reactors
differ only in the packing material used and these can be random or tubular plastic (figure
10). The neutrally plastic media within each aeration tank provides a stable base for the
growth of a diverse community of microorganisms. Polyvinylchloride (PVC) media has a very
high surface-to-volume ratio, allowing for a high concentration of biological growth to thrive
within the protected areas of the media.
There are three types of up flow attached growth processes: 1) the up flow packed bed
reactor, where the pack material is fixed and the wastewater flows between the packing
covered by the biofilm. The packing material can be rock or synthetic plastic. 2) The aerobic
expanded bed reactor (AEBR) which uses a fine-grain sand to support the biofilm growth. 3) The
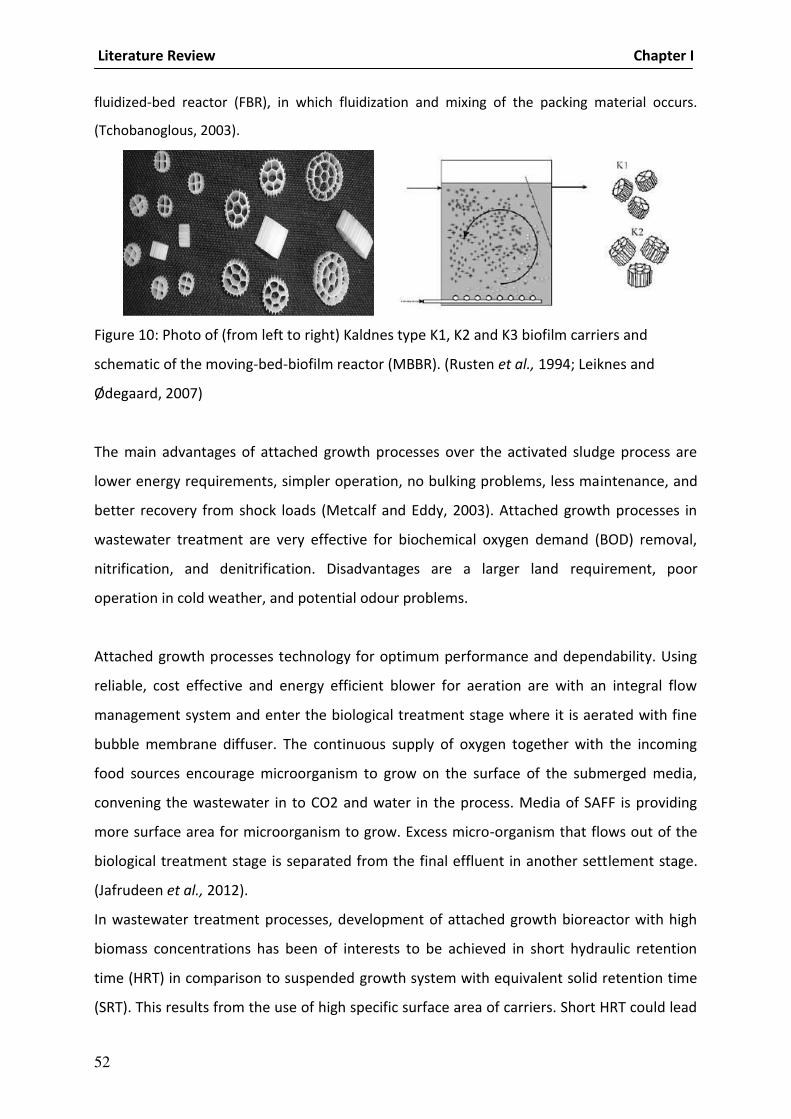
Literature Review Chapter I
52
fluidized-bed reactor (FBR), in which fluidization and mixing of the packing material occurs.
(Tchobanoglous, 2003).
Figure 10: Photo of (from left to right) Kaldnes type K1, K2 and K3 biofilm carriers and
schematic of the moving-bed-biofilm reactor (MBBR). (Rusten et al., 1994; Leiknes and
Ødegaard, 2007)
The main advantages of attached growth processes over the activated sludge process are
lower energy requirements, simpler operation, no bulking problems, less maintenance, and
better recovery from shock loads (Metcalf and Eddy, 2003). Attached growth processes in
wastewater treatment are very effective for biochemical oxygen demand (BOD) removal,
nitrification, and denitrification. Disadvantages are a larger land requirement, poor
operation in cold weather, and potential odour problems.
Attached growth processes technology for optimum performance and dependability. Using
reliable, cost effective and energy efficient blower for aeration are with an integral flow
management system and enter the biological treatment stage where it is aerated with fine
bubble membrane diffuser. The continuous supply of oxygen together with the incoming
food sources encourage microorganism to grow on the surface of the submerged media,
convening the wastewater in to CO2 and water in the process. Media of SAFF is providing
more surface area for microorganism to grow. Excess micro-organism that flows out of the
biological treatment stage is separated from the final effluent in another settlement stage.
(Jafrudeen et al., 2012).
In wastewater treatment processes, development of attached growth bioreactor with high
biomass concentrations has been of interests to be achieved in short hydraulic retention
time (HRT) in comparison to suspended growth system with equivalent solid retention time
(SRT). This results from the use of high specific surface area of carriers. Short HRT could lead

Literature Review Chapter I
53
to a compact system of the reactor, which can be beneficial when the plant area is limited.
(Comett et al., 2004) studied a treatment of leachate wastewater from the anaerobic
fermentation of solid wastes using two biofilm support media. Biofilm growing on different
carrier media had different responses to the nutrient contaminated in wastewater. The
sequencing batch system consisted of two reactors containing Kaldnes and Linpor carrier
materials with specific areas of 490 and 270 m2/m3, respectively. The total COD removals
for Linpor and Kaldnes reactors were 47% and 39%, respectively and the average ammonia
removals for Linpor and Kaldnes were 72% and 42%, respectively. The surface of Linpor had
higher concentrations of microorganisms than that of Kaldnes. The average dry solids in
Linpor and Kaldnes were 170 g/m2 and 63 g/m2, respectively.
2.2.3.1. Application of attached growth biofilms with membrane bioreactors
The typical attached membrane bioreactor consists of a bioreactor with a membrane
module and media submerged in the bioreactor. There are blowers in the bottom of the
bioreactor to supply air for the biomass and suspend the media in the bioreactor. The media
are used to collide the membrane surface to reduce the thickness of cake layer. On the other
hand, the biomass could attach on the surface of media to increase the biomass
concentration and reduce the sludge production. So, the attached membrane system does
not required large space, since clarifier is not need in the system. Also, retaining relatively
high biomass concentration in attached membrane system over MBR or attached system
would increase removal efficiency and retain nitrifiers for increasing nitrification. The lab
scale attached membrane bioreactor is showed in (Figure 11).
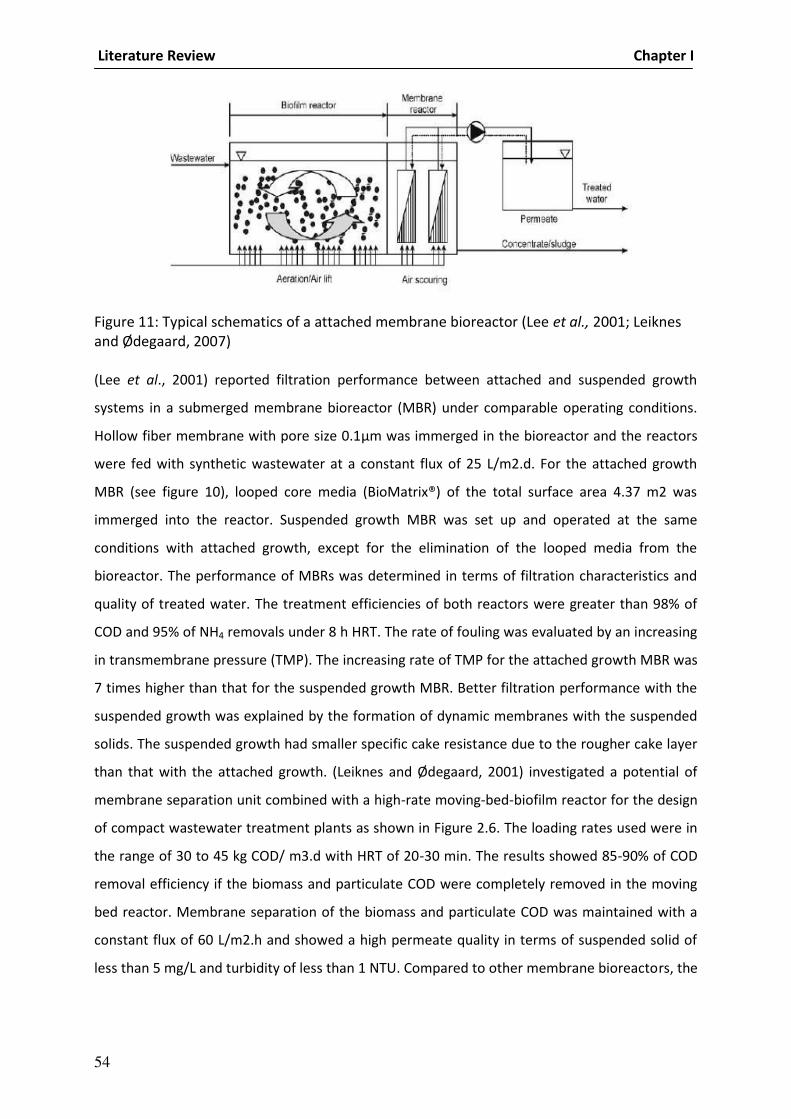
Literature Review Chapter I
54
Figure 11: Typical schematics of a attached membrane bioreactor (Lee et al., 2001; Leiknes and Ødegaard, 2007)
(Lee et al., 2001) reported filtration performance between attached and suspended growth
systems in a submerged membrane bioreactor (MBR) under comparable operating conditions.
Hollow fiber membrane with pore size 0.1 m was immerged in the bioreactor and the reactors
were fed with synthetic wastewater at a constant flux of 25 L/m2.d. For the attached growth
MBR (see figure 10), looped core media (BioMatrix®) of the total surface area 4.37 m2 was
immerged into the reactor. Suspended growth MBR was set up and operated at the same
conditions with attached growth, except for the elimination of the looped media from the
bioreactor. The performance of MBRs was determined in terms of filtration characteristics and
quality of treated water. The treatment efficiencies of both reactors were greater than 98% of
COD and 95% of NH4 removals under 8 h HRT. The rate of fouling was evaluated by an increasing
in transmembrane pressure (TMP). The increasing rate of TMP for the attached growth MBR was
7 times higher than that for the suspended growth MBR. Better filtration performance with the
suspended growth was explained by the formation of dynamic membranes with the suspended
solids. The suspended growth had smaller specific cake resistance due to the rougher cake layer
than that with the attached growth. (Leiknes and Ødegaard, 2001) investigated a potential of
membrane separation unit combined with a high-rate moving-bed-biofilm reactor for the design
of compact wastewater treatment plants as shown in Figure 2.6. The loading rates used were in
the range of 30 to 45 kg COD/ m3.d with HRT of 20-30 min. The results showed 85-90% of COD
removal efficiency if the biomass and particulate COD were completely removed in the moving
bed reactor. Membrane separation of the biomass and particulate COD was maintained with a
constant flux of 60 L/m2.h and showed a high permeate quality in terms of suspended solid of
less than 5 mg/L and turbidity of less than 1 NTU. Compared to other membrane bioreactors, the

Literature Review Chapter I
55
moving bed biofilm reactor could operate at higher volumetric loading (10-15 times) and at
shorter HRT (10-30 times).
(Snyder et al., 2007a) performed a comprehensive analysis of the use of various membrane
and activated carbon technologies on the removal of pharmaceuticals, endocrine-disrupting
compounds, and personal care products.
2.2.4. Activated carbon adsorption
Activated carbon is a solid, porous, black carbonaceous material, (see Figure 12). It is
distinguished from elemental carbon by the absence of both impurities and an oxidized
surface (Mattson and Mark, 1971).
Figure 12: Activated carbon: surface and pores – scanning electron microscope image. Magnification increases from left to right. (Courtesy of Roplex Engineering Ltd.).
Activated carbon has an extraordinarily large surface area and pore volume, making it
suitable for a wide range of applications. The dynamics of adsorption in a packed activated
carbon bed are influenced by the shape and size of the activated carbon particles and their
effect on the flow characteristics. The smaller an activated carbon particle is, the better the
access to its surface area and the faster the rate of adsorption. For spherical beads, the
diameter can be measured easily. For cylindrical extrudates, an equivalent spherical
diameter, d eqv, can be calculated from the radius and length of the extrudate. However, for
particles of irregular shape and a wide size distribution, it is difficult to derive d eqv. In such
cases particle sizes derived from sieve analyses can be useful parameters for determining
adsorption rate.
The most important property of activated carbon, the property that determines its usage, is
the pore structure. The total number of pores, their shape and size determine the

Literature Review Chapter I
56
adsorption capacity and even the dynamic adsorption rate of the activated carbon. IUPAC
classifies pores as follows (Rodriguez-Reinoso and Linares-Solano, 1989):
macropores: d0 > 50 nm
esopores: ≤ d0 ≤
micropores: d0 < 2 nm
ultramicropores: d0 < 0.7 nm
supermicropores: 0.7 < d0 <2 nm
Where: d0 is the pore width for slit type pores or the pore diameter for cylindrical pores.
The macropores act as transport pathways, through which the adsorptive molecules travel
to the mesopores, from where they finally enter the micropores. The micropores usually
constitute the largest proportion of the internal surface of the activated carbon and
contribute most to the total pore volume. Most of the adsorption of gaseous adsorptive
takes place within these micro pores, where the attractive forces are enhanced and the
pores are filled at low relative pressures. Thus, the total pore volume and the pore size
distribution determine the adsorption capacity. The dynamics of adsorption in a packed
activated carbon bed are influenced by the shape and size of the activated carbon particles
and their effect on the flow characteristics. The smaller an activated carbon particle is, the
better the access to its surface area and the faster the rate of adsorption. For spherical
beads, the diameter can be measured easily. For cylindrical extrudates, an equivalent
spherical diameter, deqv, can be calculated from the radius and length of the extrudate.
However, for particles of irregular shape and a wide size distribution, it is difficult to derive
deqv. In such cases particle sizes derived from sieve analyses can be useful parameters for
determining adsorption rate. ( Jufang Wu, 2004)
2.2.4.1. Application of activated carbon
In the water and wastewater treatment, activated carbon is used, single or coupled with
another process, either in powdered (suspension process) or granular (fixed bed process),
depending upon the specific application and process. The objectives pursued with the use of
activated carbon in water treatment have changed significantly in recent decades. Years ago,
activated carbon was employed primarily for the removal of excess chlorine and the
elimination of substances affecting odour and taste from relatively good-quality raw water.
Increasingly exacting quality requirements for drinking water, coupled with increasing

Literature Review Chapter I
57
pollution levels in untreated water (groundwater and surface water), have led to the
optimization of activated carbon as a means of guaranteeing acceptable drinking water
quality. In parallel, changes in treatment processes, such as the reduction of high-strength
chorine treatment, have resulted in the elimination of traditional applications.
In recent years, the use of activated carbon processes has become widely established in
drinking water treatment, groundwater rehabilitation and the treatment of wastewaters.
Likewise, activated carbon is being used to an increasing extent in waste water treatment,
whether it be in the systematic treatment of individual effluent streams (e.g. in the
chemicals industry or hospital effluents), in the removal of substances toxic to bacteria in
biological waste water treatment or in tertiary waste water treatment, where effluent
restrictions are particularly severe.
2.2.4.2. Removal of Micropollutants in Activated Carbon
Powdered and Granular Activated Carbon (PAC and GAC) have been commonly used for
sorption of organic micropollutants like pesticides or taste and odour compounds (Ternes
and Joss, 2006). Several studies have also evaluated the adsorption of other emerging trace
organics including a range of PhACs and ECDs on activated carbon in both laboratory systems
and full scale drinking water treatment plants (Kim et al., 2010; Ternes et al., 2002). Only a
few studies have investigated GAC adsorption as an option for tertiary treatment of
conventional biologically treated wastewater.
Previous studies carried out by our group (Serrano et al., 2010) showed that a GAC addition
of 0.5e1 g.L-1 directly into the aeration tank of an activated sludge reactor can be a useful
tool to increase the removal of the recalcitrant PPCPs carbamazepine, diazepam and
diclofenac. Moreover, recent works have shown that activated carbon can be useful to
minimise fouling problems in MBRs. In this way, the use of PAC concentrations of 0.5 103 g.L-
1 inside the aeration tank of a MBR have been used to attain an easier control of membrane
fouling (Remy et al., 2009). However, activated carbon addition is not common in STPs. With
activated sludge processes, (Ng and Stenstrom, 1987) showed that the use of 0.5- 4 g.L-1 of
PAC may enhance nitrification rates by 75 and 97%, whereas other authors observed an
improvement of organic matter removal as well as a significant decrease of toxicity caused

Literature Review Chapter I
58
by certain inhibitors on the nitrification process (Widjaja et al., 2004). In fact, activated
carbon is a suitable support for bacterial attachment, being possible in this way to enhance
the retention of the more slowly growing bacteria, such as nitrifiers (Thuy and Visvanathan,
2006; Aktas and Cecen, 2001).
The activated carbon amended MBR to date has been mainly studied in relation to
membrane fouling mitigation (Guo et al., 2008) and rarely to assess recalcitrant pollutant
removal enhancement(Hai et al., 2008). Only two studies (Zhang et al., 2008; Lee et al.,
2011) to date have explored PAC-amended MBR specifically for the removal of
micropollutants. Although (Zhang et al., 2008) confirmed improved removal efficiency; a
comprehensive understanding of the involved phenomena is yet to be developed. (Remy et
al., 2009) proposed a very comprehensive resume of the main research contributions on this
issue and reported that the addition of low PAC concentrations can increase the permeate
flux of about 10% by improving the membrane filtration performance. (Fang et al., 2006; Ng
et al., 2008) indicated the adsorption of foulants to the PAC particles as the responsible
mechanism (2–5 g·PAC·L-¹activated sludge) of fouling reduction, but also observed as
frequent refreshing of the PACs was necessary because foulants saturate them, while
operation at an infinite solid retention time (SRT) did not exhibit a positive effect on
filterability.
Results from these previous experiences reported in technical literature, confirming that
activated carbon addition, in low concentrations, makes possible to halve the permeate flux
loss while other tests carried out with higher concentrations did not reveal significant
efficiency improvements. Moreover, the temperature influence (considering two series of
tests carried out at 12 and 22 °C, respectively) is negligible. The activated carbon addition
can contribute to reduce the membrane fouling in MBR systems. The benefit of activated
carbon addition improves the MBR filtration performances, such as the energy consumption
reduction due to mitigation of TMP increase (or flow rate decrease), elongation of cleaning
in place as well as physical cleaning intervals

Literature Review Chapter I
59
3. Characteristics of activated sludge flocs In the literature, it is difficult to find specific descriptions of sludge characteristics in MBR
systems, and therefore this section will describe sludge characteristics mainly based on the
conventional activated sludge processes. Extracellular polymeric substances (EPS) play an
important role in the development of this specific matrix and represent a major sludge floc
component beside water phase and cells (Li and Ganczarczyk, 1990). In addition, inorganic
and organic substances are adsorbed from the water phase to the flocs and hence sorption
processes are involved in floc formation and consequently in the elimination process of
wastewater pollutants. The structure and composition of activated sludge flocs are very
complex and are directly or indirectly related to sludge settleability. The microorganisms in
the bioreactor metabolize dissolved and suspended organic components of the feed
wastewater and this process is advantageous due to high chemical conversion efficiency
(Judd, 2006). The aerobic processes are ideally capable of converting large organic molecules
into CO2, H2O and inorganic nitrogen products (Judd, 2006). However, some amounts of
extracellular polymeric substances (EPS) will also be produced depending on the conditions
in the reactor as well as the feed composition (Judd, 2006). The efficiency of the processes
and the production of byproducts depend on various operation parameters, both physical
and biological (Judd, 2006).
In activated sludge systems filamentous bacteria were often observed and it was suggested
that they provide a stabilizing backbone for the three-dimensional floc structure (Bossier and
Verstraete 1996). However, extensive growth of filamentous bacteria is often associated
with settling problems such as bulking or scum formation. Bulking sludge is characterized by
sludge flocs from which filamentous bacteria grow into the surrounding liquid inhibiting
formation of dense floc aggregates under low hydrodynamic shear (e.g. during
sedimentation). In contrast, scum formation is caused by sludge flocs float to the surface
aggregating to a more or less stable sludge layer at the water-air interface. According to
(Lemmer and Lind, 2000) three different groups of filamentous bacteria involved in settling
problems are frequently found in municipal WWTPs. Sulfur bacteria such as type 021N and
Thiothrix sp., which are able to use beside organic substrates reduced sulfur components as
energy source, and heterotrophic bacteria adapted to high sludge load (F/M ratio > 0.15 kg
BOD5 kg-1 MLSS d-1), e.g. Sphaerotilus spp. and Haliscomenobacter hydrossis, are in general

Literature Review Chapter I
60
responsible for bulking sludge. The third group including heterotrophic bacteria adapted to
low sludge load (F/M ratio < 0.15 kg BOD5 kg-1 MLSS d-1) is often found in nutrient removal
plants with nitrogen elimination. Eukaryotic organisms are also found in activated sludge
systems. However, activated sludge does not usually favour growth of fungi because of fungi
being selected by extremely low pH values below 4. In contrast, monocellular protozoa
comprising flagellates, amoeba, and ciliates, and highly organized metazoa such as rotifers,
nematodes, and other worms play an important role in the activated sludge system. The
primary role of both protozoa and metazoa is to clarify the effluent by predation on freely
suspended bacteria and bacteria loosely attached to the floc surface.
3.1. Floc morphology and composition
(Wilén et al., 2008) confirmed that most of the microorganisms in conventional activated
sludge processes self-aggregate in complex sludge flocs, which mainly consist of bacterial
colonies surrounded by a network of extracellular polymeric substances (EPS). Besides, the
flocs include organic fibres and particles and inorganic components as presented in the
(figure 13).
Sludge typically has a bimodal size distribution, and this has been observed in MBR systems as well (Le-Clech et al., 2006).
Figure 13: Schematic example of the structure of an activated sludge floc including single bacteria, bacterial colonies, absorbed organic and inorganic particles and organic fibres surrounded by the EPS matrix, Adapted from (Mikkelsen, 1999).

Literature Review Chapter I
61
The smaller fraction is primary particles, e.g. single bacteria and colloids, and the larger
fraction is the sludge flocs, respectively (Mikkelsen and Keiding ,1999). (Mikkelsen and
Keiding, 1999) was demonstrated that the bimodal distribution results from an equilibrium
between flocculation and deflocculation i.e. aggregation of new flocs or incorporation of
primary particles into existing flocs and erosion of particles from the surface of existing flocs
or large scale fragmentation of flocs, respectively (see Figure14). (Jarvis et al., 2005)
confirmed that the state of this equilibrium depends on the strength of the forces involved
in the interaction within the sludge flocs and the external shear forces applied on the flocs
Figure 14: Floc breakage involves either large scale fragmentation or surface erosion,
Adapted from (Jarvis et al., 2005).
Floc strength can be regarded as a sum of all the interactions that bind bacteria and floc
constituents together. The four most commonly cited floc-binding interactions are the
DLVO-type interactions (Hermansson, 1999), bridging of EPS with divalent (Eriksson and Alm,
1991) and trivalent cations (Nielsen and Keiding, 1998), hydrophobic interactions (Urbain et
al., 1993), and physical entanglement of floc entities (Rijnaarts et al., 1995). All these
interactions can be affected by both physico-chemical properties of bulk liquid and biological
activity of bacteria inhabiting the flocs, which makes the floc strength a continuously
changing parameter, the magnitude of which can be managed with a number of strategies.
According to the DLVO theory, bacterial adhesion to floc surface can be increased by
increasing the ionic strength of the solution. This effect is expected to result from decreasing
the double layer thickness and decreasing the surface potential, which would eventually act
against the electrostatic repulsive forces (Hermansson, 1999). EPS bridging mechanisms are
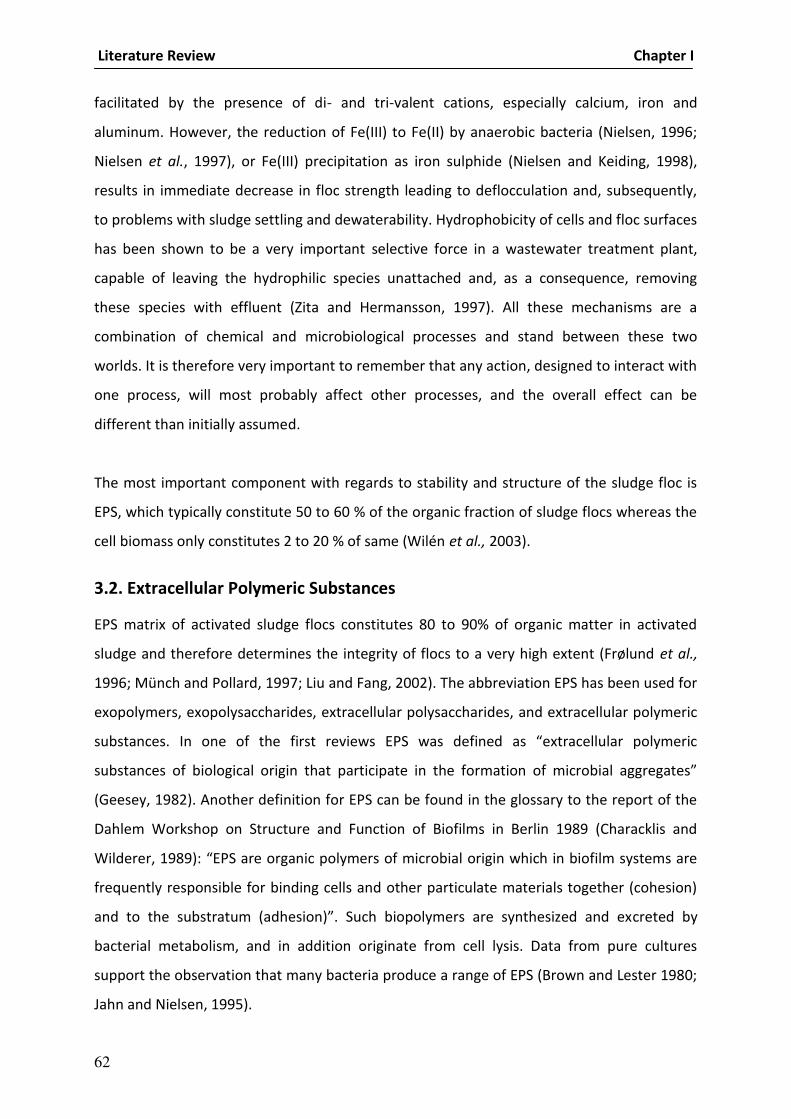
Literature Review Chapter I
62
facilitated by the presence of di- and tri-valent cations, especially calcium, iron and
aluminum. However, the reduction of Fe(III) to Fe(II) by anaerobic bacteria (Nielsen, 1996;
Nielsen et al., 1997), or Fe(III) precipitation as iron sulphide (Nielsen and Keiding, 1998),
results in immediate decrease in floc strength leading to deflocculation and, subsequently,
to problems with sludge settling and dewaterability. Hydrophobicity of cells and floc surfaces
has been shown to be a very important selective force in a wastewater treatment plant,
capable of leaving the hydrophilic species unattached and, as a consequence, removing
these species with effluent (Zita and Hermansson, 1997). All these mechanisms are a
combination of chemical and microbiological processes and stand between these two
worlds. It is therefore very important to remember that any action, designed to interact with
one process, will most probably affect other processes, and the overall effect can be
different than initially assumed.
The most important component with regards to stability and structure of the sludge floc is
EPS, which typically constitute 50 to 60 % of the organic fraction of sludge flocs whereas the
cell biomass only constitutes 2 to 20 % of same (Wilén et al., 2003).
3.2. Extracellular Polymeric Substances
EPS matrix of activated sludge flocs constitutes 80 to 90% of organic matter in activated
sludge and therefore determines the integrity of flocs to a very high extent (Frølund et al.,
1996; Münch and Pollard, 1997; Liu and Fang, 2002). The abbreviation EPS has been used for
exopolymers, exopolysaccharides, extracellular polysaccharides, and extracellular polymeric
su sta es. I o e of the first re ie s EP“ as defi ed as e tra ellular pol eri
substances of biologi al origi that parti ipate i the for atio of i ro ial aggregates
(Geesey, 1982). Another definition for EPS can be found in the glossary to the report of the
Dahlem Workshop on Structure and Function of Biofilms in Berlin 1989 (Characklis and
Wilderer, : EP“ are orga i pol ers of i ro ial origi hi h i iofil s ste s are
frequently responsible for binding cells and other particulate materials together (cohesion)
a d to the su stratu adhesio . “u h iopol ers are s thesized a d e creted by
bacterial metabolism, and in addition originate from cell lysis. Data from pure cultures
support the observation that many bacteria produce a range of EPS (Brown and Lester 1980;
Jahn and Nielsen, 1995).

Literature Review Chapter I
63
The work of Novak and Park resulted in the fractionation of activated sludge extracellular
polymers into three major groups according to the distinct cations responsible for
attachment of these polymers: (1) polymers composed of lectin-like proteins bound to
polysaccharides, bridged by Ca2+ and Mg2+ and extractable by a sodium-rich cation exchange
resin (CER), (2) protein-rich biopolymers bound to Fe cations and extractable by sulfide, and
(3) biopolymers bound to Al cations, extractable with bases (Novak et al., 2003; Park and
Novak, 2007; Park et al., 2008; Park and Novak, 2009). In more complex systems, e.g. the
activated sludge floc, EPS originate from (i) microbial metabolism or lysis of microorganisms
as described above and (ii) from wastewater components accumulated to the floc matrix by
sorption processes (Urbain et al., 1993). In addition, hydrolysis processes of macromolecules
due to the activity of extracellular enzymes, influence EPS composition (Frølund et al., 1995,
Confer and Bruce 1998). Because it is not possible to distinguish between microbially
produced EPS, adsorbed material, and hydrolysis products, in this work all three fractions are
defined as EPS.
EPS in activated sludges and biofilms are also known to promote cell-cell
recognition/communication and protect cells against harmful environmental conditions such
as turbulence, dehydration, antibiotics and biocides (Wingender et al., 1999). Furthermore
the ter s ou d EP“ a d solu le EP“ are used for so e iofil s ste s Hsieh et al.,
1994; Nielsen et al., 1997). Bound EPS include sheaths, capsular polymers and cell-attached
organic material. Soluble macromolecules, colloids, and slimes represent soluble EPS. This
means that all polymers outside the cell wall, which are not directly bound to the outer
membrane/murein-protein-layer, will be considered extracellular EPS material.
The main organic fractions detected in activated sludge EPS were proteins, carbohydrates,
uronic acids, humic substances, lipids, and fatty acids (Goodwin and Forster, 1985; Urbain et
al., 1993; Frølund et al., 1996, Bura et al., 1998; Dignac et al., 1998; Conrad et al., 2003;
Wilen et al., 2003). Significant amounts of DNA and RNA were also found (Frølund et al.,
1996; Palmgren and Nielsen, 1996). Park and Novak found that each cation-bound fraction
of EPS produced a unique SDS-PAGE protein fingerprint, suggesting a different protein
composition and therefore accounting for different characteristics conveyed by each fraction
(Park et al., 2008). As the pool of EPS proteins is augmented by incoming proteins from

Literature Review Chapter I
64
influent stream, by proteins originating from sludge cell lysis, and by proteins actively
secreted by sludge microorganisms (Park et al., 2008), the actual role of EPS proteins is most
probably very significant, but also very complex. Earlier studies often indicated that
polysaccharides were the most abundant and important EPS compound (Brown and Lester,
1980; Horan and Eccles, 1999) but a number of recent studies have shown that the quantity
of proteins is about two to three folds higher than polysaccharides in activated sludge EPS
(Urbain et al., 1992; Frølund et al., 1996; Nielsen et al., 1996; Higgins and Novak, 1997a;
Dignac et al., 1998; Wingender et al., 1999; Liu and Fang, 2002; Comte et al., 2007). It was
also reported that glycoproteins are very likely present in activated sludge EPS so that part of
the protein and carbohydrate content in EPS arises from the extraction of glycoproteins
(Goodwin and Forster, 1985; Jorand et al., 1998; Horan and Eccles, 1999). The general
characteristic of bacterial glycoprotein is interesting to note since it often exhibits both
acidic characteristic (low isoelectric point) and hydrophobic characteristic (Jorand et al.,
1998). Consequently, it can be involved in bacterial aggregation by both electrostatic bond
(cation bridging) and hydrophobic interaction.
EPS can be composed of a variety of biopolymers transported to the extracellular milieu by
active secretion or export, lysed cellular components from the rupture of cell structure,
hydrolyzed or digested exocellular substances, and materials adsorbed from the
environment such as in wastewater being fed to an activated sludge system (Urbain et al.,
1992; Dignac et al., 1998; Nielsen and Keiding, 1998; Wingender et al., 1999). However, it is
mainly unknown how these different-origin EPS are distributed within the floc and
contribute to the physiological property of activated sludge flocs. Furthermore, due to the
scarcity of molecular investigation on activated sludge EPS, their identity, function, and fate
in various stages of the activated sludge system remains veiled. Additional possible functions
of EPS are summarized by (Wingender et al., 1999). EPS might act as protective barriers
against toxic substances, e.g. heavy metals or certain biocides (disinfectants and antibiotics),
predation and dramatic environmental fluctuations (pH, salt content, hydraulic pressure).
Furthermore the localization of extracellular enzymes mentioned above, which perform the
degradation of exogenous macromolecules and particulate material is well described in the
literature. This observation indicates two further functional aspects, which are described in
Literature Review Chapter I
65
the following chapters, the involvement of EPS in accumulation and subsequent utilization of
these accumulated substances as carbon sources.
(Kim et al., 1998) reported that addition of powder activated carbon (PAC) to the MBR could
increase flux permeability by reducing dissolved EPS levels from 121-196 to 91-127 mg/g
VSS. (Thuy, 2003) investigated the performance of biological activated carbon (BAC) by
adding granular activated carbon into MBR (BAC-MBR) and AS-MBR (activated sludge MBR)
to treat inhibitory phenolic compounds. The comparison of the two systems in terms of
membrane fouling was carried out. It was found that the TMP suddenly increased in the AS-
MBR while the BAC-MBR was linearly increased. TMP in the BAC-MBR after 90 days were
slightly higher than that in the AS-MBR, and the bound EPS of the BAC-MBR was higher than
that of the AS-MBR. The protein/carbohydrate (P/C) ratio in soluble EPS was high in BAC-
MBR (0.86-2.13), but soluble EPS production (0.49-2.03 mgC/gVSS) was low. The P/C ratio
and soluble EPS were the two important factors in biofouling.
(Likewise, 1996; Nagaoka et al., 1996) reported that EPS could accumulate in the aeration
tank of the membrane separation for activated sludge process, which caused an increase in
mixed liquor viscosity and thus in the filtration resistance. (Change and Lee, 1998) noted that
the EPS contents of activated sludge could be an indicator for estimating the membrane
fouling.
(Mukai et al., 2000) estimated flux decline of ultrafiltration membrane at different cultural
growth phases i.e. different EPS and metabolic concentrations in AS process. The authors
reported that the flux decline was affected by protein to sugar ratio of EPS and metabolic
products. Lower permeate flux occurred at higher retention of protein and greater amounts
of retained protein during the filtration.
3.2.1. Extraction of EPS of activated sludge
Controversies in EPS extraction studies are also associated with the impact of extracted EPS
on sludge characteristics. The quantity of EPS extracted by the cation exchange resin CER
procedure was negatively correlated to settling properties (Liao et al., 2001; Wilén et al.,
2003a), but related to better dewatering characteristics of activated sludge (Jin et al., 2003;

Literature Review Chapter I
66
Mikkelsen and Keiding, 2002). However, EDTA-EPS and glutaraldehyde-EPS reported by
(Erikkson and Alm, 1991; Sponza , 2002), respectively, showed negative correlations with
both settling and dewatering properties of sludge. Results from the thermal treatment of
sludge tended to show either no relationship (Shin et al., 2001) or positive relationship
(Goodwin and Forster, 1985) between the amount of extracted EPS and settleablilty of
sludge but accounted for poorer dewater ability of sludge (Kang et al., 1989). Despite this
confusing information from earlier studies, several important things can be noted. First, as
(Novak and Haugan, 1981) suggested two decades ago that there is no universal method for
providing quantitative extraction of exocellular biopolymers from sludge floc. Considerable
disagreement regarding extraction efficiency between different methods and the low
extractability of EPS, even from the best method designated in each study (typically, less
than 100 mg EPS/g solids), supports this statement. Second, it is unlikely that the EPS
extracted by a single method is representative of EPS in sludge floc.
Controversies about the impact of EPS on sludge characteristics have often been attributed
to the different extraction methods with different experimental approaches (cultures,
extraction time, shearing force, etc). However, the varying composition of EPS such as the
quantity and ratio of proteins and polysaccharides associated with different extraction
methods indicate that EPS extracted by different treatments could be qualitatively different
and this is more likely the reason for the differences reported. Furthermore, it was seen
from the reviewed literature that some types of EPS are highly selective for certain kind of
cations over others. Since several extraction methods are specific for certain cations in floc,
the extracted materials by different treatments should also be different.
3.2.2. Effect of hospital wastewaters on extracellular polymeric substances formation in
municipal wastewater
Previous studies have identified the extracellular polymeric substances (EPS) or soluble
microbial products (SMP) as one of the most significant factors responsible for membrane
fouling (Drews et al., 2006; Janga et al., 2007; Judd, 2008; Le-Clech et al., 2006; Meng et al.,
2009). (Delgado, 2009) confirmed that presence cyclophosphamide presence induced a
modification of biological suspended solids. The modifications in the biomass and in the bulk
solution appeared to influence the membrane performance.

Literature Review Chapter I
67
(Avella et al., 2009) studied the effect of the cyclophosphamide and its mean metabolites on
extracellular polymeric substances (EPS) formation and this study confirmed that
cyclophosphamide and its mean metabolites in the studied concentrations range influenced
the biomass exopolymer production. Clearly that cyclophosphamide presence induced an
increase in soluble EPS. The increase of these macromolecular species may be attributed to a
protection mechanism. (Laspidou and Rittmann, 2002; Aquino and Stuckey, 2004) observed
an increased concen- tration of soluble EPS with a high molecular size in anaerobic
chemostat in the presence of toxicants (chloroform or chromium). (Henriques and Love,
2007) found that the EPS matrix inside sludge flocs was a protective barrier for bacteria
exposed to chemicals toxins such the octane and cadmium.
(Aquino and Stuckey, 2004) study on soluble microbial products (SMP) in bioreactor spiked
with chloroform or chromium: they observed enhanced soluble microbial production,
composed mainly of PR and PS and no change in SMP composition in toxic s prese e. The
suggested that some SMP might be deliberately excreted by micro-organisms in cell to cell
communication (quorum sensing). It is now established that the quorum sensing influences
the biofilm development or aggregates dispersion (Parsek and Greenberg, 2005) regulating
the excretion of PS or PR for biomass survival. It was found that bacteria are a thousand
times more resistant to antibiotics in a biofilm than in liquid suspension (Everst, 2006).
3.3. Physic parameters of activated sludge
Floc formation and settling in activated sludge can be assessed using two measurements,
namely the MLSS and SVI. MLSS and SVI are routine tests at the macro scale to assess
performance of the reactor. MLSS is a measure of suspended solids in the sample. Although
flocculation is not greatly affected by the concentration of suspended solids, there are
reports in the literature describing the negative influence of high MLSS on effluent quality
(Chapman, 1983). MLSS is a measure of mixed liquor suspended solids and this measure
includes the total weight of microorganisms, EPS, organic waste, suspended waste and any
other particulate in wastewater (Goddard, 1987).
SVI is a measure of sludge settleability. SVI is defined as the volume in millimeters occupied
by one gram of suspension after 30 min. It indirectly measures morphology of flocs, and is a

Literature Review Chapter I
68
physical characteristic of activated sludge (Liao et al., 2006; Schmid et al., 2003). SVI is
measured at the macro level and it tracks the settling of a sludge sample rather than the
settling of one single particle. SVI needs to be measured as a function of MLSS. The MLSS
consideration is only accurate for sludge samples up to 4000 mg/L, MLSS values higher than
4000 mg/L would introduce errors in the SVI measurement (Dick and Vesilind, 1969). This
makes SVI theoretically not supported, but it is a useful assessment of process control.
Furthermore, since it is simple, inexpensive, and fast this test is still considered to be a
routine test (Dick and Vesilind, 1969; Finch, 1950).
SRT is not a test but an operational parameter that states, how long the sludge has been
retained; in other words, it is the cell residence time in a reactor. SRT may influence many
other characteristics of activated sludge, including: hydrophobicity, surface charge, surface
irregularity and EPS, (Liao et al., 2001; Liao et al., 2006). In addition to SRT, other carefully
controlled operational parameters are essential to microbial well-being. Microbial cells could
be considered an ongoing progress of evolution and as a result, they demand certain
optimized conditions for their survival. These conditions include: pH, temperature, food to
microorganism ratio and ratio of different nutrients (Abbassi et al., 2000; Barr et al., 1996;
Jenkins et al., 2003; Liu et al., 2002). The above conditions are all necessary for the survival
of microorganisms in their niche. In WWTP, the above conditions are not easy to maintain
optimally at all times due to parameters such as variability of influent water or weather
conditions. When the above conditions are not optimized, the microbial community may
change (Boon et al., 2002). Changes in the community may cause inefficiencies in reactor
performance along with changes in settleability and/or formation of solid/liquid interfaces
(Bruus et al., 1992; Jin et al., 2004; Nielsen et al., 1996). Formation of solid/liquid interfaces
is dependent on the stabilization of physicochemical properties in a floc (Lee et al., 1997;
Liao et al., 2001; Liu et al., 2009).

Literature Review Chapter I
69
4. Analyses instruments
4.1. Activated sludge morphology
Activated sludge is a complex mixture of flocs, smaller cell aggregates, and both organic and
inorganic particles suspended in water. The activated sludge floc is a complicated structure
composed of biotic and abiotic components. The general structure of a floc is a result of the
selective pressure in the wastewater treatment plant, favoring dense aggregates with good
settling properties. The biotic community of an activated sludge floc is composed of both
prokaryotes – Bacteria and some Archaea – and eukaryotes – protozoan and often metazoan
organisms (Eikelboom, 2000). The actual community composition is dynamic and is a net
result of the influent wastewater composition and the conditions inside the treatment plant.
A typical activated sludge floc composed of bacterial cells growing in dense, grape-shaped
microcolonies, as filaments or as single cells embedded in the matrix of extracellular
polymeric substances (EPS) or attached to filamentous organisms (Jorand et al., 1995;
Snidaro et al., 1997; Jenkins et al., 2003). Filamentous bacteria are generally recognized as
a k o es of a flo , respo si le for its e ha i al stre gth, as ell as settli g properties
(Ekama et al., 1997). The EPS matrix, composed of several fractions, is dense and sticky, glue-
like material, responsible to a large degree for floc and microcolony integrity. In the EPS
matrix many holes, cavities and channels are present, which make up for the large surface
area of flocs and facilitate water and nutrient transport to the cells growing deep in the floc
structure (Liss et al., 1996; Daims et al., 2001; Chu and Lee, 2004). The EPS matrix can be
regarded as a typical gel because of its swelling/deswelling properties and divalent cation
bridging (Keiding et al., 2001). This is extremely important for the floc properties, which
determine the behavior of activated sludge in full-scale processes like settling, dewatering
and gravity drainage.
Several studies have shown that the settling and the compaction properties of the activated
sludge are directly related to the flocs structure, which depends on a group of chemical,
physical and biological factors that significantly influence the balance between filamentous
and floc-forming bacteria (Pujols and Canler , 1992), leading to changes in the structure and,
thus, in the morphological properties of microbial aggregates. In this way, it is possible to

Literature Review Chapter I
70
establish relationships between sludge settling indexes and several parameters that
characterize the morphology of microbial flocs (Námer and Ganczarczyk, 1993; Li and
Ganczarczyk, 1987, 1988, 1990, 1992), being these relationships useful for monitoring the
settling stage in activated sludge systems. The size of activated sludge flocs is typically 40 to
125 m, but values down to 25 m and up to 1000 m have been reported (Frølund et al.,
1996; Ekama et al., 1997; Eikelboom, 2000; Jenkins et al., 2003). The floc size is a net result
of the floc strength and the mechanical stresses that the floc is subjected to, whereas the
floc strength results from a range of chemical and biological factors. All in all, the floc size is
a very dynamic floc characteristic with many implications on sludge macroscopic properties
and sludge behavior in large-scale processes. The effective dewatering of activated sludge by
gravity drainage depends on a number of physicochemical and microbiological factors, the
most important of which seems to be the particle size distribution, similarly to the case of
dead-end filtration of abiotic suspensions. Deflocculation, a process of floc disruption into
smaller fragments, is especially damaging to the drainage process. Small floc fragments can
easily penetrate the cake voids and close the pores (process known as blinding), which leads
to increased drag, slower drainage and progressing cake compression.
The presence of small particles in the activated sludge suspension has been shown to
decrease dewater ability many times (Karr and Keinath, 1978; Barber and Veenstra, 1986;
Mikkelsen et al., 1996). Since deflocculation of activated sludge flocs is a direct result of
reduced floc strength (Mikkelsen and Keiding, 1999), the knowledge of floc strength and
factors affecting it can be effectively used to investigate the phenomena behind the quality
of sludge in terms of gravity drainage. Floc strength can be regarded as a sum of all the
interactions that bind bacteria and floc constituents together. The four most commonly cited
floc-binding interactions are the DLVO-type interactions (Hermansson, 1999), bridging of EPS
with divalent (Eriksson and Alm., 1991) and trivalent cations (Nielsen and Keiding, 1998),
hydrophobic interactions (Urbain et al., 1993), and physical entanglement of floc entities
(Rijnaarts et al., 1995). All these interactions can be affected by both physico-chemical
properties of bulk liquid and biological activity of bacteria inhabiting the flocs, which makes
the floc strength a continuously changing parameter, the magnitude of which can be
managed with a number of strategies. According to the DLVO theory, bacterial adhesion to
floc surface can be increased by increasing the ionic strength of the solution. This effect is

Literature Review Chapter I
71
expected to result from decreasing the double layer thickness and decreasing the surface
potential, which would eventually act against the electrostatic repulsive forces (Hermansson,
1999).
4.2. Microbial composition and activity
Behind the macroscopic physico-chemical properties of activated sludge flocs, and the EPS
matrix composition and function, stand the sludge microorganisms. Even though bacterial
cells only make up from 10-20% of the total sludge organic matter (Nielsen and Nielsen,
2002), the composition of sludge microbiota determines the amount and composition of EPS
and therefore influences the overall floc characteristics. It has been shown that different
groups of bacteria influence the floc strength to a different extent, i.e. that Beta-, Gamma-,
and Deltaproteobacteria form relatively strong microcolonies, while colonies of other
bacteria like Alphaproteobacteria and Firmicutes are rather weak (Klausen et al., 2004). This
claim is supported by the findings that sludge supernatant and the settled floc differ in
microbial composition (Morgan- Sagastume et al., 2008) and that sludge flocs generally have
loosely and strongly attached fractions of cells and EPS (Keiding and Nielsen, 1997; Liao et
al., 2002; Sheng et al., 2006). The easily detachable fraction of approximately 5-15% of cells
can be removed from flocs by shear forces alone, the strongly attached fraction of further
15-40% of cells requires certain physico-chemical treatments in addition to shear forces in
order to deflocculate, and the remaining 50-75% of cells cannot be removed from flocs
(Larsen et al., 2008). Therefore, it becomes clear that the bacterial community composition
determines how a given sludge reacts to a given set of factors and therefore how a given
treatment influences floc strength, floc size distribution and, as a consequence, sludge
dewater ability and draining characteristics (Klausen et al., 2004). A good balance between
filamentous and flocforming bacteria favor the formation of large, dense and strong flocs
desirable for adequate settling and compaction of the activated sludge. Misbalance could
induce filamentous bulking caused by an overgrowth of filamentous bacteria or disperse
growth (pin point floc) provoked by a scarce growth of floc-forming bacteria. The
filamentous bulking promotes the formation of highly irregular flocs causing a decrease of
settling speed as well as low sludge compaction, while the disperse growth leads to the
formation of small and lights flocs that not settle, resulting in a very turbid effluent with high
concentration of suspended matter. (Jenkins et al., 1993).
Literature Review Chapter I
72
Several techniques have been proposed in literature in order to describe the complex
structure of the flocs in terms of the material organization within the aggregates. These
techniques have allowed to known the physical aspect of the floc (filament size and fractal
dimension), the granulometric distribution of the floc sizes (measured by photographic
technique in free settling, Coulter Counter, laser diffraction and Malvern counter, etc) and
the consequences of bio-flocculation on flow properties (rheological measurements and
settling rates).
4.3. Microscopic techniques
4.3.1. Image Analysis procedure
Various methods have been established to measure the size of activated sludge flocs. The
most commonly used approach is microscopy (Barbusinski and Koscielniak, 1995). It
represents an excellent technique for directly examining the flocs. However, for manual
microscopy, elaborate sample preparation is necessary and only a few particles can be
examined. More recently, by connecting the microscope to automated image analysis
software, a faster evaluation of activated sludge floc properties became possible (Grijspeerdt
and Verstraete, 1997). Another technique used for characterising the activated sludge floc
size and size distribution is the Coulter Counter (Andreadakis, 1993). This technique requires
sample suspension in an electrolyte, which can create structural disturbance on biological
flocs or might cause clogging of the aperture during the measurement of the large size
particles.
The recent development of image analysis technique has enabled a more complete
understanding of the aggregates physical structure and morphology. Image analysis has
become a fundamental tool with great applications within the Environmental Science. In
aerobic activated sludge systems, it has been applied for morphological characterization of
microbial flocs, allowing the estimation of different parameters of the Euclidian geometry
(Grisjpeerdt and Verstraete, 1996, 1997; Jin et al., 2003; Amaral, 2003), the fractal analysis
of contour of these aggregates and other aspects such as detection and counting of
filaments (Li and Gaczarczyk, 1989; da Motta et al., 2001). These morphological parameters
have been correlated with settling properties of activated sludge, estimated as Sludge

Literature Review Chapter I
73
Volume Index (SVI) (Grijspeerdt and Verstratete, 1997; da Motta et al., 2001; Amaral, 2003),
in order to monitor filamentous bulking in wastewater treatment plants. The floc size and
size distribution have been often reported in literature as outcomes of a particular
measurement technique and less importance has been given to the influence of the
measurement technique on the results. Since operation of various devices is based on a
broad range of measurement principles, it is expected that different results are obtained.
Moreover, for the case of activated sludge, due to the biological fragile and irregular
structure of the flocs, the results may often lead to a misinterpretation of the data.
Experimental setup of the system to the digital image recording For the aspired automatic regulation of the biological stages of wastewater treatment
plants, development and implementation of procedures are necessary that start with taking
digital photographs of activated sludge samples by means of a microscope and a CCD
camera. The following automatic image processing by algorithms of the digital image
processing and the final statistical analysis enable a correlation of data determined the in
this way with the operating conditions of the wastewater treatment plant. Images of
activated sludge samples are detected with the help of the CCD camera attached at the
microscope, screened into a pixel picture and read as an analogue video signal into the
Frame Grabber (figure 15). The Frame Grabber changes the video signal with an 8-bit-A/D-
transducer into 256 grey tones.
Figure 15: Experimental setup of the system for digital image recording

Literature Review Chapter I
74
The available digital image of the activated sludge sample is stored as a file and can be
processed subsequently with algorithms of digital image processing. The principle aim of the
image processing process is the extraction of certain information from the digital images, so
that a scene or individual objects from this images and their relation in the scene can be
interpreted and will be learned by a machine. The first step of the digital image processing is
the improvement of the quality of the microscopic digital images by image processing
measures. Some of these measures are for example the histogram balance or the median
filtering. The recognition of an object in a scene is only possible if it is different from other
objects and from the background of the scene. A subtask of the image processing exists thus
in the division of a picture into meaningful fields and regions, which are different. This
process is called segmentation.
The segmentation of the original microscopic digital image (figure 16-A) can be made by
using an edge detection algorithm. Objects are separated from their background defining
the edges of the object as the modification of the light intensity, this object in the picture
contents. A two-dimensional light intensity modification can be described with the help of a
function. The turning point of this function represents a point of edge, because at this point
the light intensity changes fastest. The aim of edge the detection exists in the determination
of such points of edges. The determination of the points of edge is achieved by a calculation
of local extrema. The actual point of edge is selected, after a check of the local maximums in
different directions. The result of edge detection is the gradient image (figure 16-B), which
has to be binarised in the following step.
A B
Figure 16: (a) Original and (b) gradient microscopic images of a bulking sludge

Literature Review Chapter I
75
4.3.2. Confocal Laser Scanning Microscopy
The technique of laser scanning and spinning disk confocal fluorescence microscopy has
become an essential tool in biology and the biomedical sciences, s well as in materials
science due to attributes that are to readily available using other contrast modes with
traditional optical microscopy (Pawley, 1995 and Masters, 1996). The application f a wide
array of new synthetic and naturally occurring fluorochromes has made it possible to
identify cells and ub-microscopic cellular components with high degree of specificity amid
non-fluorescing material (Mason, 1999). In fact, his confocal microscope is often capable of
revealing him presence of a single molecule (Peterman et al., 2004). Through the se of
multiply-labeled specimens, different probes a simultaneously identify several target
molecules simultaneously, both in fixed specimens and living ells and tissues (Goldman and
sector 2005). Although both conventional and confocal microscopes cannot provide spatial
resolution below the diffraction limit of specific specimen features, hem detection of
fluorescing molecules below such limits s readily achieved.
4.3.2.1. Principles of Confocal Microscopy
The confocal principle in epifluorescence laser scanning microscope is diagrammatically
presented in Figure 17. Coherent light emitted by the laser system (excitation source) passes
through a pinhole aperture that is situated in a conjugate plane (confocal) with a scanning
point on the specimen and a second pinhole aperture positioned in front of the detector (a
photomultiplier tube). As the laser is reflected by a dichromatic mirror plane, secondary
fluorescence emitted from points on the specimen (in the same focal plane) pass back
through the dichromatic mirror and are focused as a confocal point at the detector pinhole
aperture.

Literature Review Chapter I
76
Figure 17: Schematic diagram of the optical pathway and principal components in a laser canning confocal microscope. The significant amount of fluorescence emission that occurs at points above and below the
objective focal plane is not confocal with the pinhole (termed Outof- Focus Light Rays in
Figure 16) and forms extended Airy disks in the aperture plane (Stelzer et al., 2000). Because
only a small fraction of the out-of-focus fluorescence emission is delivered through the
pinhole aperture, most of this extraneous light is not detected by the photomultiplier and
does not contribute to the resulting image. The dichromatic mirror, barrier filter, and
excitation filter perform similar functions to identical components in a wide field epi-
fluorescence microscope (Rost et al., 1992). Refocusing the objective in a confocal
microscope shifts the excitation and emission points on a specimen to a new plane that
becomes confocal with the pinhole apertures of the light source and detector.
In laser scanning confocal microscopy, the image of an extended specimen is generated by
scanning the focused beam across a defined area in a raster pattern controlled by two high-
speed oscillating mirrors driven with galvanometer motors. One of the mirrors moves the
beam from left to right along the x lateral axis, while the other translates the beam in the y
direction. After each single scan along the x axis, the beam is rapidly. Wide field versus

Literature Review Chapter I
77
confocal microscopy illumination volumes, demonstrating the difference in size between
point scanning and wide ield excitation light beams. Claxton, Fellers, and Davidson
transported back to the starting point and shifted along the y axis to begin a new scan in a
process termed fly back (Webb, 1995). During the fly back operation, image information is
not collected. In this manner, the area of interest on the specimen in a single focal plane is
excited by laser illumination from the scanning unit.
4.3.2.2. Advantages and disadvantages of confocal microscopy
The primary advantage of laser scanning confocal microscopy is the ability to serially
produce thin (0.5 to 1.5 micrometer) optical sections through fluorescent specimens that
have a thickness ranging up to 50 micrometers or more (Sandison and W. Webb; 1994). With
most confocal microscopy software packages, optical sections are not restricted to the
perpendicular lateral (x-y) plane, but can also be collected and displayed in transverse
planes. Vertical sections in the x-z and y-z planes (parallel to the microscope optical axis) can
be readily generated by most confocal software programs. Most of the software packages
accompanying commercial confocal instruments are capable of generating composite and
multi-dimensional views of optical section data acquired from z-series image stacks. The
three-dimensional software packages can be employed to create either a single three-
dimensional representation of the specimen or a video (movie) sequence compiled from
different views of the specimen volume.
In many cases, a composite or projection view produced from a series of optical sections
provides important information about a three-dimensional specimen than a multi-
dimensional view (Conchello et al., 1994-2005).
Advances in confocal microscopy have made possible multi-dimensional views (Conchello et
al., 1994-2005) of living cells and tissues that include image information in the x, y, and z
dimensions as a function of time and presented in multiple colors (using two or more
fluorophores). Additional advantages of scanning confocal microscopy include the ability to
adjust magnification electronically by varying the area scanned by the laser without having
to change objectives. This feature is termed the zoom factor, and is usually employed to
Literature Review Chapter I
78
adjust the image spatial resolution by altering the scanning laser sampling period (Pawley,
1995; Centonze, 1995).
Disadvantages of confocal microscopy are limited primarily to the limited number of
excitation wavelengths available with common lasers (referred to as laser lines), which occur
over very narrow bands and are expensive to produce in the ultraviolet region (Gratton,
1995).
Another downside is the harmful nature (Ashkin, 1987) of high-intensity laser irradiation to
living cells and tissues, an issue that has recently been addressed by multiphoton and
Nipkow disk confocal imaging. Finally, the high cost of purchasing and operating multi-user
confocal microscope systems (DeMaggio, 2002), which can range up to an order of
magnitude higher than comparable wide field microscopes, often limits their
implementation in smaller laboratories.
4.3.2.3. Fluorophores for confocal microscopy
Biological laser scanning confocal microscopy relies heavily on fluorescence as an imaging
mode, primarily due to the high degree of sensitivity afforded by the technique coupled with
the ability to specifically target structural components and dynamic processes in chemically
fixed as well as living cells and tissues. Many fluorescent probes are constructed around
synthetic aromatic organic chemicals designed to bind with a biological macromolecule (for
example, a protein or nucleic acid) or to localize within a specific structural region, such as
the cytoskeleton, mitochondria, Golgi apparatus, endoplasmic reticulum, and nucleus
(Haugland et al., 2005) Other probes are employed to monitor dynamic processes and
localized environmental variables, including concentrations of inorganic metallic ions, pH,
reactive oxygen species, and membrane potential (Lemasters et al ., 1999). Fluorescent dyes
are also useful in monitoring cellular integrity (live versus dead and apoptosis), endocytosis,
exocytosis, membrane fluidity, protein trafficking, signal transduction, and enzymatic activity
(Johnson, 1998) addition, fluorescent probes have been widely applied to genetic mapping
and chromosome analysis in the field of molecular genetics.

Literature Review Chapter I
79
4.3.2.4. Basic characteristics of fluorophores
Fluorophores are catalogued and described according to their absorption and fluorescence
properties, including the spectral profiles, wavelengths of maximum absorbance and
emission, and the fluorescence intensity of the emitted light (Johnson, 1998). One of the
most useful quantitative parameters for characterizing absorption spectra is the molar
extinction coefficient (denoted with the Greek symbol e, see Figure 18(a)), which is a direct
measure of the ability of a molecule to absorb light. The extinction coefficient is useful for
converting units of absorbance into units of molar concentration, and is determined by
measuring the absorbance at a reference wavelength (usually the maximum, characteristic
of the absorbing species) for a molar concentration in a defined optical path length. The
quantum yield of a fluorochrome or fluorophore represents a quantitative measure of
fluorescence emission efficiency, and is expressed as the ratio of the number of photons
emitted to the number of photons absorbed. In other words, the quantum yield represents
the probability that a given excited fluorochrome will produce an emitted (fluorescence)
photon. Quantum yields typically range between a value of zero and one, and fluorescent
molecules commonly employed as probes in microscopy have quantum yields ranging from
very low (0.05 or less) to almost unity. In general, a high quantum yield is desirable in most
imaging applications. The quantum yield of a given fluorophore varies, sometimes to large
extremes, with environmental factors, such as metallic ion concentration, pH, and solvent
polarity (Johnson, 1998)
Figure 18: Fluorescent spectral profiles, plotted as normalized absorption or emission as a function of wavelength, for popular synthetic fluorophores emitting in the blue, green, and red regions of the visible spectrum. Each profile is identified with a colored bullet in (a), which illustrates excitation spectra. (b) The emission spectra for the fluorophores according to the legend in (a).

Literature Review Chapter I
80
In most cases, the molar extinction coefficient for photon absorption is quantitatively
measured and expressed at a specific wavelength, whereas the quantum efficiency is an
assessment of the total integrated photon emission over the entire spectral band of the
fluorophore (see Figure 18(b)). As opposed to traditional arc-discharge lamps used with the
shortest range (10-20 nanometers) band pass interference filters in wide field fluorescence
microscopy, the laser systems used for fluorophore excitation in scanning confocal
microscopy restrict excitation to specific laser spectral lines that encompass only a few
nanometers (Pawley, 1995 ; Hibbs, 2004). The fluorescence emission spectrums for both
techniques, however, is controlled by similar band pass or long pass filters that can cover
tens to hundreds of nanometers (Hibbs, 2004). Below saturation levels, fluorescence
intensity is proportional to the product of the molar extinction coefficient and the quantum
yield of the fluorophore, a relationship that can be utilized to judge the effectiveness of
emission as a function of excitation wavelength(s).
4.3.2.5. Traditional fluorescent dyes
Many of the classical fluorescent probes that have been successfully utilized for many years
in wide field fluorescence (Johnson, 1998; Kasten 1999), including fluorescein
isothiocyanate, Lissamine rhodamine, and Texas red, are also useful in confocal microscopy.
Fluorescein is one of the most popular fluorochromes ever designed, and has enjoyed
extensive application in immunofluorescence labelling. This xanthene dye has an absorption
maximum at 495 nanometres, which coincides quite well with the 488 nanometer (blue)
spectral line produced by argon ions and krypton-argon lasers, as well as the 436 and 467
principal lines of the mercury and xenon arc-discharge lamps (respectively). In addition, the
quantum yield of fluorescein is very high and a significant amount of information has been
gathered on the characteristics of this dye with respect to the physical and chemical
properties (Wessendorf and Brelje, 1992). On the negative side, the fluorescence emission
intensity of fluorescein is heavily influenced by environmental factors (such as pH), and the
relatively broad emission spectrum often overlaps with those of other fluorophores in dual
and triple labeling experiments (Johnson, 1998; Wessendorf and Brelje, 1992; Entwistle and
Noble, 1992).
Literature Review Chapter I
81
Tetramethyl rhodamine (TMR) and the isothiocyanate derivative (TRITC) are frequently
employed in multiple labeling investigations in widefield microscopy due to their efficient
excitation by the 546 nanometer spectral line from mercury arc-discharge lamps. The
fluorochromes, which have significant emission spectral overlap with fluorescein, can be
excited very effectively by the 543 nanometer line from helium-neon lasers, but not by the
514 or 568 nanometer lines from argon-ion and krypton-argon lasers (Entwistle and Noble,
1992). When using krypton-based laser systems, Lissamine rhodamine is a far better choice
in this fluorochrome class due to the absorption maximum at 575 nanometers and its
spectral separation from fluorescein. Also, the fluorescence emission intensity of rhodamine
derivatives is not as dependent upon strict environmental conditions as that of fluorescein.
Several of the acridine dyes, first isolated in the nineteenth century, are useful as fluorescent
probes in confocal microscopy (Wessendorf and Brelje, 1992).
The most widely utilized, acridine orange, consists of the basic acridine nucleus with
dimethylamino substituents located at the 3 and 6 positions of the tri-nuclear ring system. In
physiological pH ranges, the molecule is protonated at the heterocyclic nitrogen and exists
predominantly as a cationic species in solution. Acridine orange binds strongly to DNA by
intercalation of the acridine nucleus between successive base pairs, and exhibits green
fluorescence with a maximum wavelength of 530 nanometers (Johnson, 1998; Wessendorf
and Brelje, 1992; Darzynkiewicz, 1990). The probe also binds strongly to RNA or single
stranded DNA, but has a longer wavelength fluorescence maximum (approximately 640
nanometres; red) when bound to these macromolecules. In living cells, acridine orange
diffuses across the cell membrane (by virtue of the association constant for protonation) and
accumulates in the lysosomes and other acidic vesicles. Similar to most acridines and related
polynuclear nitrogen heterocycles, acridine orange has a relatively broad absorption
spectrum, which enables the probe to be used with several wavelengths from the argon-ion
laser.
Another popular traditional probe that is useful in confocal microscopy is the phenanthridine
derivative, propidium iodide, first synthesized as an anti-trypanosomal agent along with the
closely related ethidium bromide). Propidium iodide binds to DNA in a manner similar to the
acridines (via intercalation) to produce orange-red fluorescence centered at 617 nanometers
(Waring, 1965; Arndt-Jovin and Jovin, 1989). The positively charged fluorophore also has a
high affinity for double-stranded RNA. Propidium has an absorption maximum at 536

Literature Review Chapter I
82
nanometers, and can be excited by the 488-nanometer or 514-nanometer spectral lines of
an argon-ion (or krypton-argon) laser, or the 543-nanometer line from a green helium-neon
laser. The dye is often employed as a counterstain to highlight cell nuclei during double or
triple labeling of multiple intracellular structures. Environmental factors can affect the
fluorescence spectrum of propidium, especially when the dye is used with mounting media
containing glycerol. The structurally similar ethidium bromide, which also binds to DNA by
intercalation (Waring, 1965), produces more background staining and is therefore not as
effective as propidium.
4.3.2.6. EPS analysis with confocal laser scanning microscopy and chemical analysis
CLSM was used for the identification of bacteria and EPS distribution within the biofilm
matrix. Based on the work of (Staudt et al., 2003) EPS glyco conjugates were stained with the
Aleuria aurantia lectin (LINARIS Biologische Produkte GmbH, Wertheim-Bettingen, and
Germany) labeled with AlexaFluor_ 488 (invitrogen/Molecular Probes, Eugene, USA). For the
identification of bacteria the nucleic acid stain SYTO60 (invitrogen/ Molecular Probes,
Eugene, USA) was applied following the Probes, Eugene, USA) was used to stain proteins
within the biofilm matrix (Lawrence et al., 2003). Image stacks were created with a Zeiss
LSM510 META confocal laser scanning microscope (Carl Zeiss Micro Imaging GmbH, Jena,
Germany), controlled by means of the AIM software (version 3.2, Carl Zeiss Micro Imaging
GmbH, Jena, Germany). The Zeiss LSM510 META is equipped with different lasers, offering
several excitation wavelengths. For fluorescence excitation two wavelengths were used: 488
and 633 nm. For the direct observation of biofilms on slides a water immiscible lens (40x
magnification, N.A. ¼ 0.8) was used. For each measurement, one of the marked areas on the
slide was chosen randomly. On this spot, five points were scanned to determine the
distribution of EPS and nucleic acids. The pinhole for each scanned channel was adjusted to
scan all channels with an identical optical slice thickness (North, 2006) of 0.78 mm.
In addition to lectin binding analysis with CLSM, a chemical analysis of the EPS was
performed using a DOWEX cation exchange resin to break down the network of the EPS by
exchange of divalent cations (Ca2+, Mg2+) as described in literature (Comte et al., 2006;
Frolund et al., 1996; Jahn and Nielsen, 1995; Lowry et al., 1951; Nielsen and Jahn, 1999).
Thereby 70 g DOWEX cation exchange resin (Type Na) were added per 1 g of dried organic

Literature Review Chapter I
83
matter of biofilm sample. Determination of dried organic matter was performed before
following the rules of DIN EN 12880 (Deutsches Institut fur Normung e.V, 2000). Reaction
has been carried out with approximately 10 g of rinsed biofilm sample in a shaking flask for
1.5 h under stirring (900 rpm) at 4 C°. Used cation exchange resin was separated by
centrifugation at 4300 g for 5 min. Resulting supernatant was centrifuged again at 4300 g for
15 min (2 times in cooled environment) and filtered through a cellulose acetate filter with
pore diameter of 0.45 mm. In this supernatant proteins and humic substances were
determined by the methods described by Lowry et al., 1951) and Frolund et al., 1995),
respectively. The concentration of carbohydrates in the supernatant was determined by the
anthrone method (Raunkjaer et al., 1994).
4.3.2.7. Digital image analysis
Image analysis was performed with the freely available software ImageJ version 1.39i
(http://rsb.info.nih.gov/ij/index. html) including the LSM-Reader plugin to open LSM5
formatted image stacks created by the microscope software. The tool J Image Analyzer 1.1,
which is based on the performance of Image J and handles LSM5 formatted image stacks,
was programmed for quantitative analysis. By setting a threshold, pixels with intensity below
the threshold were assigned to the background. All other pixels were set to the foreground.
Due to the individual image adjustment during the image stack acquisition, the threshold
was chosen manually for each image stack. It has to be stressed that the pitfalls of threshold
setting by the operator is well known (Staudt et al., 2004; Yang et al., 2001). Thus, the
conditions during digital image analysis were kept constant for each image analysis. The
same monitor was used including settings for brightness and contrast. To avoid hardware-
based influences, all DIA were performed by the same person to avoid individual influences.
Nevertheless, operating manually allows optimization of the images with respect to
structural information.
The foreground pixels were counted and the coverage C of every single image of the image
stack was quantified. Additionally, an average coverage Cstack was calculated for each
image stack. (Eq. 4)
1 n= n max

Literature Review Chapter I
84
C stack = –––––∑ C
n max n=1 With n = number of slices (Eq. 4) 1 n= n max
C = –––––– ∑ C stack
n max n=1
With n = number of image stacks.
In a next step, all values of average coverage C stack of all analyzed image stacks of one slide
taken from a funnel with a Reynolds number of 1000, 2500 and 4000, respectively, were
averaged once more to obtain one single value C representing the averaged amount of
scanned EPS glyco conjugates and nucleic acids on one slide. To better visualize the amount
of EPS glyco conjugates and nucleic acids detected, stacks of 50 single images (slices) were
evaluated as packages. The sum of coverage within such packages of 50 single images (slices)
was calculated by (Eq. 5) (Wagner et al. 2008).
slices n +49
SC stack = ∑ C (Eq. 5) slices n
With = , , …
1 n= n max
SC = –––––– ∑ (SC stack / 50)
n max n=1
With n = number of image stacks.
4.3.3. Fluorescence spectroscopy
Fluorescence is a specific type of photoluminescence, the general term used to describe the
interaction that occurs when molecules are excited by the absorption of photons of
electromagnetic radiation and then, consequently, the re-emission of light energy. The

Literature Review Chapter I
85
phenomenon of fluorescence occurs when a beam of light is passed through a sample and
the photons of light excite the electrons of the molecules in the sample. The electrons jump
into higher energy molecular orbitals and then as they fall back into their original orbitals
they emit energy in the form of light. Fluorescence is characterized by this almost immediate
re-emission of energy after absorption, the entire event occurring in only 10-12 to 10-9
second (Vogel, 1989).
Fluorescence can be measured through the use of a fluorescence spectrometer. A typical
instrument consists of a radiation source, a primary monochromator, a secondary
monochromator, a detector, an amplifier, and a readout device. Light from the source of
radiation is passed through the primary monochromator, which allows only the wavelength
of light required for excitation of the molecules in the sample to pass through. The second
monochromator, located at a 90° angle from the incident optical path, absorbs this primary
radiant energy, transmitting only the fluorescent radiant energy. The geometrical
arrangement of this device makes it particularly sensitive, around three to four orders of
magnitude more sensitive than the spectrophotometer, and therefore a very important
analytical tool (Dekker and Guilbault, 1990).
Three-dimensional excitation–emission matrix (EEM) fluorescence spectroscopy is a rapid,
selective and sensitive technique. The outstanding advantage of EEM fluorescence
spectroscopy is that information regarding the fluorescence characteristics can be entirely
acquired by changing excitation wavelength and emission wavelength simultaneously. Thus,
because of its high sensitivity, good selectivity, and non-destruction of samples, EEM
fluorescence spectroscopy could be useful for studying the chemical and physical properties
of EPS. It can be used to distinguish the fluorescence compounds present in the complex EPS
mixtures from various origins. EEM fluorescence spectroscopy has been successfully used to
evaluate the characteristics of natural dissolved organic matter and humic substances from
various origins (Coble, 1996; Baker 2001; Lu and Jaffe, 2001; Reynolds, 2002; Chen et al.,
2003). It has been proven to be a useful technique to differentiate the changes and
transformations of organic matter in natural environments. In biological and biochemical
fields of study, the fluorescence spectrometer is often used to detect fluorescent probes.
There are three classes into which fluorescent probes can be divided: intrinsic probes,
extrinsic covalently bonded probes, and extrinsic associating probes.

Literature Review Chapter I
86
Tryptophan is one of the three aromatic amino acid residues found in proteins which act as
intrinsic fluorophores (the other two amino acids being tyrosine and phenylalanine), (Valeur,
2002) and although typical proteins are comprised of only 1.1 molar percent tryptophan
residues, this particular amino acid is a very valuable probe of protein structure ( Pokalsky et
al., 1995). I o pariso to the a sorptio a i a a a d e ti tio oeffi ie t ε for
oth t rosi e a = . , ε= a d phe lala i e a = . , ε= , tr ptopha
has a higher wavelength of absorption and a much higher extinction coefficient
a = . , ε= . Both of these fa tors o tri ute to the do i a e of the tr ptopha
e issio sig al, aki g it the ulti ate e erg a eptor i protei s (Dekker and Guilbault,
1990). For this reason, tryptophan can be used as a fluorescent probe to determine the
relative concentrations of protein, and hence of organic materials, contained within different
samples of wastewater.
4.3.4. IR spectroscopy
The basic principle of the IR spectroscopy is the excitation of polar bonds of molecules by
absorption of light in the infrared region of the electromagnetic spectrum. Absorption is
primarily between atoms of hydrogen, carbon, oxygen and nitrogen, the so called light
atomic bonds (e.g. C-H, C-O, C=C). It causes molecular vibrations with a life time in the order
of 10-9 - 10-6 s after excitation. The frequency or wavelength at which atoms of a molecule
are excited and start to vibrate is dependent on the types of vibrating atoms (atomic mass
and radius), the bond strength and the structure of the molecules.
These mass and structural dependent vibrations are called normal vibrations. Normal
vibrations are developed as discrete vibrations of all atoms of a molecule moving in phase
with the same frequency but with different amplitudes (KELLNER et al., 2004; HARRIS, 2007).
The fundamental modes of normal vibrations are stretching (stretching and shortening of
chemical bonds, symmetric or asymmetric), bending (in-plane movement of atoms changing
the angle between bonds), wagging (in-phase, out-of-plane movement of atoms, while other
atoms of the molecule are in-plane), rocking (in-phase forth and back swinging of atoms in
the symmetry plane of the molecule), and twisting (rocking vibration with twisting of the
plane during the movement of the atoms) (TWARDOWSKI and ANZENBACHER ,1994). The
high sensitivity to changes in composition and structure of normal vibration facilitates a

Literature Review Chapter I
87
fingerprint-type identification of polyatomic molecules. IR radiation only causes vibration in
polar bonds in which a change of the dipole moment occurs. Due to this fact, non-polar
molecules cannot be identified by IR spectroscopy (Kellner et al., 2004). Compared to normal
vibrations, absorption bands of functional groups are independent of structure and
composition of the molecules.
This independence occurs if the atoms constituting the functional group are significantly
lighter or heavier than the neighbouring atoms or if the bond strength in the functional
groups differs from those of the bonds in the vicinity. The absorption of functional groups is
called group frequency and significantly developed by functional groups containing H atoms
or isolated double and triple bonds. The corresponding wavelength region of group
frequencies is situated at wave number positions higher than 1300 cm-1 and groups
containing heavy atoms are found in the FIR region below 400 cm-1. The wavelength range
from 1,300 to 400 cm-1 is called the fingerprint region and contains bands of absorbance of
special significance for the entire molecule (Kellner et al., 2004). With regard to the aim of
this thesis; the analysis of sediments, IR spectroscopy enables the identification of both
organic and minerogenic components, whereas spectral regions related to minerogenic
components are mostly situated in the fingerprint region due to the missing of functional
groups with the exception of hydroxyl group. The basis for quantitative analysis of certain
sediment components is the Bouger- Lambert-Beer law (see Eq. 6) which demonstrates the
direct proportionality of absorbance A to concentration C, of the light-absorbing species in
the sample. The absorbance is expressed as
A= εbC (Eq. 6)
Where ε is the molar absorptivity (M-¹cm-¹) and b is the path length (cm). Absorbance is
di e sio less, ut the ter a sor a e u its after a sor a e a e fou d i the
literature. The concentration is usually given in units of moles per liter (M) (HARRIS, 2007). A
correct estimation of concentration of a single compound by integrating of peak areas is
difficult due to overlapping of various absorbance bands, especially within mixtures like
sediments that contain many different compounds. Other common methods based on the
peak height, the maximum absorbance, at a certain frequency are affected by the additive

Literature Review Chapter I
88
character of absorbance. Therefore the integration of multivariate techniques has been a
major advance in quantitative analysis of IR spectra and is now commonly used for data
extraction (Griffiths and De haseth, 2007).
4.3.5. Ion Exchange Chromatography
Natural and artificial zeolites (sodium aluminum silicates) have been used for many years to
remove calcium and magnesium ions from water because they include metal ions, which are
able to exchange places with the other metal ions. Ion exchangers are now being produced
which combine a polymer (a resin which acts as an insoluble inert support) and a functional
group, which dictates whether the exchanger is anionic or cationic. Acids are usually used as
the functional group in cation exchange resins while amines or quaternary ammonium salts are
generally used in anion exchange resins.8 both types of exchangers can be used for the
analyzation of wastewater, the dominant ions being Cl-, NO2-, NO3-, PO4-3, and NH4+.
The rate of ion exchange, and hence separation of the ions, is governed by their relative
affinities. The metal ions in the sample are in constant competition for binding of the
functional groups. Generally at equal concentrations the ion with the highest affinity for the
functional group will take the binding site and move the slowest through the column. An
io s affi it is deter i ed its harge a d its size: the greater the charge and the larger
the size, the higher the affinity. The total cation or anion content of a sample is also able to
be determined simply by using either a cation or an anion exchanger and then titrating the
H+ or OH-, respectively (Robinson, 2005).
4.4. Dosage the pharmaceuticals compounds in wastewaters
The validation and determination of organics micropollutants content in municipal
wastewater samples has been determined by two separate ways, liquid chromatography
combined with mass spectrometry (LC/MS) and gas chromatography (GC) combined with
mass spectrometry (GC/MS). When GC/MS is used to analyze samples of municipal
wastewater, there are different steps as opposed to LC/MS. Samples are taken through SPE
similar to LC/MS procedures, except when samples are dried down under a stream of
nitrogen they are completely dried down and then derivatized with BSTFA ((N, O-bis
(trimethylsilyl) trifluoroacetamide) and TMCS (trimethylchlorosilane), (Mari et al., 2009).
Derivatization is the process by which a compound is chemically modified to produce a new

Literature Review Chapter I
89
compound that can be analyzed by gas chromatography. The use of derivatization helps
increase volatility, detectability, and improves chromatographic behavior (Regis
Technologies Inc, 2000). After derivatization, the samples are injected onto a GS/MS
instrument with specific protocol parameters (Mari et al., 2009; Mustonen et al., 2005).
Liquid chromatography combined with mass spectrometry is the most widely used method
for the determination of organics micropollutants in municipal wastewater samples. Two
types of liquid chromatography have been used to evaluate organics micropollutants in
municipal wastewater samples: high performance liquid chromatography (HPLC) and ultra
performance liquid chromatography (UPLC) (Nuijs et al., 2011).
High performance liquid chromatography and ultra performance liquid chromatography are
similar when used during the analysis of illicit drug content in wastewater samples (Nuijs et
al., 2011). HPLC is an extremely powerful tool in analytical chemistry used to separate,
identify, and quantitate compounds in a sample that can be dissolved in a liquid. HPLC uses
high pressure to push solvents through a packed column. With the use of column particle
sizes of 5 m and pump pressures up to 6000 pounds per square inch (psi), HPLC has been
used to separate differe t o stitue ts of a o pou d si e the s Wa g a d He, ;
http://www.waters.com/waters/nav.htm?cid=10048919, 2012). Ultra performance liquid
chromatography is a variant of HPLC. UPLC is a much newer technology that has significant
increases in resolution, speed, and sensitivity in liquid chromatography. UPLC uses smaller
columns with 1 or 2 millimeter internal diameters packed with smaller particles (1.7 micron)
and have the ability to deliver mobile phases at 15,000 (psi) ( http://www.waters
.com/waters/nav.htm?cid=10048919, 2012). Using high-pressure fluidics and smaller particle
size columns, along with the optimization of pump, injector, column, and detector
technology, UPLC has improved liquid chromatography (Wang and He, 2011,
http://www.waters.com/ waters/nav.htm?cid=10048919, 2012).
There are three major types of chromatography used within liquid chromatography:
hydrophilic interaction liquid chromatography (HILIC), reversed-phase liquid
chromatography (RPLC), and normal phase liquid chromatography (NPLC). Normal phase
chromatography is used to separate compounds based on their polarity. NPLC uses a polar

Literature Review Chapter I
90
stationary phase or column, which is most often silica, in combination with a non-polar
solvent. Solvents usually include hexane, ethyl acetate, or other mobile phases that have a
low polarity (Wang and He, 2011). When NPLC is used, non-polar compounds are eluted off
at a faster rate than polar compounds (Snyder et al., 1988). Reversed-phase chromatography
involves the separation of molecules based on their hydrophobicity. Columns that are used
consist of an alkylsilica-based, non-polar sorbent linked with carbon-18 (C18) that allows
separation based on the hydrophobic binding of the solute molecule from the mobile phase
to the immobilized hydrophobic ligands attached to the sorbent (Walker and Rapley, 2008).
Other columns may be used such as carbon-8 or cyano, both of which have a more
immediate polarity. Cyano can be used in both NPLC and RPLC (Wang and He, 2011). Two
separate mobile phases are used for the separation of molecules. One mobile phase consists
of a mixture between water and an organic solvent. The other mobile phase is an organic
solvent, methanol or acetonitrile, used to elute analytes from chromatographic columns. The
aqueous phase usually contains ammonium formate or ammonium acetate, and has been
acidified with formic or acetic acids. This aids in the ionization of the compounds in the
positive ionization mode.
The aqueous phase in the negative ionization mode varies from basic, to neutral, or slightly
acidic (Nuijs et al ., 2011; Castiglioni et al., 2011; van Juijs et al., 2009 ; Bijlsma et al., 2009 ;
Boleda et al., 2007). Hydrophilic interaction liquid chromatography (HILIC) works like normal
phase liquid chromatography (3). The stationary phase in HILIC is often more polar than the
mobile phase and the analytes typically elute in an order opposite that of RPLC (Wang and
He, 2011; Carlsen, 1997). The phases used in HILIC consist of a polar stationary phase and a
highly organic mobile phase, usually methanol or acetonitrile. Water is used as an eluting
solvent and resolves polar analytes better than reversed-phased columns. Under these
conditions small polar compounds are retained by the stationary phase (Gheorghe et al.,
2008).
The ionization of drugs and their various metabolites with LC-MS/MS has been carried out
with electrospray ionization (ESI). The majority of illicit drugs, their various metabolites, and
pharmaceuticals are best ionized in the positive mode. Cannabinoids show good responses
in both the positive and negative mode. ESI has one drawback however; it is susceptible to
Literature Review Chapter I
91
matrix effects of analyte ionization signal (Castiglioni et al., 2011). Matrix effects often
compromise the analysis of samples by LC-MS/MS. Different approaches have been used to
account for matrix effects including: matrix-matched standards calibration, sample dilution,
and the use of stable isotopically labeled internal standards (Martinez . Most reported
methodologies include isotope-labelled internal standards in order to compensate for losses
of desired compounds during SPE and/or matrix effects in wastewater matrices (Castiglioni
et al., 2011).
Mass Spectrometry
There are two major types of mass spectrometry that have been incorporated within liquid
chromatography for analysis of wastewater effluent samples: single quadrupole MS (Q) and
triple quadrupole MS (QqQ) (Ferrer and Thurman, 2003). Single quadrupole mass
spectrometry contains a single mass filtering quadrupole. This quadrupole works in a
selective mode known as Selected Ion Monitoring (SIM). As a set of voltages are applied to
the quadrupole this allows for only one ion of a specific mass-to-charge ratio 21 (m/z) to
pass while other ions with different m/z are filtered out. This allows for the detection of a
single analyte as it passes through the quadrupole (Schreiber, 2010). Triple quadrupole
(QqQ) MS incorporates three different quadrupoles as opposed to a single one (Schreiber,
2010). QqQ works using a mode known as Multiple Reaction Monitoring (MRM) which
allows for more selectivity and noise reduction (Schreiber, 2010). The first of the three
quadrupoles filters out a specific precursor ion based on m/z. The second quadrupole acts as
a collision cell to produce a product ion by the collision of the precursor ion with a neutral
gas, like nitrogen. This process is known as Collision Induced Dissociation (DIC) producing a
product ion that is sent to the third quadrupole. The third quadrupole acts similar to the first
where only product ions with a specific m/z are allowed to pass while all others are filtered
out (Schreiber, 2010).
There are multiple advantages to using a triple quadrupole as opposed to a single
quadrupole. Triple quadrupoles provide a higher selectivity with less interference resulting in
less time consuming method development and faster analysis times. There is also a better
signal to noise ratio as compared to the single quadrupole providing lower Limits of

Literature Review Chapter I
92
Quantitation (LOQ) and better accuracy and reproducibility at lower concentrations
(Schreiber, 2010).
5. Conclusion
Scientists as (Pauwels and Verstraete, 2006) and projects conducted by the laboratory (Pills
project, SIPIBEL) have been demonstrated that the hospital effluents present really different
qualitative and quantitative characteristics (Altin et al., 2003; kosma et al., 2010; Liu et al.,
2010; Verlicchi et al., 2010a) in compared with the urban wastewater. Hospital effluents are
considered as hotspots for specific compounds discharge in the environment because the
concentrations of these compounds, and thus their effects, are higher than in a urban
wastewater, even if the total quantity (g/day) is comparatively lower (It is recognized that
hospital effluent represents around 20% of the pharmaceutical load in a urban sewer.
For that, hospital wastewater was studied in this work.
Pharmaceutical micropollutant could be detected in soluble or in solid phase, depending on
sorption capability. Pharmaceutical micropollutant could by biologically oxidized depending
on their biodegradability. Thus, these compounds could be removed from the effluent by
different mechanisms and different processes, which are described in the bibliography.
Ternes (1998) monitored 32 pharmaceutical drugs and 5 metabolites in municipal WWTP
influent and effluent, and in the receiving surface waters. Ternes found mainly the acidic
drugs ubiquitously in surface waters in the nanogram-per-liter range. (Khan and Ongerth,
2004) that 29 (58%) of the pharmaceuticals would be present in the influent at
concentrations of greater than or equal to 1 g/l, and 20 (40%) of the pharmaceuticals
would still be present in the wastewater at concentrations greater than or equal to 1 g/l
after secondary treatment. (Snyder et al., 2007) reported that concentrations of caffeine,
acetaminophen, sulfameth- oxazole, carbamazepine, and gemfibrozil decreased as the
compounds passed through the pilot MBR with removal efficiencies varying between 99.1%
(sulfamethoxazole) and 99.9% (acetaminophen). (Radjenovic et al., 2009) found that the
removal of acetaminophen from the aqueous phase by the MBR was greater than 99%
(similar to the CAS). No elimination of gemfibrozil took place by CAS treatment, whereas 30-
40% of this compound was eliminated by the MBR. In the same study, carbamazepine
remained untreated by both technologies. Removal efficiencies of sulfamethoxazole were

Literature Review Chapter I
93
higher by the MBR technology (81%) than by the conventional activated sludge (75%).
(Kimura et al., 2005) investigated the ability of submerged MBR at a municipal WWTP to
remove six pharmaceuticals and one herbicide (dichlorprop). (Bouju et al., 2008) shows that
MBRs should be more efficient on Persistent organic pollutants (POPs) removal than CAS.
In our work, we oriented our studies towards biological processes as activated sludge, and,
to increase the productivity, towards fixed biomass as MBBR.
(Heberer et al., 2002) identified diclofenac as one of the most important pharmaceuticals in
the anthropic water cycle, with low µg/L concentrations in both row and treated wastewater
(3.0 and 2.5 µg/L at the influent and effluent, respectively). As a result of the incomplete
removal during conventional wastewater treatment, these compounds were also found in
surface waters in the ng/L to low mg/L range (Ternes et al., 1998). (Kinney et al., 2006)
showed that organic wastewater contaminants could be detected in the target biosolids with
high frequency and high concentration, which suggests that biosolids can be an important
source of organic wastewater contaminants to terrestrial environment. (Xia et al., 2005)
indicated that the PPCPs that enter wastewater treatment plants can undergo partial or
complete transformation and by-products can be discharged to the environment in the final
effluent or through biosolids being applied to land.
Due to this results, our study was oriented on the upgrading of biological treatment
technologies by used the membrane bioreactors and their improvements.
Previous studies (Serrano et al., 2010) showed that a GAC addition of 0.5 g.L-1 directly into
the aeration tank of an activated sludge reactor can be a useful tool to increase the removal
of the recalcitrant PPCPs carbamazepine, diazepam and diclofenac., (Ng and Stenstrom,
1987) showed that the use of 0.5- 4 g.L-1 of PAC may enhance nitrification rates by 75 and
97%, whereas other authors observed an improvement of organic matter removal as well as
a significant decrease of toxicity caused by certain inhibitors on the nitrification process
(Widjaja et al., 2004). In fact, activated carbon is a suitable support for bacterial attachment,
being possible in this way to enhance the retention of the more slowly growing bacteria,
such as nitrifies (Thuy and Visvanathan, 2006; Aktas and Cecen, 2001). The overall results
confirm slightly the importance of using the activated carbon to upgrading the treatment
systems.

Literature Review Chapter I
94
The occurrence of antibiotic in effluent could have two consequences: the modification of
the biomass morphology and the promotion of antibiotic resistances. Sulfonamides,
fluoroquinolone, and macrolide antibiotics show the highest persistence and are frequently
detected in wastewater and surface waters (Huang et al., 2001). Sulfamethoxazole is one of
the most detected sulfonamides (Brown et al., 2006; Yang et al., 2005) that was reported
with various concentrations and up to ca. 8mg/L (in raw influent in China) (Peng et al., 2006).
Sulfamethoxazole is often administrated in combination with trimethoprim, and commonly
analyzed together (Gobel et al., 2005). The class of tetracyclines, widely used broadspectrum
antibiotics, with chlortetracycline, oxytetracycline, and tetracycline as mostly used, was
detected in raw and treated sewage in many studies in the ng/L (Kim et al., 2005) to mg/L
concentrations (Yang et al., 2003). Tetracyclines and fluoroquinolones form stable
complexes with particulates and metal cations, showing the capacity to be more abundant in
the sewage sludge (Alexy et al., 2004; Daughton et al., 1999). Some of the most prescribed
antibiotics—macrolides clarithromycin, azithromycin, roxithromycin, and dehydro-
erythromycin were found in various environmental matrices in a variety of concentrations
from very low ng/L to few mg/L (Gobel et al., 2005; Karthikeyan et al., 2006).
Many active antibiotic substances were found in raw sewage matrices, including both
aqueous and solid phase. The occurrence of antibiotics may promote the development of
bacterial resistance, which may be stimulated by exposure to low concentrations (Jorgensen
and Halling-Sorensen, 1998). (Baquero et al., 2008; Kummerer, 2004) investigated that
HWW is a source for undesirable constituents, such as (multi-) antibiotic-resistant bacteria..
As a consequence, occurrence of antibiotics in the aquatics environment increased our
motivations to studying the antibiotic resistance phenomena.
Finally, this work is a shed of light about two principal axes: the impact of hospital
wastewater on the biomass and the improvement for treating the hospital wastewater. This
work is a part of many efforts affected to control and decreased the organics
micropollutants in the environment.

Literature Review Chapter I
95
References of Literature Review
A
Abbassi B., Dullstein S., Räbiger N., 2000. Minimization of excess sludge production by increase of oxygen concentration in activated sludge flocs; experimental and theoretical approach. Water research 34, 139-146. Ahn A., Nielsen P.H., 1995. Extraction of extracellular polymeric substances (EPS) from biofilms using a cation exchange resin. Water Sci. Technol. 32 (8), 157–164. Aquino S.F., Stuckey D.C., 2004. Soluble microbial products formation in anaerobic chemostats in the presence of toxic compounds. Water Research 38 (2), 255– 266. Alexy R., Kumpel T., Kummerer K., 2004. Assessment of degradation of 18 antibiotics in the Closed Bottle Test. Chemosphere 57:505–512. Amaral A.L., (2003.) Image Analysis in Biotechnological Processes: Applications to Wastewater Treatment, Tese de Doutorado em Engenharia Química e Biológica, Universidade do Minho, Braga. Andreadakis, A.D., (1993). Physical and chemical properties of activated sludge floc. Wat. Res., 27(12), 1707–1714. Ashkin A. J., Dziedzic M., Yamane T., 1987. Optical Trapping and Manipulation of Single Cells using Infrared Laser Beams, Nature, 330: 769-771, 1987. Asmaa Mouatassim-Souali, S. L. Tamisier-Karolak, D. Perdiz, M. Cargouet, Y. Levi, 2003. Validation of a quantitative assay using GC/MS for trace determination of free and conjugated estrogens in environmental water samples, Journal of Separation Sciences, 26, 105–111. Arndt-Jovin D. J., Jovin T. M., Taylor D. L., Wang Y.-L., 1989. Fluorescence Labeling and Microscopy of DNA in, in D. L. Taylor and Y.-L. Wang, Fluorescence Microscopy of Living Cells in Culture, Part B. Methods Cell Biol., 30: 417-448, 1989. Avella A.C., Delgado L.F., Görner T., Albasi C., Galmiche M., 2009. Ph. de Donato a Effect of cytostatic drug presence on extracellular polymeric substances formation in municipal wastewater treated by membrane bioreactor biortech. Aktas O., Cecen F., 2001. Addition of activated carbon to batch activated sludge reactors in the treatment of landfill leachate and domestic wastewater. Journal of Chemical Technology and Biotechnology 76 (8), 793-802. Altin A., Altin S., Degirmenci M., 2003. Characteristics and treatability of hospital (medical) wastewaters. Fresenius Environmental Bulletin 12 (9), 1098–1108.

Literature Review Chapter I
96
Anderson G. K., Saw C. B., Fernandes M. I. A. P., 1986. Applications of Porous Membrane for Biomass Retention in Biological Wastewater Treatment Processes. Process Biochemistry, 21, 174-184.
B
Brown K., Kulis J., Thomson B., Chapman T., Mawhinney D., 2006. Occurrence of antibiotics in hospital, residual, and dairy effluent, municipal wastewater, and the rio grande in new mexico. Science of the Total Environment 366, 772–783. Bryan R. C., Warner C., 1989. Regulatory Pathways Governing HIV-1 Replication Greene Howard Hughes Medical Institute Department of Medicine and Department of Microbiology and Immunology Duke University Medical Center Durham, North Carolina. Balk F., Ford A., 1999. Environmental risk assessment for the polycyclic musks AHTN and HHCB in the EU. Toxicol. I. Fate and exposure assessment Lett., 111, 57-79. Bitsch N., Dudas C., Korner W., Failing K., Biselli S., Rimkus G., Brunn H., 2002. Estrogenic activity of musk fragrances detected by the E-screen assay using human MCF-7 cells. Archives of Environmental Contamination and Toxicology, 43(3), 257-264. Brown KD., Kulis J., Thomson B., Chapman TH., Mawhinney DB., 2006. Occurrence of antibiotics in hospital, residential, and dairy effluent, municipal wastewater, and the Rio Grande in New Mexico. Sci Total Environ 366:772–783 Bendz D., Paxeus N., Ginn T., Loge F., 2005. Occurrence and fate of pharmaceutically active compounds in the environment, a case study: Hoje in sweden. Journal of Hazardous Materials 122, 195–204. Baker R.W., 2000. Membrane Technology and Applications. McGraw-Hill, New York. Belfort G., Davis R.H., Zydney A.L.,1994. The behavior of suspensions and macromolecular solutions in crossflow microfiltration. Journal of Membrane Science, vol. 96 (1) pp. 1-58 Bowen P. T., Jackson M. K. and Corbitt R. A., 1991. "Sludge Treatment, Usage, and Disposal." Research Journal of the Water Pollution Control Federation 63(4): 406- 414. Baker A., 2001. Fluorescence excitation–emission matrix characterization of some sewage impacted rivers. Environ. Sci. Technol. 35, 948–953. Baquero F., Martinez J., Canton R., 2008. Antibiotics and antibiotic resistance in water environments. Current Opinion in Biotechnology 19, 260–265. Barber J.B., Veenstra J.N.,1986. Evaluation of biological sludge properties influencing volume reduction. Journal of the Water Pollution Control Federation 58, 149-156 Barbusinski K., Koscielniak H.,1995. Influence of Substrate Loading Intensity on Floc Size in Activated Sludge Process, Water Research, 29, p. 1703-1710.

Literature Review Chapter I
97
Barr T. A., Taylor J. M., Duff S. J. B., 1996. Effect of HRT, SRT and temperature on the performance of activated sludge reactors treating bleached kraft mill effluent. Water research 30, 799-810. Beier S., Cramer C., Koster S., Mauer C., Palmowski L., Schroeder H. F., Pinnekamp J., 2011. Full scale membrane bioreactor treatment of hospital wastewater as forerunner for hot-spot wastewater treatment solutions in high density urban areas. Water Science and Technology 63 (1), 66–71. Beier S., Koster S., Veltmann K., Schroder H. F., Pinnekamp J., 2010. Treatment of hospital wastewater effluent by nanofiltration and reverse osmosis. Water Science and Technology 61 (7), 1691–1698. Bernhard M., Muller J., Knepper T.P., 2006. Biodegradation of persistent polar pollutants in wastewater: Comparison of an optimised lab-scale membrane bioreactor and activated sludge treatment. Water Research, 40, 3419-28. Bijlsma L., Sancho J. V., Pitarch E., Ibanez M., Hernandez F., 2009. Simultaneous ultra high-pressure liquid chromatography-tandem mass spectrometry determination of amphetamine and amphetamine-like stimulants, cocaine and its metabolites, and a cannabis metabolite in surface water and urban wastewater. J. of Chromatography A; 1216: 3078-89. Boleda M. R., Galceran M. T., Ventura F., 2007. Trace determination of cannabinoids and opiates in wastewater and surface waters by ultra-performance liquid chromatography tandem mass spectrometry. Journal of Chromatagraphy A; 1175: 38-48. Boon, N., De Windt W., Verstraete W., Top E.M., 2002. Evaluation of nested PCR– DGGE (denaturing gradient gel electrophoresis) with group-specific 16S rRNA 100 primers for the analysis of bacterial communities from different wastewater treatment plants. FEMS Microbiology Ecology 39, 101-112. Bossier P., Verstraete W., 1996. Triggers for microbial aggregation in activated sludge. Appl. Microbiol. Biotechnol. 45: 1-6. Bouju H., Buttiglieri G., Malpei F., 2008. Perspectives of persistent organic pollutants (POPS) removal in an MBR pilot plant. Desalination, 224, 1-6. Brown M. J., and Lester J. N., 1980. Comparison of bacterial extracellular polymer extraction methods. Appl. Environ. Microbiol. 40: 179-185. Bruus J. H., Nielsen P. H. & Keiding K., 1992. On the stability of activated sludge flocs with implications to dewatering. Water research 26, 1597-1604. Bura R., Cheung M., Liao B., Finlayson J., Lee B. C., Droppo I. G., Leppard G. G., Liss, S. N., 1998. Composition of extracellular polymeric substances in the activated sludge floc matrix. Water Sci. Technol. 37 (4-5): 325-333.
Literature Review Chapter I
98
Byrns G., 2001. The fate of xenobiotic organic compounds in wastewater treatment plants. Water Res. 35(10), 2523-2533.
C Carballa M., Omil F., Lema J., Llompart M., Garcia-Jares C., Rodriguez I., Gomez M., Ternes T., 2004. Behavior of pharmaceuticals, cosmetics and hormones in a sewage treatment plant. Water Res. 38, 2918–2926. Carballa M., Omil F., Lema JM., 2007. Calculation methods to perform mass balances of micropollutants in sewage treatment plants. Application to Pharmaceutical and Personal Care Products (PPCPs). Environ Sci Technol 41:884–890. Carlsen S., 1997. How a house works: What happens after the flush. The Family Handyman; March: 107-13. Carlsson G., Orn S., Anderson P.L., Soderstrom H., Norrgren Mar. L., 2000. The impact of musk ketone on reproduction in zebrafish (Danio rerio) , Environ. Res., 50(1-5), 237-241. Castiglioni S., Bagnati R., Fanelli R., Pomati F., Calamari D., Zuccato E., 2006. Removal of pharmaceuticals in sewage treatment plants in italy. Environmental science and technology 40, 357–363. Castiglioni S., Bagnati R., Fanelli R., Pomati F., Calamari D., Zuccato E., 2006. Removal of pharmaceuticals in sewage treatment plants in italy. Environmental science and technology 40, 357–363. Castiglioni S., Bagnati R., Melis M., Panawennage D., Chiarelli P., Fanelli R., Zuccato E., 2011. Identification of cocaine and its metabolites in urban wastewater and comparison with the human excretion profile in urine. Water Research; 45: 5141-50. Centonze V., Pawley J., 1995. Tutorial on Practical Confocal Microscopy and use of the Confocal Test Specimen, in J. B. Pawley (ed.), Handbook of Biological Confocal Microscopy, New York: Plenum Press, 549-570. Chaize S., Huyard A., 1991. Membrane Bioreactor on Domestic Wastewater Treatment Sludge Production and Modeling Approach. Water Science and Technology, 23, 1591-1600. Chang I. S., Bag S. O., Lee C. H., 2001. Effect of Membrane Fouling on Solute Rejection During Membrane Filtration of Activated Sludge. Process Biochemistry, 36, 855-860. Chang I. S., Lee C. H., 1998. Membrane filtration characteristic in membrane – coupled activated sludge system-the effect of physiological states of activated sludge on membrane fouling. Desalination, 120 (3), 221-233. Chang S. and Fane A.G., 2002. Filtration of Biomass with laboratory-scale submerged hollow fibre modules - effect of operating conditions and module configuration. Journal of Chemical Technology and Biotechnology, vol. 77 pp. 1030-1038.

Literature Review Chapter I
99
Chapman D. T., 1983. The Influence of Process Variables on Secondary Clarification. Journal (Water Pollution Control Federation) 55, 1425-1434. Characklis W. G., and Wilderer P. A., 1989. Glossary. p. 369-371 in W. G. Characklis and P. A. Wilderer (eds.), Structure and Function of Biofilms. Wiley, Chichester. Chen W., Westerhoff P., Leenheer J.A., Booksh K., 2003. Fluorescence excitation–emission matrix regional integration to quantify spectra for dissolved organic matter. Environ. Sci. Technol. 37, 5701–5710. Cheryan M., 1998. Ultrafiltration and Microfiltration Handbook. Technomic Publishing Company, Inc., Lancaster. Chiang C., Tsai C., Lin S., Huo C., Lo K., 2003. Disinfection of hospital wastewater by continuous ozonization. Journal of Environmental Science and Health A38 (12), 2895–2908. Chiemchaisri C., Yamamoto K. ,Vigneswaran S., 1993. Household Membrane Bioreactor in Domestic Wastewater Treatment. Water Science and Technology, 27(1) 171-178. Chiemchaisri C., Yamamoto K., Vigneswaran S., 1993. Household Membrane Bioreactor in Domestic Wastewater Treatment. Water Science and Technology, 27(1) 171-178. Choo K. H., Lee C. H., 1996. Membrane Fouling Mechanisms in the Membrane Coupled Anaerobic Bioreactor. Water Research., 30 (8) 1771-1780. Christian, P. (2005). Improved Membrane Filtration for Water and wastewater Using Air Sparging and Backflushing. University of Alaska. PHD, Thesis. Chu C.P., Lee D.J., 2004. Multiscale structures of biological flocs. Chemical Engineering Science 59, 1875-1883. Cicek N., 2003. A Review of Membrane Bioreactor and Their Potential Application in the Treatment of Agricultural Wastewater. Canadian Biosystems Engineering, 45, 6.37-6.49. Cicek N., Franco J.P., Suidan M.T., Urban V., Manem J., 1999. Characterisation and comparison of a membrane bioreactor and a conventional activated-sludge system in the treatment of wastewater containing high molecular weight compounds. Water Environment Research. 71(1), 64-70. Clara M., Kreuzinger N., Strenn B., Gans O., Kroiss H., 2005a. The solids retention time - a suitable design parameter to evaluate the capacity of wastewater treatment plants to remove micropollutants. Water Research 39, 97–106. Clara M., Kreuzinger N., Strenn B., Gans O., Kroiss H., 2005. The solids retention time – a suitable design parameter to evaluate the capacity of wastewater treatment plants to remove micropollutants. Water Res 39:97–106.

Literature Review Chapter I
100
Clara M., Kreuzinger N., Strenn B., Gans O., Kroiss H., 2005a. The solids retention time – a suitable design parameter to evaluate the capacity of wastewater treatment plants to remove micropollutants. Water Research 39, 97–106. Clara M., Strenn B., Gans O., Martinez E., Kreuzinger N., Kroiss H., 2005b. Removal of selected pharmaceuticals, fragrances and endocrine disrupting compounds in a membrane bioreactor and conventional wastewater treatment plant. Water Res. 39, 4797–4807. Clara M., Strenn B., Kreuzinger N., 2004. Carbamazepine as a possible anthropogenic marker in the aquatic environment: investigations on the behaviour of carbamazepine in wastewater treatment and during groundwater infiltration. Water Research 38, 947–954. Coble P.G., 1996. Characterization of marine and terrestrial DOM in seawater using excitation–emission matrix spectroscopy. Mar. Chem. 51 (4), 325–346. Comett T., González-Martínez S., Wilderer P., 2004. Treatment of leachate from the anaerobic fermentation of solid wastes using two biofilm support media. Water Science and Technology, 49 (11-12), 287-294. Comte S., Guibaud G., Baudu M., 2006. Relations between extraction protocols for activated sludge extracellular polymeric substances (EPS) and EPS complexation properties, Part I. Comparison of the efficiency of eight EPS extraction methods. Enzyme Microb. Technol. 38, 237–245. Comte S., Guibaud G., Baudu M., 2007. Effect of extraction method on EPS from activated sludge: an HPSEC investigation. Journal of Hazardous Materials 140, 129-137. Conchello J.-A., Cogswell C. G., Wilson T., Carlsson K., Kino G. S., Lerner, J. M. Lu T., Katzir A. eds.,1994-2005. Three-Dimensional and Multidimensional Microscopy: Image Acquisition and Processing, Volumes I-XII, Bellingham, Washington: SPIE International Society for Optical Engineering. Confer D. R., Bruce E. L., 1998. Location of protein and polysaccharide hydrolytic activity in suspended and biofilm wastewater cultures. Water Res. 32: 31-38. Conrad A., Kontro M., Keinänen M. M., Cadoret A., Faure P., Mansury-Huault L., Block J. C., 2003. Fatty acids of lipid fractions in extracellular polymeric substances of activated sludge flocs. Lipids 38: 1093-1105. Cote P., Buisson H., Arakaki, G., 1997. Immersed Membrane Activated Sludge for the Reuse of Municipal Wastewater. Desalination , 113, 189-196. Côté P., Buisson H., Pound C., Arakaki G., 1997. Immersed membrane activated sludge for the reuse of municipal wastewater. Desalination, 113 (2-3), 189-196.

Literature Review Chapter I
101
D
Da Motta M., Pons M.N., Roche N. and Vivier H., 2001. Characterization of activated sludge by automated image analysis, Biochemical Engineering Journal, 9, p. 165-173. Daims H., Nielsen J.L., Nielsen P.H., Schleifer K.H., Wagner M., 2001. In situ characterization of Nitrospira-like nitrite-oxidizing bacteria in wastewater treatment plants. Applied and content on aggregate deflocculation. Advances in Colloid and Interface Science, 80, 151-182. Darren D. S., Choon T. H., Swee L. K., 2006. Effects of Hydraulic Retention Time on Behavior of Start-up Submerged Membrane Bioreactor with Prolonged Sludge Retention Time. Desalination, 195, 209-225. Darren D. S., Choon T. H., Swee, L. K.,2006. Effects of Hydraulic Retention Time on Behavior of Start-up Submerged Membrane Bioreactor with Prolonged Sludge Retention Time. Desalination, 195, 209-225. Darzynkiewicz Z., 1990. Differential Staining of DNA and RNA in Intact Cells and Isolated Cell Nuclei with Acridine Orange, Methods Cell Biol., 33: 285-298. Daughton C. G., Ternes T. A., 1999. Pharmaceuticals and Personal Care Products in the Environment: Agents of Subtle Change?,Environmental Health Perspectives, 107, 907 – 938. Daughton C., Ternes T., 1999. Pharmaceuticals and personal care products in the environment: Agents of subtle change? Environmental Health Perspectives 107, 907–938. Daughton CG., Ternes TA., 1999. Pharmaceuticals and personal care products in the environment: Agents of subtle change? Environ Health Perspect 107:907–938. Dekker M., Guilbault GG., 1990. Practical Fluorescence. 2nd ed. New York: Marcel Dekker, Inc. Delgado L.F., 2009. Bioréacteur à membrane e ter e pour le traite e t d efflue ts contenant des médicaments anticancéreux: élimination et influence du cyclophosphamide et de ses principaux métabolites sur le procédé. PhD thesis, INP Toulouse, France. DeMaggio S., 2002. Running and Setting Up a Confocal Microscope Core Facility, in B. Matsumoto (ed.), Cell Biological Applications of Confocal Microscopy, in Methods in Cell Biology, Volume 70, New York: Academic Press, 475-486. Desbrow C., Routledge E.J., Brighty G.C., Sumpter J.P., Waldock M., 2011. Identification of Estrogenic Chemicals in STW Effluent. 1. Chemical Fractionation and in Vitro Biological Screening Environmental Science & Technology, 32, 1549-1558. Dewatering Implications. Thesis (PhD). Aalborg University Dick R. I., Vesilind P. A., 1969. The Sludge Volume Index: What Is It? Journal (Water Pollution Control Federation) 41, 1285-1291.

Literature Review Chapter I
102
Dignac M. F., Urbain V., Rybacki D., Bruchet A., Snidaro D., Scribe P., 1998. Chemical description of extracellular polymers: implication on activated sludge floc structure. Water Sci. Technol. 30 (8-9): 45-53. Dongen J., Faisal I. H.,Kazuo Y., 2004. Development and Application of Anaerobic Membrane Bioreactor Systems in the Far-Eastern Countries. University of Tokyo. Japan. www.geocities.com/faisal_hai/AMBRreview. Drews A., Evenblij H., Rosenberger S., 2005. Potential and Draw backs of Microbiology-Membrane Interaction in Membrane Bioreactor. Environmental Progress. 24 (4), 426-433.
E
Edwards VA.,2010. The Nitrogen Cycle- Control Ammonia and Nitrate in Ponds, Lakes, Lagoons, Rivers, and Wastewater Treatment [Online]. Available from: http://www.alken murray.com/BioInfo2-03.htm. Eikelboom D.H., 2000. Process control of activated sludge plants by microscopic investigation. IWA Publishing, (ISBN 9781900222297). Ekama G.A., Barnard J.L., Gunthert F.W., Krebs P., McCorquodale J.A., Parker D.S., Wahlberg Emmanuel E., Blanchard J-M., Keck G., Perrodin Y., 2001. Caractérisation chimique, biologique et écotoxilogique des effluents hospitaliers. Dechets sciences et techniques 22, 31–33. Engelhardt N., Firk W., Warnken W., 1998. Integration of Membrane Filtration into the Activated Sludge Process in Municipal Wastewater Treatment. Water Sci Technol, 38(4 5), 429-436. Entwistle A., Noble M., 1992. The use of Lucifer Yellow, BODIPY, FITC, TRITC, RITC and Texas Red for Dual Immunofluorescence Visualized with a Confocal Scanning Laser Microscope, Journal of Microscopy, 168: 219-238. Eriksson L., Alm B., 1991. Study of flocculation mechanisms by observing effects of a complexing agent on activated sludge properties. Water Science and Technology 24, 21-28. Evenblij H., 2001. Membrane bioreactors for wastewater treatment (Membraanbioreactoren voor de behandeling van afvalwater). (in Dutch) PAO-cursus Membraanfiltratie bij de waterbereiding, Delft, 9 en 10 oktober. Everst S., 2006. Bacterial Conversations. C&EN, Washington. October 23, pp. 17–26. <http://www.CEN-online.org>.
F
Fent K., Weston A., Caminada D., 2006. Ecotoxicology of human pharmaceuticals. Aquatic Toxicology 76, 122–159.

Literature Review Chapter I
103
Ferrer I., Thurman E. M., 2003. Liquid chromatography/mass spectrometry, MS/MS and time-of-flight MS: Analysis of emerging contaminates. Oxford University Press. Fertig EJ., Mattson RH., 2008. Carbamazepine in the book: Epilepsy: A comprehensive textbook, vol 2. Lippincott Williams and Wilkins, Philadephia, PA, pp 1543–1556 Finch J., Ives H., 1950. Settleability Indexes for Activated Sludge. Sewage and Industrial Wastes 22, 833-839. Frølund B., Palmgren R., Keiding K., Nielsen P. H., 1996. Extraction of extracellular polymers from activated sludge using a cation exchange resin. Water Res. 30: 1749-1758. Frølund B., Palmgren R., Keiding K., Nielsen P.H. ,1996. Extraction of extracellular polymers from activated sludge using a cation exchange resin. Water Research 30, 1749-1758 FrølundB., Griebe T., Nielsen P. H., 1995. Enzymatic activity in the activated-sludge floc matrix. Appl. Microbiol. Biotechnol. 43: 755-761.
G
Gander M. A., Jefferson B. and Judd S. J., 2000. Membrane Bioreactors for Use in Small Wastewater Treatment Plants: Membrane Materials And Effluent Quality. Water Science and Technology, 41(1) 205-211. Gander M., Jefferson B. and Judd S., 2000. Aerobic MBRs for Domestic Wastewater Treatment: A Review with Cost Considerations. Separation and Purification Technology. 18 (2), 119-130. Gautam A., Kumar S., Sabumon P., 2007. Preliminary study of physico-chemical treatment options for hospital wastewater. Journal of Environmental Management 83, 289–306. Geesey G. G., 1982. Microbial exopolymers: Ecological and economic considerations. ASM News 48: 9-14. Gheorghe A., van Juijs A., Pecceu B., Bervoets L., Jorens P.G., Blust R.,2008. Analysis of cocaine and its principal metabolites in waste and surface water using solid-phase extraction and liquid chromatography-ion trap tandem mass spectrometry. Anal. Bioanal. Chem.; 391: 1309-19. Gobel A., McArdell CS., Joss A., Siegrist H., Giger W., 2007. Fate of sulfonamides, macrolides, and trimethoprim in different wastewater treatment technologies. Sci Total Environ . 372:361–71. Gobel A., Thomsen A., McArdell CS., Alder AC., Giger W., Theib N., Loeffler D., Ternes TA., 2005. Extraction and determination of sulfonamides, macrolides, and trimethoprim in sewage sludge. J Chromatogr A 1085:179–189.

Literature Review Chapter I
104
Gobel A., Thomsen A., McArdell CS., Joss A., Giger W., 2005. Occurrence and Sorption Behavior of Sulfonamides, Macrolides, and Trimethoprim in Activated Sludge Treatment. Environ Sci Technol 39:3981–3989 Goddard A. J., Forster C. F., 1987. Stable foams in activated sludge plants. Enzyme and Microbial Technology 9, 164-168. Goldman R. D., Spector D. L., 2005. Live Cell Imaging: A Laboratory Manual, New York: Cold Spring Harbor Press. Gomez M., Bueno M., Lacorte S., Fernandez-Alba A., Aguera A., 2007. Pilot survey monitoring pharmaceuticals and related compounds in a sewage treatment plant located on the mediterranean coast. Chemosphere 66, 993– 1002. Goodwin J. A. S., Forster C. F., 1985. A further examination into the composition of activated sludge surface in relation to their settlement characteristics. Water Res. 19: 527-533. Grady, C. P. L. Jr., G. T. Daigger and H. C. Lim, Biological Wastewater Treatment, Second Edition, Marcel Dekker, Inc., New York, 1999. Gratton E., vandeVen M. J., Pawley (ed.) J. B., 1995. Laser Sources for Confocal Microscopy, in Handbook of Biological Confocal Microscopy, New York: Plenum Press, 69-98, 1995. Griffiths PR., de Haseth JA., 2007. Fourier Transform Infrared Spectroscopy. Wiley, New York. Grijspeerdt K., Verstraete W., 1996. A Sensor for a Secondary Clarifier Based on Image Analysis, Water Science & Technology, 33, p. 61-70. Grijspeerdt K., Verstraete W., 1997. Image Analysis to Estimate the Settleability and Concentration of Activated Sludge, Water Research, 31, p. 1126-1134. Grontmij| 2005. Influent- e efflue to derzoek r zi s Deel B, hormoonverstorende stiffen, AquaSense. Gulkowska A., Leung HW., So MK., Taniyasu S., Yamashita N., Yeung LWY., Richardson BJ., Lei AP., Giesy JP., Lam PKS., 2008. Removal of antibiotics from wastewater by sewage treatment facilities in Hong Kong and Shenzhen, China. Water Res 42:395–403. Günder B., 2001. The Membrane Coupled-Activated Sludge Process in Municipal Wastewater Treatment. Technomic Publishing Company Inc., Lancaster, USA. Guo W., Vigneswaran S., Ngo H.-H., Xing W., Goteti P., 2008. Comparison of the 362 performance of submerged membrane bioreactor (SMBR) and submerged membrane 363 adsorption bioreactor (SMABR). Bioresource Technology, 99, 1012.
H
Literature Review Chapter I
105
Hai F.I., Yamamoto K., Nakajima F., Fukushi K., 2008. Removal of structurally different dyes in submerged membrane fungi reactor--Biosorption/PAC-adsorption, membrane retention and biodegradation. Journal of Membrane Science, 325, 395-403. 49–72. Halling-Sorensen B., Nielsen S. N., Lanzky P., Ingerslev F., Lutzhoft H., Jorgensen S., 1998. Occurrence, fate and effects of pharmaceutical substances in the environment - a review. Chemosphere 36 (2), 357–393. Hany J., Nagel R., 1995. Detection of UV-sunscreen agents in breast milk. Deutsche Lebensmittel 91, 341–245. Harris DC., 2007. Quantitative Chemical Analysis. W.H. Freeman and Company. Haugland R.A., Vesper S.J., Wymer L.J., 1999. Quantitative measurement of Stachybotrys chartarum conidia using real time detection of PCR products with the TaqManTM fluorogenic probe system. Mol. Cell. Probes 13, 329–340. Hawkshead J., 2008. Hospital wastewater containing pharmaceutically active compounds and drug-resistant organisms: a source of environmental toxicity and increased antibiotic resistance. Journal of Residuals Science and Technology 5 (2), 51–60. Heberer T., 2002a. Occurrence, fate, and removal of pharmaceutical residues in the aquatic environment: a review of recent research data. Toxicology Letters 131, 5–17. Hermansson M. (1999) The DLVO theory in microbial adhesion. Colloids and Surfaces B – Biointerfaces 14, 105-119 Hibbs A. R., 2004. Confocal Microscopy for Biologists, New York: Kluwer Academic. Higgins M. J., and Novak J. T., 1997. Characterization of extracellular protein and its role in bioflocculation. J. Environ. Eng. 123: 479-485. Horan N. J., Bu'Ali A. M., Eccles C. R., 1988. Isolation, identification and characterization of filamentous and floc-forming bacteria from activated sludge flocs. Environ. Technol. Lett. 9: 449-457. Hsieh K. M., Murgel G. A., Lion L. W., Shuler M. L., 1994. Interaction of microbial biofilms with toxic trace metals: 1. observation and modeling of cell growth, attachment, and production of extracellular polymer. Biotechnol. Bioeng. 44: 219-231. Huang CH., Renew JE., Smeby KL., Pinkerston K., Sedlak DL., 2001. Assessment of potential antibiotic contaminants in water and preliminary occurrence analysis. Water Resour Update in microcolony strength of probe-defined bacteria in activated sludge flocs. FEMS Microbiology Ecology 50, 123-132.
J

Literature Review Chapter I
106
Jafrudeen, Naved A., 2009. STUDY OF WIDELY USED TREATMENT TECHNOLOGIES FOR HOSPITAL WASTEWATER AND THEIR COMPARATIVE Vol. 5, Issue 1, pp. 227-240. Jahn A., Nielsen P. H., 1995. Extraction of extracellular polymeric substances (EPS) from biofilms using a cation exchange resin. Water Sci. Technol. 32 (8): 157-164. Janga N., Ren X., Kim G., Ahn Ch., Cho J., Kim I.S., 2007. Characteristics of soluble microbial products and extracellular polymeric substances in the membrane bioreactor for water reuse. Desalination 202 (1–3), 90–98. JARVIS P., JEFFERSON B., GREGORY J., PARSONS S.A., 2005. A review of floc strength and mechanism of bacterial adhesion. Colloids and Surfaces B: Biointerfaces 4, 5-22 Jefferson B., Laine A. L., Judd S. J., Stephenson T., 2000. Membrane Bioreactors and Their Role in Wastewater Reuse. Water Science and Technology, 41 (1) 197-204. Jenkins D., Richard M. G. & Daigger G. T., 2003. Manual on the causes and control of activated sludge bulking, foaming, and other solids separation problems. (Lewis Publishers/CRC Press). Jin B., Wilén B.M., Lant P., 2003. A comprehensive insight into floc characteristics and their impact on compressibility and settleability of activated sludge, Chemical Engineering Journal, 95, p. 221-234. Jin B., Wilén B-M., Lant P., 2003. A comprehensive insight into floc characteristics and their impact on compressibility and settleability of activated sludge. Chemical Engineering Journal, 95(1-3), 221-234. Jjemba P., 2006. Excretion and ecotoxicity of pharmaceutical and personal care products in the environment. Ecotoxicology and Environmental Safety 63, 113–130. Johnson A.C., Aerni H.-R., Gerritsen A., Gibert M., Giger W., K. Hylland,M. Jurgens, Nakari T., Pickering A Suter ., M.J.-F., Svenson A., Wettstein F.E., 2005. Comparing steroid estrogen, and nonylphenol content across a range of European sewage plants with different treatment and management practices Water Research, 39, 47–58. Johnson I., 1998. Fluorescent Probes for Living Cells, Histochem. J., 30: 123-140. Jones OAH., Voulvoulis N., Lester JN., 2004. Potential ecological and human health risksassociated with the presence of pharmaceutically active compounds in the aquatic environment. Crit Rev Toxicol 34:335–350. Jorand F., Boue-Bigne F., Block J. C., Urbain V., 1998. Hydrophobic/hydrophilic properties of activated sludge exopolymeric substances. Water Sci. Technol. 37 (4-5): 307-315.
Literature Review Chapter I
107
Joss A., Andersen H. , Ternes T.,. Richle P.R, Siegrist H., 2004. Removal of Estrogens in Municipal Wastewater Treatment under Aerobic and Anaerobic Conditions, Consequences for Plant Optimization, Environ. Sci. Technol., 37, 3047-3055. Joss A., Keller E., Alder A., Gobel A., Mcardell C., Ternes T., Siegrist H., 2005. Removal of pharmaceuticals and fragrances in biological wastewater treatment. Water Research 39, 3139–3152. Joss A., Zabczynski S., Gobel A., Hoffmann B., Loffler D., McArdell CS., Ternes TA., Thomsen A., Siegrist H., 2006. Biological degradation of pharmaceuticals in municipal wastewater treatment: proposing a classification scheme. Water Res 40(8):1686–1696. Jossa A., Kellera E., Aldera A.C., Gobela A., McArdella C.S., Ternes T., Siegrist H., 2005. Removal of pharmaceuticals and fragrances in biological wastewater treatment. Water Research, 39, 3139–3152. JUDD S., 2006. The MBR book: Principles and Applications of Membrane Bioreactors in Water and Wastewater Treatment. Oxford: Elsevier. Judd S., 2008. The status of membrane bioreactor technology. Trends in Biotechnology 40 (2), 109–116. Jufang W., 2004. Modeling adsorption of organic compounds on activated carbon. Environmental Microbiology 67, 5273-5283.
K
Kajitvichyanukul E., Suntronvipart N., 2006. Evaluation of biodegradability and oxidation degree of hospital wastewater using photo-fenton process as the pretreatment method. Journal of Hazardous Materials B138, 384–391. Kalsch W., 1999. Biodegradation of the iodinated X-ray contrast media diatrizoate and iopromideScience of the Total Environment, 225, 143-153. Kang I. J., Yoon S. H., Lee C. H., 2002. Comparison of the Filtration Characteristics of Organic and Inorganic Membranes in a Membrane-Coupled Anaerobic Bioreactor. Water Research, 36, 1803-1813. Karickhoff S. W., Brown D. S. and Scott T. A., 1979. Sorption of hydrophobic pollutants on natural sediments. Wat. Res. 13, 241-248. Karr P.R., Keinath T.M., 1978. Limitations of the specific resistance and CST tests for sludge dewatering. Filtration and Separation 15, 543-544. Karthikeyan KG., Meyer MT., 2006. Occurrence of antibiotics in wastewater treatment facilities in Wisconsin, USA. Sci Total Environ 361:196–207.

Literature Review Chapter I
108
Kasprzyk-Hordern B., Dinsdale R., Guwy A., 2009. The removal of pharmaceuticals, personal care products, endocrine disruptors and illicit drugs during wastewater treatment and its impact on the quality of receiving waters. Water Research 43, 363–380. Kasten F. H., 1999. Introduction to Fluorescent Probes: Properties, History, and Applications, in W. T. Mason (ed.), Fluorescent and Luminescent Probes for Biological Activity, New York: Academic Press, 17-39. Kellner R., Mermet J-M., Otto M., Valcárcel H., Widmer HM., 2004. Analytical chemistry: a modern approach to analytical science. Wiley-VCH, Weinheim, Berlin, New York, Chichester, Brisbane, Singapore, Toronto. Khan S., Ongerth J., 2005. Occurrence and removal of pharmaceuticals at an Australian sewage treatment plant. Water -, 35–39. Kim J. S., Lee C. H., Chang I. S., 2001. Effect of Pump Shear on the Performance of a Crossflow Membrane Bioreactor. Water Research, 35 (9) 2137-2144. Kim S., Eichhorn P., Jensen JN., Weber AS., Aga DS., 2005. Removal of antibiotics in wastewater: effect of hydraulic and solid retention times on the fate of tetracycline in the activated sludge process. Environ Sci Technol 39:5816–5823. Kim S., Eichhorn P., Jensen JN., Weber AS., Aga DS., 2005. Removal of antibiotics in wastewater: Effect of hydraulic and solid retention times on the fate of tetracycline in the activated sludge process. Environ. Sci. Technol. 39(15), 5816-5823. Kim S.H., Shon H.K., Ngo H.H., 2010. Adsorption characteristics of antibiotics trimethoprim on powdered and granular activated carbon. Journal of Industrial and Engineering Chemistry 16, 344–349. Kimura K., Hara H.,Watanabe Y., 2007. Elimination of selected acidic pharmaceuticals from municipal wastewater by an activated sludge system and membrane bioreactors. Environmental Science and Technology, 41, 3708–3714. Kimura K., Hera H., Watanabe Y., 2005. Removal of pharmaceutical compounds by submerged membrane bioreactors (mbrs). Desalination 178, 135–140. Kinney CA., Furlong ET., Kolpin DW., Burkhardt MR., Zaugg SD., Werner SL., Bossio JP., Benotti MJ., 2008. Bioaccumulation of pharmaceuticals and other anthropogenic waste indicators in earthworms from agricultural soil amended with biosolid or swine manure. Environ Sci Technol 42:1863–1870. Klausen M.M., Thomsen T.R., Nielsen J.L., Mikkelsen L.H., Nielsen P.H., 2004. Variations in the aquatic environment: investigations on the behaviour of Carbamazepine in wastewater treatment and during groundwater infiltration. Water Res 38:947–954.

Literature Review Chapter I
109
Kloepfer A., Gnirss R., Jekel M., Reemtsma T., 2004. Occurrence of benzothiazoles in municipal wastewater and their fate in biological treatment. Water Sci. Technol. 50(5), 203-208. Kobayashi Y., Yasojima M., Komori K., Suzuki Y., Tanaka H., 2006. Removal characteristics of human antibiotics during wastewater treatment in Japan. Water Pract Technol 1:1–9 Kosma C., Lambropoulou D., Triantafyllos A., 2010. Occurrence and removal of ppcps in municipal and hospital ,wastewaters in greece. Journal of Hazardous Materials 179, 804–817. Kreuzinger N., Clara M., Droiss H., 2004. Relevance of the sludge retention time (srt) as design criteria for wastewater treatment plants for the removal of endocrine disruptors and pharmaceuticals from wastewater. Water Science and Technology 50 (5), 149–156. Kummerer K., 2009. Antibiotics in the aquatic environment – a review – part i. Chemosphere 75 (4), 417–434. Kummerer K., 2001. Drugs in the environment: emission of drugs, diagnostic aids and disinfectants into wastewater by hospital in relation to other sources - a review. Chemosphere 45, 957–969. Kummerer K., 2001. Drugs in the environment: emission of drugs, diagnostic aids and disinfectants into wastewater by hospital in relation to other sources – a review. Chemosphere 45, 957–969. Kummerer K., 2004. Resistance in the environment. Journal of Antimicrobial Chemotherapy 54 (2), 311–320. Kummerer K., Henninger A., 2003. Promoting resistence by the emission of antibiotics from hospitals and households into effluent. Clinical Microbiology and Infection 9 (12), 1203 1214. Larsen P., Nielsen J.L., Svendsen T.C., Nielsen P.H.,2008. Adhesion characteristics of nitrifying bacteria in activated sludge. Water Research 42, 2814-2826.
L
Laspidou Ch.S., Rittmann B.E., 2002. A unified theory for extracellular polymeric substances, soluble microbial products, and active and inert biomass. Water Research 36 (11), 2711–2720. LE-CLECH P., CHEN V., FANE T. A. G., 2006. Fouling in membrane bioreactors used in wastewater treatment. Journal of Membrane Science, 284, 17-53. Lee J., Ahn W. Y., Lee C.H., 2001. Comparison of the filtration characteristics between attached and suspended growth microorganism in submerged membrane bioreactor. Water Research, 35 (10), 2435-2445.
Literature Review Chapter I
110
Lee B. C., 1997. The influence of nutrients on floc physicochemical properties and structure in activated sludge processes M.A.Sc. thesis, University of Toronto. Leecaster M., Weisberg S.B., 2001. Effect of sampling frequency on shoreline microbiology assessments. Mar. Pollut. Bull. 42, 1150–1154. Leiknes T., & Ødegaard H., (2007). The development of a biofilm membrane bioreactor. Desalination, 202, 135-143. Lesjean B., Gnirss R., Buisson H., Keller S., Tazi-Pain A., Luck F., 2005. Outcomes of a 2-year investigation on enhanced biological nutrients removal and trace organics elimination in membrane bioreactor (MBR). Water Sci. Technol. 52(10-11), 453-460. Li D. H. and Ganczarczyk J. J., (1990). Structure of activated sludge flocs. Biotechnology and bioengineering, 35 (1), 57-65. Li D.H., Ganczarczyk J.J., 1989. Fractal Geometry of Particle Aggregates Generated in Water and Wastewater Treatment Processes, Environmental Science & Technology, 23, p. 1385-1389. Li D.H., Ganczarczyk J.J., 1988. Flow through activated sludge flocs, Water Research, 22, p. 789-792. Li D.H., Ganczarczyk J.J., 1991. Size distribution of activated sludge flocs, Res. J. Wat. Pollut. Control Fed., 63, p. 806-814. Li D.H., Ganczarczyk J.J., 1992. Advective transport in activated sludge flocs, Water Environmental Research, 64, p. 236-240. Liao B. Q., Allen D. G., Droppo I. G., Leppard G. G., Liss S. N., 2001. Surface properties of sludge and their role in bioflocculation and settleability. Water research 35, 339-350. Liao B. Q., Allen D. G., Droppo I. G., Leppard G. G., Liss S. N., 2001. Surface properties of sludge and their role in bioflocculation and setteability. Water Research, 35 (2), 561-564. Lienert J., Burki T., Escher B., 2007a. Reducing micropollutants with source control: substance flow analysis of pharmaceuticals in faeces and urine. Water Science and Technology 56 (5), 87–96. Lienert J., Gudel K., Escher B., 2007b. Screening method for ecotoxicological hazard assessment of 42 pharmaceuticals considering human metabolism and excretory routes. Environmental Science and Technology 41, 4471–4478. Lindqvist N., Tuhkanen T., Kronberg L., 2005. Occurrence of acidic pharmaceuticals in raw and treated sewages and in receiving waters. Water research 39, 2219–2228.

Literature Review Chapter I
111
Lishman L., Smyth S. A., Sarafin K., Kleywegt S., Toito J., Peart T., Lee B., Servos M., Beland M., Seto P., 2006. Occurrence and reductions of pharmaceuticals and personal care products and estrogens by municipal wastewater treatment plants in Ontario, Canada Science of the Total Environment, 367, 544–558. Liss S.N., Droppo I.G., Flannigan D.T., Leppard G.G., 1996. Floc architecture in wastewater and natural riverine systems. Environmental Science and Technology 32, 680-686. Liu H., Fang H. H. P., 2002. Extraction of extracellular polymeric substances (EPS) of sludges. Journal of Biotechnology 95, 249-256. Liu Q., Zhou, Y., Chen L., Zheng, X., 2010. Application of mbr for hospital wastewater treatment in china. Desalination 250, 605–608. Liu X.-W., Sheng G.-P., Yu H.-Q., 2009. Physicochemical characteristics of microbial granules. Biotechnology Advances 27, 1061-1070. Lojkine M.H., Field R.W., Howell J.A., 1992. Crossflow microfiltration of cell suspensions: a review of models with emphasis on particle size effects. Trans. Inst. Chem. Eng, vol. 70 pp. 149- 164. Lowry O.H., Rosebrough N.J., Farr A.L., Randall R.J., 1951. Protein measurement with the folin phenol reagent. J. Biol. Chem. 193, 265–275. Lu X.Q., Jaffe R., 2001. Interaction between Hg(II) and natural dissolved organic matter: a fluorescence spectroscopy based study. Water Res. 35, 1793–1803.
M
Machado E., Kist, L., Schmidt R., Hoeltz J., Dalberto D., Alcayagua E., 2007. Secondary hospital wastewater detoxification and disinfection by advanced oxidation processes. Environmental Technology 28, 1135–1143. Mahnik, S.N. , Lenz K. ,Weissenbacher N., R.M. Mader, M. Fuerhacker, 2007. Fate of -fluorouracil, doxorubicin, epirubicin, and daunorubicin in hospital wastewater and their elimination by activated sludge and treatment in a membrane-bio-rea tor s ste , Chemosphere. Mari F., Politi L., Biggeri A., Accetta G., Trignano C., Di Padua M., 2009. Cocaine and heroin in waste water plants: A 1-year study in the city of Florence, Italy. Forensic Sci., Int.; 198: 88-92. Mason W. T., 1999. Fluorescent and Luminescent Probes for Biological Activity, New York: Academic Press. Masters B. R., 1996. Selected Papers on Confocal Microscopy, SPIE Milestone Series, Volume MS 131, Bellingham, Washington: SPIE Optical Engineering Press.

Literature Review Chapter I
112
Matamoros V., Garcia J., Bajona J.M., 2008. Organic micropollutant removal in a full-scale surface flow constructed wetland fed with secondary effluent. Water Res. 42, 653–660. Matamoros V., Mujeriego R., Bayona, J., 2007b. Trihalomethane occurrence in chlorinated reclaimed water at full-scale wastewater treatment plants in ne spain. Water research 41, 3337–3344. Meng F., Chae S.-R., Drews A., Kraume M., Shin H.-S., Yang F., 2009. Recent advances in membrane bioreactors (MBRs): membrane fouling and membrane material. Water Research 43 (6), 1489–1512. Meritxell G., Mira P., Damia B., 2006. Development of a multi-residue analytical methodology based on liquid chromatography–tandemmass spectrometry (LC–MS/MS) for screening and trace level determination of pharmaceuticals in surface and wastewaters; Talanta, 70, 678–690. Mesdaghinia A., Naddafi K., Nabizadeh R., Saeedi R., Zamanzadeh M., 2009. Wastewater characteristics and appropriate method for wastewater management in the hospitals. Iranian Journal Public Health 38 (1), 34–40. Metcalfe C., Koening B., Bennie D., Servos M., Ternes T., Hirsch R., 2003a. Occurrence of neutral and acidic drugs in the effluents of canadian sewage treatment plants. Environmental Toxicology and Chemistry 22 (12), 2872–2880. Metcalfe C., Miao X., Koening Struger J., 2003b. Distribution of acidic and neutral drugs in surface waters near sewage treatment plants in the lower great lakes, canada. Environmental Toxicology and Chemistry 22 (12), 2881–2889. Metcalfe E., 1991. Wastewater Engineering. Treatment, disposal, reuse. Mc Graw Hill. Miao X-S., Yang J-J., Metcalfe CD., 2005. Carbamazepine and its metabolites in wastewater B – Biointerfaces 14, 105-119 MIKKELSEN L. H., KEIDING K., 1999. Equilibrium aspects of the effects of shear and solids content on aggregate deflocculation. Advances in Colloid and Interface Science, 80, 151-182. MIKKELSEN L. H., 1999. A Physico-Chemical Approach to the Floc Strength Concept – with Dewatering Implications. Thesis (PhD). Aalborg University. Mikkelsen L.H., Gotfredsen A.K., Agerbæk M.L., Nielsen P.H., Keiding K., 1996. Effects of colloidal stability on clarification and dewatering of activated sludge. Water Science and Technology 34, 449-457. Mohn W., Tiedje J., 1992. Microbial reductive dehalogenation. Microbiol. Rev. 56, 482–507. Morgan-Sagastume F., Laren P., Nielsen J.L., Nielsen P.H., 2008. Characterization of the loosely attached fraction of activated sludge bacteria. Water Research 42, 843-854.
Literature Review Chapter I
113
Mukai T., Takimono K., Kohno T., Okada M., 2000. Ultrafiltratiom behaviour of extracellular and metabolic products in activated sludge system with UF separation process. Water Research, 34 (3), 902-908. Mulder M., 1996. Basic principles of membrane technology. Kluwer Academic Publishers, Dordrecht. Münch E., Pollard P.C., 1997. Measuring bacterial biomass-COD in wastewater containing particulate matter. Water Research 31, 2550-2556. Murakami T., Usui J., Takamura K.,Yashikawa T., 2000. Application of Immersed-type Membrane Separation Activated Sludge Process to Municipal Wastewater Treatment. Water Science and Technology, 41(10) 295-301. Murphy D. B., 2001Fundamentals of Light Microscopy and Electronic Imaging, New York: Wiley-Liss. Mustonen T.K., Spencer S.M., Hoskinson R.A., Sachs D.P., Garvery A.J., 2005. The influence of gender, race, and menthol content on tobacco exposure measures. Nicotine Tobacco Research; 7: 581-90. Nadir., 2005. Internet http://www.microdyn-nadir.de. Nagaoka H., Ueda S., Miya A., 1996. Influence of bacterial extracellular polymers on the membrane separation activated sludge process. Water Science and Technology, 34 Nagtegaal M., Ternes T.A. , Baumann W., Nagel R., 1997. Detection of UV-sunscreen agents in water and fish of the Meerfelder Maar the Eifel Germany. UWSF-Z fur Umweltchem Okotox, 9(2),79–86. Nakada N., Tonishima T., Shinohara H., Kiri K., Takada H., 2006. Pharmaceutical chemicals and endocrine disrupters in municipal wastewater in tokyo and their removal during activated sludge treatment. Water Research 40, 3297–3303. Nakata H. Kannan K. Jones P.D. Gies J.P., 2005. Determination of fluoroquinolone antibiotics in wastewater effluents by liquid chromatography–mass spectrometry and fluorescence detection Chemosphere, 58, pp. 759–766. Námer J., Ganczarczyk J.J., 1993. Settling Properties of Digested Sludge Particle Aggregates, Water Research, 27, p. 1285-1294. Ng A.S., Stenstrom M.K., 1987. Nitrification in powdered activated carbon activated sludge process. Journal of Environmental Engineering 113 (6), 1285e1301.
Literature Review Chapter I
114
Ng W. J., Ong S. L., Gomez M. J., Hu J. Y., Fan X. J., 2000. Study on a Sequencing Membrane Bioreactor for the Wastewater Treatment. Water Science and Technology, 41 (10-11) 227-237. Nielsen J.L., Nielsen P.H., 2002. Activated sludge – The floc. In Encyclopedia of Environmental and in biosolids in a municipal wastewater treatment plant. Environ Sci Technol 39: 7469 7475 Nielsen P.H., Frølund B., Spring S., Caccavo F.J., 1997. Microbial Fe (III) reduction in activated sludge. Journal of Applied Microbiology 20, 645. Nielsen P.H., Jahn A., Wingender, J., Neu, T.R., Flemming, H.-C. (Eds.,) 1999. In: Microbial Extracellular Polymeric Substances. Springer Verlag, Berlin, Heidelberg, New York, pp. Novak J.T., Sadler M.E., Murthy S.N., 2003. Mechanisms of floc destruction during anaerobic and aerobic digestion and the effect on conditioning and dewatering of biosolids. Water Research 37, 3136-3144. Nuijs A.L.N., Castiglioni S., Tarcomnicu I., Postigo C., de Alda M.L., Neels H., Zuccato E., Barcelo D., Covaci A., 2011. Illicit drug consumption estimations derived from wastewater analysis: A critical review. Science of the Total Environment; 409: 3564-77.
O
Ødegaard H., (2000). Advanced compact wastewater treatment based on coagulation and moving bed biofilm processes. Water Science and Technology, 42 (12), 33-48. Ødegaard H., (2006). Innovations in wastewater treatment: the moving bed bioreactor. Water Science and Technology, 53 (9), 17-33. Onesios K.M., Yu J.T., Bouwer, E.J., 2009. Biodegradation and removal of pharmaceuticals and personal care products in treatment systems: a review. Biodegradation 20, 441–466.
P
Palmgren R., Nielsen P. H., 1996. Accumulation of DNA in the exopolymeric matrix of activated sludge and bacterial cultures. Water Sci. Technol. 34 (5-6): 233-240. Park C., Novak J., 2009. Characterization of lectins and bacterial adhesins in activated sludge. Park C., Novak J.T., 2007. Characterization of activated sludge exocellular polymers using several cation-assocaited extraction methods. Water Research 41, 1679-1688. Park C., Novak J.T., Helm R.F., Ahn Y-O., Esen A., 2008. Evaluation of the extracellular proteins in full-scale activated sludges. Water Research 42, 3879-3889.
Literature Review Chapter I
115
Park N., Vanderford B., Snyder S., Sarp S., Kim S., Cho J., 2009. Effective controls of micropollutants included in wastewater effluent using constructed wetlands under anoxic condition. Ecological Engineering 35, 418–423. Parsek M.R., Greenberg E.P., 2005. Sociomicrobiology: the connections between quorum sensing and biofilms. Trends in Microbiology 13 (1), 27–33. Pawley J. B., 1995. Handbook of Biological Confocal Microscopy, New York: Plenum Press. Pawley J., Pawley J. B. (ed.), 1995. Fundamental Limits in Confocal Microscopy, in Handbook of Biological Confocal Microscopy, New York: Plenum Press, 19-37. Paxéus N., 2004. Removal of selected non-steroidal anti-inflammatory drugs (NSAIDs), gemfibrozil, carbamazepine, β-blockers, trimethoprim and triclosan in conventional wastewater treatment plants in five EU countries and their discharge to the aquatic environment, Water Sci. Technol. 50 (5) (253–260). Peng X., Wang Z., Kuang W., Tan J., Li K., 2006. A preliminary study on the occurrence and behavior of sulfonamides, ofloxacin and chloramphenicol antimicrobials in wastewaters of two sewage treatment plants in Guangzhou, China. Sci Total Environ 371:314–322. Peterman E. J. G., Sosa H., Moerner W. E.,2004. Single-Molecule Fluorescence Spectroscopy and Microscopy of Biomolecular Motors, Ann. Rev. Phys. Chem. 55: 79-96. Petrovic M. ; Gros M. ; Barcelo D. , 2006. Multi-residue analysis of pharmaceuticals in wastewater by ultra-performance liquid chromatography– quadrupole–time-of-flight mass spectrometry. Journal of Chromatography A, 1124, 68–81. Petrovic M., Barcelo D., 2007. Analysis, fate and removal of pharmaceuticals in the water cycle. Vol. 50. Elsevier. Petrovic M., Gonzales S., Barceló D., 2003. Analysis and removal of emerging contaminants in wastewaters and drinking waters. TrAC Trends Anal. Chem. 22 (10), 685–696.
Pokalsky C., Wick P., Harms E., Lytle FE., Van Etten RL., 1995. Fluorescence Resolution of the Intrinsic Tryptophan Residues of Bovine Protein Tyrosyl Phosphatase. The Journal of Biological Chemistry. 270: 3809-3815.
Pontius, F., 2001. A Balanced Approach to Regulating Endocrine Disrupting Chemicals in Drinking Water. Inside EPA Risk Policy Report. October 15. pg. 32-35. Publishing, London, pp. 308–327 Pujols R., Canler J.P., 1992. Biosorption and dynamics of bacterial populations in activated sludge. Water Research, 26, p. 209-212. Putschew A., Wischnack S., Jekel M., 2000. Occurence of triiodinated X-ray contrast agents in the aquatic environment Science of the Total Environment, 255, 129–134.

Literature Review Chapter I
116
R
‘adje o ić J., atŏsić ., ijato ić I., Petro ić ., Barceló D., 2008. Membrane bioreactor as advanced wastewater treatment technology. Hdb Env Chem, 5 (S/2), pp. 37–101. Radjenovic J., Petrovic M., Barceló D., 2007. Analysis of pharmaceuticals in wastewater and removal using a membrane bioreactor. Anal. Bioanal. Chem. 387, 1365–1377. Radjenovic J., Petrovic M., Barceló D., 2009. Fate and distribution of pharmaceuticals in wastewater and sewage sludge of the conventional activated sludge (CAS) and advanced membrane bioreactor (MBR) treatment. Water Res. 43, 831–841. Raunkjaer K., Hvitved-Jacobsen T., Nielsen, P.H., 1994. Measurement of pools of protein, carbohydrate and lipid in domestic wastewater. Water Res. 28 (2), 251–262. Regis Technologies Inc. 2000. GC derivatization. http://www.registech.com/Library/gc derrev.pdf. Reif R., Suarez S., Omil F., Lema J., 2008. Fate of pharmaceuticals and cosmetic ingredients during the operation of a mbr treating sewage. Desalination 221, 511–517. Remy M., Van der Marel P., Zwijnenburg A., Rulkens W., Temmink H., 2009. Low dose powdered activated carbon addition at high sludge retention times to reduce fouling in membrane bioreactors, Water Research, Vol. 43, pp. 345-350. Reynolds D.M., 2002. The differentiation of biodegradable and non-biodegradable dissolved organic matter in waste waters using fluorescence spectroscopy. J. Chem. Technol. Biotechnol. 77, 965–972. Rijnaarts H.H.M., Norde W., Bouwer E.J., Lyklema J., Zehnder A.J.B., 1995. Reversibility Robinson JW., 2005. Undergraduate Instrument Analysis. New York, NY. Marcel Deckker Inc. p. 178-230 Rodriguez-Reinoso F., Linares-Solano A., 1989. Chemistry and physics of carbon: a series of advances (P.A.Thrower, Ed.), Marcel Dekker, Inc., New York. 1989. Rost F. W. D., 1992. Fluorescence Microscopy, Volume 1, New York: Cambridge University Press. Rusten B., Siljudalen, J. G., & Nordeidet, B. (1994). Upgrading to nitrogen removal with the KMT moving bed biofilm process. Water Science and Technology, 29 (12), 185-195.
S
Sandison D., Webb W., 1994. Background Rejection and Signal-to- Noise Optimization in the Confocal and Alternative Fluorescence Microscopes, Applied Optics: 33: 603-610.

Literature Review Chapter I
117
Sarafraz S., Khani M., Yaghmaeian K., 2007. Quality and quantity survey of hospital wastewater in hormozgan province. Iran Journal of Health Science Engineering 4 (1), 43–50. Schmid M., 2003. Characterization of activated sludge flocs by confocal laser scanning microscopy and image analysis. Water research 37, 2043-2052 . Schrap M.S., G.B.J. Rijs Beek M.A., Maaskant J.F.N., Staeb J., Stroomberg G.,Tiesnitsch J., RIZA., 2003, Humane en veterinaire geneesmiddelen in Nederlands oppervlaktewater en afvalwater; een “ ree i g , rapport 2003.023. (ISBN 36956234). Schreiber A., 2010. Advantages of using triple quadrupole over single quadrupole mass spectrometry to quantify and identify the presence of pesticides in water and soil samples. AB SCIEX: 1-6. Schwarzenbach R., Gschwend P., Imboden D., 2003. Environmental Organic Chemistry, 2nd Edition. Wiley Interscience, A John and Sons, Inc., Publication. Seung H. B., 2004. Aerobic And Anaerobic Membrane Bioreactors (MBRs) For Dilute Municipal Wastewater Treatment. PhD Thesis. Illinois Institute Of Technology. Chicago. Shin H-S., Park H-S.,1991. Enhanced nutrient removal in porous biomass carrier sequencing batch reactor (PBCSBR). Water Science and Technology, 23, 719-728. Shorvon S., Perucca E., FIsh D., Dodson E., 2004. Carbamazepine in: the treatment of epilepsy. Blackwell Science, Maiden, MA, pp 131–132. Sipma J., Osuna B., Collado N., Monclus H., Ferrero G., Comas J., Rodriguez-Roda I., 2010. Comparison of removal of pharmaceuticals in mbr and activated sludge systems. Desalination 250, 653–659. Snyder L. R., Glajch J. L., Kirkland J. J., 1988. Practical HPLC Method Development. Wiley Interscience. Snyder S.A., Adham S., Redding A.M., Cannon F.S., DeCarolis J., Oppenheimer J., Wert E.C., Yoon Y., 2006. Role of membranes and activated carbon in the removal of endocrine disruptors and pharmaceuticals. Desalination 202, 156–181. Sponza D. T., 2002. Extracellular polymer substances and physicochemical properties of floc in steady- and unsteady –state activated sludge systems. Process Biochemistry, 37 (9), 983-998. Staudt C., Horn H., Hempel D.C., Neu T.R., 2003. I : O Flahert , V., Moran, P., Lens, P., Stoodley, P. (Eds.), Biofilms in Industry, Medicine & Environmental Biotechnology. IWA Publication.

Literature Review Chapter I
118
Staudt C., Horn, H., Hempel D.C., Neu T.R., 2004. Volumetric measurements of bacterial cells, extracellular polymeric substance glycoconjugates in biofilms. Biotechnol. Bioeng. 88(5), 585–592. Steger-Hartmann T. , Lange R., Schweinfurth H., 1999. Environmental risk assessment for the widely used iodinated x-ray contrast agent iopromide. Ecotoxicology Environmental Safety, 42, 274-281. Stelzer E. H. K., 2000 Practical Limits to Resolution in Fluorescence Light Microscopy, in R. Yuste, F. Lanni, A. Konnerth (eds.), Imaging Neurons: A Laboratory Manual, New York: Cold Spring Harbor Press, 12.1-12. STOWA, 2003. Verwijdering van hormoonverstorende stiffen in riool water zuiverings installaties. Suarez S., Carballa M., Omil F., Lema J., 2008. How are pharmaceutical and personal care products (ppcps) removed from urban wastewaters? Rev. Environ. Sci. Biotechnol. -. sulfonamide antibiotics in influent and effluent domestic wastewater by solid-phase extraction and liquid chromatography-electrospray ionization tandem mass spectrometry. J Chromatogr A 1097:40–53. Symons, J. S. Zuehlke, U. Duennbier, T. Heberer,2005. The Drinking Water Dictionary. Denver: AWWA. Deter i atio of estroge steroids i surfa e ater a d aste ater liquid chromatography- ele trospra ta de ass spe tro etr , , Journal of Separation Sciences, 28, 2005, 52–58.
T
Ternes T. A., 1998. Occurrence of drugs in German sewage treatment plants and rivers Water Research, 32(11), 3245-3260. Ternes T., Joss, A., 2006. Human Pharmaceuticals, Hormones and Fragrances. The challange of micropollutants in urban water management. IWA Publishing, London. Ternes T.A., Meisenheimer M., McDowell D., Sacher F., Brauch H., Haist-Gulde B., Preuss G., Wilme U., Zulei-Seibert N., 2002. Removal of pharmaceuticals during drinking water treatment. Environ. Sci. Technol. 36(17), 3855-3863. Ternes T.A., Stuber J., Herrmann N., McDowell D., Ried A., Kampmann M., Teiser B., 2003. Ozonation: a tool for removal of pharmaceuticals, contrast media and musk fragrances from wastewater? Water Research, 37, 1976–1982. Ternes TA., Janex-Habibi M-L., Knacker T., Kreuzinger N., Siegrist H., 2005. Assessment of technologies for the removal of pharmaceuticals and personal care products in sewage and drinking water facilities – POSEIDON Project the toxicity response of activated sludge bacteria to chemical toxins. Water Research 41 (18), 4177–4185.

Literature Review Chapter I
119
Thuy Q.T.T., Visvanathan C., 2006. Removal of inhibitory phenolic compounds by biological activated carbon coupled membrane bioreactor. Water Science and Technology 53 (11), 89e97. Trussell R.S., Adham S. and Trussel R.R., 2005. Process Limits of Municipal Wastewater Treatment with the submerged Membrane Bioreactor. Environmental Engineering. 131 (3), 410-416. Tsakona M., Anagnostopoulou E., Gidarakos E., 2007. Hospital waste management and toxicity evaluation: A case study. Waste Management 27, 912–920. Twardowski J., Anzenbacher P., 1994. Raman and IR spectroscopy in biology and biochemistry. Ellis Horwood, New York, London, Toronto, Sydney, Tokyo, Singapore.
U
Ueda T., Hata K., 1999. Domestic Wastewater Treatment by a Submerged Membrane Bioreactor with Gravitational Filtration. Water Research, 33(12) 2888-2892. Ujang Z. and Anderson G.K., 2000. Effect of Operating Parameters on the Separation of Metal Chelates Using Low Pressure Reverse Osmosis Membrane (LPROM). Water Since and Technology. 41 (10-11), 135-142. Ujang Z., Au Y.L. and Nagaoka H., 2002. Comparative Study on Microbial Removal in Immersed Membrane Filtration (IMF) with and without Powdered Activated Carbon (PAC). Water Science and Technology, 46 (9) 109-115. Ujang Z., Hamdzah M. and Ozaki H., 2005b. Revers Osmosis for Micropollutant Rejection: The Effects of Low Pressure System. Water Malaysia. 10, 33-36. Ujang Z., Ng S.S. and Nagaoka H., 2005a. Package Plant of Extended Aeration Membrane Reactors: A Study on Aeration Intensity and Biofouling Control. Water Science and Technology. 51 (10), 97-104. Urase T., Kikuta T., 2005. Separate estimation of adsorption and degradation of pharmaceutical substances and estrogens in the activated sludge process. Water Res. 39(7), 1289-1300. Urbain V., Block J.C., Manem J., 1993. Bioflocculation in activated sludge: an analytic approach. Water Research 27, 829-838. Urbain V., Block, J. C., Manem, J., 1993. Bioflocculation in activated sludge, an analytic approach. Water Res. 27: 829-838.
V
Valeur B. 2002. Molecular Fluorescence: Principles and Applications. Weinham: Wiley-VCH.

Literature Review Chapter I
120
Van Juijs A.L.N., Pecceu B., Theunis L., Dubois N., Charlier C., Jorens P. G., Bervoets L., Blust, R., Meulemans H., Neels H., Covaci A., 2009. Can cocaine use be evaluated through analysis of wastewater? A nation-wide approach conducted in Belgium. Addiction; 104: 734-41. Verlicchi P., Galletti A., Masotti L., 2008. Caratterizzazione e trattabilità di reflui ospedalieri: indagine sperimentale(con sistemi MBR) presso u ospedale dell area ferrarese. Pro . “IDI“A conference Firenze. Verlicchi P., Galletti A., Masotti L., 2010a. Management of hospital wastewaters: the case of the effluent of a large hospital situated in a small town. Water Science and Technology 61 (10), 2507–2519. Vieno N., Harkki H., Tuhkanen T., Kronberg L., 2007a. Occurrence of pharmaceuticals in river water and their elimination in a pilot-scale drinking water treatment plant. Environmental Science and Technology 41, 5077–5084. Vieno N., Tuhkanen T., Kronberg L., 2005. Seasonal variation in the occurrence of pharmaceuticals in eflluents from a sewage treatment plant and in the recipient water. Environmental Science and Technology 39, 8220–8226. Vieno N., Tuhkanen T., Kronberg L., 2007b. Elimination of pharmaceuticals in sewage treatment plants in finland. Water research 41, 1001–1012. Vogel AI., 1989. Textbook of Quantitative Chemical Analysis. 5th ed. New York: John Wiley and Sons Inc. p. 731-733. Vogelsang C., Grung M., Jantsch T. G., Tollefsen K. E., Liltved H., 2006. Occurrence and removal of selected organic micropollutants at mechanical, chemical and advanced wastewater treatment plants in Norway. Water Research, 40(19), 3559-3570.
W
Wagner A., 2009. Combined use of confocal laser scanning microscopy (CLSM) and Raman microscopy (RM): Investigations on EPS – Matrix water research pp 6 3 – 7 6. Walker J. M., Rapley R., 2008. Molecular Biomethods Handbook. Humana Press. Wang P. G., He W., 2011. Hydrophilic Interaction Liquid Chromatography (HILIC) and Adva- nced Applications. CRC Press. Waring M. J.,1965. Complex Formation Between Ethidium Bromide and Nucleic Acids, J. Mol. Biol., 13: 269-282. Webb R. H., Dorey C. K., 1995. The Pixelated Image, in J. B. Pawley (ed.), Handbook of Biological Confocal Microscopy, New York: Plenum Press, 55-67.

Literature Review Chapter I
121
Wen X., Ding H., Huang X., Lui R.,2004. Treatment of hospital wastewater using a submerged membrane bioreactor. Process Biochemistry, 39 (11), 1427-1731. Wessendorf M. W., Brelje T. C., 1992. Which Fluorophore is Brightest? A Comparison of the Staining Obtained Using Fluorescein, Tetramethylrhodamine, Lissamine Rhodamine, Texas Red and Cyanine 3.18, Histochemistry, 98: 81-85. Widjaja T., Miyata T., Nakano Y., Nishijima W., Okada M., 2004. Adsorption capacity of powdered activated carbon for 3,5- dichlorophenol in activated sludge. Chemosphere 57 (9), 1219- 1224. WILÉN B. M., LUMLEY D., MATTSSON A., TAKASHI M., 2008. Relationship between floc composition and flocculation and settling properties studied at a full scale activated sludge plant. Water Research, 42 (16), 4404-4418. Wilén B.-M., Jin B., Lant P., 2003. Relationship between flocculation of activated sludge and composition of extracellular polymeric substances. Water Science and Technology 47, 95-103. Wingender J., Neu T. R., Flemming H.-C., 1999. What are bacterial extracellular polymeric substances. p. 1-19 in J. Wingender, T. R. Neu, and H.-C. Flemming (eds.), Microbial Extracellular Polymeric Substances. Springer, Heidelberg, Berlin. Witzig R., Manz W., Rosenberger S., Krüger U., Kraume M.,Szewzyk U., 2002. Microbiological Aspects of a Bioreactor with Submerged Membranes for Aerobic Treatment of Municipal Wastewater. Water Research, 36, 394-402.
X
Xia K., Bhandari A., Das K., Pillar G., 2005. Occurrence and fate of pharmaceuticals and personal care products (PPCPs) in biosolids. J. Environ. Qual. 34, 91– 104. Xing C. H., Wen X. H., Qian Y., Sun D., Klose P.S., Zhang X. Q., 2002. Fouling and cleaning of microfiltration membrane in municipal wastewater reclamation. Water Science and Technology, 47 (1), 263-270.
Y
Yamamoto K., Hiasa M., Mahmood T., Matsuo T., 1989. Direct solid-liquid Separation Using Hollow Fiber Membrane in an Activated Sludge Aeration Tank. Water Science and Technology, 21(4-5) 43-54. Yang S., Carlson K., 2003. Evolution of antibiotic occurrence in a river through pristine, urban and agricultural landscapes. Water Res 37:4645–4656.

Literature Review Chapter I
122
Yang X., Beyenal H., Harkin G., Lewandowski Z., 2001. Evaluation of biofilm image thresholding methods. Water Res. 35, 1149–1158. Yoshimura R., Yanagihara N., Terao T., Minami K., Toyohira Y., Ueno S., Uezono Y., Abe K., Izumi F., 1998. An active metabolite of carbamazepine, carbamazepine-10,11-epoxide, inhibits ion channel-mediated catecholamine secretion in cultured bovine adrenal medullary cells. Psychopharmacology 135:368–373. Yu J., Bouwer E., Coelhan M., 2006. Occurrence and biodegradability studies of selected pharmaceuticals and personal care products in sewage effluent. Agric. Water Manage. 86, 72–80.
Z
Zhang L.Q., Urase T., Feng L., 2008. Removal of carbamazepine in an enhanced membrane bioreactor with small dose addition of powdered activated carbon. in: X. Wang, R. Chen (Eds.), Advances in Chemical Technologies for Water and Wastewater Treatment, pp. 199- 205. Zhang S., Yang F., Liu Y., Zhang X., Yamada Y., Furukawa K., 2006. Performance of A Metalic Membrane Bioreactor Treating Simulated Distillery Wastewater At Temperatures Of 30 to 45 C, Env. Biological Sci. Techno, Kumamoto University, Desalination, 194, 146-155. Zhang Y., Geißen S-U., Gal C., 2008. Carbamazepine and diclofenac: removal in wastewater treatment plants and occurrence in water bodies. Chemosphere 73:1151–1161. Zita A., Hermansson M., 1997. Effects of bacterial cell surface structures and hydrophobicity on attachment to activated sludge flocs. Applied and Environmental Microbiology 63, 1168 1170.

Material and Methods Chapter II
123
Chapter II
Material and Methods

Material and Methods Chapter II
124
1. Study area and wastewater characteristics
Activated sludge was sampled in the aeration tank of the municipal WWTP of the city
(Limoges, France), (285,000 inhabitant-equivalents) which received the hospital effluents
(HE), contributing to ≈ % of the total asal flo arri i g i the WWTP, a d the urban
effluents (UE), o tri uti g to ≈ . % of the total asal flo arri i g i the WWTP. This plant
treats domestic and a very small fraction of industrial wastewater (about 10 percent) and
operates advanced activated sludge treatment with an output of 47000 m3 per day in dry
weather and 81000 m3 during rain (wastewater 47000 m
3 per day and run off 34000 m
3 per
day). The sampled sludge from clarifier had an initial concentration of 3.5 to 5g.L-1
.
This study was realized on a 869-bed teaching hospital located on the centre of France, and
which water consumption reaches 923 m3 per day. The HE samples analyzed in this study
were collected from the sewerage system which comprises only sewers from clinical
activities of the hospital. The UE receives wastewater from 13 360 population equivalents
which comprised mainly domestic wastewater. None HE is present in this effluent.
Average pharmaceuticals quantifications, and physic-chemicals characteristics of
wastewaters and activated sludge used during the experiments are detailed in the Table 1.
Table 1: Physicochemical characteristics of the HE and UE feed wastewaters overall the
study, as well as the activated sludge inoculum used at the beginning of the experiment for
the both reactors. Standard deviation values are in brackets.
HE UE AS
COD (mg.l-1
) Total 325.8 (117.5) 183.9 (78.3)
1120
Soluble 188.3 (54.7) 89.5 (41.3) 120
N (mg.l-1
) Total 115.1 (15.0) 113.3 (11.3) -
Soluble 89.6 (23.1) 93.2 (11.3) -
TSS (g.l-1
) 0.208 (0.061) 0.143 (0.064) 3.115 (0.134)
VSS (g.l-1
) 0.237 (0.086) 0.135 (0.067) 2.550 (0.070)

Material and Methods Chapter II
125
Table 2: Concentration (ng.l-1
) of some relevant pharmaceuticals.
Type of
compound Compound HE UE
Contrast Media Iopamidol 110798 (80843) 6460 (2091)
Ammonium diatrizoate n/d n/d
Antibacterials
Ciprofloxacin 455 (172) n/d
Clarithromycin * n/d n/d
Sulphamethoxazole* 280 (70) n/d
Antibacterials
metabolite N-acetyl sulphamethoxazole*** 1051 (599) <200ng/l
Anti-
inflammatories
Naproxen** n/d n/d
Diclofenac n/d n/d
Cytostatics Cyclophosphamide* 290 (159) n/d
Ifosfamide 265 (271) n/d
Anaesthetic Lidocaine** 537 (560) #DIV/0!
Anticonvulsants
/ tranquilisers Carbamazepine** 114 (35) 193 (56)
Betablockers /
Anti-
hypertensives
Atenolol** 103 (44) 215 (49)
*LOQ 80ng/l; **LOQ 10ng/l; ***LOQ 200ng/l
aThe pharmaceutical compound selection has been done as the recommended priority list selected in the PILLS
projec.
2. Reactors and operating conditions
2.1. Aerobic and anaerobic reactors (Batch mode)
The pilot is made of four aerobic and four anaerobic stirred reactors (Figure 1). Each reactor
has a working volume of 3 litres. The reactors were filled with 2000 mL of sample sludge
coming from Limoges WWTP (sludge of aerobic tank, for aerobic reactors) and 1000 ml of
effluent.
The aerobic and anaerobic reactors were studied in a batch mode. Parameters that were
monitored simultaneously throughout each experiment were pH, Temperature (T°C),
Dissolved Oxygen (DO) and biogas volume. The pH and Temperature measurements were
done using digital pH metre (Digital pH metre SUNTEX instruments, Taiwan) and dissolved
oxygen were done using digital DO meter (Mettler-Toledo, SG6, Germany).

Material and Methods Chapter II
126
Figure 1: Photo of pilot plan with 8 aerobic and anaerobic reactors.
2.2. Conventional activated sludge system tests (CAS)
Two identical lab scales CAS (figure 2; total volume 14 L) was continuously fed with
wastewaters collected each 7 day at the hospital. Wastewaters were kept in a refrigerated
(4°C) and agitated tank where it was directly pumped to feed the pilots. Influent flow rate
was 21.6 L.d-1
corresponding to a hydraulic residence time of 15.3 h-1
in the aeration tank.
Sludge recirculation from the clarifier was maintained at 100% of feed flow rate, allowing a
60 min return activated sludge retention time in the thermal treatment reactor.
Aeration was operated by repeated aerobic/anoxic cycles (3h/3h) in order to ensure
nitrification and denitrification. Air flow rate was adjusted daily in order to have a dissolved
oxygen concentration between 2 and 4 mg.L-1
in the reactors during aerated phases (no
limitation by oxygen concentration). Solids residence time (i.e. sludge age) was maintained
at 15 days throughout the experiments: settled sludge was wasted every two day
accordingly considering sludge losses through the effluent.

Material and Methods Chapter II
127
Figure 2: Description of the conventional activated sludge process used. Wastewaters were
kept in a refrigerated (4°C) and agitated tank (1) where it was directly pumped to feed the
pilots. Influent flow rate was 21.6 L.d-1
, and corresponded to a hydraulic residence time of
15.3 h-1
in the aeration tank (2) where aeration (2 and 4 mg.L-1
) was operated by repeated
aerobic/anoxic cycles (2h/2h) in order to ensure nitrification and denitrification. Sludge
recirculation (4) from the clarifier (3) was maintained at 100% feed flow rate. Solids
residence time (i.e. sludge age) was maintained at 15 days throughout the experiments:
settled sludge was wasted every two days accordingly considering sludge losses through the
effluent.
2.3. Membrane bioreactor (MBR)
The pilot scale (Figure 3) comprised a 30 l bioreactor and U-shaped hollow fiber membrane
module was immersed in the bioreactor. Hollow fibres ultra filtration used were made of
polyethylene with a pore size of 0.05 μm (Mitsubishi Rayon Co., Ltd., Japan). Aeration was
done through diffusers at the bottom of the reactor to provide oxygen for biomass growth
as well as shear to reduce cake formation at membrane surface. Dissolved oxygen levels
were maintained between 2 and 4.5mgO2/L. The membrane permeate was continuously
removed by a peristaltic pump under a constant flux (1.8 L/h), constantly monitoring the
trans-membrane pressure (TMP) build-up which indicates the extent of membrane fouling.
The operation was stopped when the TMP reached 26 kPa because it was difficult to
maintain the flux at constant level at TMP of over 26 kPa. The hydraulic retention time (HRT)
ranged from 15 to 24 h. temperature was 14–20 ◦C and pH was 7–8. The sludge retention
time (SRT) was around 15 days.

Material and Methods Chapter II
128
Figure 3: schematic diagram of the membrane bioreactor
Table 3: Key operational parameters of CAS and MBR systems investigated.
2.3.1. Cleaning protocol
The membrane module was systematically cleaned prior to each critical flux test. For
experiments reported in situ chemical cleaning of the membranes was carried out by soaking
in solution of 4g/l de Na OH + 200 ppm, contact time = 2 h with 25 C°, after that in solution
of 1 % citric acid, contact time = 30 min with 25 C°, finely in solution of HCL ph = 2, contact
time = 30 min in 25 C°.
2.4. Ultrafiltration system (AS-UF)
The reactor consisted of bioreactor with a working volume of 400 L and a membrane module
in an external circulation loop (figure 4). The membrane module was a Polypropylene and
type of fibres cruses (UF) membrane with 1m² of surface area and pore size of 0.2µm
(ALTING, MICRODYN, France). A Ruston turbine (80-120 rpm) was installed to keep the
bioreactor completely mixed. An identical lab-scale cross-flow MBR was run and inoculated
with activated sludge from a municipal wastewater treatment plant (dry weight, 2.5 g/L).
The influent was a hospital effluent (average flux 100 L/ day). Flow of permeate was about
HRT (h) SRT (days) Flow (m3/h) Temperature (C°) PH
Dissolved
oxygen (mg/L) Aerobic tank (L)
MBR 15-24 15-20 0,0018 16-19 7,0 - 8,0 2,0 - 4,5 30
CAS 15,3 15 0,0009 17-20 7,0-8,0 2,0-4,5 14
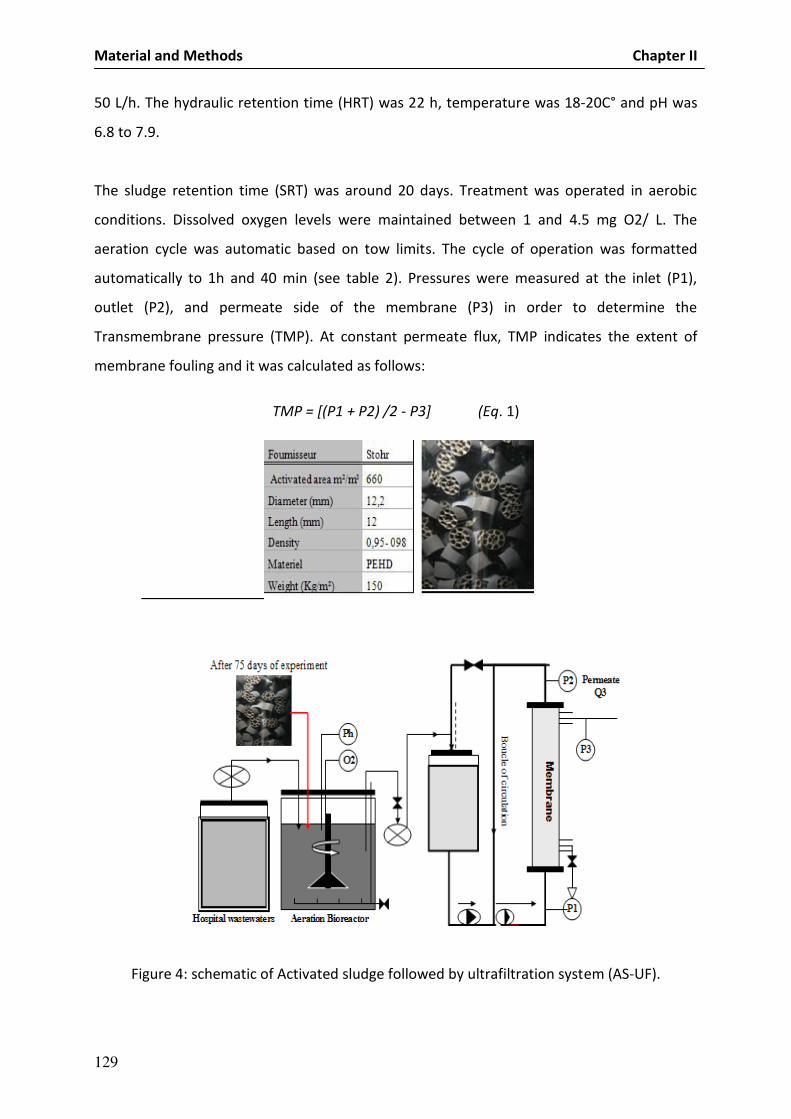
Material and Methods Chapter II
129
50 L/h. The hydraulic retention time (HRT) was 22 h, temperature was 18-20C° and pH was
6.8 to 7.9.
The sludge retention time (SRT) was around 20 days. Treatment was operated in aerobic
conditions. Dissolved oxygen levels were maintained between 1 and 4.5 mg O2/ L. The
aeration cycle was automatic based on tow limits. The cycle of operation was formatted
automatically to 1h and 40 min (see table 2). Pressures were measured at the inlet (P1),
outlet (P2), and permeate side of the membrane (P3) in order to determine the
Transmembrane pressure (TMP). At constant permeate flux, TMP indicates the extent of
membrane fouling and it was calculated as follows:
TMP = [(P1 + P2) /2 - P3] (Eq. 1)
Figure 4: schematic of Activated sludge followed by ultrafiltration system (AS-UF).

Material and Methods Chapter II
130
Table 4: Conditions of bioreactor operation
Condition of bioreactor operation
Operating parameters Operating range
Concentration of oxygen 1- 5 mg O2/L
PH 6,9 -8
T C° 16- 20
Agitation 80-120 tr/min
Volume (L) 400 L
flow of outlet (L.d-1) 1300-1700 L / j
SRT (d) 15-20 jours
HST 22 h
Aeration Auto - 1-5 mg.O2/L
Time of presence O2 (h) 6
Flux out let (14-20°C) (L.m-2.h-1) 40-50 L/h
Mode of filtration position horizontal- vitesse tangentielle Interne- Externe T
Tangential speed along
0,286m/s the membrane (m / s)
Type of initial treatment Decantation
Cycle of operation
Time of decantation 20 min
Time of transporte 20 min
Temps of filtration 20 min
Temps of alimentation 40 min
Volume of tank 150 L
Volume of tank the washing 150 L
Flow of pump Booster 900 L/h
flow of pomp of circulation 800-950 L/h
flow of inlet 4,25 L/ h
TMP 0,1 - 0,25 bar
3. Analytical methods
Wastewaters and sludge physic-chemical characteristic measurements were done every two
day. Measurements of total and volatile suspended solids (TSS and VSS) were done
according to the normalized method (AFNOR, NF T 90-105). Chemical Oxygen Demand (COD)
was measured by the closed reflux colorimetric method (ISO 15705:2002), and total nitrogen
(TN) was assessed using the alkaline persulfate digestion with colorimetric finish (Hach com -
pany). The COD and TN were carried out on both total and soluble fraction (after samples fil-
trated at 1.2µm). Ionic species in solution were determined on samples filtrated at 0.22µm
using ion chromatography (DIONEX 120) according to the standard method (AFNOR, NF EN
ISO 10304-1). The used detector was conducted metric, and the analytical error was ±5%
(Table 5).

Material and Methods Chapter II
131
Table 5: Analytical methods and precision of measurement
Mesure Method Sample volume Phase Precision of
measurement
COD
Method
colorimetric en
micro tubing
(ISO 15705 :2002
2 ML fraction totale
fraction soluble
± 200 mg O2/L
(± 5%) sur la
fraction totale et
de ± 6 mg O2/L
sur la fraction
soluble
N total Micro méthode
HACH 2 ml
Fraction totale
fraction soluble ±5 mg
ANIONS
CATIONS
Chromatographie
ionique 900µl filtration 0.22µm -
TSS , TVS
AFNOR 1997 a
Filtration 1.2µm ,
105°C 12h then
550°C 2h
40 ml Sludge total 2 %
4. Characteristics of activated sludge Flocs
4.1. Sludge characterizations
The indication of sludge (IB) or indication of Mohlman (IM) represents the volume occupied
by sludge after 30 minutes of settling and returned to the concentration in SM of the test.
IB = [V30 /TSS]
With:
(IB): The indication of sludge.
V30: volume of decanter after 30 minutes of decantation.
TSS: concentration of total suspended materials.
4.2. EPS analysis
4.2.1. EPS extraction and chemical analysis
The analysis of EPS in biomass was made through a thermal extraction method. The mixed
liquor of activated sludge was centrifuged at 4,000 rpm for 20 min at 4 C° in order to remove
the soluble EPS from bound EPS. After collecting the soluble EPS, the remaining pellet was
washed and re-suspended in saline water (0.9% NaCl solution). The extracted solution was
obtained from a heat treatment at 80 C° for 1 h. The extracted solution was then separated

Material and Methods Chapter II
132
from the sludge solids by centrifuging under similar conditions (4,000 rpm for 20 min and T=
4C°), the supernatant obtained at this stage being referred to as bound EPS solution. The EPS
is composed of many components such as protein, carbohydrate, nucleic acid, and lipids. In
this study, the main component of EPS to be considered was protein and carbohydrate.
4.2.2. Analysis of total protein, humic substances and polysaccharides
Protein content, expressed in mg equivalent of bovine serum albumin per gram of VSS (mg/
L for the soluble polymer), was determined according to the method of Lowry et al. (1951)
with a correction for the humic substances. Humic substances were measured with the
Folin-Ciocalteau phenol reagent in the same trial as the protein by omitting the CuSO4.
Results were expressed in mg equivalent of humic acid per gram of VSS (mg/ L) for the
soluble polymer). Polysaccharides were determined according to the method of Dubois et al.
(1956) and the results expressed in mg equivalent of glucose per gram of VSS (mg/ L) for the
soluble polymer).
Proteins
Proteins are large organic compounds made of amino acids arranged in a linear chain and
joined together by peptide bonds between the carboxyl and amino groups of adjacent amino
acid residues. The sequence of amino acids in a protein is defined by a gene and encoded in
the genetic code.
A more sensitive method is measurement of protein with the Folin-Ciocalteau phenol (FCP)
reagent (Lowry et al., 1951). The first step is a burnt reaction where peptide bonds in protein
react with copper in alkaline solution. The next step is a reduction of the active
phosphomolybdic and phosphotungstic acids in the reagent by the copper treated protein.
The colour developed is measured spectrophotometrically.
The principal disadvantage of the method of Lowry is the risk of interference from many
substances. The Lowry method is slightly variable in sensitivity to various proteins but on
average 27 different proteins resemble the colour developed by bovine serum albumin
(Davis, 1988).
The choice of method for measuring protein in wastewater is not obvious, because none of
the reviewed methods are ideal for this purpose. Considering the requirement for sensitivity
and specificity for protein, the choice is between the methods of Lowry et al. (1951) and

Material and Methods Chapter II
133
Bradford, (1976). According to variability in extinction between different proteins, the Lowry
method seems to be much more accurate than the Bradford method (Kamma et al., 1994).
Proteins were measured using the method proposed by Lowry method using BSA (Bovine
Serum Albumin) as a standard protein and modified slightly by Kamma et al. (1994). Four
reagents were prepared:
• Reage t A: % Na CO i . N NaOH
• Reage t B : . % CuSO · H O
• Reage t B : % sodiu tartrate dou le Na a d K
• Reage t C: L Reage t A + L Reage t B + L Reage t B
• Reage t E: N Foli Reage t
To start, 2.5 mL of Reagent C was added to 0.5 mL of sample, immediately mixed, and let
stand for exactly 10 min at room temp. Reagent E was added (0.25 mL), the sample mixed,
and incubated at room temperature for 30 min. Absorbance was measured at 650 nm, with
UV – Visible spectrophotometer; model UV – 1700, Pharma-Spec, (SUIMADZU) and with
bovine serum used as the standard. The measurement error is about 5 – 8% for the soluble
proteins concentration and 10 to 15% for the total concentration of protein.
Carbohydrates
Carbohydrates (from hydrates of carbon) or saccharides (Greek meaning "sugar") are simple
organic compounds that are aldehydes or ketones with many hydroxyl groups added, usually
one on each carbon atom that is not part of the aldehyde or ketone functional group. The
dominating carbohydrate sources in wastewater are starch- and dairy products, vegetables,
fruit and cellulose having a monomeric composition of glucose, fructose and galactose which
are all hexoses (Kamma et al., 1994). Carbohydrate concentrations were determined using
the phenol sulphuric method introduced by Dubois et al., (1956) and modified slightly by
Kamma et al., (1994). Carbohydrate concentration was calculated from a calibration curve
constructed using a glucose standard. Four reagents were prepared:
• Sulfuri a id, reage t grade . %.
• % Phe ol solutio i ater.
To start, 0.5 mL of sugar solution is pipette into a colorimetric tube, and 0.5 mL of 5% phenol
is added. Then 2.5 mL of concentrated sulphuric acid is added rapidly, the stream of acid

Material and Methods Chapter II
134
being directed against the liquid surface rather than against the said of the test tube in order
to obtain good mixing. The tubes are allowed to stand 5 minutes, and then they are shaken
and placed for 5 to 10 minutes in a water bath at 25 to 30°C. Before readings are taken. The
colour is stable for several hours and reading may be made later if necessary. The
absorbance of the characteristic yellow-orange colour is measured at 490 nm with UV –
Visible spectrophotometer; model UV – 1700, Pharma-Spec, (SHIMADZU). The amount of
sugar may then be determined by reference standard curve. The measurement error is
about 10 - 12% for the concentration of carbohydrates in the soluble phase and around 8 –
10% for total carbohydrates concentration.
5. Microscopic techniques
5.1. Confocal laser scanning microscopy
Bright field microscopy was carried out with an optical microscope (Olympus CX 31)
equipped with a video CCD camera connected to a PC via a grabbing card. After having
deposited a drop of activated sludge on a slide and spread it with the enlarged tip of a plastic
pipette, the smear was let to dry before grabbing at least 100 images (magnification 100x)
Care was taken to avoid overlapping fields. Pixel size calibration was done with a stage
micrometer (160 pixels = 100 μ . The i ages ere a al zed usi g the pro edure des ri ed
in (da Motta et al., 2003) and implemented on Visilog 5 (Noésis, Saint-Aubin, France). The
activated sludge structure was quantified by the ratio of the number of small fragments
(fragments with an area smaller than 6.25 µm2 which are not filaments) with respect to the
total area occupied by the biomass on the image and the filaments abundance (ratio of the
filament length (in pixels) to the total area occupied by the biomass on the image).
The Li e/Dead®Ba LightTM a terial ia ilit stai as used a ordi g to the a ufa turer’s
instructions (Molecular Probes, Eugene, Oregon, USA). The kit provides a two-color
fluores e e assa of a terial ia ilit rel i g o e ra e i tegrit : ia le acteria are
stai ed SYTO ® a d fluores e t gree , hile da aged a teria are stai ed propidiu
iodide a d fluores e t red. Proto ol esta lished (Lopez et al., 2005) was performed: 1 mL
of undiluted biomass suspension was mixed with 3 µL of a mixture of equal parts of SYTO®
and propidium iodide. This short staining protocol allowed direct observation of the original

Material and Methods Chapter II
135
flo stru ture. No e trifugatio or fi atio steps ere eeded. Mi ros opi o ser atio s
started 15 min after staining. Fluorescence emissions were recorded with an airy disk
confocal pinhole opening and 512 x 512 images at a 0.28 µm (x,y) pixel size were obtained
pi hole µ , pi el d ell ti e of . µs . A o sta t μ step size i the erti al
direction was used when imaging the 3D structures. Phase-contrast microscopy was also
used to image the structure of the flocs. Excitation maxima for SYTO®9 and propidium iodide
bound to DNA were 480 and 540 nm, respectively. SYTO®9 was excited at 488 nm and the
fluorescence emission was collected in the green channel between 505 and 550 nm. The
propidium iodide was excited at 543 nm and the fluorescence emission was collected in the
red channel after a long pass filter at 585 nm. The EPS of the activated sludge flocs was
excited at 405 nm and their auto fluorescence was collected between 505 and 550 nm in the
blue channel.
PS (Polysaccharides) and PN (Proteins) staining was carried out according to the modified
procedure of [14]. Bio samples were centrifuged to remove supernatant, washed twice with
1× phosphate-buffered saline (PBS) buffer (pH 7.2) and kept fully hydrated in 2 mL centrifuge
tubes covered with aluminium foil. For PS staining, 100 μL of concanavalin A conjugated with
tetra - eth lrhoda i e Co A, g L− , Mole ular Pro es, a d Carls ad, CA, USA as
first dripped onto the sample and incubated for 30 min to stain α-mannopyranosyl and α
glucopyranosyl sugar residues. For PN staining, 100 μL of sodium bicarbonate buffer (0.1 M)
was introduced to the sample to maintain the amine groups in non-protonated form.
Subsequently, 100 μL of fluores ei isothio a ate solutio FITC, g L− , Fluka as
supplemented and incubated for 1 h to bind to proteins. Samples were washed tow times
with 1× PBS buffer after each staining stage to remove loosely bound and excess dyes.
Finally, sectioned granule or biofloc samples were mounted onto microscopic glass slides for
observation of the distribution of PS and PN by a confocal laser scanning microscopy
equipped with an Ar–He–Ne laser unit and three barrier filters. Samples were visualized with
a ×10 objective and analyzed with the start LSM image browser confocal software.
5.2. Digital image analysis
Material and Methods Chapter II
136
Image analysis was performed with the freely available software Image J version 1.39i
including the LSM Reader plug in to open LSM5 formatted image stacks created by the
microscope software. The tool Image J Analyzer 1.1, which is based on the performance of
Image J and handles LSM5 formatted image stacks, was programmed for quantitative
analysis. By setting a threshold, pixels with intensity below the threshold were assigned to
the background. All other pixels were set to the foreground. Due to the individual image
adjustment during the image stack acquisition, the threshold was chosen manually for each
image stack. It has to be stressed that the pitfalls of threshold setting by the operator is well
known (Staudt et al., 2004).
6. Bimolecular analyses
6.1. DNA extraction
Activated sludge was sampled weekly until the end of the experiment, for molecular biology
analyses. Activated sludges (2-mL), were pelleted at 15000 g for 10 min, and total DNA was
extracted using the FastDNA® spin kit for feces and the FastPrep
® Instrument (MP
Bio edi als , follo i g the a ufa turer’s i stru tio s. Feed aste ater sa ples ere
filtered in triplicate under vacuum through sterile 47 mm-membranes with a porosity of
0.45µm (Millipore). Total DNA was extracted from bacteria retained on the filters using the
PowerWater® DNA isolatio kit MoBio La oratories I . , follo i g the a ufa turer’s
instructions. In order to have a global view of the bacterial diversity of the feed effluents,
total DNA of each sample of HE or UE were pooled to performed all bacterial diversity
analyses. Before storage at -20°C, the quality of extracted DNA was verified by
electrophoresis through a 0.8% (w/v) agarose gel, and their quantity was assayed in
triplicate using a Nanodrop® spectrophotometer (Thermo Scientific).
6.2. PCR-DGGE experiment
The PCR-DGGE was performed as Laurent et al. with some modifications. Briefly, one DNA
extract of each activated sludge sample was used to perform a PCR experiment using the
universal bacterial primers 341F with a 40-bp GC-clamp and 518R. For the PCR, 1ng.µL-1
of
template DNA was used in a final PCR mixture volume of 100µL. Twenty five microliters of
each PCR product were loaded onto 8% (w/v) polyacrylamide gel (containing 37.5:1 of

Material and Methods Chapter II
137
acrylamide to bis-acrylamide) with a linear denaturant gradient ranging from 40% to 60% (of
urea w/v and formamide v/v). The DGGE was performed at 60°C for 15h at 100V in 1X TAE
electrophoresis buffer with D-code universal mutation detection system (Bio-Rad
Laboratories, Hercules, CA, USA). Gel images were analyzed using Quantity One Quantitation
Software Version 4.6.1 (Bio-Rad Laboratories, Hercules, CA, USA).
6.3. Pyrosequencing
Pyrosequencing was done to analyse the bacterial diversity. The V3 and V4 region, of the 16S
rRNA encoding gene were chosen to analyse the bacterial diversity using the bacterial
universal primers 339F (CTCCTACGGGAGGCAGCAG) and 339R (TTGTGCGGGCCCCCGTCAATT)
targeting the V3 and the V4 variable regions of the 16S rRNA encoding gene. The
pyrosequencing as well as the PCR were conduct by the Molecular research LB lab
(http://www.mrdnalab.com/) according to standard laboratory procedures using a 454 FLX
Sequencer (454 Life Sciences, Branford, CT, USA). The detail methods and the analyse
pipeline, as well as results are presented in the SI.
6.4. Diversity analyses
For each samples rarefaction analyses were performed using past (PAleontological Statistics
v1.60) software from http://folk.uio.no/ohammer/past/. The Primer6 (Plymouth Routines In
Multivariate Ecological Research, version 6.1.6) software was used to performed diversity
indices calculation (Bray-Curtis, Chao1 richness and Shannon diversity indexes), and
clustering analysis coupled to two-dimensional non-metric multidimensional scaling
ordination (2D-nMDS) based on Bray Curtis similarity taking into account for the DGGE
pattern, the presence or absence of band and their relative intensity, and for the
pyrosequencing the relative abundance of OTU with a cutoff at 3% of sequence identity was
considered.
6.5. Quantitative PCR protocol
Quantitative PCR (qPCR) assays were targeted at intI1 gene of the class 1 RI from total
extracted DNA. The quantification of the rRNA 16S encoding gene was performed in a SYBR
green assay using the universal primer 338F and 518R targeting the 16S rRNA gene of
Eubacteria as described previously. Assays were performed in triplicate with a MX3005P
real-time detection system (Stratagene®). In order to avoid qPCR inhibitor effects total DNA

Material and Methods Chapter II
138
samples were diluted to the convenient dilution for which quantifications were not affected.
The statistical hypothesis test Mann-Whitney was performed using the StatView©
5.0
software (SAS institute Inc.), a p-value <0.05 was considered to be significant. For an
accurate quantification, the intI1 gene and the 16S rRNA encoding genes were embedded in
a single standard plasmid. A full standard curve, made up between 103 and 10
8 copy number
for standards, was included in duplicate in each qPCR run. The total estimated bacterial cell
number was recovered with 16S rRNA encoding genes quantification. Based on the
Ribosomal RNA Database, the number of the 16S rRNA encoding genes per bacteria is
currently estimated to 4.1. Therefore all 16S rRNA quantifications have been divided by 4.1
to estimate the total bacterial load. The relative abundance of class 1 RI was calculated by
dividing their concentration by the estimated bacterial concentration.
7. Dosage the pharmaceuticals compounds in wastewaters
7.1. Sample preparation
Waters were centrifuged at 10000g for 10min and the supernatant was acidified to pH=3
using formic acid (Sigma). This acidified solution was passed through SPE column Oasis HLB 3
cc Cartridge (Waters), under vacuum. The SPE column was air dried and stored at -20C. HLB
cartridges were first washed with 6ml water, then eluted with 8ml CH3CN (Fisher)/MeOH
(Fisher), containing 0.1% formic acid. They were then dried down ready for analysis. Dried
down samples were re-constituted in CH3CN/H20 (distilled) 30/70. Internal standards were
added to afford a concentration of 5ug/l. Calibration standards were prepared and run at
the following concentrations ranges: Atenolol, Lidocaine, Ciprofloxacin, Cyclophosphamide,
Sulphamethoxazole, Ifosfamide, N-acetyl sulphamethoxazole 10 – 5000 ug/ml. Iopamidol,
Ioprimide and Diatrizoate 40 – 20000 ug/ml. Criteria was minimum 4 points on the line +/-
20%.
7.2. Detection
The LC method was a gradient from 1% orgainic to 99% organic over 54 mins. Flow rate was
200ul/min and injection volume was 10ul. The column oven was set to 30oC. Column was an
Atlantis dC18 3um 2.1 x 150mm (Waters). A binary pump Agilent 1100 series LC system with
electrospray ionisation and a detector Esquire 3000 plus Ion Trap mass spectrometer from
Bruker Daltonics was used for the detection.

Material and Methods Chapter II
139
7.3. Dosage the PPCP in the wastewater
Tow different analytical methods were applied to determine the concentration levels of the
PPCPs in the wastewaters samples. Analyses were performed by the IANESCO. Water
samples were enriched by liquid-solid phase (SPE) by using Osis HLB cartridges (6ml, 200mg)
from waters. The SPE extracts were injected in liquid chromatography- mass spectrometry
(LC-MS/MS). Acquisition was performed in selected reaction monitoring (SRM) mode and
tow transitions (quantification, confirmation) were obtained for each compound.
References
Da Motta, M.; Pons, M.-N.; Roche, N. Monitoring filamentous bulking in activated sludge
systems fed by synthetic or municipal wastewater. Bioprocess Biosyst. Eng. 2003, 25,
387−393.
Kamma, R., Thorkild, H-J. and Per. Halkjre ,N. 1994 Measurement of pools of protein,
carbohydrate and lipid in domestic wastewater, Water Research, 28, (2), PP. 251-262.
Lowry O.H., Rosebrough N.J., Farr A.L., Randall R.J., 1951. Protein measurement with the
folin phenol reagent. J. Biol. Chem. 193, 265–275.
Lopez, C.; Pons, M. N.; Morgenroth, E. Evaluation of microscopic techniques (epifluorescence
microscopy, CLSM, TPELSM) as a basis for the quantitative image analysis of activated
sludge.Water Res. 2005, 39, 456−468.
Staudt, C., Horn, H., Hempel, D. C. & Neu, T. R. 2004 Volumetric measurements of bacterial
cells, extracellular polymeric substance glycoconjugates in biofilms. Biotechnology and
Bioengineering 88, 585–592.
Yang, X., Beyenal, H., Harkin, G. & Lewandowski, Z. 2001 Evaluation of biofilm image
thresholding methods. Water Research 35, 1149–1158.

Chapter III
140
Chapter III
Results and Discussion
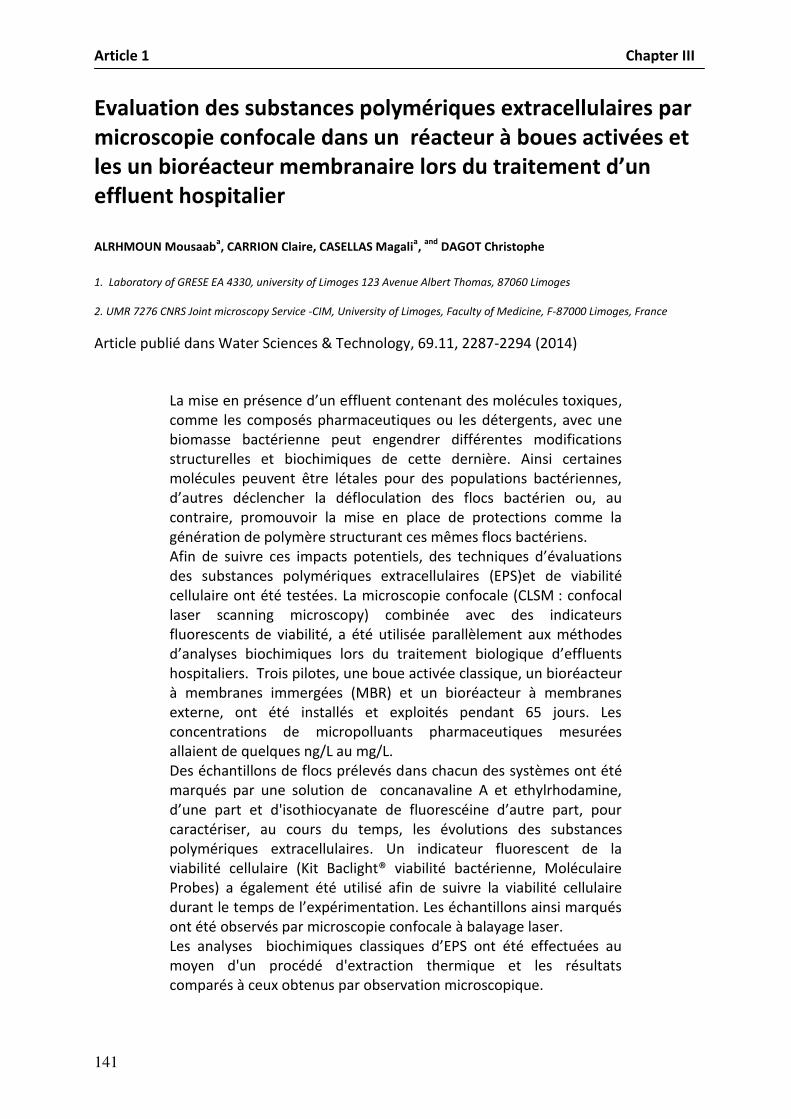
Article 1 Chapter III
141
Evaluation des substances polymériques extracellulaires par
microscopie confocale dans un réacteur à boues activées et
les u ioréa teur e ra aire lors du traite e t d’u effluent hospitalier
ALRHMOUN Mousaab
a, CARRION Claire, CASELLAS Magali
a,
and DAGOT Christophe
1. Laboratory of GRESE EA 4330, university of Limoges 123 Avenue Albert Thomas, 87060 Limoges
2. UMR 7276 CNRS Joint microscopy Service -CIM, University of Limoges, Faculty of Medicine, F-87000 Limoges, France
Article publié dans Water Sciences & Technology, 69.11, 2287-2294 (2014)
La ise e p se e d’u efflue t o te a t des ol ules to i ues,
comme les composés pharmaceutiques ou les détergents, avec une
biomasse bactérienne peut engendrer différentes modifications
structurelles et biochimiques de cette dernière. Ainsi certaines
molécules peuvent être létales pour des populations bactériennes,
d’aut es d le he la défloculation des flocs bactérien ou, au
contraire, promouvoir la mise en place de protections comme la
génération de polymère structurant ces mêmes flocs bactériens.
Afin de suivre ces i pa ts pote tiels, des te h i ues d’ valuatio s des substances polymériques extracellulaires (EPS)et de viabilité
cellulaire ont été testées. La microscopie confocale (CLSM : confocal
laser scanning microscopy) combinée avec des indicateurs
fluorescents de viabilité, a été utilisée parallèlement aux méthodes
d’a al ses io hi i ues lo s du t aite e t iologi ue d’efflue ts hospitaliers. Trois pilotes, une boue activée classique, un bioréacteur
à membranes immergées (MBR) et un bioréacteur à membranes
externe, ont été installés et exploités pendant 65 jours. Les
concentrations de micropolluants pharmaceutiques mesurées
allaient de quelques ng/L au mg/L.
Des échantillons de flocs prélevés dans chacun des systèmes ont été
marqués par une solution de concanavaline A et ethylrhodamine,
d’u e pa t et d'isothio a ate de fluo es i e d’aut e pa t, pou caractériser, au cours du temps, les évolutions des substances
polymériques extracellulaires. Un indicateur fluorescent de la
viabilité cellulaire (Kit Baclight® viabilité bactérienne, Moléculaire
Probes) a également été utilisé afin de suivre la viabilité cellulaire
du a t le te ps de l’e p i e tatio . Les ha tillo s ai si a u s ont été observés par microscopie confocale à balayage laser.
Les a al ses io hi i ues lassi ues d’EPS o t t effe tu es au moyen d'un procédé d'extraction thermique et les résultats
comparés à ceux obtenus par observation microscopique.

Article 1 Chapter III
142
L’a al se des sultats o tenus aboutit aux conclusions suivantes:
- les effi a it s de t aite e t de l’efflue t hospitalie , e te e de paramètre classique de pollution, sont bons dans les 3 cas ; il ’ a pas d’effet ota le d’i hi itio de l’a tivit a t ie e. Les a membrane permettent cependant les meilleurs taux
d’ li i atio . - On note une évolution des concentrations en EPS différentes aux
cours du temps pour les trois procédés, pourtant alimentés par le
même effluent. Les concentrations les plus importantes sont
obtenues dans le MBR. Différentes hypothèses sont avancés pour
e pli ue e ph o e, ota e t l’i po ta e de l’âge des boues.
- l’ volutio de la mortalité cellulaire ne montre pas une
surmortalité significative mais des distributions dans les flocs
variables.
- Les images obtenus par CLSM traités par analyse statistique, ont
o t u e o e elatio e t e les deu odes d’a al ses validant ainsi le suivi des évolutions des concentrations au cours
du temps des EPS et de la viabilité cellulaire, notamment en
réacteur membranaire immergé. Cette technique sera utilisée
pour le suivi des EPS dans les différents procédés utilisés lors de
nos travaux.

Provided for non-commercial research and educational use only. Not for reproduction or distribution or commercial use.
This article was originally published by IWA Publishing. IWA Publishing recognizes the retention of the right by the author(s) to photocopy or make single electronic
copies of the paper for their own personal use, including for their own classroom use, or the personal use of colleagues, provided the copies are not offered for sale and
are not distributed in a systematic way outside of their employing institution.
Please note that you are not permitted to post the IWA Publishing PDF version of your paper on your own website or your institution’s website or repository.
Please direct any queries regarding use or permissions to [email protected]
Article 1 Chapter III
143

Evaluation of the extracellular polymeric substances by
confocal laser scanning microscopy in conventional
activated sludge and advanced membrane bioreactors
treating hospital wastewater
Mousaab Alrhmoun, Claire Carrion, Magali Casellas
and Christophe Dagot
ABSTRACT
Confocal laser scanning microscopy (CLSM) combined with fluorescent viability indicators, was used
in this study to investigate the impact of hospital wastewaters on floc structure and composition. In
this work, three pilot-scale projects, two membrane bioreactors (MBRs) with a submerged or
external membrane bioreactor and a conventional activated sludge, were installed and operated for
65 days. They were fed with an influent sampled directly from the hospital drainage system, which
contained micropollutant concentrations ranging from ng/L to mg/L. Samples of flocs were observed
using CLSM to characterize the extracellular polymeric substances (EPS) stained with concanavalin
A–tetra methylrhodamine and fluorescein isothiocyanate solution and combined with a fluorescent
viability indicator (Baclight® Bacterial Viability Kit, Molecular Probes), allowing visualization of isolated
stained cells in the three-dimensional structure of flocs (damaged or not). The results of CLSM of the
sludge composition were compared with classical biochemical analysis of EPS made through a
thermal extraction method. The results showed a good relation between these analyses and the
statistical treatment of microscopic pictures.
Mousaab Alrhmoun (corresponding author)
Magali Casellas
Christophe Dagot
Laboratory of GRESE EA 4330,
University of Limoges,
123 avenues Albert Thomas,
87060 Limoges Cedex,
France
E-mail: [email protected]
Claire Carrion
UMR 7276 CNRS Service commun de microscopie-
CIM,
Université de Limoges,
Faculté de Médecine,
Limoges F-87000,
France
Key words | confocal laser scanning microscopy, EPS, extracellular polymeric substances, MBR,
membrane bioreactors
INTRODUCTION
In biological wastewater treatment systems, occurrence of
extracellular polymeric substances (EPS), a complex high
molecular weight mixture of polymers bound to bacterial
flocs, has been observed using various electron microscopy
techniques (Sheng et al. ). This often leads to decreased
performance of the wastewater treatment plant, to reduce
settling properties of activated sludge flocs in the secondary
clarifier and, in the worst case, to impact on the water quality
(Schmid et al. ). EPS are composed of a wide variety of
organic materials, including polysaccharides, proteins, nucleic
acids, lipids and humic substances. In an activated sludge
system, EPS mainly contain two forms, soluble EPS (SEPS)
and bound EPS (BEPS) according to their location around
the cell (Wingender et al. ; Rosenberger et al. ).
In recent years, membrane bioreactors (MBRs) have
given rise to increased attention in the field of wastewater
technologies (Zator et al. ). An important problem in
MBR treatment is the fouling of the membrane and that
leads to a decrease in performance of the MBRs. The fouling
properties of the membrane can be affected by a number of
factors, such as the amount and the composition of EPS, the
distribution in the sludge and the structure of flocs. The rela-
tive importance of these factors is, however, not well
understood (Ramesh et al. ).
Recently, among the various techniques that exist for the
visualization and distribution of EPS in activated sludge or
sorbed on the MBR, confocal laser scanning microscopy
(CLSM) was found to be a powerful tool used on the micro-
metre scale (Le-Clech et al. ; Wang & Wu ). CLSM
could be used to observe fully hydrated samples to obtain
the original shapes and structures of EPS (Zhang & Bishop
). After staining by various fluorescence probes, the
2287 © IWA Publishing 2014 Water Science & Technology | 69.11 | 2014
doi: 10.2166/wst.2014.141
Article 1 Chapter III
144

spatial distributions of carbohydrates, proteins and nucleic
acids in EPS can also be obtained by CLSM, in addition to
conventional chemical colorimetric analyses which can be
used to quantify their contents in EPS (Raunkjær et al. ).
A comparison between the two methods for carbo-
hydrates, protein and humic-like substances content
determination in EPS showed that the two methods yielded
similar results, but that the coefficient of time and the ana-
lyses cost for the CLSM method was lower than that for
the conventional chemical colorimetric method. The pur-
pose of this investigation was to evaluate the suitability of
images from the microscopic technique (CLSM) as a basis
for quantitative image analysis (Sheng et al. ).
MATERIALS AND METHODS
Reactor configuration and operating conditions
Three laboratory-scale systems, submerged (SMBR) or exter-
nal membrane bioreactors (EMBR) equipped with a
polypropylene membrane module and a type of hollow fibre
membrane, and a conventional activated sludge system
(CAS), were used to evaluate the role of the process on the for-
mation of EPS compounds and on the performances of the
three configurations in treating hospital wastewater.
Analytical methods
Physico-chemical characteristic measurements on the waste-
water and the sludge were carried out every 2 days.
Measurements of total and volatile suspended solids (TSS
and VSS) were performed according to the normalized
method (NF T 90-105; AFNOR ). Chemical oxygen
demand (COD) was measured by the closed reflux colori-
metric method (ISO 15705:2002; ISO ), and total
nitrogen (TN) was assessed using alkaline persulfate diges-
tion with colorimetric finish (Hach company). The COD
and TNmeasurements were carried out on both total and sol-
uble fractions (after samples had been filtered at 1.2 μm).
Ionic species in solution were determined on samples filtered
at 0.22 μm using ion chromatography (DIONEX 120) accord-
ing to the standard method (AFNOR, NF EN ISO 10304-1).
The analytical error was ±5%.
EPS extraction and chemical analysis
The analysis of EPS in biomass was made through a thermal
extraction method. Protein content was determined
according to the method of Lowry et al. () and the poly-
saccharides were determined according to the method of
Dubois et al. ().
Confocal laser scanning microscopy – EPS staining and
visualization
SYTO® 9 BacLight™ bacterial stains was used according to
the manufacturer’s instructions (Molecular Probes, Eugene,
Oregon, USA). The kit provides a three-colour fluorescence
assay of bacteria relying on membrane integrity: viable bac-
teria are stained by SYTO® 9 and fluoresce green, while
damaged bacteria are stained by propidium iodide and fluor-
esce red. The protocol established by Lopez et al. () and
Baker & Inverarity () was performed: 1 mL of undiluted
biomass suspension was mixed with 3 μL of a mixture of
equal parts of SYTO® 9 and propidium iodide. This short
staining protocol allowed direct observation of the original
floc structure and the time-lapse microscopy. Microscopic
observations started 15 min after staining. Excitation
maxima for SYTO® 9 and propidium iodide bound to
DNA are 480 and 540 nm, respectively (Reynolds ). A
Zeiss LCM 710 NLO confocal microscope was used for
the image series. The band width of the detected fluor-
escence wavelengths has been optimized to uniquely
channel the maximum emission in sequential mode to
avoid potential interference (502–530 nm) for SYTO® 9
and (600–630 nm) for propidium iodide.
Step size was determined by choosing start and end
points in the z-direction of the flocs, and by then selecting
a number of optical sections.
Polysaccharides (PS) and proteins (PN) staining was
carried out according to the modified procedure of Chen
et al. (). Bio-samples were centrifuged to remove super-
natant, washed twice with phosphate-buffered saline (PBS)
buffer (pH 7.2) and kept fully hydrated in 2 mL centrifuge
tubes covered with aluminium foil.
For PS staining, 100 μL of concanavalin A conjugated
with tetramethylrhodamine (Con A, 250 mg/L; Molecular
Probes, Carlsbad, CA, USA) was first dripped onto the
sample and incubated for 30 min to stain α-mannopyranosyl
and α-glucopyranosyl sugar residues. For PN staining,
100 μL of sodium bicarbonate buffer (0.1 M) was introduced
to the sample to maintain the amine groups in non-proto-
nated form. Subsequently, 100 μL of fluorescein
isothiocyanate solution (FITC, 1 g/L, Fluka) was sup-
plemented and incubated for 1 h to bind to proteins.
Samples were washed twice with 1× PBS buffer after each
staining stage to remove loosely bound and excess dyes.
2288 M. Alrhmoun et al. | Evaluation of EPS by confocal laser scanning microscopy in CAS and MBRs treating wastewater Water Science & Technology | 69.11 | 2014
145

Finally, sectioned granule or biofloc samples were
mounted onto microscope glass slides for observation of
the distribution of PS and PN by CLSM. The image acqui-
sition settings, such as laser intensity, numerical aperture,
gain and offset settings were adjusted according to Toh
et al. (). Samples were visualized with 10× and 100×
objectives and analyzed with the start LSM image browser
confocal and Image J software.
Digital image analysis
Image analysis was performed with the freely available soft-
ware Image J version 1.39i including the LSM-Reader plug.
The tool Image J Analyzer 1.1, which is based on the per-
formance of Image J and handles LSM5 formatted image
stacks, was programmed for quantitative analysis. By setting
a threshold, pixels with intensity below the threshold were
assigned to the background. All other pixels were set to
the foreground. Due to the individual image adjustment
during the image stack acquisition, the threshold was
chosen manually for each image stack. It has to be stressed
that the pitfalls of threshold setting by the operator are well
known (Yang et al. ; Staudt et al. ).
RESULTS AND DISCUSSION
Performance of MBR systems and CAS in treating the
organic pollutants
A comparison between the three reactors was made for TSS
and VSS, COD and nitrogen removal rates. The results in
Table 1 showed that the removal efficiencies of COD, TN,
and TSS, in EMBR were 87.9, 91.1 and 99.6%, respectively,
compared with 80.5, 79 and 93.6%, respectively, in SMBR
and 78, 85.4 and 93.4% in CAS (Table 1). The MBR
system is able to achieve COD removal by both physical
and biological mechanisms.
Analysis of EPS
It has been generally believed that EPS can mediate both
bacterial cohesion and adhesion. Hence, EPS, especially
PS/PN, have a decisive role in building and keeping the
structural integrity of a microbial community (Liu et al.
). At low solid residence time (SRT) (15 days), the con-
centrations of all the compounds measured in MBR sludge
supernatant are higher than those with CAS until 45 days
of exposure (Figure 1). These results could be explained by
different assumptions: (1) first it could be assumed that a
‘low’ SRT (lower than 30 days) is not sufficient to degrade
Table 1 | Stabilized COD, N and SS removal efficiencies for AG-MBR and SG-MBR
Efficiency of removal (%) TSS VSS Total Soluble
COD N COD N
EMBR 99.6 97.5 87.9 91.1 86.9 90.5
SMBR 93.6 87.8 80.5 79.0 71.6 85.4
CAS 93.4 87.2 78.0 85.4 72.8 85.5
Figure 1 | EPS concentration in the mixed liquor for SMBR, EMBR and CAS systems.
2289 M. Alrhmoun et al. | Evaluation of EPS by confocal laser scanning microscopy in CAS and MBRs treating wastewater Water Science & Technology | 69.11 | 2014
146

all the organic compounds, which are accumulated in the
system because of external membrane retention; (2) the
presence of more dispersed organisms in MBR probably
also aid the degradation of molecules in the supernatant
due to reduction of mass transfer limitation; (3) increase of
SRT could also enhance the development of slowly growing
populations, which are able to use some macro-molecules
(polysaccharides and proteins) as substrate; (4) finally, if it
is assumed that the quantified organics (PN and PS) are
principally composed of microbial products, it can be sup-
posed that non-flocculating bacteria produced less
biopolymer, which is a known flocculating agent.
EPS analysis with confocal laser scanning microscopy
Live/dead assessment within mixed microbial flocs
Propidium iodide (PPI) was used to stain dead cells and extra-
cellular SYTO® 9 was used to stain live cells in the sample. In
general, for all floc samples, the SYTO® 9 and PPI signals
were distributed throughout the flocs sections. However,
the intensity of the two signals varied from one region of a
floc to another, probably due to the differential number and
localization of live versus dead cells within the flocs.
CLSM images (Figure 2) reveal that there is an increase
in blue signal intensity during the time of observation and it
is much more significant in the SMBR compared with the
CAS. These modifications were attributed to a protection
mechanism of the bacteria against toxic effluent (Avella
et al. ). EPS might act as protective barriers against
toxic substances, e.g. heavy metals or certain biocides (disin-
fectants and antibiotics).
Stacks of images were imported into the image software
to mathematically compute relative intensities of the SYTO®
9 and PPI signals, and to calculate the relative percentage of
live cells per floc.
Evolution of EPS compositions within a mixed microbial
community
Figures 3 and 4 show that the visualizations of flocs col-
lected in the EMBR reactor after 2, 20, 45, and 65 days of
exposure time to the hospital effluent.
In general, through visual inspection, an increase in SEPS
and BEPS was observed, especially in the first days between 2
and 20 days of exposure. This finding is in accordance with
our chemical analysis which shows increasing concentration
of SEPS and BEPS (PS, PN and humic-like substances) with
time up to 20 days (see Figures 1, 3 and 4). Through the fluor-
escence indications at the start of the study (from 2 to 20 days
of exposure to hospital effluents) it were observed that the
polysaccharides and the humic-like substance compounds
Figure 2 | CLSM image of live cell distribution within CAS and SMBR flocs. Flocs were stained with SYTO® 9 for total available DNA (viable bacteria; green) and stained with PPI for DNA of
dead cells and EPS DNA (dying bacteria; red). Images obtained at x100 magnification. These representative images are based upon the examination of 5–10 flocs per sample.
The full colour version of this figure in available online at http://www.iwaponline.com/wst/toc.htm.
2290 M. Alrhmoun et al. | Evaluation of EPS by confocal laser scanning microscopy in CAS and MBRs treating wastewater Water Science & Technology | 69.11 | 2014
147

increased in the bound phase (Figure 3). Then, a stabilization
in polysaccharides concentration and a decrease in concen-
tration of proteins were observed in both phases (bound and
soluble) of sludge samples after more than 40 days.
The chemical analysis of the soluble and supernatant
EPS matrix in the EMBR shows a slight trend towards a
small increase in carbohydrate concentrations and a
decrease in protein concentrations after the first 20 days of
Figure 3 | CLSM images of the BEPS distribution within EMBR flocs. Images were obtained at x10 magnification. FITC staining universal protein is in green and ConA staining α-man-
nopyranosyl and α glucopyranosyl is in red. Images are representative of 5–10 flocs examined. Images (a, b, c), (d, e, f), (g, h, i), (j, k, l) are for 2, 20, 45 and 65 days, respectively.
(1), (2), (3) represent the distribution of the EPS constituent versus the time in the sludge from the experimental tests. In right-hand boxes, 'Red' denotes polysaccharides,
'Green' denotes proteins, and 'Blue' denotes humic-like substances. The full colour version of this figure in available online at http://www.iwaponline.com/wst/toc.htm.
2291 M. Alrhmoun et al. | Evaluation of EPS by confocal laser scanning microscopy in CAS and MBRs treating wastewater Water Science & Technology | 69.11 | 2014
148

the study. The lower signal intensity at the exterior of the
flocs (soluble) compared to the interior of flocs (bound)
can be related to the loss of packing of EPS.
A dynamic high and low signal observed on the two
sides of the central peak was possibly due to the porosity
and filamentous bacteria on the exterior of the flocs.
Lower intensities in the FITC could be due to fewer binding
sites caused by lower concentration of these EPS
constituents.
Statistical analyses
Stacks of images were imported into the J image software to
mathematically compute relative intensities of the SYTO® 9
and PPI signals, and to calculate the relative percentage of
live cells per floc. The relative distribution of dead/live
Figure 4 | CLSM images of the SEPS distribution within EMBR flocs. Images were obtained at x10 magnification. FITC staining universal protein is in green and ConA staining α-man-
nopyranosyl and α glucopyranosyl is in red. Images are representative of 5–10 flocs examined. Images (a, b, c), (d, e, f), (g, h, i), (j, k, l) are for 2, 20, 45 and 65 days, respectively.
In right-hand boxes, 'Red' denotes polysaccharides, 'Green' denotes proteins, and 'Blue' denotes humic-like substances. The full colour version of this figure in available online
at http://www.iwaponline.com/wst/toc.htm.
Figure 5 | Relative number of live cells in two reactors (CAS and SMBR). The percentage
was determined by measuring fluorescent intensities of SYTO® 9, which labels
all DNA in a sample, and PPI, which labels DNA from cells with compromized
membranes and extracellular DNA. The calculation is based on measurements
of 5–10 flocs from each sampling site.
2292 M. Alrhmoun et al. | Evaluation of EPS by confocal laser scanning microscopy in CAS and MBRs treating wastewater Water Science & Technology | 69.11 | 2014
149

cells is shown in Figure 2 and relative percentages can be
observed in Figure 5 for two sites.
Five or more flocs from each sampling site were exam-
ined. We can observe the SMBR samples had the most
intact cells, followed by CAS. This may indicate the overall
health and well-being of cells within flocs of different
origin and give an indicator on the relation between concen-
tration of EPS and the live cells of bacteria.
The settleability and physicochemical parameters are
attributed to the PN/PS ratio. The PN/PS ratios were ana-
lyzed via the bulk extraction method for the sludge
samples in both phases (bound and soluble) in EMBR and
was found to be from 0.3 to 1.3 in both phases.
For the sludge samples analyzed through microscopic
analysis, however, the calculated PN/PS ratios were
between 0.05 and 1.3 at the bound phase.
The bulk analysis revealed that the bulk EPS constitu-
ents of all sampling sites were not significantly different
according to PN/PS ratios examined through the micro-
scopic method. The relation between the intensity of
the PN (FITC) and the PS (Con A) with the relative per-
centage fluorescent intensity versus time is reported in
Figure 6.
CONCLUSIONS
It can be concluded that CLSM, in combination with image
analysis, is a powerful method for direct determination of
the EPS distribution, heterogeneity factors and the structure
of activated sludge flocs. We have also found that there is a
good correlation between the chemical analyses of EPS and
the statistical treatment of microscopic pictures.
In addition, significant and specific changes of the EPS
compounds, and in the microbial population structure of
original flocs, could be observed in the CAS and MBR sys-
tems treating hospital effluent.
ACKNOWLEDGEMENTS
This work was supported by the noPILLS project (www.
no-pills.eu), Department of Rural Engineering at University
of Aleppo. The authors are thankful to David Chaisemartin
for technical assistance.
REFERENCES
AFNOR NF T90-105 Qualité de l’eau – Dosage des matières
en suspension – Méthode par centrifugation. AFNOR, Paris.
Avella, A. C., Delgado, L. F., Gorner, T., Albasi, C., Galmiche, M.
& De Donato, P. h. Effect of Cytostatic drug presence on
extracellular polymeric substances formation in municipal
wastewater treated by membrane bioreactor. Bioresource
Technology 101, 518–526.
Baker, A. & Inverarity, R. Protein-like fluorescence intensity
as a possible tool for determining river water quality.
Hydrology Processes 18, 2927–2945.
Chen, M., Lee, D. J. & Tay, J. H. Distribution of extracellular
polymeric substances in aerobic granules. Applied
Microbiology Biotechnology 73, 1463–1469.
Dubois, M., Gilles, K. A., Hamilton, J. K., Robers, P. A. & Smith, F.
Colorimetric method for determination of sugars and
related substances. Analytical Chemistry 28 (3), 350–356.
ISO 15705: 2002 Water quality – Determination of the
chemical oxygen demand index (ST-COD) – Small-scale
sealed-tube method. ISO, Geneva.
Figure 6 | Percentage of protein and carbohydrate intensity versus the time within EMBR flocs for the bound phase (a) and soluble phase (b) (n¼ 5).
2293 M. Alrhmoun et al. | Evaluation of EPS by confocal laser scanning microscopy in CAS and MBRs treating wastewater Water Science & Technology | 69.11 | 2014
150

Le-Clech, P., Marselina, Y., Ye, Y., Stuetz, R. M. & Chen, V.
Visualisation of polysaccharide fouling on microporous
membrane using different characterisation techniques.
Journal of Membrane Science 290, 36–45.
Liu, Y., Yang, S. F. & Tay, J. H. Improved stability of aerobic
granules by selecting slow-growing nitrifying bacteria.
Biotechnology Journal 108, 161–169.
Lopez, C., Pons, M. N. & Morgenroth, E. Evaluation of
microscopic techniques (epifluorescence microscopy CLSM,
TPE-LSM) as a basis for the quantitative image analysis of
activated sludge. Water Research 39, 456–468.
Lowry, O. H., Roserbrough, N. J., Farr, A. L. & Randall, R. J.
Protein measurement with the Folin phenol reagent. Journal
of Biological Chemistry 193 (1), 265–275.
Ramesh, A., Lee, D. J., Wang, M. L., Hsu, J. P., Juang, R. S., Hwang,
K. J., Liu, J. C. & Tseng, S. J. Biofouling in membrane
bioreactor. Separation Science and Technology 41, 1345–1370.
Raunkjær, K., Hvitved-Jacobsen, T. & Nielsen, P. H.
Measurement of pools of protein, carbohydrate and lipid in
domestic wastewater. Water Research 28, 251–261.
Reynolds, D. M. The differentiation of biodegradable and
non-biodegradable dissolved organic matter in waste waters
using fluorescence spectroscopy. Journal Chemical
Technology and Biotechnology 77, 965–972.
Rosenberger, S., Evenblij, H., te Poele, S., Wintgens, T. & Laabs,
C. The importance of liquid phase analyses to
understand fouling in membrane assisted activated sludge
processes – six case studies of different European research
groups, M. Kraume, Filterability of activated sludge in
membrane bioreactors. Desalination 146, 373–379.
Schmid, M., Thill, A., Purkhold, U., Walcher, M., Bottero, J. Y.,
Ginestet, P. h., Nielsen, P. H., Wuertz, S. & Wagner, M.
Characterization of activated sludge flocs by confocal laser
scanning microscopy and image analysis. Water Research 37,
2043–2052.
Sheng, Y. H., Li, X. & Ping, G. Extracellular polymeric
substances (EPS) of microbial aggregates in biological
wastewater treatment systems. A review. Biotechnology
Advances 12, 882–894.
Staudt, C., Horn, H., Hempel, D. C. & Neu, T. R. Volumetric
measurements of bacterial cells, extracellular polymeric
substance glycoconjugates in biofilms. Biotechnology and
Bioengineering 88, 585–592.
Toh, S. K., Tay, J. H., Moy, B., Ivanov, V. & Tay, S. L.
Size effect on the physical characteristics of the aerobic
granule in a SBR. Applied Microbiology Biotechnology 60,
687–695.
Wang, Z. & Wu, C. A review of membrane fouling in MBRs:
characteristics and role of sludge cake formed on
membrane surfaces. Separation Science and Technology 44,
3571–3596.
Wingender, J., Neu, T. R. & Flemming, H. C. Microbial
Extracellular Polymeric Substances: Characterization,
Structure, and Function. Springer, Berlin.
Yang, X., Beyenal, H., Harkin, G. & Lewandowski, Z.
Evaluation of biofilm image thresholding methods. Water
Research 35, 1149–1158.
Zator, M., Lopez, F. & Guell, C. Membrane fouling
characterization by confocal microscopy during filtration of
BSA/dextran mixtures. Journal of Membrane Science 301,
57–66.
Zhang, X. Q. & Bishop, P. L. Spatial distribution of
extracellular polymeric substances in biofilms. Journal of
Environment and Engineering 127, 850–860.
First received 11 October 2013; accepted in revised form 4 March 2014. Available online 26 March 2014
2294 M. Alrhmoun et al. | Evaluation of EPS by confocal laser scanning microscopy in CAS and MBRs treating wastewater Water Science & Technology | 69.11 | 2014
151
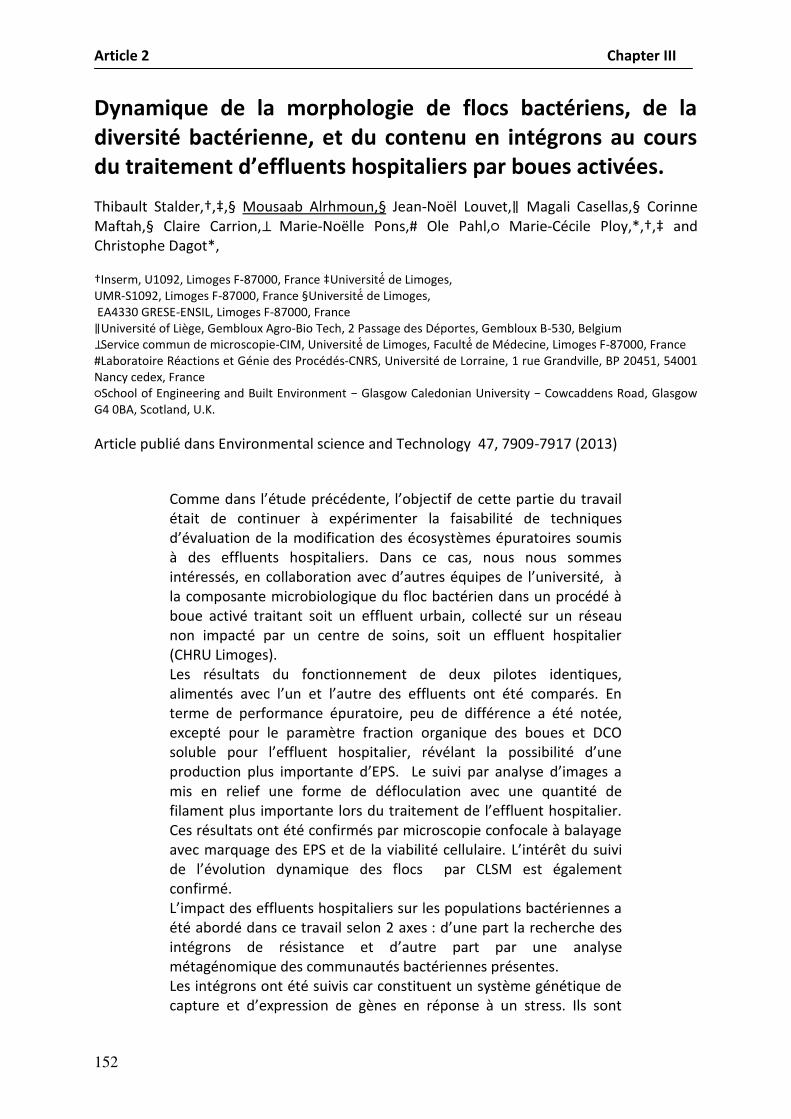
Article 2 Chapter III
152
Dynamique de la morphologie de flocs bactériens, de la
diversité bactérienne, et du contenu en intégrons au cours
du traite e t d’efflue ts hospitaliers par oues a tivées.
Thibault Stalder, , ,§ Mousaab Alrhmoun,§ Jea -Nol Louvet,∥ Magali Casellas,§ Corinne
Maftah,§ Claire Carrion,⊥ Ma ie-Nolle Pons,# Ole Pahl,○ Ma ie-Ccile Ploy,*, , and
Christophe Dagot*,
Inserm, U1092, Limoges F-87000, France U ive sit de Limoges,
UMR-S1092, Limoges F-87000, France §U ive sit de Limoges,
EA4330 GRESE-ENSIL, Limoges F-87000, France ∥Université of Liège, Gembloux Agro-Bio Tech, 2 Passage des Déportes, Gembloux B-530, Belgium ⊥Service commun de microscopie-CIM, U ive sit de Limoges, Fa ult de Médecine, Limoges F-87000, France
#Laboratoire Réactions et Génie des P o ds-CNRS, Université de Lorraine, 1 rue Grandville, BP 20451, 54001
Nancy cedex, France
○School of Engineering and Built Environment − Glasgow Caledonian University − Cowcaddens Road, Glasgow
G4 0BA, Scotland, U.K.
Article publié dans Environmental science and Technology 47, 7909-7917 (2013)
Co e da s l’tude p de te, l’o je tif de ette pa tie du t avail était de continuer à expérimenter la faisabilité de techniques
d’valuatio de la odifi atio des os stè es pu atoi es sou is à des effluents hospitaliers. Dans ce cas, nous nous sommes
i t esss, e olla o atio ave d’aut es uipes de l’u ive sit, à la composante microbiologique du floc bactérien dans un procédé à
boue activé traitant soit un effluent urbain, collecté sur un réseau
non impacté par un centre de soins, soit un effluent hospitalier
(CHRU Limoges).
Les résultats du fonctionnement de deux pilotes identiques,
ali e ts ave l’u et l’aut e des efflue ts o t t o pa s. E terme de performance épuratoire, peu de différence a été notée,
excepté pour le paramètre fraction organique des boues et DCO
solu le pou l’efflue t hospitalie , vla t la possi ilit d’u e p odu tio plus i po ta te d’EPS. Le suivi pa a al se d’i ages a mis en relief une forme de défloculation avec une quantité de
fila e t plus i po ta te lo s du t aite e t de l’efflue t hospitalie . Ces résultats ont été confirmés par microscopie confocale à balayage
avec marquage des EPS et de la viabilité cellulaire. L’i t êt du suivi de l’volutio dynamique des flocs par CLSM est également
confirmé.
L’i pa t des efflue ts hospitalie s su les populatio s a t ie es a été abordé dans ce travail selon 2 axes : d’u e pa t la e he he des i tg o s de sista e et d’aut e pa t pa u e analyse
métagénomique des communautés bactériennes présentes.
Les intégrons ont été suivis car constituent un système génétique de
aptu e et d’e p essio de gè es e po se à u st ess. Ils so t

Article 2 Chapter III
153
notamment impliqués dans la dissémination de la résistance aux
antibioti ues. Il est o t i i ue l’ali e tatio de os pilotes de traitement en effluent hospitalier provoque une augmentation de
l’a o da e elative e i tg o s, o pa ative e t au pilote alimenté par des eaux urbaines classiques.
L'analyse métagénomique comparative des communautés
a t ie es a o t ue le t aite e t de l’efflue t hospitalie a entraîné l'introduction de Pseudomonas spp. dans la communauté
bactérienne.
L’a al se oise des sultats a outit à la o lusio ue les
effluents hospitaliers impactent les populations bactériennes
classiques des bassins de boues activée en induisant
sur le plan physique, une érosion des flocs,
su le pla io hi i ue, u e aug e tatio de la p odu tio d’EPS
sur le plan biologique, une modification de la population avec
l'introduction de Pseudomonas spp., connu pour ces potentialités à
produire des EPS
sur le plan du risque, une modification des potentialités, liées
également à Pseudomonas spp., à échanger des déterminants
génétiques (RIS) impliqués dans l'acquisition de la résistance aux
antibiotiques.

Dynamic Assessment of the Floc Morphology, Bacterial Diversity,and Integron Content of an Activated Sludge Reactor ProcessingHospital Effluent
Thibault Stalder,†,‡,§ Mousaab Alrhmoun,§ Jean-Noel Louvet,∥ Magali Casellas,§ Corinne Maftah,§
Claire Carrion,⊥ Marie-Noelle Pons,# Ole Pahl,○ Marie-Cecile Ploy,*,†,‡ and Christophe Dagot*,§
†Inserm, U1092, Limoges F-87000, France‡Universite de Limoges, UMR-S1092, Limoges F-87000, France§Universite de Limoges, EA4330 GRESE-ENSIL, Limoges F-87000, France∥University of Liege, Gembloux Agro-Bio Tech, 2 Passage des Deportes, Gembloux B-530, Belgium⊥Service commun de microscopie-CIM, Universite de Limoges, Faculte de Medecine, Limoges F-87000, France#Laboratoire Reactions et Genie des Procedes-CNRS, Universite de Lorraine, 1 rue Grandville, BP 20451, 54001 Nancy cedex, France○School of Engineering and Built Environment − Glasgow Caledonian University − Cowcaddens Road, Glasgow G4 0BA, Scotland,U.K.
*S Supporting Information
ABSTRACT: The treatment of hospital effluents (HE) is a majorconcern, as they are suspected of disseminating drugs and antibioticresistance determinants in the environment. In order to assess HEinfluence on wastewater treatment plant biomass, lab-scale conventionalactivated sludge systems (CAS) were continuously fed with real HE orurban effluent as a control. To gain insights into the main hurdles linked toHE treatment, we conducted a multiparameter study using classicalphysicochemical characterization, phase contrast and confocal laserscaning microscopy, and molecular biology (i.e., pyrosequencing) tools.HE caused erosion of floc structure and the production of extracellularpolymeric substances attributed to the development of floc-formingbacteria. Adaptation of the sludge bacterial community to the HEcharacteristics, thus maintaining the purification performance of the biomass, was observed. Finally, the comparativemetagenomic analysis of the CAS showed that HE treatment resulted in an increase of class 1 resistance integrons (RIs) and theintroduction of Pseudomonas spp. into the bacterial community. HE treatment did not reduce the CAS process performance;nevertheless it increases the risk of dissemination into the environment of bacterial species and genetic determinants (RIs)involved in antibiotic resistance acquisition.
■ INTRODUCTION
During the past decade, several studies and internationalresearch programs (POSEIDON, PILLS, KNAPPE) haveworked on the contribution of medical care activities toenvironmental pollution. These anthropogenic activitiesproduce effluents that contain pharmaceuticals and antibioticresistant determinants (ARD), which are designated asemerging contaminants by some of the studies. Severalecotoxicological surveys1−4 showed that pharmaceuticals haveadverse effects on the receiving environment, while ARDs arelinked to the emergence of multidrug resistant bacteria.5
Hospital effluents (HE) are characterized by a large diversityof hazardous chemicals such as antibiotics, anesthetics,cytotoxic agents, disinfectants, heavy metals, and iodized X-ray contrast media.6,7 Concentrations of pharmaceuticals in HEare most often in the range of μg·L−1, and a study comparinganalytical measurements of 73 pharmaceuticals compounds in a
HE and an urban effluent (UE) wastewater treatment plant(WWTP) found that pharmaceutical concentrations ininfluents were 7-fold higher on average in the HE than in theUE. Pharmaceuticals compounds of the highest concentrationsin HE included the following: analgesics/anti-inflammatories,lipid regulators, and antibiotics.8 The influence of antibiotics onbacterial communities, in terms of impact on the microbialecosystem equilibrium, or on the ARD content, raises specificsanitary issues, even if environmental concentrations ofantibiotics are often too low to exert a direct selective pressureon bacterial communities.9 However, in vitro studies havereported that subinhibitory concentrations of antibiotics could
Received: February 25, 2013Revised: June 19, 2013Accepted: June 21, 2013Published: June 21, 2013
Article
pubs.acs.org/est
© 2013 American Chemical Society 7909 dx.doi.org/10.1021/es4008646 | Environ. Sci. Technol. 2013, 47, 7909−7917
154

impact the behavior of bacterial communities. They couldinfluence mutational, recombinational, and horizontal genetransfer rates in bacteria10 and could increase the emergence ofantibiotic resistant bacteria.11,12 Furthermore HE exhibit highconcentrations of (i) opportunistic pathogens, such asPseudomonas aeruginosa, (ii) antibiotic resistant bacteria ofclinical interest, such as multidrug resistant E. coli orvancomycin and ciprofloxacin resistant Enterococcus spp., and(iii) antibiotic-resistance genes.13−20 The complex relationshipbetween antibiotic-resistance profiles of bacteria from HE andtheir downstream environments is mainly the result ofhorizontal transfers of antibiotic resistance genes containedby bacterial genetic elements, i.e. plasmids, transposons,resistant integrons.21 These genetics elements often harbormore than one resistance gene, conferring multidrug resistance.Resistant integrons (RIs) are genetic elements able to acquireand exchange genes embedded within cassettes.22 Five classesof RIs have been described, and class 1 is the most describedand the most frequently found. Class 1 RIs are widespread inthe environment and are mainly associated, in a medicalcontext, with clinical antibiotic resistance in gram-negativebacteria.23,24 In HE, it was found that more than 50% ofantibiotic-resistant Enterobacteriaceae contained class 1 RIs.25
They have been used for the evaluation of the prevalence ofmultidrug resistance in sludge from WWTP.9,26
Most HEs are discharged into municipal sewers connected tourban WWTPs without specific treatment aimed at bacterial- ormicropollutants; the resultant impacts on the associatedbiological systems and, more generally, on WWTP performanceraise questions about the management of these effluents.27
Currently, the most common WWTP types involve bio-logical processes, which are based on the ability of endogenousmicroorganisms to biologically oxidize organic pollutants. Inthese conventional activated sludge (CAS) processes, thebacterial population is organized in macroscopic structures(floc), which are made up of macromolecules denotedextracellular polymeric substances (EPS).28 This floc organ-ization enables gravity sedimentation, which is a principalmonitoring parameter in WWTP management. To date, theinfluence of HE on the biological biomass involved in thewastewater purification process has been poorly investigated interms of the floc structure, the bacterial metabolic efficiency, orthe microbial ecosystem equilibrium. Only some authors havereported the negative impact of elevated concentrations ofindividual antibiotics or synthetic mixtures of pharmaceuticalson the structure, activity,29,30 and bacterial community withinthe WWTP biomass.31
In this study, we examined the treatment of a HE with a CASsystem, focusing on overall performance, biomass structure,bacterial diversity, and antibiotic resistance determinants. Thesame treatment applied to an UE was used as a control. Theoriginality and importance of this study lie in its multiscaleapproach, giving an overview of the impacts of a real HE onseveral major aspects of the CAS process and ARDdissemination.
■ MATERIALS AND METHODS
Conventional Activated Sludge Reactors: Tests andAnalytical Methods. Two identical lab-scale CAS reactorscomprising an activated sludge reactor and a settling tank (totalvolume 14 L) were continuously fed with HE or UE untilsteady-state was reached. Total suspended solids (TSS), volatilesuspended solids (VSS), total/soluble chemical oxygen demand
(COD), total/soluble total nitrogen (TN), and the sludgevolume index (SVI) were continuously monitored on alternatedays. The reactor settings and parameters and a completedescription of the collection sites and effluents characteristics(including selected pharmaceutical compounds) are provided inthe Supporting Information (SI).
Microscopy. Bright field microscopy was conducted usingan Olympus CX 31 equipped with a video CCD cameraconnected to a PC via a grabbing card. After depositing a dropof sludge on a slide and spreading it with the enlarged tip of aplastic pipet, the smear was left to dry before grabbing at least100 images (×100 magnification). Care was taken to avoidoverlapping fields. Pixel size calibration was performed using astage micrometer (160 pixels = 100 μm). The images wereanalyzed using the procedure described by Da Motta et al.(2003),32 implemented with Visilog 5 (Noesis). The sludgestructure was quantified by the ratio between the number ofsmall fragments (nonfilamentous fragments with an area of lessthan 6.25 μm2) and the total area occupied by the biomass onthe image and filament abundance (ratio of the filament length(in pixels) to the total area occupied by the biomass on theimage). Average values were calculated for about 100 images.The coefficient of variation (c.v.) for any image analysis set wasless than 10% if the number of images was increased by 10%.Indeed the c.v. was between 1 and 5%, and we used 5%.The Live/DeadBacLightTM bacterial viability stain was used
according to the manufacturer’s instructions (MolecularProbes). The kit provides a two-color fluorescence assay ofbacterial viability based on membrane integrity using thenucleic acid stains SYTO 9 (fluorescent green) and propidiumiodide (fluorescent red). When the dyes are used together, cellswith intact membrane show a green fluorescence, while cellswith damaged membranes show a red fluorescence. Theprotocol established by Lopez et al. (2005)33 was used: 1 mL ofundiluted biomass suspension was mixed with 3 μL of anequimolar mix of SYTO 9 and propidium iodide (5 μM finalconcentration). This short staining protocol allows directobservation of the original floc structure. Microscopicobservations started 15 min after staining. Fluorescenceemissions were recorded with an Airy disk confocal pinholeopening, which yielded 512 × 512 images with a 0.28 μm (x,y)pixel size (pinhole 118 μm, pixel dwell time of 3.2 μs). Aconstant 1 μm step size in the vertical direction was used whenimaging the 3D structures. Phase-contrast microscopy was alsoused to visualize the structure of the flocs. The excitationmaxima for SYTO9 and propidium iodide bound to DNA were480 and 540 nm, respectively. SYTO9 was excited at 488 nm,and fluorescence emission was collected in the green channelbetween 505 and 550 nm. Propidium iodide was excited at 543nm, and fluorescence emission was collected in the red channelafter long-pass filter at 585 nm. The EPS of the sludge flocs wasexcited at 405 nm, and their autofluorescence was collected inthe blue channel between 505 and 550 nm.
DNA Extraction. Every week, sludge from each reactor wassampled for molecular biological analyses. Two mL of sludgewas pelleted at 15000 g for 10 min and then total DNA wasextracted using the FastDNA spin kit for feces on the FastPrepInstrument (MP Biomedicals), according to the manufacturer’sinstructions. In order to concentrate bacteria from feed effluent,wastewater samples were filtered in triplicate under vacuumthrough sterile 47-mm membranes with a porosity of 0.45 μm(Millipore). Total DNA was extracted from the bacteriaretained on the filter using a PowerWater DNA isolation kit
Environmental Science & Technology Article
dx.doi.org/10.1021/es4008646 | Environ. Sci. Technol. 2013, 47, 7909−79177910
155

(MoBio Laboratories Inc.), following the manufacturer’sinstructions. Total DNA of all HE or UE were pooled. Beforestorage at −20 °C, the quality of extracted DNA was verified byelectrophoresis through 0.8% (w/v) agarose gel, and itsquantity was assayed in triplicate with a Nanodrop spectropho-tometer (Thermo Scientific).PCR-DGGE Experiment. PCR-DGGE was based on
Laurent et al. experiment.34 Extracted DNA from each sludgesample was analyzed by PCR using the universal bacterialprimers 341F with a 40-bp GC-clamp and 518R.35 For PCR, 1ng·μL−1 template DNA was used in a final volume of 100 μL.Twenty-five microliters of each PCR product was loaded onto8% (w/v) polyacrylamide gel (containing acrylamide and bis-acrylamide, 37.5:1) with a linear denaturant gradient rangingfrom 40% to 60% (urea w/v and formamide v/v). DGGE wasperformed at 60 °C for 15h at 100 V in 1 × TAEelectrophoresis buffer with the D-code universal mutationdetection system (Bio-Rad Laboratories, Hercules, CA, USA).Gel images were analyzed using Quantity One QuantitationSoftware Version 4.6.1 (Bio-Rad Laboratories).Pyrosequencing. Pyrosequencing was used to analyze
bacterial diversity. The V3 and V4 regions of the 16S rRNAencoding gene were chosen to analyze bacterial diversity, usingthe universal bacterial primers 339F (CTCCTACGGGAGG-CAGCAG) and 339R (TTGTGCGGGCCCCCGTCAATT)which target the V3 and V4 variable regions of the 16S rRNAgene. Pyrosequencing and PCR were conducted by theMolecular Research LB Lab (http://www.mrdnalab.com/)using standard laboratory procedures and a 454 FLX Sequencer(454 Life Sciences). The detailed methods, analysis pipeline,and results are presented in the SI.Diversity Analyses. Rarefaction analyses were performed
using PAST software (PAleontological Statistics v1.60) fromhttp://folk.uio.no/ohammer/past/. Primer6 software (Ply-mouth Routines In Multivariate Ecological Research, version6.1.6) was used to calculate the Bray−Curtis (BC) similarityindex, the diversity indices (Chao1 richness and Shannondiversity indexes), and for clustering analysis coupled to two-dimensional nonmetric multidimensional scaling ordination(2D-nMDS) based on BC similarity, taking into account thepresence or absence of bands and their relative intensity for theDGGE pattern.Quantitative PCR Protocol. Quantitative PCR (qPCR)
assays targeted the intI1 gene of the class 1 RIs from totalextracted DNA, using the method described by Barraud et al.(2010).36 Quantification of the rRNA 16S encoding gene wasperformed in a SYBR green assay using the universal primer338F and 518R which target the 16S rRNA gene of Eubacteriaas described by Park et al. (2006).37 Assays were performed intriplicate with a MX3005P real-time detection system(Stratagene). In order to avoid qPCR inhibitor effects, totalDNA samples were serially diluted to the dilution at whichquantification was not affected. For accurate quantification, theintI1 and 16S rRNA genes were embedded in a single standardplasmid. A full standard curve, between 103 and 108 copies ofstandard plasmid, was included in duplicate in each qPCR run.The total estimated bacterial cell number was obtained usingquantification of the 16S rRNA encoding genes. Based on theRibosomal RNA Database, the mean number of 16S rRNAencoding genes per bacterial cell is currently estimated to be4.1.38 Therefore, 16S rRNA encoding gene copy numbers weredivided by 4.1 to estimate the total bacterial load. The relativeabundance of class 1 RIs was calculated by dividing their
concentration by the estimated bacterial load. For all statisticaltests, the Mann−Whitney was implemented with StatView 5.0software (SAS institute Inc.), and p values <0.05 wereconsidered significant.
■ RESULTS
General Performance of the CAS System underDifferent Feeding Procedures. The overall performance ofthe two CAS reactors was measured by classical physicochem-ical parameters until steady-state was reached. The purificationperformance of the HE reactor was equivalent to the UEreactor; for both reactors TSS, COD, and TN removal ratesaveraged greater than 95%, 90%, and 70%, respectively, and theSVIs decreased to 50 mL·g−1 of TSS after 16 days of operation.Specific differences in the HE reactor were observed in asignificant increase in the organic fraction of the sludge from0.8 ± 0.02 to 1 ± 0.03 VSS·TSS−1 from day 22 to the end of theexperiment (Figure S2−B) and a significant increase in thesoluble COD content of the treated HE from 22 ± 1.8 to 57 ±4.6 mg·L−1 by the 34th day (Figure S2−C).
Evolution of the Sludge Structure. The sludge structureand morphology were examined using optical microscopycombined with images analysis. Throughout the first 26 days,no difference in activated sludge floc morphology was observedbetween the two reactors. At the end of the experiment, phasecontrast microscopy showed the presence of a greaterproportion of floc fragments (i.e., very small flocs, see Figure1C) in the HE reactor than in the UE reactor (0.023 vs 0.008small fragments per μm2, respectively) (Figure 1A).
At the end of the experiment, a high density of livefilamentous bacteria as well as damaged bacteria which wereprincipally nonfilamentous, was observed with CLSM in theflocs from the HE reactor (Figure 2B vs 2E). This differencewas confirmed by quantitative image analysis where, after 26days of experiment, the ratio of filaments per μm2 increased
Figure 1. (A) Ratio of fragments of flocs (number of small fragments/total floc area) and (B) ratio of filaments (filament length/total flocarea) over time in the HE (◆) and UE (◊) reactor. Examples of phasecontrast micrograph of activated sludge floc morphology at the end ofthe experiments in the HE (C) and the UE feed reactor (D). Thearrows indicate fragments of floc in the activated sludge of the HEreactor.
Environmental Science & Technology Article
dx.doi.org/10.1021/es4008646 | Environ. Sci. Technol. 2013, 47, 7909−79177911
156

from 0.018 to 0.089 in the HE reactor (Figure 1B). The EPS ofthe sludge was denser in the floc from the HE reactor (bluefluorescence on the Figure 2A vs 2D), suggesting a higher rateof EPS secretion by bacterial biomass of the sludge.Evolution of Bacterial Communities. PCR-DGGE
coupled with pyrosequencing of the 16S rRNA encoding
genes was used to study the influence of HE on the bacterialdiversity in sludge.Average observed bacterial concentrations in the two reactors
were similar and stable over time, at respective 1.82 × 10¹¹ ±6.69 × 10¹⁰ and 3.58 × 10¹¹ ± 3.44 × 10¹⁰ estimatedbacteria·L−1, except for the first week when the concentrationin the HE reactor was significantly higher (Figure S3). Bacterialloading in the HE and UE was relatively constant throughoutthe experiment, albeit higher for HE than UE (3.0 × 10¹¹ ± 2.0× 10¹¹ and 1.2 × 10¹¹ ± 6.1 × 10¹⁰ of estimated bacteriacells·L−1, respectively).A total of 49 different bands were noted on the PCR-DGGE
profile (Figure S4). The band patterns were similar to eachother, with a minimum BC similarity index of 91.1%. Therefore,in terms of bacterial diversity, feeding HE or UE did not affectthe main bacterial taxa of the sludge community. Assuming thatPCR efficiencies were identical for all targeted sequences, therelative intensity of the bands (semiquantitative analysis) wasused to follow the evolution of the bacterial communities(Figure 3A).This semiquantitative analysis showed that the bacterial
community of the HE reactor changed over time. In the firststep, the bacterial community evolved until the third week(T3), which corresponded to the point at which its structurewas most different from its initial structure (BC similarity indexbetween T0 and T3 = 63.3%). At T4, T5, and TF (end of theexperiment) bacterial community shared a BC similarity indexhigher than 89.9%, indicating that the bacterial community hadreached equilibrium. By comparison, the same semiquantitativeanalysis showed that the bacterial community in the UE reactordid not evolve (BC similarity index consistently higher than84%). Overall, the semiquantitative analysis showed that whileno appearance or disappearance of main bacterial taxa occurredover time in the HE reactor after steady-state was reached, anearly shift of the balance within the community occurred in thefirst weeks following the start of the experiment.In order to further understand this evolution, bacterial
communities from both reactors were investigated bypyrosequencing of a portion of the 16S rRNA encoding gene.The diversity analysis comprising of the rarefaction curves, the
Figure 2. CLSM images of activated sludge at t = 40 days in the UEreactor showing (A) autofluorescence; (B) viability staining; (C)merge of autofluorescence and viability staining; and in the HE reactorshowing (D) autofluorescence; (E) viability staining; (F) merge ofautofluorescence and viability staining. The green and redfluorescences correspond to living and damaged bacteria, respectively.The blue fluorescence corresponds to the fluorescence of EPS.69
Figure 3. (A) 2D-nMDS map based on the semiquantitative analysis of the DGGE profiles showing the evolution of the activated sludge bacterialcommunity in both reactors (◊ UE, ◆ HE). This 2D projection of the BC similarity matrix allowed visualization of the similarity between eachbacterial community over time, i.e. the distance between diamonds. Plain and dashed lines represent the differing percentage of similarities. (B)Proportion of bacteria classes and phyla recovered from the HE and UE feed to the reactors (HE-Feed and UE-Feed) and from the HE and UEreactor sludges at the beginning (HE-T0 and UE-T0) and the end (HE-TF and UE-TF) of the experiment.
Environmental Science & Technology Article
dx.doi.org/10.1021/es4008646 | Environ. Sci. Technol. 2013, 47, 7909−79177912
157

bacterial diversity indices (Chao1 richness and Shannonindices), and their genus affiliation are given in the SI.Regarding the bacterial genera present in the HE reactor at theinitial (T0) and final (TF) time of the experiment, 85 generaamong the 121 genera present at the beginning of theexperiment were still detected among the 118 genera present atthe end. These 85 genera represented 93 to 94% of the totalbacterial population, confirming the interpretation of thesimilar PCR-DGGE band pattern that HE did not majorlydisturb the bacterial community within the reactor. Theevolution observed within the HE reactor was thus mainlydue to evolution of the proportion of the bacteria alreadypresent.The proportions of each bacterial class and phylum are
shown in Figure 3B. Between the T0 and TF a major reduction(−16.9%) and augmentation (+15.7%) was observed in thebacterial classes Chlorof lexi and γ-Proteobacteria, respectively, inthe HE reactor (HE-AS-T0 vs HE-AS-TF in Figure 3B).The analysis of the variations within the bacterial genera
between the beginning and the end of the experiment showedmajor variation (>1%) of 10 bacterial genera in the HE reactor(Figure 4). The most noticeable examples of this phenomenon
were observed in the following: (i) the filamentous bacteria ofthe Koulethrix genus belonging to the Chlorof lexi class, whichare the most abundant bacteria in the sludge (Figure 3B),reduced by 17.1% and (ii) the floc-forming bacteria of thePseudomonas genus belonging to the γ-Proteobacteria (Figure3B) increased by 9.7%. In contrast, the variations observed inthe UE reactor were lower (Figure 3B, Figure 4).Although the main evolution of the bacterial community was
due to a shift in the bacterial balance of main taxa alreadypresent, the in-depth analysis using pyrosequencing revealedthe introduction of some new bacterial taxa by the HE into thesludge of the reactor. The analysis of all operational taxonomicunits (OTUs) which were not initially detected in the HEreactor at the beginning of the experiment, but which weredetected in the HE itself and in the HE reactor at the end of theexperiment (Table 1), showed that the HE specificallyintroduced 24 OTUs in the sludge of the HE reactor. Amongthese OTUs, 5 and 6 respectively belonged to the Acinetobacter
and Pseudomonas genera. A large increase (+7.3%) ofPseudomonas proportion in the total bacterial community wasobserved between T0 and TF. For the UE reactor, the sameanalysis revealed that only 5 genera were introduced by the UE(Af ipia, Ochrobactrum, Paracoccus, Pseudomonas, Shinella).Moreover their proportion in the bacterial community at theend of the experiment did not exceed 0.1% (data not shown).
Class 1 Resistant Integron (RI) Evolution. Class 1 RIsrelative abundances were assessed as an indicator of antibioticresistance of the sludge bacterial communities. The relativeabundance of class 1 RIs in the HE was higher than that in theUE (0.230 (±0.120) vs 0.030 (±0.028) of class 1 RIs perestimated bacterial cell). HE feeding resulted in an increase ofclass 1 RIs relative abundance in the sludge during the firstweeks of the experiment (Figure 5).
By comparison with the UE reactor, the relative abundanceof class 1 RIs in the HE reactor increased up to 3.5-fold by thethird week of the experiment (T3), the time when the bacterialcommunity was the most divergent from its initial state (Figure3A). Then the relative abundance decreased from 0.62 ± 0.04to 0.42 ± 0.003 class 1 RIs per estimated bacterial cell until thefifth week (T5), i.e. the time corresponding to the equilibriumof the bacterial community. Nevertheless, the relativeabundance of class 1 RIs was still significantly different at TF.In the UE reactor the initial relative abundance of 0.11 ± 0.01of class 1 RIs per estimated bacterial cell did not vary althoughthe UE influent relative abundance was lower (0.030 (±0.028)of class 1 RI per estimated bacterial cell).
Figure 4. Major positive or negative variations (in excess of 1%) of theproportion of bacterial genus in (A) the HE reactor and (B) the UEreactor between the beginning and the end of the experiment. *corresponds to genus found also in the effluents used for the feed ofthe reactors.
Table 1. Proportion (in %) of OTU, Defined for a 3%Sequence Identity Cutoff, and Their Affiliated Genus,Introduced by HE into the Activated Sludge
affiliated genusnumber ofOTU
proportion inHE
proportion in HEreactor at TF
Achromobacter 1 0.2 0.1
Acinetobacter 5 4.8 0.8
Agrobacterium 1 0.3 0.1
Comamonas 3 10.8 0.3
Diaphorobacter 1 0.4 0.1
Flavobacterium 2 0.1 0.7
Ochrobactrum 1 1.4 0.1
Phenylobacterium 1 0.2 0.1
Pseudomonas 6 3.1 7.3
Shinella 1 0.4 0.4
Sphingobacterium 1 1.6 0.1
Stenotrophomonas 1 0.8 0.1
Figure 5. Evolution of the relative abundance of class 1 RIs over timein the HE (◆) and UE (◊) reactors.
Environmental Science & Technology Article
dx.doi.org/10.1021/es4008646 | Environ. Sci. Technol. 2013, 47, 7909−79177913
158
■ DISCUSSION
HEs are characterized by high concentrations of surfactants,pharmaceuticals, potentially hazardous bacteria, and ARD.39
Thereby, they can influence biological wastewater treatment interms of (i) overall activity, (ii) floc structure, (iii) bacterialdiversity, and (iv) ARD dissemination. In order to obtain anaccurate characterization of this influence, a multiscaleapproach, coupling different types on analysis, was carried outduring the monitoring of two identical lab-scale CAS reactorstreating HE and UE.Previous studies have reported the stability of performance of
biological processes fed with synthetic mixtures of antibiotics orreal HE.40,41 In accordance with their observations, the initialCAS ecosystem studied here was quickly able to adapt itsactivity to the specific makeup of HE in terms of suspendedsolids and organic matter content. However, a more in-depthinvestigation uncovered impacts of the HE on the organiccontent of sludge and on the soluble COD content of thetreated effluent.HE Induced Floc Erosion. Acclimatization of the active
biomass, probably occurring either at the floc structure level(i.e., defloculation) or at the bacterial community level, couldexplain these observations. Similar amplified effects have beenmentioned by other authors who observed floc disintegrationand bacterial lyses after application of high concentrations of asingle antibiotic in batch condition.29,42−44 This suggests thatthe HE did not induce any acute toxicity on the biomass butaltered the physical structure of flocs.It has been shown that some surfactants and pharmaceuticals
found in HE result in a decrease in the mean surface of sludgeflocs.43,45,46 In our study, assessment of the proportion offilaments indicated either a filamentous bulking phenomenaalso described elsewhere47 or a floc erosion/disruption leadingto the release of core filaments. In our study, the analysis ofbacterial diversity by pyrosequencing did not support thefilamentous bulking hypothesis, as it revealed a significantreduction in the proportion of filamentous bacteria belongingto the Chlorof lexi class, represented mainly by Kouleothrix spp.,the most abundant bacterial genus in the sludge. Chlorof lexi arewidely distributed in activated sludge and are chiefly located inthe core of flocs, probably explaining their involvement in thestabilization of the floc backbone.48,49 All our observationstended to show that HE leads to the erosion of sludge flocs,resulting in an increase in floc fragments, exposure of ‘corefilaments’, and the degradation of the organic load of thetreated effluent.HE Promoted Excretion of EPS. Toxic compounds, at
nonlethal concentrations, induce reactions in the flocs,biochemically characterized by production of EPS.50,51 SuchEPS excretion has been observed during exposure of flocs tocyclophosphamide.52 In our survey, such molecules were foundin the HE but were not detected in the UE. Indeed, averageconcentrations of the cytotoxic agents cyclophosphamide andifosfamide were, respectively, 290 ± 159 ng·L−1 and 265 ± 271ng·L−1, for the anesthetic lidocaine, 537 ± 560 ng·L−1, and forthe antibacterials ciprofloxacin and sulfamethoxazole averageconcentrations of 455 ± 172 ng·L−1 and 280 ± 70 ng·L−1,respectively, were quantified (Table S2). Denser floc matrices,observed by autofluorescence coupled with bacterial staining inthe HE feed, suggested that during HE treatment EPS contentof the flocs increased. It seems reasonable to infer that HEpromoted EPS production by the biomass. This hypothesis is
supported also by the observed increase in the proportion ofimportant floc-forming bacteria in the HE reactor: Flavobacteriaspp. and Pseudomonas spp. (Figure 4), which are known to formbiofilms under stress- or in wastewater-conditions.12,53
HE Modified Bacterial Community. While clear morpho-logical shifts of flocs were observed in sludge fed with HE, thediversity of the initial bacterial communities in the sludge wasnot strongly impacted. Nevertheless, a bacterial balance shiftwas observed in the HE reactor before the morphological shiftof the flocs. Indeed this fast adaptive response of the bacterialcommunity, probably due to its flexibility, explained theconsistent performance of the purification process throughoutthe experiment. Other studies reported that the adaptation ofthe bacterial community is more likely related to the flexibilityof the population than its diversity.54,55 Specifically forpharmaceutical wastewaters, Lapara et al. (2002) 56 showedthat the flexibility of the initial bacterial community, in responseto influent variations allowed for consistent process perform-ances. Another study31 using synthetic wastewater spiked withpharmaceuticals at concentrations above 50 μg·L−1 described aminor but consistent structural divergence of the bacterialcommunity in a lab scale CAS reactor and also a reduction ofthe bacterial diversity, while other reactor parameters, such asthe nitrification rate, were not affected. In our study, the use ofreal HE tended to exhibit a similar evolution of the bacterialcommunity, except that reduction in bacterial diversity was notobserved.
HE Induced Increase of Class 1 RI. The occurrence ofARD in HE is considered as an efficient way of spreadingantibiotic resistance in WWTPs.57,58 Previous studies based oncultivable approaches pointed out the occurrence of somehazardous bacteria, including antibiotic resistant strains(Escherichia coli, Pseudomonas aeruginosa, and Salmonella spp.)in WWTPs treating HE.21,57−59 The objectives of our study wasto obtain a global assessment of the antibiotic resistancedissemination in a WWTP operating HE. We thus focused on aculture-independent method using the relative abundance ofclass 1 RIs as a genetic marker of ARD. We showed that HEfeeding increased the relative abundance of class 1 RIs in thebacterial population of the sludge, thus leading to an increasedpotential for ARD dissemination. The coevolution of therelative abundance of class 1 RIs and the bacterial communityin the HE reactor suggests that this behavior could be due tothe introduction or the in situ development of bacteria thatpossess these genetic elements, rather than horizontal genetransfers. This hypothesis is strongly supported by theappearance within the sludge after HE feeding of Pseudomonasand Acinetobacter genera, which are known as important RIcarriers.60
Pseudomonas spp. are ubiquitous environmental bacteria.Their high adaptation capacities seem to be linked to theirgenome plasticity, which is composed of a multitude ofexogenic acquired DNA.61 Moreover, Pseudomonas spp. strainsare characterized by their capacity to form the following: (i)biofilms in medical infections, increasing their resistance toantibiotic treatment,62 and (ii) flocs in WWTP, leading to theirdevelopment in activated sludge ecosystems.63 This bacterialgenus is also known for its ability to metabolize a wide diversityof toxic compounds such as insecticides, antiseptics, herbicides,and surfactants and to be typically recovered from environ-ments exposed to disinfectant or antibiotic pressures.64 In thisstudy, the HE feeding led to a transient state of the bacterialcommunity before it reached its equilibrium. During this
Environmental Science & Technology Article
dx.doi.org/10.1021/es4008646 | Environ. Sci. Technol. 2013, 47, 7909−79177914
159

transient state ecological niches could have been created, andPseudomonas spp., probably more adapted to the conditionsshaped by the HE in the HE reactor, could have had a selectiveadvantage to grow in the bacterial community. This assumptionis supported by a survey64 which demonstrated, by anequivalent comparative metagenomic approach, that thecontamination of river sediments by quaternary ammoniumcompounds, substances typically found in HE, promoted theenrichment of bacterial communities in Pseudomonas spp.Stress conditions increase the diversity of genetic variants of
Pseudomonas spp., leading to their adaptation to changingconditions and to the emergence of antibiotic-resistantstrains.65 Moreover these types of bacteria have been shownto be both acceptors and donors of broad host range plasmidsin sludge.66,67 We conclude that the introduction ofPseudomonas strains originated from HE in sludge couldincrease the risk of antibiotic resistance dissemination inWWTP processing HE. Furthermore, stress conditions,including antibiotics, also induce the acquisition of antibioticresistance gene cassettes by RIs via the SOS response.68 HEoffer ideal conditions to promote genetic evolution in bacterialcommunities.Environmental Relevance of the Study. This work
showed that the specific treatment of medical care effluents didnot unduly disturb the activated sludge process, while it didhowever affect the floc structure, the production of the floc EPSmatrix, and the bacterial population balance. It did alsoultimately alter sedimentation and the treated water quality.On the other hand, HE increased the ARD in the sludge, via
class 1 RIs, and promoted the introduction and the develop-ment of Pseudomonas ssp. In order to deeper understand ARDintroduced by HE in sludge biomass, accurate characterizationof the resistome embedded by bacterial communities present inHE treatment should be considered in future studies.Indeed, more attention should be paid toward downstream
treatments and land-application of sludges produced byWWTPs treating HE effluents. The work by Burch et al.team70 on the removal of some ARD in the sludge treatmentprocesses highlights the importance of process technology andparameters choice (i.e., aerobic/anaerobic, temperature), whichin some cases could increase or decrease the proportion of class1 RI containing bacteria in treated sludge. Moreover, in thetreatment of HE, membrane bioreactors using ultrafiltrationmembranes have been reported to be efficient process optionsto avoid sedimentation problems of the biomass, to increase thetreated effluent quality, and specifically to remove class 1 RIfrom HE (www.pills-project.eu).
■ ASSOCIATED CONTENT
*S Supporting InformationA full description of the sampling sites, the main physico-chemicals methods and characteristics of the pharmaceuticalscompounds load within the effluents, and the CAS reactor usedas well as the methods used for the standard generation for real-time PCR, the pyrosequencing of the 16S rRNA encodinggenes and all supporting figures and tables provided in theSupporting Information. This material is available free of chargevia the Internet at http://pubs.acs.org.
■ AUTHOR INFORMATION
Corresponding Author*Phone: +33 555 423 697. E-mail: [email protected] author address: EA4330 GRESE, ENSIL-Ester
Technopole 16 rue Atlantis 87068 Limoges Cedex, France(C.D.). Phone: +33 555 056 727. E-mail: [email protected]. Corresponding author address: Inserm U1092,Faculte de medecine 2, rue du Docteur Marcland 87065Limoges Cedex, France (M.-C.P.).
Notes
The authors declare no competing financial interest.
■ ACKNOWLEDGMENTS
This work was supported by the regional council of Limousin,the EU Cost Action TD0803: Detecting Evolutionary Hotspotsof Antibiotic Resistances in Europe (DARE), and by theEuropean INTERREG program funded PILLS project. Theauthors wish to thank Moyra McNaughtan and Joanne Robertsof Glasgow Caledonian University for the pharmaceuticalanalysis as well as Philippe Chazal and Mark Boyle for theircritical review of the paper.
■ REFERENCES
(1) Emmanuel, E.; Perrodin, Y.; Keck, G.; Blanchard, J.-M.;Vermande, P. Ecotoxicological risk assessment of hospital wastewater:a proposed framework for raw effluents discharging into urban sewernetwork. J. Hazard. Mater. 2005, 117, 1−11.(2) Boillot, C.; Bazin, C.; Tissot-Guerraz, F.; Droguet, J.; Perraud,M.; Cetre, J. C.; Trepo, D.; Perrodin, Y. Daily physicochemical,microbiological and ecotoxicological fluctuations of a hospital effluentaccording to technical and care activities. Sci. Total Environ. 2008, 403,113−129.(3) Escher, B. I.; Baumgartner, R.; Koller, M.; Treyer, K.; Lienert, J.;McArdell, C. S. Environmental toxicology and risk assessment ofpharmaceuticals from hospital wastewater. Water Res. 2011, 45, 75−92.(4) Jean, J.; Perrodin, Y.; Pivot, C.; Trepo, D.; Perraud, M.; Droguet,J.; Tissot-Guerraz, F.; Locher, F. Identification and prioritization ofbioaccumulable pharmaceutical substances discharged in hospitaleffluents. J. Environ. Manage. 2012, 103, 113−121.(5) Davies, J. Microbes have the last word. A drastic re-evaluation ofantimicrobial treatment is needed to overcome the threat of antibiotic-resistant bacteria. EMBO Rep. 2007, 8, 616−621.(6) Kummerer, K. Antibiotics in the aquatic environment–a review–part I. Chemosphere 2009, 75, 417−434.(7) Verlicchi, P.; Galletti, A.; Petrovic, M.; Barcelo, D. Micro-Pollutants in Hospital Effluent: Their Fate, Risk and TreatmentOptions. In Emerging Organic Contaminants and Human Health;Barcelo , D., Ed.; The Handbook of Environmental Chemistry;Springer: Berlin, Heidelberg, 2012; pp 139−171.(8) Verlicchi, P.; Al Aukidy, M.; Galletti, A.; Petrovic, M.; Barcelo, D.Hospital effluent: Investigation of the concentrations and distributionof pharmaceuticals and environmental risk assessment. Sci. TotalEnviron. 2012, 430, 109−118.(9) Rizzo, L.; Manaia, C.; Merlin, C.; Schwartz, T.; Dagot, C.; Ploy,M. C.; Michael, I.; Fatta-Kassinos, D. Urban wastewater treatmentplants as hotspots for antibiotic resistant bacteria and genes spreadinto the environment: A review. Sci. Total Environ. 2013, 447C, 345−360.(10) Rodríguez-Rojas, A.; Rodríguez-Beltran, J.; Couce, A.; Blazquez,J. Antibiotics and antibiotic resistance: A bitter fight against evolution.Int. J. Med. Microbiol. 2013, In press.(11) Gullberg, E.; Cao, S.; Berg, O. G.; Ilback, C.; Sandegren, L.;Hughes, D.; Andersson, D. I. Selection of resistant bacteria at very lowantibiotic concentrations. PLoS Pathog. 2011, 7, e1002158.(12) Bruchmann, J.; Kirchen, S.; Schwartz, T. Sub-inhibitoryconcentrations of antibiotics and wastewater influencing biofilmformation and gene expression of multi-resistant Pseudomonasaeruginosa wastewater isolates. Environ. Sci. Pollut. Res. Int. 2013, 20,3539−3549.
Environmental Science & Technology Article
dx.doi.org/10.1021/es4008646 | Environ. Sci. Technol. 2013, 47, 7909−79177915
160

(13) Schwartz, T.; Kohnen, W.; Jansen, B.; Obst, U. Detection ofantibiotic-resistant bacteria and their resistance genes in wastewater,surface water, and drinking water biofilms. FEMS Microbiol. Ecol. 2003,43, 325−335.(14) Schwartz, T.; Volkmann, H.; Kirchen, S.; Kohnen, W.; Schon-Holz, K.; Jansen, B.; Obst, U. Real-time PCR detection of Pseudomonasaeruginosa in clinical and municipal wastewater and genotyping of theciprofloxacin-resistant isolates. FEMS Microbiol. Ecol. 2006, 57, 158−167.(15) Servais, P.; Passerat, J. Antimicrobial resistance of fecal bacteriain waters of the Seine river watershed (France). Sci. Total Environ.2009, 408, 365−372.(16) Galvin, S.; Boyle, F.; Hickey, P.; Vellinga, A.; Morris, D.;Cormican, M. Enumeration and characterization of antimicrobial-resistant Escherichia coli bacteria in effluent from municipal, hospital,and secondary treatment facility sources. Appl. Environ. Microbiol.2010, 76, 4772−4779.(17) Czekalski, N.; Berthold, T.; Caucci, S.; Egli, A.; Burgmann, H.Increased levels of multiresistant bacteria and resistance genes afterwastewater treatment and their dissemination into Lake Geneva,Switzerland. Front. Microbiol. 2012, 3, 106.(18) Picao, R. C.; Cardoso, J. P.; Campana, E. H.; Nicoletti, A. G.;Petrolini, F. V. B.; Assis, D. M.; Juliano, L.; Gales, A. C. The route ofantimicrobial resistance from the hospital effluent to the environment:focus on the occurrence of KPC-producing Aeromonas spp. andEnterobacteriaceae in sewage. Diagn. Microbiol. Infect. Dis. 2013, 76,80−85.(19) Varela, A. R.; Ferro, G.; Vredenburg, J.; Yanık, M.; Vieira, L.;Rizzo, L.; Lameiras, C.; Manaia, C. M. Vancomycin resistantEnterococci: From the hospital effluent to the urban wastewatertreatment plant. Sci. Total Environ. 2013, 450−451, 155−161.(20) Borjesson, S.; Dienues, O.; Jarnheimer, P.-A.; Olsen, B.;Matussek, A.; Lindgren, P.-E. Quantification of genes encodingresistance to aminoglycosides, beta-lactams and tetracyclines inwastewater environments by real-time PCR. Int. J. Environ. HealthRes. 2009, 19, 219−230.(21) Oberle, K.; Capdeville, M.-J.; Berthe, T.; Budzinski, H.; Petit, F.Evidence for a complex relationship between antibiotics and antibiotic-resistant Escherichia coli: from medical center patients to a receivingenvironment. Environ. Sci. Technol. 2012, 46, 1859−1868.(22) Stokes, H. W.; Hall, R. M. A novel family of potentially mobileDNA elements encoding site-specific gene-integration functions:integrons. Mol. Microbiol. 1989, 3, 1669−1683.(23) Stalder, T.; Barraud, O.; Casellas, M.; Dagot, C.; Ploy, M. C.Integron involvement in environmental spread of antibiotic resistance.Front. Microbiol. 2012, 3, 119.(24) Cambray, G.; Guerout, A. M.; Mazel, D. Integrons. Annu. Rev.Genet. 2010, 44, 141−166.(25) Guo, X.; Xia, R.; Han, N.; Xu, H. Genetic diversity analyses ofclass 1 integrons and their associated antimicrobial resistance genes inEnterobacteriaceae strains recovered from aquatic habitats in China.Lett. Appl. Microbiol. 2011, 52, 667−675.(26) Ma, Y.; Wilson, C. A.; Novak, J. T.; Riffat, R.; Aynur, S.; Murthy,S.; Pruden, A. Effect of various sludge digestion conditions onsulfonamide, macrolide, and tetracycline resistance genes and class Iintegrons. Environ. Sci. Technol. 2011, 45, 7855−7861.(27) Lienert, J.; Koller, M.; Konrad, J.; McArdell, C. S.; Schuwirth, N.Multiple-criteria decision analysis reveals high stakeholder preferenceto remove pharmaceuticals from hospital wastewater. Environ. Sci.Technol. 2011, 45, 3848−3857.(28) Bhatia, D.; Bourven, I.; Simon, S.; Bordas, F.; van Hullebusch, E.D.; Rossano, S.; Lens, P. N. L.; Guibaud, G. Fluorescence detection todetermine proteins and humic-like substances fingerprints ofexopolymeric substances (EPS) from biological sludges performedby size exclusion chromatography (SEC). Bioresour. Technol. 2013,131, 159−165.(29) Louvet, J.-N.; Heluin, Y.; Attik, G.; Dumas, D.; Potier, O.; Pons,M.-N. Assessment of erythromycin toxicity on activated sludge via
batch experiments and microscopic techniques (epifluorescence andCLSM). Process Biochem. 2010, 45, 1787−1794.(30) Shi, Y.-J.; Wang, X.-H.; Qi, Z.; Diao, M.-H.; Gao, M.-M.; Xing,S.-F.; Wang, S.-G.; Zhao, X.-C. Sorption and biodegradation oftetracycline by nitrifying granules and the toxicity of tetracycline ongranules. J. Hazard. Mater. 2011, 191, 103−109.(31) Kraigher, B.; Kosjek, T.; Heath, E.; Kompare, B.; Mandic-Mulec,I. Influence of pharmaceutical residues on the structure of activatedsludge bacterial communities in wastewater treatment bioreactors.Water Res. 2008, 42, 4578−4588.(32) Da Motta, M.; Pons, M.-N.; Roche, N. Monitoring filamentousbulking in activated sludge systems fed by synthetic or municipalwastewater. Bioprocess Biosyst. Eng. 2003, 25, 387−393.(33) Lopez, C.; Pons, M. N.; Morgenroth, E. Evaluation ofmicroscopic techniques (epifluorescence microscopy, CLSM, TPE-LSM) as a basis for the quantitative image analysis of activated sludge.Water Res. 2005, 39, 456−468.(34) Laurent, J.; Jaziri, K.; Guignard, R.; Casellas, M.; Dagot, C.Comprehensive insight of the performances of excess sludge reductionby 90 °C thermal treatment coupled with activated sludge at pilotscale: COD and N removal, bacterial populations, fate of heavy metals.Process Biochem. 2011, 46, 1808−1816.(35) Muyzer, G.; de Waal, E. C.; Uitterlinden, A. G. Profiling ofcomplex microbial populations by denaturing gradient gel electro-phoresis analysis of polymerase chain reaction-amplified genes codingfor 16S rRNA. Appl. Environ. Microbiol. 1993, 59, 695−700.(36) Barraud, O.; Baclet, M. C.; Denis, F.; Ploy, M. C. Quantitativemultiplex real-time PCR for detecting class 1, 2 and 3 integrons. J.Antimicrob. Chemother. 2010, 65, 1642−1645.(37) Park, J. W.; Crowley, D. E. Dynamic changes in nahAc genecopy numbers during degradation of naphthalene in PAH-contami-nated soils. Appl. Microbiol. Biotechnol. 2006, 72, 1322−1329.(38) Klappenbach, J. A.; Saxman, P. R.; Cole, J. R.; Schmidt, T. M.rrndb: the ribosomal RNA operon copy number database. NucleicAcids Res. 2001, 29, 181−184.(39) Kummerer, K. Drugs, diagnostic agents and disinfectants inwastewater and water–a review. Schriftenr. Ver. Wasser-, Boden- Lufthyg.2000, 105, 59−71.(40) Al-Ahmad, A.; Haiss, A.; Unger, J.; Brunswick-Tietze, A.;Wiethan, J.; Kummerer, K. Effects of a realistic mixture of antibioticson resistant and nonresistant sewage sludge bacteria in laboratory-scaletreatment plants. Arch. Environ. Contam. Toxicol. 2009, 57, 264−273.(41) Kovalova, L.; Siegrist, H.; Singer, H.; Wittmer, A.; McArdell, C.S. Hospital wastewater treatment by membrane bioreactor: perform-ance and efficiency for organic micropollutant elimination. Environ. Sci.Technol. 2012, 46, 1536−1545.(42) Alighardashi, A.; Pandolfi, D.; Potier, O.; Pons, M. N. Acutesensitivity of activated sludge bacteria to erythromycin. J. Hazard.Mater. 2009, 172, 685−692.(43) Louvet, J. N.; Giammarino, C.; Potier, O.; Pons, M. N. Adverseeffects of erythromycin on the structure and chemistry of activatedsludge. Environ. Pollut. 2010, 158, 688−693.(44) Louvet, J.-N.; Attik, G.; Dumas, D.; Potier, O.; Pons, M.-N.Simultaneous Gram and viability staining on activated sludge exposedto erythromycin: 3D CLSM time-lapse imaging of bacterialdisintegration. Int. J. Hyg. Environ. Health 2011, 214, 470−477.(45) Liwarska-Bizukojc, E.; Bizukojc, M. Effect of selected anionicsurfactants on activated sludge flocs. Enzyme Microb. Technol. 2006, 39,660−668.(46) Liwarska-Bizukojc, E.; Bizukojc, M. The influence of theselected nonionic surfactants on the activated sludge morphology andkinetics of the organic matter removal in the flow system. EnzymeMicrob. Technol. 2007, 41, 26−34.(47) Martins, A. M. P.; Pagilla, K.; Heijnen, J. J.; van Loosdrecht, M.C. M. Filamentous bulking sludge–a critical review. Water Res. 2004,38, 793−817.(48) Bjornsson, L.; Hugenholtz, P.; Tyson, G. W.; Blackall, L. L.Filamentous Chlorof lexi (green non-sulfur bacteria) are abundant in
Environmental Science & Technology Article
dx.doi.org/10.1021/es4008646 | Environ. Sci. Technol. 2013, 47, 7909−79177916
161

wastewater treatment processes with biological nutrient removal.Microbiology 2002, 148, 2309−2318.(49) Kragelund, C.; Levantesi, C.; Borger, A.; Thelen, K.; Eikelboom,D.; Tandoi, V.; Kong, Y.; van der Waarde, J.; Krooneman, J.; Rossetti,S.; Thomsen, T. R.; Nielsen, P. H. Identity, abundance andecophysiology of filamentous Chlorof lexi species present in activatedsludge treatment plants. FEMS Microbiol. Ecol. 2007, 59, 671−682.(50) Aquino, S. F.; Stuckey, D. C. Soluble microbial productsformation in anaerobic chemostats in the presence of toxiccompounds. Water Res. 2004, 38, 255−266.(51) Henriques, I. D. S.; Love, N. G. The role of extracellularpolymeric substances in the toxicity response of activated sludgebacteria to chemical toxins. Water Res. 2007, 41, 4177−4185.(52) Avella, A. C.; Delgado, L. F.; Gorner, T.; Albasi, C.; Galmiche,M.; de Donato, P. Effect of cytostatic drug presence on extracellularpolymeric substances formation in municipal wastewater treated bymembrane bioreactor. Bioresour. Technol. 2010, 101, 518−526.(53) Gotoh, H.; Kasaraneni, N.; Devineni, N.; Dallo, S. F.; Weitao, T.SOS involvement in stress-inducible biofilm formation. Biofouling2010, 26, 603−611.(54) Deng, Y.; Zhang, Y.; Gao, Y.; Li, D.; Liu, R.; Liu, M.; Zhang, H.;Hu, B.; Yu, T.; Yang, M. Microbial community compositional analysisfor series reactors treating high level antibiotic wastewater. Environ. Sci.Technol. 2012, 46, 795−801.(55) Saikaly, P. E.; Oerther, D. B. Diversity of dominant bacterial taxain activated sludge promotes functional resistance following toxicshock loading. Microb. Ecol. 2011, 61, 557−567.(56) LaPara, T. M.; Nakatsu, C. H.; Pantea, L. M.; Alleman, J. E.Stability of the bacterial communities supported by a seven-stagebiological process treating pharmaceutical wastewater as revealed byPCR-DGGE. Water Res. 2002, 36, 638−646.(57) Tsai, C. T.; Lai, J. S.; Lin, S. T. Quantification of pathogenicmicro-organisms in the sludge from treated hospital wastewater. J.Appl. Microbiol. 1998, 85, 171−176.(58) Chitnis, V.; Chitnis, S.; Vaidya, K.; Ravikant, S.; Patil, S.;Chitnis, D. S. Bacterial population changes in hospital effluenttreatment plant in central India. Water Res. 2004, 38, 441−447.(59) Prado, T.; Pereira, W. C.; Silva, D. M.; Seki, L. M.; Carvalho, A.P. D.; Asensi, M. D. Detection of extended-spectrum beta-lactamase-producing Klebsiella pneumoniae in effluents and sludge of a hospitalsewage treatment plant. Lett. Appl. Microbiol. 2008, 46, 136−141.(60) Peymani, A.; Farajnia, S.; Nahaei, M. R.; Sohrabi, N.; Abbasi, L.;Ansarin, K.; Azhari, F. Prevalence of class 1 integron among multidrug-resistant Acinetobacter baumannii in Tabriz, northwest of Iran. Pol. J.Microbiol. 2012, 61, 57−60.(61) Mathee, K.; Narasimhan, G.; Valdes, C.; Qiu, X.; Matewish, J.M.; Koehrsen, M.; Rokas, A.; Yandava, C. N.; Engels, R.; Zeng, E.;Olavarietta, R.; Doud, M.; Smith, R. S.; Montgomery, P.; White, J. R.;Godfrey, P. A.; Kodira, C.; Birren, B.; Galagan, J. E.; Lory, S. Dynamicsof Pseudomonas aeruginosa genome evolution. Proc. Natl. Acad. Sci.U.S.A. 2008, 105, 3100−3105.(62) Costerton, J. W.; Stewart, P. S.; Greenberg, E. P. Bacterialbiofilms: a common cause of persistent infections. Science 1999, 284,1318−1322.(63) Bitton, G. Wastewater microbiology; 3rd ed.; Wiley-Liss JohnWiley & Sons: Hoboken, NJ, 2005.(64) Oh, S.; Tandukar, M.; Pavlostathis, S. G.; Chain, P. S. G.;Konstantinidis, K. T. Microbial community adaptation to quaternaryammonium biocides as revealed by metagenomics. Environ. Microbiol.2013, DOI: doi: 10.1111/1462-2920.12154.(65) Boles, B. R.; Thoendel, M.; Singh, P. K. Self-generated diversityproduces “insurance effects” in biofilm communities. Proc. Natl. Acad.Sci. U.S.A. 2004, 101, 16630−16635.(66) Tsutsui, H.; Anami, Y.; Matsuda, M.; Inoue, D.; Sei, K.; Soda, S.;Ike, M. Transfer of plasmid pJP4 from Escherichia coli and Pseudomonasputida to bacteria in activated sludge developed under different sludgeretention times. J. Biosci. Bioeng. 2010, 110, 684−689.
(67) Soda, S.; Otsuki, H.; Inoue, D.; Tsutsui, H.; Sei, K.; Ike, M.Transfer of antibiotic multiresistant plasmid RP4 from Escherichia colito activated sludge bacteria. J. Biosci. Bioeng. 2008, 106, 292−296.(68) Guerin, E.; Cambray, G.; Sanchez-Alberola, N.; Campoy, S.;Erill, I.; Da Re, S.; Gonzalez-Zorn, B.; Barbe, J.; Ploy, M. C.; Mazel, D.The SOS response controls integron recombination. Science 2009, 324,1034.(69) Sheng, G.-P.; Yu, H.-Q. Characterization of extracellularpolymeric substances of aerobic and anaerobic sludge using three-dimensional excitation and emission matrix fluorescence spectroscopy.Water Res. 2006, 40, 1233−1239.(70) Burch, T. R.; Sadowsky, M. J.; LaPara, T. M.Aerobic digestionreduces the quantity of antibiotic resistance genes in residual municipalwastewater solids. Front Microbiol 2013, 4.
Environmental Science & Technology Article
dx.doi.org/10.1021/es4008646 | Environ. Sci. Technol. 2013, 47, 7909−79177917
162

Article 3 Chapter III
163
Comparaison du traite e t d’efflue ts hospitaliers par boue activée et réacteur membranaire : efficacité et impacts.
ALRHMOUN Mousaaba, CARRION Claire, CASELLAS Magali
a,
and DAGOT Christophe
1. Laboratory of GRESE EA 4330, university of Limoges 123 Avenue Albert Thomas, 87060 Limoges
2. UMR 7276 CNRS Joint microscopy Service -CIM, University of Limoges, Faculty of Medicine, F-87000 Limoges, France
Article soumis à Bioresource Technology journal (2015)
Da s le ad e de l’a lio atio des p o d s de t aitement
d’efflue ts hospitalie s, et a ti le p opose la o pa aiso d’u système de traitement biologique membranaire (BAM) avec un
système à boue activée traditionnel (BA) pou le t aite e t d’u effluent hospitalier.
Le fonctionnement de 2 pilotes (BA et BAM) a été suivi pendant 60
jours et leurs performances ont été comparées, avec un suivi de
l’ volutio de la ualit io hi i ue des flo s pa i os opie confocale avec marquage fluorescent. La spectrométrie de
fluorescence 3D a été introduite comme technique susceptible de
permettre le suivi de la qualité des influent et des effluent au cours
du temps.
Les deux systèmes de traitement aboutissent à des performances
épuratoires équivalentes sur les paramètres classiques de pollution,
le BAM ayant cependant des capacités à la rétention des MES
supérieures (96,1% contre 89,1%). Un panel de substances
pharmaceutiques a été mesuré en amont et en aval des deux
procédés. Les résultats, comparés à ceux de la littérature, dans des
conditions de gestion du procédé pouvant cependant être différente,
montrent, de manière générale, de meilleures performances pour le
BAM que pour le BA. Comme cela est retrouvé dans la littérature,
certaines molécules ne sont éliminées de manière très partielle par
l’u et l’aut e des procédés. Par exemple, le paracétamol, le
kétoprofène, l'ibuprofène, la caféine, le métronidazole, le
bézafibrate, le fénofibrate, la pravastatine, le ramipril, le propanolol,
l'aténolol, le sotalol, la carbamazépine, le losartan, l'oxazépam et
isosfamide sont modérément éliminés par BAM, mais leur
élimination par le BA était beaucoup plus faible. Aucune élimination a
été réalisée pour la roxithromycine et reste faible pour le
triméthoprime (31,4%) et le sulfaméthoxazole (50%).
Le ode d’ li i atio des composés pharmaceutiques pouvant être
lié à deux modes principaux, la biodégradation et/ou la sorption, les
constantes biologiques Kbio et de sorption ont été mis en parallèle
des tau d’ li i atio da s les 2 t pes de a teu s, pouva t pe ett e d’ava e des h poth ses ua t à la p do i a e d’u

Article 3 Chapter III
164
des mécanismes dans le procédé (comme pour le sulfametoxasol par
exemple)
Le suivi de l’ volutio des EPS, pa a al se io hi i ue, pa microscopie confocale et par spectrométrie de fluorescence, a,
montrée que les effluents hospitaliers modifiaient la structure et la
composition des flocs. Le BAM favoriserait une production de EPS (et
notamment des protéines) plus importante que le BA, pouvant être
liée à un âge des boues plus important. Cela à des conséquences sur
le colmatage des membranes.

Article 3 Chapter III
165
Performances and effects on the EPS of submerged membrane bioreactor (MBR)
compared to conventional activated sludge treatment for hospital effluent treatment
Mousaab Alrhmouna. 1 Claire, Carrionb, Magali Casellasa, Christophe Dagot a
a GRESE EA 4330, university of Limoges 123 Avenue Albert Thomas, 87060 Limoges
b UMR 7276 CNRS Joint microscopy Service -CIM, University of Limoges, Faculty of Medicine, F-87000 Limoges, France
Abstract
Performance of a submerged membrane bioreactor (MBR) and conventional activated sludge
(CAS) for the treatment of hospital wastewater was investigated. Two pilot-scales were
designed and operated for more than 60 days. Lab scale experiments were conducted and
microscopic techniques used to monitor and characterize the extracellular polymeric
substances of sludge (EPS) as an indicator of biochemical modification of bacterial
community under stress. The removal of the organics compounds by MBR was more effective
than with the CAS. After 15 days of exposure to the hospital effluent, a significant increase
of soluble EPS concentration in MBR was detected, certainly due to the occurrence of
pharmaceuticals or to more or less toxic molecules in the effluent. Paracetamol, ketoprofen,
ibuprofen, caffeine, metronidazole, bezafibrate, fenofibrate, pravastatin, ramipril, propanolol,
atenolol, sotalol, carbamazepine, losartan, oxazepam and isosfamide were moderately
removed by MBR, while their removal by CAS was much lower. The monitoring of EPS
concentrations, estimated by biochemical analysis, confocal microscopy and fluorescence
spectrometry, showed the impact of the process on production the EPS.
Key words: Membrane bioreactor, EPS, Pharmaceuticals, Conventional activated sludge
1. Introduction
In recent years, increasing attention has been carried out to the presence of emerging
pollutants in wastewater, in surface water and in groundwater (Daughton and Ternes, 1999;
Heberer, 2002; Barceló, 2003; Daughton, 2004; Petrovic et al., 2009). These pollutants
include surfactants, pharmaceuticals and personal care products (PPCPs), endocrine
disruptors, illicit drugs, gasoline additives and many other groups of compounds. In most

Article 3 Chapter III
166
cases, there are not yet all listed in the water quality regulations but may be candidates in the
future, at least under surveillance list, depending on research on their potential health and/or
environmental effects and the results of monitoring of their occurrence.
At the urban scale, effluents discharged by hospitals represent about 20% of the total
organic PPCPs load found in the urban sewer (Carballa et al., 2004) and are considered as an
important local source of these compounds: a great variety of micro-contaminants resulting
from diagnostic, laboratory and research activities on one side and medicine excretion by
patients on the other. (Kummerer, 2001; Petrovic et al., 2003; Carballa et al., 2004; Onesios et
al., 2009).
Some researches studied on the on-site treatment of hospital effluent before the release into
the sewage network (Gautam et al., 2007; Lenz et al., 2007; Pauwels and Verstraete, 2006;
Interreg PILLS project, 2013). Recently studies have assessed the risk of hospital effluent on
an ecotoxicological point of view. But if they concluded that the dilution in urban sewage
reduced the acute toxicity of the total effluent, the real effects of emerging pollutants
accumulation on environment are controverted (Jean et al., 2012).
The conventional activated sludge CAS is currently the principal barrier currently used to
decrease the release of harmful contaminants into the environment and to slow down the risk
induced by pharmaceutical residues, if the treatment facilities and waste disposal in
wastewater treatment plants (WWTPs) are designed, operated and managed properly (Ghosh
et al., 2009, Choubert et al., 2009). Further understanding of the effectiveness of conventional
WWTPs and new wastewater treatment technologies for removing pharmaceutical residues
will play an important role in addressing these issues (Ghosh et al., 2009). We consider that
about 50 % of the PPCPs load could be retain a conventional biological WWTP but
depending of a lot of parameters, like molecule properties, type of water process and
treatment management (Martin, 2012). The main mechanisms responsible for the
pharmaceutical compounds removal from water are sludge sorption, biodegradation by
microorganisms and, in the MBR system, retention by the membrane (José et al., 2010).
Consequently, variable discharged quantities of pharmaceuticals can reach surface and ground
waters (Farre´et al., 2001). (Carballa et al., 2004) indicated that although during the primary
treatment process, pharmaceuticals compounds were not removed efficiently (ranged from 20
to 50%), the aerobic activated sludge process caused a significant reduction in all compounds
detected, between 30 and 75%, with exception for iopromide, which remained in the aqueous
phase. (Joss et al., 2005) did not observed an evident correlation between the chemical
structure of compound and biological removal efficiency, which varied strongly from

Article 3 Chapter III
167
compound to compound because of the mechanism of elimination from the aqueous phase
(Barrat et al., 2010).
Processes with membrane, such membrane bioreactors (MBR) or micro/ultra filtration as a
tertiary treatment, have been set up to improve the efficiency of PPCP removal. MBRs
usually operate at high sludge retention times and high concentrations of biomass, allowing an
intensification of biological processes by the implementation of resistant and low-growth
biomass (DeWever et al., 2007; Delgado et al., 2009). These conditions may increase the
elimination of contaminants with special characteristics like pharmaceuticals compounds,
such as low bio-degradability and low concentration (by co-metabolism phenomena),. (Clara
et al., 2005) found that diclofenac removal failed by size exclusion, but a partial removal
could be obtained by rising the sludge retention time. Ibuprofen on the other hand was
removed to a high degree (> 90%). In contrast to (Clara et al., 2005 a), a study by (Radjenovic
et al., 2007) indicated a better pharmaceutical removal with MBR compared to CAS for, as a
example, 87.4% compared to 50,1%, 58.7% compared to 0%, and 71,8% compared to 27,7%
for diclofenac, metoprolol and clofibric acid respectively.
Nevertheless, the main problem in membrane application is a rapid decline in the
permeation flux due to membrane fouling, which requires frequent membrane
cleaning/replacement, thus increasing the running costs (Judd et al., 2004). Many studies
indicate that the soluble EPS play a major role in fouling (Rosenberger et al., 2002;
Rosenberger et al., 2006). Some authors attributed primarily it to proteins, present in the
effluent or produce by the microorganisms (Hernandez et al., 2005; Meng et al., 2006), but a
larger number of recent publications indicates that soluble polysaccharide is also one of the
main molecules affecting MBR fouling (Le-Clech et al., 2006; Rosenberger et al., 2005;
Lesjean et al., 2005; Nataraj et al., 2008; Alrhmoun et al., 2015). This last point still needs
examination in the case of the presence of toxic compounds, especially on the understanding
of the sludge development and subsequent characteristics, because it is known that these
compounds could induce the production of EPS.
The aim of this paper is to compare the CAS and MBR performances in treating hospital
wastewater at pilot scale. In addition, this work investigated the effects of presence the toxics
agents on the EPS production.
2. Materials and Methods
2.1. Study area
The hospital effluent (HE) samples used in this study were collected from the sewerage
system of the clinical activities of the Limoges hospital (France). Average characteristics of

Article 3 Chapter III
168
wastewater and activated sludge (CAS) used as inoculums during the experiments are detailed
in table 1.
Table1 Physicochemical characteristics of the hospital effluents (HE) and activated sludge (AS).
COD (mg/L) N (mg/L)
TSS(g/L) TVS(g/L) Total Soluble Total Soluble
HE 412.5±5 173.5±5 128.9±4 95±4 0.199 0.091
AS 1201±5 285±5 - - 6.214 1.35
2.2. Reactors and operating conditions
Two lab-scale pilots have been used: a conventional activated sludge system (CAS) and a
membrane bioreactors (MBR), with, if possible, identical operating conditions (Table 2)
Table2 Key operational parameters of CAS and MBR systems investigated.
Parameter CAS MBR
HRT (h) 15,3 15-24
SRT (days) 15 15-20
Flow (m3/h) 0,0009 0,0018
Temperature (C°) 17-20 16-19
PH 7,0-8,0 7,0 - 8,0
Dissolved Oxygen (mg/L) 2,0-4,5 2,0 - 4,5
Aerobic tank (L) 14 30
2.2.1. Conventional activated sludge system (CAS)
The CAS (Fig.1. A) had a total volume of 14 L and was continuously fed with wastewater
collected each 7 days at the hospital. Wastewater was kept at 4°C in an agitated tank where it
was directly pumped to feed the pilot. Influent flow rate was 21.6 L.d-1
corresponding to a
hydraulic residence time of 15.3 h-1
in the aeration tank. Aeration was operated by repeated
aerobic/anoxic cycles (3h/3h) in order to ensure nitrification and denitrification. Air flow rate
was adjusted daily to maintain a dissolved oxygen concentration between 2 and 4 mg.L-1
in
the reactors during aerated phases and avoid oxidation limitation by oxygen concentration.
Solids residence time (SRT) was maintained at 15 days throughout the experiments: settled
sludge was wasted every two day accordingly considering sludge losses through the
discharged effluent. The experiment was conducted over a period of 60 days.

Article 3 Chapter III
169
A
A ir
TPH
S lu d g e re m o v a lH o s p ita l e fflu e n ts
B
Fig. 1. Shematic diagrams of CAS (A) and MBR (B) systems treatment.
2.2.2. Membrane bioreactor (MBR)
The Membrane bioreactor (polymem – Toulouse- France - Fig. 1. B) was constituted of a
30 l bioreactor and ultrafiltration-shaped hollow fibre membrane module immersed in the
bioreactor. Hollow fibres were made of polypropylene with a pore size of 0.05 m. Aeration
was done through diffusers at the bottom of the reactor to provide oxygen for biomass growth
as well as shear to reduce cake formation at membrane surface. Dissolved oxygen levels were
maintained between 2 and 4.5 mgO2/L. The membrane permeate was continuously removed
by a peristaltic pump under a constant flux (1.8 L/h), and the trans-membrane pressure (TMP)
constantly measured to monitor the extent of membrane fouling. The operation was stopped
when the TMP reached 26 kPa to maintain the flux at a constant value. The hydraulic
retention time (HRT) was ranged from 15 to 24 h, the temperature from 17 to 20°C and pH
from 7 to 8.
Article 3 Chapter III
170
2.3. Analytical methods
The physico-chemical characteristic of wastewaters and sludge were determined every two
days. The Chemical Oxygen Demand (COD) and Total Nitrogen (TN) were carried out on
both total and soluble fraction after samples filtration at 1.2µm. COD was measured by the
closed reflux colorimetric method (ISO 15705:2002), and TN was assessed using the alkaline
persulfate digestion with colorimetric method (Hach company) (HCT 191, ISO 15705 and
HACH DR/2000). Measurements of total and volatile suspended solids (TSS and VSS) were
done according to the normalized method (AFNOR, NF T 90-105).
2.4. Analysis of pharmaceuticals
Pharmaceuticals analyses in the wastewater samples were performed by IANESCO
laboratory (Poitiers, France). Water samples were enriched by liquid-solid phase (SPE) by
using Osis HLB cartridges (6ml, 200mg) from waters. The SPE extracts were injected in
liquid chromatography- mass spectrometry (LC-MS/MS) applying electrospray ionization
(ESI) under high-resolution MS conditions. Acquisition was performed in selected reaction
monitoring (SRM) mode and two transitions (quantification, confirmation) were obtained for
each compound. Quality control (QC) was assured by measuring two transitions for each
analyse and each internal standard, comparing retention time of analyse with the retention
time of the internal standard in each sample, duplicates, numerous blanks, and QC standards.
The global analytical error was ± 0.75µg/L.
2.5. Analysis of total protein, humic substances and polysaccharides
Protein content, expressed in mg equivalent of bovine serum albumin per gram of VSS for
the soluble polymer, was determined according to the method of Lowry et al. (1951) with a
correction for the humic-like substances. Humic-like substances were measured with the
Folin-Ciocalteau phenol reagent in the same trial as the protein by omitting the CuSO4.
Results were expressed in mg equivalent of humic acid per gram of VSS for the soluble
polymer. Polysaccharides were determined according to the method of Dubois et al. (1956)
and the results expressed in mg equivalent of glucose per gram of VSS for the soluble
polymer.
2.6. Confocal laser scanning microscopy
EPS was measured by confocal laser scanning microscopy and pictures was statically
analysed by Image J software according (Alrhmoun at al., 2014). PS and PN staining was
carried out according to the modified procedure of Chen et al., (2007). Bio samples were
centrifuged to remove supernatant, washed twice with 1× phosphate-buffered saline (PBS)
Article 3 Chapter III
171
buffer (pH 7.2) and kept fully hydrated in 2 mL centrifuge tubes covered with aluminium foil.
For PS staining, 100 L of concanavalin A conjugated with tetra -methylrhodamine (Con A,
250 mg L−1
, Molecular Probes, and Carlsbad, CA, USA) was first dropwise to the sample and
incubated for 30 min to stain α-mannopyranosyl and α glucopyranosyl sugar residues. For PN
staining, 100 L of sodium bicarbonate buffer (0.1 M) was introduced to the sample to
maintain the amine groups in non-protonated form. Subsequently, 100 L of fluorescein
isothiocyanate solution (FITC, 1 g L−1
, Fluka) was supplemented and incubated for 1 h to
bind to proteins. Samples were washed tow times with 1× PBS buffer after each staining stage
to remove loosely bound and excess dyes. Finally, sectioned granule or biofloc samples were
mounted onto microscopic glass slides for observation of the distribution of PS and PN by a
confocal laser scanning microscopy equipped with an Ar–He–Ne laser unit and three barrier
filters. The image acquisition settings, such as laser intensity, numerical aperture, gain and
offset settings were adjusted according to Toh et al., (2003) and the levels were kept constant
through observation.
SYTO® λ BacLightTM bacterial stains was used according to the manufacturer’s
instructions (Molecular Probes, Eugene, Oregon, USA). The kit provides a three-color
fluorescence assay of bacterial relying on membrane integrity: viable bacteria are stained by
SYTO® 9 and fluorescein green, while damaged bacteria are stained by propidium iodide and
fluoresce in red. Protocol established by (Lopez et al., 2005; Baker A et al., 2004) was
performed: 1 mL of undiluted biomass suspension was mixed with 3 L of a mixture of equal
parts of SYTO® 9 and propidium iodide. This short staining protocol allowed direct
observation of the original floc structure and the time-lapse microscopy. No centrifugation or
fixation steps were needed. Microscopic observations started 15 min after staining. Excitation
maxima for SYTO® 9 and propidium iodide bound to DNA are 480 and 540 nm, respectively
(Reynolds D M et al., 2002).
To capture the image series, a Leica TCS LSI-AOTF confocal microscope (Leica
Microsys- tems, Germany) equipped with 488 and 532 nm laser diode was used with an HCX
5×0.5. The bandwidth of the detected fluorescence wavelengths has been optimized to
uniquely channel the maximum emission in sequential mode to avoid potential cross-talking
(502–530 nm for SYTO® 9 and 600–630 nm for propidium iodide). Fluorescence emissions
were recorded within 1 Airy disk confocal pinhole opening and 1024 × 1024 images at a 1.36
µm (x,y) pixel size were obtained. Instead of selecting a constant step size in the vertical
direction, the step size was determined by choosing start and end points in the z-direction of

Article 3 Chapter III
172
the flocs, and by then selecting a number of optical sections. The resulting voxel depths for
the flocs analyzed ranged from 1 to 2 mm.
2.7. Spectroscopic analysis
Spectroscopic analysis was conducted by applying 1) ultraviolet (UV)-visible spectroscopy
(Pharma Spec 1700,Shimadzu Corp., Kyoto, Japan) measuring light absorbance between 200
and 600 nm using 1 cm-path quartz cuvettes; and 2) fluorescence spectroscopy using the
Shimadzu RF-5301 PC spectrofluorophotometer. Absorbance at 254 nm was used to monitor
dissolved COD (Miroslav et al., 1983). Fluorescence Excitation-Emission-Matrix (EEM)
spectra were collected with subsequent scanning emission spectra from 280 to 600 by varying
the excitation wavelength from 250 to 450 nm at 5 nm increments. The software Panorama
Fluorescence 2.1 was employed for handling EEM and Scilab (Digiteo Corp., France) was
used to plot the matrix. Synchronous fluorescence spectra were also collected with an off set
value equal to 20 nm. The tryptophan-like fluorescence at an excitation wavelength of 282 nm
and an emission wavelength of 332 nm made it feasible to monitor the fate of soluble organic
nitrogen (Sarraguça et al., 2009).
3. Results and Discussion
3.1. Comparison between MBR and CAS performances
The two laboratory-scales pilots (MBR and CAS) were run in parallel, fed with the
described hospital effluent (table 1) during 65 days. Results reported in table (3) showed that
the MBR was able to achieve very good organic removal efficiencies during the entire
working period. Their removal efficiencies based on TSS, VSS, total and soluble COD ranged
to 96.1 %, 87.9 % 86.9 % and 82.1 % respectively, whereas those with CAS were 89.1 %, 85
%, 77.4 % and 73.4 % respectively. As expected, the removal of solid compounds was more
efficient with membrane bioreactor (MBR) than with conventional activated sludge treatment
because the membrane act as a physical barrier.
Table 3
Organic pollutants removal efficiencies for CAS and MBR.
Efficiency of removal % TSS VSS T COD S COD TN SN
MBR 96,1 87,9 86,9 82,1 88,9 83,6
CAS 89,1 85 77,4 73,4 84,2 86,2
Article 3 Chapter III
173
3.2. Occurrence and removal of PPCPs
The total efficiency of removal from water for each pharmaceutical compound was
determined for both MBR and CAS according to Eq. (1):
Removal % = 100 × [(C1 - C2) / C1] (Eq. 1)
Where:
C1: concentration of a pharmaceutical compound in influent.
C2: concentration of a pharmaceutical compound in effluent.
Table 4 and Fig. 2A and B show the concentration of the studied phamaceuticals and the
removal (%) for both reactors MBR and CAS, respectively and compared to data founded in
scientific reviews, and represented by a vertical line between maximal and minimal removal
data founded. A large disparity between the literature results was noticed, depending
definitely of experimental set-up system or analysed processes. However, our results are in
coherence with these values. It can be observed highest removal efficiency (95± 5%) or a
complete removal for ketoprofen, paracetamol, ibuprofen caffeine, bezafibrate, fenofibrate,
pravastatin, ramipril, atenolol, isosfamide and lohexol in the MBR and paracetamol, caffeine,
fenofibrate, pravastatin, ramipril, isosfamide, estrone (E1) and estriol in the CAS.
Roxithromycin has the most complex chemical structure of the target compounds and acts as
an antibacterial agent. It has a moderate hydrophobic nature (log Kow=2.75) and a basic
character. It was sparsely eliminated from both types of processes. The treatment of naproxen
led to lower elimination rates of 48.28% in MBR and neither removal in CAS. It can be
partially explained by a more stable chemical structure of this molecule. Sulfamethoxazole,
possessing antibacterial properties, was eliminated by only 50% in the MBR and neither in
CAS where its concentration increased during the 50 days of treatment, certainly due to the
occurrence of conjugates in the effluent, which are partially hydrolysed.

Article 3 Chapter III
174
A (MBR)
0
10
20
30
40
50
60
70
80
90
100
Cod
eine
Ket
opro
fen
Parac
etam
ol
Dic
lofe
nac
Nap
roxe
n
Ibup
rofe
n
Tram
adol
Rox
ithro
myc
in
Sulfa
met
oxaz
ole
Met
roni
dazo
le
Trimet
hopr
im
Triclo
san
Hyd
roch
loro
thia
zide
Furos
emid
e
Caf
fiene
Bez
afib
rate
Fenof
ibra
te
Prava
stat
in
Ram
ipril
prop
anol
ol
Ate
nolo
l
Sotal
ol
Car
bam
azép
ine
Losar
tan
Oxa
zepa
m
Isos
fam
ide
Cyc
loph
osph
amid
e
Fen
ofib
ric A
cid
2-hy
drox
y-ib
upro
fen
4-hy
drox
y-di
clof
enac
Epoxy
-car
bam
azep
ine
Estro
ne (
E1)
Estrio
l
lom
epro
l
lopr
omid
e
Rem
ova
l ra
te,
%
B (CAS)
0
10
20
30
40
50
60
70
80
90
100
Code
ine
Ket
oprofe
n
Parac
etam
ol
Dic
lofe
nac
Nap
roxe
n
Ibup
rofe
n
Tram
adol
Roxi
thro
myc
in
Sulfa
met
oxaz
ole
Met
ronid
azol
e
Trimet
hoprim
Triclo
san
Hydr
ochlo
roth
iazi
de
Furose
mid
e
Caf
fiene
Bez
afib
rate
Fenof
ibra
te
Pravas
tatin
Ram
ipril
propan
olol
Ate
nolol
Sotal
ol
Car
bamaz
épin
e
Losar
tan
Oxaz
epam
Isosf
amid
e
Cycl
opho
spham
ide
Fen
ofib
ric A
cid
2-hydr
oxy-ib
upro
fen
4-hydr
oxy-d
iclo
fena
c
Epoxy
-car
bamaz
epin
e
Estro
ne ( E
1)
Estrio
l
lom
epro
l
lopro
mid
e
Rem
ova
l ra
te, %
Fig. 2. Removal efficiencies (%) for 35 PPCPs in MBR (A) and CAS (B) reactors. Minimum
and maximum removal efficiencies according to (Sipma et al., 2009).
The elimination of pharmaceutical compounds can occur through various mechanisms in
MBR and CAS. Sorption onto sludge is one of the mechanisms involved as biodegradation or,
for a short part, volatilisation. According to (Carballa et al., 2005), adsorption refers to the
hydrophobic interactions of the aliphatic and aromatic groups of a compound with fats present
in the sludge or with the lipophilic cell membrane of the microorganisms (depending on their
Kow value), while absorption refers to the electrostatic interactions of positively charged
groups of dissolved chemicals with the negatively charged surfaces of the microorganisms
(characterized by the dissociation constant pKa).

Article 3 Chapter III
175
Table 4 Physico-chemical characteristics and average removal efficiencies of selected pharmaceuticals
in CAS and MBR.
*Refs: Sipma et al., 2009 ; Yu et al., 2008; Radjenovic et al.,2007 ; Joss et al., 2005 : Lee et al., 2003 : Gobel et al., 2007 ; Vieno et al.,
2007; Radjenovic et al., 2009 ; comez et al., 2007 ; Heberer et al., 2002 ; Nakada et al., 2006 ; Santos et al.,2007 ; suarez et al ., 2005 ;
Paxéus et al.,2004 ; Clara et al.,2004 ; Lishman et al.,2006.
(Göbel et al., 2007) studied the elimination of pharmaceuticals by MBR and CAS and
concluded that the contribution of activated sludge adsorption in the case of pharmaceutical
compounds was less than 6%, i.e., negligible, because this is within the analytical variance of
the method.
Pharmaceutical
MBR CAS Degradation Constant K bio (L/kg ss d)
Sorption constant Kd L/kg ss
*Min.
Rem. %
*Max.
Rem. % Rem. %
*Min.
Rem.%
*Max.
Rem. % Rem. %
Ramipril 18 99,5 100 25 99,9 99,8 n.d n.d
propanolol 25 66,9 100 0 0 0 n.d 366
Bezafibrate 55 88 100 0 22 5,56 2,5 n.d
Fenofibrate 69 99,9 100 53 99,8 99,5 n.d n.d
Paracétamol 18 100 99,60 55 99,9 99,4 80 n.d
Cafienne 11 99,9 99,28 44,2 89,9 88,37 n.d n.d
Ibuprofen 89 99,9 96,39 52 99,7 9,64 20 7
Pravastatin 60 99,9 96,30 59,4 61,8 95,93 n.d 0
Atenolol 0 97 93,93 0 97 95,36 n.d 64
Metronidazole 57 90 90 14 99 83,33 n.d n.d
Roxithromycin 33 75 89,6 0 66 0 0,2 300
Cyclophosphamide 0 92,6 88 0 10 0 n.d n.d
Sulfametoxazole 47 90 87,4 0 99 0 6,2 300
Estriol 0 12 83,12 44 99,9 99,7 280 n.d
Isosfamide 89 99,9 80,5 59 99,9 99,4 n.d n.d
Trimethoprim 47,5 66,7 79,8 0 40,4 8,57 0,15 200
Estrone (E1) 0 22 79,6 59 99,9 99,8 145 n.d
2-hydroxy-ibuprofen 36 88,5 77,95 0 0 0 n.d n.d
Furosemide 47 74 72,22 33 74,5 70 n.d n.d
Tramadol 10 85 68,52 22 92,4 81,8 0,11 111
Triclosan 10 86,9 66,20 15 81,2 70 n.d n.d
Naproxen 71 99,3 48,28 0 98 0 1,5 13
lopromide 40 75 46,36 0 11,5 0 2,1 11
Fenofibric acid 0 15 22,10 0 0 8,15 0,5 5
Codeine 0 22 9,52 0 10 0 n.d n.d
Sotalol 43,4 53,1 0 21,4 75 0 n.d n.d
Carbamazepine 0 23 0 0 58 46,92 0,03 0,1
Losartan 0 5 0 0 0 0 n.d n.d
Oxazepam 0 10 0 0 10 0 n.d n.d
4-hydroxy-diclofenac 0 22 0 14 88 20,91 n.d n.d
Epoxy-carbamazepine 0 10 0 0 15 0 n.d n.d
lomeprol 0 14 0 0 8 0 n.d n.d

Article 3 Chapter III
176
In our study, sulfamethoxazole, which has a hydrophilic nature with two ionisable amine
groups, can be present in an aqueous solution, in positive, neutral, or negative forms. At pH
values between the pKa values of the compound (1.4 and 5.8), it predominates as a neutral
species, while above the second pKa value of the compound (pH 5.8) it becomes a negatively
charged specie (Göbel et al., 2007). These physicochemical properties give an indication that
in the studied MBR system (pH 7.2) the sorption mechanism on sludge will play a negligible
role, due to electrostatic repulsion between the negatively charged groups of the compound
and the negatively charged surfaces of the sludge. Therefore, biodegradation can be
considered as the main mechanism responsible for the removal. (Göbel et al., 2007) and that
correspond with this study. Fig.3A shows the correlation between the walues of Kbio with the
removal efficiency. Increasing the Kbio for the sulfamethoxazole was as indicator on the
complete biodegradation which was correlated with high removal efficiency in CAS and
MBR.
Considering the antibiotic compounds studied the highest removal efficiencies were
observed for metronidazole (90 ± 5%) in the MBR and 83.3 ± 5% in the CAS. This can be
partially explained by its basic character and reduced antibacterial potency compared to
sulfamethoxazole and roxithromycin.
In the MBR, the Kd of ketoprofen, naproxen, ibuprofen, sulfamethoxazole, metronidazole,
triclosan, hydrochlorothiazide, furosemide, carbamazepine, losartan, oxazepam, isosfamide,
cyclophosphamide, Fenofibric acid, 2-hydroxy-ibuprofen, epoxy-carbamazepine, estrone
(E1), estriol, iomeprol and lopromide showed a significant positive correlation with their
removal efficiencies. (Fig. 3B and Table 4), suggesting that high removal efficiencies of these
compounds in the wastewater treatments plant the important resulted in absorption on the
activated sludge. The sorption phenomena seems to be a major removal mechanism in the
MBR for ketoprofen, naproxen, ibuprofen, sulfamethoxazole, metronidazole, triclosan,
hydrochlorothiazide, furosemide, carbamazepine, losartan, oxazepam, isosfamide,
cyclophosphamide, fenofibric acid, 2-hydroxy-ibuprofen, epoxy-carbamazepine, estrone (
E1), estriol, lomeprol and lopromide (Golet et al., 2003; Lindberg et al., 2006).
Several assumptions may be made to explain the difference between CAS and MBR: (1) a
higher SRT in the MBR allows a better degradation of non-easily biodegradable molecules (as
pharmaceuticals) and (2) could also enhance the development of slowly growing populations,
(3) a higher concentration of no-flocculating and dispersed organisms in MBR probably aids
the degradation of molecules in the supernatant due to reduction of mass transfer limitation,

Article 3 Chapter III
177
(4) one of the reaction of bacteria to an environmental stress is the production of EPS which
can increase the sorption characteristics between sorbable molecules and sludge.
A
0
20
40
60
80
100
Ram
ipril
prop
anol
ol
Bez
afib
rate
Fenof
ibra
te
Parac
étam
ol
Caf
ienn
e
Ibup
rofe
n
Prava
statin
Ate
nolo
l
Met
roni
dazo
le
Rox
ithro
myc
in
Cyc
loph
osph
amid
e
Sulfa
met
oxaz
ole
Estrio
l
Isos
fam
ide
Trimetho
prim
Estro
ne (
E1)
2-hy
drox
y-ib
upro
fen
Furos
emid
e
Tram
adol
Triclo
san
Nap
roxe
n
lopr
omid
e
Fenof
ibric
acide
Cod
ienn
e
Sotalol
Car
bam
azép
ine
Losar
tan
Oxa
zepa
m
4-hy
drox
y-di
clof
enac
Epoxy
-car
bam
azep
ine
lom
epro
l
Rem
oval,
rate
%
0,1
1
10
100
1000
Sorp
tion
con
stan
t K
d (
L/k
g s
s d)MBR
CAS
Kd
B
0
20
40
60
80
100
Ram
ipril
prop
anol
ol
Bez
afib
rate
Fenof
ibra
te
Parac
étam
ol
Caf
ienn
e
Ibup
rofe
n
Prava
stat
in
Ate
nolo
l
Metro
nida
zole
Rox
ithro
myc
in
Cyc
loph
osph
amid
e
Sulfa
metox
azol
e
Estriol
Isos
fam
ide
Trim
etho
prim
Estro
ne (
E1)
2-hy
drox
y-ib
upro
fen
Furos
emid
e
Tram
adol
Tricl
osan
Nap
roxe
n
lopr
omid
e
Fenof
ibric
aci
de
Cod
ienn
e
Sotal
ol
Car
bam
azép
ine
Losar
tan
Oxa
zepa
m
4-hy
drox
y-di
clof
enac
Epoxy
-car
bam
azep
ine
lom
epro
l
Rem
oval,
rate
%
0,01
0,1
1
10
100
1000
Bio
deg
rad
ati
on
co
nst
an
t K
bio
(L
/kg
ss
d)
MBR
CAS
K bio
Fig. 3. Removal efficiency with the Kbio (A) and the Kd (B).
3.2 EPS measurement
Samples of flocs were qualitatively observed using confocal laser scanning microscopy
(CLSM) to characterize the extracellular polymeric substances (EPS). Visualization of a flocs
collected in the CAS and BRM reactors after a 2, 18, 30, and 48 days of exposure time to
hospital effluent is presented in Figure 4 after statistical treatment. The relative quantity of

Article 3 Chapter III
178
total EPS increased in the CAS during the 30 first days of experiment, and then decreased at
the end; this may show some acclimation of the biomass to the specificity of the effluent. On
the other hand, in the MBR, the relative quantity of EPS increased continuously during the
time of experiment, leading to an accumulation on the media, and, accordingly, to a decrease
of the membrane permeability. The involving of cellular lysis in the occurrence of EPS was
also visualized by confocal microscopy stained with fluorescent viability indicator (Fig. 4).
The relationship between the evolutions of alive cells and EPS seems more evident in the
CAS, where the percentage of EPS is closed to the percentage of alive cells (except at 30
days). It is not the case in the MBR, confirming that EPS could be a by-product due to the
type of process.
(1)
0 2 0 4 0 6 0
4 8
3 0
1 8
2
Tim
e (
da
ys
)
D e a d c e llsE P Sa liv e c e lls
%
(2)
0 2 0 4 0 6 0
0
1 8
3 0
4 8
Tim
e (
da
ys
)
D e a d c e llsE P Sa liv e c e lls
%
Fig. 4. Evolution of alive and dead cells and EPS in MBR (1) and CAS (2)
To confirm these results, three-dimensional EEM spectroscopy was applied to characterize
the soluble EPS from both MBR and CAS sludge supernatant. Three peaks were readily
identified from EEM fluorescence spectra of effluents from BRM-EPS and CAS-EPS during
60 days of treatment (Fig. 5. A, B). The first main peak was identified at excitation/emission
wavelengths (Ex/Em) of 240/300–310nm (Peak I), while the second main peak was identified

Article 3 Chapter III
179
at Ex/Em of 250–275/340–350nm (Peak II). These two peaks have been described as protein-
like peaks, in which the fluorescence is associated with the aromatic amino acid tryptophan
(Baker, 2001; Chen et al., 2003; Yamashita and Tanoue, 2003; Baker and Inverarity, 2004).
Compared with the fluorescence peak location of proteins reported previously (276–281/340–
370nm) (Baker, 2001), the locations of Peak II for the two EPS showed a blue shift. A third
peak was located around Ex/Em = 280-300/380–400nm (Peak III). A similar fluorescence
signal has also been observed for natural dissolved organic matter and is described as visible
humic acid-like fluorescence (Coble, 1996).
A C
( CAS ) ( MBR)
I
II
III
2 d
1 8 d
3 0 d
0 1 6 2 4 3 2 4 6
0 .0
0 .5
1 .0
1 .5
T im e (d a y s)
Tr
yp
to
ph
an
e/ F
lu
vic
- l
ik
e
flo
ur
es
en
ce
in
te
ns
ity
C A S
M B R
B
Fig. 5. (A, B) EEM fluorescence spectra of the soluble-EPS. (C) The ratio tryptophan/fulvic-
like fluorescence intensity versus time in CAS and MBR reactors treating the hospital
wastewater.
.
The change in the relative fluorescence intensity of the peaks during activated sludge
treatment gave interesting information about the composition of sludge and the change in the
EPS structure. The ratio tryptophan-like/fulvic-like fluorescence intensity was considered as
an indicator of the biologic state of wastewater. During the first 40 days the ratio between the
tryptophan-like fluorescence and the fulvic- like substances fluorescence was increased from

Article 3 Chapter III
180
0.25 to 0.65 for the CAS and from 0.79 to 1 for the MBR (Fig. 5C) indicating an increase in
proteins concentration in both case.
Synchronous fluorescence with an offset value of 20 nm permitted to measure the change
in the peak I, peak II and peak III intensity for both CAS and MBR reactors (Fig. 6A and B).
Important according between concentrations of the EPS compounds measured in both
fluoremetric and chemical analyses in both MBR (A) and CAS (B) reactors and that confirms
the impact of the hospital effluents in increasing concentration the EPS during the 40 days of
experiment.
A
0 1 0 2 0 3 0 4 0 5 0
0
2 0 0
4 0 0
6 0 0
0
5
1 0
1 5
2 0
2 5
C o v e n tio n n e l A c tiv a te d S lu d g e (C A S )
T im e (d a y s )
Flu
ore
se
nc
e (
EX
= 2
80
, D
elt
a =
20
nm
)
Co
nc
en
tra
tion
of P
ro
tien
s (m
g/L
)
T ry p to p h a n P ro te in s
0 1 0 2 0 3 0 4 0 5 0
0
2 0 0
4 0 0
6 0 0
8 0 0
0
5
1 0
1 5
2 0
M e m b ra n e B io re a c to r (M B R )
T im e (d a y s )
Flu
ore
se
nc
e (
EX
= 2
80
, D
elt
a =
20
nm
)
Co
nc
en
tra
tion
of P
ro
tien
s (m
g/L
)
T ry p to p h a n P ro te in s
B
0 1 0 2 0 3 0 4 0 5 0
0
5 0 0
1 0 0 0
1 5 0 0
1 2 0
1 4 0
1 6 0
1 8 0
2 0 0
2 2 0
T im e (d a y s )
Flu
ore
se
nc
e (
EX
= 3
80
, D
elt
a =
20
nm
) Hu
mic
- like
su
bs
tan
ce
s(m
g/L
)
F lu v ic -lik e
s u b s ta n c e s
H u m ic - lik e
s u b s ta n c e s
0 1 0 2 0 3 0 4 0 5 0
5 0 0
6 0 0
7 0 0
8 0 0
9 0 0
1 0 0 0
1 1 0 0
1 5 0
2 0 0
2 5 0
3 0 0
T im e (d a y s )
Flu
ore
se
nc
e (
EX
= 3
80
, D
elt
a =
20
nm
) Hu
mic
- like
su
bs
tan
ce
s(m
g/L
)
F lu v ic -lik e
s u b s ta n c e s
H u m ic - lik e
s u b s ta n c e s
Fig. 6. C The relation between the chemical dosage for the proteins and humic-like substances
and tryptophan-like fluorescence ( exc= 280 nm, Δ=20 nm), fulvic-like fluorescence ( exc = 365 nm, Δ= 20 nm) versus time during the time of the (A) MBR and (B) CAS
To quantify the EPS, the total EPS composition (PN, PS, HA) were analysed by
biochemical analyses and their evolutions were represented in the Fig. 7. Significant
increasing of total EPS was found during the experiment in both MBR and CAS reactors.
Protein concentration was very low and its increasing in supernatant concentrations in MBR
and CAS was significant since the days 35 (from 4mg/L to 20 mg/L).
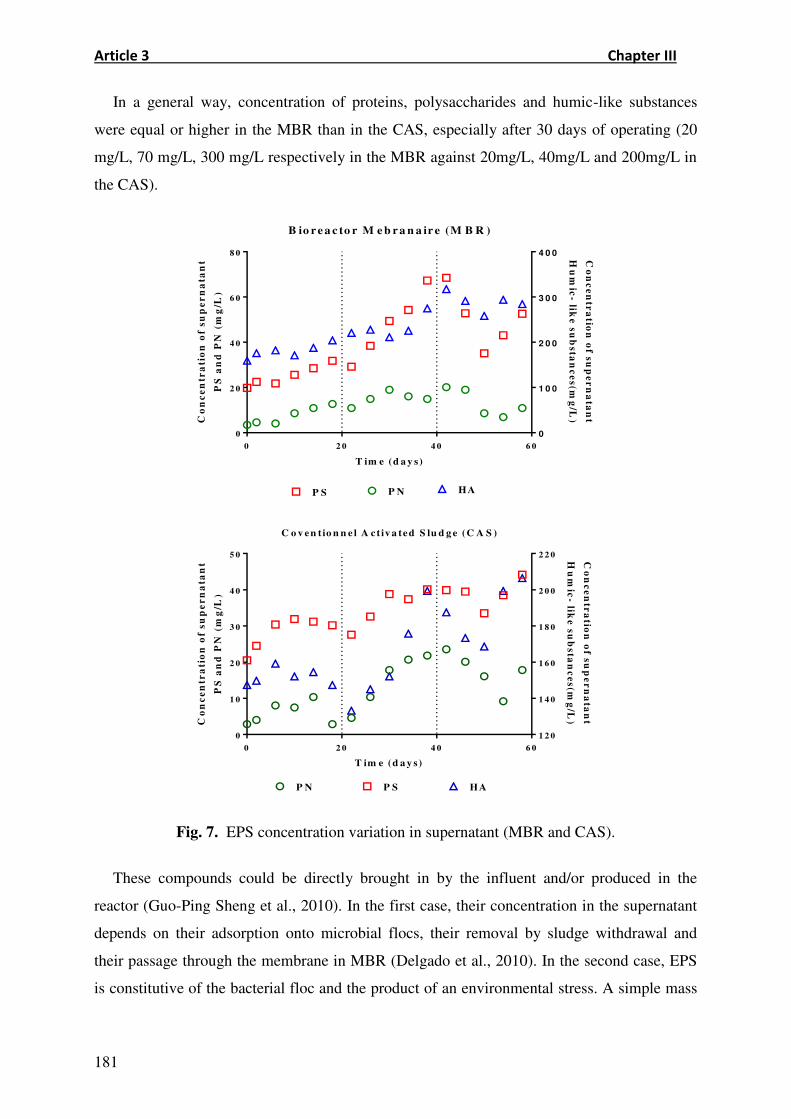
Article 3 Chapter III
181
In a general way, concentration of proteins, polysaccharides and humic-like substances
were equal or higher in the MBR than in the CAS, especially after 30 days of operating (20
mg/L, 70 mg/L, 300 mg/L respectively in the MBR against 20mg/L, 40mg/L and 200mg/L in
the CAS).
0 2 0 4 0 6 0
0
2 0
4 0
6 0
8 0
0
1 0 0
2 0 0
3 0 0
4 0 0
B io r e a c to r M e b r a n a ir e (M B R )
T im e (d a y s)
Co
nc
en
tra
tio
n o
f s
up
er
na
tan
t
PS
an
d P
N (
mg
/L)
Co
nc
en
tra
tion
of s
up
er
na
tan
t
Hu
mic
- like
su
bs
tan
ce
s(m
g/L
)
P NP S HA
0 2 0 4 0 6 0
0
1 0
2 0
3 0
4 0
5 0
1 2 0
1 4 0
1 6 0
1 8 0
2 0 0
2 2 0
C o v en tio n n e l A ct iv a ted S lu d g e (C A S )
T im e (d a y s)
Co
nc
en
tra
tio
n o
f s
up
er
na
tan
t
PS
an
d P
N (
mg
/L)
Co
nc
en
tra
tion
of s
up
er
na
tan
t
Hu
mic
- like
su
bs
tan
ce
s(m
g/L
)
P N P S HA
Fig. 7. EPS concentration variation in supernatant (MBR and CAS).
These compounds could be directly brought in by the influent and/or produced in the
reactor (Guo-Ping Sheng et al., 2010). In the first case, their concentration in the supernatant
depends on their adsorption onto microbial flocs, their removal by sludge withdrawal and
their passage through the membrane in MBR (Delgado et al., 2010). In the second case, EPS
is constitutive of the bacterial floc and the product of an environmental stress. A simple mass

Article 3 Chapter III
182
balance for each compounds showed that if humic-likes substances concentration resulted of
the quality of the influent, proteins and polysaccharides concentrations were the result of
microbial metabolism.
Moreover, it has been shown that the presence of pharmaceuticals compounds stimulates
the survival mechanisms of microorganisms and the production of EPS with a slightly higher
production of polysaccharides than proteins (A.C. Acella et al., 2009). It can thus be supposed
that the higher concentration of EPS in MBR compared to CAS was also linked to cake layer
retention of the membrane.
4. Conclusion
The MBR was able to achieve good organic removal efficiencies by comparison with the
CAS. Despite the low concentration studied, the pharmaceutical compounds modifie the
characteristics of the biological matrix. Their occurrence stimulated the mechanisms of
survival (higher production of EPS. Fouling potential seems to be linked more closely to
polysaccharides than other EPS. Simultaneously, confocal laser scanning observations and
three-dimensional EEM spectroscopy showed significant modifications of sludge
morphology. (Higher production of soluble EPS). The MBR presented higher removal
efficiencies for pharmaceuticals by compared with the CAS.
References
Alrhmoun M., Carrion C., Casellas M., Dagot C., 2015. Upgrading the performances of
ultrafiltration membrane system coupled with activated sludge reactor by addition of
biofilm supports for the treatment of hospital effluents. Chemical Engineering Journal
262, 456–463.
Avella, A.C., Delgado, L.F., Gorner, T., Albasi, C., Galmiche, M., De Donato, Ph., 2010.
Effect of cytostatic drug presence on extracellular polymeric substances formation in
municipal wastewater treated by membrane bioreactor. Bioresour. Technol. 101 (2),
518–526.
Baker A., 2002. Fluorescence properties of some farm wastes: implications for water quality
monitoring. Water Research. 36, 189-195.
Baker A., 2001. Fluorescence excitation–emission matrix characterization of some sewage-
impacted rivers. Environ. Sci.Technol. 35, 948–953.
Baker A., Inverarity R., 2004. Protein-like fluorescence intensity as a possible tool for
determining river water quality. Hydrol. Process. 18, 2927–2945. Biodegradation. 20,
441-466.
Barret M., Carr`ere H., Latrille E., Wisniewski C., Patureau D., 2010. Micropollutant and
sludge characterization formodeling sorption equilibria,” Environmental Science and Technology. 44 (3), 1100–1106.

Article 3 Chapter III
183
Bernhard M., Müller J., Knepper T.P., 2006. Biodegradation of persistent polar pollutants in
wastewater: comparison of an optimised lab-scale membrane bioreactor and activated
sludge treatment, Water Res. 40, 3419–3428.
Byrns G., 2001. The fate of xenobiotic organic compounds in wastewater treatment plants,
Water Res. 35 (2523).
Carballa M., Omil F., Lema J.M., Llompart M., Garcia-Jares C., Rodriguez I., Gomez M.,
2004. Chromatography–mass spectrometry: methods and preliminary results including
toxicity studies with Vibrio fischeri. J. Chromatogr. A 938, 187–197.
Carballa M., Omil F., Lema J.M., 2005. Removal of cosmetic ingredients and pharm-
aceuticals in sewage primary treatment, Water Res. 39, 4790–4796.
Clara M., Strenn B., Gans O., Martinez E., Kreuzinger N., Kroiss H., 2005. Removal of
selected pharmaceuticals, fragrances and endocrine disrupting compounds in a
membrane bioreactor and conventional wastewater treatment plants, Water Res. 39,
4797–4807.
Choubert J.M., S. Martin-Ruel, M. Coquery (2009). Prélèvement et échantillonnage des
substances prioritaires et émergentes dans les eaux usées : Les prescriptions techniques
du projet de recherche AMPERES. Techniques Sciences et Méthodes. 4: 88-101.
Coble, P.G., 1996. Characterization of marine and terrestrial DOM in seawater using
excitation– emission matrix spectroscopy. Mar. Chem. 51 (4), 325–346.
Daughton C. G., Ternes T. A., 1999. Pharmaceuticals and Personal Care Products in the
Environment: Agents of Subtle Change?,Environmental Health Perspectives, 107, 907 –
938.
Delgado L. F., Faucet-Marquis V., Schetrite S., Pfohl-Leszkowicz A., Paranthoen S., Albasi
C., 2010a. Effect of cytostatic drugs on the sludge and on the mixed liquor
characteristics of a cross-flow membrane bioreactor: consequence on the process. J.
Membr. Sci. 347 (1–2), 165–173.
Delgado Luis, F., Schetrite, S., Gonzalez, C., Albasi, C., 2010b. Effect of cytostatic drugs on
microbial behavior in membrane bioreactor system. Bioresour. Technol. 101 (2), 527–536.
Delgado L.F., Dorandeu C., Marion B., Gonzalez C., Faucet-Marquis V., Schetrite S., Albasi
C., 2009. Removal of a cytostatic drug by a membrane bioreactor. Desalination Water
Treat. 9, 112–118.
Dewever H., Weiss S., Reemtsma T., Vereecken J., Müller J., Knepper T., Röden O.,
Gonzalez, S., Barcelo D., Hernando M.D., 2007. Comparison of sulfonated and other
micropollutants removal in membrane bioreactor and conventional wastewater
treatment, Water Res. 41, 935–945.
Farrè M., Ferrer I., Ginebreda A., Figueras M., Ollivella L., Tirapu L., Vilanova M., Barcelo
D., 2001. Determination of drugs in surface water and wastewater samples by liquid
Fate of cancerostatic platinum compounds in biological wastewater treatment of
hospital effluents, Chemosphere 69, 1765–1774.
Gao, M., Yang, M., Li, H., Yang, Q., Zhang, Y., 2004. Comparison between a submerged
membrane bioreactor and a conventional activated sludge system on treating ammonia-
bearing inorganic wastewater. J. Biotechnol. 108, 265–269.
Göbel A., McArdell C.S., Joss A., Siegrist H., Giger W., 2007. Fate of sulfonamides,
macrolides, and trimethoprim in different wastewater treatment technologies, Sci. Total
Environ. 372, 361–371.

Article 3 Chapter III
184
Golet E.M., Xifra I., Siegrist H., Alder A.C., Giger W., 2003. Environmental exposure
assessment of fluoroquinolone antibacterial agents from sewage to soil. Environ. Sci.
Technol. 37, 3243-3249.
Heberer T., 2002. Tracking persistent pharmaceutical residues from municipal sewage to
drinking water. Journal of Hydrology. 266, 175-189.
Henriques I.D.S., Love N.G., 2007. The role of extracellular polymeric substances in the
toxicity response of activated sludge bacteria to chemical toxins Water Res. 41 (18),
4177–4185.
Hernandez M.E., Rojas R., Van Kaam S., Albasi C., 2005. Role and variation of supernatant
compounds in submerged membrane bioreactor fouling, Desalination 175, 95–107.
Huang, X., Liu, R., Gian, Y., 2000. Behaviour of soluble microbial products in a membrane
bioreactor. Process. Biochem. 36, 401–406.
José L., Maxime F., Wilhelm G., 2010. Removal of pharmaceutical compounds in membrane
bioreactors (MBR) applying submerged membranes, laboratory of Energy and the
Environment, Department of Chemical Engineering and Food Universitário, Trindade.
40, 880-900.
Judd S.J., 2004. A review of fouling of membrane bioreactors in sewage treatment, Water Sci.
Technol. 49 (2) 229–235.
Jean J., Perrodin Y., Pivot C., Trepo D., Perraud M., Droguet J., Tissot-Guerraz F., Locher
F., 2012. Identification and prioritization of bioaccumulable pharmaceutical substances
discharged in hospital effluents. J. Environ. Manage. 103, 113−121. Lenz K., Hann S., Koellensperger G., Stefánka Z., Stingeder G., Weissenbacher N., Mahnik,
M. Fuerhacker S.N., 2005. Presence of cancerostatic platinum compounds in hospital
wastewater and possible elimination by adsorption to activated sludge, Sci. Total
Environ. 345, 141–152.
Le-Clech P., Chen V., Fane T.A.G., 2006. Fouling in membrane bioreactors used in
wastewater treatment, J. Membr. Sci. 284, 17–53.
Lenz K., Koellensperger G., Hann S., Weissenbacher N., Mahnik S.N., Fuerhacker M.,
Kümmerer K., 2001. Drugs in the environment: emission of drugs, diagnostic aids and
disinfectants into wastewater by hospitals in relation to other sources review.
Chemosphere 45, 957–969.
Lesjean B., Rosenberger S., Laabs C., Jekel V., Gnirss R., Amy G., 2005. Correlation
between membrane fouling and soluble/colloidal organic substances in membrane
bioreactors for municipal wastewater treatment, Water Sci. Technol. 51, 1–8.
Lindberg R.H., Olofsson U., Rendahl P., Johansson M.I., Tysklind M., Andersson B., 2006.
Behavior of fluoroquinolones and trimethoprim during mechanical, chemical, and active
sludge treatment of sewage water and digestion of sludge. Environ. Sci. Technol. 40,
1042-1048.
Martin Ruel S., Choubert J-M., Budzinski H., Miège C., Esperanza M., Coquery M., 2012.
Occurrence and fate of relevant substances in wastewater treatment plants regarding
Water Framework Directive and future legislations. Water Science and Technology,
65(7), 1179-1189.
Miqueleto A.P., Dolosic C.C., Pozzi E., Foresti E., Zaiat M., 2010. Influence of carbon
sources and C/N ratio on EPS production in anaerobic sequencing batch biofilm reactors
for wastewater treatment, Bioresour. Technol. 101 (4) 1324–1330.
Meng F., Zhang H., Yang F., Zhang S., Li Y., Zhang X.,2006. Identification of activated
sludge properties affecting membrane fouling in submerged membrane bioreactors, Sep.
Purif. Technol. 51, 95–103.

Article 3 Chapter III
185
Mobed, J.J., Hemmingsen, S.L.,Autry,J.L.,McGown, L.B., 1996. Fluorescence characteriza-
tion of IHSS humic substances: total luminescence spectra with absorbance correction.
Environ.Sci. Technol. 30, 3061–3065
Molecular Probes, LIVE/DEAD® BacLightTM Bacterial Viability Kits. Revised: September.,
2011. Fluorescence Spectroscopy Protocols. Staining Bacteria with either Kit L7007 or
L7012.
Nataraj S., Schomäcker R., Kraume M., Mishra I.M., Drews A., 2008. Analyses of
polysaccharide fouling mechanisms during crossflow membrane filtration, J. Membr.
Sci. 308, 152-161.
Ng H.Y., Hermanowicz S.W., 2005b. Membrane bioreactor operation at short solids retention
times: performance and biomass characteristics. Water Res. 39, 981–992.
Onesios K.M., Yu J.T., Bouwer E.J., 2009. Biodegradation and removal of Pharmaceuticals
and personal care products in treatment systems: a review.
Petrovi M., Diaz c A., Ventura F., Barcelo D., Am J., 2003. Soc. Mass Spectrom. 14, 516.
Pills Project: www.pills-eu.fr
Reynolds D.M., 2002. The differentiation of biodegradable and non-biodegradable dissolved
organic matter in waste waters using fluorescence spectroscopy. J. Chem. Technol.
Biotechnol.77, 965–972.
Rosenberger S., Laabs C., Lesjean B., Gnirss R., Amy G., Jekel M., Schrotter J.C., 2006.
Impact of colloidal and soluble performance in membrane bioreactor for municipal
wastewater treatment, Water Res. 40, 703- 710.
Rosenberger S., Evenblij H., te Poele S., Wintgens T., Laabs C., 2003. The importance of
liquid phase analyses to understand fouling in membrane assisted activated sludge
processes—six case studies of different European research groups, Filterability of
activated sludge in membrane bioreactors, desalination. 146, 373–379.
Sarraguça M., Paulo A., Alves M., Dias A., Lopes Jo., Ferreira En., 2009. Quantitative
monitoring of an activated sludge reactor using on line UV-visible and near-infrared
spectroscopy. Analytical and Bioanalytical Chemistry. 395, 1159-1166.
Shin H.S., Kang S.T., 2003. Characteristics and fates of soluble microbial products in
ceramicmembrane bioreactor at various sludge retention times. Water Res. 37, 121-
127.
Urase T., Kikuta T., 2005. Separate estimation of adsorption and degradation of
pharmaceutical substances and estrogens in the activated sludge process, Water Res. 39,
1283- 1289.
Ternes T., 2004. Behavior of pharmaceuticals, cosmetics and hormones in a sewage treatment
plant. Water Research. 38, 2918-2926.
Weiss S., Reemtsma T., 2008. Membrane bioreactors for municipal wastewater treatment a
viable option to reduce the amount of polar pollutants discharged into surface waters?
Water Res. 42, 3837–3847.
Wingender J., Neu T.R., 1999. What are bacterial extracellular polymer substances in
Flemming (Eds.), Microbial Extracellular Polymeric Substances, Springer, Heidelberg.
1–19.
Yamashita Y., Tanoue E., 2003. Chemical characterization of protein-like fluorophores in
DOM in relation to aromatic amino acids. Mar. Chem. 82, 255–271.

Article 4 Chapter III
186
Amélioration des performances de systèmes à boue activée
couplés à u e e ra e d’ultrafiltratio interne ou externe
par ajouts de supports bactériens.
Afi d’a lio e les pe fo a es des a teu s iologi ues oupl s à un système de séparation membranaire, des supports bactériens
synthétiques ont été ajoutés à la liqueur mixte afin de favoriser la
oissa e d’u iofil . Deu o figu atio s o t t test es (A et B) :
- un système à membrane immergée, fonctionnant selon les modalités
des bioréacteurs à membrane (recyclage interne)
- un système à membrane externe, traitant une eau partiellement
décantée, et fonctionnant comme traitement tertiaire. Les résultats
de cette deuxième configuration ont été publiés dans Chemical
Engineering Journal.
A- Performa es d’u ioréa teur e ra aire à iofil traita t u efflue t hospitalier par ajout d’u support a térie (cette partie est écrite pour le
publier en « Desalination journal »)
Des suppo ts a t ie s o t t ajout s da s la li ueu i te d’u réacteur à membrane immergée (BAM) traitant un effluent
hospitalier, afin de le transformer en bioréacteur membranaire à
biofilm (MBBR) et améliorer ces performances en terme
d’ li i atio de o pos s pha a euti ues. Ai si, ap s 0 jou s de fonctionnement en BAM, les supports ont été ajoutés et le système
suivi pe da t 0 jou s gale e t. D’u e a i e glo ale, les rendements d'élimination pour les paramètres classiques (DCO, MES,
MVS, et NT) ont été améliorés lors du passage en MBBR. Dans le cas
des composés pha a euti ues, si d’u e a i e g ale les tau d’a atte e t so t eilleu s e MBBR u’e BAM T a adol, sulfaméthoxazole, triméthoprime, naproxène, triclosan, métoprolol,
sotalol, losartan, carboxyle ibuprofène, ibuprofène 2-hydroxy, époxy
carbamazépine, 4 androstene-3, 17-dione et ioméprol) des
exceptions ont été mesurés (propanolol 100% à 25%).
Comme lors des travaux précédents, les EPS ont été analysées par la
méthode biochimique et par microscopie confocale, couplée avec
une estimation de la viabilité cellulaire. Après une augmentation de
la o e t atio de p ot i es, de pol sa ha ides ou d’a ides humiques-like lors du fonctionnement en BAM, leurs concentrations
dans la phase liquide ont brutalement diminuées pour se stabiliser.
Seule la concentration en acides humiques-like augmente de
ouveau, e tai e e t li e à l’ali e tatio .

Article 4 Chapter III
187
U e des pe ussio s de l’ajout de ga issage a t de di i ue le colmatage membranaire et donc de réduire le nombre de lavage en
stabilisant la perméabilité membranaire.
B- Amélioration des performances d’u système à boue activée couplés à une
e ra e d’ultrafiltratio par ajouts de supports a térie s.
ALRHMOUN Mousaaba, CARRION Claire, CASELLAS Magali
a,
and DAGOT Christophe
1. Laboratory of GRESE EA 4330, university of Limoges 123 Avenue Albert Thomas, 87060 Limoges
2. UMR 7276 CNRS Joint microscopy Service -CIM, University of Limoges, Faculty of Medicine, F-87000 Limoges, France
Article publié dans Chemical Engineering Journal, 262, 456-463 (2015)
Un réa teu à oue a tiv e oupl à u e e a e d’ult afilt atio BAM a t is e pla e pou le t aite e t d’u efflue t hospitalie
et suivi pe da t jou s e te e de pe fo a e d’ li i atio de composés pharmaceutiques et, comme précédemment, de
modification structurelle des flocs.
Comme précédemment des supports bactériens ont été ajoutés dans
la liqueur mixte du bassin aéré afin de transformer le réacteur en
bioréacteur membranaire à biofilm (MBBR) et suivi pendant 2 mois
supplémentaires sur les mêmes performances.
D’u e a i e glo ale, les e de e ts d' li i atio pou les paramètres classiques (DCO, MES, MVS, et NT) ont été améliorés lors
du passage en MBBR.
Da s le as des o pos s pha a euti ues, si d’u e a i e g ale les tau d’a atte e t so t eilleu s e MBBR u’e BAM (Tramadol, sulfaméthoxazole, triméthoprime, naproxène, triclosan,
métoprolol, sotalol, losartan, carboxyle ibuprofène, ibuprofène 2-
hydroxy, époxy carbamazépine, 4 androstene-3, 17-dione et
ioméprol) des exceptions ont été constatées (propanolol 100% à
25%).
Les différentes hypothèses avancées, validée par des études
antérieures, sont :
- l’aug e tatio du te ps de s jou des oues li à la p se e d’u iofil ofo su les suppo ts ajout s - l’aug e tatio de la io asse dans les structures de biofilm
- l’aug e tatio des ph o es de so ptio su les iofil s supportés. .
Comme lors des travaux précédents, les EPS ont été analysées par la
méthode biochimique et par microscopie confocale, couplée avec
une estimation de la viabilité cellulaire.
Après une augmentation de la concentration de protéines, de
pol sa ha ides ou d’a ides hu i ues-like lors du fonctionnement en
BAM, leurs concentrations dans la phase liquide ont brutalement
Article 4 Chapter III
188
diminuées pour se stabiliser. Seule la concentration en acides
humiques-like augmente de nouveau, certainement liée à l’appo t de ces composés par l’ali e tatio .
Le suivi des évolutions de la pression transmembranaire et du flux de
pe at a o t ue l’ajout de ga issage a la ge e t sta ilisé les
évolutions de ces deux paramètres. Une des conséquences de l’ajout de garnissage a donc été de diminuer le colmatage membranaire et
ainsi de réduire le nombre de lavage en stabilisant la perméabilité
membranaire. Cette diminution est mise en relation avec les
productions des différents EPS.
Results and Discussion Chapter III
189
A- Application of membrane biofilm bioreactor (MBBR) for hospital
wastewater treatment: Performances and Efficiency for Organic
Micropollutant Elimination
1. Introduction
The use of membrane bioreactors (MBR) is emerging as an attractive technology for hospital
wastewater treatment with considerable advantages over conventional treatment methods
(Arnot et al. 1996). The bioreactor which combines membrane system and biological
treatment processes into a single unit is designed to remove particulate, colloidal and some
dissolved substances from the solutions (Chang et al. 1998). The membrane separation
technique could be used to avoid a problem of non-settling sludge, to replace a secondary
clarifier, and to obtain a high effluent quality and a compactness of treatment plants
(Visvanathan et al., 2000).
Nevertheless, membrane fouling is one of the main drawbacks of this technique and it is
generally accepted that fouling reduces the performance of membrane. To overcome
membrane fouling due to the cake resistance, a number of techniques have been explored:
backwashing, jet aeration, operation below critical flux, addition of coagulants (Lee et al.
2000). Most of the studies have focused on minimizing the cake formation on the membrane
surface, but another way is to use a support media in the bioreactor to fix the biomass and
there by to limit the primary sources of cake layer. When the fouling occurs, a thick gel layer
and cake layer are formed on and into the membrane, causing the decrease of the permeate
flux and the increase of the operating costs due to needs for cleaning or replacing the
membrane.
Fouling is usually attributed to a number of parameters, such as sludge particle deposition,
adhesion of macromolecules such as extracellular polymeric substances (EPS) and pore
clogging by small molecules (Bouhabila 1996). Soluble EPS (soluble macromolecule and
colloid) can enter the membrane pores and then build up on the pore wall, leading to a
reduction of total section area of membrane pores causing pore plugging into membrane
and increasing the membrane resistance (Lukas et al. 2002). The membrane performance
can be monitored through a number of factors such as membrane fouling, EPS production,

Results and Discussion Chapter III
190
treated effluent quality, biomass characteristic and microbial activity (Lee et al. 2003; Kim et
al. 2001).
A number of studies have been experimentally conducted on membrane fouling (Chang et
al. 1998; Nagaoka et al. 1996; Ognier et al. 2002) investigating an attached growth
bioreactor with fixed support media to minimize the fouling in submerged MBR.
(Basu et al. 2005) studied the effect of support media in integrated bio filter submerged
membrane system, and membrane fouling rate and water quality parameters were of
interest. It was found that the membrane fouling rate doubled in the absence of support
media. The authors also suggested that the support media enhanced the membrane surface
scouring and the bio film growth on the support media, which improved the removal
efficiency. The comparison, reported in this paper, was intended to check whether the
attached growth treatment of effluent hospitals could increase performance the MBR in
removal the organic pollutants and the micropollutants. MBR was used to treat the hospital
effluent and to evaluate its performance for the MBR with supports media or without
supports media but not in term of performances but also the changes in EPS concentration.
2. Materials and Methods
2.1. Study area
The hospital effluent (HE) samples used in this study were collected from the sewerage
system (black water) which comprises only sewers from clinical activities of the hospital.
Average characteristics of wastewater and activated sludge used as inoculums during the
experiments are detailed in the (table 1).
Table1 Show physicochemical characteristics of the hospital effluents (HE) and activated
sludge (AS).
COD (mg/L) N (mg/L)
TSS (g/L) VSS (g/L) Total Soluble Total Soluble
HE 412.5± 5 173.5 ±5 128.9±5 95± 5 0.199 0.091
AS 1201± 5 285± 5 - - 6.214 1.35

Results and Discussion Chapter III
191
2.2. Membrane bioreactors (MBR)
Submerged membrane bioreactor (MBR) having 27 L of working volume were used under a
laboratory scale. The reactor had a rectangular cross section and was separated into two
compartments by a vertical holed baffle plate to prevent the moving media from contacting
the membrane module and protecting it from breakage. The MBR system consisted of
bioreactor. Hollow fiber membrane module was submerged in bioreactor shown in (Fig1).
The characteristics of the membrane used in this work are listed in (Table 2).
Figure 1 Schematic diagram of membrane bioreactor
Table 2 the characteristics of the membrane used in this work
Item
Membrane
characteristics
Model STNM424
Membrane material Polyethylene
(coating with hydrophilic)
Membrane
configuration Hollow fiber
Pore size 0.05μ
Surface area 1 m2
Manufacturer Rayon Co., Ltd (Japan)
Aeration was done through diffusers at the bottom of the reactor to provide oxygen for
biomass growth as well as shear to reduce cake formation at membrane surface.

Results and Discussion Chapter III
192
Dissolved oxygen levels were maintained between 2 and 4.5mg O2/h. The membrane
permeate was continuously removed by a peristaltic pump under a constant flux (1.8 L/h)
constantly monitoring the trans-membrane pressure (TMP) build-up which indicates the
extent of membrane fouling and under intermittent operation mode in a automatic cycle
for 10 minute of production (on), and 45 seconds for physical water cleaning operation (off )
by using a integrated timer. The membrane cleaning process was temporarily required
when the membrane was clogged, which was indicated by an increase in the
transmembrane pressure (TMP) up to ~26 kPa. The TMP value was measured using a U-
shaped Hg manometer. The hydraulic retention time (HRT) ranged from 15 to 20 h.
Temperature was from 14 to 16 C° and pH was from 7 to 8. The sludge retention time (SRT)
was around 15 days. The bioreactor was run for 95 days in two operations the first begin
from 1 to 60 days without the biofilm supports media (MBR) and the second from 60 to 120
days with the biofilms supports media (MBBR). See table 3 to know more about the
characteristics of supports.
Table 3 Characteristics of supports media
2.3. Analytical methods
Wastewaters and sludge physicochemical characteristic measurements were done every two
day. Measurements of total and volatile suspended solids (TSS and VSS) were done
according to the normalized method (AFNOR, NF T 90-105). Chemical Oxygen Demand (COD)
was measured by the closed reflux colorimetric method (ISO 15705:2002), and total nitrogen
(TN) was assessed using the alkaline per sulfate digestion with colorimetric reactive (Hatch
company). The COD and TN were carried out on both total and soluble fraction (after

Results and Discussion Chapter III
193
samples filtrated at 1.2µm). Ionic species in solution were determined on samples filtrated at
0.22µm using ion chromatography (Dionex 120) according to the standard method (AFNOR,
NF EN ISO 10304-1). The used detector was conducted metric, and the analytical error was
±5%.
2.4. Extracellular polymeric substances (EPS)
The analysis of EPS in biomass was made through a thermal extraction method. The mixed
liquor of activated sludge was centrifuged at 4000 rpm for 20 min and T= 4 C° in order to
remove the soluble EPS from bound EPS. After collecting the soluble EPS, the remaining
pellet was washed and re-suspended in saline water (0.9% NaCl solution). The extracted
solution was then separated from the sludge solids by centrifuging under similar conditions
(4,000 rpm for 20 min and T= 4 C°), the supernatant obtained at this stage being referred to
as bound EPS solution.
2.4.1. Analysis of total protein, humic substances -likes and polysaccharides
Protein content, expressed in mg equivalent of bovine serum albumin per gram of VSS (mg/
L for the soluble polymer), was determined according to the method of Lowry et al. (1951)
with a correction for the humic substances .Humic substances- likes were measured with the
Folin-Ciocalteau phenol reagent in the same trial as the protein by omitting the CuSO4.
Results were expressed in mg equivalent of humic substances- likes per gram of VSS (mg/L)
for the soluble polymer. Polysaccharides were determined according to the method of
Dubois et al. (1956) and the results expressed in mg equivalent of glucose per gram of VSS
(mg/ L) for the soluble polymer.
2.5. Confocal laser scanning microscopy
To characterize the extracellular polymeric substances of sludge, samples of flocs were
observed using 3D-CLSM combined with a fluorescent viability indicator (Backlight®Bacterial
Viability Kit, Molecular Probes) allowing visualization of isolated stained cells in the three-
dimensional structure of flocs (damaged or not). For the image series a Zeiss LCM 710 NLO
confocal microscope equipped with laser diode was used with an HCX 5×0.5. The band width
of the detected fluorescence wavelengths has been optimized to uniquely channel the

Results and Discussion Chapter III
194
maximum emission in sequential mode to avoid potential cross-talking. Fluorescence
emissions were recorded within 1 airy disk confocal pinhole opening and 1024 × 1024
images at a 1.36-m (x, y) pixel size were obtained. Instead of selecting a constant step size in
the vertical direction, the step size was determined by choosing start and end points in the z-
direction of the flocs, and by then selecting a number of optical sections.
2.6. Dosage the Pharmaceuticals and Personal Care Products (PPCPs) in the
wastewater
Two different analytical methods were applied to determine the concentration levels of the
PPCPs in the wastewaters samples. Water samples were enriched by liquid-solid phase (SPE)
by using Oasis HLB cartridges (6ml, 200mg) from waters. The SPE extracts were injected in
liquid chromatography mass spectrometry (LC-MS/MS). Acquisition was performed in
selected reaction monitoring (SRM) mode and tow transitions (quantification, confirmation)
were obtained for each compound. Quality control (QC) was assured by measuring two
transitions for each analyze and each internal standard, comparing retention time of analyze
with the retention time of the internal standard in each sample, duplicates, numerous
blanks, and QC standards. In global analytical error was about ~ ± 10µg/L. (this analysis was
occurred in IANSCO laboratory, Poitiers, France).
3. Results and Discussion
3.1. Reactor operation and performance
The treatment of a hospital effluent has been running during 120 days, with an operating
cycle without biofilm supports during the first of 60 days (MBR) and the addition of these
supports the 61 th day (MBBR). Lower values in term of total and soluble COD, TSS,, VSS
and total N removal were observed in the (MBR) compare to the MBBR (table 4). These
results demonstrated that the presence of supports media allowed an increase of global
microbial activity due to the increase of biomass concentration on the support and of the
SRT of fixed organisms.

Results and Discussion Chapter III
195
Table 4 showed that the removal efficiencies
Efficiency of removal % TSS VSS Total Phase Soluble Phase
COD N N COD
MBR 97,3± 1% 87,8± 1% 80,4± 5% 78± 5% 85,3± 5% 71,6± 5%
MBBR 99± 1% 97,6± 1% 94,2± 5% 84,9± 5% 84,3± 5% 90,7± 5%
The global removal efficiency (including adsorption and membrane fouling) was determined
according to Eq 1:
Removal % = 100 × [(C1 -C2) / C1]
Where:
C1 the experimental concentration determined in each reactor influent by analysis.
C2 the experimental concentration determined in each reactor effluent by the analysis.
Results measured are illustrated in Figure 2. The overall permeability for MBR at 15 days of
operations is not essentially the same by compared with the MBBR. Based on this analysis,
the performance of the membrane filtration in MBBR is significantly affected by addition the
biofilms supports media in the reactor. In our hypotheses the biofilm could be fixed on the
supports and that decreasing concentration the soluble EPS free in the reactor.
This hypothesis was confirmed with the Figure 3 which illustrated increasing fouling rate
with concentration the soluble EPS in MBR. Au contrary, the fouling rate was from 0.01 to
0.04 in MBBR although the increasing of concentration the soluble EPS. The results confirm
the importance of biofilm supports media as a means to mitigate fouling in immersed
membrane systems. These results are in agreement with findings from other studies;
(Invanovic et al., 2011; Basu et al., 2006).

Results and Discussion Chapter III
196
0 5 1 0 1 5
1 0 0
1 5 0
2 0 0
2 5 0
3 0 0
M B R M B B R
Pe
rm
ea
bil
ity
(L
MH
/ba
r)
T im e (d a y s )
C h e m ic a l c le a n in g
Figure 2 Example on changes of overall permeability during the experiment in MBR and
MBBR.
0 1 0 0 2 0 0 3 0 0 4 0 0
0 .0 0
0 .0 2
0 .0 4
0 .0 6
M B B R
C o n c e n tra t io n o f s o lu b le E P S (m g /L )
Fo
uli
ng
ra
te,(
dT
MP
/dT
, K
pa
/d)
0 1 0 0 2 0 0 3 0 0 4 0 0 5 0 0
0 .0 0
0 .0 5
0 .1 0
0 .1 5
M B R
C o n c e n tra t io n o f s o lu b le E P S (m g /L )
Fo
uli
ng
ra
te,(
dT
MP
/dT
, K
pa
/d)
Figure 3 correlations between soluble EPS and calculated fouling rate in both MBR and
MBBR reactors.
Results and Discussion Chapter III
197
3.2. Occurrence and removal of Pharmaceuticals and Personal Care Products
(PPCPs) in hospital wastewaters
The different mechanisms responsible for pharmaceutical compounds removal from hospital
wastewater a biological system are sludge sorption on organic matter and biodegradation by
microorganisms present in the wastewater (Cho et al. 2004). The total removal efficiency
(sludge sorption+ biodegradation+ membrane retention) of 27 pharmaceutical compounds
was determined for both MBBR and MBR and compared to bibliography (table5). The
concentrations of the various pharmaceutical compounds and some transformation
products during the study period were determined. (Table5) shows the concentration of the
PPCPs in influent and effluent for both reactor MBBR and MBR. It can be clearly observed
the highest removal efficiency (90±5%) or complete removal of ketoprofen, paracetamol,
ibuprofen, caffeine, metronidazole, pravastatin, atenolol in both BRM but Tramadol,
sulfamethoxazole, trimethoprim, naproxen, triclosan, metoprolol, sotalol, Losartan, carboxyl
ibuprofen, 2-hydroxy ibuprofen, epoxy carbamazepine, 4 androstene -3, 17-dione, and
iomeprol could be high removed by MBBR, while lower removal by MBR was found for them.
The total removal efficiency (sludge sorption+ biodegradation + membrane retention) of
each pharmaceutical compound was determined MBR according to
Eq 2:
Removal % = C −C / C ×
Where:
C1: the experimental concentration determined for each pharmaceutical compound in each
reactor influent by LC / (MS-MS) analysis.
C2: the experimental concentration of each pharmaceutical compound in each reactor
effluent by the LC / (MS-MS) analysis

Results and Discussion Chapter III
198
Table 5 the concentration of pharmaceutics compound in influent and effluent for both
MBBR and MB
Pharmaceutical
compound
Removal (±5%)
References Influent (µg/L) MBR MBBR
Ketoprofen 15± 10 99 97 (30%) (Jelic et al. 2011)
paracetamol 310± 10 95 98
Diclofenac 0,11± 10 42 68 (5–45 %) (Joss et al. 2005)
Naproxen 0,32± 10 34 95 (55-85 %) (Joss et al. 2005)
Ibuprofen 17± 10 99 95 (90-100 %) (Joss et al. 2005)
Tramadol 3± 10 22 92
sulfamethoxazole 21± 10 33 91 <85 % (Jelic et al. 2011
Metronidazole 7,3± 10 86 95 15–18 % (Jelic et al. 2011
Trimethoprim 10± 10 10.5 89 90% (Göbel et al. 2007)
Triclosan 0,14± 10 22 100
Hydrochlorothiazide 0,96± 10 92 45 (0-100 %) (Jelic et al. 2011
Furosemide 12± 10 83 52 35–40 % (Jelic et al. 2011
Caffeine 130± 10 96 98
Pravastatin 0,74± 10 95 95 45 % (Jelic et al. 2011
metoprolol 0,09± 10 42 95 35 % (Jelic et al. 2011
Propanolol 0,24± 10 100 25
Atenolol 1,5± 10 93 97 70 % (Jelic et al. 2011
Sotalol 2,3± 10 31.8 95 10% (Jelic et al. 2011
Carbamazepine 1± 10 58 83 < 40 % (Joss et al. 2005)
Losartan 0,2± 10 45 99 30 % (Jelic et al. 2011
Oxazepam 0,55± 10 86 15 60 % (Jelic et al. 2011
Fenofibric acid 5,6± 10 99 71
Carboxyl ibuprofen 110± 10 51.9 96 80 % (Joss et al. 2005)
2-hydroxy ibuprofen 38± 10 29.6 98
Epoxy carbamazepine 0,67± 10 69 97 40% (Joss et al. 2005)
4 androstene -3,17-dione 0,27± 10 56 99
Iomeprol 960± 10 55 96 60-80 % (Jelic et al. 2011
Results and Discussion Chapter III
199
3.3. Evolution of Extracellular polymeric substances (EPS) and their
distribution in the sludge
The EPS production under our operating conditions was determined in terms of total and
soluble EPS through the extraction method. (Fig 4) shows the concentrations of proteins,
polysaccharides and the substances humic substances- likes in the soluble EPS. The
concentrations of proteins and polysaccharides in the soluble phase increased during the 40
first days of operating in the MBR, from 4 mg/L to 20 mg/L and from 20 mg/L to 70 mg/L
respectively, before a decrease certainly due to the chemical washing. The value of these
concentrations could be due to the occurrence of pharmaceuticals compounds (Sheng et al.,
2010) or, for a part, directly brought in by the influent. Therefore, their concentrations in the
supernatant depend on their adsorption onto microbial flocs, their removal by sludge
withdrawal and their passage through the membrane in MBR (Delgado et al; 2010). While
these concentrations are globally constant for the MBBR. However the concentration of the
soluble proteins and soluble polysaccharides was lower in the MBBR. (It was between 4 to 8
mg/L and 5-20 mg/L respectively). As it is known, the occurrence of biofilms increases the
concentration of EPS fixed and this EPS are part of their structure.
On the other side, the concentrations of humic substances-like acids in the two systems are
closed, with a slow increasing. But concentrations of soluble humic substances –like were
decreased directly after addition the biofilms supports media, and then it was increased
slowly throughout the experiment.

Results and Discussion Chapter III
200
0
5
1 0
1 5
2 0
2 5
Pro
tein
s (
mg
/L)
M B R M B B R
0
5
1 0
1 5
2 0
2 5
Po
lys
ac
ch
ara
ide
s (
mg
/L)
0 2 0 4 0 6 0 8 0 1 0 0 1 2 0
0
1 0 0
2 0 0
3 0 0
4 0 0
T im e (d a y s )
Hu
mic
- li
ke
su
bs
tan
ce
s (
mg
/L)
Figure 4: Variation of concentration of proteins, polysaccharides and humic substances-like
during the experiment for tow reactors (MBBR and MBR)

Results and Discussion Chapter III
201
A
C
[1]
[2]
0
2 0
4 0
6 0
Pe
rc
en
tag
e o
f to
tal
flu
ore
se
nc
e %
a liv e c e lls
E P S
d e a d c e lls
2 d 4 8 d 6 0 d 1 2 0 d
M B R M B B R
Figure 5 Distribution of EPS in the biofilm stained with Back light ™ a series of o fo al i ages take at sa e
factors of realization (part [1]). (a) and (b) aerobic MBR at 2 and 48 days of treatment respectively, (c) and (d)
aerobic MBBR at 2and50 (d) treatment respectively. Percentage of total fluorescence intensity (part [2])
Concentration of EPS was in Blue, dead cells in red and in Green: Concentration of live bacteria in sludge
It can be postulated that the occurrence of supports allows the development of biofilm and
there by the production of EPS constitutive or sorbed on the biofilm. We also note that the
A
B
C
D
MBR MBBR
Results and Discussion Chapter III
202
EPS concentration is not stable although we felt that we were at hydraulic steady state. This
can mean that the membrane acts as a barrier especially for proteins and polysaccharides.
The occurrence of EPS on the sludge and on biofilm is confirmed with the use of a confocal
microscopy and the three-di e sio al stru ture of flo s ould e isualized ith the
arki g of EPS i lue a d ia ilit i gree . Visualizatio of flo s olle ted in the MBBR
rea tor a d of a flo olle ted i BRM rea tor after 2 a d 50 da s of e posure to
pharmaceuticals compounds is presented in (Fig 5). The comparison of the evolution of the
green and blue fluorescence during this period showed the increase of the EPS
concentration in MBR and MBBR and that confirm our chemical analyses for the soluble EPS
(bleu), but it was significantly in the MBR by compared with MBBR and that could refer to
presence the biofilm supports media and mechanism of fixation the biofilms.
4. Conclusions
In this work membrane bioreactor system was operated for 120 days with reel hospital
effluent. Biofilm supports media injected in the bioreactor after 60 days of experiment
(MBBR). The study compared the sludge performances of MBB and MBBR, treating the same
hospital wastewater, operating over a small range of solid retention time (SRT = days). The
influence of biofilm supports media and separation technique (membrane) was studied and
shed new light on the subject which will be useful for further development and optimization
of MBR.
This study reported that:
1. The MBR and MBBR were able to achieve good organic removal efficiencies, except
the VSS with the total and soluble COD. The MBBR was higher removal efficiency.
2. Tramadol sulfamethoxazole, trimethoprim, naproxen, triclosan, metoprolol, sotalol,
losartan, carboxyl ibuprofen, 2-hydroxy ibuprofen, epoxy carbamazepine, 4
androstene-3, 17-dione and iomeprol could be completed removed by MBBR, while
any removal by MBR was found for them.
3. The results show it found an increase of the retention of protein and polysaccharides
of the sludge which depended on the attached biofilms on the supports media and,
consequently the possible role of supports media in MBBR at decreasing production
the proteins and polysaccharides in the soluble phase as result the fouling of
membrane.
Results and Discussion Chapter III
203
This finding confirmed that the biofilm supports media could be played a major role in
increasing the efficiency of MBR system in treating the hospital wastewater.
References
AFNOR, NF EN ISO 10304-1, Paris.,2009. NF T 90-105, Paris .,1997.
Basu OD. Huck P.M., 2005. Impact of support media in an integrated biofilter- submerged
membrane system. Water research, 39, 4220-4228.
Bouhabila E H., 1999. Treatment the waste water by immerged membrane: Interaction
suspension /membrane, Thesis doctoral in Instute national of research (INSA) Toulouse.
Chang I. S., Lee C. H.,1998. Membrane filtration characteristics in membrane coupled
activated sludge system of physiological states of activated sludge on membrane fouling.
Desalination, 120, 221–233.
Chang I. S., Lee C. H., 1998. Membrane filtration characteristics in membrane coupled
activated sludge system the effect of physiological states of activated sludge on membrane
fouling. Desalination 120, 221–233.
Cho, J., Song, K.G., Yun, H., Ahn, K.H., Kim, J.Y., Chung, T.H., 2004. Quantitative analysis of
biological effect on membrane fouling in submerged membrane bioreactor. World Filtration
Congres 9, New Orleans, USA 18–22 April.
Delgado L. F., Faucet-Marquis V., Schetrite S., Pfohl-Leszkowicz A., Paranthoen S., Albasi C.,
2010a. Effect of cytostatic drugs on the sludge and on the mixed liquor characteristics of a
cross-flow membrane bioreactor: consequence on the process. J. Membr. Sci. 347 (1–2),
165–173.
Delgado Luis, F., Schetrite, S., Gonzalez, C., Albasi, C., 2010b. Effect of cytostatic drugs on
microbial behavior in membrane bioreactor system. Bioresour. Technol. 101 (2), 527–536.
Drews A., 2008. Does fooling in MBR depend on SMP , Desalination ; 231 : 141-149.
Göbel A., Mcardell CS., Joss A., Siegrist H., Giger W., 2007. Fate of sulfonamides, macrolides,
and trimethoprim in different wastewater treatment technologies. Sci Total Environ;
372:361–71.
Guo-Ping S., Han.Yu., Xaio.L, 2010. Extracellular polymeric substances (EPS) of microbial
aggregates in biological wastewater treatment systems: A review Biotechnology advanced.
Pages 882–894.
Jelic A., Gros M., Ginebrenda A., Cespedes-Sánchez R., Ventura F., Petrovic M., 2011.
Occurrence, partition and removal of pharmaceuticals in sewage water and sludge during
wastewater treatment. Water Res. 45:1165–76.

Results and Discussion Chapter III
204
José Luiz T., Leonardo Y., Humberto J. J., Regina de F. Peralta Muniz M., 2010.
Departamento de Engenharia Química e Engenharia de Alimentos, Universidade Federal de
Santa Catarina,, Brasil Horst Friedrich Schröder Institute of Environmental Engineering.
Joss A., Keller E., Alder A., Göbel A., Mcardell C., Ternes T., 2005. Removal of
pharmaceuticals and fragrances in biological wastewater treatment. Water Res. 39: 3139–52.
Kim J.S., Lee C.H., Chang I.S., 2001. Effect of pump shear on the performance of a crossflow
membrane bioreactor, Water Research, 35(9), 2137-2144.
Lee S. J., Choo K. H., Lee C. H., 2000. Conjunctive use of ultrafiltration with powdered
activate carbon adsorption for removal of synthetic and natural organic matter. J. of
Industrial and Engineering Chemistry, 6(6) 357–364.
Lukas K., Tamm Xing.H., yiniling.Li., Tamm K., 2002. Structure and Function of Membrane
Fusion Peptides Department of Molecular Physiology and Biological Physics, University of
Virginia, Charlottesville, VA. 22908-0736
Lee W., Kang S., Shin H., 2003. Sludge characteristics and their contribution to microfiltration
in submerged membrane bioreactors, Journal of Membrane Science, 216, 217-227.
Nagaoka H., Ueda S., Miya A., 1996. Influence of bacterial extracellular polymers on the
membrane separation activated sludge process. Water Sci. Technol. 34(9), 165–172.
Ognier S., 2002. Influence of macromolecule adsorption during filtration of a membrane
bioreactor mixed liquor suspension, Journal of Membrane Science, 209, pp. 27-37.
Visvanathan C., Ben Aim R., Parameshwaran K., 2000. Membrane separation bioreactors for
wastewater treatment, Critical Review; Environmental Science and Technology, 30(1) 1-48.
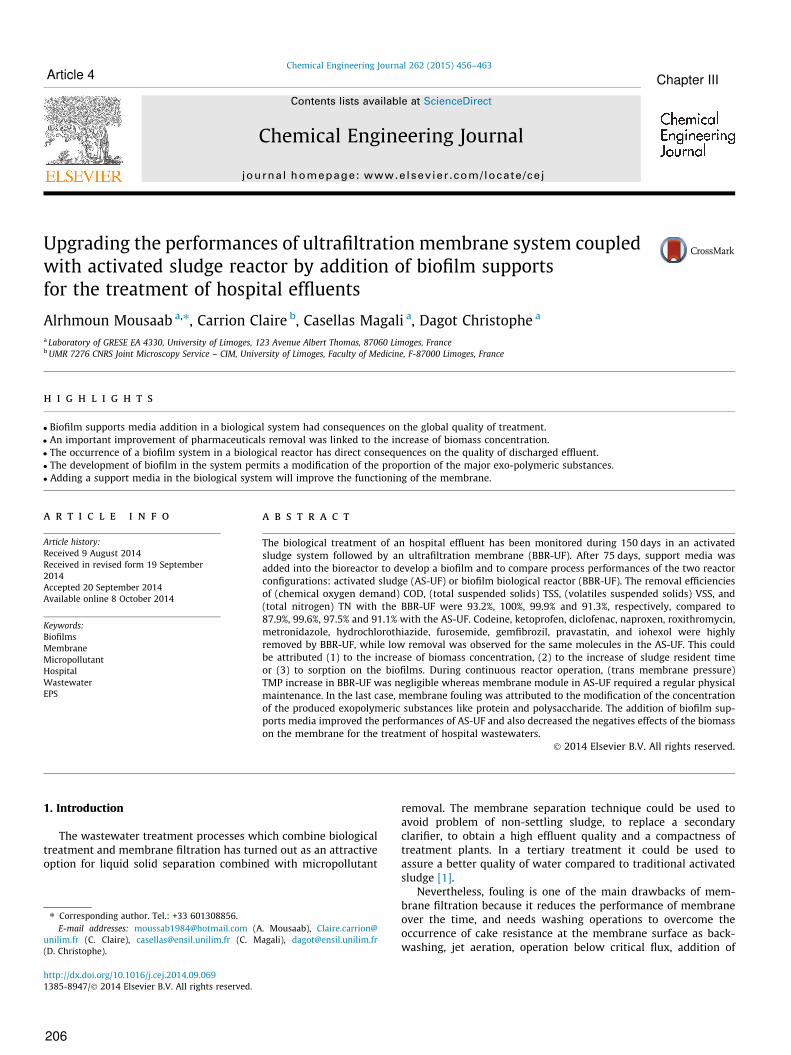
Upgrading the performances of ultrafiltration membrane system coupledwith activated sludge reactor by addition of biofilm supports
for the treatment of hospital effluents
Alrhmoun Mousaab a,⇑, Carrion Claire b, Casellas Magali a, Dagot Christophe a
a Laboratory of GRESE EA 4330, University of Limoges, 123 Avenue Albert Thomas, 87060 Limoges, FrancebUMR 7276 CNRS Joint Microscopy Service – CIM, University of Limoges, Faculty of Medicine, F-87000 Limoges, France
h i g h l i g h t s
� Biofilm supports media addition in a biological system had consequences on the global quality of treatment.
� An important improvement of pharmaceuticals removal was linked to the increase of biomass concentration.
� The occurrence of a biofilm system in a biological reactor has direct consequences on the quality of discharged effluent.
� The development of biofilm in the system permits a modification of the proportion of the major exo-polymeric substances.
� Adding a support media in the biological system will improve the functioning of the membrane.
a r t i c l e i n f o
Article history:
Received 9 August 2014
Received in revised form 19 September
2014
Accepted 20 September 2014
Available online 8 October 2014
Keywords:
Biofilms
Membrane
Micropollutant
Hospital
Wastewater
EPS
a b s t r a c t
The biological treatment of an hospital effluent has been monitored during 150 days in an activated
sludge system followed by an ultrafiltration membrane (BBR-UF). After 75 days, support media was
added into the bioreactor to develop a biofilm and to compare process performances of the two reactor
configurations: activated sludge (AS-UF) or biofilm biological reactor (BBR-UF). The removal efficiencies
of (chemical oxygen demand) COD, (total suspended solids) TSS, (volatiles suspended solids) VSS, and
(total nitrogen) TN with the BBR-UF were 93.2%, 100%, 99.9% and 91.3%, respectively, compared to
87.9%, 99.6%, 97.5% and 91.1% with the AS-UF. Codeine, ketoprofen, diclofenac, naproxen, roxithromycin,
metronidazole, hydrochlorothiazide, furosemide, gemfibrozil, pravastatin, and iohexol were highly
removed by BBR-UF, while low removal was observed for the same molecules in the AS-UF. This could
be attributed (1) to the increase of biomass concentration, (2) to the increase of sludge resident time
or (3) to sorption on the biofilms. During continuous reactor operation, (trans membrane pressure)
TMP increase in BBR-UF was negligible whereas membrane module in AS-UF required a regular physical
maintenance. In the last case, membrane fouling was attributed to the modification of the concentration
of the produced exopolymeric substances like protein and polysaccharide. The addition of biofilm sup-
ports media improved the performances of AS-UF and also decreased the negatives effects of the biomass
on the membrane for the treatment of hospital wastewaters.
� 2014 Elsevier B.V. All rights reserved.
1. Introduction
The wastewater treatment processes which combine biological
treatment and membrane filtration has turned out as an attractive
option for liquid solid separation combined with micropollutant
removal. The membrane separation technique could be used to
avoid problem of non-settling sludge, to replace a secondary
clarifier, to obtain a high effluent quality and a compactness of
treatment plants. In a tertiary treatment it could be used to
assure a better quality of water compared to traditional activated
sludge [1].
Nevertheless, fouling is one of the main drawbacks of mem-
brane filtration because it reduces the performance of membrane
over the time, and needs washing operations to overcome the
occurrence of cake resistance at the membrane surface as back-
washing, jet aeration, operation below critical flux, addition of
http://dx.doi.org/10.1016/j.cej.2014.09.069
1385-8947/� 2014 Elsevier B.V. All rights reserved.
⇑ Corresponding author. Tel.: +33 601308856.
E-mail addresses: [email protected] (A. Mousaab), Claire.carrion@
unilim.fr (C. Claire), [email protected] (C. Magali), [email protected]
(D. Christophe).
Chemical Engineering Journal 262 (2015) 456–463
Contents lists available at ScienceDirect
Chemical Engineering Journal
journal homepage: www.elsevier .com/locate /ce j
Article 4 Chapter III
206

coagulants [2]. When the fouling occurs, a thick gel layer and cake
layer are formed on and into the membrane, causing the decrease
of the permeate flux and the necessity to clean the membrane.
Fouling is usually attributed to a number of parameters, such as
sludge particle deposition, adhesion of macromolecules as extra-
cellular polymeric substances (EPS) produced by bacteria in the
biological system and pore clogging by small molecules [3]. Soluble
EPS (soluble macromolecules and colloids) can enter the mem-
brane pores, leading to a reduction of total section area of mem-
brane pores causing pore plugging and increasing the membrane
resistance [4].
Most of the studies were focused on minimizing the cake for-
mation on the membrane surface, but another way is to use a sup-
ports media in the bioreactor to fix the biomass and thereby to
limit the primary sources of cake layer and minimize the fouling
[5–7]. As an example, Basu and Huck [8] studied the effect of sup-
port media in integrated biofilter submerged membrane system on
membrane fouling rate and on water quality parameters. It was
found an observable difference in the membrane fouling rates
between the two processes and a fouling at least two times slower
with the support media system compared to the non-support sys-
tem. The authors also suggested that the support media enhanced
the membrane surface scouring which improved the removal
efficiency.
For this, the implemented process treatment consisted of a bio-
logical basin coupled to an external membrane module. After
75 days of running with planktonic biomass, plastic carriers were
added to allow the development of a biofilm within the same
reactor.
The objectives of this presented work, applied to the evaluation
of pharmaceutical residues removal by biological treatment cou-
pled with membrane filtration, are in a short term (i) to increase
the performance of a classical AS-UF system by adding support
media but also (ii) to evaluate in the same time the evolution of
membrane fouling and (iii) to demonstrate, in fine, the relation of
this physical clogging with the biochemical structure of bacterial
flocs and the EPS production.
2. Materials and methods
2.1. Study area
The hospital effluent (HE) samples used in this study were col-
lected from the sewers deserving the clinical activities of hospital
(Limoges, France). The average characteristics of wastewater and
those of activated sludge used as inoculum during the experiments
are detailed in the Table 1.
2.2. Reactors and operating conditions
The bioreactor had a working volume of 400 L equipped with a
Ruston turbine (80–120 rpm) installed to keep the bioreactor com-
pletely mixed. An ultrafiltration membrane module (ALTING,
MICRODYN, France), consisting of a module of hollow fiber in poly-
propylene, developing 1 m2 of surface area for a pore size of
0.2 lm, was positioned in an external circulation loop (Fig. 1).
The influent permeate flow had an average value of 100 L/ day.
The average values of hydraulic retention time (HRT) and of sludge
retention time (SRT) were respectively of 22 h and 20 days, the
temperature of 18–20 �C and the pH varied from 6.8 to 7.9.
Dissolved oxygen levels were automatically maintained
between 1 and 4.5 mg O2/L. The cycle of operation (feeding, pump-
ing, decantation, filtration) was conducted and supervised by a
programmed automat (AUTOMAT: market) (Table 2). Pressures
were measured at the inlet (P1), outlet (P2), and permeate side of
the membrane (P3) in order to determine the transmembrane
pressure (TMP). At constant permeate flux, TMP indicating the
extent of membrane fouling was calculated as in Eq. (1):
Table 1
Physicochemical characteristics of the hospital effluents (HE) and sludge.
COD (mg/L) N (mg/L) TSS (g/L) TVSS (g/L)
Total Soluble Total Soluble
HE 318 ± 5 185.5 ± 5 122.4 ± 4 80 ± 4 0.2 ± 0.05 0.054 ± 0.05
Sludge 1174 ± 5 144 ± 5 – – 5.9 ± 0.05 0.121 ± 0.05
Fig. 1. Activated sludge followed by ultrafiltration system (AS-UF).
A. Mousaab et al. / Chemical Engineering Journal 262 (2015) 456–463 457
207
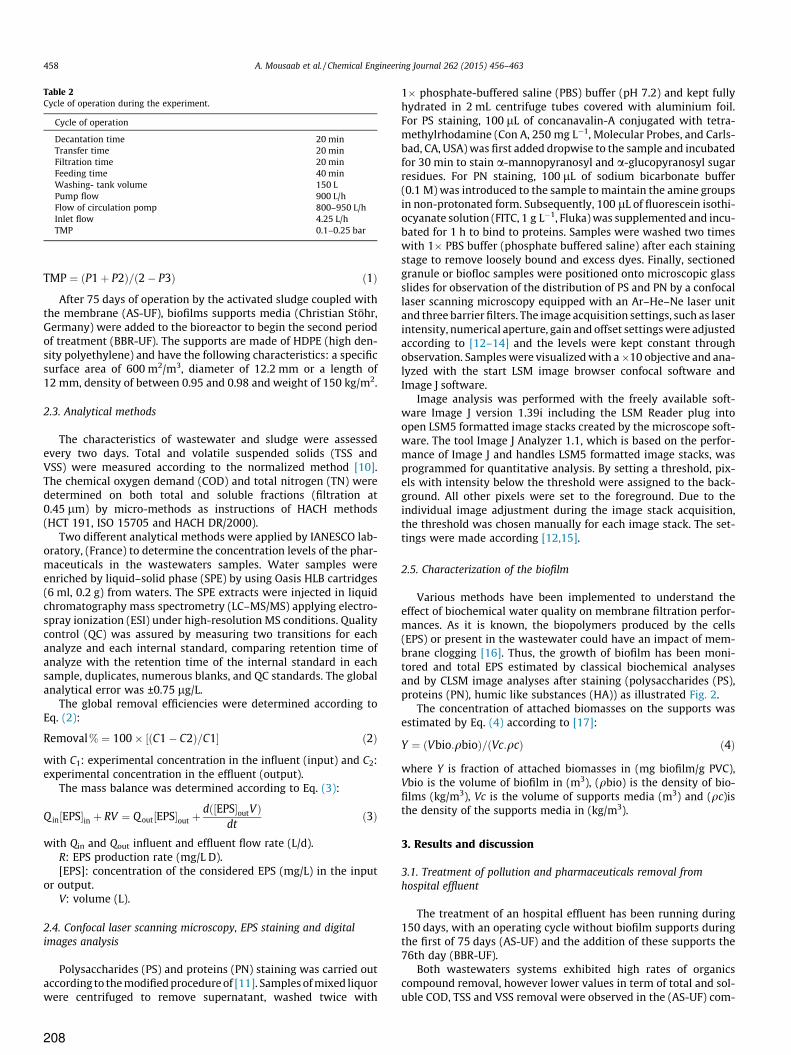
TMP ¼ ðP1þ P2Þ=ð2� P3Þ ð1Þ
After 75 days of operation by the activated sludge coupled with
the membrane (AS-UF), biofilms supports media (Christian Stöhr,
Germany) were added to the bioreactor to begin the second period
of treatment (BBR-UF). The supports are made of HDPE (high den-
sity polyethylene) and have the following characteristics: a specific
surface area of 600 m2/m3, diameter of 12.2 mm or a length of
12 mm, density of between 0.95 and 0.98 and weight of 150 kg/m2.
2.3. Analytical methods
The characteristics of wastewater and sludge were assessed
every two days. Total and volatile suspended solids (TSS and
VSS) were measured according to the normalized method [10].
The chemical oxygen demand (COD) and total nitrogen (TN) were
determined on both total and soluble fractions (filtration at
0.45 lm) by micro-methods as instructions of HACH methods
(HCT 191, ISO 15705 and HACH DR/2000).
Two different analytical methods were applied by IANESCO lab-
oratory, (France) to determine the concentration levels of the phar-
maceuticals in the wastewaters samples. Water samples were
enriched by liquid–solid phase (SPE) by using Oasis HLB cartridges
(6 ml, 0.2 g) from waters. The SPE extracts were injected in liquid
chromatography mass spectrometry (LC–MS/MS) applying electro-
spray ionization (ESI) under high-resolution MS conditions. Quality
control (QC) was assured by measuring two transitions for each
analyze and each internal standard, comparing retention time of
analyze with the retention time of the internal standard in each
sample, duplicates, numerous blanks, and QC standards. The global
analytical error was ±0.75 lg/L.
The global removal efficiencies were determined according to
Eq. (2):
Removal% ¼ 100� ½ðC1� C2Þ=C1� ð2Þ
with C1: experimental concentration in the influent (input) and C2:
experimental concentration in the effluent (output).
The mass balance was determined according to Eq. (3):
Q in½EPS�in þ RV ¼ Qout½EPS�out þdð½EPS�outVÞ
dtð3Þ
with Qin and Qout influent and effluent flow rate (L/d).
R: EPS production rate (mg/L D).
[EPS]: concentration of the considered EPS (mg/L) in the input
or output.
V: volume (L).
2.4. Confocal laser scanning microscopy, EPS staining and digital
images analysis
Polysaccharides (PS) and proteins (PN) staining was carried out
according to themodifiedprocedureof [11]. Samplesofmixed liquor
were centrifuged to remove supernatant, washed twice with
1� phosphate-buffered saline (PBS) buffer (pH 7.2) and kept fully
hydrated in 2 mL centrifuge tubes covered with aluminium foil.
For PS staining, 100 lL of concanavalin-A conjugated with tetra-
methylrhodamine (Con A, 250 mg L�1, Molecular Probes, and Carls-
bad, CA, USA) was first added dropwise to the sample and incubated
for 30 min to stain a-mannopyranosyl and a-glucopyranosyl sugar
residues. For PN staining, 100 lL of sodium bicarbonate buffer
(0.1 M) was introduced to the sample to maintain the amine groups
in non-protonated form. Subsequently, 100 lL of fluorescein isothi-
ocyanate solution (FITC, 1 g L�1, Fluka)was supplemented and incu-
bated for 1 h to bind to proteins. Samples were washed two times
with 1� PBS buffer (phosphate buffered saline) after each staining
stage to remove loosely bound and excess dyes. Finally, sectioned
granule or biofloc samples were positioned onto microscopic glass
slides for observation of the distribution of PS and PN by a confocal
laser scanning microscopy equipped with an Ar–He–Ne laser unit
and three barrier filters. The image acquisition settings, such as laser
intensity, numerical aperture, gain and offset settingswere adjusted
according to [12–14] and the levels were kept constant through
observation. Sampleswere visualizedwith a�10 objective and ana-
lyzed with the start LSM image browser confocal software and
Image J software.
Image analysis was performed with the freely available soft-
ware Image J version 1.39i including the LSM Reader plug into
open LSM5 formatted image stacks created by the microscope soft-
ware. The tool Image J Analyzer 1.1, which is based on the perfor-
mance of Image J and handles LSM5 formatted image stacks, was
programmed for quantitative analysis. By setting a threshold, pix-
els with intensity below the threshold were assigned to the back-
ground. All other pixels were set to the foreground. Due to the
individual image adjustment during the image stack acquisition,
the threshold was chosen manually for each image stack. The set-
tings were made according [12,15].
2.5. Characterization of the biofilm
Various methods have been implemented to understand the
effect of biochemical water quality on membrane filtration perfor-
mances. As it is known, the biopolymers produced by the cells
(EPS) or present in the wastewater could have an impact of mem-
brane clogging [16]. Thus, the growth of biofilm has been moni-
tored and total EPS estimated by classical biochemical analyses
and by CLSM image analyses after staining (polysaccharides (PS),
proteins (PN), humic like substances (HA)) as illustrated Fig. 2.
The concentration of attached biomasses on the supports was
estimated by Eq. (4) according to [17]:
Y ¼ ðVbio:qbioÞ=ðVc:qcÞ ð4Þ
where Y is fraction of attached biomasses in (mg biofilm/g PVC),
Vbio is the volume of biofilm in (m3), (qbio) is the density of bio-
films (kg/m3), Vc is the volume of supports media (m3) and (qc)is
the density of the supports media in (kg/m3).
3. Results and discussion
3.1. Treatment of pollution and pharmaceuticals removal from
hospital effluent
The treatment of an hospital effluent has been running during
150 days, with an operating cycle without biofilm supports during
the first of 75 days (AS-UF) and the addition of these supports the
76th day (BBR-UF).
Both wastewaters systems exhibited high rates of organics
compound removal, however lower values in term of total and sol-
uble COD, TSS and VSS removal were observed in the (AS-UF) com-
Table 2
Cycle of operation during the experiment.
Cycle of operation
Decantation time 20 min
Transfer time 20 min
Filtration time 20 min
Feeding time 40 min
Washing- tank volume 150 L
Pump flow 900 L/h
Flow of circulation pomp 800–950 L/h
Inlet flow 4.25 L/h
TMP 0.1–0.25 bar
458 A. Mousaab et al. / Chemical Engineering Journal 262 (2015) 456–463
208
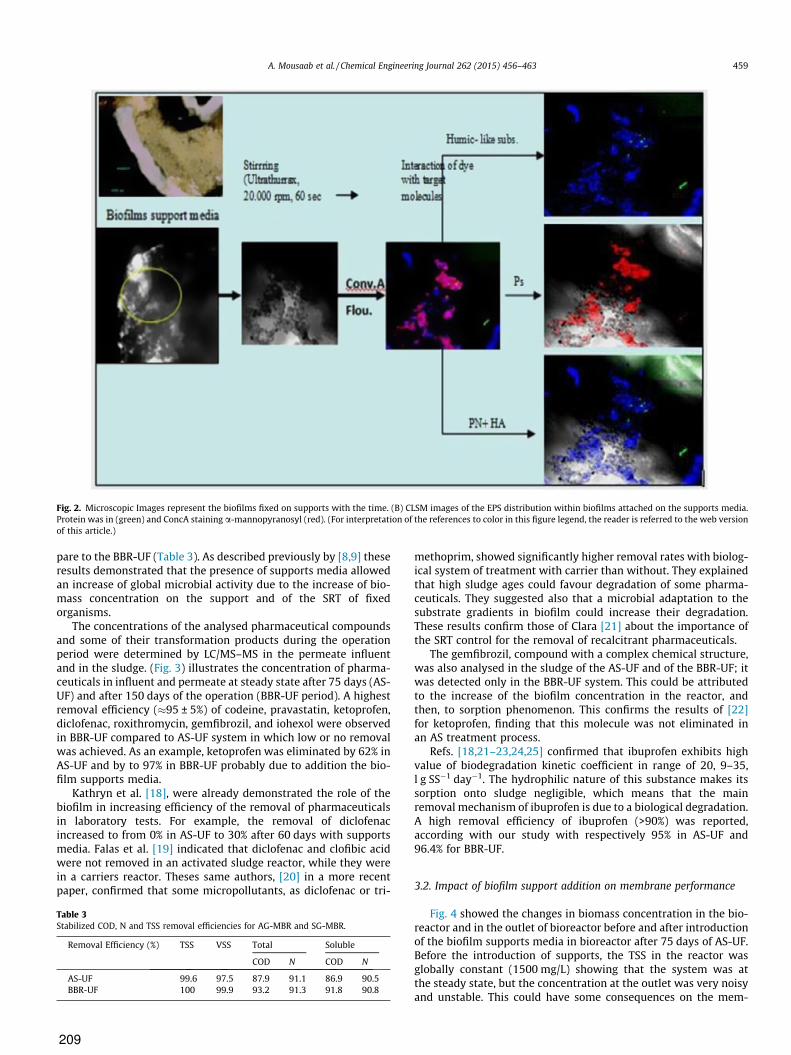
pare to the BBR-UF (Table 3). As described previously by [8,9] these
results demonstrated that the presence of supports media allowed
an increase of global microbial activity due to the increase of bio-
mass concentration on the support and of the SRT of fixed
organisms.
The concentrations of the analysed pharmaceutical compounds
and some of their transformation products during the operation
period were determined by LC/MS–MS in the permeate influent
and in the sludge. (Fig. 3) illustrates the concentration of pharma-
ceuticals in influent and permeate at steady state after 75 days (AS-
UF) and after 150 days of the operation (BBR-UF period). A highest
removal efficiency (�95 ± 5%) of codeine, pravastatin, ketoprofen,
diclofenac, roxithromycin, gemfibrozil, and iohexol were observed
in BBR-UF compared to AS-UF system in which low or no removal
was achieved. As an example, ketoprofen was eliminated by 62% in
AS-UF and by to 97% in BBR-UF probably due to addition the bio-
film supports media.
Kathryn et al. [18], were already demonstrated the role of the
biofilm in increasing efficiency of the removal of pharmaceuticals
in laboratory tests. For example, the removal of diclofenac
increased to from 0% in AS-UF to 30% after 60 days with supports
media. Falas et al. [19] indicated that diclofenac and clofibic acid
were not removed in an activated sludge reactor, while they were
in a carriers reactor. Theses same authors, [20] in a more recent
paper, confirmed that some micropollutants, as diclofenac or tri-
methoprim, showed significantly higher removal rates with biolog-
ical system of treatment with carrier than without. They explained
that high sludge ages could favour degradation of some pharma-
ceuticals. They suggested also that a microbial adaptation to the
substrate gradients in biofilm could increase their degradation.
These results confirm those of Clara [21] about the importance of
the SRT control for the removal of recalcitrant pharmaceuticals.
The gemfibrozil, compound with a complex chemical structure,
was also analysed in the sludge of the AS-UF and of the BBR-UF; it
was detected only in the BBR-UF system. This could be attributed
to the increase of the biofilm concentration in the reactor, and
then, to sorption phenomenon. This confirms the results of [22]
for ketoprofen, finding that this molecule was not eliminated in
an AS treatment process.
Refs. [18,21–23,24,25] confirmed that ibuprofen exhibits high
value of biodegradation kinetic coefficient in range of 20, 9–35,
l g SS�1 day�1. The hydrophilic nature of this substance makes its
sorption onto sludge negligible, which means that the main
removal mechanism of ibuprofen is due to a biological degradation.
A high removal efficiency of ibuprofen (>90%) was reported,
according with our study with respectively 95% in AS-UF and
96.4% for BBR-UF.
3.2. Impact of biofilm support addition on membrane performance
Fig. 4 showed the changes in biomass concentration in the bio-
reactor and in the outlet of bioreactor before and after introduction
of the biofilm supports media in bioreactor after 75 days of AS-UF.
Before the introduction of supports, the TSS in the reactor was
globally constant (1500 mg/L) showing that the system was at
the steady state, but the concentration at the outlet was very noisy
and unstable. This could have some consequences on the mem-
Fig. 2. Microscopic Images represent the biofilms fixed on supports with the time. (B) CLSM images of the EPS distribution within biofilms attached on the supports media.
Protein was in (green) and ConcA staining a-mannopyranosyl (red). (For interpretation of the references to color in this figure legend, the reader is referred to the web version
of this article.)
Table 3
Stabilized COD, N and TSS removal efficiencies for AG-MBR and SG-MBR.
Removal Efficiency (%) TSS VSS Total Soluble
COD N COD N
AS-UF 99.6 97.5 87.9 91.1 86.9 90.5
BBR-UF 100 99.9 93.2 91.3 91.8 90.8
A. Mousaab et al. / Chemical Engineering Journal 262 (2015) 456–463 459
209

brane filtration system operation. After the addition of supports,
the TSS concentration (Biofilm + free cells) doubled to a stable con-
centration of 3000 mg/L while the TSS concentration at the outlet
decreased to a stable concentration of 10 mg/L.
Because an increase of TSS in the discharged water could have
some consequences on the quality of the filtration due to the mem-
brane fouling, the TMP was measured. Fig. 5 showed that in AS-UF
system, TMP was maintained around 15–25 kPa during 75 days of
continuous reactor operation (0–75 days). On day 75, when bio-
films supports media were added in BBR-UF, the TMP was reduced
to reach about 17 kpa indicating a restoration of membrane per-
meability and a stabilization of the flux around 50 L h�1. This fact
was observed without the use of chemical washing. This result
suggests that the presence of support media notably improved
the membrane performances.
3.3. Biofilm growth and EPS characterisation and localisation after
support media addition
Fig. 6 showed distinctly the increase of thickness of biofilms and
the concentration of attached biomasses on the supports estimated
according Eq. (3).
After 110 days of experiment the average thicknesses in middle
of the total biofilm on supports was 400 lm measured by bifocal
inversed microscopy (STEMi V6 coupled with software Videomet).
Images of confocal microscopy of biofilms fixed on the supports
media after staining confirm the occurrence of EPS in biofilm.
Soluble and total EPS were represented in the Fig. 7a and b. The
total and soluble EPS concentrations, their composition (PN, PS,
HA) and their evolutions by biochemical analyses and microscopic
techniques with fluorescent staining were determined during the
Fig. 3. Concentrations and removal rates of PPCPs in both AS-UF and BBR-UF systems.
Fig. 4. TSS (mg/L) in the bioreactor and in the outlet before and after introduction the biofilm supports media.
460 A. Mousaab et al. / Chemical Engineering Journal 262 (2015) 456–463
210

150 days of operating illustrated in Fig. 8. Significant difference
could be found between the first period (before 75 days) and the
second period (after 75 days) of operation.
Increasing concentrations of PN, PS, HA in both total and solu-
ble phases was observed in the 20 first days of operation followed
by a decreased of the PN, PS and HA concentrations to reach
about 25, 15 and 180 mg/L, respectively for the total phase and
10, 8 and 148 mg/L, respectively for the soluble phase. The evolu-
tion of these concentrations could be due to the biomass acclima-
tion to the hospital effluent, to a bacterial reaction against the
occurrence of pharmaceuticals compounds in the effluent [26]
or, for a part, directly by a certain quantity of EPS brought in
by the influent (see after).
After 75 days and the adding of supports, these concentrations
of PN, PS, HA were globally constant to reach the values of 5–
10 mg/L, 30–45 mg/L and 160–220 mg/L, respectively for the total
phase and 3–8 mg/L, 10–20 mg/L and 175 mg/L, respectively for
the soluble phase.
3.4. Explanation of membrane clogging improvement trough EPS mass
balance
The occurrence of biofilms increases the concentration of EPS,
which are intrinsic of their structure. Therefore, their concentra-
tions in the supernatant depend on their adsorption onto microbial
flocs, their removal by sludge clogging and their passage through
the membrane [27]. Presence of the biofilm supports media in
the sludge was believed to play a significant role at accumulation
and absorbing the biofilm and consequently, changes the concen-
tration of EPS in the reactor. To verify the influence of the quality
of wastewater on the occurrence of EPS in the system, a mass bal-
ance between input and output has been done (Eq. (3)) considering
the concentration of PS, PN and HA in the input and a average flow
rate.
The result confirmed a production per day of EPS, especially for
PS and HA with 20 mg/d and 250 mg/d respectively. The results
showed that water quality had a minor influence compare to the
EPS production by the microorganisms.
The effect of the enhancement of PS and HA, and especially the
decrease of PN is directly correlated with the improvement of
membrane filtration because it is nowwell known that the concen-
tration of a protein was one of the reason of membrane clogging
and fouling as shown in [27].
The evolution of the EPS fluorescence during this period showed
the decrease of proteins, the increase of polysaccharides and rela-
tive stability of the humic-like substances after the addition of sup-
port media (Fig. 9). These observations were in agreement with our
chemicals analyzes for the EPS compounds during the experiment.
It confirmed the importance of EPS, especially proteins, in the bio-
fouling phenomena, and the possibility of the control of the effi-
ciency of a membrane system by a biological-based strategy, as
suggested by [28].
Fig. 5. Transmembrane pressures and permeate flux of BBR-UF and classical MBR as afunction of operation time.
Fig. 6. Evolution of the thickness and attached biomasses on supports media versus time.
A. Mousaab et al. / Chemical Engineering Journal 262 (2015) 456–463 461
211

Fig. 7. Variation of concentration of total EPS (a) and soluble EPS (b) in versus of operations time (day).
Fig. 8. CLSM images of the EPS distribution within AS-UF and BBR-UF flocs. Images were obtained at 10� magnification.
462 A. Mousaab et al. / Chemical Engineering Journal 262 (2015) 456–463
212
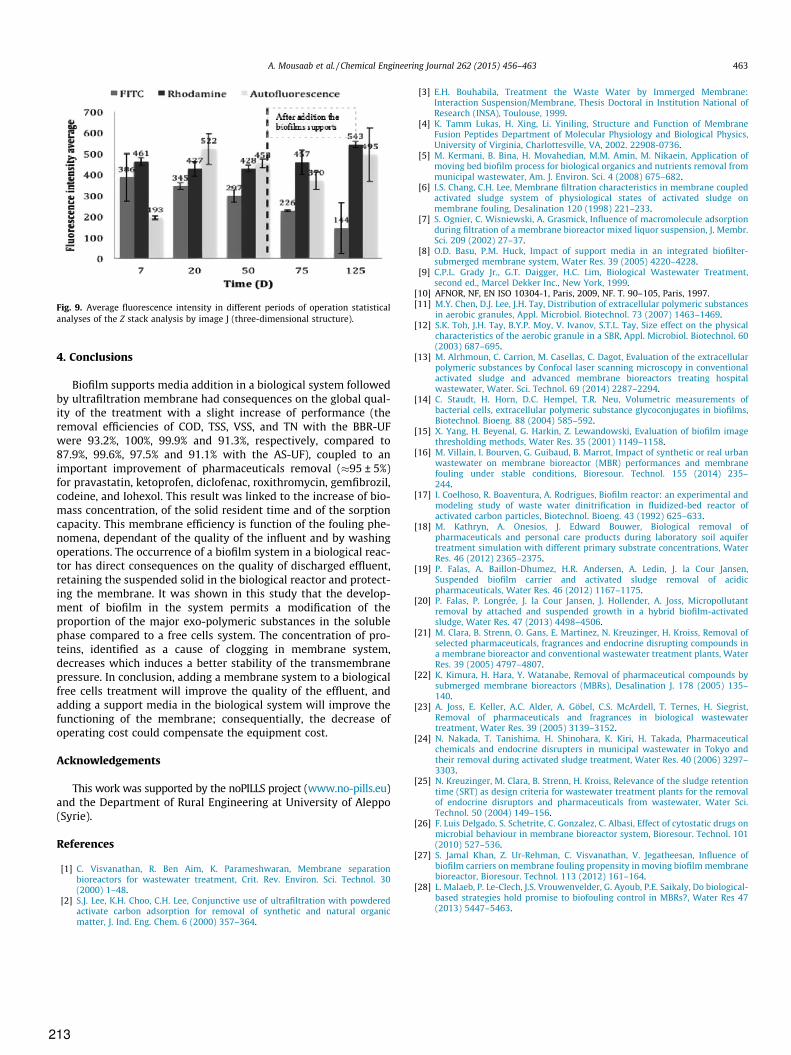
4. Conclusions
Biofilm supports media addition in a biological system followed
by ultrafiltration membrane had consequences on the global qual-
ity of the treatment with a slight increase of performance (the
removal efficiencies of COD, TSS, VSS, and TN with the BBR-UF
were 93.2%, 100%, 99.9% and 91.3%, respectively, compared to
87.9%, 99.6%, 97.5% and 91.1% with the AS-UF), coupled to an
important improvement of pharmaceuticals removal (�95 ± 5%)
for pravastatin, ketoprofen, diclofenac, roxithromycin, gemfibrozil,
codeine, and Iohexol. This result was linked to the increase of bio-
mass concentration, of the solid resident time and of the sorption
capacity. This membrane efficiency is function of the fouling phe-
nomena, dependant of the quality of the influent and by washing
operations. The occurrence of a biofilm system in a biological reac-
tor has direct consequences on the quality of discharged effluent,
retaining the suspended solid in the biological reactor and protect-
ing the membrane. It was shown in this study that the develop-
ment of biofilm in the system permits a modification of the
proportion of the major exo-polymeric substances in the soluble
phase compared to a free cells system. The concentration of pro-
teins, identified as a cause of clogging in membrane system,
decreases which induces a better stability of the transmembrane
pressure. In conclusion, adding a membrane system to a biological
free cells treatment will improve the quality of the effluent, and
adding a support media in the biological system will improve the
functioning of the membrane; consequentially, the decrease of
operating cost could compensate the equipment cost.
Acknowledgements
This work was supported by the noPILLS project (www.no-pills.eu)
and the Department of Rural Engineering at University of Aleppo
(Syrie).
References
[1] C. Visvanathan, R. Ben Aim, K. Parameshwaran, Membrane separationbioreactors for wastewater treatment, Crit. Rev. Environ. Sci. Technol. 30(2000) 1–48.
[2] S.J. Lee, K.H. Choo, C.H. Lee, Conjunctive use of ultrafiltration with powderedactivate carbon adsorption for removal of synthetic and natural organicmatter, J. Ind. Eng. Chem. 6 (2000) 357–364.
[3] E.H. Bouhabila, Treatment the Waste Water by Immerged Membrane:Interaction Suspension/Membrane, Thesis Doctoral in Institution National ofResearch (INSA), Toulouse, 1999.
[4] K. Tamm Lukas, H. Xing, Li. Yiniling, Structure and Function of MembraneFusion Peptides Department of Molecular Physiology and Biological Physics,University of Virginia, Charlottesville, VA, 2002. 22908-0736.
[5] M. Kermani, B. Bina, H. Movahedian, M.M. Amin, M. Nikaein, Application ofmoving bed biofilm process for biological organics and nutrients removal frommunicipal wastewater, Am. J. Environ. Sci. 4 (2008) 675–682.
[6] I.S. Chang, C.H. Lee, Membrane filtration characteristics in membrane coupledactivated sludge system of physiological states of activated sludge onmembrane fouling, Desalination 120 (1998) 221–233.
[7] S. Ognier, C. Wisniewski, A. Grasmick, Influence of macromolecule adsorptionduring filtration of a membrane bioreactor mixed liquor suspension, J. Membr.Sci. 209 (2002) 27–37.
[8] O.D. Basu, P.M. Huck, Impact of support media in an integrated biofilter-submerged membrane system, Water Res. 39 (2005) 4220–4228.
[9] C.P.L. Grady Jr., G.T. Daigger, H.C. Lim, Biological Wastewater Treatment,second ed., Marcel Dekker Inc., New York, 1999.
[10] AFNOR, NF, EN ISO 10304-1, Paris, 2009, NF. T. 90–105, Paris, 1997.[11] M.Y. Chen, D.J. Lee, J.H. Tay, Distribution of extracellular polymeric substances
in aerobic granules, Appl. Microbiol. Biotechnol. 73 (2007) 1463–1469.[12] S.K. Toh, J.H. Tay, B.Y.P. Moy, V. Ivanov, S.T.L. Tay, Size effect on the physical
characteristics of the aerobic granule in a SBR, Appl. Microbiol. Biotechnol. 60(2003) 687–695.
[13] M. Alrhmoun, C. Carrion, M. Casellas, C. Dagot, Evaluation of the extracellularpolymeric substances by Confocal laser scanning microscopy in conventionalactivated sludge and advanced membrane bioreactors treating hospitalwastewater, Water. Sci. Technol. 69 (2014) 2287–2294.
[14] C. Staudt, H. Horn, D.C. Hempel, T.R. Neu, Volumetric measurements ofbacterial cells, extracellular polymeric substance glycoconjugates in biofilms,Biotechnol. Bioeng. 88 (2004) 585–592.
[15] X. Yang, H. Beyenal, G. Harkin, Z. Lewandowski, Evaluation of biofilm imagethresholding methods, Water Res. 35 (2001) 1149–1158.
[16] M. Villain, I. Bourven, G. Guibaud, B. Marrot, Impact of synthetic or real urbanwastewater on membrane bioreactor (MBR) performances and membranefouling under stable conditions, Bioresour. Technol. 155 (2014) 235–244.
[17] I. Coelhoso, R. Boaventura, A. Rodrigues, Biofilm reactor: an experimental andmodeling study of waste water dinitrification in fluidized-bed reactor ofactivated carbon particles, Biotechnol. Bioeng. 43 (1992) 625–633.
[18] M. Kathryn, A. Onesios, J. Edward Bouwer, Biological removal ofpharmaceuticals and personal care products during laboratory soil aquifertreatment simulation with different primary substrate concentrations, WaterRes. 46 (2012) 2365–2375.
[19] P. Falas, A. Baillon-Dhumez, H.R. Andersen, A. Ledin, J. la Cour Jansen,Suspended biofilm carrier and activated sludge removal of acidicpharmaceuticals, Water Res. 46 (2012) 1167–1175.
[20] P. Falas, P. Longrée, J. la Cour Jansen, J. Hollender, A. Joss, Micropollutantremoval by attached and suspended growth in a hybrid biofilm-activatedsludge, Water Res. 47 (2013) 4498–4506.
[21] M. Clara, B. Strenn, O. Gans, E. Martinez, N. Kreuzinger, H. Kroiss, Removal ofselected pharmaceuticals, fragrances and endocrine disrupting compounds ina membrane bioreactor and conventional wastewater treatment plants, WaterRes. 39 (2005) 4797–4807.
[22] K. Kimura, H. Hara, Y. Watanabe, Removal of pharmaceutical compounds bysubmerged membrane bioreactors (MBRs), Desalination J. 178 (2005) 135–140.
[23] A. Joss, E. Keller, A.C. Alder, A. Göbel, C.S. McArdell, T. Ternes, H. Siegrist,Removal of pharmaceuticals and fragrances in biological wastewatertreatment, Water Res. 39 (2005) 3139–3152.
[24] N. Nakada, T. Tanishima, H. Shinohara, K. Kiri, H. Takada, Pharmaceuticalchemicals and endocrine disrupters in municipal wastewater in Tokyo andtheir removal during activated sludge treatment, Water Res. 40 (2006) 3297–3303.
[25] N. Kreuzinger, M. Clara, B. Strenn, H. Kroiss, Relevance of the sludge retentiontime (SRT) as design criteria for wastewater treatment plants for the removalof endocrine disruptors and pharmaceuticals from wastewater, Water Sci.Technol. 50 (2004) 149–156.
[26] F. Luis Delgado, S. Schetrite, C. Gonzalez, C. Albasi, Effect of cytostatic drugs onmicrobial behaviour in membrane bioreactor system, Bioresour. Technol. 101(2010) 527–536.
[27] S. Jamal Khan, Z. Ur-Rehman, C. Visvanathan, V. Jegatheesan, Influence ofbiofilm carriers on membrane fouling propensity in moving biofilmmembranebioreactor, Bioresour. Technol. 113 (2012) 161–164.
[28] L. Malaeb, P. Le-Clech, J.S. Vrouwenvelder, G. Ayoub, P.E. Saikaly, Do biological-based strategies hold promise to biofouling control in MBRs?, Water Res 47(2013) 5447–5463.
Fig. 9. Average fluorescence intensity in different periods of operation statistical
analyses of the Z stack analysis by image J (three-dimensional structure).
A. Mousaab et al. / Chemical Engineering Journal 262 (2015) 456–463 463
213

Article 5 Chapter III
214
Efficacité du charbon actif en grain modifié couplé à un
bioréacteur à membrane pour le traitement de
micropolluant organique
Mousaab Alrhmoun, Magali Casellas, Michel Baudu, Christophe Dagot
1. Laboratory of GRESE EA 4330, university of Limoges 123 Avenue Albert Thomas, 87060 Limoges
Article publié dans dans International Journal of Chemical, Nuclear, Metallurgical and
Materials Engineering, 8, 1, (2014)
Ce t avail pa t toujou s du p i ipe de l’a lio atio de l’ li i atio des composés pharmaceutiques des effluents hospitaliers. La
configuration choisie dans ce cas est le système à boue activée, suivi
d’u e e a e d’ult afilt atio , suivi pa u e olo e de ha o a tif e g ai , do t l’o je tif est l’ li i atio des pollua ts siduels. La colonne de CAG a été divisée en 3 parties, et le charbon traité
diff e e t da s ha u e d’elle lavage a ide, sa s lavage, et lavage asi ue da s l’o je tif de odifie les p op i t s du ha o et ainsi de capter le maximum de molécules, malgré leurs différences
de propriétés physico-chimiques.
Comme dans les cas précédent, et lors de 275 jours de traitement, les
sultats d’ pu atio esu s su les pa a t es lassi ues so t t s bons.
Les analyses des résidus médicamenteux ont portés sur 21 composés
pharma euti ues, da s l’efflue t, e so tie de a teu membranaire, et suite aux colonnes de GAC modifié. Certains
composés sont bien éliminés par le traitement biologique
membranaire (ketoprofène, naproxène, paracétamol, ibuprofène,
caféine, gemfibrozil, pravastatin, carboxyl-ibuprofène, iohéxol). Les
premiers résultats du couplage MBR – GAC ont montré une
élimination proche de 100% sur les différentes molécules analysées
résiduels.

�
��������—The aim of the study is to improve removal of trace
organic contaminants dissolved in activated sludge by the process of
filtration with membrane bioreactor combined with modified
activated carbon, for a maximum removal of organic compounds
characterized by low molecular weight. Special treatment was
conducted in laboratory on activated carbon. Tow reaction
parameters: the pH of aqueous middle and the type of granular
activated carbon were very important to improve the removal and to
motivate the electrostatic Interactions of organic compounds with
modified activated carbon in addition to physical adsorption, ligand
exchange or complexation on the surface activated carbon. The
results indicate that modified activated carbon has a strong impact in
removal 21 of organic contaminants and in percentage of 100% of the
process.
���� �—Activated carbon, organic contaminants, Membrane
bioreactor.
I.� INTRODUCTION
N the world, the question of presence the micropolluant as
pharmaceuticals and personal care products (PPCPs) in
water is one of main problems of environment, because of
sanitary and dangerous consequences for this type of
micropolluant and the insufficiency of purification networks.
Hospitals are important sources of these compounds: a great
variety of micro2contaminants result from diagnostic,
laboratory and research activities on one side and medicine
excretion by patients on the other. They include active
principles of drugs and their metabolites, chemicals, heavy
metals, disinfectants and specific detergents for endoscopes
and other instruments, radioactive markers and iodinated
contrast media [1], [2]. In France, the total number of hospitals
has raised from 1540 in 1990 to 2856 in 2005. Environ
1.071.000 m3/d hospital wastewater was generated,
corresponding to approximately 5 % of municipal wastewater
in 2005.
The Membrane Bioreactor (MBR) technique is a promising
alternative to conventional treatment as membranes can
achieve a high degree of water purification. The combination
Of membrane filtration and biological treatment avoids
secondary clarification and tertiary steps [3]. Recently, more
attention has been paid to the membrane bioreactor (MBR)
technology for hospital wastewater treatment because of its
M. Alrhmoun, M. Casellas, M. Baudu, and C. Dagot are with laboratory of
GRESE EA 4330, University of Limoges, France (e2mail: moussab1984@
hotmail.com, [email protected], [email protected] Dagot@ ensil.unilim.fr).
higher efficiency in pollutant removal, excellent effluent
quality, low sludge production, compact size and lower energy
consumption [3]. Because of their ability to reach higher
contact times and then to maintain in reaction a slow2growing
biomass, microorganism species are more diversified with
higher physiological capacity and are more adapted to
resistant compounds. Although the effectiveness of MBR
treatment for eliminating trace organic contaminants has been
well demonstrated in the literature, recent studies have also
shown the limitations of MBR in removing certain persistent
compounds [4]2[6]. Therefore, it is necessary to implement a
post2treatment process after MBR particularly in indirect
potable water recycling applications or when discharging the
effluent to an ecologically sensitive environment.
Numerous authors have investigated the MBR for the
treatment of effluent containing pharmaceuticals [5], [2]. All
these studies were carried out using microfiltration (MF) or
ultra filtration (UF) membranes. In this study, the removal of
trace organic contaminants via sequential application of GAC
adsorption following MBR treatment (MBR2GAC) was
investigated. Using the granular activated carbon (GAC)
adsorption has been commonly in treatment process of
industrial water and it is very effective for the removal of
pesticides and other emerging trace organic contaminants in
drinking water treatment [7], [8]. Recently, a few have
investigated the use of GAC adsorption for the removal of
trace organic micropolluant from biologically treated effluent
[9]2[11]. The hospital wastewater treated by membrane reach
to GAC post2treatment which to specifically target the residual
trace organic contaminants in MBR permeate.
The purpose of this paper was to summarize the long2term
performance experience of a MBR2 GAC system for hospital
wastewater treatment and to provide data on the elimination
efficiency of an on2site biological wastewater treatment. To
verifier this objective: (i) pilot2scale MBR coupled with post
treatment GAC was installed to receive and treat real hospital
wastewater, (ii) an efficient and representative samples was
taken to representatively collect influent and effluent from the
MBR; and (iii) SPE2HPLC2MS/MS analytical method was
developed and optimized to quantify the concentrations of
approximately 30 target analytics including pharmaceuticals
and human metabolites (laboratory INASCO, Poitiers,
France).
Efficiency of Modified Granular Activated Carbon
Coupled with Membrane Bioreactor for Trace
Organic Contaminants Removal Mousaab Alrhmoun, Magali Casellas, Michel Baudu, Christophe Dagot
I
World Academy of Science, Engineering and Technology
International Journal of Chemical, Nuclear, Metallurgical and Materials Engineering Vol:8 No:1, 2014
43
Inte
rnat
ional
Sci
ence
Index
Vol:
8, N
o:1
, 2014 w
aset
.org
/Publi
cati
on/9
997205
Article 6 Chapter III
215
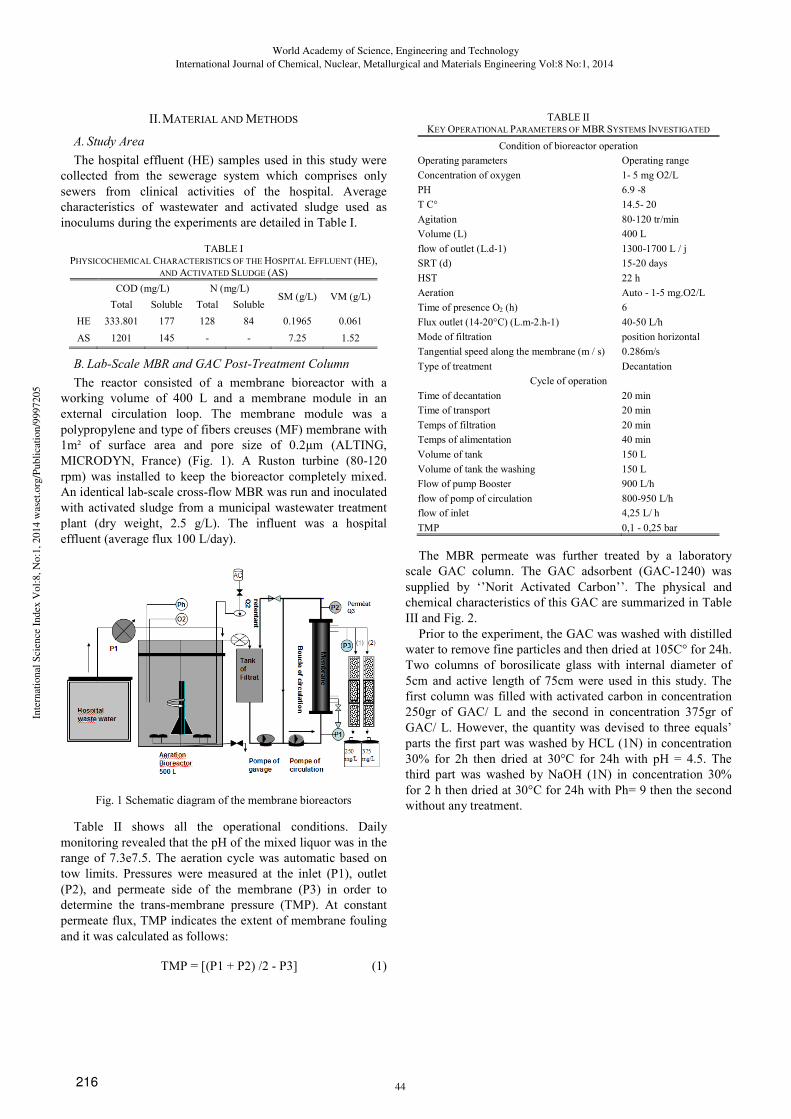
II.�MATERIAL AND METHODS
������������
The hospital effluent (HE) samples used in this study were
collected from the sewerage system which comprises only
sewers from clinical activities of the hospital. Average
characteristics of wastewater and activated sludge used as
inoculums during the experiments are detailed in Table I.
TABLE I
PHYSICOCHEMICAL CHARACTERISTICS OF THE HOSPITAL EFFLUENT (HE),
AND ACTIVATED SLUDGE (AS)
COD (mg/L) N (mg/L)
SM (g/L) VM (g/L) Total Soluble Total Soluble
HE 333.801 177 128 84 0.1965 0.061
AS 1201 145 2 2 7.25 1.52
��� ���������������������������������������
The reactor consisted of a membrane bioreactor with a
working volume of 400 L and a membrane module in an
external circulation loop. The membrane module was a
polypropylene and type of fibers creuses (MF) membrane with
1m² of surface area and pore size of 0.2Hm (ALTING,
MICRODYN, France) (Fig. 1). A Ruston turbine (802120
rpm) was installed to keep the bioreactor completely mixed.
An identical lab2scale cross2flow MBR was run and inoculated
with activated sludge from a municipal wastewater treatment
plant (dry weight, 2.5 g/L). The influent was a hospital
effluent (average flux 100 L/day).
Fig. 1 Schematic diagram of the membrane bioreactors
Table II shows all the operational conditions. Daily
monitoring revealed that the pH of the mixed liquor was in the
range of 7.3e7.5. The aeration cycle was automatic based on
tow limits. Pressures were measured at the inlet (P1), outlet
(P2), and permeate side of the membrane (P3) in order to
determine the trans2membrane pressure (TMP). At constant
permeate flux, TMP indicates the extent of membrane fouling
and it was calculated as follows:
TMP = [(P1 + P2) /2 2 P3] (1)
TABLE II
KEY OPERATIONAL PARAMETERS OF MBR SYSTEMS INVESTIGATED
Condition of bioreactor operation
Operating parameters Operating range
Concentration of oxygen 12 5 mg O2/L
PH 6.9 28
T C° 14.52 20
Agitation 802120 tr/min
Volume (L) 400 L
flow of outlet (L.d21) 130021700 L / j
SRT (d) 15220 days
HST 22 h
Aeration Auto 2 125 mg.O2/L
Time of presence O2 (h) 6
Flux outlet (14220°C) (L.m22.h21) 40250 L/h
Mode of filtration position horizontal
Tangential speed along the membrane (m / s) 0.286m/s
Type of treatment Decantation
Cycle of operation
Time of decantation 20 min
Time of transport 20 min
Temps of filtration 20 min
Temps of alimentation 40 min
Volume of tank 150 L
Volume of tank the washing 150 L
Flow of pump Booster 900 L/h
flow of pomp of circulation 8002950 L/h
flow of inlet 4,25 L/ h
TMP 0,1 2 0,25 bar
The MBR permeate was further treated by a laboratory
scale GAC column. The GAC adsorbent (GAC21240) was
supplied by ‘’Norit Activated Carbon’’. The physical and
chemical characteristics of this GAC are summarized in Table
III and Fig. 2.
Prior to the experiment, the GAC was washed with distilled
water to remove fine particles and then dried at 105C° for 24h.
Two columns of borosilicate glass with internal diameter of
5cm and active length of 75cm were used in this study. The
first column was filled with activated carbon in concentration
250gr of GAC/ L and the second in concentration 375gr of
GAC/ L. However, the quantity was devised to three equals’
parts the first part was washed by HCL (1N) in concentration
30% for 2h then dried at 30°C for 24h with pH = 4.5. The
third part was washed by NaOH (1N) in concentration 30%
for 2 h then dried at 30°C for 24h with Ph= 9 then the second
without any treatment.
World Academy of Science, Engineering and Technology
International Journal of Chemical, Nuclear, Metallurgical and Materials Engineering Vol:8 No:1, 2014
44
Inte
rnat
ional
Sci
ence
Index
Vol:
8, N
o:1
, 2014 w
aset
.org
/Publi
cati
on/9
997205
216
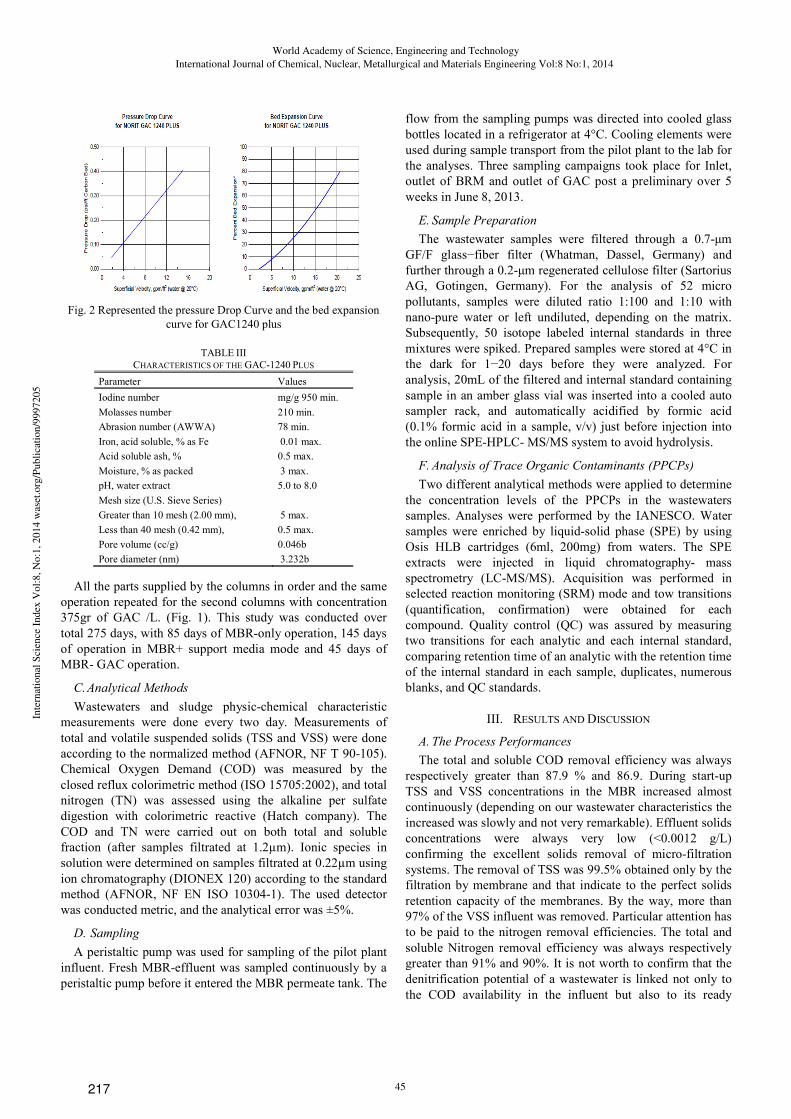
Fig. 2 Represented the pressure Drop Curve and the bed expansion
curve for GAC1240 plus
TABLE III
CHARACTERISTICS OF THE GAC21240 PLUS
Parameter Values
Iodine number mg/g 950 min.
Molasses number 210 min.
Abrasion number (AWWA) 78 min.
Iron, acid soluble, % as Fe 0.01 max.
Acid soluble ash, % 0.5 max.
Moisture, % as packed 3 max.
pH, water extract 5.0 to 8.0
Mesh size (U.S. Sieve Series)
5 max. Greater than 10 mesh (2.00 mm),
Less than 40 mesh (0.42 mm), 0.5 max.
Pore volume (cc/g) 0.046b
Pore diameter (nm) 3.232b
All the parts supplied by the columns in order and the same
operation repeated for the second columns with concentration
375gr of GAC /L. (Fig. 1). This study was conducted over
total 275 days, with 85 days of MBR2only operation, 145 days
of operation in MBR+ support media mode and 45 days of
MBR2 GAC operation.
���������������������
Wastewaters and sludge physic2chemical characteristic
measurements were done every two day. Measurements of
total and volatile suspended solids (TSS and VSS) were done
according to the normalized method (AFNOR, NF T 902105).
Chemical Oxygen Demand (COD) was measured by the
closed reflux colorimetric method (ISO 15705:2002), and total
nitrogen (TN) was assessed using the alkaline per sulfate
digestion with colorimetric reactive (Hatch company). The
COD and TN were carried out on both total and soluble
fraction (after samples filtrated at 1.2Hm). Ionic species in
solution were determined on samples filtrated at 0.22Hm using
ion chromatography (DIONEX 120) according to the standard
method (AFNOR, NF EN ISO 1030421). The used detector
was conducted metric, and the analytical error was ±5%.
����������� �
A peristaltic pump was used for sampling of the pilot plant
influent. Fresh MBR2effluent was sampled continuously by a
peristaltic pump before it entered the MBR permeate tank. The
flow from the sampling pumps was directed into cooled glass
bottles located in a refrigerator at 4°C. Cooling elements were
used during sample transport from the pilot plant to the lab for
the analyses. Three sampling campaigns took place for Inlet,
outlet of BRM and outlet of GAC post a preliminary over 5
weeks in June 8, 2013.
!�����������������
The wastewater samples were filtered through a 0.72Sm
GF/F glass−fiber filter (Whatman, Dassel, Germany) and
further through a 0.22Sm regenerated cellulose filter (Sartorius
AG, Gotingen, Germany). For the analysis of 52 micro
pollutants, samples were diluted ratio 1:100 and 1:10 with
nano2pure water or left undiluted, depending on the matrix.
Subsequently, 50 isotope labeled internal standards in three
mixtures were spiked. Prepared samples were stored at 4°C in
the dark for 1−20 days before they were analyzed. For
analysis, 20mL of the filtered and internal standard containing
sample in an amber glass vial was inserted into a cooled auto
sampler rack, and automatically acidified by formic acid
(0.1% formic acid in a sample, v/v) just before injection into
the online SPE2HPLC2 MS/MS system to avoid hydrolysis.
"������������#�����$ ������������������%�����&��
Two different analytical methods were applied to determine
the concentration levels of the PPCPs in the wastewaters
samples. Analyses were performed by the IANESCO. Water
samples were enriched by liquid2solid phase (SPE) by using
Osis HLB cartridges (6ml, 200mg) from waters. The SPE
extracts were injected in liquid chromatography2 mass
spectrometry (LC2MS/MS). Acquisition was performed in
selected reaction monitoring (SRM) mode and tow transitions
(quantification, confirmation) were obtained for each
compound. Quality control (QC) was assured by measuring
two transitions for each analytic and each internal standard,
comparing retention time of an analytic with the retention time
of the internal standard in each sample, duplicates, numerous
blanks, and QC standards.
III.� RESULTS AND DISCUSSION
�������������#�������
The total and soluble COD removal efficiency was always
respectively greater than 87.9 % and 86.9. During start2up
TSS and VSS concentrations in the MBR increased almost
continuously (depending on our wastewater characteristics the
increased was slowly and not very remarkable). Effluent solids
concentrations were always very low (<0.0012 g/L)
confirming the excellent solids removal of micro2filtration
systems. The removal of TSS was 99.5% obtained only by the
filtration by membrane and that indicate to the perfect solids
retention capacity of the membranes. By the way, more than
97% of the VSS influent was removed. Particular attention has
to be paid to the nitrogen removal efficiencies. The total and
soluble Nitrogen removal efficiency was always respectively
greater than 91% and 90%. It is not worth to confirm that the
denitrification potential of a wastewater is linked not only to
the COD availability in the influent but also to its ready
World Academy of Science, Engineering and Technology
International Journal of Chemical, Nuclear, Metallurgical and Materials Engineering Vol:8 No:1, 2014
45
Inte
rnat
ional
Sci
ence
Index
Vol:
8, N
o:1
, 2014 w
aset
.org
/Publi
cati
on/9
997205
217

biodegradability. Performance of the MBR with respect to the
removal of TOC and TN was stable during the entire study
(Table IV).
TABLE IV EVOLUTION THE EFFICIENCY REMOVAL OF ORGANIC POLLUTANTS BY MBR
Removal % TSS VSS TCOD SCOD TN SN
MBR 99.5 97.4 87.9 86.9 91 90.4
������'����#�����$ �������������������������
The main mechanisms responsible for the removal of
pharmaceutical compounds in the MBR2system are sludge
sorption and biodegradation by microorganisms present in the
wastewater [12]. The total removal efficiency (sludge
sorption+ biodegradation + membrane retention) of each
pharmaceutical compound was determined MBR according to
(1):
Removal % = (C2−C1) / C2 × 100
where:
C1: the experimental concentration determined for each
pharmaceutical compound in each reactor influent by LC /
(MS MS) analysis.
C2: the experimental concentration of each pharmaceutical
compound in each reactor effluent by the LC / (MS2MS)
analysis.
The concentrations of the various pharmaceutical
compounds and their transformation products during the
spiking period were determined by LC/MS2MS applying
electro spray ionization (ESI) under high resolution MS
conditions. Table V shows the concentration of the PPCPs in
influent, outlet and the removal % for the MBR after 275 days
of the operation. It can be clearly observed the highest
removal efficiency (environ 95%) or complete removal of
Ketoprofen, Naproxen, Paracetamol, Ibuprofen, Caffeine,
Gemfibrozil, Pravastatin, Carboxy2ibuprofen, Iohexol in BRM
for the compounds which (log D< 3).
In our study after 275 days of operation and in high
efficiency of removal for the N and the COD we can confirm
that the BRM was reached to stable operation. Therefore, the
high and/or variable removal of these compounds can be
attributed to their physicochemical proprieties as the
electronics strong in presence functional groups (amide,
chlorine and carboxylic) [6], (see Fig. 3). In addition to that
effect of hydrophobic interactions and its changes with the
time. Hydrophpic compounds (log D> 3) adsorbed on sludge
can be retained by membrane and further biodegradation by
biomasses in the reactor can occur. The reporters [4]2[6]
confirmed our results. In another side, the reporters [14], [16]2
[18] have been reported variations in the removal of these
compounds, for example joss et al found the efficiency of
removal of Ketoprofen 30% and Naproxen from 55 to 85%.
This means that in addition to physiochemical proprieties of
trace organics, their removal also depends on operations
conditions such as the temperature [19], [20], the HRT [21]
and the PH [22].
TABLE V
TRACE ORGANIC CONTAMINANT REMOVAL EFFICIENCY OF THE MBR OVER
275 DAYS OF OPERATION
Pharmaceutical
compound
Influent
(Hg/L)
Removal (%)
References MBR MBR2GAC
Codeine 0,18 100 100
Ketoprofen 6,4 97 100 (30%) [13]
Paracetamol 177 100 100
Diclofenac 0,1 30 100 (5–45%) [14]
Naproxen 3,7 94,6 100 (55285%) [14])
Ibuprofen 1,4 96,4 100 (902100%) [14]
Roxithromycin 0,21 57,1 100 (<60%) [15]
Sulfametoxazole 1,6 18,8 100
Metronidazole 4,8 56,3 100 15–18% [13]
Trimethoprim 1,4 14,3 100 90% [15]
Hydrochlorothiazide 2,8 10,7 100
Furosemide 5,1 74,5 100 35–40% [13]
Caffeine 41 96,1 100
Gemfibrozil 0 100 100
Pravastatin 0,42 100 100 45% [13]
Metoprolol 0,1 10 100
Atenolol 0,77 70,1 100 70% [13]
Acide Fenofibric 2,1 71,9 100
Carboxyl2ibuprofen 16 100 100 80% [14]
Iopromide 1,1 74,5 100 60280% [13]
Iohexol 167 99,8 100
World Academy of Science, Engineering and Technology
International Journal of Chemical, Nuclear, Metallurgical and Materials Engineering Vol:8 No:1, 2014
46
Inte
rnat
ional
Sci
ence
Index
Vol:
8, N
o:1
, 2014 w
aset
.org
/Publi
cati
on/9
997205
218

Fig. 3 Physiochemical properties of traces organics found in hospital waste water
������'����#�����$ ������������������������������
������
The removal effectiveness of the activated carbon
adsorptive treatment system depends on the properties of the
adsorbent (specific surface area, porosity, surface polarity, and
physical shape of the material) and the characteristics of the
compound (shape, size, charge and hydrophobicity).
Adsorption mechanisms consist of the chemical (electrostatic
interaction) and physical bindings of molecules to the surface
of an adsorbent. The latter is often more important due to the
capability to form multi2layer bindings [23]. In fact, it was
recently reported that the greatest removal of amoxicillin by
activated carbon was achieved under pH conditions
corresponding to a zero net charge on the activated carbon
surface [24].
The sorption efficiencies of organics traces to activated
carbon may be significantly altered by several factors, such as
the types of activated carbon used, the initial concentrations of
target compounds and the pH, temperature and dissolved
organic carbon (COD) concentration of the solution [25]2[28].
World Academy of Science, Engineering and Technology
International Journal of Chemical, Nuclear, Metallurgical and Materials Engineering Vol:8 No:1, 2014
47
Inte
rnat
ional
Sci
ence
Index
Vol:
8, N
o:1
, 2014 w
aset
.org
/Publi
cati
on/9
997205
219

The capacity of activated carbon to adsorb a particular
compound can, to some extent, be predicted based on the
‘hydrophilic’ or ‘hydrophobic’ nature of the chemical [23].
The hydrophobic (non2polar) or hydrophilic (polar) properties
of pharmaceutics compounds can be determined from their
LogD (or pKa2adjusted Log Kow) values. It has been reported
that non2polar compounds with Log Kow > 2, may be
effectively removed with activated carbon by hydrophobic
interaction [23]. However, the adsorption of more polar or
charged compounds to activated carbon is much more difficult
to predict due to additional effects of polar interactions and
ion exchange [23]. For that in our study we have been changed
the ionic forces of activated carbon by treating with acidic and
basic solution in high concentration. Many pharmaceutics
compounds, such as tetracycline and sulfonamides are often
present in negatively charged form at normal operating pH
conditions [29]. Therefore, the use of ionic treatment
processes may be effective for the removal of this anionic
micropollutant [30] and that according with our results in this
study. Ion exchange is the main mechanism in the ionic
treatment for negatively and positively charged pharmaceutics.
Full2scale studies are required to determine the optimal
configuration and operating conditions of adsorptive systems,
which are effective and economically feasible for
pharmaceutics compounds removal. In another side, in this
study, we can confirm that initially GAC post2treatment could
significantly improve the removal of the compounds which
demonstrated low to moderate removal by MBR treatment
(i.e., diclofenac, Roxithromycin, Sulfametazole, Hydrochloric2
thiamine, Furosemide, Metoprolol, Atenolol, Acide
Fenofibric, Iopromide, Trimethoprim, and metronidazole) see
Table V.
IV.� CONCLUSIONS
This study reported the stabilization of extern MBR system
in biological treating of the hospital effluent during the
operation a period over of 275 days. The results confirmed the
high efficiency removal of COD and Nitrogen. The MBR
system treatment can effectively remove Ketoprofen,
Naproxen, Paracetamol, Ibuprofen, Caffeine, Gemfibrozil,
Pravastatin, Carboxyl2ibuprofen, and Iohexol. The GAC
column following the MBR treatment was demonstrated a
high (952100%) removal for all the organics traces in the
hospital waste water. The ionic force of activated carbon and
the electronic charge of organic micropollutant were two parts
of chemical and electronic interaction which have been as
important mechanism for complete and effective removal of
organic micro pollutant of the waste water treated by MBR.
REFERENCES
[1]� Kümmerer K. Drugs in the environment: emission of drugs, diagnostic aids and disinfectants into wastewater by hospitals in relation to other
sources a review. 2001 Chemosphere, 45, (6–7), 9572969
[2]� Carballa, M., Omil, F., Lema, J.M., Llompart, M., Garcia2Jares, C., Rodriguez, I., Gomez, M., Chromatography–mass spectrometry:
methods and preliminary results including toxicity studies with Vibrio fischeri. J. Chromatogr. A 20042 938, 187–197.
[3]� Franc2ois Zaviska , PatrickDrogui , AlainGrasmick , AntoninAzais a,b,
MarcHe´ran ; Journal of Membrane Science Nanofiltration membrane bioreactor for removing pharmaceutical compounds. 2012 Journal of
Membrane Science 429 (2013) 121–129.
[4]� Clara, M., Strenn, B., Gans, O., Martinez, E., Kreuzinger, N., Kroiss, H., 2005. Removal of selected pharmaceuticals, fragrances and endocrine
disrupting compounds in a membrane bioreactor and conventional
wastewater treatment plants. Water Res. 39, 4797e4807. [5]� Joss, A., Keller, E., Alder, A.C., Göbel, A., McArdell, C.S., Ternes, T.,
Siegrist, H., 2005. Removal of pharmaceuticals and fragrances in
biological wastewater treatment. Water Res. 39, 3139e3152. [6]� Tadkaew, N., Hai, F.I., McDonald, J.A., Khan, S.J., Nghiem, L.D.,
2011. Removal of trace organics by MBR treatment: the role of
molecular properties. Water Res. 45, 2439e2451. [7]� Kim, S.H., Shon, H.K., Ngo, H.H., 2010. Adsorption characteristics of
antibiotics trimethoprim on powdered and granular activated carbon. J.
Ind. Eng. Chem. 16, 344e349. [8]� Behera, S.K., Oh, S.Y., Park, H.S., 2012. Sorptive removal of ibuprofen
from water using selected soil minerals and activated carbon. Int. J.
Environ. Sci. Technol. 9, 85e94. [9]� Dickenson, E.R.V., Drewes, J.E., 2010. Quantitative structure property
relationships for the adsorption of pharmaceuticals onto activated
carbon.Water Sci. Technol. 62, 2270e2276. [10]� Grover, D.P., Zhou, J.L., Frickers, P.E., Readman, J.W., 2011. Improved
removal of estrogenic and pharmaceutical compounds in sewage effluent
by full scale granular activated carbon: impact on receiving river water. J. Hazard. Mater. 185, 1005e1011.
[11]� Hernández2Leal, L., Temmink, H., Zeeman, G., Buisman, C.J.N., 2011. Removal of micropollutants from aerobically treated grey water via
ozone and activated carbon. Water Res. 45, 2887e2896.
[12]� José Luiz Tambosi a,b, Rênnio Felix de Sena a,b, Maxime Favier b, Wilhelm Gebhardt b, Humberto Jorge José a, Horst Friedrich Schröder
b, Regina de Fátima Peralta Muniz Moreira a, a Laboratory of Energy
and the Environment, Department of Chemical Engineering and Food Engineering, Federal University of Santa Catarina, Campus
Universitário, Trindade, 880402900.
[13]� Jelic A, Gros M, Ginebrenda A, Cespedes2Sánchez R, Ventura F, Petrovic M, et al. Occurrence, partition and removal of pharmaceuticals
in sewage water and sludge during wastewater treatment. Water Res
2011; 45:1165–76. [14]� Joss A, Keller E, Alder A, Göbel A, Mcardell C, Ternes T, et al.
Removal of pharmaceuticals and fragrances in biological wastewater
treatment. Water Res 2005; 39: 3139–52. [15]� Göbel A, Mcardell CS, Joss A, Siegrist H, Giger W. Fate of
sulfonamides, macrolides, and trimethoprim in different wastewater
treatment technologies. Sci Total Environ n2007; 372:361–71. [16]� Urase, T., Kagawa, C., Kikuta, T., 2005. Factors affecting removal of
pharmaceutical substances and estrogens in membrane separation
bioreactors. Desalination 178, 107e113. [17]� Nakada, N., Tanishima, T., Shinohara, H., Kiri, K., Takada, H., 2006.
Pharmaceutical chemicals and endocrine disrupters in municipal
wastewater in Tokyo and their removal during activated sludge treatment. Water Res. 40, 3297e3303.
[18]� Kimura, K., Hara, H., Watanabe, Y., 2007. Elimination of selected
acidic pharmaceuticals from municipal wastewater by an activated sludge system and membrane bioreactors. Environ. Sci. Technol. 41,
3708e3714.
[19]� Hai, F. I., Tessmer, K., Nguyen, L. N., Kang, J., Price, W. E., Nghiem, L. D., 2011. Removal of micropollutants by membrane bioreactor under
temperature variation. J. Membr. Sci. 383, 144e151.
[20]� Vieno, N.M., Härkki, H., Tuhkanen, T., Kronberg, L., 2007. Occurrence of pharmaceuticals in river water and their elimination in a pilot2scale
drinking water treatment plant. Environ. Sci. Technol. 41, 5077e5084.
[21]� Kim, S., P. Eichhorn, J.N. Jenson, A.S. Weber, and D.S. Aga, Removal of antibiotics of waste water: Effect of hydraulic and solid retention time
on the fate of tetracycline in the activated sludge process. Environmental science technology, 2005. 39(15): P. 581625823.
[22]� Tadkaew, M. sivakumar, F. I., McDonald, J. A., Khan, S. J., Nghiem, L.
D., 2010. Effect of mixed liquer Ph at removal traces organics in a
membrane bioreactor. Bio. Tech. 2010. 163 (0) P. 2872303. [23]� Snyder, S. A., Westerhoff, P., Yoon, Y. & Sedlak, D. L. 2003.
Pharmaceuticals, Personal Care Products, and Endocrine Disruptors in
Water: Implications for the Water Industry. Environmental Engineering Science, 20, 4492469.
World Academy of Science, Engineering and Technology
International Journal of Chemical, Nuclear, Metallurgical and Materials Engineering Vol:8 No:1, 2014
48
Inte
rnat
ional
Sci
ence
Index
Vol:
8, N
o:1
, 2014 w
aset
.org
/Publi
cati
on/9
997205
220

[24]� Putra, E. K., Pranowo, R., Sunarso, J., Indraswati, N. & Ismadji, S.
2009. Performance of activated carbon and bentonite for adsorption of amoxicillin from wastewater: Mechanisms, isotherms and kinetics.
Water Research, 43, 241922430.
[25]� Rivera2Utrilla, J., Prados2Joya, G., Sánchez2Polo, M., Ferro2García, M.A., Bautista2 Toledo, I., 2009. Removal of nitroimidazole antibiotics
from aqueous solution by adsorption/bioadsorption on activated carbon.
J. Hazard. Mater. 170, 298e305. [26]� Choi, K. J., Kim, S. G. & Kim, S. H. 2008. Removal of tetracycline and
sulphonamide classes of antibiotic compound by powdered activated
carbon. Environmental Technology, 29, 3332342. [27]� Ji, L. L., Chen, W., Duan, L. & Zhu, D. Q. 2009. Mechanisms for strong
adsorption of tetracycline to carbon nanotubes: A comparative study
using activated carbon and graphite as adsorbents. Environmental Science & Technology, 43, 23222 2327.
[28]� Aksu, Z. & Tunc, O. 2005. Application of biosorption for penicillin G
removal: comparison with activated carbon. Process Biochemistry, 40, 8312847.
[29]� Adam, M. L., Comfort, S. D., Morley, M. C. & Snow, D. D. 2004.
Remediating RDX2contaminated ground water with permanganate: Laboratory investigations for the Pantex perched aquifer. Journal of Environmental Quality, 33, 216522173.
[30]� Robberson, K. A., Waghe, A. B., Sabatini, D. A. & Butler, E. C. 2006. Adsorption of the quinolone antibiotic nalidixic acid onto anion2
exchange and neutral polymers. Chemosphere, 63, 9342941.
World Academy of Science, Engineering and Technology
International Journal of Chemical, Nuclear, Metallurgical and Materials Engineering Vol:8 No:1, 2014
49
Inte
rnat
ional
Sci
ence
Index
Vol:
8, N
o:1
, 2014 w
aset
.org
/Publi
cati
on/9
997205
221

Conclusion and Future Work
222
Conclusion and Future Work

Conclusion and Future Work
223
Conclusions
To study removal organic micropollutants in hospital wastewater by treatment systems as
the MBR means to deal with a very complex set of problems. This thesis investigated in
strategic research the logical steps to increase our scientific knowledge about many
important details:
1. The effects of hospital wastewater on the treatment performance of the MBR and
CAS systems.
2. Study the toxic impact of hospital effluents on the microorganisms and characterize
the changes in composition the sludge to decrease the membrane fouling
phenomenon under different reel operating conditions.
3. Development a MBR system to achieve high removal of organic micropollutants in
treating the hospital effluents and produce a high quality effluent in the outlet.
This thesis began with literature review to demonstrate the significant of available data and
for identity keys points for subsequent investigation. Few of studies was illustrated the
potential effects of hospital effluents on the aquatic environment, microorganisms, the
human health, and performances the wastewaters systems process and that explain reel
difficult in this area. In addition to many of these studies was treated with synthetic
wastewater and that means absence the reel conditions of treatment although presence the
scientific according.
In this study, the reel conditions and the technical experiments with pilot- scales was the
first gaol of our strategy to reach for high efficiency of removal organic micropollutants.
This thesis was succeeded to employed new technical instrument as confocal microscopic in
morphologic characterisation of activated sludge. In addition to reach a qualitative and
quantities analyses for the EPS and their composition by using special staining dyes. In
Conclusion and Future Work

Conclusion and Future Work
224
hapte at a ti le 1 It can be concluded that CLSM, in combination with image analysis, is
a powerful method for direct determination of the EPS distribution, heterogeneity factors
and the structure of activated sludge flocs. This study also found that there is a good
correlation between the chemical analyses of EPS and the statistical treatment of
microscopic pictures . That was important to confirm our chemical analyses.
In anther side, in chapter 3 and article (2) the toxic effects of hospital effluents (HE) and their
pharmaceuticals compounds by comparison with urban effluents (UE) on the bacteria (as
microorganisms in direct contact with antibiotics residues), and performance the CAS system
was a principal objective. We could conclude that:
1. HE leads to the erosion of sludge flocs, resulting in an increase in floc fragments,
e posu e of o e fila e ts , a d the deg adatio of the o ga i load of the treated
effluent.
2. Denser floc matrices, observed by autofluorescence coupled with bacterial staining in
the HE feed, suggested that during HE treatment EPS content of the flocs increased.
It seems reasonable to infer that HE promoted EPS production by the biomass. This
hypothesis is supported also by the observed increase in the proportion of important
floc-forming bacteria in the HE reactor.
3. Structural divergence of the bacterial community in a lab scale CAS reactor and also
a reduction of the bacterial diversity, while other reactor parameters, such as the
nitrification rate, were not affected.
4. The introduction of Pseudomonas strains originated from HE in sludge could increase
the risk of antibiotic resistance dissemination in WWTP processing HE. Furthermore,
stress conditions, including antibiotics, also induce the acquisition of antibiotic
resistance gene cassettes by RIs via the SOS response. HE offers ideal conditions to
promote genetic evolution in bacterial communities.
From this important finding we have decided studding the MBR as a modern technology in
treating the HE in based on the CAS system that mean a comparative study between the CAS
and MBR systems for explain, exactly effect the HE in two process and performance both

Conclusion and Future Work
225
systems in treating this type of effluents (In article 3). The analyses performed on the
supernatant and activated sludge bioreactors allow us to draw the following conclusions:
The MBR was able to achieve good organic removal efficiencies. MBR removal
efficiencies based on T COD, S COD by comparison with the CAS.
Despite the low concentration studied, the toxicity of the pharmaceutical
compounds on activated sludge altered the characteristics of the biological matrix.
The presence of the pharmaceutical compounds stimulated the mechanisms of
survival (higher production of EPS). Fouling potential seems to be linked more closely
to polysaccharides than other EPS.
Simultaneously, confocal laser scanning observations and three-dimensional EEM
spectroscopy showed significant modifications of sludge morphology. (Higher
production of soluble EPS).
The results obtained of dosage the compounds pharmaceuticals showed that the MBR
presented higher removal efficiencies than the CAS for almost of compounds.
This step of our research has been useful for give us the motivation a development and
optimisation the MBR. That as i a ti le i Application of membrane biofilm bioreactor
(MBBR) for hospital wastewater treatment: Performances and Efficiency for Organic
Micropollutant Elimination . This study reported that: the possible role of supports media in
MBBR at decreasing production the proteins and polysaccharides in the soluble phase as
result the fouling of membrane. This finding confirmed that the biofilm supports media
could be played a major role in increasing the efficiency of MBR system in treating the
hospital wastewater. But, that p oposed st o gl this uestio What a out the filt atio
extern membrane and with full pilot- scale and for long time (different operation
conditions)? This type of application could use in the medicals factories and hospitals in
t eati g the HE efo e ea h to WWTP. To a s e s ie tifi all e ha e studied Upgrading
the performances of Ultrafiltration Membrane system coupled with Activated Sludge
Reactor by addition of biofilm supports for the treatment of hospital effluents i a ti le .
This article was concluded that biofilm supports media addition in a biological system
followed by ultrafiltration membrane had consequences on the global quality of the
treatment with a slight increase of performance based on classical parameters, coupled to
an important improvement of pharmaceuticals removal (pravastatin, ketoprofen, diclofenac,
roxithromycin, gemfibrozil, codeine, Iohexol). This result was linked to the increase of

Conclusion and Future Work
226
biomass concentration, of the solid resident time and of the sorption capacity. As it has been
shown furthermore, the treatment of pharmaceuticals was due to the biological degradation
depending at once of the biodegradability of each molecule (and with could be configured
by a parameter Kbiol) and its sorption capacity (parameterized by the Koc), and, in our
system by the porosity of the membrane. This membrane efficiency is function of the fouling
phenomena, dependant of the quality of the influent and by washing operations. The
occurrence of a biofilm system in a biological reactor has direct consequences on the quality
of discharged effluent, retaining the suspended solid in the biological reactor and protecting
the membrane. It was shown in this study, by biochemical analysis and confocal
observations, that the development of biofilm in the system permits a modification of the
proportion of the major exo-polymeric substances in the soluble phase compared to a free
cells system. The concentration of proteins, identified as a cause of clogging in membrane
system, decreases which induces a better stability of the transmembrane pressure.
Consequentially, the decrease of operating cost could compensate the equipment cost.
But, in all our experiments we have discovered that it was impossible to have a complete
removal without studding mechanism of removal for all organic micropollutants and their
physical and chemical characterisations to find a new approach for high removal efficiency.
In this area, there was many studies explained role of activated carbon in removal the
organics micropollutants. From this title the research was to find common factor between all
the organics micropollutant presented in the HE. That was the Ionitic force which motive the
chemical function to take electric interaction in presence an adsorbent material has ionise
special characteristics that means, by example, granular modified activated carbon. Article
studied Efficiency of Modified Granular Activated Carbon Coupled with Membrane
Bioreactor for Trace Organic Contaminants Removal . I this a ti le The MBR system
treatment can effectively remove Ketoprofen, Naproxen, Paracetamol, Ibuprofen, Caffeine,
Gemfibrozil, Pravastatin, Carboxyl-ibuprofen, and Iohexol. The GAC column following the
MBR treatment was demonstrated a high (95-100%) removal for all the organics traces in
the hospital waste water. The ionic force of activated carbon and the electronic charge of
organic micropollutant were two parts of chemical and electronic interaction which have
been as important mechanism for complete and effective removal of organic micro pollutant
of the waste water treated by MBR.
Conclusion and Future Work
227
This thesis studied the effects of hospital wastewater on the treatment performance of the
MBR and CAS systems. The toxic impact of hospital effluents on the microorganisms and
characterize the changes in composition the sludge to decrease the membrane fouling
phenomenon under different reel operating conditions.
The influence of biofilm supports media, modified activated carbon and separation
technique (membrane) to achieve high removal of organic micropollutants in treating the
hospital effluents.
Finally, I hope that this thesis shed new light on this important subject which will be direct
risk on the public human health and it could find alive data for development and
optimization of removal systems process.
Future work
In this thesis I have been all the data bases and the operation conditions to have a
mathematical model for optimisation the MBR in high removal efficiency of organics
micropollutants. For that the recommendations studies for future work:
(1) Carbon adsorption: To complete my studding in development the MBR combined
with powder activated carbon reactor and find a modelling constant adsorption in
reel operation conditions.
(2) Magnetic separation : The combined use of magnetic field and iron-based complex in
membrane bioreactor in treating the hospital wastewaters and in same area study
the potential applications of the nanoparticules ,as the MFe2O4 magnetic, in
removal the organic micropollutants.
(3) Biofilm: To study bio-mechanisms of microbial activity and bio-kinetics in the biofilm
membrane bioreactor MBBR, and identifying the relation between the microbial

Conclusion and Future Work
228
species and high removal efficiency of organic micropollutants in MBR system
process.

Abstract This research investigates the removal of pharmaceutics present in hospital wastewaters by
conventional activated sludge and MBR systems of treatment and under various operating
conditions to elucidate the removal mechanism and increasing the efficiency of removal. In
this study, laboratory scales was composed to four types of reactors used: Bach reactors,
conventional activated sludge, submerged membrane bioreactor and extern membrane
bioreactor and all these reactors were feed in reel hospital wastewaters. Different Technical
studies and many experiments were affected to develop the MBR systems: the beginning
was with biofilm supports media and the attached growth of biofilms in the reactor and the
finish by using the powder activated carbon. En general, the reported results show high
performance for the MBR with compared to CAS system in treating the basic organic
pollutants. Presence the biofilm supports media was very important for high removal of
pharmaceuticals compounds from the hospital wastewaters. The presence of the
pharmaceutical compounds stimulated the mechanisms of survival higher production of EPS.
Fouling potential seems to be linked more closely to polysaccharides than other EPS. In this
study, for the first time, was employed the confocal microscopy for qualities and quantities
analyses for the EPS in the biologic reactors. Microscopic observations were confirmed the
chemical analyses of EPS compounds.
In final experiment 21 pharmaceuticals were eliminated from the hospital effluents during
the treatment in extern membrane (UF) with modified granular activated carbon. In addition
to many biomolucles analyses which study the principals impact of hospital effluents on the
i oo ga is ’s especially the bacteria in using different, recent techniques. This study
demonstrates by reel conditions the role the developed MBR systems in treating the hospital
effluents and its impact direct on the environment.
Keywords: Membrane Bioreactors, Biofilms supports, Hospital wastewater, EPS
Résumé Cette recherche po te su l’élimination des micropolluants pharmaceutiques des effluents
hospitaliers par des procédés biologiques classiques (boue activée) et membranaire. Il est
montré que les systèmes à membrane, externe ou immergée, permettent un meilleur
traitement, ou une meilleure rétention, de plus de 50% des molécules pharmaceutiques
esu és. Afi d’a élio e l’effi a ité des p o édés e a ai es, des suppo ts a té ie s ont été ajoutés dans le bassin biologique permettant de diminuer considérablement le
colmatage. Il est montré u’u e des o sé ue es de la présence de ce garnissage est une
diminution globale des EPS produits, donc du colmatage membranaire, et de la rétention des
molécules pharmaceutiques,. Afi d’aug e te e o e l’effi a ité du procédé, du charbon
actif en poudre ou en grain a été ajouté avant la filtration (CAP) ou en sortie de filtration
(CAG), permettant une élimination quasi complète des molécules mesurées. La qualité des
biomasses épuratrices a été suivie par microscopie confocale avec marquage fluorescent des
exopolymères et de la viabilité cellulaire. Il est montré que les effluents hospitaliers
modifient la structure des flocs et des biofilms, leur composition biochimique, avec une
augmentation des concentrations en protéines extracellulaires, et la répartition des
populations caractérisées par métagénomique.
Mots- clés : Bioréacteurs membranaires, biofilms supports media, effluents hospitaliers, EPS