Hydrogen production from industrial wastewaters: an ...
26
1 Hydrogen production from industrial wastewaters: an integrated reverse electrodialysis - water electrolysis energy system Ramato Ashu Tufa a, *, Jaromir Hnát a , Michal Němeček a , Roman Kodým a , Efrem Curcio b,c , and Karel Bouzek a a Department of Inorganic Technology, University of Chemistry and Technology Prague, Technická 5, 166 28 Prague 6, Czech Republic b Department of Environmental and Chemical Engineering, University of Calabria (DIATIC-UNICAL) via P. Bucci CUBO 45A, 87036 Rende (CS) Italy c Institute on Membrane Technology of the National Research Council (ITM-CNR), c/o the University of Calabria, via P. Bucci, cubo 17/C, 87036 Rende, CS, Italy
Transcript of Hydrogen production from industrial wastewaters: an ...

1
Hydrogen production from industrial wastewaters: an integrated
reverse electrodialysis - water electrolysis energy system
Ramato Ashu Tufaa,*, Jaromir Hnát a, Michal Němeček a, Roman Kodým a, Efrem Curciob,c,
and Karel Bouzeka
aDepartment of Inorganic Technology, University of Chemistry and Technology Prague, Technická 5, 166
28 Prague 6, Czech Republic
bDepartment of Environmental and Chemical Engineering, University of Calabria (DIATIC-UNICAL) via
P. Bucci CUBO 45A, 87036 Rende (CS) Italy
cInstitute on Membrane Technology of the National Research Council (ITM-CNR), c/o the
University of Calabria, via P. Bucci, cubo 17/C, 87036 Rende, CS, Italy
2
Abstract
This work presents a novel approach combining reverse electrodialysis (RED)
and alkaline polymer electrolyte water electrolysis (APWEL) for renewable hydrogen
production. APWEL is fuelled by salinity gradient power (SGP) extracted from sulfate
(SO42-)-rich industrial wastewater. The performance of a pilot-scale RED unit (200 cells,
active area: 31.5×63.5 cm2), using salt solutions mimicking sulfate-rich waste streams
(0.01-0.3 M Na2SO4), was evaluated. An open circuit voltage (OCV) of 12.3 V, a
maximum power density of 0.22 W/m2MP (MP: membrane pair) and internal area
resistance of 43.2 Ωcm2/cell were recorded by using 0.01 M/0.3 M Na2SO4 solutions at
35 oC. The APWEL stack (6 cells, active area: 5×5 cm2), equipped with Ni foam
electrodes and heterogeneous anion-selective membranes, was tested with varying
concentrations of liquid electrolyte (0.85-2.5 M KOH) and varying temperatures (28-48
oC). The APWEL stack attained a maximum current density of 110 mA/m2 at 1.85 V/cell
(i.e. 11 V per stack), 2.5 M KOH and 48oC. Under these conditions, the integrated
system exhibited a maximum hydrogen production rate of 50 cm3/h·cm2. This study
opens up a new perspective on renewable hydrogen production fuelled by non-
intermittent SGP from SO42--rich industrial effluents.
Keywords: Industrial wastewater, reverse electrodialysis, salinity gradient power, water
electrolysis, hydrogen production
3
1. Introduction
Hydrogen is a clean and versatile energy carrier for the future. It can be produced
from water, natural gas, biomass and various other sources. Over the last decade,
hydrogen production using water electrolysis has found acceptability due to the
simplicity of this technology and the possibility to produce hydrogen of high purity.
Moreover, water electrolysis is a flexible process driven by renewable energy resources,
such as solar and wind power. More recently, the use of salinity gradient power (SGP)
generated by reverse electrodialysis (RED) as a non-intermittent power source to fuel
water electrolyzers has also been explored as an interesting alternative for renewable
hydrogen production (Tufa et al., 2017; Tufa et al., 2016). In RED, cation-exchange
membranes (CEMs) and anion-exchange membranes (AEMs) are alternately aligned to
create a low-concentration compartment (LCC) and a high-concentration compartment
(HCC) which are fed with solutions of low and high concentrations, respectively. A
scheme of RED is shown in Figure 1. The transport of ions occurs through ion-exchange
membranes from HCC to LCC solutions driven by the electrochemical potential
difference. Electricity is generated by a redox reaction evolving over electrodes placed
at the ends of the membrane pile. RED technology is mostly investigated at lab-scale
(Farrell et al., 2017), while studies of large-scale RED systems for SGP generation are
relatively rare. A more recent demonstration of a pilot-scale RED system involved the
testing of a stack equipped with 125 cell pairs (44×44 cm2) and using brine and brackish
water from salt works (Tedesco et al., 2016).
Alkaline water electrolysis represents a mature process for hydrogen production
combining the advantages of robustness and relatively low capital and operating costs.
However, it has several limitations, such as inadequately optimized separator, low
process efficiency and lack of suitability for intermittent power operations (Chanda et
al., 2015). The latest development in alkaline water electrolysis is alkaline polymer
electrolyte water electrolysis (APWEL), which employs a solid polymer electrolyte
based on AEMs (Hnát et al., 2011; Xiao et al., 2012). Such a design has the advantage
of low gas cross-over, higher flexibility, and suitability for scale-up and operability at
high pressure, allowing a simplified system with lower costs. In fact, most APWEL
studies focus on single-cell designs rather than multiple-cell designs; the latter allow a
better understanding of system performance on a large scale. Therefore, the present

4
study uses scaled-up RED and APWEL systems in contrast to the set-ups used in most
of the previous studies.
Figure 1. Picture and scheme of the pilot-scale RED set-up (HCC: high-concentration
compartment; LCC: low-concentration compartment. C: Cation-exchange membrane,
A: Anion-exchange membrane.
Industrial waste streams discharged into the ocean have SGP potential of up to
18 GW (Logan and Elimelech, 2012). However, the performance of RED using waste
streams from various sources (Dil et al., 2017a; Dil et al., 2017b; Luo et al., 2017;
Mehrabi and Alipanahpour Dil, 2017) other than NaCl-based salt solutions is a poorly
investigated topic. Recent attempts have focused on the application of hybrid
RED/electrodialysis systems for power generation using phenol-containing wastewaters
(Luo et al., 2017), and wastewater from a fish canning factory and a sewage treatment
plant (Di Salvo et al., 2017). Meanwhile, hydrogen production from waste resources is
a rapidly growing field. In particular, biological hydrogen production from industrial
wastewaters containing organic matter is regarded as a promising strategy for renewable
hydrogen production; however, the drawback of this process is the low yield (Hatzell et
al., 2014). On the other hand, given an electrolyzer’s energy consumption of 53-70
kWh/kg (Levene et al., 2007), efficient exploitation of SGP produced from waste
streams to fuel water electrolyzers would produce an annual yield of up to 3 M tons of
hydrogen. Therefore, indirect production of hydrogen from industrial waste streams by
water electrolyzers may be a viable alternative to other renewable hydrogen
technologies.

5
Most industrial waste streams are rich in SO42- which can be converted into
renewable energy and hydrogen. SO42--rich waste streams are usually obtained from salt
lake brines, mining processes and industrial waste streams from sewage treatment
plants, tanneries and rechargeable battery manufacturing processes. In most cases,
industrial wastewaters contain sulfate concentrations from 1-40 g/L (0.01-0.4 M ) (Siles
et al., 2010), which is far above the permitted limit (0.75-1.5 g/L) of discharge to surface
water bodies (Act, 2003). A high content of SO42- brine with concentrations of up to 1
M can be obtained from membrane treatment of industrial wastewater (Quist-Jensen et
al., 2017). Therefore, SO42--rich industrial wastewaters can potentially be exploited for
SGP generation and subsequent hydrogen production in the logic of the circular
economy, waste-to-energy (WtE) and power-to-gas (P2G) (Götz et al., 2016).
To our knowledge, no attempt has been made to produce SGP from SO42--rich
industrial effluents with subsequent use as fuel for hydrogen production by water
electrolysis. In the present study, a novel approach is investigated, combining SGP RED
and APWEL systems for hydrogen production driven by non-intermittent energy
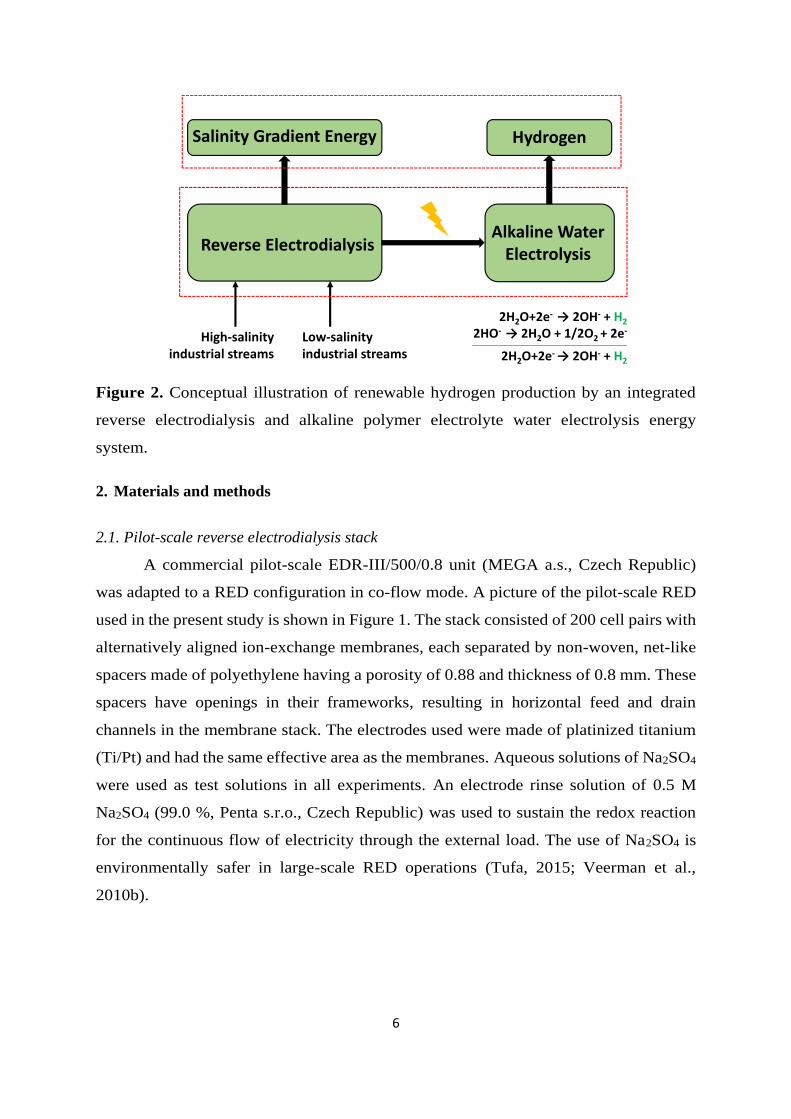
generated from SO42--rich industrial waste streams. The process is conceptually
illustrated in Figure 2. Two key objectives were set. Firstly, a pilot-scale RED unit was
optimized for SGP generation using industrial waste streams: the performance of the
RED unit was evaluated in terms of voltage and power density at varying flow velocity
and temperature of waste streams. Next, a laboratory-scale APWEL system, scaled-up
6-fold compared to most cases studied using single-cell designs (Ju et al., 2018; Tufa et
al., 2016), was tested for potential hydrogen production driven by SGP: the hydrogen
production rate was evaluated at varying electrolyte concentrations and temperatures to
identify optimal operating conditions. The ultimate goal was to demonstrate the
possibility of converting the electrochemical potential of industrial waste streams into
clean energy and hydrogen by an integrated RED-APWEL energy system.
6
Figure 2. Conceptual illustration of renewable hydrogen production by an integrated
reverse electrodialysis and alkaline polymer electrolyte water electrolysis energy
system.
2. Materials and methods
2.1. Pilot-scale reverse electrodialysis stack
A commercial pilot-scale EDR-III/500/0.8 unit (MEGA a.s., Czech Republic)
was adapted to a RED configuration in co-flow mode. A picture of the pilot-scale RED
used in the present study is shown in Figure 1. The stack consisted of 200 cell pairs with
alternatively aligned ion-exchange membranes, each separated by non-woven, net-like
spacers made of polyethylene having a porosity of 0.88 and thickness of 0.8 mm. These
spacers have openings in their frameworks, resulting in horizontal feed and drain
channels in the membrane stack. The electrodes used were made of platinized titanium
(Ti/Pt) and had the same effective area as the membranes. Aqueous solutions of Na2SO4
were used as test solutions in all experiments. An electrode rinse solution of 0.5 M
Na2SO4 (99.0 %, Penta s.r.o., Czech Republic) was used to sustain the redox reaction
for the continuous flow of electricity through the external load. The use of Na2SO4 is
environmentally safer in large-scale RED operations (Tufa, 2015; Veerman et al.,
2010b).
High-salinity industrial streams
Hydrogen
Low-salinity industrial streams
Reverse ElectrodialysisAlkaline Water
Electrolysis
Salinity Gradient Energy
2H2O+2e- → 2OH- + H2
2HO- → 2H2O + 1/2O2 + 2e-
2H2O+2e- → 2OH- + H2
7
2.1.1. Membranes
Ralex ion-exchange membranes (MEGA a.s., Czech Republic) with a thickness
of 0.57 mm, an effective area 2000 cm2 (31.5 cm x 63.5 cm) and total active membrane
area of 80 m2 were used in the pilot-scale RED unit. These membranes have higher ion-
exchange capacity compared to most commercial membranes, along with a reasonable
permselectivity i.e. capability to permit counter-ions while excluding co-ions. The
electrochemical properties of Ralex membranes are shown in Table 1.
2.1.2. Feed solutions
Aqueous solutions of Na2SO4 were used as test solutions in all experiments. The
LCC solution had a concentration of 0.01 M Na2SO4, the HCC solution a concentration
of 0.3 M Na2SO4. The concentration of feed solutions was monitored at regular time
intervals by conductivity measurement (GREISINGER GMH 3430, Czech Republic).
Experiments were performed in batch mode by recirculation of feed solutions at a flow
rate in the range of 1-11 m3/h (flow meter GEORG FISHER+GF+, USA) and
temperature in the range of 15 - 35oC.
Table 1. Properties of the ion-exchange membranes used in the present study (Güler et
al., 2013).
2.1.3. Electrochemical measurements.
An external precision resistor (Fuel Cell test load, TL4A, Astris Energi Inc., USA),
connected in series with the RED system, was used for loading the stack (Tufa et al.,
2014). The DC current and voltage levels across the test loads were measured by a Fluke
87-V Digital Multimeter (USA). A response time of about 30 minutes was maintained
between each experimental run for Na2SO4 feed solutions to achieve a stable voltage.
The overall performance of the RED stack was evaluated in terms of voltage (V), current
Membrane Thickness (µm)
Areal resistance (Ωcm2)
Permselectivity (%)
Ion-exchange capacity (meq./g)
Charge density (meq./g H2O)
Ralex AMH-PES 714 7.66 89.3 1.97 3.5
Ralex CMH-PES 764 11.3 94.7 2.34 7.6

8
(I) and gross power density (Pd). Theoretical approaches to an evaluation of the
performance of the RED stack are provided in the Supporting Information.
2.2. Alkaline water electrolysis stack
2.2.1. Design and assembly of the membrane electrode
The APWEL unit, in a bipolar configuration, was equipped with 6 cells, each
having an active area of 5×5 cm2. A picture and scheme of the APWEL unit is presented
in Figure 3. The anodes and cathodes were based on porous Ni foam (INCO Advanced
Technology Materials Co, Ltd., USA) with a thickness of 1.7 mm and a pore size of
0.58 mm. The end plates of the APWEL stack were made of steel, the insulating plates
of PVC (polyvinyl chloride) (PLEXIPLAST, Czech Republic). Nickel sheets (KÖNIG
FRANKSTAHL s.r.o., Czech Republic) were used as current collectors and bipolar
plates. Distribution plates, serving both for the housing of the Ni foam electrodes and
the distribution of the liquid electrolyte, were made of polyethylene (PE) (TITAN-
MULTIPLAST s.r.o., Czech Republic). Expanded polytetrafluoroethylene sealing was
used to prevent leakage of the electrolyte from the stack. The flow of the liquid
electrolyte was 4.6 cm3/s throughout the stack. The separators of the gases produced
were made of polymethyl methacrylate (Zenit, spol. s.r.o., Czech Republic) and filled
with polyethylene rollers in order to increase the linearity of the flow and interfacial
contact, and thus the separation rate of the gaseous phase.
The heterogeneous membranes produced in-house were composed of an inert
matrix of low-density polyethylene (LDPE 605 BA, ExxonMobil TM, LD 605BA,
USA) (27.3 wt.%) and a water-soluble component of poly(ethylene glycol-ran-
propylene glycol) (6.7 wt.%) (Sigma-Aldrich, USA) blended with anion-selective resins
(Dowex Marathon, USA) with quaternary ammonium functional groups. Details of the
preparation, characterization and activation methods of the anion-selective membrane
(ASM) are given elsewhere (Hnát et al., 2012). For the present study, the membranes
were reinforced with polyethylene terephthalate to improve the mechanical properties.
The properties of the ASMs are presented in Table 2.

9
Figure 3. Picture and scheme of the lab-scale electrolyzer with zero-gap membrane
electrode assembly.
2.2.1. Electrochemical measurements.
The voltage of the APWEL stack was recorded for an input current range of 0.25
A - 9.75 A (corresponding to current densities in the range of 0.01-0.39 A/cm2) supplied
by a DC power source Statron 3251.1 (Statron Gerätetechnik GmbH, Germany). The
current-voltage curve was recorded at KOH (85.0 %, Penta s.r.o., Czech Republic)
concentration in the range of 0.85-2.5 mol/dm3 and temperature in the range of 28-48
oC. The hydrogen production rate (HPR) under different conditions can be determined
from Ie flowing through the APWEL.
The minimum amount of energy required to initiate the water electrolysis
reaction is ΔG = 237.2 kJ/mol, corresponding to the reversible voltage of VR =1.23 V.
However, under practical conditions the cell voltage (Vcell) is given by:
cell R act e OhmV V I R
where ηact is the activation overpotential of electrode reactions, Ie the cell current
and ROhm the Ohmic resistance associated with electrolyte properties, electrode type and
cell design. The thermoneutral voltage (Vth) corresponds to the condition where the
energy dissipated by electric current is used to overcome G for the splitting of water
molecules which is related to the redox processes as well as the change in entropy S.
Vth is related to the change in enthalpy ∆H as:
th
HV
nF
(1)
(2)
10
where n is the number of electrons involved in the redox reaction and F is the faraday
constant (96,485 C/mol). Vth is equal to 1.48 V at 25 °C. Industrial-scale alkaline
electrolyzers operate at a cell voltage of 1.8-2.0 V and a current density of 100-300
mA/cm2 (Wang et al., 2014; Zeng, K. and Zhang, D.K., 2010). The power dissipated
over the electrolyzer (Pe) can be obtained from the cell voltage and cell current:
ecelle IVP
The energy consumed by the electrolyzer We (kWh/Nm3) with 100 % Faradaic
efficiency is given by:
e cellW V nF
The energy requirements of industrial-scale alkaline electrolyzers usually amount to 4.5-
5.0 kWh/Nm3 (Wang et al., 2014; Zeng, K. and Zhang, D.K., 2010), the theoretical value
is 2.9 kWh/Nm3, thus implying a thermodynamic efficiency of about 58-64% (Wang et
al., 2014). The hydrogen production rate (HPR) can be determined from Ie as:
ee
IHPR
nF
where ηe is the conversion efficiency (current efficiency) factor depending on gas losses
due to parasitic currents and hydrogen permeation into the anode compartments. ηe can
be determined from the theoretical hydrogen production rate HPRt as:
100e
t
HPRx
HPR
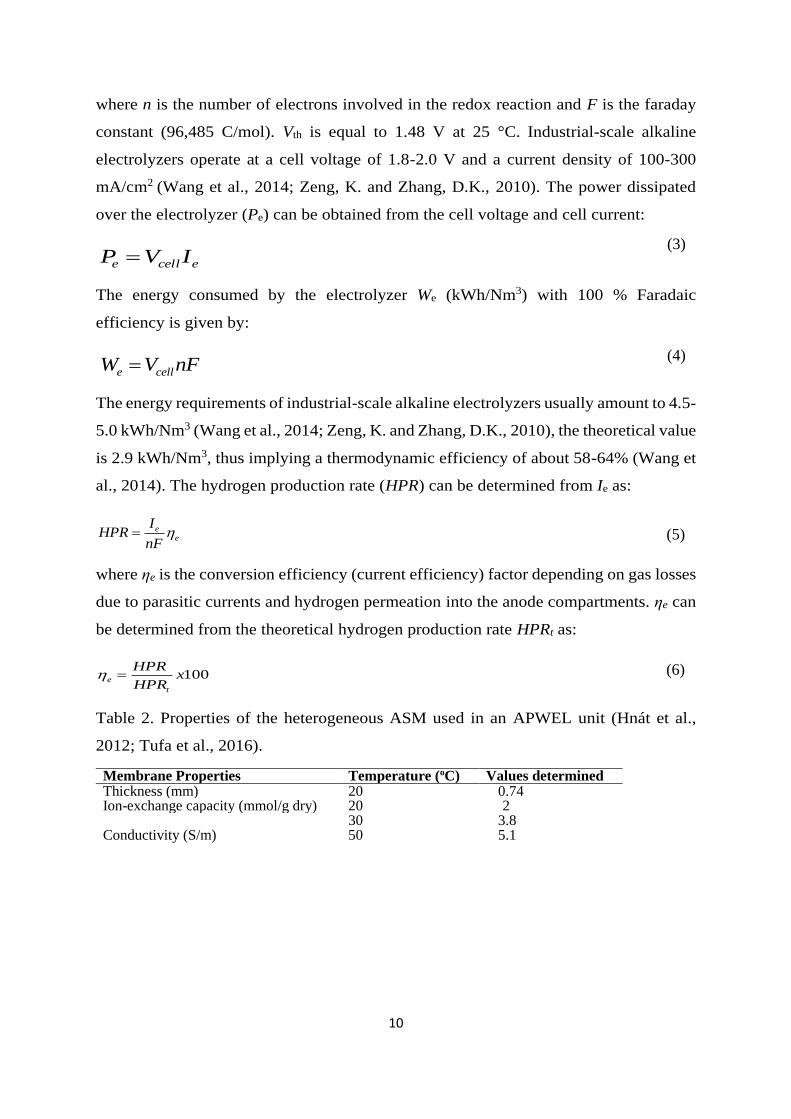
Table 2. Properties of the heterogeneous ASM used in an APWEL unit (Hnát et al.,
2012; Tufa et al., 2016).
Membrane Properties Temperature (oC) Values determined Thickness (mm) 20 0.74 Ion-exchange capacity (mmol/g dry) 20 2 Conductivity (S/m)
30 3.8 50 5.1
(3)
(4)
(5)
(6)

11
3. Results and discussion
3.1. Power generation in pilot-scale reverse electrodialysis
The dependence of power generated by RED on temperature (15-35oC) and flow
velocity (0.6-6.9 cm/s) was evaluated in order to identify conditions for the highest
power output. The RED stack was operated with 0.01M/0.3 M Na2SO4 feed solutions.
3.2. Effect of flow velocity and temperature
3.2.1. OCV of the stack
An increase in flow velocity improves the hydrodynamic mixing and hence
facilitates the mass transfer of ions towards the membrane surface. Moreover, the flow
velocity is directly related to the residence time of the solution in the RED stack. If the
flow velocity is increased by two-fold, the residence time is reduced by half. Thus, it
has a direct impact on the salinity gradient distribution across the channels of the stack.
Figure 4 presents the polarization curves as a function of flow velocity and
temperature. An increase in OCV of up to 9.7% - from 10.9V to 12V - was observed on
raising the flow velocity from 0.6 to 6.9 cm/s (Figure 4a). A viable explanation is a
change in the local salinity gradient due to the flowing parasitic current. In fact, a much
higher impact of flow velocity on OCV was observed in previous studies on small-scale
RED designs (Tufa et al., 2015); this was ascribed to the higher salinity gradient and
thinner membranes used in such cases which promote concentration changes caused by
the parasitic current.
12
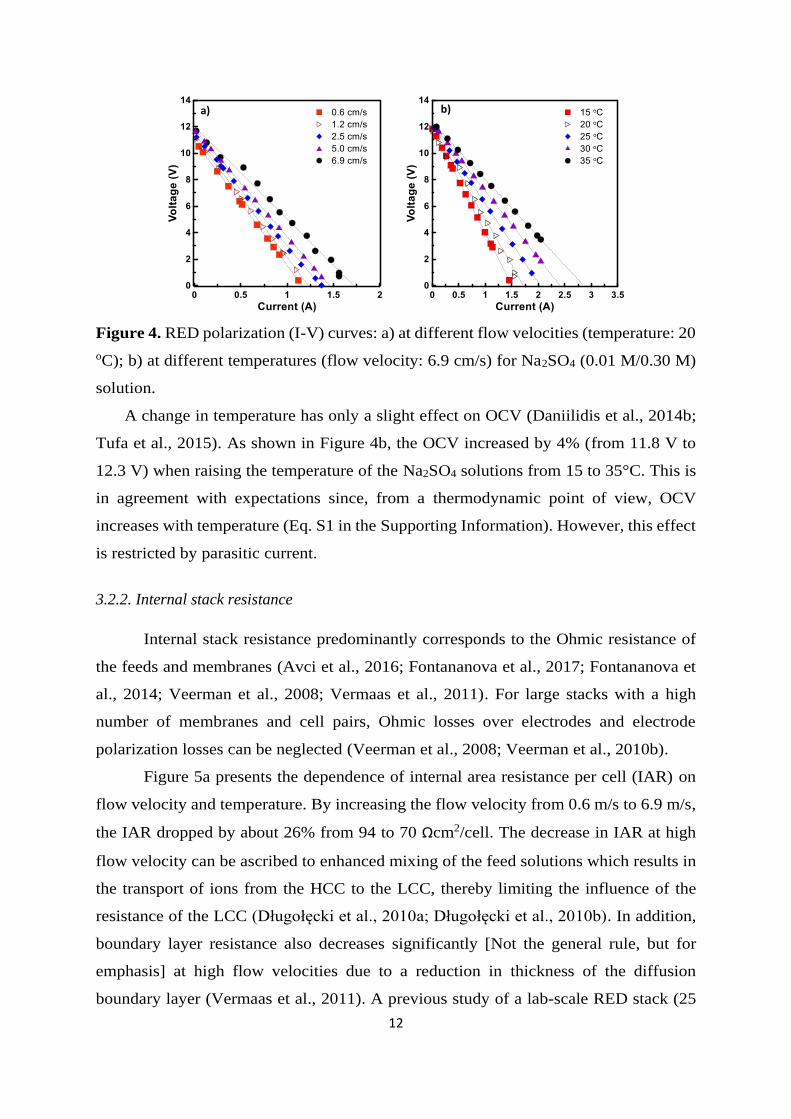
Figure 4. RED polarization (I-V) curves: a) at different flow velocities (temperature: 20
oC); b) at different temperatures (flow velocity: 6.9 cm/s) for Na2SO4 (0.01 M/0.30 M)
solution.
A change in temperature has only a slight effect on OCV (Daniilidis et al., 2014b;
Tufa et al., 2015). As shown in Figure 4b, the OCV increased by 4% (from 11.8 V to
12.3 V) when raising the temperature of the Na2SO4 solutions from 15 to 35°C. This is
in agreement with expectations since, from a thermodynamic point of view, OCV
increases with temperature (Eq. S1 in the Supporting Information). However, this effect
is restricted by parasitic current.
3.2.2. Internal stack resistance
Internal stack resistance predominantly corresponds to the Ohmic resistance of
the feeds and membranes (Avci et al., 2016; Fontananova et al., 2017; Fontananova et
al., 2014; Veerman et al., 2008; Vermaas et al., 2011). For large stacks with a high
number of membranes and cell pairs, Ohmic losses over electrodes and electrode
polarization losses can be neglected (Veerman et al., 2008; Veerman et al., 2010b).
Figure 5a presents the dependence of internal area resistance per cell (IAR) on
flow velocity and temperature. By increasing the flow velocity from 0.6 m/s to 6.9 m/s,
the IAR dropped by about 26% from 94 to 70 Ωcm2/cell. The decrease in IAR at high
flow velocity can be ascribed to enhanced mixing of the feed solutions which results in
the transport of ions from the HCC to the LCC, thereby limiting the influence of the
resistance of the LCC (Długołęcki et al., 2010a; Długołęcki et al., 2010b). In addition,
boundary layer resistance also decreases significantly [Not the general rule, but for
emphasis] at high flow velocities due to a reduction in thickness of the diffusion
boundary layer (Vermaas et al., 2011). A previous study of a lab-scale RED stack (25
a) b)

13
cells) led to a 0.14 Ω cm2 reduction in IAR per 0.1 cm/s increase in fluid velocity (Tufa
et al., 2015). Długołecki et al. observed a significant reduction in internal stack
resistance of a RED (3 cells) when operated at a flow velocity above 0.3 cm/s
(Długołȩcki et al., 2009).
The IAR decreases monotonically with rising temperature. A significant
reduction in IAR of up to 45 % from 78.8 to 43.2 Ωcm2/cell was recorded when the
temperature of the feed solutions was increased from 15 oC to 35 oC. Raising feed
temperature increases ionic conductivity, enhances ionic mobilities and, ultimately,
reduces stack resistance. Considering that Ohmic resistances largely predominate, an
almost linear trend between IAR and temperature can be assumed, and a reduction of
1.8 Ωcm2/cell/oC is computed within the experimental temperature range.
Figure 5. The variation of a) IAR b) ionic shortcut currents with temperature (flow
velocity: 6.9 cm/s) and flow velocity 6.9 cm/s (temperature: 20 oC) for Na2SO4 (0.01
M/0.30 M) solution.
Figure 5b presents the variation in Is with flow velocity and temperature. In fact,
Is depends on both OCV and Ri (Eq. S4 in the Supporting Information). Is also depends
on operating conditions: it increases with an increase in flow velocity, which is
associated with an increase in conductivity of the LCC solution due to enhanced mixing.
Since the OCV is hardly influenced by temperature, the change in Is can be correlated
to the change in Ri, which is assumed to be a linear function of temperature. On average,
Is increases with a rise in temperature at a rate of 0.1 A/oC. The Is of the present pilot-
scale RED stack was comparatively higher than that of our previous investigation of a
a) b)
14
small-scale RED stack (25 cells) which indicated an average increment rate of about
0.02 A/oC (Tufa et al., 2015; Tufa et al., 2014). Although the difference in stack design
and operating conditions precludes a direct comparison, the general observation is that
Is increases when the RED stack is scaled up (Tedesco, Michele et al., 2015).
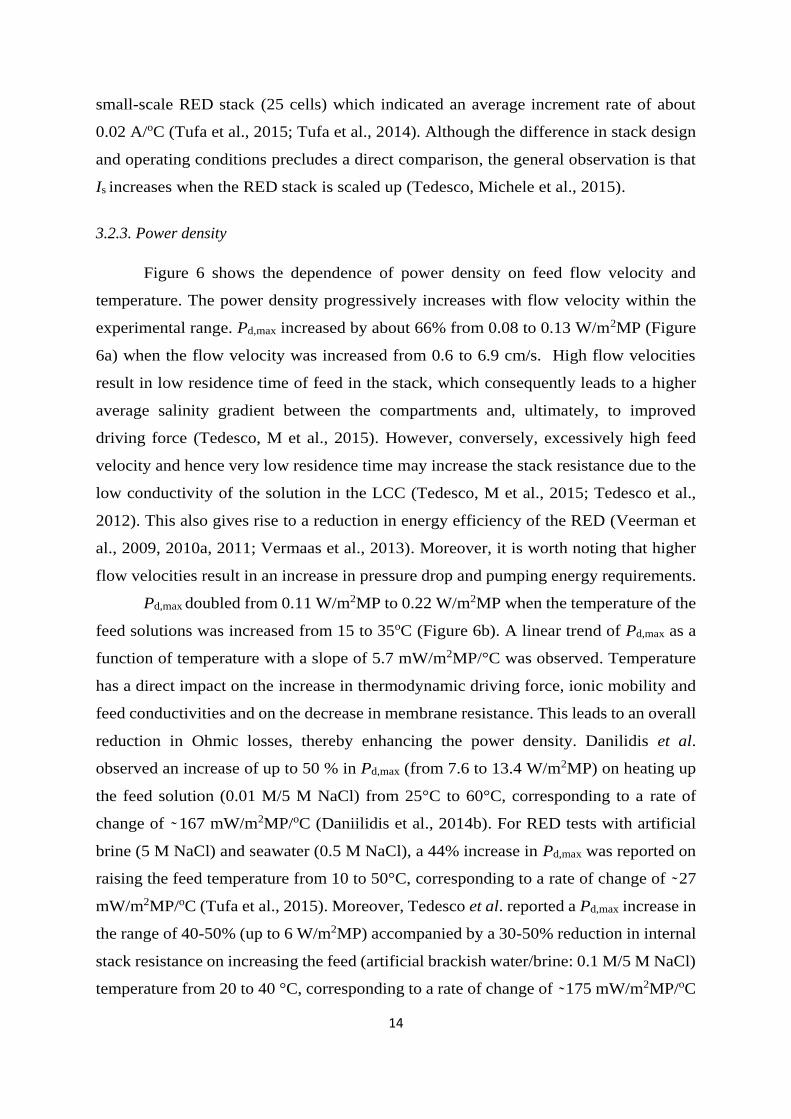
3.2.3. Power density
Figure 6 shows the dependence of power density on feed flow velocity and
temperature. The power density progressively increases with flow velocity within the
experimental range. Pd,max increased by about 66% from 0.08 to 0.13 W/m2MP (Figure
6a) when the flow velocity was increased from 0.6 to 6.9 cm/s. High flow velocities
result in low residence time of feed in the stack, which consequently leads to a higher
average salinity gradient between the compartments and, ultimately, to improved
driving force (Tedesco, M et al., 2015). However, conversely, excessively high feed
velocity and hence very low residence time may increase the stack resistance due to the
low conductivity of the solution in the LCC (Tedesco, M et al., 2015; Tedesco et al.,
2012). This also gives rise to a reduction in energy efficiency of the RED (Veerman et
al., 2009, 2010a, 2011; Vermaas et al., 2013). Moreover, it is worth noting that higher
flow velocities result in an increase in pressure drop and pumping energy requirements.
Pd,max doubled from 0.11 W/m2MP to 0.22 W/m2MP when the temperature of the
feed solutions was increased from 15 to 35oC (Figure 6b). A linear trend of Pd,max as a
function of temperature with a slope of 5.7 mW/m2MP/°C was observed. Temperature
has a direct impact on the increase in thermodynamic driving force, ionic mobility and
feed conductivities and on the decrease in membrane resistance. This leads to an overall
reduction in Ohmic losses, thereby enhancing the power density. Danilidis et al.
observed an increase of up to 50 % in Pd,max (from 7.6 to 13.4 W/m2MP) on heating up
the feed solution (0.01 M/5 M NaCl) from 25°C to 60°C, corresponding to a rate of
change of 167 mW/m2MP/oC (Daniilidis et al., 2014b). For RED tests with artificial
brine (5 M NaCl) and seawater (0.5 M NaCl), a 44% increase in Pd,max was reported on
raising the feed temperature from 10 to 50°C, corresponding to a rate of change of 27
mW/m2MP/oC (Tufa et al., 2015). Moreover, Tedesco et al. reported a Pd,max increase in
the range of 40-50% (up to 6 W/m2MP) accompanied by a 30-50% reduction in internal
stack resistance on increasing the feed (artificial brackish water/brine: 0.1 M/5 M NaCl)
temperature from 20 to 40 °C, corresponding to a rate of change of 175 mW/m2MP/oC
15
(Tedesco, M et al., 2015). A recent study shows a 25% increase in power density for
RED when heating up the feed stream (artificial river water/seawater: 0.017 M/0.5 M
NaCl) from 20 °C to 40 °C, corresponding to a rate of change of 20 mW/m2MP/oC
(Benneker et al., 2017). In general, the increase in Pd,max with the rise in feed temperature
assures the advantage of the thermal heat contained in wastewater.
Figure 6. Power curves at different flow velocities (temperature: 20 oC) and b)
temperatures (flow velocity: 6.9 cm/s) for Na2SO4 (0.01 M/0.3 M) feed solutions.
It is worth noting that an increase in both feed temperature and flow velocity
boosts the energy consumption; this requires an appropriate techno-economic analysis
to establish the optimal operating conditions (Gurreri et al., 2012; Tufa et al., 2015).
With regard to temperature, the availability of low-grade waste heat makes it beneficial,
irrespective of the cost of the input energy (Forman et al., 2016; Luo et al., 2012; Tufa
et al., 2017). This represents a huge advantage in terms of synergetic conversion of the
electrochemical potential of waste streams and low-grade waste heat into electricity, and
further storage as hydrogen by coupling RED with APWEL.
3.3. Hydrogen production by alkaline water electrolysis
The use of non-intermittent RED power to fuel APWEL enables clean and
sustainable hydrogen production. The performance of an APWEL system depends on
several operating parameters, such as temperature, liquid electrolyte concentration,
catalyst and binder loadings (Tufa et al., 2016; Zeng, K. and Zhang, D., 2010).
a) b)

16
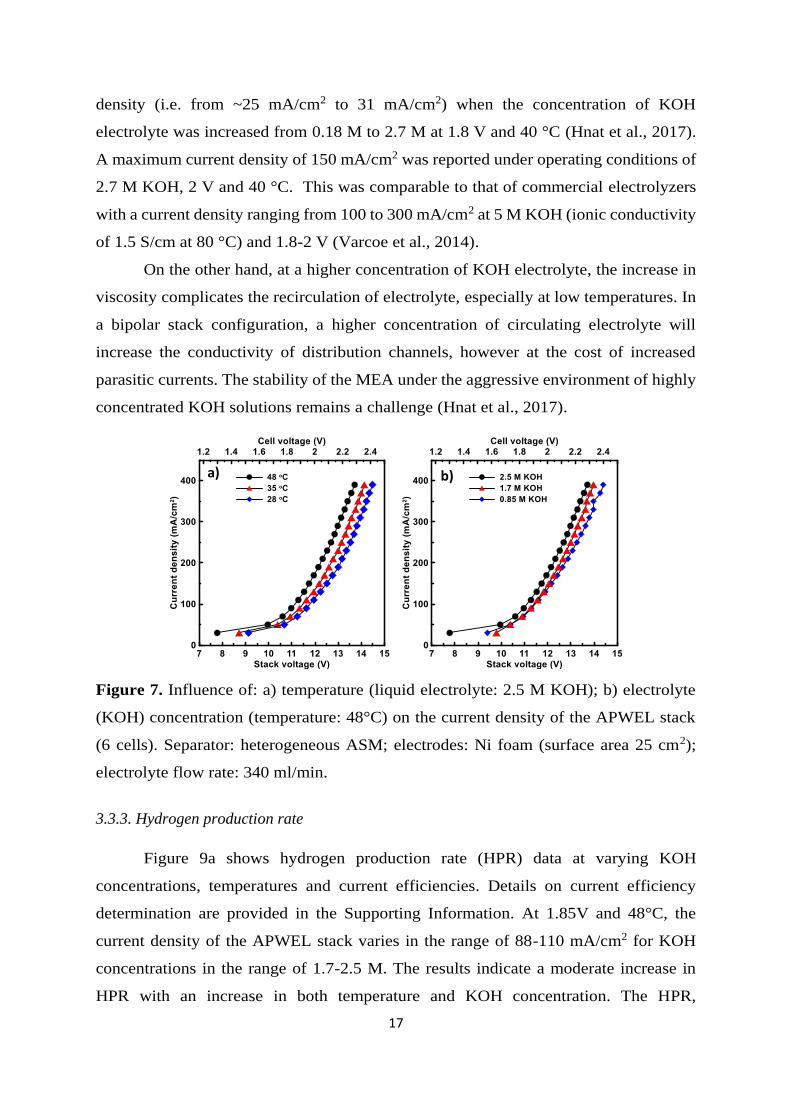
3.3.1. Influence of temperature.
Temperature influences the Ohmic loss and kinetics of an electrochemical reaction
at the three-phase interface (electrode, catalyst and electrolyte) (Kang et al., 2017; Lee
et al., 2016). In this regard, an increase in temperature is expected to reduce the stack
voltage needed to attain the required current density (Li et al., 2016; Marini et al., 2012).
A rise in temperature improves the performance of a water electrolysis system to a
certain extent (Figure 7a): when the temperature is raised from 28 to 48oC the stack
voltage progressively decreases from 11.2 V to 10.6 V. A current density of 75 mA/cm2
was recorded at 28oC and cell voltage of 1.85 V. When raising the electrolyte
temperature to 48oC, the current density increased to 110 mA/cm2. A voltage of 1.85 V
was chosen as the value corresponding to the lower limit of industrial operational
conditions which is equivalent to a thermoneutral efficiency of 80 % vs. Vth of water
splitting (see Section 2.2.1).
The impact of temperature, particularly on the overpotential of the oxygen
evolution reaction at the anode which is detrimental to the overall cell performance, is
significant (Xu et al., 2011; Zhang et al., 2006). A study of micro-alkaline water
electrolyzers by Wendt et al. indicated a 20% reduction (from 0.35 V to 0.28 V) of
oxygen overpotential by shifting the temperature from 90 to 160oC at a current density
of 1 A/cm2 (Wendt and Plzak, 1983).
3.3.2. Influence of electrolyte concentration.
Figure 7b shows the effect of electrolyte concentration on the performance of the
APWEL stack. The cell voltage declines moderately with an increase in electrolyte
(KOH) concentration. For a current density in the range of 90-390 mA/cm2, the cell
voltage drops, on average, by 2.5% on increasing the KOH concentration from 0.85 M
to 2.5 M at 48oC. At a cell voltage of 1.85V and 48oC, corresponding to Vstack of 11.1 V,
the current density increases from 86 to 110 mA/cm2 when the KOH concentration is
shifted from 0.85 M to 2.5 M KOH. The use of concentrated KOH improves the
conductivity of the electrolyte, thus facilitating the ionic contact between the catalytic
layer and the membrane, and it improves utilization of the 3D structure of the electrode,
thereby enhancing the electrolyzer’s performance. A recent study by Hnát et al. on a
single-cell alkaline electrolyzer equipped with a novel 1,4-diazabicyclo[2.2.2]octane
(DABCO)-functionalized AEM indicated an approximately 20% increase in current
17
density (i.e. from ~25 mA/cm2 to 31 mA/cm2) when the concentration of KOH
electrolyte was increased from 0.18 M to 2.7 M at 1.8 V and 40 °C (Hnat et al., 2017).
A maximum current density of 150 mA/cm2 was reported under operating conditions of
2.7 M KOH, 2 V and 40 °C. This was comparable to that of commercial electrolyzers
with a current density ranging from 100 to 300 mA/cm2 at 5 M KOH (ionic conductivity
of 1.5 S/cm at 80 °C) and 1.8-2 V (Varcoe et al., 2014).
On the other hand, at a higher concentration of KOH electrolyte, the increase in
viscosity complicates the recirculation of electrolyte, especially at low temperatures. In
a bipolar stack configuration, a higher concentration of circulating electrolyte will
increase the conductivity of distribution channels, however at the cost of increased
parasitic currents. The stability of the MEA under the aggressive environment of highly
concentrated KOH solutions remains a challenge (Hnat et al., 2017).
Figure 7. Influence of: a) temperature (liquid electrolyte: 2.5 M KOH); b) electrolyte
(KOH) concentration (temperature: 48°C) on the current density of the APWEL stack
(6 cells). Separator: heterogeneous ASM; electrodes: Ni foam (surface area 25 cm2);
electrolyte flow rate: 340 ml/min.
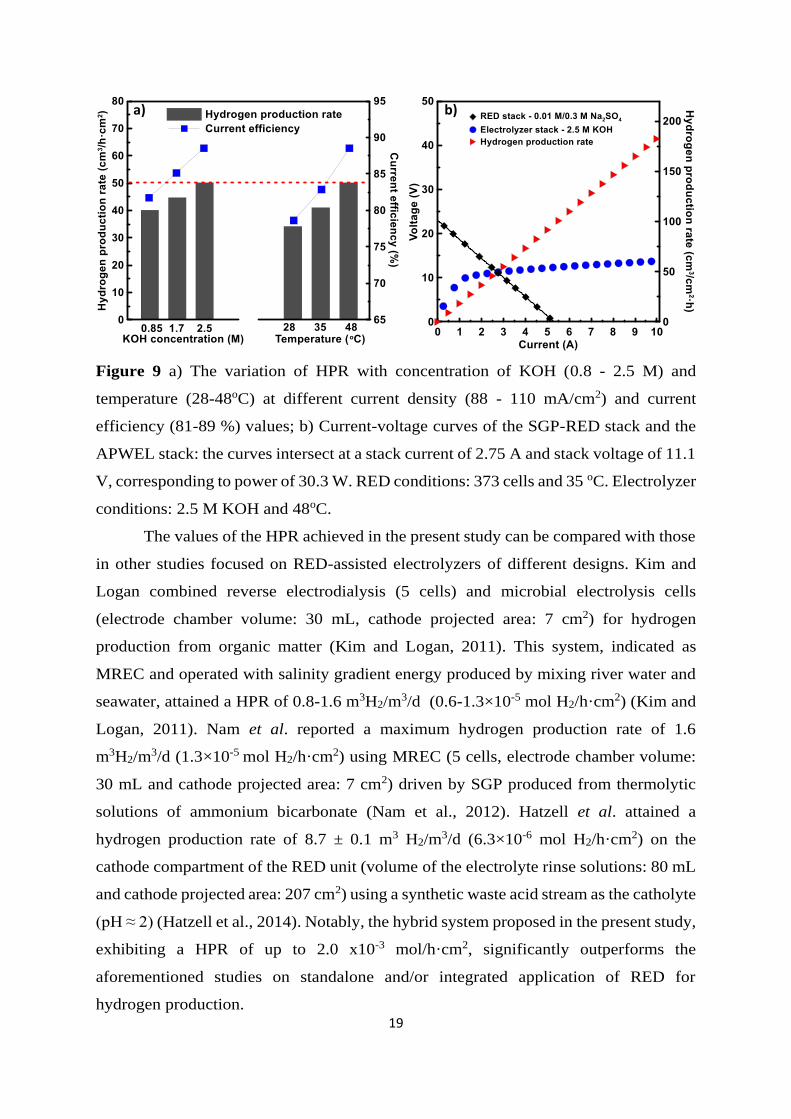
3.3.3. Hydrogen production rate
Figure 9a shows hydrogen production rate (HPR) data at varying KOH
concentrations, temperatures and current efficiencies. Details on current efficiency
determination are provided in the Supporting Information. At 1.85V and 48°C, the
current density of the APWEL stack varies in the range of 88-110 mA/cm2 for KOH
concentrations in the range of 1.7-2.5 M. The results indicate a moderate increase in
HPR with an increase in both temperature and KOH concentration. The HPR,
a) b)

18
normalized to an electrode area of 25 cm2, increased from 40 to 50 cm3/h·cm2 (1.6×10-
3 to 2.0×10⁻³ mol/h·cm2) when the KOH concentration was changed from 0.85 to 2.5 M
at 48 °C. Under optimal conditions, when the maximum HPR reached 50 cm3/h·cm2,
the electrolyzer energy consumption was about 5 kWh/Nm3 of H2. A previous study of
a single-cell APWEL stack indicated a current density of 57 mA/cm2, corresponding to
a HPR of 26 cm3/h·cm2 (1.1×10⁻³ mol/h·cm2) at a cell voltage of 1.85 V, 1.7 M KOH
electrolyte solution and 45 oC (Tufa et al., 2016). This is comparable to the present
APWEL stack which attained a HPR of 45 cm3/h·cm2 (1.8×10⁻³ mol/h·cm2) under
similar conditions.
In order to identify the operating point where the power requirement of the
APWEL meets the power output of the RED stack, the polarization curves of the two
systems were analyzed concurrently. Figure 9b presents the polarization curves of the
APWEL stack and the pilot-scale RED stack. Under optimal conditions (1.85 V, 2.5 M
KOH), the current flow in the APWEL stack is 2.75 A and the Vstack is 11.1 V. This
corresponds to a total power dissipation of 30.3 W. In order to achieve this power
dissipation, the number of cells in the SGP-RED stack was increased to 373 cells for
operations with Na2SO4 (0.01 M/0.3 M at 35oC). Under these conditions, the
polarization curve of the RED stack and APWEL stack intersect at a cell voltage of 1.85
V and a current of 2.75 A, attaining a HPR of 50 cm3/h·cm2.
19
Figure 9 a) The variation of HPR with concentration of KOH (0.8 - 2.5 M) and
temperature (28-48oC) at different current density (88 - 110 mA/cm2) and current
efficiency (81-89 %) values; b) Current-voltage curves of the SGP-RED stack and the
APWEL stack: the curves intersect at a stack current of 2.75 A and stack voltage of 11.1
V, corresponding to power of 30.3 W. RED conditions: 373 cells and 35 oC. Electrolyzer
conditions: 2.5 M KOH and 48oC.
The values of the HPR achieved in the present study can be compared with those
in other studies focused on RED-assisted electrolyzers of different designs. Kim and
Logan combined reverse electrodialysis (5 cells) and microbial electrolysis cells
(electrode chamber volume: 30 mL, cathode projected area: 7 cm2) for hydrogen
production from organic matter (Kim and Logan, 2011). This system, indicated as
MREC and operated with salinity gradient energy produced by mixing river water and
seawater, attained a HPR of 0.8-1.6 m3H2/m3/d (0.6-1.3×10⁻⁵ mol H2/h·cm2) (Kim and
Logan, 2011). Nam et al. reported a maximum hydrogen production rate of 1.6
m3H2/m3/d (1.3×10⁻⁵ mol H2/h·cm2) using MREC (5 cells, electrode chamber volume:
30 mL and cathode projected area: 7 cm2) driven by SGP produced from thermolytic
solutions of ammonium bicarbonate (Nam et al., 2012). Hatzell et al. attained a
hydrogen production rate of 8.7 ± 0.1 m3 H2/m3/d (6.3×10⁻⁶ mol H2/h·cm2) on the
cathode compartment of the RED unit (volume of the electrolyte rinse solutions: 80 mL
and cathode projected area: 207 cm2) using a synthetic waste acid stream as the catholyte
(pH ≈ 2) (Hatzell et al., 2014). Notably, the hybrid system proposed in the present study,
exhibiting a HPR of up to 2.0 x10⁻³ mol/h·cm2, significantly outperforms the
aforementioned studies on standalone and/or integrated application of RED for
hydrogen production.
b)a)

20
Although technically possible, single-step hydrogen production directly on RED
electrodes is very demanding from the point of view of design and operation: the
electrolyzer would require a sufficient number of RED cells in order to provide the
necessary voltage at the terminal electrodes, each stack corresponding to just a single
alkaline water electrolysis cell. Each such cell needs to be equipped with the necessary
hydraulic and gas separation infrastructure. As a result, the complexity of the entire
system would increase enormously. On the other hand, integrating RED with a separate
APWEL unit offers the advantage of flexibility, with the possibility to use the excess
power produced by RED exclusively for grid power supply or simultaneously with
hydrogen production.
5. Economic aspects
The cost of the hybrid RED-APWEL system proposed in the present study operating
on industrial sulfate waste streams calls for a breakdown of the individual units. The
cost of electricity from industrial waste streams is directly related to that of installing a
RED plant. The cost of a RED plant is mainly dependent on the membranes. In fact,
given a current membrane price of about 50 €/m2, RED is a more expensive technology
than other renewable energy sources like wind and solar (Daniilidis et al., 2014a).
However, with process intensification the use of novel, low-cost membranes would
make a huge contribution to the reduction of the cost of RED in the near future. A
feasibility study shows that the cost of electricity could drop to 0.18 €/kWh, given that
cheap raw materials and manufacturing technologies could reduce the membrane price
to 4.3 €/m2 (Daniilidis et al., 2014a). Moreover, further optimization of RED would
result in levelized costs of electricity of about 0.11-0.20 €/ kWh by 2020. The critical
issue concerning the use of SO42--rich waste streams in RED is system performance,
which requires further optimization.
The cost perspective for alkaline water electrolysis is quite different from that of
RED. A typical electrolyzer set-up consists of an electrolysis stack and storage units
based on a conventional cylinder tank or tailored ones with a specific material that
adsorbs and desorbs hydrogen. All of these factors contribute to the total installation
cost which depends mainly on plant size and site‐specific characteristics. For a capacity in the
range of 1,000‐1,200 €/kW, Bertuccioli et al. estimated 1,100 €/kW as the main investment
cost with a projected large potential decrease to 580 €/kW by 2030 (Luca Bertuccioli, 2014).
21
A system cost breakdown for alkaline water electrolysis reveals that the stack accounts
for up to 50% of the overall cost. Membranes contribute only about 7% of the overall
stack cost and about 3.5% of the entire system (Kuckshinrichs et al., 2017). Therefore,
the impact of introducing a new membrane is not a major issue in terms of the overall
cost of alkaline water electrolysis systems unlike the case of RED.
4. Conclusions and outlook
The use of SO42--rich industrial waste streams for power generation represents a
promising alternative for the valorization of industrial waste streams. An APWEL stack,
continuously fuelled by SGP-RED operating on industrial waste streams, ensures an
environmentally benign hydrogen production route. A maximum HPR of 50 cm3/h·cm2
was attained under the best conditions (1.85 V/cell, 2.5 M KOH, 48°C). However,
further optimization in terms of materials and process is required to meet commercial
requirements. The use of highly active, stable electrodes and electrocatalysts both for
the anodic and cathodic reactions along with the development of a highly conductive
and stable ASM are among the core research targets to improve the efficiency of
APWEL. Moreover, an improved design of the APWEL stacks would also facilitate
efficient pressurization; this would bring about a huge cost reduction and plant
simplification, without the need for subsequent hydrogen compression. For RED,
further optimization of ion-exchange membranes for fast transport of SO42- ions is
crucial to enhance the output power of RED. The apparent permselectivity of
membranes in Na2SO4 is low due to lower ionic flux (5.58x10⁻⁸ mol/cm2·s) and low bulk
transport number (0.449) of SO42- ions across AEMs (Güler et al., 2014). Future
research should also focus on optimal stack design, reduction of hydraulic friction
losses, assessment of pre-treatment requirements and exploration of various other
wastewater resources for power generation (Act, 2003; Di Salvo et al., 2017; Dil et al.,
2018; Dil et al., 2016; Siles et al., 2010). Moreover, a more advanced techno-economic
assessment of the RED-APWEL system using industrial waste streams with different
operating conditions, system design and efficiency and supported by experimental
outputs, is the subject of future studies.
22
Acknowledgments
The financial support of the Education, Audiovisual and Culture Executive
Agency (EACEA) under the Program “Erasmus Mundus Doctorate in Membrane
Engineering”-EUDIME (FPA 2011-0014) is kindly acknowledged. Ramato A. Tufa
acknowledges the financial support of the European Union’s Horizon 2020 research and
innovation programme under the Marie Skłodowska-Curie Actions IF Grant agreement
No. 748683. Additionally, the financial support of this research received from the Grant
Agency of the Czech Republic under project No. 16-20728S is gratefully acknowledged.
References
Act, T., 2003. Standards for Effluent Discharge Regulations. Ministry of Environment and
Sustainable Development: Port Louis, Port Louis District, Mauritius.
Avci, A.H., Sarkar, P., Tufa, R.A., Messana, D., Argurio, P., Fontananova, E., Di Profio, G.,
Curcio, E., 2016. Effect of Mg2+ ions on energy generation by Reverse Electrodialysis.
Journal of Membrane Science 520, 499-506.
Benneker, A.M., Rijnaarts, T., Lammertink, R.G.H., Wood, J.A., 2018. Effect of temperature
gradients in (reverse) electrodialysis in the Ohmic regime. Journal of Membrane Science
548, 421-428.
Bobicki, E.R., Liu, Q., Xu, Z., Zeng, H., 2012. Carbon capture and storage using alkaline
industrial wastes. Prog Energ Combust 38(2), 302-320.
Chanda, D., Hnat, J., Dobrota, A.S., Pasti, I.A., Paidar, M., Bouzek, K., 2015. The effect of
surface modification by reduced graphene oxide on the electrocatalytic activity of nickel
towards the hydrogen evolution reaction. Physical Chemistry Chemical Physics 17(40),
26864-26874.
Daniilidis, A., Herber, R., Vermaas, D.A., 2014a. Upscale potential and financial feasibility
of a reverse electrodialysis power plant. Applied Energy 119, 257-265.
Daniilidis, A., Vermaas, D.A., Herber, R., Nijmeijer, K., 2014b. Experimentally obtainable
energy from mixing river water, seawater or brines with reverse electrodialysis.
Renewable Energy 64, 123-131.
Di Salvo, J.L., Cosenza, A., Cipollina, A., Tamburinia, A., Micale, G., 2017. Experimental
analysis of a continuously operated reverse electrodialysis unit fed with wastewaters.
Chemical Engineering Transactions 60, 307-312.
Dil, E.A., Ghaedi, M., Asfaram, A., Bazrafshan, A.A., 2018. Ultrasound wave assisted
adsorption of congo red using gold-magnetic nanocomposite loaded on activated carbon:
Optimization of process parameters. Ultrasonics Sonochemistry 46, 99-105.
Dil, E.A., Ghaedi, M., Asfaram, A., Mehrabi, F., 2017a. Application of modificated magnetic
nanomaterial for optimization of ultrasound-enhanced removal of Pb2+ ions from aqueous
solution under experimental design: Investigation of kinetic and isotherm. Ultrasonics
Sonochemistry 36, 409-419.
Dil, E.A., Ghaedi, M., Ghezelbash, G.R., Asfaram, A., 2017b. Multi-responses optimization
of simultaneous biosorption of cationic dyes by live yeast Yarrowia lipolytica 70562 from
23
binary solution: Application of first order derivative spectrophotometry. Ecotoxicology
and Environmental Safety 139, 158-164.
Dil, E.A., Ghaedi, M., Ghezelbash, G.R., Asfaram, A., Ghaedi, A.M., Mehrabi, F., 2016.
Modeling and optimization of Hg2+ ion biosorption by live yeast Yarrowia lipolytica
70562 from aqueous solutions under artificial neural network-genetic algorithm and
response surface methodology: kinetic and equilibrium study. RSC Advances 6(59),
54149-54161.
Długołęcki, P., Anet, B., Metz, S.J., Nijmeijer, K., Wessling, M., 2010a. Transport
limitations in ion exchange membranes at low salt concentrations. Journal of Membrane
Science 346(1), 163-171.
Długołȩcki, P., Gambier, A., Nijmeijer, K., Wessling, M., 2009. Practical potential of reverse
electrodialysis as process for sustainable energy generation. Environmental Science and
Technology 43(17), 6888-6894.
Długołęcki, P., Ogonowski, P., Metz, S.J., Saakes, M., Nijmeijer, K., Wessling, M., 2010b.
On the resistances of membrane, diffusion boundary layer and double layer in ion
exchange membrane transport. Journal of Membrane Science 349(1–2), 369-379.
Farrell, E., Hassan, M.I., Tufa, R.A., Tuomiranta, A., Avci, A.H., Politano, A., Curcio, E.,
Arafat, H.A., 2017. Reverse electrodialysis powered greenhouse concept for water- and
energy-self-sufficient agriculture. Applied Energy 187, 390-409.
Fontananova, E., Messana, D., Tufa, R.A., Nicotera, I., Kosma, V., Curcio, E., van Baak, W.,
Drioli, E., Di Profio, G., 2017. Effect of solution concentration and composition on the
electrochemical properties of ion exchange membranes for energy conversion. Journal of
Power Sources 340, 282-293.
Fontananova, E., Zhang, W., Nicotera, I., Simari, C., van Baak, W., Di Profio, G., Curcio, E.,
Drioli, E., 2014. Probing membrane and interface properties in concentrated electrolyte
solutions. Journal of Membrane Science 459(0), 177-189.
Forman, C., Muritala, I.K., Pardemann, R., Meyer, B., 2016. Estimating the global waste heat
potential. Renewable and Sustainable Energy Reviews 57(Supplement C), 1568-1579.
Götz, M., Lefebvre, J., Mörs, F., Koch, A.M., Graf, F., Bajohr, S., Reimert, R., Kolb, T.,
2016. Renewable Power-to-Gas: A technological and economic review. Renewable
Energy 85, 1371-1390.
Güler, E., Elizen, R., Saakes, M., Nijmeijer, K., 2014. Micro-structured membranes for
electricity generation by reverse electrodialysis. Journal of Membrane Science 458(0),
136-148.
Güler, E., Elizen, R., Vermaas, D.A., Saakes, M., Nijmeijer, K., 2013. Performance-
determining membrane properties in reverse electrodialysis. Journal of Membrane Science
446(0), 266-276.
Gurreri, L., Tamburini, A., Cipollina, A., Micale, G., 2012. CFD analysis of the fluid flow
behavior in a reverse electrodialysis stack. Desalination and Water Treatment 48(1-3),
390-403.
Hatzell, M.C., Zhu, X., Logan, B.E., 2014. Simultaneous Hydrogen Generation and Waste
Acid Neutralization in a Reverse Electrodialysis System. ACS Sustainable Chemistry &
Engineering 2(9), 2211-2216.
Hnát, J., Paidar, M., Schauer, J., Žitka, J., Bouzek, K., 2011. Polymer anion selective
membranes for electrolytic splitting of water. Part I: stability of ion-exchange groups and
impact of the polymer binder. Journal of Applied Electrochemistry 41(9), 1043-1052.
Hnát, J., Paidar, M., Schauer, J., Žitka, J., Bouzek, K., 2012. Polymer anion-selective
membranes for electrolytic splitting of water. Part II: Enhancement of ionic conductivity
and performance under conditions of alkaline water electrolysis. Journal of Applied
Electrochemistry 42(8), 545-554.
24
Hnat, J., Plevova, M., Zitka, J., Paidar, M., Bouzek, K., 2017. Anion-selective materials with
1,4-diazabicyclo[2.2.2]octane functional groups for advanced alkaline water electrolysis.
Electrochimica Acta 248, 547-555.
Ju, W., Heinz, M.V.F., Pusterla, L., Hofer, M., Fumey, B., Castiglioni, R., Pagani, M.,
Battaglia, C., Vogt, U.F., 2018. Lab-Scale Alkaline Water Electrolyzer for Bridging
Material Fundamentals with Realistic Operation. ACS Sustainable Chemistry &
Engineering 6(4), 4829-4837.
Kang, Z., Mo, J., Yang, G., Li, Y., Talley, D.A., Retterer, S.T., Cullen, D.A., Toops, T.J.,
Brady, M.P., Bender, G., Pivovar, B.S., Green, J.B., Zhang, F.-Y., 2017. Thin film surface
modifications of thin/tunable liquid/gas diffusion layers for high-efficiency proton
exchange membrane electrolyzer cells. Applied Energy 206(Supplement C), 983-990.
Kim, Y., Logan, B.E., 2011. Hydrogen production from inexhaustible supplies of fresh and
salt water using microbial reverse-electrodialysis electrolysis cells. Proceedings of the
National Academy of Sciences of the United States of America 108(39), 16176-16181.
Lee, B.-S., Park, H.-Y., Choi, I., Cho, M.K., Kim, H.-J., Yoo, S.J., Henkensmeier, D., Kim,
J.Y., Nam, S.W., Park, S., Lee, K.-Y., Jang, J.H., 2016. Polarization characteristics of a
low catalyst loading PEM water electrolyzer operating at elevated temperature. Journal of
Power Sources 309(Supplement C), 127-134.
Levene, J.I., Mann, M.K., Margolis, R.M., Milbrandt, A., 2007. An analysis of hydrogen
production from renewable electricity sources. Solar Energy 81(6), 773-780.
Logan, B.E., Elimelech, M., 2012. Membrane-based processes for sustainable power
generation using water. Nature 488(7411), 313-319.
Luca Bertuccioli, A.C., David Hart, Franz Lehner, Ben Madden, Eleanor Standen, 2014.
Development of water electrolysis in the European Union. Cambridge, United Kingdon.
Luo, F., Wang, Y., Jiang, C., Wu, B., Feng, H., Xu, T., 2017. A power free electrodialysis
(PFED) for desalination. Desalination 404, 138-146.
Luo, X., Cao, X., Mo, Y., Xiao, K., Zhang, X., Liang, P., Huang, X., 2012. Power generation
by coupling reverse electrodialysis and ammonium bicarbonate: Implication for recovery
of waste heat. Electrochem. Commun. 19, 25.
Mehrabi, F., Alipanahpour Dil, E., 2017. Investigate the ultrasound energy assisted
adsorption mechanism of nickel(II) ions onto modified magnetic cobalt ferrite
nanoparticles: Multivariate optimization. Ultrasonics Sonochemistry 37, 37-46.
Nam, J.-Y., Cusick, R.D., Kim, Y., Logan, B.E., 2012. Hydrogen Generation in Microbial
Reverse-Electrodialysis Electrolysis Cells Using a Heat-Regenerated Salt Solution.
Environmental Science & Technology 46(9), 5240-5246.
Quist-Jensen, C.A., Macedonio, F., Horbez, D., Drioli, E., 2017. Reclamation of sodium
sulfate from industrial wastewater by using membrane distillation and membrane
crystallization. Desalination 401, 112-119.
Siles, J.A., Brekelmans, J., Martín, M.A., Chica, A.F., Martín, A., 2010. Impact of ammonia
and sulphate concentration on thermophilic anaerobic digestion. Bioresource Technology
101(23), 9040-9048.
Tedesco, M., Brauns, E., Cipollina, A., Micale, G., Modica, P., Russo, G., Helsen, J., 2015.
Reverse Electrodialysis with saline waters and concentrated brines: a laboratory
investigation towards technology scale-up. Journal of Membrane Science 492, 9-20.
Tedesco, M., Cipollina, A., Tamburini, A., van Baak, W., Micale, G., 2012. Modelling the
Reverse ElectroDialysis process with seawater and concentrated brines. Desalination and
Water Treatment 49(1-3), 404-424.
Tedesco, M., Mazzola, P., Tamburini, A., Micale, G., Bogle, I.D.L., Papapetrou, M.,
Cipollina, A., 2015. Analysis and simulation of scale-up potentials in reverse
electrodialysis. Desalination and Water Treatment 55(12), 3391-3403.

25
Tedesco, M., Scalici, C., Vaccari, D., Cipollina, A., Tamburini, A., Micale, G., 2016.
Performance of the first reverse electrodialysis pilot plant for power production from
saline waters and concentrated brines. Journal of Membrane Science 500, 33-45.
Tufa, R.A., 2015. Perspectives on environmental ethics in sustainability of membrane based
technologies for water and energy production. Environmental Technology & Innovation 4,
182-193.
Tufa, R.A., Chanda, D., Tundis, L., Hnát, J., Bouzek, K., Veerman, J., Fontananova, E., Di
Profio, G., Curcio, E., 2017. Salinity gradient power driven water electrolysis for hydrogen
production, Chemical Engineering Transactions. pp. 283-288.
Tufa, Ramato A., Curcio, E., Brauns, E., van Baak, W., Fontananova, E., Di Profio, G., 2015.
Membrane Distillation and Reverse Electrodialysis for Near-Zero Liquid Discharge and
low energy seawater desalination. Journal of Membrane Science 496, 325-333.
Tufa, R.A., Curcio, E., van Baak, W., Veerman, J., Grasman, S., Fontananova, E., Di Profio,
G., 2014. Potential of brackish water and brine for energy generation by salinity gradient
power-reverse electrodialysis (SGP-RE). RSC Advances 4(80), 42617-42623.
Tufa, R.A., Pawlowski, S., Veerman, J., Bouzek, K., Fontananova, E., di Profio, G.,
Velizarov, S., Goulão Crespo, J., Nijmeijer, K., Curcio, E., 2018. Progress and prospects
in reverse electrodialysis for salinity gradient energy conversion and storage. Applied
Energy 225, 290-331.
Tufa, R.A., Rugiero, E., Chanda, D., Hnàt, J., van Baak, W., Veerman, J., Fontananova, E.,
Di Profio, G., Drioli, E., Bouzek, K., Curcio, E., 2016. Salinity gradient power-reverse
electrodialysis and alkaline polymer electrolyte water electrolysis for hydrogen production.
Journal of Membrane Science 514, 155-164.
Varcoe, J.R., Atanassov, P., Dekel, D.R., Herring, A.M., Hickner, M.A., Kohl, P.A.,
Kucernak, A.R., Mustain, W.E., Nijmeijer, K., Scott, K., Xu, T., Zhuang, L., 2014. Anion-
exchange membranes in electrochemical energy systems. Energy & Environmental
Science 7(10), 3135-3191.
Veerman, J., Post, J.W., Saakes, M., Metz, S.J., Harmsen, G.J., 2008. Reducing power losses
caused by ionic shortcut currents in reverse electrodialysis stacks by a validated model.
Journal of Membrane Science 310(1-2), 418-430.
Veerman, J., Saakes, M., Metz, S.J., Harmsen, G.J., 2009. Reverse electrodialysis:
Performance of a stack with 50 cells on the mixing of sea and river water. Journal of
Membrane Science 327(1-2), 136-144.
Veerman, J., Saakes, M., Metz, S.J., Harmsen, G.J., 2010a. Electrical power from sea and
river water by reverse electrodialysis: A first step from the laboratory to a real power plant.
Environmental Science and Technology 44(23), 9207-9212.
Veerman, J., Saakes, M., Metz, S.J., Harmsen, G.J., 2010b. Reverse electrodialysis:
evaluation of suitable electrode systems. Journal of Applied Electrochemistry 40(8), 1461-
1474.
Veerman, J., Saakes, M., Metz, S.J., Harmsen, G.J., 2011. Reverse electrodialysis: A
validated process model for design and optimization. Chemical Engineering Journal
166(1), 256-268.
Vermaas, D.A., Saakes, M., Nijmeijer, K., 2011. Doubled Power Density from Salinity
Gradients at Reduced Intermembrane Distance. Environmental Science & Technology
45(16), 7089-7095.
Vermaas, D.A., Veerman, J., Yip, N.Y., Elimelech, M., Saakes, M., Nijmeijer, K., 2013.
High Efficiency in Energy Generation from Salinity Gradients with Reverse
Electrodialysis. ACS Sustainable Chemistry & Engineering 1(10), 1295-1302.
26
Wang, M., Wang, Z., Gong, X., Guo, Z., 2014. The intensification technologies to water
electrolysis for hydrogen production–A review. Renewable and Sustainable Energy
Reviews 29, 573-588.
Wendt, H., Plzak, V., 1983. Electrocatalytic and thermal activation of anodic oxygen- and
cathodic hydrogen-evolution in alkaline water electrolysis. Electrochimica Acta 28(1), 27-
34.
Xiao, L., Zhang, S., Pan, J., Yang, C., He, M., Zhuang, L., Lu, J., 2012. First implementation
of alkaline polymer electrolyte water electrolysis working only with pure water. Energy &
Environmental Science 5(7), 7869-7871.
Xu, W., Scott, K., Basu, S., 2011. Performance of a high temperature polymer electrolyte
membrane water electrolyser. Journal of Power Sources 196(21), 8918-8924.
Zeng, K., Zhang, D., 2010. Recent progress in alkaline water electrolysis for hydrogen
production and applications. Prog Energ Combust 36(3), 307-326.
Zeng, K., Zhang, D.K., 2010. Recent progress in alkaline water electrolysis for hydrogen
production and applications. Prog Energ Combust 36(3), 307-326.
Zhang, J., Xie, Z., Zhang, J., Tang, Y., Song, C., Navessin, T., Shi, Z., Song, D., Wang, H.,
Wilkinson, D.P., Liu, Z.-S., Holdcroft, S., 2006. High temperpature PEM fuel cells.
Journal of Power Sources 160(2), 872-891.


![Agro-industrial Wastewater Treatment by Electrolysis ... · of agro-industrial wastewaters, which contain high concentrations of biodegradable organic matter (in terms of BOD) [11].](https://static.fdocuments.us/doc/165x107/60949681b70af0649a2b0793/agro-industrial-wastewater-treatment-by-electrolysis-of-agro-industrial-wastewaters.jpg)