Sedimentation Management in Flood Control Dams - AgEcon Search
22
Sediment Management in Flood Control Dams Maneechit Pattanapanchai 1 , Farhed Shah 2 and George Annandale 3 Abstract: Reservoir sedimentation reduces economic value and longevity of flood control dams. Periodic sediment removal allows extension of reservoir life. An optimal control model is developed to evaluate alternative sediment management strategies for flood control dams. An illustrative empirical analysis shows that sustainable management is economically desirable for a wide range of parameter values. Key Words: flood control, sedimentation, dams, cost-benefit analysis. JEL Codes: Q25, Q27 American Agricultural Economics Association Annual Meeting 2002 Long Beach, CA. July 27-31. Copyright 2002 by Maneechit Pattanapanchai, Farhed Shah and George Annandale. All rights reserved. Readers may make verbatim copies of this document for non-commercial purposes by any means, provided that this copyright notice appears on such all copies. 1, 2 Department of Agricultural and Resource Economics, University of Connecticut, 1376 Storrs Road, Storrs, CT 06269-4021 3 Engineering & Hydrosystems, Inc., 8122 SouthPark Lane, Littleton, CO 80120 Primary contact: Maneechit Pattanapanchai, Department of Agricultural and Resource Economics, 318 WBY, University of Connecticut, 1376 Storrs Road, U-21, Storrs, CT 06269- 4021. E-Mail: [email protected] 1
Transcript of Sedimentation Management in Flood Control Dams - AgEcon Search

Sediment Management in Flood Control Dams
Maneechit Pattanapanchai 1, Farhed Shah2 and George Annandale3
Abstract: Reservoir sedimentation reduces economic value and longevity of flood control dams. Periodic sediment removal allows extension of reservoir life. An optimal control model is developed to evaluate alternative sediment management strategies for flood control dams. An illustrative empirical analysis shows that sustainable management is economically desirable for a wide range of parameter values.
Key Words: flood control, sedimentation, dams, cost-benefit analysis.
JEL Codes: Q25, Q27
American Agricultural Economics Association Annual Meeting 2002 Long Beach, CA. July 27-31.
Copyright 2002 by Maneechit Pattanapanchai, Farhed Shah and George Annandale. All rights reserved. Readers may make verbatim copies of this document for non-commercial purposes by any means, provided that this copyright notice appears on such all copies.
1, 2 Department of Agricultural and Resource Economics, University of Connecticut, 1376 Storrs Road, Storrs, CT 06269-4021 3 Engineering & Hydrosystems, Inc., 8122 SouthPark Lane, Littleton, CO 80120 Primary contact: Maneechit Pattanapanchai, Department of Agricultural and Resource Economics, 318 WBY, University of Connecticut, 1376 Storrs Road, U-21, Storrs, CT 06269-4021. E-Mail: [email protected]
1
Sedimentation Management in Flood Control Dams
I. Introduction
Each year millions of dollars worth of property and other valuables are lost due to floods.
A dam can prevent or reduce downstream flood damage by temporarily storing a large part of the
storm runoff. Reservoir sedimentation leads to decrease in storage capacity, which in turn can
significantly impair the ability of a dam to perform this function. Also, sedimentation might
cause structural damage and increase maintenance cost of operating the dam and/or lead to costly
decommissioning at an earlier date. Periodic sediment removal, using techniques such as
flushing, hydrosuction, or mechanical dredging, can play an important role in extending the
useful life of dams.
This paper presents an optimal control model that helps determine the desirable timing
and extent of sediment removal from a flood control dam. Sediment removal is expensive, but it
needs to be compared against other alternatives. The model extends the work of Palmieri, Shah,
and Dinar (2001) who consider flushing a reservoir that serves irrigation or hydropower purposes
only. The problem we address is conceptually more complex because of the fact that floods are
probabilistic events. We also believe it is an important practical problem that has hitherto been
ignored in the economics literature.
The paper is organized as follows. Section II provides background information and
reviews the literature on sedimentation and flood control dams. Section III discusses our general
model. Section IV presents the results of an illustrative case study that uses data from a flood
control dam in Connecticut. Section V concludes the paper.

II. Background and Literature Review
In the United States, about 7 percent of the land is in floodplains. The most common
cause of flooding is high rate of runoff from heavy and prolonged rain. Floods cause enormous
economics losses, both directly and indirectly. In 1981, the estimated direct damage from
flooding in the United States averaged around $2.2 billion annually and was expected to increase
(WRC, 1981).
About 25 percent of dams in the U.S. have been built primarily for flood control
purposes. The first flood prevention dam under the Flood Control Act was constructed in 1938.
Since then, more than 10,000 dams have been added under small watershed programs. Earlier
dams were built with a 50-year life span, which meant that the lakes were expected to fill with
sediment in 50 years. Later dams were built for a 100-year life span. As of now, a vast majority
of these dams are reaching or have already past their expected life span. In many cases,
sedimentation is significantly affecting reservoir ability to hold floodwater. As a result, we are
now facing with a decision whether to rehabilitate or retire these dams.
A recent study by United Nations Environment Program (2001) indicates that worldwide
reservoir storage lost because of mud and silt is about 1 percent annually. In 1999, the World
Bank organized a workshop of experts in the field of reservoir sediment management. Following
the workshop, research concentrated on building on the work of Palmieri, Shah, and Dinar
(2001) by developing software that has the ability to identify economically optimal sediment
management strategies that are also technically feasible. This computer program, however, only
takes into consideration two types of benefits from storage, namely, irrigation and
hydroelectricity. Flood control benefits have yet to be incorporated, despite the fact that flooding
2
causes enormous damage to both property and life, and many flood control dams are loosing
their ability to prevent flooding due to sedimentation. The purpose of the current paper is to start
filling this gap in the literature.
One of the challenges is to develop a functional relationship for flood damages. Several
approaches have been proposed for estimating residential flood damages. One of the most
widely used is the depth-damage function. This function describes the relationship between the
level (height) of floodwater and the damage to the building structures and content. The damage
is usually measured as a percentage of total value of building structures and content (Davis,
1992). This is the basic approach that we will be adapting for use in our study.
III. Model and Methodology
In our model, a dam provides two types of services: non-flood control (agriculture,
hydroelectricity, recreation, etc.) and flood control. The ability of the dam to provide these
services decreases as remaining reservoir capacity goes down due to sedimentation. Capacity
recovery through sediment removal is often possible, but the process is expensive and may be
constrained by technical feasibility. For the sake of simplification, we consider only flushing as
a sediment removal technique. Other operation and maintenance costs are also accounted, as is
an initial construction cost for new dams. Our problem is to choose a reservoir level sediment
management policy such that total discounted net benefits of the dam are maximized.
The above is a dynamic optimization problem, for which an optimal control formulation
is specified later in this section. We begin, however, with a discussion of some of the key
components of the net benefit function, namely: (1) Non-flood Control Benefits (2) Flood
3

Control Benefits (3) Sediment Removal Costs.
(1) Non-flood Control Benefits
We assume that there is an annual output of services from stored water, i.e., reservoir
yield that represents water available for use in irrigation and/or hydropower. For simplification,
the price of water obtained for these services is taken as a constant, P1, which is then multiplied
by reservoir yield to obtain annual non-flood control benefits.
Reservoir yield is a function of available storage and it decreases over time as the
reservoir storage is lost due to sedimentation. In this paper, we use Gould’s Gamma method for
estimating yield as described in Morris and Fan (1997, pp. 3.20-3.22).
The relationship between storage level, yield, and reliability is
St = {Zp2/[4(1-D)]-d}Cv
2
Where St = storage volume express as hydrological size
Cv = coefficient of variation of annual flows (Cv = Sd/MAR)
Zp = standardized normal variate at p%
D = withdrawal rate as ratio of the mean annual discharge rate (yield)
d = correction factor
MAR = mean annual runoff
Value of d and Zp will depend on the probability of failure and is given in table 3.5 in
Morris and Fan (1997). Reservoir yield (Wt) is equal D*MAR, after substitute for Wt we get
reservoir yield as a function of storage and mean annual runoff as follow:
Wt = (4*MAR*St – Zp2Sd2+4dSd2)/4(d/MAR)Sd2 +St)
Where Zp, St, and d are describe as above and,
4

Wt is reservoir yield at time t
Sd is standard deviation of the mean annual runoff
Using one percent probability of failure the above equation can be rewritten as
Wt = (4*MAR*St – (5.4289)Sd2+(6)Sd2)/4(1.5/MAR)Sd2 +St)
This is the function we use to estimate value of non-flood control benefits in this study.
Assuming that all other variables are given, this reservoir yield is a function only of only
reservoir storage. As a result, we are able to write this reservoir yield as W(St).
(2) Flood Control Benefits
We postulate flood control benefits as the difference between expected damages when
there is no dam and when the dam exists. Dams may be viewed as limiting flood damages by
reducing the likelihood of floods or reducing the damages due to a flood of given magnitude. It
follows that flood control benefits may be taken as the difference between the area under the
damage probability curve without dam and the same curve with dam. This is represented in
Figure 1.
Figure 12
2 Note that this is
Flood damages (loss)
With no dam = dam when filled up
With dam at storage St < S0
With dam at storage S0 Exceedance Probability
5
only a representation. The actual function is not necessarily a straight line.

While the damage probability curve without dam will not change over time, the damages
probability curve with dam will move outward as sedimentation occurs, which will reduce flood
control benefits. This change will continue until the dam is completely silted, at which point
damage probability curve s with dam and without dam will coincide and flood control benefits
will be zero.
Estimation of flood damages is a complex task since many factors both qualitative as well
as quantitative are involved. In general, flood damage can be grouped into two major categories
namely, economic damage and social damage. Economic damage is a lost that can be valued in
economical way (or in monetary value) such as properties, crops, services, etc. Social damage is
a qualitative impact of flood on human’s life such as anxiety, panic, inconvenience and
disruption of social activities. This social damage is hard to represent by monetary value or
estimate in some quantitative form without using a nonmarket valuation procedure. In this study
only economic damages due to flood are considered. Loss of human life is also excluded from
our flood damage estimate for the same reason. Thus, “flood damages” through out this paper
refer to easily economic damages only.
Flood damages are function of characteristics of flood which include flood depth,
duration, and velocity. Among them, flood depth is considered the critical factor that determines
the damages. Depth-damage function is widely used to represent this relationship. This function
differs different among land use patterns (e.g. residential, agriculture, industry, services) and
location. For any flood plain, determination of expected flood damages requires knowledge of
three component terms: i) magnitude and probability of floods, ii) depth-damage function, and
iii) value of all property and land used in the flood plain. We now discuss these components
individually.
6

i) Magnitude and probability of floods
In our simplified approach, a flood occurs when the peak flow coming into a reservoir is
larger than the capacity of reservoir. In this case, the difference between the peak flow level and
the reservoir capacity defines the magnitude of the flood. The flood causes damages that depend
on its magnitude. The probability of a flood of given magnitude is equal to the probability of the
corresponding peak flow level.
Using historical peak flow data at each dam we can construct the distribution of peak
flow. Under the assumption that distribution of peak flow does not change over time, one can get
the probability of each exceed peak flow using a proper density function.
ii) Depth-damage function
Depth of water in the floodplain determines damage. The depth-damage function for
‘building type’ land is distinct from the depth-damage function for ‘agricultural type’ land. The
former relates damages to the percentage of the structural or content value that will be destroyed
by a certain flood depth and has two parts - one for structure and another for content. For
agriculture type land, the depth-damages depend on proportion of flood-free gross return3. This
function is not only a function of depth but also the time (of the year) of flood as well as duration
of flood. Damage to infrastructures and services consist of direct cost, which is the cost of repair
and reconstruct the infrastructure, and indirect cost of disruption of services. Several functional
form of depth-damage function has been discussed and appeared in the literature including Dutta
(1998), Davis (1992), and Kiefer (1996).
A typical residential depth-damage function can be represented as
Y = α + β1X + β2X2 +β3X3 + u
7 3 More details can be found in Dutta (1999), p.113.

where Y is the percent damage to structure or content, α is a constant that represent the
percent damage when flood height is 0, that is the percent damage at the first floor level and X is
the depth of flood
To estimate the depth-damage function , one can use several types of data such as,
historical flood data, survey data of potential losses in properties, or specialist assessments of the
potential losses. The U.S. Army Corp of Engineers has developed various depth-damage
functions for both residential and non-residential structures. However, as we have stated earlier,
the depth-damage function is a location specific. In other words, the depth-damage function for
one location may not be suitable for another.
iii) Value of Structures and Land
In order to get a total monetary value of flood damage for any flood magnitude we need
to multiply the percentage damage of both structure and contents that we get from depth damage
function to the total value of structure and contents. This total value can be estimate using actual
survey data or using secondary spatial data with a median house price as a representative value.
Unfortunately, this type of data is not always readily available.
Expected flood damage at any given flood magnitude is its probability times total
damages. Using annual historical peak flow data, we can get the annual expected flood damage
as a summation of expected flood damage of each magnitude. And we can obtain flood control
benefit for reservoir at storage level St as the difference between expected annual flood damage
without dam and expected annual flood damage with the dam at remaining storage St.
It is suggested in the literature that the average annual flood protection benefits should be
computed from at least three flood events.4 When a dam exists, sediment accumulation in the
8 4 Parker (1987) and Green (2000).

reservoir reduces storage and increases the probability of flood at each magnitude. Thus, annual
expected annual flood damage increases over time. On the other hand, expected annual damage
without dam will not change. As a result, flood control benefits, as defined above, decrease over
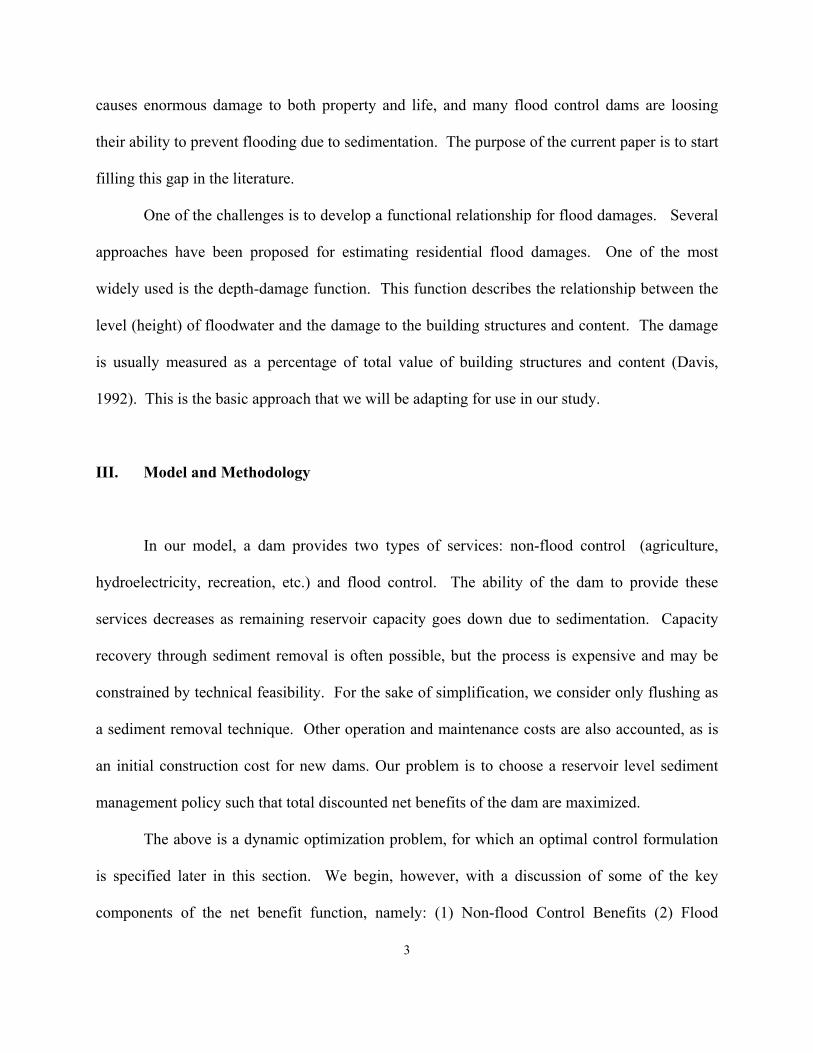
time as sedimentation increases. Figure 2 and 3 below show the relationship between reservoir
storage, expected flood damage, and flood control benefits. Sediment removal will increase
reservoir storage and thus increase both the flood control benefit as well as other benefits.
9
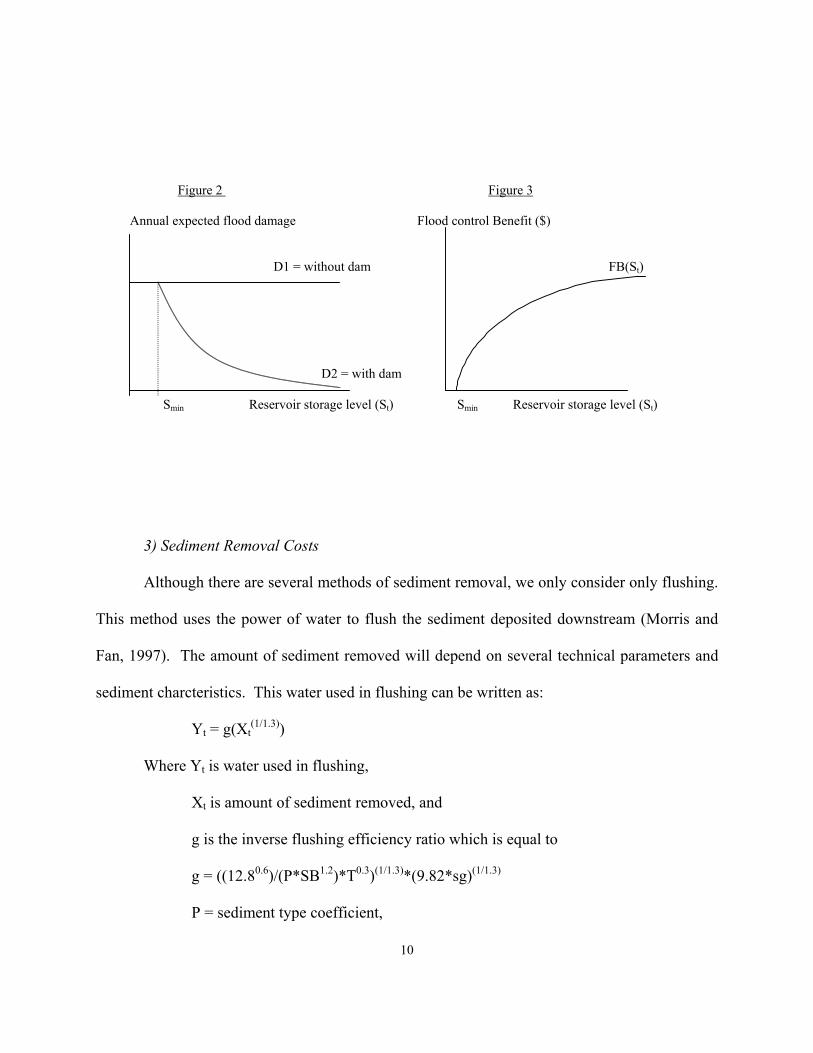
Figure 2 Figure 3 Annual expected flood damage Flood control Benefit ($)
D1 = without dam FB(St) D2 = with dam Smin Reservoir storage level (St) Smin Reservoir storage level (St)
3) Sediment Removal Costs
Although there are several methods of sediment removal, we only consider only flushing.
This method uses the power of water to flush the sediment deposited downstream (Morris and
Fan, 1997). The amount of sediment removed will depend on several technical parameters and
sediment charcteristics. This water used in flushing can be written as:
Yt = g(Xt(1/1.3))
Where Yt is water used in flushing,
Xt is amount of sediment removed, and
g is the inverse flushing efficiency ratio which is equal to
g = ((12.80.6)/(P*SB1.2)*T0.3)(1/1.3)*(9.82*sg)(1/1.3)
P = sediment type coefficient,
10

SB = slope of reservoir bed,
T = Time duration of flushing, and
sg = Specific gravity of sediment.
In addition to the opportunity cost of water used in flushing, the cost of sediment removal
may include other fixed cost that can be accomodated in the model.
Social Planner Problem
Given the above discussion of the components of the net benefit function, we are now in a
position to formulate our social planner problem. We seek to determine the sediment
management strategy that maximizes the net present value of discounted lifetime net benefit. In
mathematical terms, annual sediment removed, X, and lifetime T are to be chosen to
Max Z = ∫T
0 [OBt(S1t) + FBt(S2t) - CO – CS(X)]e-rt + SVe-rt - C
Subject to
dS1t/dt = - α(M-X)
dS2t/dt = -(1- α)(M-X)
S0 = S10 + S20, S0 ≥ S10 ≥ 0
St = S1t + S2t = S0 – (M-X)t
Where FBt(S2t) is flood control benefits,
OBt is other benefits (i.e., non-flood control benefits),
S0 is initial storage capacity,
11

α is the flood control priority parameter,
S10 is the initial reservoir storage allocated for non-flood control purposes,
S20 is the initial reservoir storage allocate for flood control purpose,
St is remaining storage at time t,
r is the discount rate,
CO is annual operating cost,
C is construction cost,
CS is cost of removing sediment, and
SV is salvage value of the dam.
The flood control priority parameter, α, determines how much of the net incoming
sediment will be allocated for the flood control pool and how much will be allocated for the
other purposes pool. When α equal to one, all sediment deposited is allocated to the other
purpose pool, thus maintaining the flood control storage. This indicates that the management’s
priority is given to flood control purpose. When α is zero all sediment will be allocated to flood
control pool and the management’s priority is for other purposes.
The following assumptions are used in the base case model in this study.
1. The entire flood control storage is available at the beginning of each flooding season.
2. There is no uncertainty in the incoming sediment.
3. Distribution of peak flow is not change over time.
4. Annual operating cost is constant at CO and is independent of sediment level in the reservoir.
5. Amount of sediment removed is constant at X for every removal.
6. There is no externality associated with the sediment removal.
7. Discount rate is 7 %.
12

IV. Application
Data and Empirical Specification
We apply our model to a small flood control dam in northern Connecticut. Much of the
data needed are available, but some important pieces of information are missing, for which best
guess values are used. Thus our present exercise is for illustrative purposes only.
One of the key data limitations is lack of historical flood records and damages. In view
of this problem, we developed a general functional form from data for typical depth damage
function provided in Davis (1992). We use this data to estimate a depth-damage function.
Employing synthetic data on probability distribution of floods and total value of structures in the
area to calculate total flood damages, we then alter this probability as it would have changed
with declining reservoir storage. After several repeated calculations we conclude that the
following functional form is most appropriate for the Flood Control Benefit (FB) function:
FB(S2t) = γ(S2t - Smin)1/2
Where γ is a benefit coefficient that will depend on the land use, depth-damage function,
and distribution of peak flow for each flood plain. Given the same size of dam γ will be higher
for higher mean of peak flow, or value of each land use. Smin is the minimum storage level for
flood control benefit. That is the storage level in which annual expected flood damage is equal to
annual expected flood damage without dam. Assuming Smin is zero, we estimated the FB
function for our case as5
FB(S2t) = 17.64(S2t)1/2
13 5 Estimation details are available upon request.

We consider three alternative reservoir management strategies, namely, sustainable,
nonsustainable and run-of-river. Sustainable management occurs when sediment is removed
periodically in a way reservoir storage will maintain at the same level forever (at least
theoretically). Nonsustainable management is the strategy where we do not practice any
sediment removal and the dam structure is retired when the reservoir is silted to the optimal
degree. In the run of river case, there is also no sediment removal, but the dam structure is
maintained after it is silted up and continues to provide limited benefits.
A computer program written in Excel is used to run the base case model explained in the
previous section. The following specific forms and parameter values are used.
Flood control benefit FB(S2t) = 17.64(St0.5)
Other purpose benefit OB(S1t) = P1*Wt
OB(S1t) = P1*(4*MAR*St – Zp2Sd2+4dSd2)/4(d/MAR)Sd2 +St)
Where P1 = unit value of reservoir yield, assume to be 1.
Construction cost: We assume that construction cost can be calculated as
C = cS0
Where c = cost per unit of storage = 3.5 - 0.53LN(S0/1000000)
Operating cost: We assume operating cost to be a proportion of the construction cost.
Co = ϕC
Where ϕ is assumed to be 5% .
Cost of sediment removal: Cost of removal sediment amount X = Cs(X) where
Cs(X) = F + P2 (g(Xt(1/1.3)))
Where F is fixed cost of sediment removal per event, assumed to be 5,000
14
P2 is the unit value of water used for removing sediment, assumed to be 0.1.
Salvage value is taken to be zero.
Base Case Results
Net present value for sustainable management, nonsustainable, and run-of-river strategies
are $5,926,285.298, $4,543,559.224, and $4,495,841.760 respectively. With sustainable
management net present value of dam increases by 30 percent and life of the dam increases from
60 years to over 300 years. Net present value of run-of-river strategy is less than nonsustainable
because the dam is relatively small and non-storage benefits are less than the cost of maintaining
the structure of the dams. Thus if sustainable management is not possible, under the given
physical characteristics and cost involved, one should retire and remove dams structure after the
optimal life of the dam is reached.
15

16
Percent of sediment that can be removed
4
5
6
7
25 50 75 100
Percent of sediment can be remove (%)
Net
pre
sent
val
ue(m
illio
n do
llars
)
Nonsustainable
Nonsustainablewith sedimentremoval
Run-off-River
Mean annual runoff
-202468101214
3000 4000 4556 5000 6000 7000
Mean annual runoff (1,000 cubic meter)
Net
pre
sent
val
ue(m
illio
n do
llars
)
Nonsustainable
Sustainable
Run-off-River
Fixed cost of sediment removal
23344556677
0 5 10 50 100
Fixed cost (1,000 dollar)
Net
pre
sent
val
ue(m
illio
n do
llars
)
NonsustainableSustainableRun-off-River
Interest Rate
-5051015202530
3% 5% 7% 8% 10% 15%
Interest Rate (Percent)
Net
pre
sent
val
ue(m
illio
n do
llars
)
NonsustainableSustainableRun-off-River
Annual incoming sediment
23344556677
50 60 75 80 90 100
Annual incoming sediment(1,000 metric ton)
Net
pre
sent
val
ue(m
illio
n do
llars
)
Nonsustainable
Sustainable
Run-off-River
Flood Control Priority Parameter
012345678
0.00 0.25 0.50 0.75 1.00
Flood control priority parameter
Net
pre
sent
val
ue(m
illio
n do
llars
) Nonsustainable
Sustainable
Run-off-River
Figure 8. Figure 9.
Figure 7. Figure 6.
Figure 5. Figure 4.
Unit value of reservoir yield
-30-20-10010203040
0.100.500.751.001.502.00
Unit value of reservoir yield (dollar)
Net
pre
sent
val
ue(m
illio
n do
llars
)
NonsustainableSustainableRun-of-River
Flood contro
01234567
5.0010.00
15.00
17.64
Flood constrolcoefficie
Net
pre
sent
val
ue(m
illio
n do
llars
)
Unit value of water use to remove sediment
01234567
0.01 0.05 0.10 0.50 0.75 1.00
Unit value (dollar)
Net
pre
sent
val
ue
(mill
ion
dolla
rs)
NonsustainableSustainableRun-of-River
Figure 13
Figure 11. Figure 10.
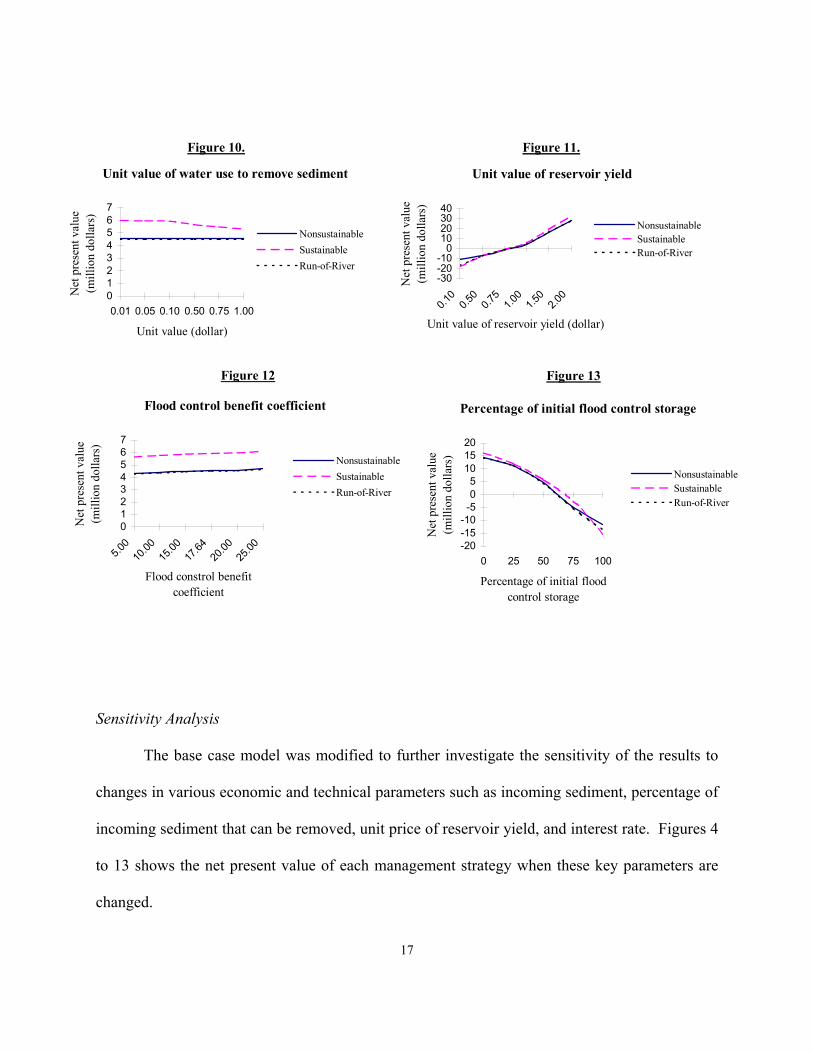
Sensitivity Analysi
The base c
changes in various
incoming sedimen
to 13 shows the n
changed.
Figure 12
l benefit coefficient
20.00
25.00
benefit nt
NonsustainableSustainableRun-of-River
Percentage of initial flood control storage
-20-15-10-505101520
0 25 50 75 100
Percentage of initial flood control storage
Net
pre
sent
val
ue(m
illio
n do
llars
)
NonsustainableSustainableRun-of-River
s
ase model was modified to further investigate the sensitivity of the results to
economic and technical parameters such as incoming sediment, percentage of
t that can be removed, unit price of reservoir yield, and interest rate. Figures 4
et present value of each management strategy when these key parameters are
17
Although most of the time sustainable management is still prefered, this is not always the
case. Generally, sustainable management is dominant for the range parameter values used when
changes are made in mean annual runoff, flood control benefit coefficient, and the unit value of
water used in removing sediment. For all other sensitivity exerciseses, nonsustainable
management may be prefered in some range of parameters.
Concerning the case of partial removal reported in Figure 4, when the percentage of the
sediment that can be removed is less than 36, it is not worth practicing sediment removal. On the
other hand, if the percentage that can be removed is higher, then the strategy is desirable and
reservoir life is extended. For example, reservoir life will be extended from 60 years if we do
not remove any sediment to 109 years if we can remove 50 percent of the incoming sediment.
Reservoir life will increase further to 145 years if we can remove 75 percent of the incoming
sediment. Net present value of the dam will increase from $4,543,559 to $5,001,880, and
5,851,150 respectively in these cases.
When annual incoming sediment is low we should not practice sediment removal because
the high fixed cost of sediment removal relative to the amount of sediment we can removed
makes it less economical than no removal. Thus nonsustainable management is preferred in such
cases..
Nonsustainable is also preferred if the interest rate is higher than 8.5 percent. This is
because high interest rate makes the present value of future benefit become much smaller, which
reduces the value of extending the life of the reservoir.
Similarly, if the fixed cost of removing sediment is increased above $100,000 per event,
we should no longer practice sediment removal and just let the dam silt up. This is because at
18

this point the cost is too high as compared to the benefit of removal. Similarly, the sustainable
policy is dominated by the nonsustainable policy if the flood control priority parameter is above
0.25.
V. Summary and Conclusion
Loss of reservoir capacity due to sedimentation is a major concern for many flood control
dams. Policy makers need to take into account sedimentation and its management costs when
evaluating and ranking proposed dams. Also, sediment management in existing dams needs to
be given careful consideration with a view towards extending the useful life of these projects.
This paper presents an optimal control model of sediment management in multipurpose dams
that have flood control as a main function. The model is applicable to new as well as existing
dams.
Results of an illustrative application show that, for a wide range of parameter values
sustainable management of dams is a preferred policy. It can increase discounted net benefits by
almost one-third over the nonsustainable outcome that involves no sediment removal. Partial
sediment removal may also be more desirable than the latter strategy if technical constraints do
not allow full removal and a sustainable outcome.
Although the numerical example presented is based partly on synthetic data and the
model is quite simplified (e.g., only one sediment removal technique is allowed), our general
approach can be extended quite easily to serve as a basis for policy relevant work in this field.
19
VI. References
Arnell, N. W. (1989). “Expected Annual Damages and Uncertainties in Flood Frequency
Estimation. Journal of Water Resources Planning and Management. Vol. 115, No. 1, January,
1989. Pages 94-107.
Crowder, B. M. (1987). "Economic costs of reservoir sedimentation: A regional approach
to estimating cropland erosion damages." Journal of Soil and Water Conservation. May-June
1987, pages 194-197.
Davis, S. A. and L.L. Skaggs (1992). Catalog of Residential Depth-damage Functions
used by the Army Corps of Engineers in Flood Damage Estimations U.S. Army Corps of
Engineers, Water Resources Support Center, Institute for Water Resources, 1992; Springfield,
VA
Dendy, F. E. (1968). "Sedimentation in the Nation's Reservoirs." Journal of Soil and
Water Conservation. July-August 1968, pages 135-137.
Dutta, D. and S. Herath, (1999), “Methodology for Flood Damage Assessment using GIS
and Distributed Hydrologic Model”, Proceedings of International Symposium on Information
Technology Tools for Natural Disaster Risk Management, INCEDE Report 11, pp. 109-124
Green, C. (2000). Best Practical Methods for Valuing Flood Control Benefits. Paper
prepared for the thematic Review III.1: Economic, financial and distributional analysis.
Contributing paper to the World Commission on Dams. June 2000.
Kiefer, J.C. and J.S. Willett (1996). Analysis of Nonresidential Content Value and Depth-
damage Data for Flood Damage Reduction Studies. U.S. Army Corps of Engineers, Water
Resources Support Center, Institute for Water Resources.
20

21
Morris, G. and J. Fan. (1997). Reservoir Sedimentation Handbook : Design and
Management of Dams, Reservoirs, and Watersheds for Sustainable Use. McGraw-Hill
Professional publishing.
Palmieri, A., F. Shah and A. Dinar. (2001). “Economics of Reservoir Sedimentation and
Sustainable Management of Dams”. Journal of Environmental Management, Vol. 61, No. 2, Feb
2001, pp. 149-163
Parker, D. J, C.H. Green and P.M. Thompson (1987). Urban Flood Protection Benefits:
A Project Appraisal Guide, Aldershot: Gower.
United Nations Environment Programme. (2001). “Felling of Forests Adding to World’s
Water Shortages as Dams Fill up With Silt”. News release 01/116.
U.S. Water Resources Council. (1981). Floodplain Management Handbook Water
Resources Support Center. Institute for Water Resources.
U.S. Army Corps of Engineers. National Economic Development Procedures Manual Urban
Flood Damage.