LECTURE NOTE - falmatasaba.files.wordpress.com · Steel dams Concrete dams Earth dams Rockfill dams...
183
Addis Ababa University Faculty of Technology Department of Civil Engineering HYDRAULLIC STRUCTURES I LECTURE NOTE Bayou Chane (Ph. D) Shimelis Behailu (M. Sc.) Addis Ababa May 2006
Transcript of LECTURE NOTE - falmatasaba.files.wordpress.com · Steel dams Concrete dams Earth dams Rockfill dams...
Addis Ababa University Faculty of Technology
Department of Civil Engineering
HYDRAULLIC STRUCTURES I LECTURE NOTE
Bayou Chane (Ph. D) Shimelis Behailu (M. Sc.)
Addis Ababa
May 2006
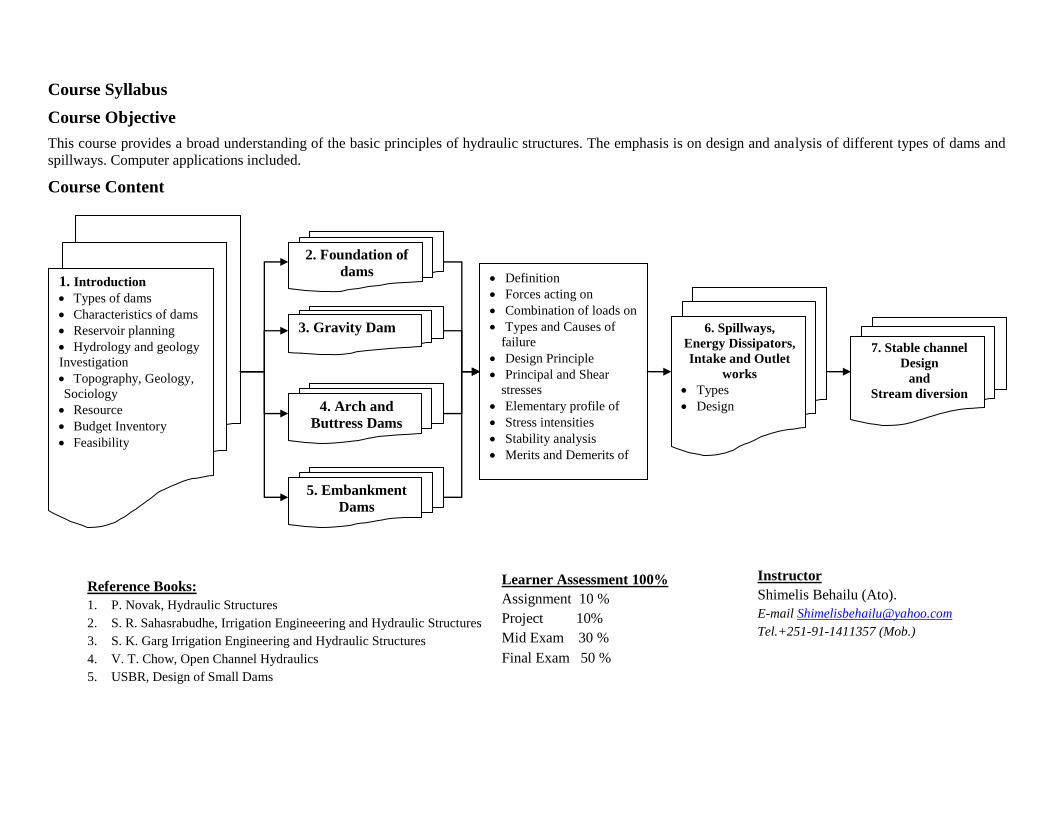
Course Syllabus
Course Objective
This course provides a broad understanding of the basic principles of hydraulic structures. The emphasis is on design and analysis of different types of dams and
spillways. Computer applications included.
Course Content
Reference Books:
1. P. Novak, Hydraulic Structures
2. S. R. Sahasrabudhe, Irrigation Engineeering and Hydraulic Structures
3. S. K. Garg Irrigation Engineering and Hydraulic Structures
4. V. T. Chow, Open Channel Hydraulics
5. USBR, Design of Small Dams
Learner Assessment 100%
Assignment 10 %
Project 10%
Mid Exam 30 %
Final Exam 50 %
Instructor
Shimelis Behailu (Ato).
E-mail [email protected]
Tel.+251-91-1411357 (Mob.)
Definition
Forces acting on
Combination of loads on
Types and Causes of
failure
Design Principle
Principal and Shear
stresses
Elementary profile of
Stress intensities
Stability analysis
Merits and Demerits of
4. Arch and
Buttress Dams
3. Gravity Dam
2. Foundation of
dams 1. Introduction
Types of dams
Characteristics of dams
Reservoir planning
Hydrology and geology
Investigation
Topography, Geology,
Sociology
Resource
Budget Inventory
Feasibility
6. Spillways,
Energy Dissipators,
Intake and Outlet
works
Types
Design
7. Stable channel
Design
and
Stream diversion
5. Embankment
Dams

Addis Ababa University Hydraulic Structures I
April 13 i
Table of Contents
Course Syllabus ........................................................................................................................... i
Course Objective .......................................................................................................................... i
Course Content............................................................................................................................. i
Table of Contents ......................................................................................................................... i
1 Introduction ................................................................................................................ 1
1.1 General ............................................................................................................................ 1
1.2 Types of dams ................................................................................................................. 1
1.3 Characteristics of dams ................................................................................................... 2
1.4 Reservoir Planning .......................................................................................................... 6
1.5 Hydrology and geology................................................................................................... 7
1.6 Environmental, Social, Economical and Political investigation ................................... 11
1.7 Location criteria for dam and spillway site ................................................................... 11
1.8 Dam site investigation................................................................................................... 12
1.9 Data collection .............................................................................................................. 12
1.10 Site Requirement ........................................................................................................... 14
1.11 Stages in Project Planning and Implementation ........................................................... 15
2 Foundations of Dams and their Treatment ........................................................... 16
2.1 General .......................................................................................................................... 16
2.2 Rock foundation ............................................................................................................ 16
2.2.1 General .................................................................................................................. 16
2.2.2 Foundation treatment ............................................................................................ 16
2.2.3 Measures against leakage ...................................................................................... 17
2.2.4 Drainage ................................................................................................................ 17
2.2.5 Stability of Dams and Strength of Rock Foundation ............................................ 18
2.3 Earth foundation............................................................................................................ 18
2.3.1 General .................................................................................................................. 18
2.3.2 Gravel and sand foundation .................................................................................. 19
2.3.3 Estimation of seepage amount .............................................................................. 19
2.3.4 Piping .................................................................................................................... 20
2.3.5 Uplift pressure and control of seepage.................................................................. 21
2.3.6 Theories of Seepage Flow ..................................................................................... 24
2.3.7 Uplift pressure and seepage under masonry structures on pervious foundations . 25
2.3.8 Silt and clay foundation ........................................................................................ 27
3 Concrete Gravity Dam ............................................................................................. 28 3.1 General .......................................................................................................................... 28
3.2 Forces acting on gravity dams ...................................................................................... 28
3.2.1 Water pressure ...................................................................................................... 28
3.2.2 Wight of Structure................................................................................................. 30
3.2.3 Earth and silt pressure ........................................................................................... 31
3.2.4 Wind pressure ....................................................................................................... 31
3.2.5 Wave pressure and wave height ............................................................................ 31
3.2.6 Earthquake forces.................................................................................................. 32
3.3 Load combination for Design ....................................................................................... 34
3.4 Reaction of the foundation ............................................................................................ 34
3.5 Rules Governing the Design of Gravity Dams ............................................................. 35
Addis Ababa University Hydraulic Structures I
April 13 ii
3.6 Theoretical versus practical section of a dam ............................................................... 38
3.7 Design procedure of gravity dams ................................................................................ 38
3.7.1 Design methods ..................................................................................................... 38
3.7.2 Multiple step method of determining profile of gravity dam ............................... 39
3.7.3 Single Step Method ............................................................................................... 40
3.8 Gravity dam Construction, Quality control and the Future .......................................... 49
3.8.1 The Construction Process ..................................................................................... 49
3.8.2 Quality Control ..................................................................................................... 51
3.8.3 The Future ............................................................................................................. 51
4 Concrete Arch and Concrete Buttress dams ......................................................... 52 4.1 Concrete Arch Dam ...................................................................................................... 52
4.1.1 Constant radius arch dam ...................................................................................... 53
4.1.2 Constant Angle Arch dam ..................................................................................... 53
4.1.3 Variable radius arch dam ...................................................................................... 53
4.1.4 Loads on arch dam ................................................................................................ 54
4.1.5 Methods of design of massive arch dams. ............................................................ 54
4.1.6 The thin cylinder theory ........................................................................................ 54
4.1.7 Design procedure for variable radius arch dam .................................................... 56
4.1.8 Elastic arch theory (Arch dam analysis) ............................................................... 57
4.2 Buttress dams ................................................................................................................ 59
4.2.1 Classification of buttress dams ............................................................................. 59
4.2.2 Advantages and Disadvantages of Buttress Dams ................................................ 59
4.2.3 Forces on buttress dams ........................................................................................ 60
4.2.4 Design Principle for Buttress Dams ...................................................................... 60
5 Embankment Dam ................................................................................................... 62
5.1 Introduction ................................................................................................................... 62
5.2 Key elements and appurtenances of Embankment dam ............................................... 62
5.2.1 Foundation: ........................................................................................................... 62
5.2.2 Core or membrane................................................................................................. 63
5.2.3 Shell ...................................................................................................................... 64
5.2.4 Height of dam: ...................................................................................................... 65
5.2.5 Top Width: ............................................................................................................ 65
5.2.6 Appurtenances....................................................................................................... 65
5.2. Types of Embankment dam .......................................................................................... 66
5.3. Causes of Failure of Embankment dams ...................................................................... 67
5.4. Design features.............................................................................................................. 68
5.5. Seepage analysis ........................................................................................................... 70
5.6. Determination of Phreatic Lines ................................................................................... 70
5.7. Stability analysis ........................................................................................................... 74
5.7.1. Stability of side slopes of earth dam ......................................................................... 74
5.7.2. Stability of earth dam against horizontal shear developed at the base of the dam ... 78
5.8. Foundation analysis ...................................................................................................... 79
5.9. Internal drainage system ............................................................................................... 84
6 Spillways.................................................................................................................... 88 6.1 General ...................................................................................................................... 88
6.2 Types of Spillway ..................................................................................................... 88
6.2.1 Free overfall (straight drop) spillway ................................................................... 88
6.2.2 Ogee (overflow) spillway ..................................................................................... 89
Addis Ababa University Hydraulic Structures I
April 13 iii
6.2.3 Side channel spillway ........................................................................................... 90
6.2.4 Siphon spillway ..................................................................................................... 91
6.2.5 Chute spillway ...................................................................................................... 91
6.2.6 Shaft spillway........................................................................................................ 92
6.3 Spillway Crest Gates ................................................................................................. 92
6.4 Spillway design ......................................................................................................... 97
6.4.1 Background ........................................................................................................... 97
6.4.2 Stilling Basin ....................................................................................................... 112
7 Sediment Transport and Stable Channel Design ................................................ 115 7.1 Mechanics of Sediment transport............................................................................ 115
7.2 Lacey‟s regime method of stable channel design. .................................................. 115
7.3 Force on sediment particle ...................................................................................... 118
7.4 Stream Diversion .................................................................................................... 118
References: ..................................................................................................................... 122
Sample Questions from Previous Exams ..................................................................... 123
Addis Ababa University Hydraulic Structures I
April 13 1
1 Introduction
1.1 General
Hydraulic Structures are engineering constructions designed and mechanically fit for managing and
utilizing water resources to the best advantage of the human being and environment.
Dam is a barrier across flowing water that obstructs, directs or retards the flow, often creating a
Reservoir.
Reservoir is an artificial lake created by flooding land behind a dam. Some of the world's largest lakes
are reservoirs.
Spillway is a section of a dam designed to pass water from the upstream side of a dam to the downstream
side. Many spillways have gates designed to control the flow through the spillway.
Flood is an overflow or an expanse of water submerging land.
Dams differ from all other major civil engineering structures in a number of important regards:
Every dam, large or small, is quite unique; foundation geology, material characteristics, catchment
flood /hydrology etc. are each site-specific.
Dams are required to function at or close to their design loading for extended periods.
Dams do not have a structural lifespan; they may, however, have a notional life for accounting
purposes, or a functional lifespan dictated by reservoir sedimentation.
The overwhelming majority of dams are of earth fill, constructed from a range of natural soils; these
are the least consistent of construction materials.
Dam engineering draws together a range of disciplines, e.g. Structural and fluid mechanics, geology
and geotechnics, flood hydrology and hydraulics, to a quite unique degree.
The engineering of dams is critically dependent upon the application of informed engineering
judgment.
Hence the dam engineer is required to synthesize design solutions which, without compromise on safety,
represent the optimal balance between technical, economic and environmental considerations.
1.2 Types of dams
Dike is a stone or earthen wall constructed as a defense or as a boundary. The best known form of dyke is
a construction built along the edge of a body of water to prevent it from flooding onto adjacent lowland.
Levee is a natural or artificial structure, usually earthen, which parallels the course of a river. It functions
to prevent flooding of the adjoining countryside. However it also confines the flow of the river resulting
in higher and faster water flow.
Weir is a small overflow type (designed to be overtopped) dam commonly used to raise the level of a
small river or stream. Water flows over the top of a weir, although some weirs have sluice gates which
release water at a level below the top of the weir.
Check dam is a small dam designed to reduce flow velocity and control soil erosion
Diversion dam is a type of dam that diverts all or a portion of the flow of a river from its natural course
Masonry dam is a type of dam constructed with masonry. It is made watertight by pointing the joints
with cement. A plaster of cement is also applied. The interior could be either in coursed masonry or
rubble masonry.
Addis Ababa University Hydraulic Structures I
April 13 2
Dams may be classified according to
Material of construction,
structure,
intended purpose or
height;
Hence, no classification is exclusive.
Classification according to material of construction
Timber dams
Steel dams
Concrete dams
Earth dams
Rockfill dams
Combined dams
Classification according to design criteria
Hydraulic design Stability consideration
Non-overflow dams Gravity dams
Overflow dams Non-gravity dams
Composite dams
Classification according to Purpose
Storage dams Stage control dams Barrier dams
Flood control Diversion Levees and dykes
Water supply Navigation Coffer dams
Detention storage
Classification according to height (H)
H ≤ 30m low dam
30 ≤ H ≤ 100m medium
H ≥ 30m high dam
When the size of the dam has been determined, the type of dam envisaged requires certain geological and
topographical conditions which, for the main types of dams, may be stated as follows.
Concrete Dams Embankment Dams
Gravity dams Rock fill dams
Buttress dams Hydraulic fill dams
Multiple ach dams Earthen embankments
Thick arch dams Composite dams
Thin arch dams
1.3 Characteristics of dams
Coffer dam is a temporary structure constructed of any material like timber, steel, concrete, rock or earth.
It is built to enclose certain work site or to divert the flow to enable construction activity in the main river
channel. After the main structure is built (bridge, barrage or dam) either the coffer dam is dismantled or it
becomes part6 of the structure if the design so provides.
Gravity Dams
Stability is secured by making it of such a size and shape that it will resist overturning, sliding and
crushing at the toe.
Addis Ababa University Hydraulic Structures I
April 13 3
The dam will not overturn provided the resultant force falls within the base.
to prevent tension at the upstream face and excessive compression at the downstream face, the dam cross
section is usually designed so that the resultant falls within the middle third at all elevations of the cross
section
good impervious foundations are essential
inspires more confidence in the layman than any other type; it has mass that lends an atmosphere of
permanence, stability, and safety
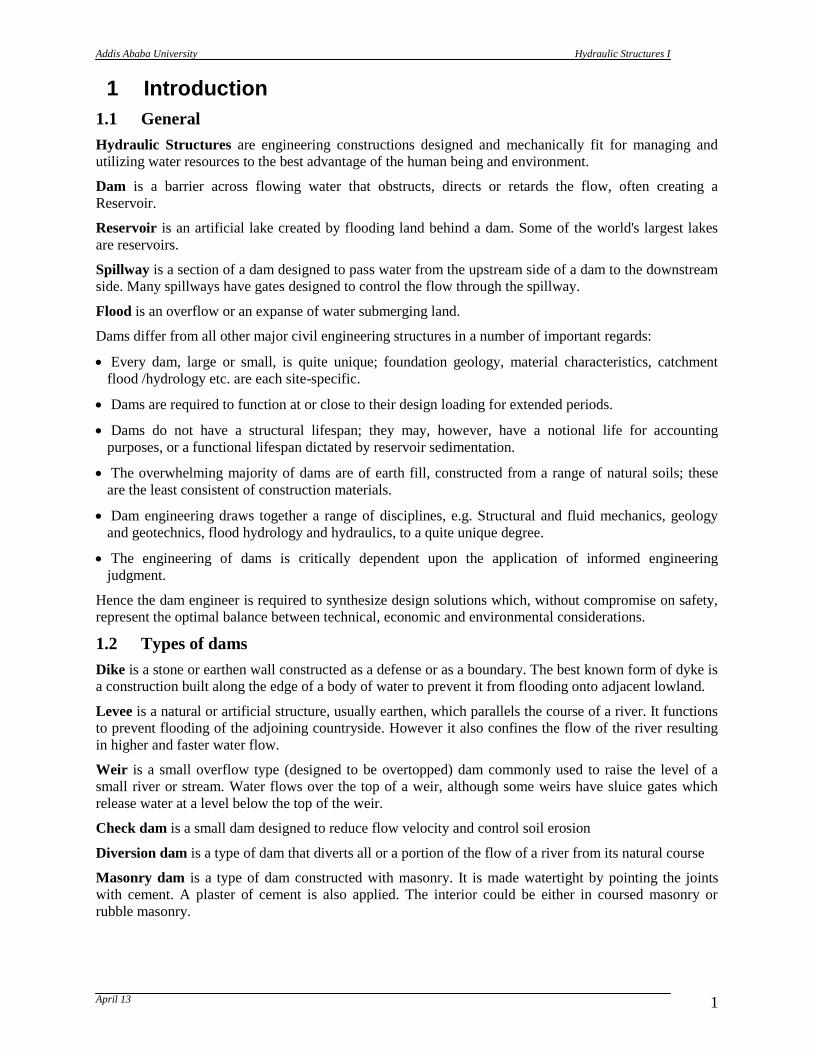
Shasta Dam impounds the Sacramento River in northern California. Like all concrete gravity dams, Shasta Dam
holds back the water in its reservoir, Shasta Lake, by the sheer force of its weight. Built of solid concrete, the
massive structure rises 183 m (602 ft). It measures 165 m (542 ft) at the base and just 9 m (30 ft) at the crest.
This shape, typical of concrete gravity dams, counteracts the force of the water pressing against the dam at the
bottom of the reservoir, where the pressure is most intense.
Courtesy of U.S. Bureau of Reclamation/Microsoft Corporation Illustration
Microsoft ® Encarta ® Reference Library 2005. © 1993-2004 Microsoft Corporation. All rights reserved.
Figure 1-1 Example of concrete Gravity dam
Gravity dams are classified as "solid" or "hollow." The solid form is the more widely used of the two,
though the hollow dam is frequently more economical to construct. Gravity dams can also be classified as
"overflow" (spillway) and "non-overflow."
Buttress Dams
The buttress dam is suitable where the rock is capable of bearing pressures of 2 - 3 MPa.
Buttress dams require between one thirds and half of the concrete required for a gravity section,
hence making it more economical for dams over 14m.
Additional skilled labor is required to create the formwork.
Threat of deterioration of concrete from the impounded water is more likely than from a thick
gravity section.
There is also an elimination of a good deal of uplift pressure, the pressure resulting from the
water in the reservoir and possibly of water from the hillside rocks gaining access through or
under any grout curtain and exerting upwards underneath the mass concrete dam.
Addis Ababa University Hydraulic Structures I
April 13 4
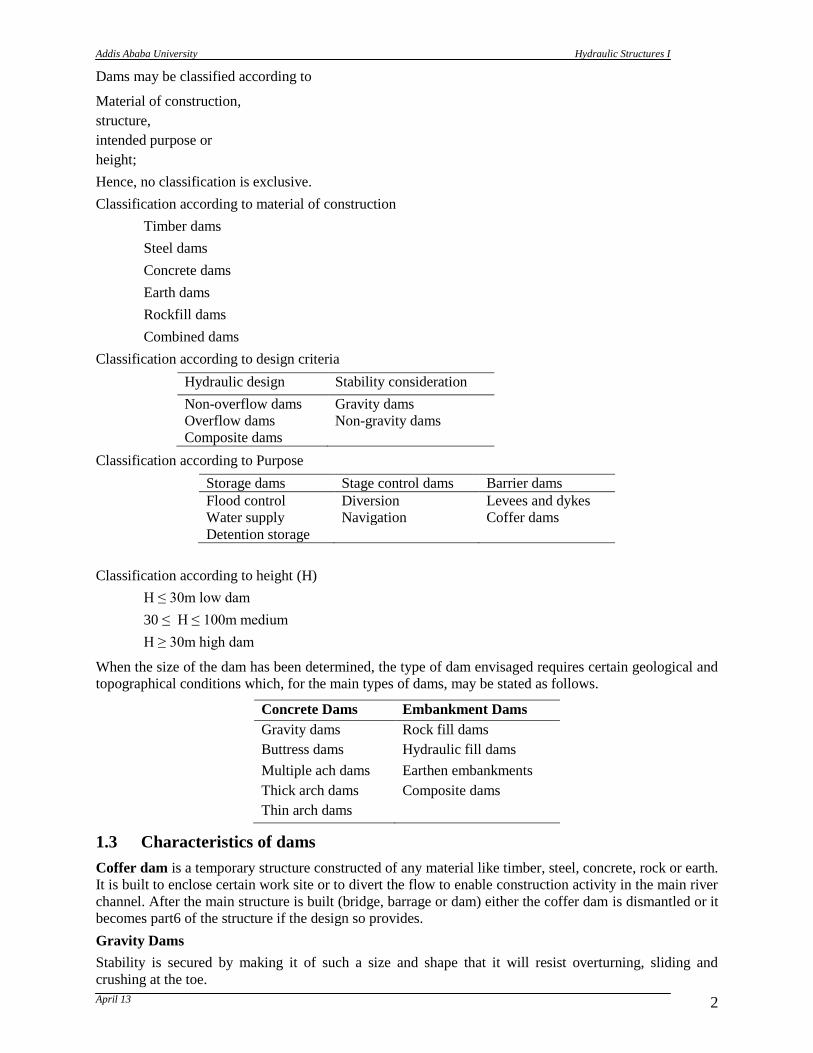
Lake Tahoe Dam impounds the Truckee River in northern California. Like all flat slab buttress dams, it has a flat
slab upstream face supported by a series of buttresses on the downstream side. Lake Tahoe Dam measures 5.5 m
tall and 33 m long. It was completed in 1913 to raise the water level in Lake Tahoe, a natural lake, to provide
additional water for crop irrigation.
Figure 1-2 Profile of buttress dam
Arch dam
Stability is obtained by a combination of arch and gravity action
Utilizes the strength of an arch to resist loads placed upon it by 'arch action'
The foundations and abutments must be competent not only to support the dead weight of the
dam on the foundation but also the forces that are directed into the abutments because of arch
action in response to the forces acting on the dam.
The strength of the rock mass at the abutments and immediately down valley of the dam must be
unquestionable and its modulus of elasticity must be high enough to ensure deformation under
thrust from the arch is not so great as to induce excessive stresses in the arch.
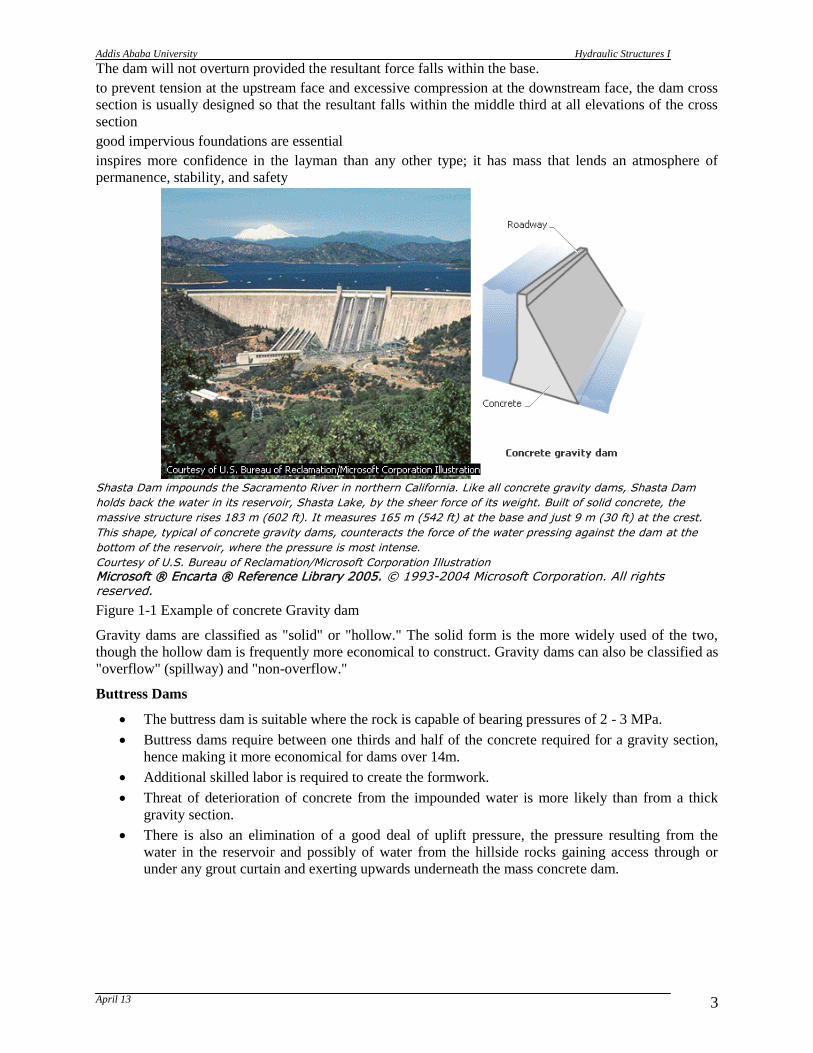
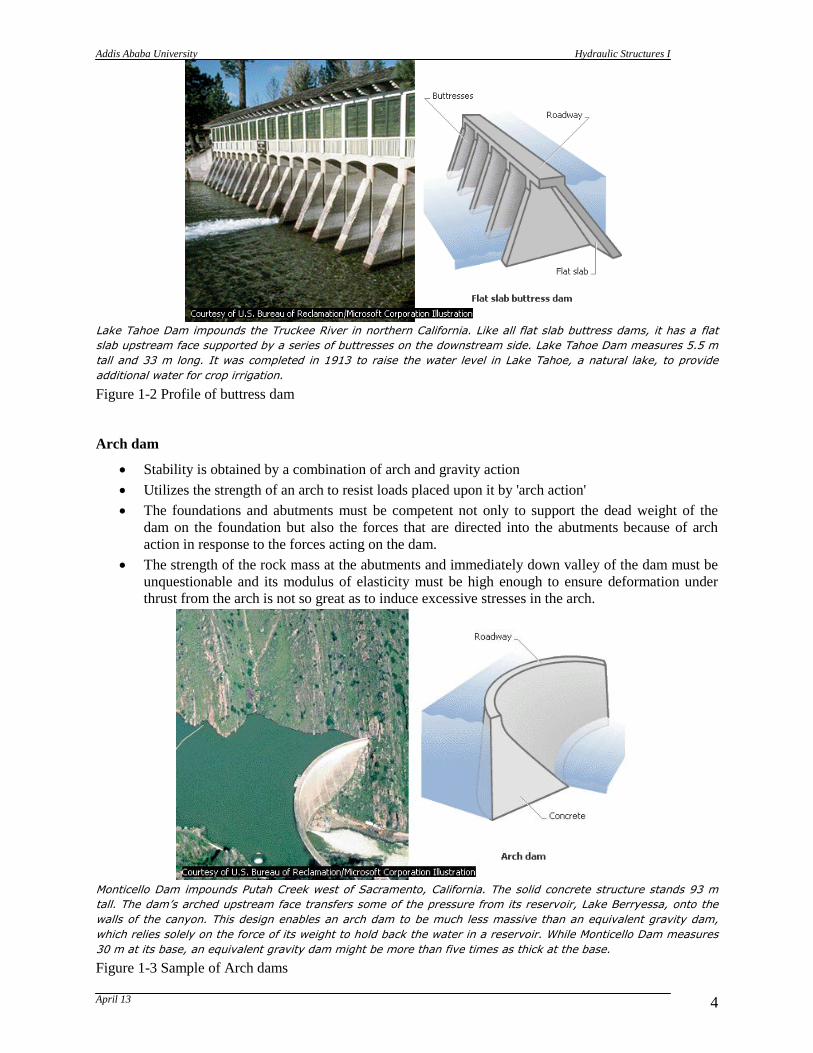
Monticello Dam impounds Putah Creek west of Sacramento, California. The solid concrete structure stands 93 m
tall. The dam’s arched upstream face transfers some of the pressure from its reservoir, Lake Berryessa, onto the
walls of the canyon. This design enables an arch dam to be much less massive than an equivalent gravity dam,
which relies solely on the force of its weight to hold back the water in a reservoir. While Monticello Dam measures
30 m at its base, an equivalent gravity dam might be more than five times as thick at the base.
Figure 1-3 Sample of Arch dams
Addis Ababa University Hydraulic Structures I
April 13 5
Rockfill dams
Can be built where the following conditions exist -
Uncertain or variable foundation which is unreliable for sustaining the pressure necessary for any
form of concrete dam.
Suitable rock in the vicinity which is hard and will stand up to variations of weather.
An adequate amount of clay in the region which may be inserted in the dam either as a vertical
core or as a sloping core.
Accessibility of the site and the width of the valley is suitable for the manipulation of heavy
earth-moving machinery, caterpillar scrapers, sheepfoot rollers and large bulldozers.
Hydraulic Fill Dams
Hydraulic fill dams are suitable in valleys of soft material and are constructed by pumping soft material
duly consolidated up to moderated heights up to 30m.
A hydraulic fill is an embankment or other fill in which the materials are deposited in place by a flowing
stream of water, with the deposition being selective. Gravity, coupled with velocity control, is used to
effect the selected deposition of the material.
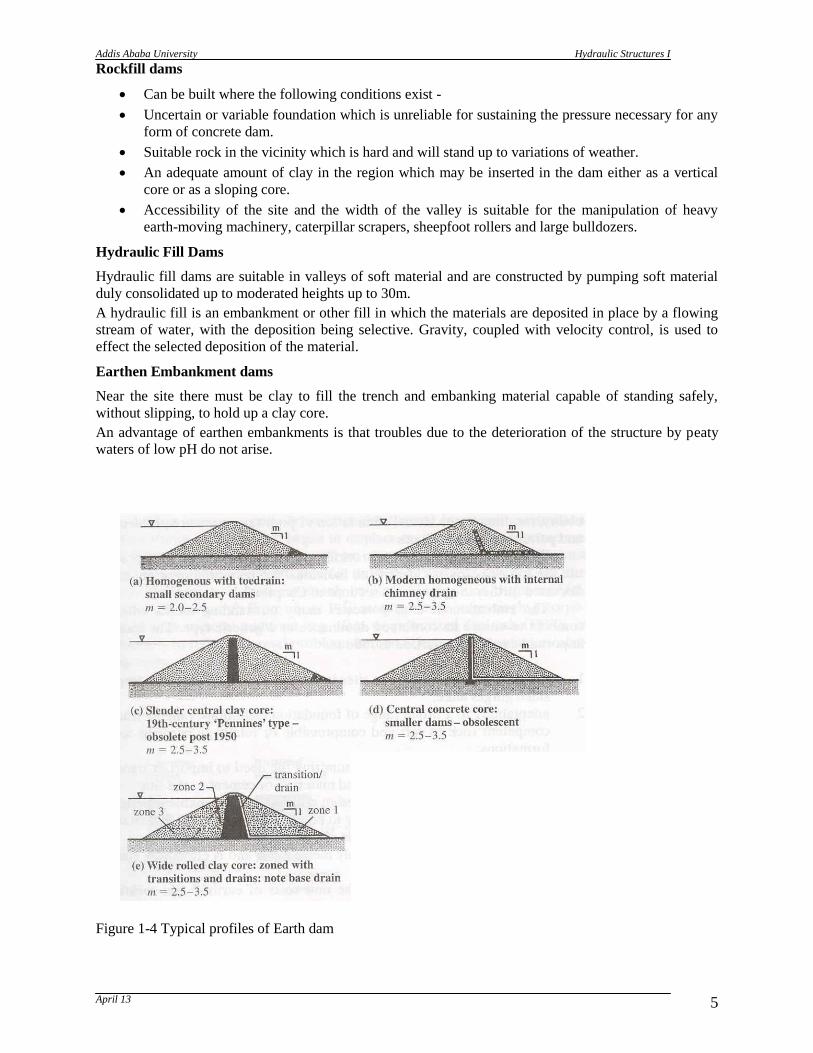
Earthen Embankment dams
Near the site there must be clay to fill the trench and embanking material capable of standing safely,
without slipping, to hold up a clay core.
An advantage of earthen embankments is that troubles due to the deterioration of the structure by peaty
waters of low pH do not arise.
Figure 1-4 Typical profiles of Earth dam
Addis Ababa University Hydraulic Structures I
April 13 6
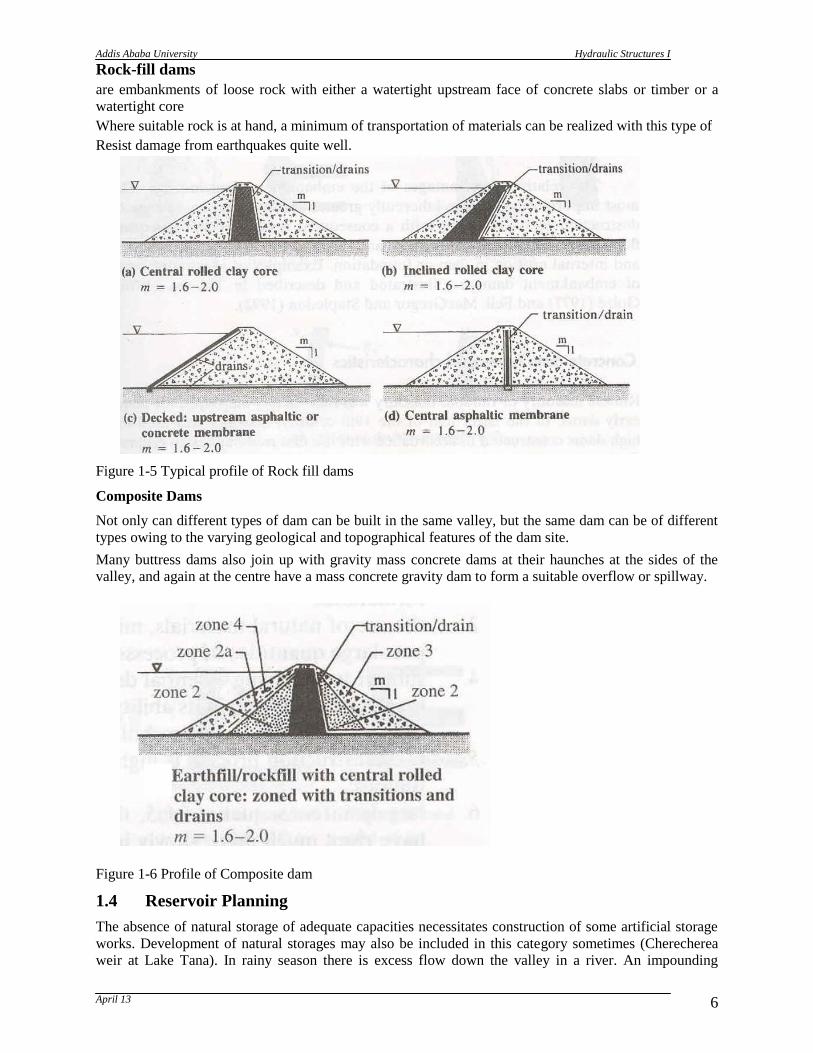
Rock-fill dams
are embankments of loose rock with either a watertight upstream face of concrete slabs or timber or a
watertight core
Where suitable rock is at hand, a minimum of transportation of materials can be realized with this type of
Resist damage from earthquakes quite well.
Figure 1-5 Typical profile of Rock fill dams
Composite Dams
Not only can different types of dam can be built in the same valley, but the same dam can be of different
types owing to the varying geological and topographical features of the dam site.
Many buttress dams also join up with gravity mass concrete dams at their haunches at the sides of the
valley, and again at the centre have a mass concrete gravity dam to form a suitable overflow or spillway.
Figure 1-6 Profile of Composite dam
1.4 Reservoir Planning
The absence of natural storage of adequate capacities necessitates construction of some artificial storage
works. Development of natural storages may also be included in this category sometimes (Cherecherea
weir at Lake Tana). In rainy season there is excess flow down the valley in a river. An impounding
Addis Ababa University Hydraulic Structures I
April 13 7
reservoir can be constructed in the valley to store this excess water which will meet the demand in dry
periods.
Storage works may be designed and constructed to serve single or multipurpose. The various purposes for
which storage works are required are mentioned below
1. Irrigation
2. Hydro-electric power generation,
3. control of destructive floods
4. Low water regulation for navigation
5. Domestic and industrial water supply
6. Recreation
7. Preservation and breeding of useful aquatic life, etc.
Before any dam is built, certain hydrological information is necessary regarding river discharge, rate and
character of siltation, and the location and duration of flooding. A critical concern in rivers is the
magnitude and duration of discharge with respect to time. Feasibility studies are necessary in assessing
the water budget for future industrial operations. Relevant studies involve meteorological monitoring,
hydrological measurements, reservoir capacity, safe yield, and flood frequency. Questions that need to be
confronted during dam site investigation include the depth at which adequate foundation materials exist,
the strength of the rocks and soils, and the likelihood of water leakage.
By analysis of storage data, availability of water is ascertained before any project is contemplated. The
next step in reservoir planning is to fix the reservoir capacity. The reservoir has to provide sufficient
storage for various purposes, namely
1. Dead storage to contain silt deposition,
2. Storage to account for evaporation loss
3. Live storage to meet the downstream demands for irrigation domestic or industrial supply, power
generation, etc.
4. Storage to act as flood protection.
The basis of fixing storage capacity for dead storage and evaporation loss depends upon the amount of
incoming sediment and the annual evaporation loss respectively. Requirement for flood protection
depends on the intensity and volume of flood flow. The live storage capacity of a reservoir depends on the
demand for various purposes. It can be arrived at by plotting the mass curves of demand and inflow of
accumulated flow or rainfall plotted against time. The capacity of the reservoir is fixed in such a way as to
take care of the demands during the minimum flow period in the driest year on record. In some cases it is
necessary to cover a period of successive dry years to consider storing of sufficient water to meet the
demand during periods of prolonged drought.
1.5 Hydrology and geology
The hydrological and geological or geotechnical characteristics of catchment and site are the principal
determinants establishing the technical suitability of a reservoir site. The hydrology of the catchment
indicates the available quantity and quality of water to be stored in the reservoir. The geology of the site is
one of the important aspects to be investigated for a dam to take decision about selection and location of
the reservoir and the type, and size the dam. More discussion will be made in the following sections about
the hydrology and geology considerations for dam design.
Assignment. #1
It is proposed to construct a reservoir in a river basin for which 34 years run off data is available as shown
in Table 1-1. The pattern of releases required from the storage to meet irrigation and hydro-power
generation requirements are 1300Mm3 per annum. Take average annual evaporation loss to be 120Mm
3.
Assuming the rate of demand distribution to be uniform over the year calculate the capacity of the
reservoir that needs to be created.

Addis Ababa University Hydraulic Structures I
April 13 8
Table 1-1 Monthly flow data of a nearby hydrologic station in m3/s
Year Jan Feb Mar Apr May Jun Jul Aug Sep Oct Nov Dec AnnuaL Q
1965 6.04 4.22 10.54 11.49 10.57 10.21 125.57 414.22 276.45 30.16 17.25 16.51 933.23
1966 11.85 15.14 10.26 18.59 6.1 17.56 162.21 651.63 426.9 43.23 11.78 7.88 1383.13
1967 6.29 8.16 6.39 7.68 34.24 32.79 213.26 405.98 296.78 85.18 43.48 13.17 1153.4
1968 14.44 25.05 20.1 91.7 25.72 25.25 261.3 464 262.9 57.12 21.45 20.79 1289.82
1969 23.4 31.51 66.51 36.47 43.21 75.73 431.3 897.4 336.7 28.72 16.48 14.61 2002.04
1970 17.92 14.56 64.89 20.34 11.47 16.73 481.8 842.2 384.2 45.62 19.38 17.27 1936.38
1971 18.42 8.91 5.28 12.43 15.13 106.21 455.13 977.54 709.57 47.7 15 12.34 2383.66
1972 13.1 23.01 27.13 33.69 22.68 29.01 218.93 397.65 146.19 20.01 7.83 6.39 945.62
1973 8.92 6.9 6.32 5.68 11.15 16.83 133.04 540.64 429.09 87.16 11.38 7.99 1265.1
1974 7.85 6.24 15.9 18.2 13.78 22.48 296.45 538.89 314.51 35.53 15.17 11.38 1296.38
1975 6.35 5.78 5.86 9.35 9.25 29.37 349.02 473.14 358.47 38.48 11.85 9.51 1306.43
1976 8.91 7.85 13.6 13.68 18.81 28.68 184.22 440.84 216.59 21.52 16.78 10.8 982.28
1977 17.88 12.7 10.7 16.4 19.3 41.42 320.93 558.26 270.18 69.22 210.81 16.74 1564.54
1978 13.42 14.78 19.58 11.8 13.4 50.5 241.47 527.92 325.97 83.79 16.9 14.68 1334.21
1979 18.74 14.06 21.25 17.15 27.12 31.73 220.68 533.13 177.24 47.79 17.33 14.08 1140.3
1980 13.41 13.1 9.97 8.1 17.47 30.24 260.32 597.44 226.63 31.94 12.48 11.51 1232.61
1981 10.91 9.5 41.83 59.18 20.9 16.88 248.7 510.7 492.9 51.57 16.39 14.24 1493.7
1982 11.99 11.09 10.03 15.32 14.43 16.99 120.08 469.42 199.56 71.05 15.65 13.14 968.75
1983 10.49 10.22 14 30.07 62.84 60.47 161.26 633.54 379.24 42.86 14.73 11.06 1430.78
1984 10.11 7.37 7.53 5.68 10.96 66.13 325.27 372.87 277.83 18.13 8.34 7.51 1117.73
1985 7.1 5.52 4.43 7.07 26.5 19.33 231.92 750.94 322.14 29.45 9.58 9.92 1423.9
1986 5.45 14.98 15.2 26.14 21.54 59.13 187.81 417.06 266.62 22.43 9.27 8.77 1054.4
1987 7.9 8.89 34.26 64.72 58.11 75.84 131.6 192 46.53 17.34 9.65 7.98 654.82
1988 8.59 7.97 8.16 11.11 8.52 24.9 138.66 736.75 548.97 52.54 11.83 9.86 1567.85
1989 10.78 13.49 16.59 28.75 12.77 21.17 286.32 540.02 416.9 31.18 10.15 10.62 1398.72
1990 8.99 28.64 47.48 68.29 12.13 25.72 235.25 676.85 306.22 41.47 9.92 7.82 1468.79
1991 7.44 11.49 22.43 7.3 6.85 24.46 256.25 773.08 429.32 23.07 9.35 8.61 1579.65
1992 8.94 14.88 8.8 10.8 10.55 25.65 188.19 588.96 394.35 39.42 10.33 8.48 1309.33
1993 7.78 11.07 6.83 24.14 32.58 65.16 352.1 795.05 538.46 79.39 18.68 10.34 1941.57
1994 7.54 5.79 6.68 11.54 10.8 23.76 208.31 440.09 400.07 40.39 12.1 12.1 1179.17
1995 10.79 10.28 8.15 35.05 13.6 25 188.44 544.38 192.78 19.06 8.3 7.62 1063.45
1996 13.42 9.88 7.46 29.15 53.09 207.3 574.8 1108.4 351.2 32.07 14.18 3.81 2404.76
1997 10.33 7.74 7.88 13.2 10.52 37.03 147.5 326.4 76.99 24.09 24.68 14.97 701.32
1998 12.57 8.58 27.19 20.06 28 62.27 386.51 1621.8 442.63 105.66 21.11 13.49 2749.87
Mean 11.12 12.04 17.92 23.54 21.00 41.82 256.61 610.56 330.62 44.54 20.58 11.358 1401.70
Addis Ababa University Hydraulic Structures I
April 13 9
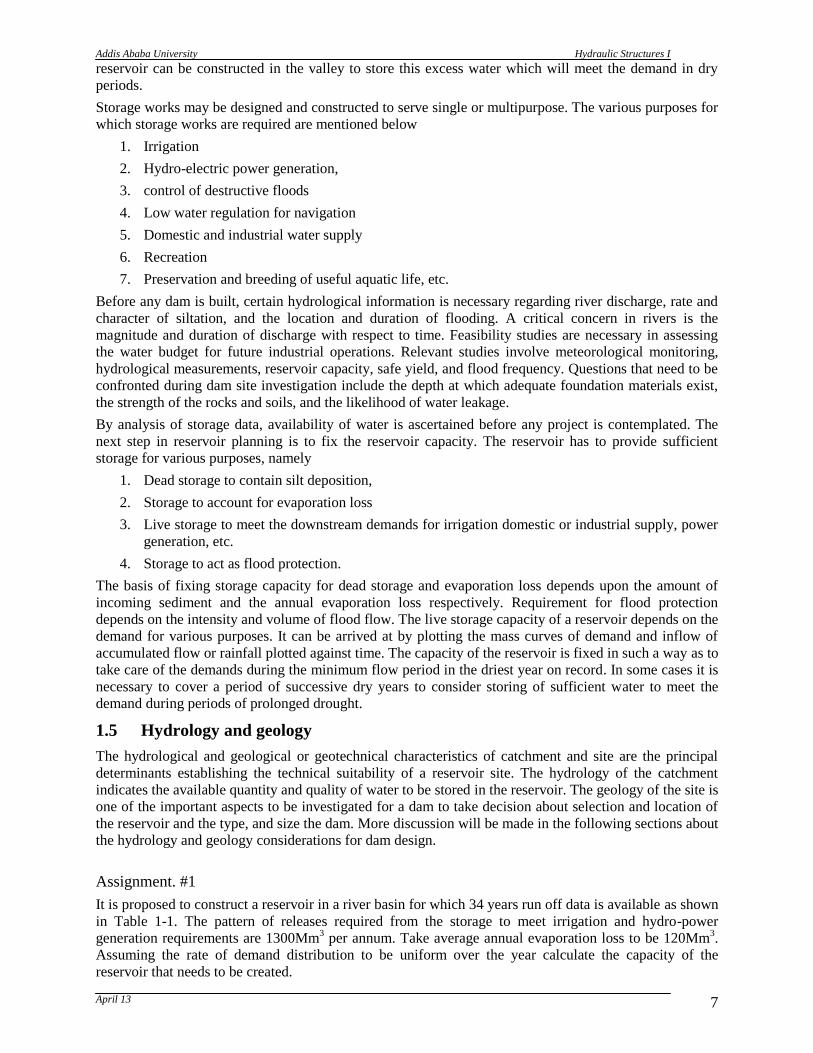
Reservoir capacity determination partial procedure.
To select ten consecutive years which relatively show dry periods, plot the annual average flow
for the entire data.
Average annual flow
0
50
100
150
200
250
1964 1969 1974 1979 1984 1989 1994 1999
Year
Flo
w (
m3 /s
)
Figure 1-7 Annual average flow
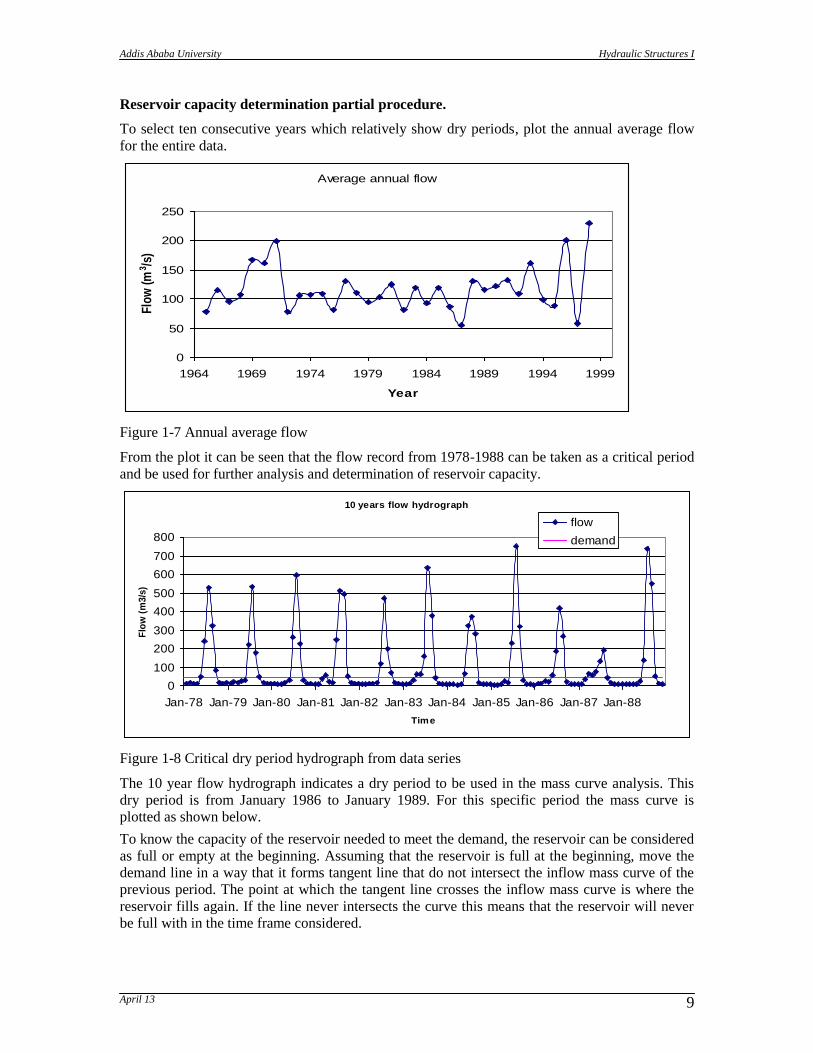
From the plot it can be seen that the flow record from 1978-1988 can be taken as a critical period
and be used for further analysis and determination of reservoir capacity.
10 years flow hydrograph
0
100
200
300
400
500
600
700
800
Jan-78 Jan-79 Jan-80 Jan-81 Jan-82 Jan-83 Jan-84 Jan-85 Jan-86 Jan-87 Jan-88
Time
Flo
w (
m3/s
)
flow
demand
Figure 1-8 Critical dry period hydrograph from data series
The 10 year flow hydrograph indicates a dry period to be used in the mass curve analysis. This
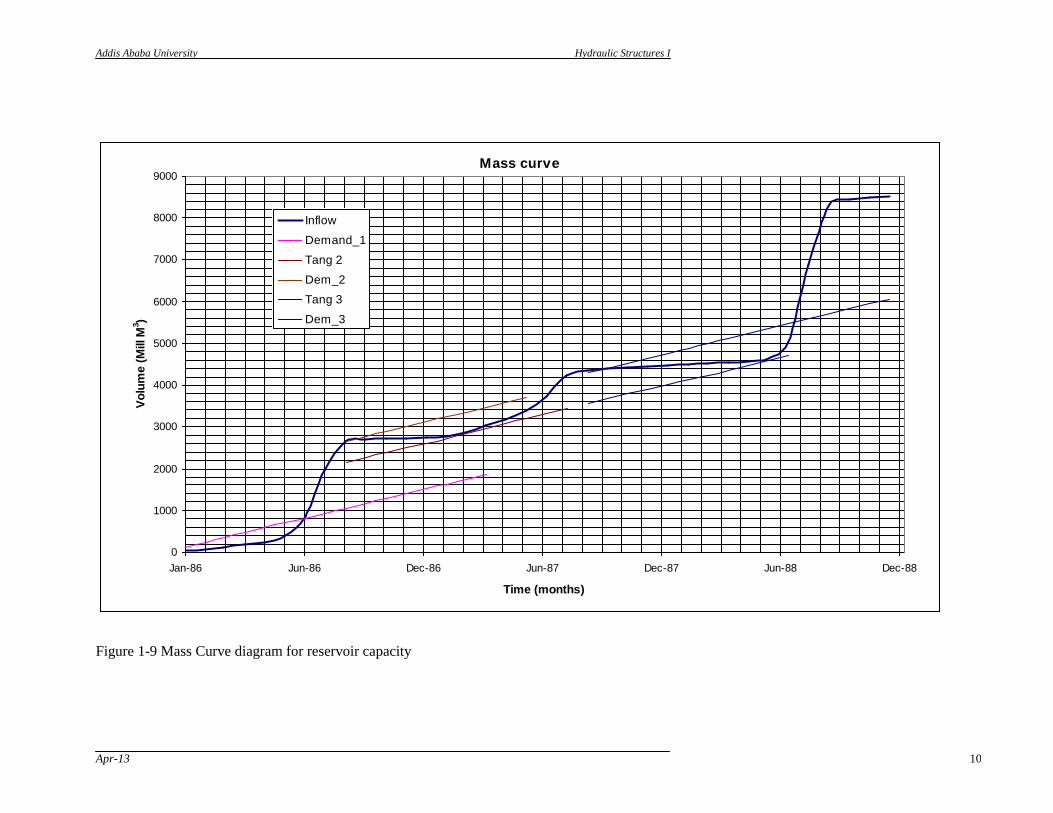
dry period is from January 1986 to January 1989. For this specific period the mass curve is
plotted as shown below.
To know the capacity of the reservoir needed to meet the demand, the reservoir can be considered
as full or empty at the beginning. Assuming that the reservoir is full at the beginning, move the
demand line in a way that it forms tangent line that do not intersect the inflow mass curve of the
previous period. The point at which the tangent line crosses the inflow mass curve is where the
reservoir fills again. If the line never intersects the curve this means that the reservoir will never
be full with in the time frame considered.
Addis Ababa University Hydraulic Structures I
Apr-13 10
Mass curve
0
1000
2000
3000
4000
5000
6000
7000
8000
9000
Jan-86 Jun-86 Dec-86 Jun-87 Dec-87 Jun-88 Dec-88
Time (months)
Vo
lum
e (
Mill M
3)
Inflow
Demand_1
Tang 2
Dem_2
Tang 3
Dem_3
Figure 1-9 Mass Curve diagram for reservoir capacity

Addis Ababa University Hydraulic Structures I
Apr-13 11
1.6 Environmental, Social, Economical and Political investigation
The environmental, economic and other socio-political issues associated with reservoir
development must in all instances be acknowledged at the outset and fully addressed thereafter.
This is especially important in the case of the larger high-profile projects and all other, large or
lesser, sited in environmentally or politically sensitive locations.
Environmental impacts and other socio-political considerations can extend across a diverse
spectrum of issues. Socio-political considerations may range from population displacement, with
consequent economic impacts, to the preservation of cultural or heritage sites; from the
consequences of sedimentation and/or of changing flood regimes to altered patterns of disease.
It is necessary to examine the complex relationships between human society and its surrounding
environment, paying particular attention to issues relating to the local and regional environment,
especially the use and misuse of water resources and the policies governing resource use.
Various types of surveys based on functional and technical requirements should be carried out for
selecting a site for the dam and reservoir. Functional suitability of a site is governed by the
balance between its natural physical characteristics and the purpose of the reservoir. Catchment
hydrology, available head and storage volume etc. must be matched to operational parameters set
by the nature and scale of the project served. Technical acceptability is dictated by the presence
of a satisfactory site for a dam, the availability of materials suitable for dam construction, and by
the integrity of the reservoir basin with respect to leakage. To these must be added an assessment
of the anticipated environmental consequences of construction and operation of the dam.
1.7 Location criteria for dam and spillway site
While selecting a site for a dam the following points should be taken into consideration
i. The dam should be as near as possible to the area to be served, hence conveyance
cost and water losses will be minimized.
ii. Foundation area should be impervious and should be able to support the weight of the
dam.
iii. The topography of the dam and reservoir sites should permit maximum storage of
water at minimum cost.
iv. Materials of construction should be available in sufficient quantity and good quality
at a reasonable distance.
v. The value of property and land which will be submerged by the reservoir has to be as
small as possible.
vi. The cost of relocating roads, buildings etc. should be as small as possible
vii. The cost of stream diversion and dewatering the site should be as small as possible
viii. Transportation facilities and accessibility of the site
ix. Availability of suitable sites for construction equipment and camps
x. The safety of the structure.
While selecting a site for spillway the following points should be taken into consideration
i. The spillway must be a part of the dam itself (not for embankment dams) or it may be
located at a separate site,
ii. The location depends on the foundation and the topography of the area. Good rock
foundation is always desirable and the topography should permit easy diversion of
the flood waters passing over the spillway, back into the original stream channel.
Addis Ababa University Hydraulic Structures I
Apr-13 12
1.8 Dam site investigation
The items of investigation required mainly for a dam structure are listed below:
1. General planning and preparation of location maps: before undertaking actual
investigation it is necessary to prepare location maps indicating
likely dam and spillway site,
proposed relocation of approach roads,
quarry sites for construction material,
stream gauging stations,
proposed camp site,
existing utilities like lines of communication, transmission lines, rail/road
communication,
Other important features.
2. Hydrologic investigation:
collection and analysis of stream flow and precipitation records,
assessment of available yield, estimation of flood peaks,
determination of spillway capacity and
Ground water studies.
3. Topographic survey:
Detailed survey for the dam site covering sufficient area on the u/s and d/s as well
as above the likely height of the dam on both the banks,
Detailed survey for areas proposed for constructing spillway, diversion tunnels,
outlets, power houses etc
Preparation of detailed maps to various scales based on the data collected.
4. Surface geologic investigation:
identification of boundary and nature of deposits and overburden;
the characteristic, structure, strike of rock beds;
Shape and magnitude of folds and fault zones.
5. Subsurface or foundation exploration:
sinking open pits,
drilling holes,
driving shafts and drifts,
Geophysical prospecting using latest techniques.
6. Seismic surveys.
7. Construction material survey:
location and estimate of quantities of available construction material,
estimates need to be supported by laboratory tests to determine suitability of
various materials for construction of dam and other structures.
1.9 Data collection
The collection of relevant data is the first state in the formulation of a project.
i. Physical data
General plan
obtain a general plan of the catchment and project area
carryout limited surveys to include additional information in this plan
the plan must include the dam site, spillway site, irrigable area, catchment area of
the stream, locality to be supplied with potable water (if any)
map scale may vary from 1:1000 – 1:10,1000
features to be included in the map
Addis Ababa University Hydraulic Structures I
Apr-13 13
o contour at 0.5 – 1.5m interval
o location of existing works, if any, affected by the proposed development,
o Proposed relocation of roads, railways, transmission lines, etc.
o Additional transportation facilities such as access roads, cableways, etc.
required for the execution of the project.
o Location of stream gauging station, water sampling and meteorological
stations, if any, in the area.
Larger plans for dam and spillway sites
o This should be in the scale of 1:500 – 1:1000 with contours as small as
possible
o The plans should show the following
Over-banks
Location of elevation of all features such as buildings, roads, etc.
Location and number of test pits and boreholes
ii. hydrologic data
data needed:
Monthly flow, momentary peak flow of a stream at or near the dam site
Annual sediment load
If available, the following information is necessary
Maximum observed flood level in the system
Report on damage caused by flooding
Data for estimating water demand
# of people to be served
approximate maximum and minimum daily water demand
irrigation water requirement
Other water requirements (industries, livestock, etc.)
iii. Meteorological Data
Average monthly temperature
Average monthly rainfall
Maximum recorded storm intensities
Annual rate of evaporation
iv. Geologic Data: geological map of the entire catchment area.
Dam and Spillway sites
Geologic map is essential
Subsurface investigation should be carried out by an experienced geologist
geologic sections of selected dam site
quality of the overburden material if an earth dam is to be built
shearing strength of the overburden material and the dam material
permeability of the overburden material
quantity and quality of the overburden material for construction purposes
Presence, orientation and extent of joint planes, seams, caverns, and solution
channel.
Strength of the rock (Hardness, etc.) if a concrete dam is to be built.
Reservoir site
Check the existence of cracks
Banks should be checked for possible zones of landslides
v. Earthquake information on past seismic activity in the area should be obtained
vi. Agricultural data
For irrigation purposes, the following data are essential for determining of water
requirement

Addis Ababa University Hydraulic Structures I
Apr-13 14
The size of the area to be irrigated
Soil structure
Possible types of crops
Soil types
vii. Material type
Soil, sand and stone (for aggregate and riprap) are needed in good quality and
sufficient quantity for dam construction. Therefore, possible quarry sites for these
materials should be identified with in a reasonable distance from the construction
site.
Selection of a suitable burrow area is influenced by
Thickness of top organic soil which has to be discarded
Content of organic matter in the rest of the soil
Quantity of oversize cobbles which could have to be removed from the soil
Rock for aggregate and riprap has to pass the standard tests of specific gravity
absorption, abrasion soundness etc.
viii. Miscellaneous data
Erosion in the catchment area
Identify exception sources of erosion
Transport
Existing facilities and rates
Local labor
Availability and rates
1.10 Site Requirement
For the budget allocated and the data collected the site selected for the reservoir and dam need to
be further evaluated for detail design. The detail design will of course necessitate additional data
collection.
Addis Ababa University Hydraulic Structures I
Apr-13 15
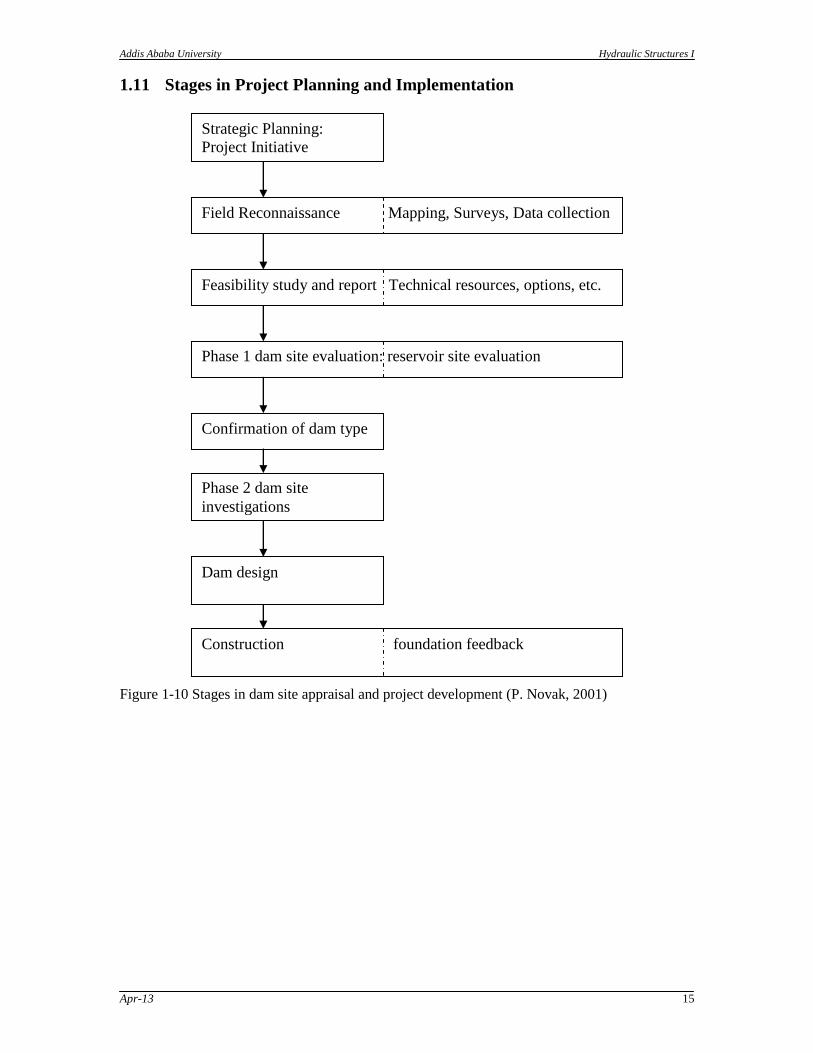
1.11 Stages in Project Planning and Implementation
Figure 1-10 Stages in dam site appraisal and project development (P. Novak, 2001)
Feasibility study and report Technical resources, options, etc.
Field Reconnaissance Mapping, Surveys, Data collection
Dam design
Phase 1 dam site evaluation: reservoir site evaluation
Confirmation of dam type
Phase 2 dam site
investigations
Construction foundation feedback
Strategic Planning:
Project Initiative
Addis Ababa University Hydraulic Structures I
Apr-13 16
2 Foundations of Dams and their Treatment
2.1 General
Foundation is part of the area under and adjacent to a dam, i.e., bottom and abutments.
A sound foundation
Must have sufficient strength to withstand crushing and to prevent sliding,
Must be tight enough to prevent excessive leakage and to reduce uplift as much as possible.
Must not be damaged by overflow discharge and discharge from outlet works.
Foundations may be classified as:
Rock foundations
Earth foundations
Foundations of coarse grained material (sand and gravel)
Foundations of fine grained materials (silt and clay)
2.2 Rock foundation
2.2.1 General
In the strength and stability calculations rock foundations are considered to be homogeneous,
continuous and isotropic but actually the rock as well as earth foundations are heterogeneous,
anisotropic, consisting of rocks of different properties and are divided by various cracks, i.e.
foundations are never continuous.
In general, rock foundations present no problem of bearing capacity and settlement even though
the foundation mass has smaller strength and large deformability than its composing rock.
Defects of rock foundations:
Presence of seams, fissures, cracks or faults that have usually resulted in erosive leakage,
excessive loss of water and sliding.
Presence of weathered zone (surface rock) or crushed zone that have usually resulted in
separate foundation.
2.2.2 Foundation treatment
Treatment of foundation, if it is necessary, consists of grouting cracks and tectonic zones and
infilling of weak portions with concrete, in strengthening broken-up parts using different
connecting arrangements and structures.
Weathered portion (surface rock) has to be excavated and removed. Excavation has to be deep
enough to give a firm „toe hold‟ to the dam.
Consolidation of foundation:
Grouting is carried out to consolidate fissured or cracked foundations (consolidation grouting) by
a grout that is prepared properly as a mixture of water and cement with admixtures of rock flour,
bentonite, etc. Grouting is usually started with a mixture of cement and water in the proportion
1:5 and gradually thickened to 1:1.
Grouting hole: Depth =15 m
Spacing = 3 to 6 m on centers
Grout pressure = 3.5 kg/cm2 (=350 KPa)
Addis Ababa University Hydraulic Structures I
Apr-13 17
Execution starts with holes drilled and grouted from 12 to 25 m apart; then, intermediate holes are
drilled and grouted.
Allowable stress: Granite : 4.0 – 7.0 KPa
Limestone : 2.5 – 5.5 KPa
Sandstone : 2.5 – 4.0 KPa
2.2.3 Measures against leakage
Leakage through rock foundations can be prevented by making grout curtain or trench filled with
concrete.
Grout curtain: High pressure holes drilled relatively deep and near the u/s foundation of dam at
close intervals and grouted under pressure (depth to be determined by water pressure test).
Depth: In hard rock = 30 – 40 % of dam height
In poor rock = as much as 70 % of dam height.
Tentative spacing = 1.5m on centers
Grout Pressure = 0.25 Kg/cm2 per meter depth below the surface
For small dams, one row of grouting holes may be sufficient. No grouting is required for
detention dams. Hot asphalt is used for sealing openings of large size containing running water.
Trench filled with concrete: Preferable if it can be done economically.
Treatment of faults, shear joints, etc.:
Optimum depth of back filling = 20% of dam height
Estimation of optimum depth as per USBR recommendation,
d = 0.0066 bh – 1.5 for h ≤ 46 m
d = 0.3 bh + 1.5 for h ≥ 46 m
Where: d = depth of excavation of weak zone below ground surface at adjoining sound rock in m.
h = height of dam above average foundation level general
b = width of wet zone
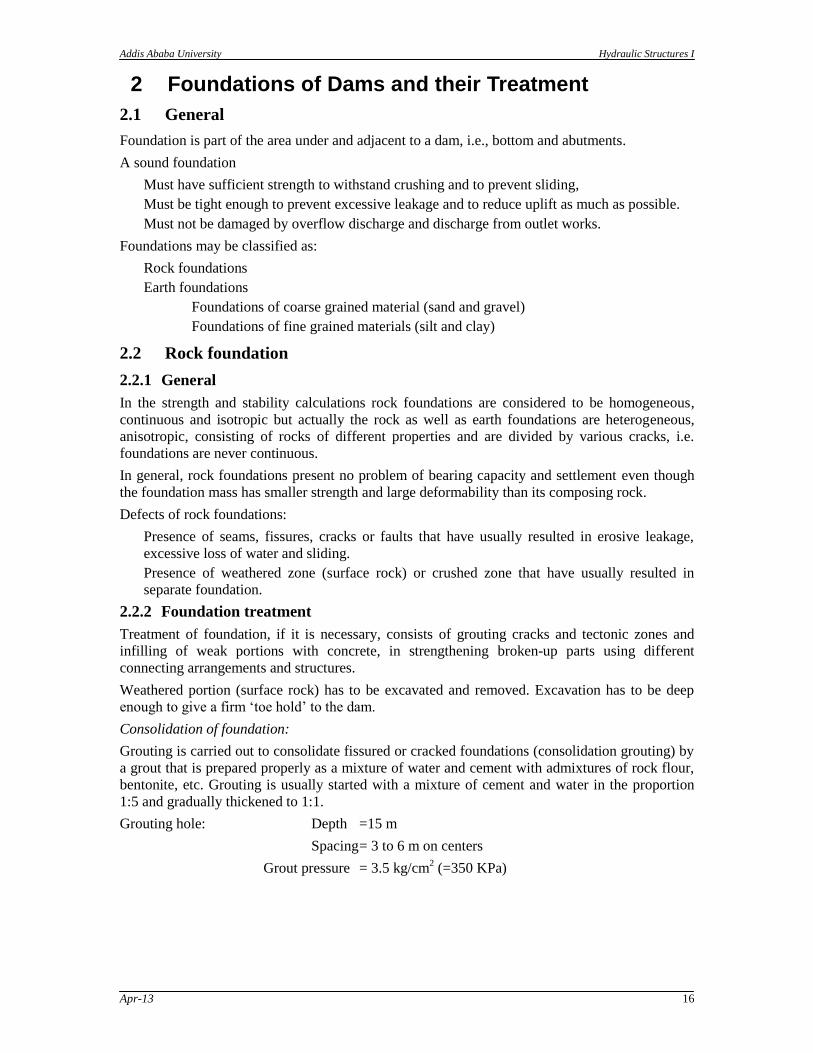
Preparation of rock and dam interface
The rock and dam interface must be prepared to obtain reliable interlocking and long contact
length in the flow direction.
Figure 2-1 Profile of a typical interface
2.2.4 Drainage
Drainage is provided to relieve uplift pressure at base of dam. It is provided by a line of drilled
holes d/s from the grout curtain. The holes are connected to drainage gallery to carry the seepage
to the tail water.
Addis Ababa University Hydraulic Structures I
Apr-13 18
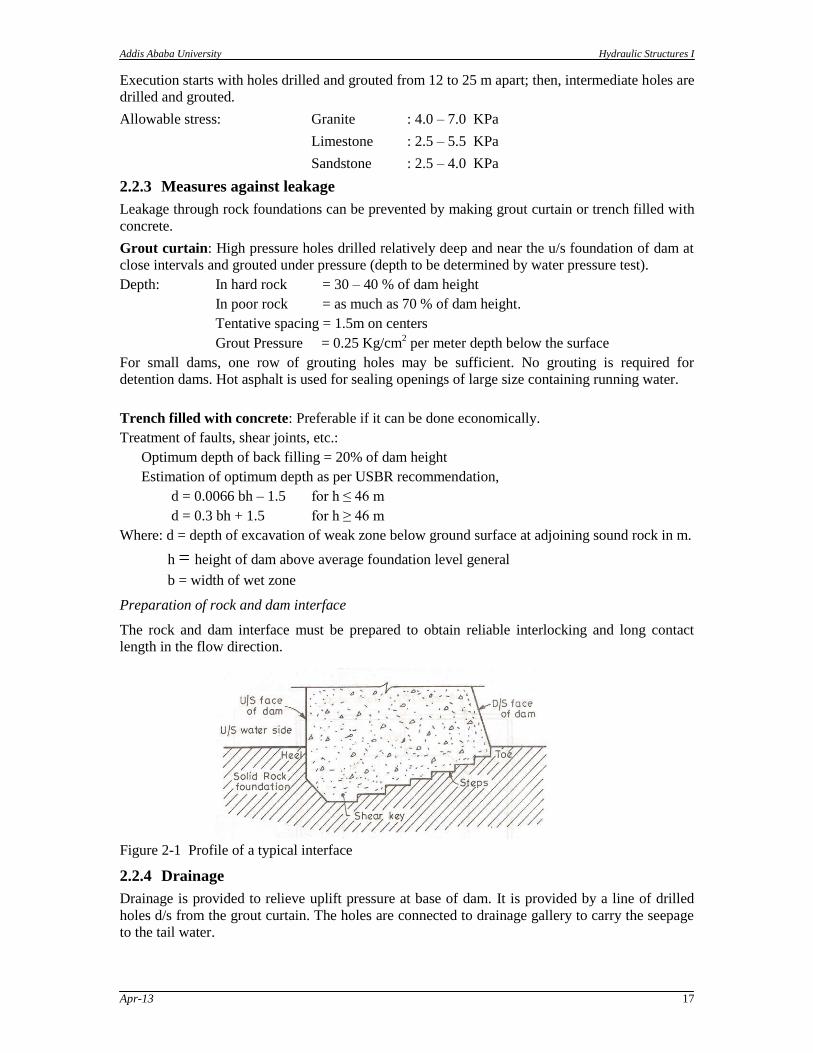
The reduction in uplift pressure in a properly working drainage gallery can be estimated as,
)'(3
2HHp
WU
Where PU = reduction of pressure at the drainage
w = unit weight of water
H = u/s water head
H’ = tail water head
a. No drainage b. Drainage gallery is provided
Figure 2-2 Uplift pressure distribution with and without drainage gallery
Net pressure available at the gallery becomes
)'2(3
1
)'(3
2
HH
HHHp
W
WWUg
2.2.5 Stability of Dams and Strength of Rock Foundation
Loss of stability of dam and displacement thereof may occur due to:
i. sliding, when its contact with the foundation is disturbed or due to cracks in the
foundation when inadmissible tensile and tangential stresses appear;
ii. overturning, when its contact with the foundation is disturbed;
iii. destruction of rock mass of foundation under the action of stresses appearing in it.
2.3 Earth foundation
2.3.1 General
Earth foundation may be classified as:
Foundations of coarse-grained material (gravel and sand)
Foundations of fine-grained material (silt and clay).
Addis Ababa University Hydraulic Structures I
Apr-13 19
In preparation of earth foundations, the objectives are to prevent: crushing, sliding, excessive
seepage under the dam, piping, and scouring by water flowing over the dam.
Because of the high cost of treatment of earth foundations, gravity dams on earth foundations are
limited in height to 20m.
2.3.2 Gravel and sand foundation
Gravel and sand foundations are alluvial in origin. The following two basic seepage problems are
encountered in using these foundations:
excessive loss of water
large seepage force
Extent of treatment to reduce the effect of the aforementioned problems depends on:
The purpose of the dam (seepage quantity is of little concern in a detention dam).
The necessity of the downstream release
Regardless of the quantity of seepage, adequate measures have to be provided to reduce the
danger of piping.
2.3.3 Estimation of seepage amount
A rough estimation of the amount of seepage could be made using the Darcy‟s equation
Q = kiA
Where: Q = rate of seepage (m3/s)
k = Permeability (Hydraulic conductivity) of the foundation material (m/s).
i = hydraulic gradient
= H/L H = upstream and downstream sections head difference (m).
L = length of seepage path (m)
A = gross area of foundation through which flow takes place (m2).
A better estimation of seepage quantity can be made by flow net analysis of the foundation. Using
flow net technique,
q = k H Nf / Np
Where: q = seepage quantity per unit length (m3/s/m)
Nf = number of flow channels
Np = number of potential drops
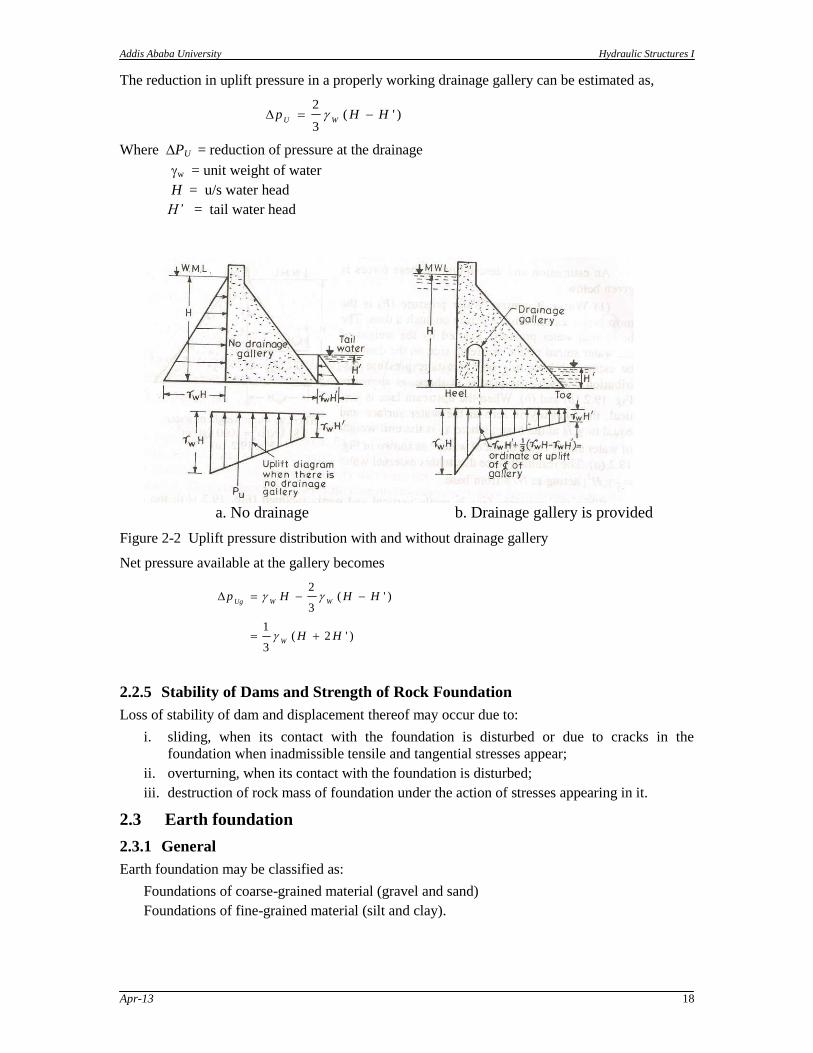
Example: For the ogee spillway with sheetpiling cutoff shown below:
a. Compute the seepage in m3/min.; and
b. Calculate the uplift force acting on the base of the dam.
Addis Ababa University Hydraulic Structures I
Apr-13 20
To compute the seepage
Alternative I.
h = 2m, H = 20m
k = 0.00001m/min [Hydraulic conductivity of pervious foundation]
L = 48m [bottom length of the spillway]
I = h/l = 2/6 = 0.33
q = KIA [Darcy‟s Equation]
= 0.00001 m/min * 0.33 * 24 m2/m
= 8.0 x 10⁻⁵
m3/min Per meter length of structure
Alternative II
H = 20m [head difference of head and tail water level]
Nf = 4 [number of Flow channels]
Nd = 10 [number of Equipotential lines]
d
f
N
NkHq
length min//10*0.8
10
4*20min*/00001.0
35mm
mN
NkHq
d
f
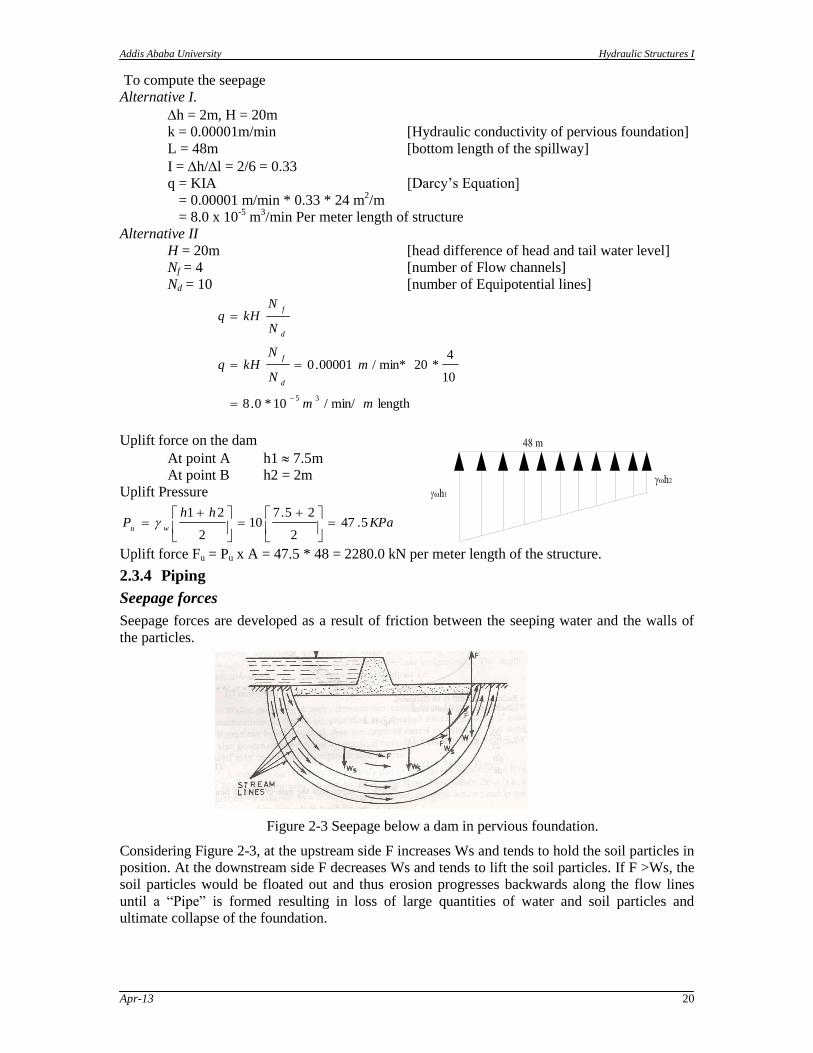
Uplift force on the dam
At point A h1 7.5m
At point B h2 = 2m Uplift Pressure
KPahh
Pwu
5.472
25.710
2
21
Uplift force Fu = Pu x A = 47.5 * 48 = 2280.0 kN per meter length of the structure.
2.3.4 Piping
Seepage forces
Seepage forces are developed as a result of friction between the seeping water and the walls of
the particles.
Figure 2-3 Seepage below a dam in pervious foundation.
Considering Figure 2-3, at the upstream side F increases Ws and tends to hold the soil particles in
position. At the downstream side F decreases Ws and tends to lift the soil particles. If F >Ws, the
soil particles would be floated out and thus erosion progresses backwards along the flow lines
until a “Pipe” is formed resulting in loss of large quantities of water and soil particles and
ultimate collapse of the foundation.
Addis Ababa University Hydraulic Structures I
Apr-13 21
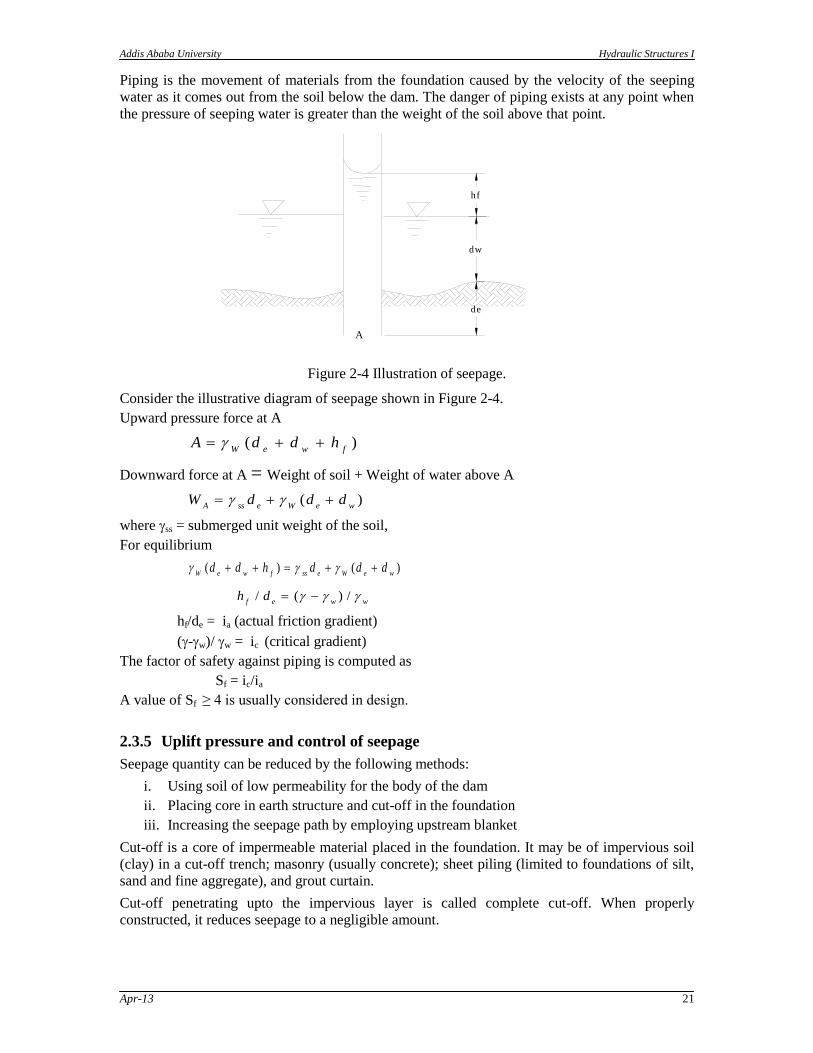
Piping is the movement of materials from the foundation caused by the velocity of the seeping
water as it comes out from the soil below the dam. The danger of piping exists at any point when
the pressure of seeping water is greater than the weight of the soil above that point.
A
de
dw
hf
Figure 2-4 Illustration of seepage.
Consider the illustrative diagram of seepage shown in Figure 2-4.
Upward pressure force at A
)(fweW
hddA
Downward force at A = Weight of soil + Weight of water above A
)(weWessA
dddW
where ss = submerged unit weight of the soil,
For equilibrium
)()(weWessfweW
dddhdd
wwefdh /)(/
hf/de = ia (actual friction gradient)
(-w)/ w = ic (critical gradient)
The factor of safety against piping is computed as
Sf = ic/ia
A value of Sf ≥ 4 is usually considered in design.
2.3.5 Uplift pressure and control of seepage
Seepage quantity can be reduced by the following methods:
i. Using soil of low permeability for the body of the dam
ii. Placing core in earth structure and cut-off in the foundation
iii. Increasing the seepage path by employing upstream blanket
Cut-off is a core of impermeable material placed in the foundation. It may be of impervious soil
(clay) in a cut-off trench; masonry (usually concrete); sheet piling (limited to foundations of silt,
sand and fine aggregate), and grout curtain.
Cut-off penetrating upto the impervious layer is called complete cut-off. When properly
constructed, it reduces seepage to a negligible amount.
Addis Ababa University Hydraulic Structures I
Apr-13 22
U pstream B lanket
Partial C utoffC om plete C utoff
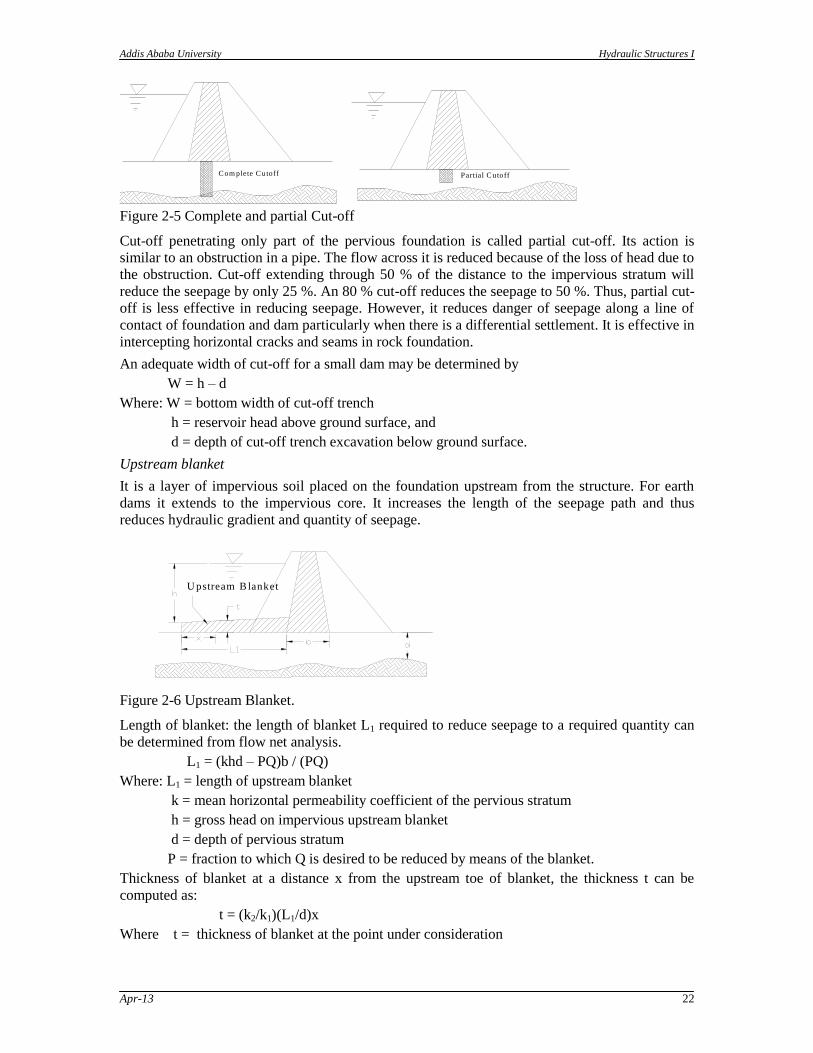
Figure 2-5 Complete and partial Cut-off
Cut-off penetrating only part of the pervious foundation is called partial cut-off. Its action is
similar to an obstruction in a pipe. The flow across it is reduced because of the loss of head due to
the obstruction. Cut-off extending through 50 % of the distance to the impervious stratum will
reduce the seepage by only 25 %. An 80 % cut-off reduces the seepage to 50 %. Thus, partial cut-
off is less effective in reducing seepage. However, it reduces danger of seepage along a line of
contact of foundation and dam particularly when there is a differential settlement. It is effective in
intercepting horizontal cracks and seams in rock foundation.
An adequate width of cut-off for a small dam may be determined by
W = h – d
Where: W = bottom width of cut-off trench
h = reservoir head above ground surface, and
d = depth of cut-off trench excavation below ground surface.
Upstream blanket
It is a layer of impervious soil placed on the foundation upstream from the structure. For earth
dams it extends to the impervious core. It increases the length of the seepage path and thus
reduces hydraulic gradient and quantity of seepage.
U pstream B lanket
Figure 2-6 Upstream Blanket.
Length of blanket: the length of blanket L1 required to reduce seepage to a required quantity can
be determined from flow net analysis.
L1 = (khd – PQ)b / (PQ)
Where: L1 = length of upstream blanket
k = mean horizontal permeability coefficient of the pervious stratum
h = gross head on impervious upstream blanket
d = depth of pervious stratum
P = fraction to which Q is desired to be reduced by means of the blanket.
Thickness of blanket at a distance x from the upstream toe of blanket, the thickness t can be
computed as:
t = (k2/k1)(L1/d)x
Where t = thickness of blanket at the point under consideration
Addis Ababa University Hydraulic Structures I
Apr-13 23
x = distance from the point under consideration to upstream toe of the blanket
k1 = average permeability of stratum
k2 = permeability of blanket
L1 = length of blanket from upstream toe to impervious section, and
d = depth of pervious stratum
For normal conditions:
t = 1.5 – 3.0 meters
L1 = 10h
In case of fine sand or silty foundation;
L1 = 15h
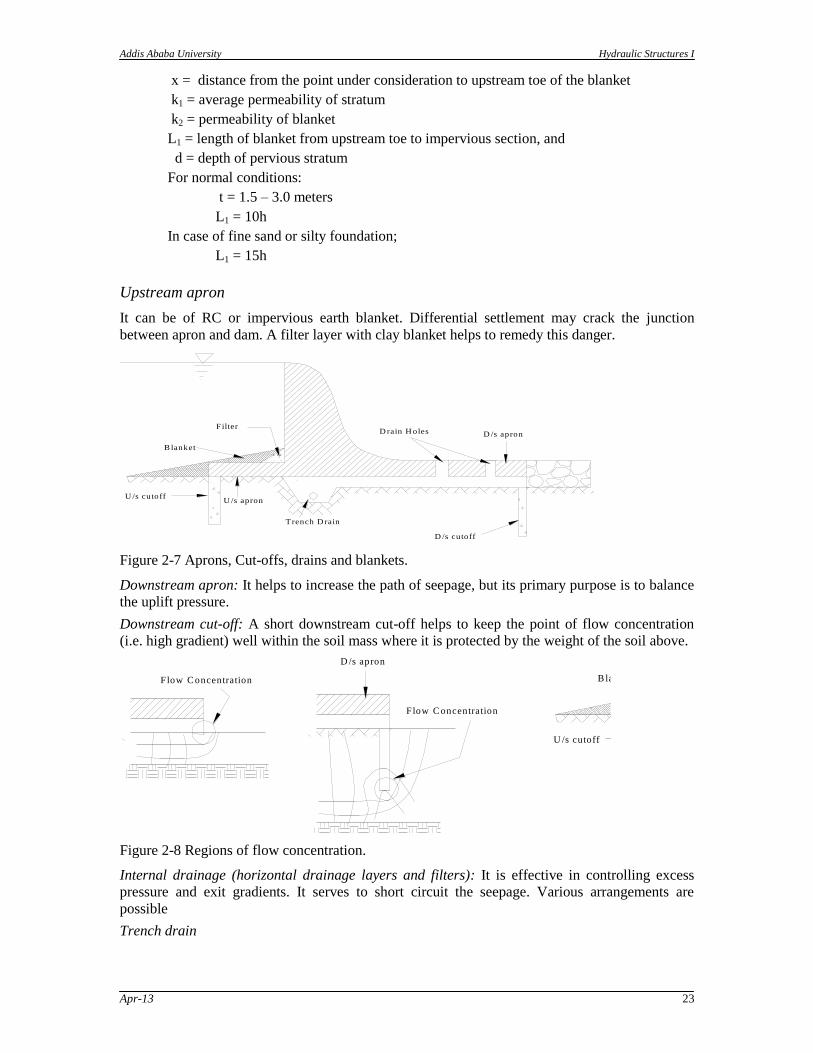
Upstream apron
It can be of RC or impervious earth blanket. Differential settlement may crack the junction
between apron and dam. A filter layer with clay blanket helps to remedy this danger.
Filter
B lanket
D /s apronD rain H oles
D /s cutoff
Trench D rain
U /s apronU /s cutoff
Figure 2-7 Aprons, Cut-offs, drains and blankets.
Downstream apron: It helps to increase the path of seepage, but its primary purpose is to balance
the uplift pressure.
Downstream cut-off: A short downstream cut-off helps to keep the point of flow concentration
(i.e. high gradient) well within the soil mass where it is protected by the weight of the soil above.
Flow C oncentration
Flow C oncentration B lanket
U /s cutoff
D /s apron
Figure 2-8 Regions of flow concentration.
Internal drainage (horizontal drainage layers and filters): It is effective in controlling excess
pressure and exit gradients. It serves to short circuit the seepage. Various arrangements are
possible
Trench drain
Addis Ababa University Hydraulic Structures I
Apr-13 24
Figure 2-9 Trench and Blanket drains
Toe drain: it is used when the downstream shell is so pervious that it forms a drain.
Low ered line of seepage
Toe drain
Figure 2-10 Toe drain.
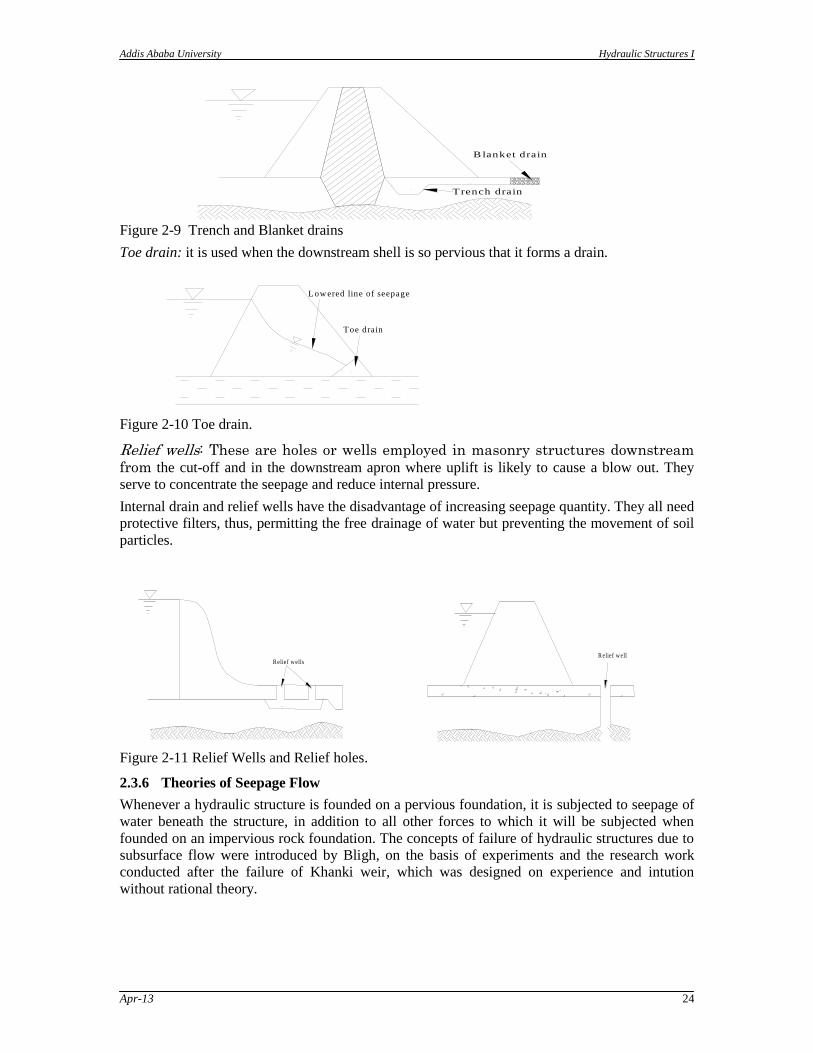
Relief wells: These are holes or wells employed in masonry structures downstream
from the cut-off and in the downstream apron where uplift is likely to cause a blow out. They
serve to concentrate the seepage and reduce internal pressure.
Internal drain and relief wells have the disadvantage of increasing seepage quantity. They all need
protective filters, thus, permitting the free drainage of water but preventing the movement of soil
particles.
Figure 2-11 Relief Wells and Relief holes.
2.3.6 Theories of Seepage Flow
Whenever a hydraulic structure is founded on a pervious foundation, it is subjected to seepage of
water beneath the structure, in addition to all other forces to which it will be subjected when
founded on an impervious rock foundation. The concepts of failure of hydraulic structures due to
subsurface flow were introduced by Bligh, on the basis of experiments and the research work
conducted after the failure of Khanki weir, which was designed on experience and intution
without rational theory.
B lanket drain
Trench drain
R elief w ell
F low C oncentration
Flow C oncentration
D /s apronD rain H olesFilter
B lanket
D /s cutoff
T rench D rain
U /s cutoffU /s apron
R elief w ells
D /s apron
Addis Ababa University Hydraulic Structures I
Apr-13 25
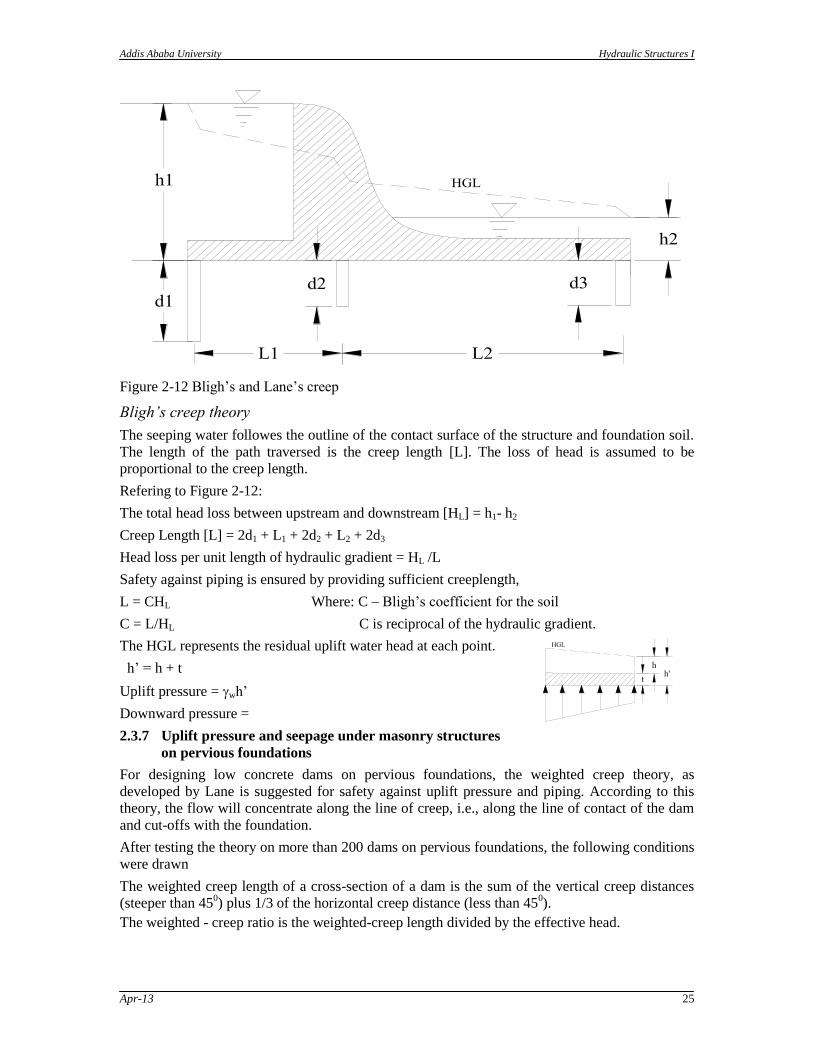
Figure 2-12 Bligh‟s and Lane‟s creep
Bligh’s creep theory
The seeping water followes the outline of the contact surface of the structure and foundation soil.
The length of the path traversed is the creep length [L]. The loss of head is assumed to be
proportional to the creep length.
Refering to Figure 2-12:
The total head loss between upstream and downstream [HL] = h1- h2
Creep Length [L] = 2d1 + L1 + 2d2 + L2 + 2d3
Head loss per unit length of hydraulic gradient = HL /L
Safety against piping is ensured by providing sufficient creeplength,
L = CHL Where: C – Bligh‟s coefficient for the soil
C = L/HL C is reciprocal of the hydraulic gradient.
The HGL represents the residual uplift water head at each point.
h‟ = h + t
Uplift pressure = wh‟
Downward pressure =
2.3.7 Uplift pressure and seepage under masonry structures
on pervious foundations
For designing low concrete dams on pervious foundations, the weighted creep theory, as
developed by Lane is suggested for safety against uplift pressure and piping. According to this
theory, the flow will concentrate along the line of creep, i.e., along the line of contact of the dam
and cut-offs with the foundation.
After testing the theory on more than 200 dams on pervious foundations, the following conditions
were drawn
The weighted creep length of a cross-section of a dam is the sum of the vertical creep distances
(steeper than 450) plus 1/3 of the horizontal creep distance (less than 45
0).
The weighted - creep ratio is the weighted-creep length divided by the effective head.
Addis Ababa University Hydraulic Structures I
Apr-13 26
When filter drains and relief wells are not used, the full Lane‟s weighted - creep ratio is to be
used (case a). Where drains are properly provided (but no flow net analysis is made), use 80% of
Lane‟s weighted creep ratio (case b).
Where both drains and flow net analysis are used, use 70% of weighed-creep ratio (case c). Take
minimum weighted-creep ratio (WCR) = 1.5
The pressure to be used in design may be estimated by assuming that the drop in pressure from
headwater to tail water along the contact line of the dam and foundation is proportional to
weighted-creep length
Table 2-1 Lane‟s recommended WCR for different materials
Material
Case a
Lane 100%
Case b
Lane 80 %
Case c
Lane 70%
Very fine sand and silt 8.5 6.8 6
Fine sand 7.0 5.6 4.9
Medium sand 6.0 4.8 4.2
Coarse sand 5.0 4.0 3.5
Fine gravel 4.0 3.2 2.8
Medium gravel 3.5 2.8 2.5
Coarse gravel (including Cobbles) 3.0 2.4 2.1
Boulders with stone, cobbles, and gravel 2.5 2.0 1.8
Soft clay 3.0 2.4 2.1
Medium Clay 2.0 1.6 1.5
Hard clay 1.8 1.5 1.5
Very hard clay and hard pan 1.6 1.5 1.5
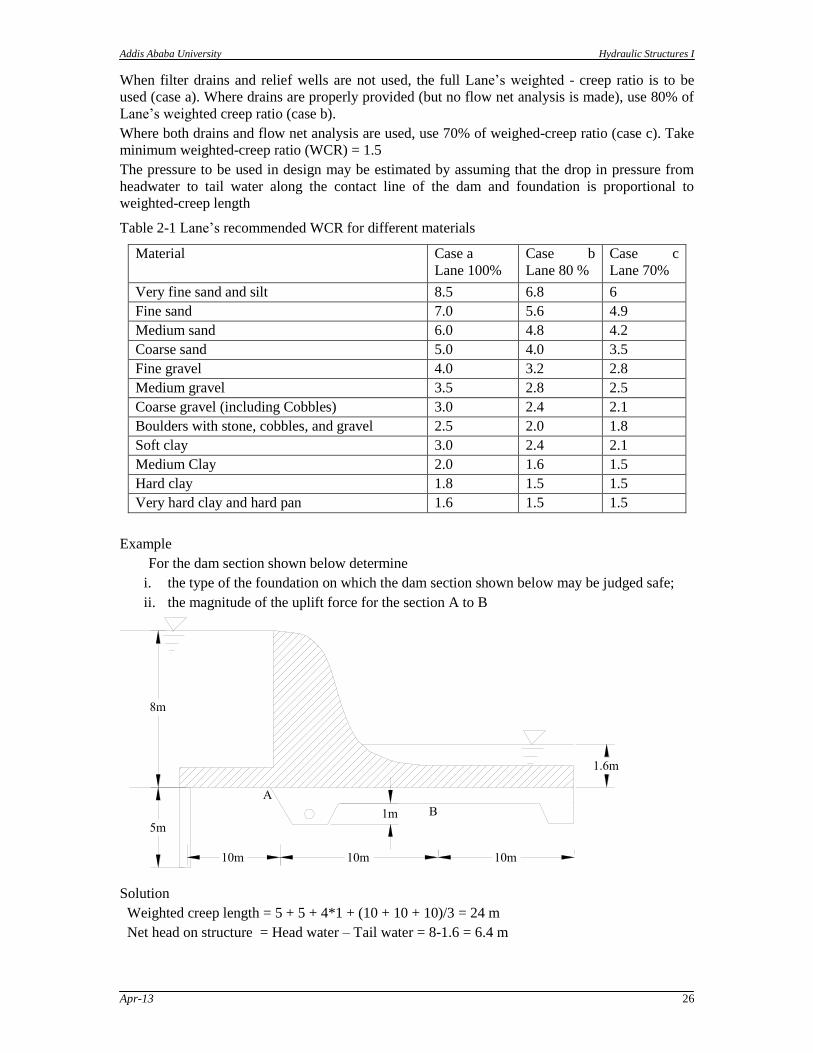
Example
For the dam section shown below determine
i. the type of the foundation on which the dam section shown below may be judged safe;
ii. the magnitude of the uplift force for the section A to B
Solution
Weighted creep length = 5 + 5 + 4*1 + (10 + 10 + 10)/3 = 24 m
Net head on structure = Head water – Tail water = 8-1.6 = 6.4 m
Addis Ababa University Hydraulic Structures I
Apr-13 27
Weighted creep ratio = 24 / 6.4 = 3.75
According to Lane‟s ratios, the dam(spillway) would be safe on clay or on medium gravel and
coarse gravel. With properly provided drains and filters, it may be considered safe on fine gravel
foundations [case b]
02.36.14.6*24
10/3)3/10115(5 - 6.4 Bpoint at Uplift
44.46.14.6*24
10/3)5(5 - 6.4 A point at Uplift
m
lengthcrest N/m591.362
3.02)(4.44 ABsection on Uplift Total k
w
2.3.8 Silt and clay foundation
Such foundation materials are sufficiently impervious. Thus seepage is not a problem. The main
challenge is bearing capacity.
Methods of foundation treatment are based on:
Soil type
Location of water table
State of compactness of the soil
Methods of treatment
a. For saturated fine-grained soils
Soil of low shearing strength is removed. This is practical for thin layers of soft soil
overlying firm material if the cost of excavation and refill is less than the cost of special
investigation and provision of flatter slopes of embankment.
Drainage is provided to the foundation to permit increase of strength during
construction.
Flatter slopes for the embankment are used to reduce the magnitude of the average
shearing stress along the potential surface of sliding. This is the most practical solution.
For recommended slopes, refer to “Design of small dams, USBR” sec 129.
b. For relatively dry foundations
For a given void ratio, an impervious soil has greater bearing capacity in the unsaturated
condition than in the saturated condition. Hence dry silt and clay foundations are generally
satisfactory for small dams.
Soils like loess (very loose wind deposited soils) exhibit sufficient strength at low water content.
Such low density soils are subject to large settlements when saturated by reservoir and may result
in failure of the dam by differential settlements that may cause rupture of the impervious portion
or by considerable reduction in free board resulting in overtopping.
Treatment here depends on the compression characteristics of the soil.
If appreciable post construction settlements are not expected upon saturation, little foundation
treatment is necessary.
Remove organic top soil
Provide a key trench
Provide a toe drain so that the foundation at the downstream toe will not saturate
When appreciable post construction settlements upon saturation are expected, measures to
minimize the settlements should be adopted.
Addis Ababa University Hydraulic Structures I
Apr-13 28
3 Concrete Gravity Dam
3.1 General
Basically, gravity dams are solid concrete structures that maintain their stability against design
loads from the geometric shape and the mass and strength of the concrete. Generally, they are
constructed on a straight axis, but may be slightly curved or angled to accommodate the specific
site conditions. Gravity dams typically consist of a non-overflow section(s) and an overflow
section or spillway.
3.2 Forces acting on gravity dams
The structural integrity of a dam must be maintained across the range of circumstances or events
likely to arise in service. The design is therefore determined through consideration of the
corresponding spectrum of loading conditions. In all foreseeable circumstances the stability of the
dam and foundation must be ensured, with stresses contained at acceptable levels and watertight
integrity essentially unimpaired.
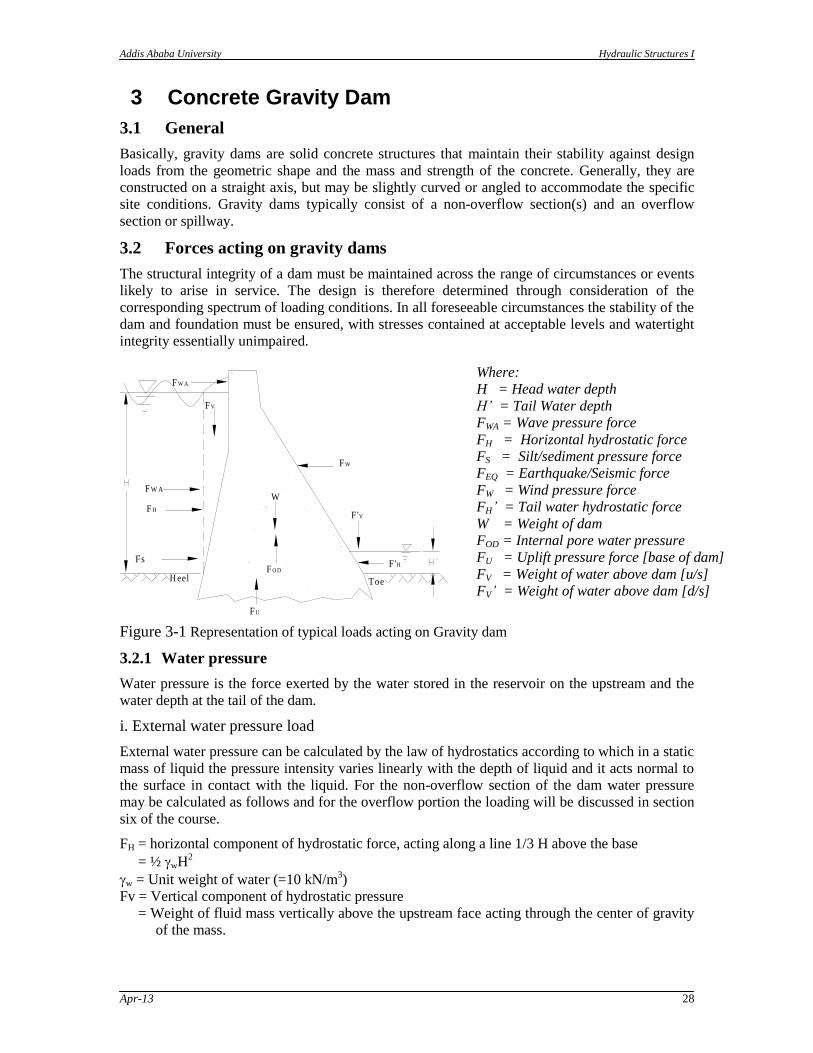
Figure 3-1 Representation of typical loads acting on Gravity dam
3.2.1 Water pressure
Water pressure is the force exerted by the water stored in the reservoir on the upstream and the
water depth at the tail of the dam.
i. External water pressure load
External water pressure can be calculated by the law of hydrostatics according to which in a static
mass of liquid the pressure intensity varies linearly with the depth of liquid and it acts normal to
the surface in contact with the liquid. For the non-overflow section of the dam water pressure
may be calculated as follows and for the overflow portion the loading will be discussed in section
six of the course.
FH = horizontal component of hydrostatic force, acting along a line 1/3 H above the base
= ½ wH2
w = Unit weight of water (=10 kN/m3)
Fv = Vertical component of hydrostatic pressure
= Weight of fluid mass vertically above the upstream face acting through the center of gravity
of the mass.
ToeH eel
F 'H
F W
F U
F'V
F O D
W
F V
F W A
F W A
F H
Fs
Where:
H = Head water depth
H’ = Tail Water depth
FWA = Wave pressure force
FH = Horizontal hydrostatic force
FS = Silt/sediment pressure force
FEQ = Earthquake/Seismic force
FW = Wind pressure force
FH’ = Tail water hydrostatic force
W = Weight of dam
FOD = Internal pore water pressure
FU = Uplift pressure force [base of dam]
FV = Weight of water above dam [u/s]
FV’ = Weight of water above dam [d/s]
Addis Ababa University Hydraulic Structures I
Apr-13 29
ii. Internal water pressure (Uplift Pressure)
Internal water pressure is the force exerted by water penetrating through the pores, cracks and
seams with in the body of the dam, at contact surface between the dam and its foundation, and
with in the foundation. It acts vertically upward at any horizontal section of the dam as well as its
foundation and hence it causes a reduction in the effective weight of the portion of the structure
lying above this section.
The computation of internal pressure involves the consideration of two constituent elements, i.e,
Hydrostatic pressure of water at a point
The percentage C, area factor, of the area on which the hydrostatic pressure acts
Both these elements are discussed below.
Hydrostatic pressure
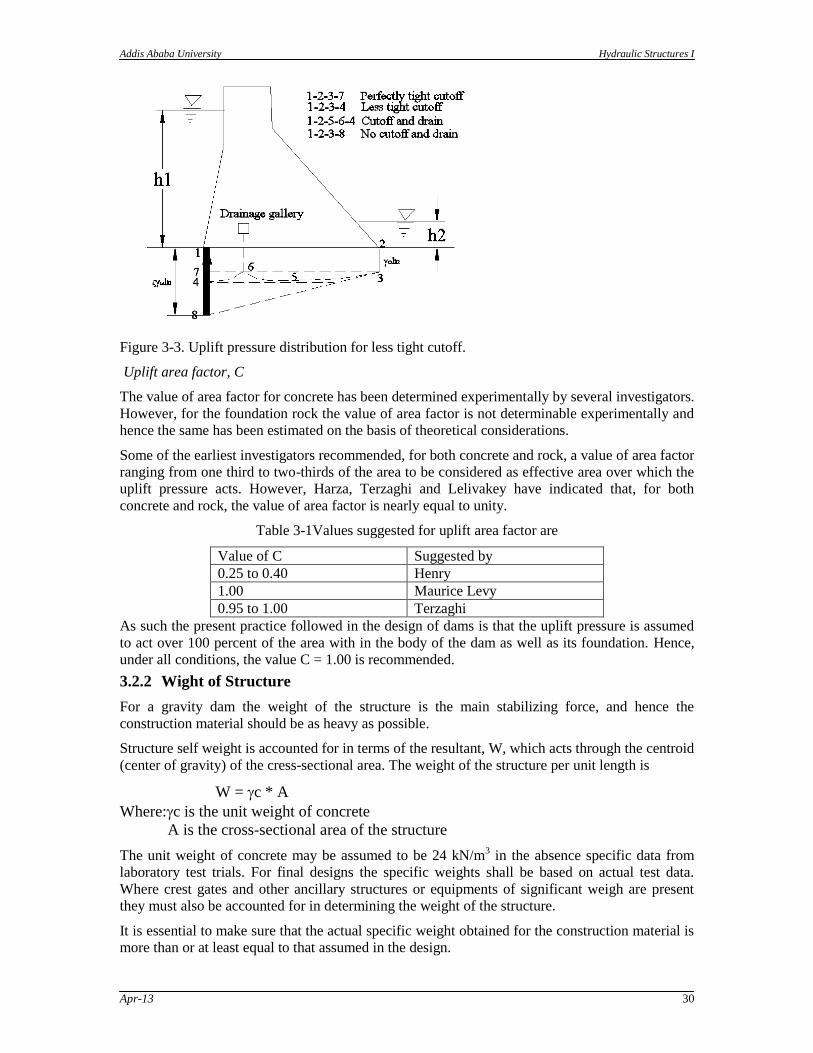
In practice dams are usually provided with cut-off walls or grout curtains to reduce seepage and
drain to relieve pressure downstream from the cutoff. Actually cutoff and grout curtains may not
be perfectly tight and hence fail to dissipate the head (h1 – h2)
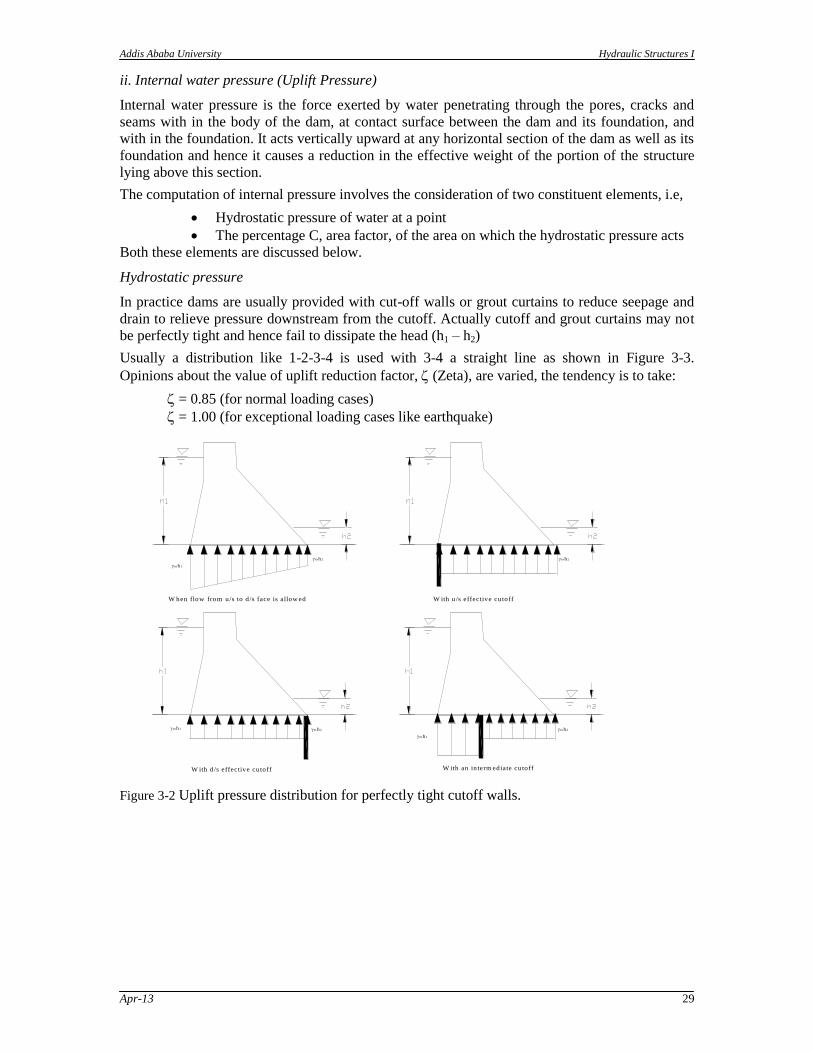
Usually a distribution like 1-2-3-4 is used with 3-4 a straight line as shown in Figure 3-3.
Opinions about the value of uplift reduction factor, (Zeta), are varied, the tendency is to take:
= 0.85 (for normal loading cases)
= 1.00 (for exceptional loading cases like earthquake)
W ith an in term ediate cutoffW ith d/s effective cutoff
W ith u/s effective cutoffW hen flow from u/s to d/s face is allow ed
h 1
h2h 1 h2
h 2h 2
h 1
Figure 3-2 Uplift pressure distribution for perfectly tight cutoff walls.
Addis Ababa University Hydraulic Structures I
Apr-13 30
Figure 3-3. Uplift pressure distribution for less tight cutoff.
Uplift area factor, C
The value of area factor for concrete has been determined experimentally by several investigators.
However, for the foundation rock the value of area factor is not determinable experimentally and
hence the same has been estimated on the basis of theoretical considerations.
Some of the earliest investigators recommended, for both concrete and rock, a value of area factor
ranging from one third to two-thirds of the area to be considered as effective area over which the
uplift pressure acts. However, Harza, Terzaghi and Lelivakey have indicated that, for both
concrete and rock, the value of area factor is nearly equal to unity.
Table 3-1Values suggested for uplift area factor are
Value of C Suggested by
0.25 to 0.40 Henry
1.00 Maurice Levy
0.95 to 1.00 Terzaghi
As such the present practice followed in the design of dams is that the uplift pressure is assumed
to act over 100 percent of the area with in the body of the dam as well as its foundation. Hence,
under all conditions, the value C = 1.00 is recommended.
3.2.2 Wight of Structure
For a gravity dam the weight of the structure is the main stabilizing force, and hence the
construction material should be as heavy as possible.
Structure self weight is accounted for in terms of the resultant, W, which acts through the centroid
(center of gravity) of the cress-sectional area. The weight of the structure per unit length is
W = c * A
Where:c is the unit weight of concrete
A is the cross-sectional area of the structure
The unit weight of concrete may be assumed to be 24 kN/m3 in the absence specific data from
laboratory test trials. For final designs the specific weights shall be based on actual test data.
Where crest gates and other ancillary structures or equipments of significant weigh are present
they must also be accounted for in determining the weight of the structure.
It is essential to make sure that the actual specific weight obtained for the construction material is
more than or at least equal to that assumed in the design.
Addis Ababa University Hydraulic Structures I
Apr-13 31
3.2.3 Earth and silt pressure
The gradual accumulation of significant deposits of fine sediment, notably silt, against the face of
the dam generates a resultant horizontal force, Fs. The magnitude of this force in additional to
water load, FWH, is a function of the sediment depth, hs, the submerged unit weight, ss, and the
active pressure coefficient, Ka, and is determined according to Rankine‟s formula.
Fs = ½ Kass hs2
Where Ka = (1-sin) / (1+sin)
= angle of internal friction of material.
3.2.4 Wind pressure
When the dam is full, wind will act only on the downstream face, thus contributing to stability.
When the dam is empty, wind can act on the upstream face, but the pressure is small compared to
the hydraulic pressure of the water. Hence for gravity dams wind is not considered. For buttress
dams, wind load on the exposed buttresses has to be considered.
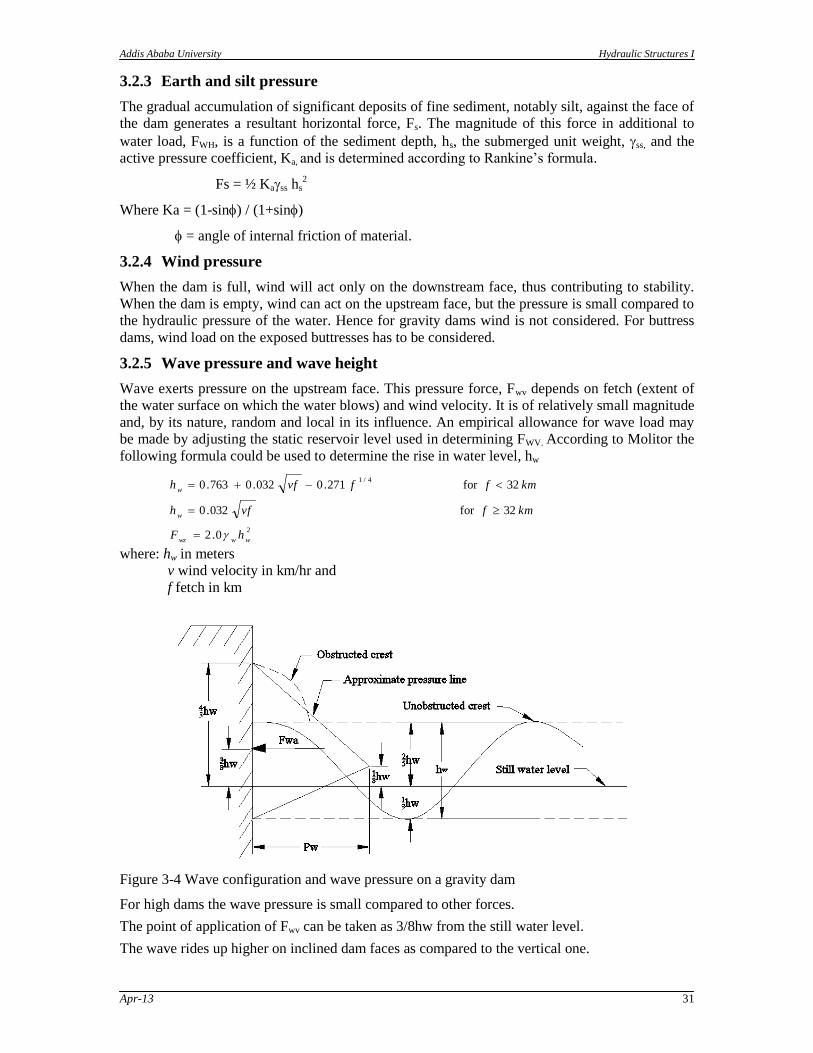
3.2.5 Wave pressure and wave height
Wave exerts pressure on the upstream face. This pressure force, Fwv depends on fetch (extent of
the water surface on which the water blows) and wind velocity. It is of relatively small magnitude
and, by its nature, random and local in its influence. An empirical allowance for wave load may
be made by adjusting the static reservoir level used in determining FWV. According to Molitor the
following formula could be used to determine the rise in water level, hw
2
4/1
0.2
32for 032.0
32for 271.0032.0763.0
wwwz
w
w
hF
kmfvfh
kmffvfh
where: hw in meters
v wind velocity in km/hr and
f fetch in km
Figure 3-4 Wave configuration and wave pressure on a gravity dam
For high dams the wave pressure is small compared to other forces.
The point of application of Fwv can be taken as 3/8hw from the still water level.
The wave rides up higher on inclined dam faces as compared to the vertical one.
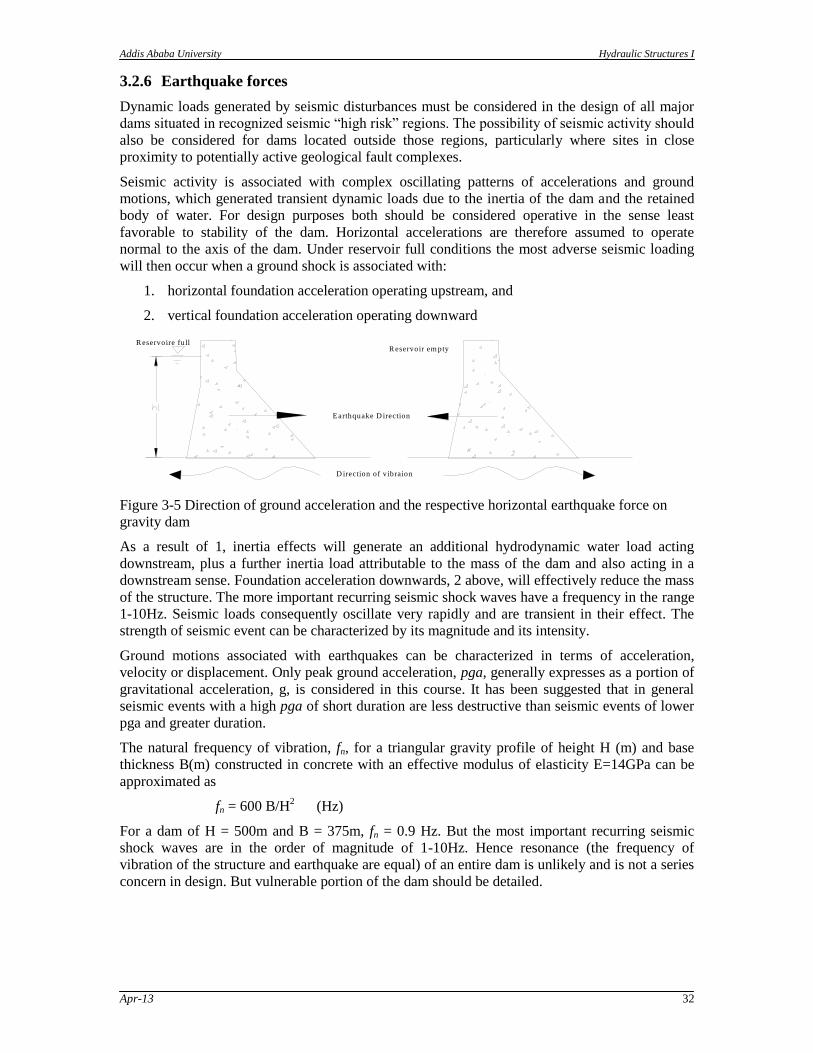
Addis Ababa University Hydraulic Structures I
Apr-13 32
3.2.6 Earthquake forces
Dynamic loads generated by seismic disturbances must be considered in the design of all major
dams situated in recognized seismic “high risk” regions. The possibility of seismic activity should
also be considered for dams located outside those regions, particularly where sites in close
proximity to potentially active geological fault complexes.
Seismic activity is associated with complex oscillating patterns of accelerations and ground
motions, which generated transient dynamic loads due to the inertia of the dam and the retained
body of water. For design purposes both should be considered operative in the sense least
favorable to stability of the dam. Horizontal accelerations are therefore assumed to operate
normal to the axis of the dam. Under reservoir full conditions the most adverse seismic loading
will then occur when a ground shock is associated with:
1. horizontal foundation acceleration operating upstream, and
2. vertical foundation acceleration operating downward
R eservoir em ptyR eservoire full
D irection of vibraion
Earthquake D irection
Figure 3-5 Direction of ground acceleration and the respective horizontal earthquake force on
gravity dam
As a result of 1, inertia effects will generate an additional hydrodynamic water load acting
downstream, plus a further inertia load attributable to the mass of the dam and also acting in a
downstream sense. Foundation acceleration downwards, 2 above, will effectively reduce the mass
of the structure. The more important recurring seismic shock waves have a frequency in the range
1-10Hz. Seismic loads consequently oscillate very rapidly and are transient in their effect. The
strength of seismic event can be characterized by its magnitude and its intensity.
Ground motions associated with earthquakes can be characterized in terms of acceleration,
velocity or displacement. Only peak ground acceleration, pga, generally expresses as a portion of
gravitational acceleration, g, is considered in this course. It has been suggested that in general
seismic events with a high pga of short duration are less destructive than seismic events of lower
pga and greater duration.
The natural frequency of vibration, fn, for a triangular gravity profile of height H (m) and base
thickness B(m) constructed in concrete with an effective modulus of elasticity E=14GPa can be
approximated as
fn = 600 B/H2 (Hz)
For a dam of H = 500m and B = 375m, fn = 0.9 Hz. But the most important recurring seismic
shock waves are in the order of magnitude of 1-10Hz. Hence resonance (the frequency of
vibration of the structure and earthquake are equal) of an entire dam is unlikely and is not a series
concern in design. But vulnerable portion of the dam should be detailed.
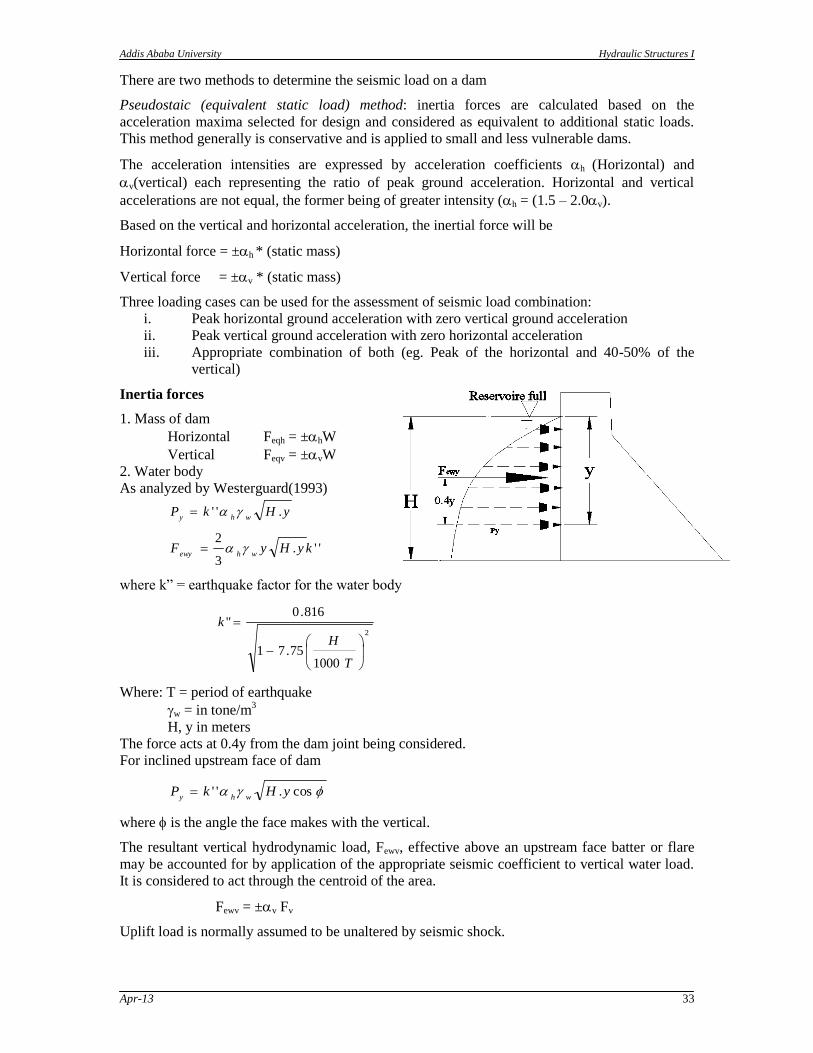
Addis Ababa University Hydraulic Structures I
Apr-13 33
There are two methods to determine the seismic load on a dam
Pseudostaic (equivalent static load) method: inertia forces are calculated based on the
acceleration maxima selected for design and considered as equivalent to additional static loads.
This method generally is conservative and is applied to small and less vulnerable dams.
The acceleration intensities are expressed by acceleration coefficients h (Horizontal) and
v(vertical) each representing the ratio of peak ground acceleration. Horizontal and vertical
accelerations are not equal, the former being of greater intensity (h = (1.5 – 2.0v).
Based on the vertical and horizontal acceleration, the inertial force will be
Horizontal force = ±h * (static mass)
Vertical force = ±v * (static mass)
Three loading cases can be used for the assessment of seismic load combination:
i. Peak horizontal ground acceleration with zero vertical ground acceleration
ii. Peak vertical ground acceleration with zero horizontal acceleration
iii. Appropriate combination of both (eg. Peak of the horizontal and 40-50% of the
vertical)
Inertia forces
1. Mass of dam
Horizontal Feqh = ±hW
Vertical Feqv = ±vW
2. Water body
As analyzed by Westerguard(1993)
''.3
2
.''
kyHyF
yHkP
whewy
why
where k” = earthquake factor for the water body
2
100075.71
816.0"
T
H
k
Where: T = period of earthquake
w = in tone/m3
H, y in meters
The force acts at 0.4y from the dam joint being considered.
For inclined upstream face of dam
cos.'' yHkPwhy
where is the angle the face makes with the vertical.
The resultant vertical hydrodynamic load, Fewv, effective above an upstream face batter or flare
may be accounted for by application of the appropriate seismic coefficient to vertical water load.
It is considered to act through the centroid of the area.
Fewv = ±v Fv
Uplift load is normally assumed to be unaltered by seismic shock.
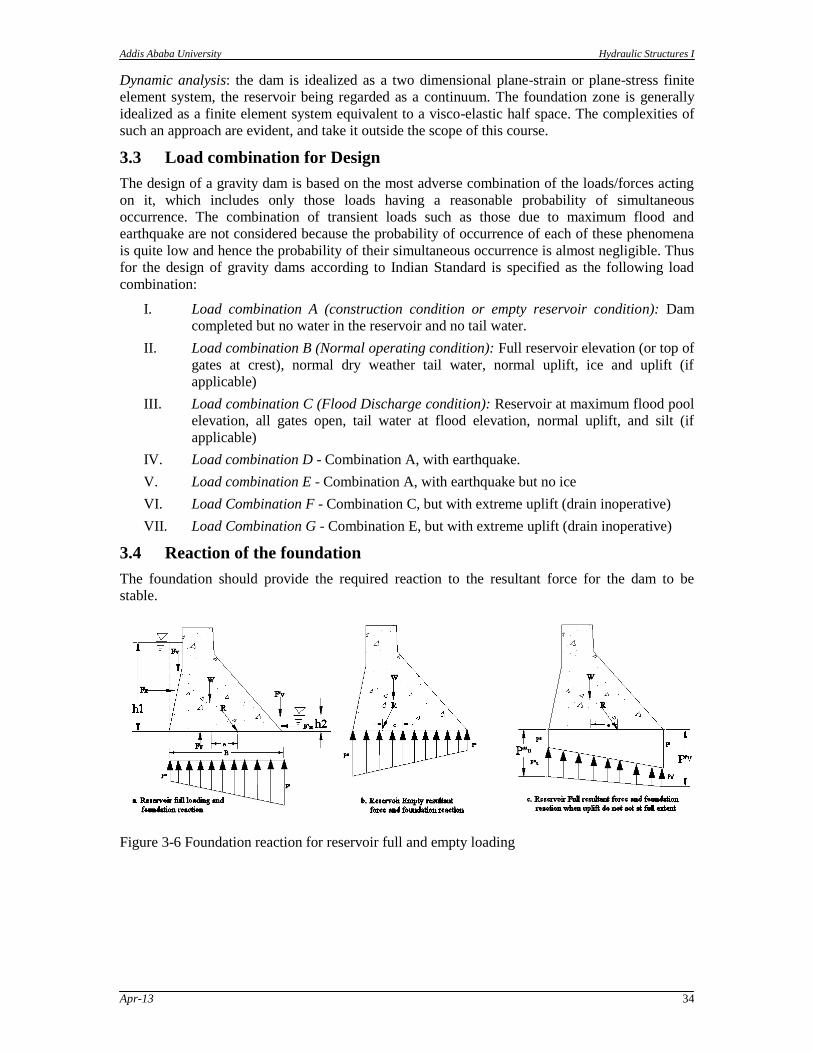
Addis Ababa University Hydraulic Structures I
Apr-13 34
Dynamic analysis: the dam is idealized as a two dimensional plane-strain or plane-stress finite
element system, the reservoir being regarded as a continuum. The foundation zone is generally
idealized as a finite element system equivalent to a visco-elastic half space. The complexities of
such an approach are evident, and take it outside the scope of this course.
3.3 Load combination for Design
The design of a gravity dam is based on the most adverse combination of the loads/forces acting
on it, which includes only those loads having a reasonable probability of simultaneous
occurrence. The combination of transient loads such as those due to maximum flood and
earthquake are not considered because the probability of occurrence of each of these phenomena
is quite low and hence the probability of their simultaneous occurrence is almost negligible. Thus
for the design of gravity dams according to Indian Standard is specified as the following load
combination:
I. Load combination A (construction condition or empty reservoir condition): Dam
completed but no water in the reservoir and no tail water.
II. Load combination B (Normal operating condition): Full reservoir elevation (or top of
gates at crest), normal dry weather tail water, normal uplift, ice and uplift (if
applicable)
III. Load combination C (Flood Discharge condition): Reservoir at maximum flood pool
elevation, all gates open, tail water at flood elevation, normal uplift, and silt (if
applicable)
IV. Load combination D - Combination A, with earthquake.
V. Load combination E - Combination A, with earthquake but no ice
VI. Load Combination F - Combination C, but with extreme uplift (drain inoperative)
VII. Load Combination G - Combination E, but with extreme uplift (drain inoperative)
3.4 Reaction of the foundation
The foundation should provide the required reaction to the resultant force for the dam to be
stable.
Figure 3-6 Foundation reaction for reservoir full and empty loading
Addis Ababa University Hydraulic Structures I
Apr-13 35
For full reservoir
B
e
B
W
B
eW
B
W
I
Mc
A
WPP
61
.6
",'
2
For empty reservoir
B
e
B
WPP
61",'
where: B = Width of the base of the dam section
e = eccentricity
W = Sum of vertical forces including uplift
W
MMe
HCGVCG
Requirements for stability
A masonry of plain concrete dam must be free from tensile stress, i.e. neither P’ nor P” shall be
negative, or
e ≤ B/6 (law of the middle third)
To limit compressive stress with in the dam body use:
P‟, P” if uplift always acts to the fullest extent.
P‟v , P”v if uplift does not act always.
Horizontal forces must be resisted both by shear and friction in the dam joint or in the foundation.
3.5 Rules Governing the Design of Gravity Dams
The following are basic assumptions that should be considered relative to the design of
important masonry/concrete dams.
1. The rock that constitutes the foundation and abutments at the site is strong enough to
carry the forces imposed by the dam with stresses well below the elastic limit at all places
along the contact planes.
2. The bearing power of the geologic structure along the foundation and abutments is great
enough to carry the total loads imposed by the dam without rock movements of
detrimental magnitude.
3. The rock formations are homogeneous and uniformly elastic in all directions, so that their
deformations may be predicted satisfactorily by calculations based on the theory of
elasticity, by laboratory measurements on models constructed of elastic materials, or by
combinations of both methods.
4. The flow of the foundation rock under the sustained loads that result from the
construction of the dam and the filling of the reservoir may be adequately allowed for by
using a somewhat lower modulus of elasticity than would otherwise be adopted for use in
the technical analyses.
5. The base of the dam is thoroughly keyed into the rock formations along the foundations
and abutments.
6. Construction operations are conducted so as to secure a satisfactory bond between the
concrete and rock materials at all areas of contact along the foundation and abutments.
7. The concrete in the dam is homogeneous in all parts of the structure.
8. The concrete is uniformly elastic in all parts of the structure, so that deformations due to
applied loads may be calculated by formulae derived on the basis of the theory of
Addis Ababa University Hydraulic Structures I
Apr-13 36
elasticity or may be estimated from laboratory measurements on models constructed of
elastic materials.
9. Effects of flow of concrete may be adequately allowed for by using a somewhat lower
modulus of elasticity under sustained loads than would otherwise be adopted for use in
technical analyses.
10. Contraction joints are properly grouted under adequate pressures, or open slots are
properly filled with concrete, so that the dam may be considered to act as a monolith.
11. Sufficient drains are installed in the dam to reduce such uplift pressures as may develop
along areas of contact between the concrete and rock materials.
12. Effects of increases in horizontal pressures caused by silt contents of flood waters usually
may be ignored in designing high storage dams, but may require consideration in
designing relatively low diversion structures.
13. Uplift forces adequate for analyzing conditions at the base of the dam are adequate for
analyzing conditions at horizontal concrete cross sections above the base.
14. Internal stresses caused by natural shrinkage and by artificial cooling operations may be
adequately controlled by proper spacing of contraction joints.
15. Internal stresses caused by increases in concrete temperature after grouting are beneficial.
16. Maximum pressures used in contraction joint grouting operations should be limited to
such values as may be shown to the safe by appropriate stress analyses.
17. No section of the Ethiopia may be assumed to be entirely free from the occurrence of
earthquake shocks.
18. Assumptions of maximum earthquake accelerations equal to one tenth of gravity are
adequate for the design of important masonry dams without including additional
allowances for resonance effects.
19. Vertical as well as horizontal accelerations should be considered, especially in designing
gravity dams.
20. During the occurrence of temporary abnormal loads, such as those produced by
earthquake shocks, some increases in stress magnitudes and some encroachments on
usual factors of safety are permissible.
21. Effects of foundation and abutment deformations should be included in the technical
analyses.
22. In monolithic straight gravity dams, some proportions of the loads may be carried by
twist action and beam action at locations along the sloping abutments, as well as by the
more usually considered gravity action.
23. Detrimental effects of twist and beam action in straight gravity dams, such as cracking
caused by the development of tension stresses, may be prevented by suitable construction
procedure.
24. In monolithic curved gravity and arch dams, some proportions of the loads may be
carried by tangential shear and twist effects, as well as by the more usually considered
arch and cantilever actions.
25. The distribution of loads in masonry dams may be determined by bringing the calculated
deflections of the different systems of load transference into agreement at all conjugate
points in the structure.
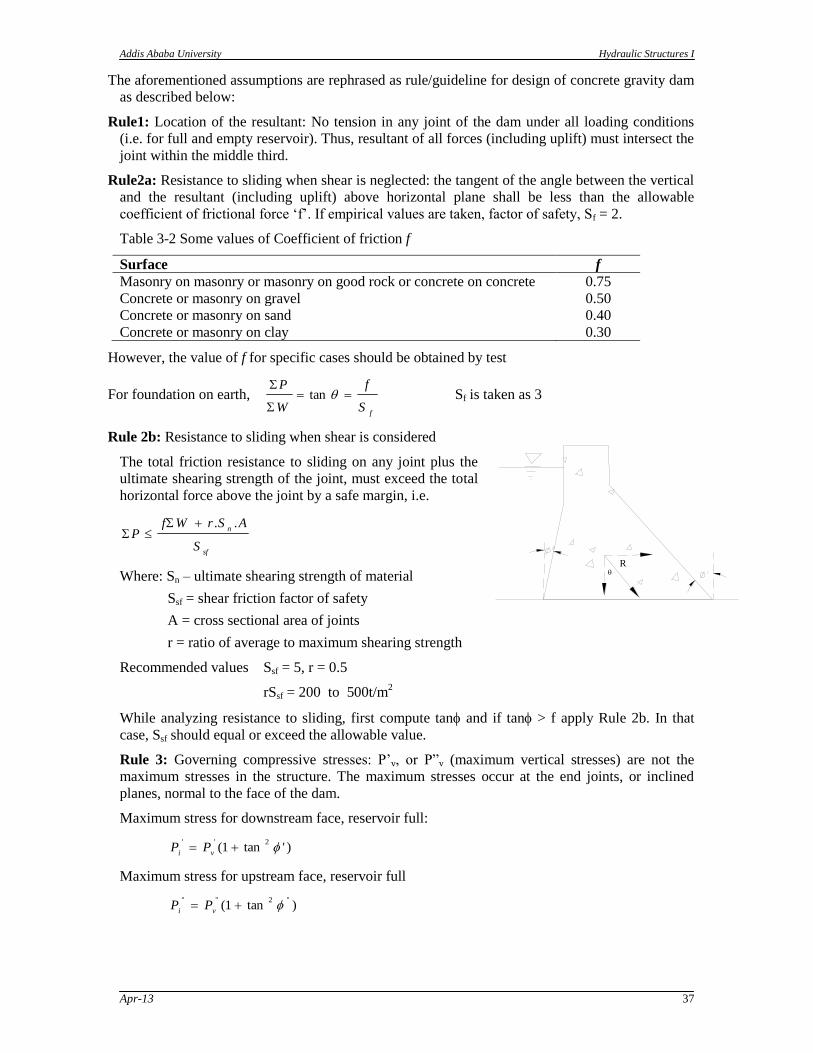
Addis Ababa University Hydraulic Structures I
Apr-13 37
The aforementioned assumptions are rephrased as rule/guideline for design of concrete gravity dam
as described below:
Rule1: Location of the resultant: No tension in any joint of the dam under all loading conditions
(i.e. for full and empty reservoir). Thus, resultant of all forces (including uplift) must intersect the
joint within the middle third.
Rule2a: Resistance to sliding when shear is neglected: the tangent of the angle between the vertical
and the resultant (including uplift) above horizontal plane shall be less than the allowable
coefficient of frictional force „f‟. If empirical values are taken, factor of safety, Sf = 2.
Table 3-2 Some values of Coefficient of friction f
Surface f
Masonry on masonry or masonry on good rock or concrete on concrete 0.75
Concrete or masonry on gravel 0.50
Concrete or masonry on sand 0.40
Concrete or masonry on clay 0.30
However, the value of f for specific cases should be obtained by test
For foundation on earth, f
S
f
W
P
tan Sf is taken as 3
Rule 2b: Resistance to sliding when shear is considered
The total friction resistance to sliding on any joint plus the
ultimate shearing strength of the joint, must exceed the total
horizontal force above the joint by a safe margin, i.e.
sf
n
S
ASrWfP
..
Where: Sn – ultimate shearing strength of material
Ssf = shear friction factor of safety
A = cross sectional area of joints
r = ratio of average to maximum shearing strength
Recommended values Ssf = 5, r = 0.5
rSsf = 200 to 500t/m2
While analyzing resistance to sliding, first compute tan and if tan > f apply Rule 2b. In that
case, Ssf should equal or exceed the allowable value.
Rule 3: Governing compressive stresses: P‟v, or P”v (maximum vertical stresses) are not the
maximum stresses in the structure. The maximum stresses occur at the end joints, or inclined
planes, normal to the face of the dam.
Maximum stress for downstream face, reservoir full:
)'tan1(2''
viPP
Maximum stress for upstream face, reservoir full
)tan1("2""
vi
PP
R
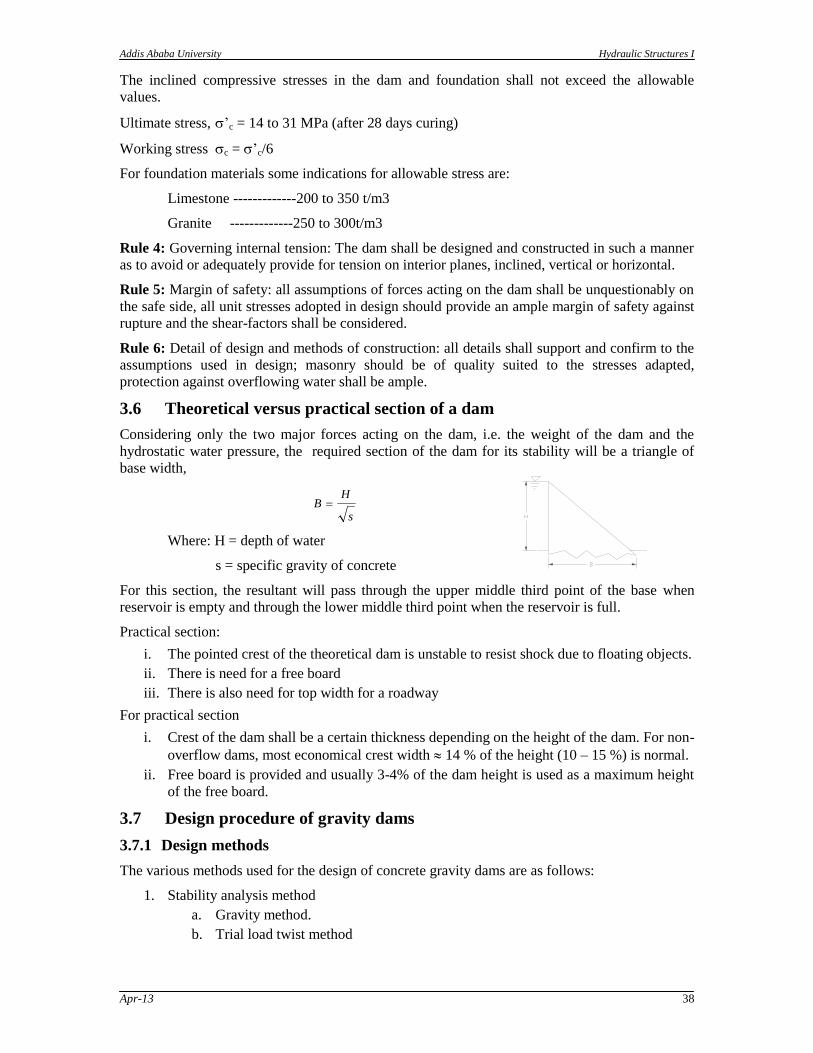
Addis Ababa University Hydraulic Structures I
Apr-13 38
The inclined compressive stresses in the dam and foundation shall not exceed the allowable
values.
Ultimate stress, ‟c = 14 to 31 MPa (after 28 days curing)
Working stress c = ‟c/6
For foundation materials some indications for allowable stress are:
Limestone -------------200 to 350 t/m3
Granite -------------250 to 300t/m3
Rule 4: Governing internal tension: The dam shall be designed and constructed in such a manner
as to avoid or adequately provide for tension on interior planes, inclined, vertical or horizontal.
Rule 5: Margin of safety: all assumptions of forces acting on the dam shall be unquestionably on
the safe side, all unit stresses adopted in design should provide an ample margin of safety against
rupture and the shear-factors shall be considered.
Rule 6: Detail of design and methods of construction: all details shall support and confirm to the
assumptions used in design; masonry should be of quality suited to the stresses adapted,
protection against overflowing water shall be ample.
3.6 Theoretical versus practical section of a dam
Considering only the two major forces acting on the dam, i.e. the weight of the dam and the
hydrostatic water pressure, the required section of the dam for its stability will be a triangle of
base width,
s
HB
Where: H = depth of water
s = specific gravity of concrete
For this section, the resultant will pass through the upper middle third point of the base when
reservoir is empty and through the lower middle third point when the reservoir is full.
Practical section:
i. The pointed crest of the theoretical dam is unstable to resist shock due to floating objects.
ii. There is need for a free board
iii. There is also need for top width for a roadway
For practical section
i. Crest of the dam shall be a certain thickness depending on the height of the dam. For non-
overflow dams, most economical crest width 14 % of the height (10 – 15 %) is normal.
ii. Free board is provided and usually 3-4% of the dam height is used as a maximum height
of the free board.
3.7 Design procedure of gravity dams
3.7.1 Design methods
The various methods used for the design of concrete gravity dams are as follows:
1. Stability analysis method
a. Gravity method.
b. Trial load twist method
Addis Ababa University Hydraulic Structures I
Apr-13 39
i. Joints keyed but not grouted
ii. Joints keyed and grouted
c. Experimental method
i. Direct method
ii. Indirect method
d. Slab analogy method
e. Lattice analogy method
f. Finite element method
2. Zoned (multiple-step) method of determining profile of dam
3. Single step method
Two procedures of design will be discussed in this course: – multiple-step method and single-step
method.
3.7.2 Multiple step method of determining profile of gravity dam
This method deals with designing the dam joint by joint (block by block) beginning at the top and
making each joint confirm to all gravity dam design requirements. The procedure results in a dam
with polygonal face that may be smoothened up for appearance with no appreciable change in
stability or economy. The multiple-step method is almost always used for the final design of dams
with a height that does not encroach greatly on Zone V.
Zoning of high non-overflow dams
A high gravity dam may be divided into seven zones according to design and stability
requirements. The characteristics and limits of these zones are described below.
Zone I: is a rectangular section from the top of the dam to the water surface. The resultant force
passes through the mid-point of the base.
Zone II: is also a rectangular section and extends to a depth where the resultant in the reservoir
full condition reaches the outer middle third point of the base.
Zone III: upstream face of the dam is vertical but the downstream face is gradually inclined so
that the resultant in the reservoir full condition has exactly at the outer middle third point of the
base. This zone extends to a depth where the resultant in the reservoir empty condition reaches
the inner middle third point of the base.
Zone IV: in this zone both the upstream and downstream faces are inclined so that the resultant
both in the reservoir full and empty conditions lie at the middle third point. The zone extends to a
point where maximum permissible compressive stress is reached at the toe of the dam.
Zone V: the slope of the downstream face is further increased to keep the principal stresses within
permissible limits. Resultant in the reservoir full condition is kept well within the middle third
section. The resultant in the reservoir empty condition follows the upper middle third section.
This zone extends to a depth where the stress at the heel of the section reaches the permissible
limits in the reservoir empty case.
Zone VI: the slope of the upstream face is rapidly increased so as to keep the principal stress at
the heel with in the permissible limits in the reservoir empty condition. The inclination of the
downstream face should also be adjusted so that the principal stress at the toe does not exceed the
maximum allowable stress. The resultants in both reservoir empty and full conditions lie within
the middle third section. This zone extends to a point where the slope of the downstream face
reaches 1:1. This normally happens when the dam is 80 to 90 meters high.
Zone VII: in this zone the inclination of both upstream and downstream faces increase with the
height of the dam. Consequently, at some plane the value of (1 + tan2) may become so great
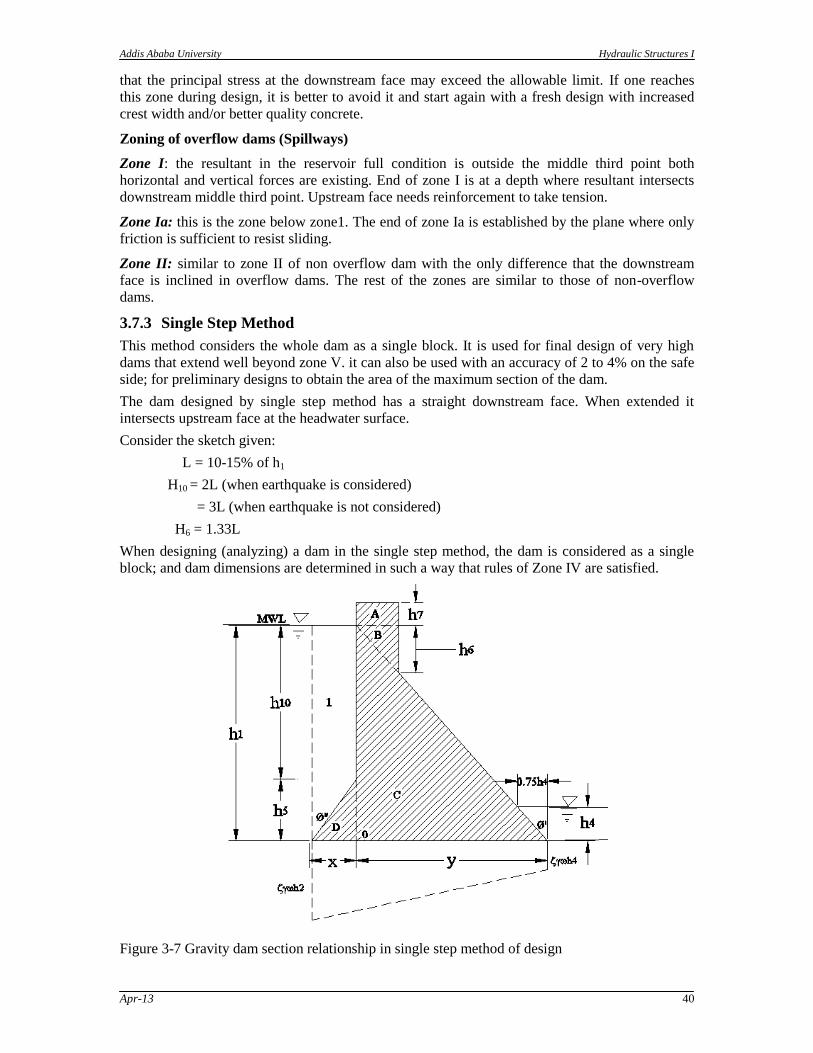
Addis Ababa University Hydraulic Structures I
Apr-13 40
that the principal stress at the downstream face may exceed the allowable limit. If one reaches
this zone during design, it is better to avoid it and start again with a fresh design with increased
crest width and/or better quality concrete.
Zoning of overflow dams (Spillways)
Zone I: the resultant in the reservoir full condition is outside the middle third point both
horizontal and vertical forces are existing. End of zone I is at a depth where resultant intersects
downstream middle third point. Upstream face needs reinforcement to take tension.
Zone Ia: this is the zone below zone1. The end of zone Ia is established by the plane where only
friction is sufficient to resist sliding.
Zone II: similar to zone II of non overflow dam with the only difference that the downstream
face is inclined in overflow dams. The rest of the zones are similar to those of non-overflow
dams.
3.7.3 Single Step Method
This method considers the whole dam as a single block. It is used for final design of very high
dams that extend well beyond zone V. it can also be used with an accuracy of 2 to 4% on the safe
side; for preliminary designs to obtain the area of the maximum section of the dam.
The dam designed by single step method has a straight downstream face. When extended it
intersects upstream face at the headwater surface.
Consider the sketch given:
L = 10-15% of h1
H10 = 2L (when earthquake is considered)
= 3L (when earthquake is not considered)
H6 = 1.33L
When designing (analyzing) a dam in the single step method, the dam is considered as a single
block; and dam dimensions are determined in such a way that rules of Zone IV are satisfied.
Figure 3-7 Gravity dam section relationship in single step method of design

Addis Ababa University Hydraulic Structures I
Apr-13 41
Comparison of Single step and Multiple step design of gravity dam
Dams of smaller height can be designed economically by Multiple step method
High dams beyond zone IV are designed by Single step method so that convex curvature
of downstream face and excessive flat slope of upstream face are avoided
It may be economical to increase the concrete strength through the use of more expensive
material, so that even a high dam designed by dividing it into only four zones, thus
eliminating zone V and VI.
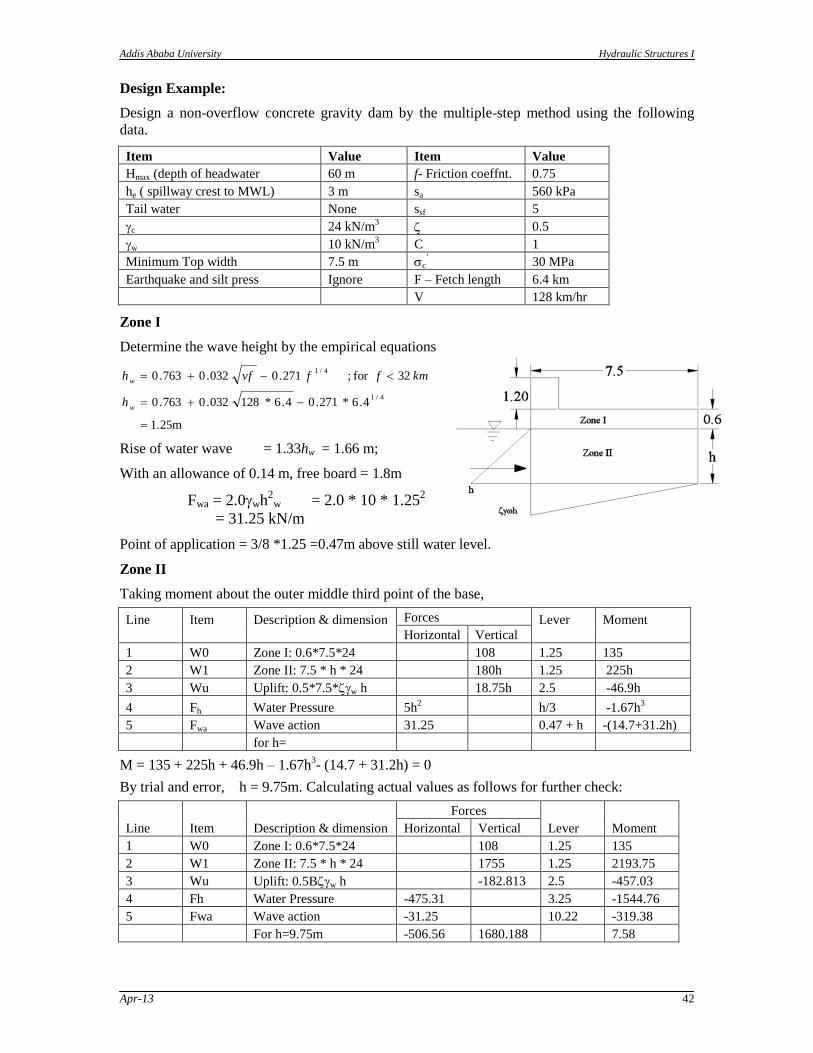
Addis Ababa University Hydraulic Structures I
Apr-13 42
Design Example:
Design a non-overflow concrete gravity dam by the multiple-step method using the following
data.
Item Value Item Value
Hmax (depth of headwater 60 m f- Friction coeffnt. 0.75
he ( spillway crest to MWL) 3 m sa 560 kPa
Tail water None ssf 5
c 24 kN/m3 0.5
w 10 kN/m3 C 1
Minimum Top width 7.5 m c‟ 30 MPa
Earthquake and silt press Ignore F – Fetch length 6.4 km
V 128 km/hr
Zone I
Determine the wave height by the empirical equations
1.25m
4.6*271.04.6*128032.0763.0
32for ; 271.0032.0763.0
4/1
4/1
w
w
h
kmffvfh
Rise of water wave = 1.33hw = 1.66 m;
With an allowance of 0.14 m, free board = 1.8m
Fwa = 2.0wh2
w = 2.0 * 10 * 1.252
= 31.25 kN/m
Point of application = 3/8 *1.25 =0.47m above still water level.
Zone II
Taking moment about the outer middle third point of the base,
Line
Item
Description & dimension
Forces Lever
Moment
Horizontal Vertical
1 W0 Zone I: 0.6*7.5*24 108 1.25 135
2 W1 Zone II: 7.5 * h * 24 180h 1.25 225h
3 Wu Uplift: 0.5*7.5*w h 18.75h 2.5 -46.9h
4 Fh Water Pressure 5h2 h/3 -1.67h
3
5 Fwa Wave action 31.25 0.47 + h -(14.7+31.2h)
for h=
M = 135 + 225h + 46.9h – 1.67h3- (14.7 + 31.2h) = 0
By trial and error, h = 9.75m. Calculating actual values as follows for further check:
Line Item Description & dimension
Forces
Lever Moment Horizontal Vertical
1 W0 Zone I: 0.6*7.5*24 108 1.25 135
2 W1 Zone II: 7.5 * h * 24 1755 1.25 2193.75
3 Wu Uplift: 0.5Bw h -182.813 2.5 -457.03
4 Fh Water Pressure -475.31 3.25 -1544.76
5 Fwa Wave action -31.25 10.22 -319.38
For h=9.75m -506.56 1680.188 7.58
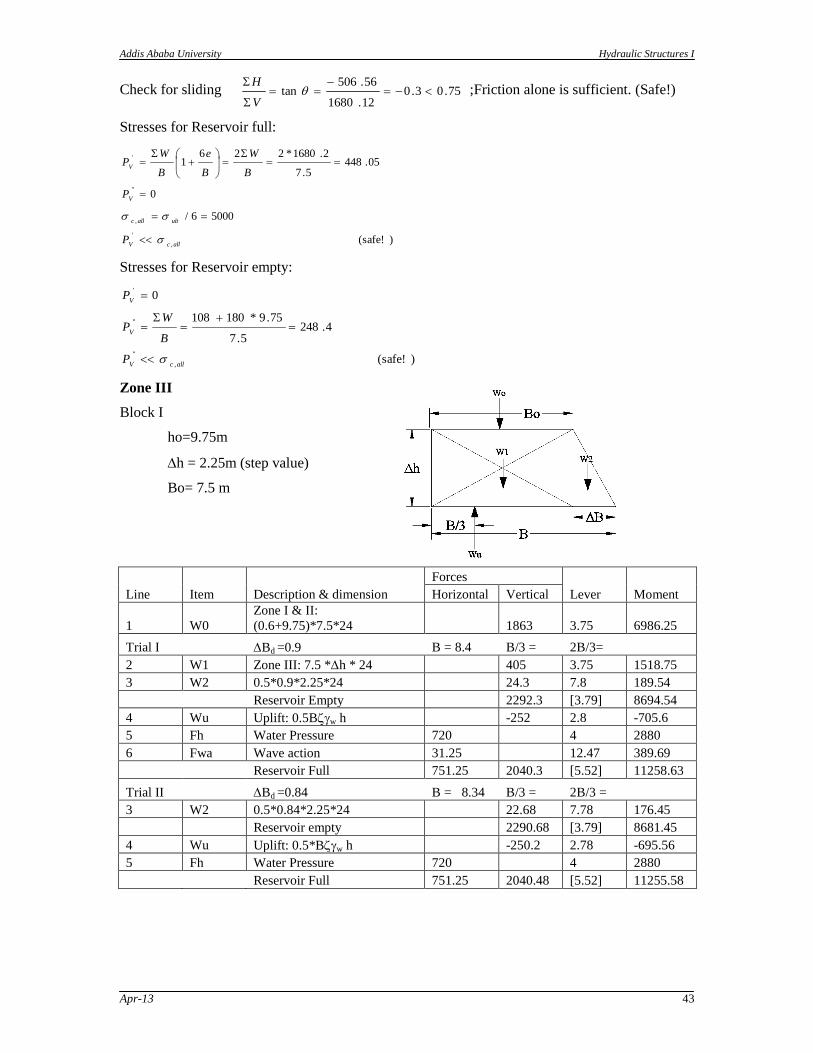
Addis Ababa University Hydraulic Structures I
Apr-13 43
Check for sliding 75.03.012.1680
56.506tan
V
H ;Friction alone is sufficient. (Safe!)
Stresses for Reservoir full:
)(safe!
50006/
0
05.4485.7
2.1680*2261
,
'
,
"
'
allcV
ultallc
V
V
P
P
B
W
B
e
B
WP
Stresses for Reservoir empty:
)(safe!
4.2485.7
75.9*180108
0
,
"
"
'
allcV
V
V
P
B
WP
P
Zone III
Block I
ho=9.75m
h = 2.25m (step value)
Bo= 7.5 m
Line Item Description & dimension
Forces
Lever Moment Horizontal Vertical
1 W0
Zone I & II:
(0.6+9.75)*7.5*24 1863 3.75 6986.25
Trial I Bd =0.9 B = 8.4 B/3 = 2B/3=
2 W1 Zone III: 7.5 *h * 24 405 3.75 1518.75
3 W2 0.5*0.9*2.25*24 24.3 7.8 189.54
Reservoir Empty 2292.3 [3.79] 8694.54
4 Wu Uplift: 0.5Bw h -252 2.8 -705.6
5 Fh Water Pressure 720 4 2880
6 Fwa Wave action 31.25 12.47 389.69
Reservoir Full 751.25 2040.3 [5.52] 11258.63
Trial II Bd =0.84 B = 8.34 B/3 = 2B/3 =
3 W2 0.5*0.84*2.25*24 22.68 7.78 176.45
Reservoir empty 2290.68 [3.79] 8681.45
4 Wu Uplift: 0.5*Bw h -250.2 2.78 -695.56
5 Fh Water Pressure 720 4 2880
Reservoir Full 751.25 2040.48 [5.52] 11255.58
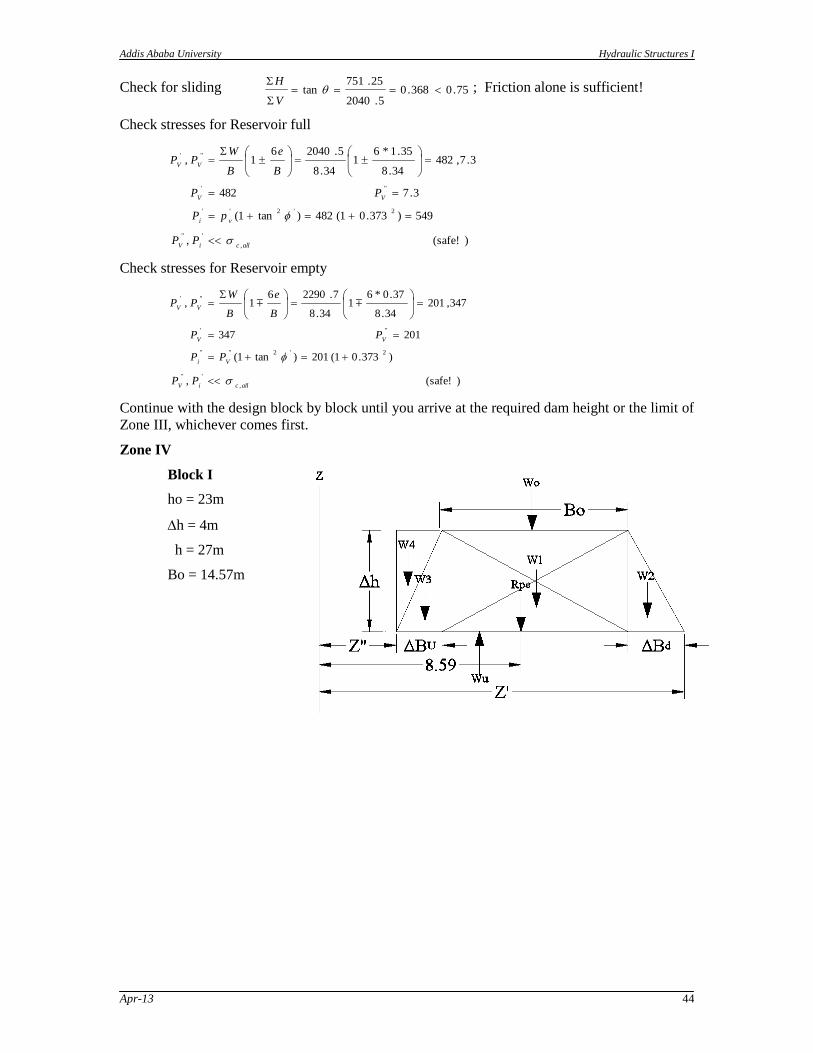
Addis Ababa University Hydraulic Structures I
Apr-13 44
Check for sliding 75.0368.05.2040
25.751tan
V
H; Friction alone is sufficient!
Check stresses for Reservoir full
)(safe! ,
549)373.01(482)tan1(
3.7 482
3.7,48234.8
35.1*61
34.8
5.204061,
,
'"
2'2''
"'
"'
allciV
vi
VV
VV
PP
pP
PP
B
e
B
WPP
Check stresses for Reservoir empty
)(safe! ,
)373.01(201)tan1(
201 347
347,20134.8
37.0*61
34.8
7.229061,
,
'"
2'2""
"'
"'
allciV
Vi
VV
VV
PP
PP
PP
B
e
B
WPP
Continue with the design block by block until you arrive at the required dam height or the limit of
Zone III, whichever comes first.
Zone IV
Block I
ho = 23m
h = 4m
h = 27m
Bo = 14.57m
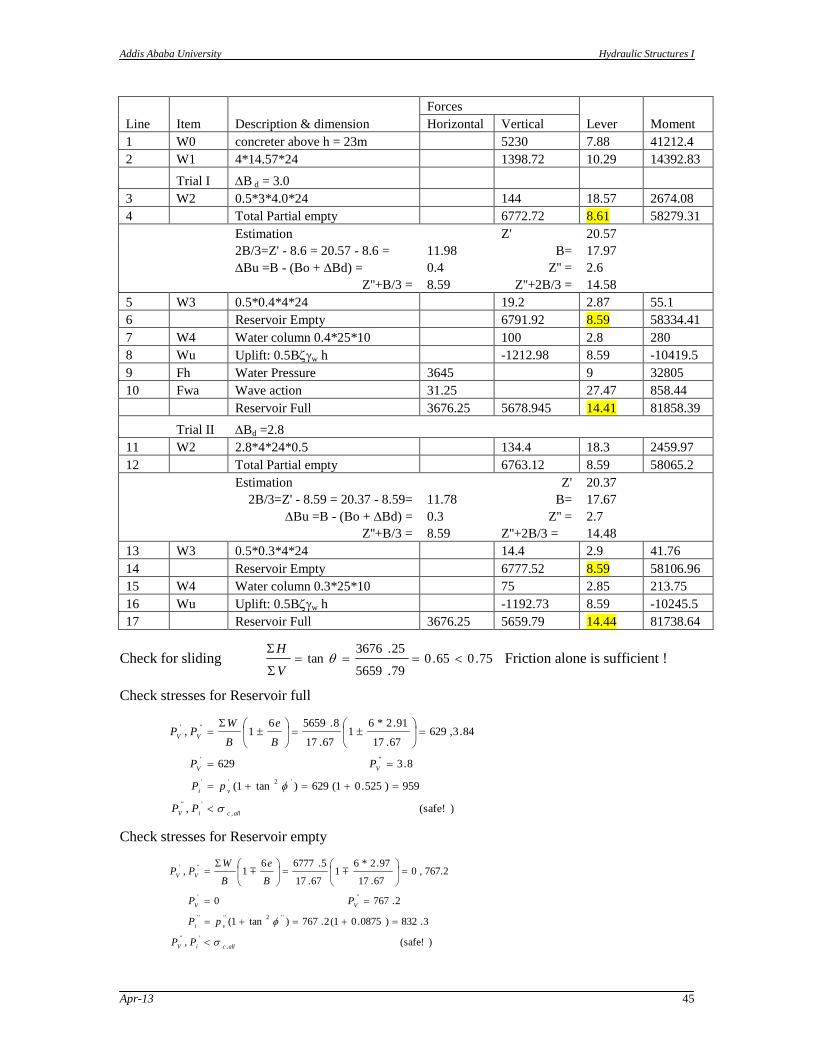
Addis Ababa University Hydraulic Structures I
Apr-13 45
Line Item Description & dimension
Forces
Lever Moment Horizontal Vertical
1 W0 concreter above h = 23m 5230 7.88 41212.4
2 W1 4*14.57*24 1398.72 10.29 14392.83
Trial I B d = 3.0
3 W2 0.5*3*4.0*24 144 18.57 2674.08
4 Total Partial empty 6772.72 8.61 58279.31
Estimation Z' 20.57
2B/3=Z' - 8.6 = 20.57 - 8.6 = 11.98 B= 17.97
Bu =B - (Bo + Bd) = 0.4 Z'' = 2.6
Z''+B/3 = 8.59 Z''+2B/3 = 14.58
5 W3 0.5*0.4*4*24 19.2 2.87 55.1
6 Reservoir Empty 6791.92 8.59 58334.41
7 W4 Water column 0.4*25*10 100 2.8 280
8 Wu Uplift: 0.5Bw h -1212.98 8.59 -10419.5
9 Fh Water Pressure 3645 9 32805
10 Fwa Wave action 31.25 27.47 858.44
Reservoir Full 3676.25 5678.945 14.41 81858.39
Trial II Bd =2.8
11 W2 2.8*4*24*0.5 134.4 18.3 2459.97
12 Total Partial empty 6763.12 8.59 58065.2
Estimation Z' 20.37
2B/3=Z' - 8.59 = 20.37 - 8.59= 11.78 B= 17.67
Bu =B - (Bo + Bd) = 0.3 Z'' = 2.7
Z''+B/3 = 8.59 Z''+2B/3 = 14.48
13 W3 0.5*0.3*4*24 14.4 2.9 41.76
14 Reservoir Empty 6777.52 8.59 58106.96
15 W4 Water column 0.3*25*10 75 2.85 213.75
16 Wu Uplift: 0.5Bw h -1192.73 8.59 -10245.5
17 Reservoir Full 3676.25 5659.79 14.44 81738.64
Check for sliding 75.065.079.5659
25.3676tan
V
H Friction alone is sufficient !
Check stresses for Reservoir full
)(safe! ,
959)525.01(629)tan1(
8.3 629
84.3,62967.17
91.2*61
67.17
8.565961,
,
'"
'2''
"'
"'
allciV
vi
VV
VV
PP
pP
PP
B
e
B
WPP
Check stresses for Reservoir empty
)(safe! ,
3.832)0875.01(2.767)tan1(
2.767 0
767.2 , 067.17
97.2*61
67.17
5.677761,
,
'"
''2''''
"'
"'
allciV
vi
VV
VV
PP
pP
PP
B
e
B
WPP
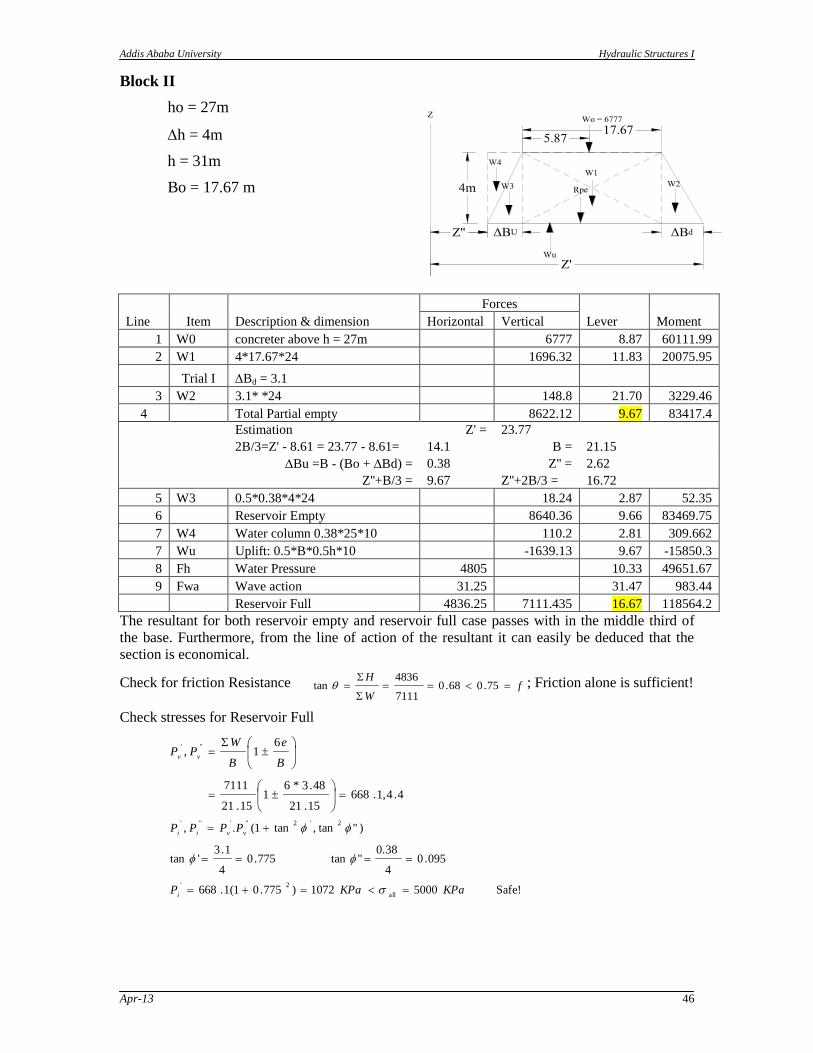
Addis Ababa University Hydraulic Structures I
Apr-13 46
Block II
ho = 27m
h = 4m
h = 31m
Bo = 17.67 m
Line Item Description & dimension
Forces
Lever Moment Horizontal Vertical
1 W0 concreter above h = 27m 6777 8.87 60111.99
2 W1 4*17.67*24 1696.32 11.83 20075.95
Trial I Bd = 3.1
3 W2 3.1* *24 148.8 21.70 3229.46
4 Total Partial empty 8622.12 9.67 83417.4
Estimation Z' = 23.77
2B/3=Z' - 8.61 = 23.77 - 8.61= 14.1 B = 21.15
Bu =B - (Bo + Bd) = 0.38 Z'' = 2.62
Z''+B/3 = 9.67 Z''+2B/3 = 16.72
5 W3 0.5*0.38*4*24 18.24 2.87 52.35
6 Reservoir Empty 8640.36 9.66 83469.75
7 W4 Water column 0.38*25*10 110.2 2.81 309.662
7 Wu Uplift: 0.5*B*0.5h*10 -1639.13 9.67 -15850.3
8 Fh Water Pressure 4805 10.33 49651.67
9 Fwa Wave action 31.25 31.47 983.44
Reservoir Full 4836.25 7111.435 16.67 118564.2
The resultant for both reservoir empty and reservoir full case passes with in the middle third of
the base. Furthermore, from the line of action of the resultant it can easily be deduced that the
section is economical.
Check for friction Resistance fW
H
75.068.0
7111
4836tan ; Friction alone is sufficient!
Check stresses for Reservoir Full
4.4,1.66815.21
48.3*61
15.21
7111
61,
"'
B
e
B
WPP
vv
Safe! 5000 1072)775.01(1.668
095.04
0.38 " tan 775.0
4
1.3'tan
)"tan,tan1(.,
all
2'
2'2"'"'
KPaKPaP
PPPP
i
vvii
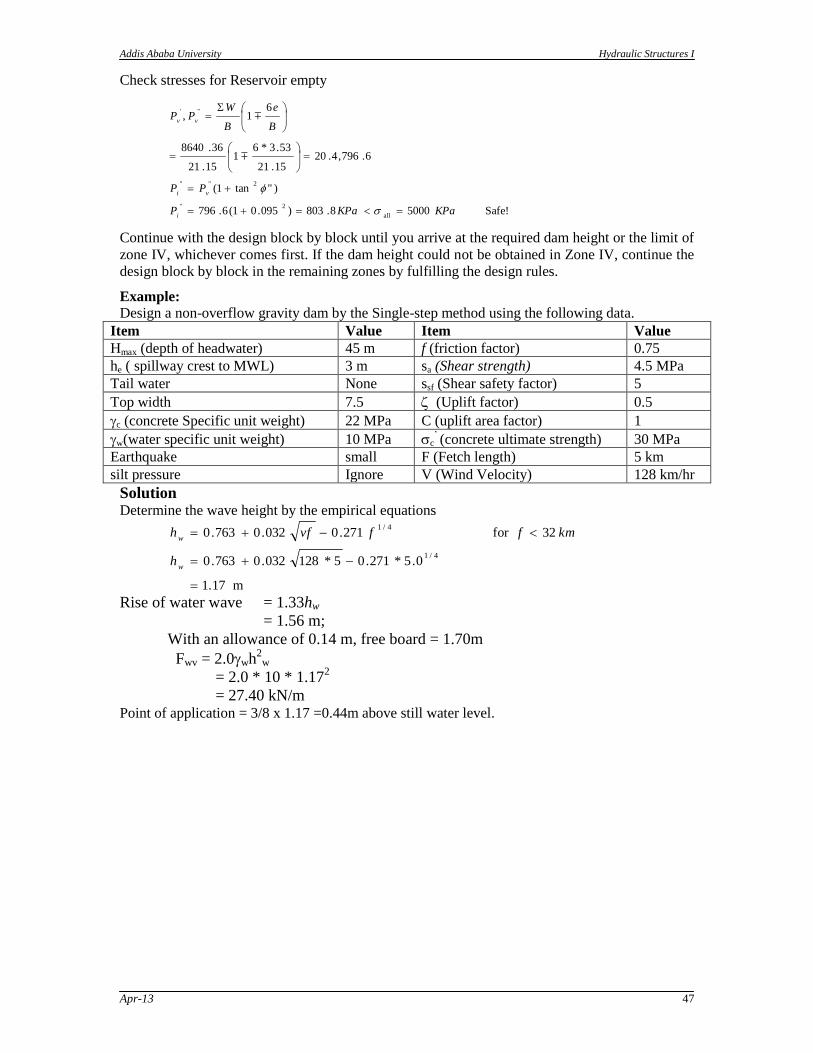
Addis Ababa University Hydraulic Structures I
Apr-13 47
Check stresses for Reservoir empty
Safe! 5000 8.803)095.01(6.796
)"tan1(
6.796,4.2015.21
53.3*61
15.21
36.8640
61,
all
2''
2"''
"'
KPaKPaP
PP
B
e
B
WPP
i
vi
vv
Continue with the design block by block until you arrive at the required dam height or the limit of
zone IV, whichever comes first. If the dam height could not be obtained in Zone IV, continue the
design block by block in the remaining zones by fulfilling the design rules.
Example:
Design a non-overflow gravity dam by the Single-step method using the following data.
Item Value Item Value
Hmax (depth of headwater) 45 m f (friction factor) 0.75
he ( spillway crest to MWL) 3 m sa (Shear strength) 4.5 MPa
Tail water None ssf (Shear safety factor) 5
Top width 7.5 (Uplift factor) 0.5
c (concrete Specific unit weight) 22 MPa C (uplift area factor) 1
w(water specific unit weight) 10 MPa c‟ (concrete ultimate strength) 30 MPa
Earthquake small F (Fetch length) 5 km
silt pressure Ignore V (Wind Velocity) 128 km/hr
Solution Determine the wave height by the empirical equations
m 1.17
0.5*271.05*128032.0763.0
32for 271.0032.0763.0
4/1
4/1
w
w
h
kmffvfh
Rise of water wave = 1.33hw
= 1.56 m;
With an allowance of 0.14 m, free board = 1.70m
Fwv = 2.0wh2
w
= 2.0 * 10 * 1.172
= 27.40 kN/m
Point of application = 3/8 x 1.17 =0.44m above still water level.
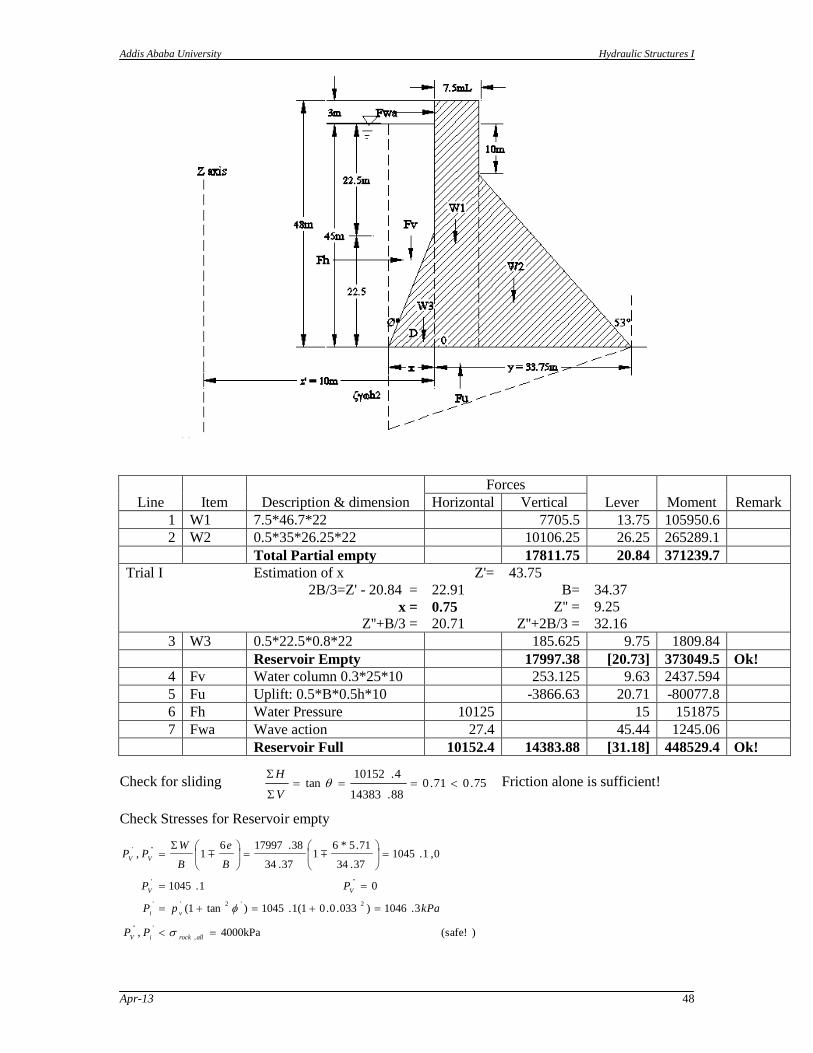
Addis Ababa University Hydraulic Structures I
Apr-13 48
Line Item Description & dimension
Forces
Lever Moment Remark Horizontal Vertical
1 W1 7.5*46.7*22 7705.5 13.75 105950.6
2 W2 0.5*35*26.25*22 10106.25 26.25 265289.1
Total Partial empty 17811.75 20.84 371239.7
Trial I Estimation of x Z'= 43.75
2B/3=Z' - 20.84 = 22.91 B= 34.37
x = 0.75 Z'' = 9.25
Z''+B/3 = 20.71 Z''+2B/3 = 32.16
3 W3 0.5*22.5*0.8*22 185.625 9.75 1809.84
Reservoir Empty 17997.38 [20.73] 373049.5 Ok!
4 Fv Water column 0.3*25*10 253.125 9.63 2437.594
5 Fu Uplift: 0.5*B*0.5h*10 -3866.63 20.71 -80077.8
6 Fh Water Pressure 10125 15 151875
7 Fwa Wave action 27.4 45.44 1245.06
Reservoir Full 10152.4 14383.88 [31.18] 448529.4 Ok!
Check for sliding 75.071.088.14383
4.10152tan
V
H Friction alone is sufficient!
Check Stresses for Reservoir empty
)(safe! 4000kPa ,
3.1046)033.0.01(1.1045)tan1(
0 1.1045
0, 1.104537.34
71.5*61
37.34
38.1799761,
,
'"
2'2''
"'
"'
allrockiV
vi
VV
VV
PP
kPapP
PP
B
e
B
WPP
Addis Ababa University Hydraulic Structures I
Apr-13 49
Check Stresses for Reservoir full
Exercises:
1. Prepare a flow chart for a computer program which could be developed to design gravity
dams by the multiple step method considering all the possible forces on the dam. The
flowchart should clearly show the main program and sub programs.
2. The non-overflow dam previously designed by the multiple step method is to be constructed
in a seismic area. Redesign the dam taking earth factor h = 0.10, period of earth quake
vibration T = 0.4sec and a top width B = 12m. Dam height, H, is 40m
3. Design the dam of the previous example of multiple-step design method by the single-step
method and compare the section obtained with the section of the multiple-step method
iii. Foundation level is at 66m below the max water level
iv. Allowable stress of foundation rock is 2Mpa
4. Design a non-overflow gravity dam by the Single-step method using the following data.
(Consider earthquake and silt pressure)
Item Value Item Value
Hmax (depth of headwater) 45 m f (friction factor) 0.75
he ( spillway crest to MWL) 3 m sa (Shear strength) 4.5 MPa
Tail water None ssf (Shear safety factor) 5
Top width 7.5 (Uplift factor) 0.5
Hs (depth of silt-water mixture) 4 m C (uplift area factor) 1
Ss(Specific gravity of silt) 1.5 c‟ (concrete ultimate strength) 30 MPa
ss(for horizontal silt water pressure) 14 kN/m2 F (Fetch length) 5 km
(earthquake factor) 0.12 V (Wind Velocity) 128 km/hr
T (period of EQ vibration) 0.80 sec c (concrete Specific unit weight) 22 MPa
w(water specific unit weight) 10 MPa
3.8 Gravity dam Construction, Quality control and the Future
3.8.1 The Construction Process
Dry construction area: Before construction can begin on any dam, the water in the streambed
must be diverted or stopped from flowing through the site. As in the case of fill dams, a
coffer-dam (a temporary structure to impound the water) must be built or the water must
be diverted into another channel or area down-stream from the dam site. For large
projects, this construction may be done several seasons before building of the dam
begins. The flow of water is closed off at the very last moment.
Foundation: The foundation area for any concrete dam must be immaculate before the first
concrete for the dam is placed. As for fill dams, this is a detailed process of excavating,
cleaning, and repairing the rock throughout the foundation "footprint" and on both
)(safe! 4000 ,
0.2092)327.11(7.757)tan1(
88.70 kPa 757.7
88.70,7.75737.34
75.4*61
37.34
88.1438361,
,
'"
2'2''
"'
"'
kPaPP
kPapP
kPaPP
B
e
B
WPP
allrockiV
vi
VV
VV
Addis Ababa University Hydraulic Structures I
Apr-13 50
abutments (the sides of the canyon that form the ends of the dam). Sites immediately
downstream of the dam for any power-plant, stilling basin, or other structure must also be
prepared.
At some sites, extensive work may be required. If the rock in the foundation or abutments
is prone to fracturing because of the load imposed by the dam and its reservoir,
earthquake activity, or the properties of the rock, it may be necessary to install extensive
systems of rock bolts or anchor bolts that are grouted into the rock through potential
fracture zones. On the abutments above the dam, systems of rock bolts and netting may
be required to keep large rock fragments from falling onto the dam. Instruments to
monitor groundwater levels, joint movement, potential seepage, slope movements, and
seismic activity are installed beginning during the early stages of foundation preparation
through completion of the dam.
A cutoff wall may be excavated deep into rock or holes may be drilled in the foundation
for the installation of reinforcing steel, called rebars, that extend up into the dam and will
be tied to the steel inside the first lifts of the dam. The idea is to build a reservoir that,
like a bowl, is equally sound around its perimeter. The water is deepest and heaviest at
the dam (when the reservoir is near capacity) so the dam and its foundation cannot be a
weak point in that perimeter.
Formwork and concrete casting: Forms made of wood or steel are constructed along the edges
of each section of the dam. Rebar is placed inside the forms and tied to any adjacent rebar
that was previously installed. The concrete is then poured or pumped in. The height of
each lift of concrete is typically only 1.5-3 m and the length and width of each dam
section to be poured as a unit is only about 15 m. Construction continues in this way as
the dam is raised section by section and lift by lift. Some major dams are built in sections
called blocks with keys or inter-locks that link adjacent blocks as well as structural steel
connections.
The process is much like constructing a building except that the dam has far less internal
space; surprisingly, however, major concrete dams have observation galleries at various
levels so the condition of the inside of the dam can be observed for seepage and
movement. Inlet and outlet tunnels or other structures also pass through concrete dams,
making them very different from fill dams that have as few structures penetrating the
mass of the dam as possible.
Early dam performance: As soon as a significant portion of the dam is built, the process of
filling the reservoir may begin. This is done in a highly controlled manner to evaluate the
stresses on the dam and observe its early performance. A temporary emergency spillway
is constructed if dam building takes more than one construction season; lengthy
construction is usually done in phases called stages, but each stage is fully complete in
itself and is an operational dam. The upstream cofferdam may be left in place as a
temporary precaution, but it is not usually designed to hold more than minimal stream
flows and rainfall and will be dismantled as soon as practical. Depending on design, some
dams are not filled until construction is essentially complete.
Appurtenances: The other structures that make the dam operational are added as soon as the
elevation of their location is reached as the dam rises. The final components are erosion
protection on the upstream (water) side of the dam (and sometimes downstream at the
bases of outlet structures), instruments along the crest (top) of the dam, and roads, side-
walks, streetlights, and retaining walls. A major dam like Hoover Dam has a full-fledged
roadway along its crest; small dams will have maintenance roads that allow single-file
access of vehicles only.
Addis Ababa University Hydraulic Structures I
Apr-13 51
Away from the dam itself, the powerhouse, instrument buildings, and even homes for
resident operators of the dam are also finished. Initial tests of all the facilities of the dam
are performed.
Completion: The final details of constructions are wrapped up as the dam is put into service. The
beginning of the dam's working life was also carefully scheduled as a design item, so that
water is available in the reservoir as soon as the supply system is ready to pump and pipe
it downstream, for example. A program of operations, routine maintenance,
rehabilitation, safety checks, instrument monitoring, and detailed observation will
continue and is mandated by law as long as the dam exists.
3.8.2 Quality Control
There is no dam construction without intensive quality control. The process of building alone
involves heavy equipment and dangerous conditions for construction workers as well as the
public. The population living downstream of the dam has to be protected over the structure itself;
the professionals who design and construct these projects should absolutely be committed to
safety, and they are monitored by local, regional, and federal agencies.
3.8.3 The Future
The future of concrete dams is the subject of much debate. Each year, over 100,000 lives are lost
in floods, and flood control is a major reason for building dams, as well as protecting estuaries
against flooding tides and improving navigation. Lives are also benefited by dams because they
provide water supplies for irrigating fields and for drinking water, and hydroelectric power is a
non-polluting source of electricity. Reservoirs are also enjoyed for recreation, tourism, and
fisheries.
However, dams are also damaging to the environment. They can change ecosystems, drown
forests and wildlife (including endangered species), change water quality and sedimentation
patterns, cause loss of agricultural lands and fertile soil, regulate river flows, spread disease (by
creating large reservoirs that are home to disease-bearing insects), and perhaps even affect
climate. There are also adverse social effects because human populations are displaced and not
satisfactorily resettled.
For years before the start of construction in 1994 of the Three Gorges Dam in China,
environmentalists the world over organized protests to try to stop this huge project. They have not
succeeded, but controversy over this project is representative of the arguments all proposed dams
will face in the future. The balance between meeting human needs for water, power, and flood
control and protecting the environment from human eradication or encroachment must be
carefully weighed.
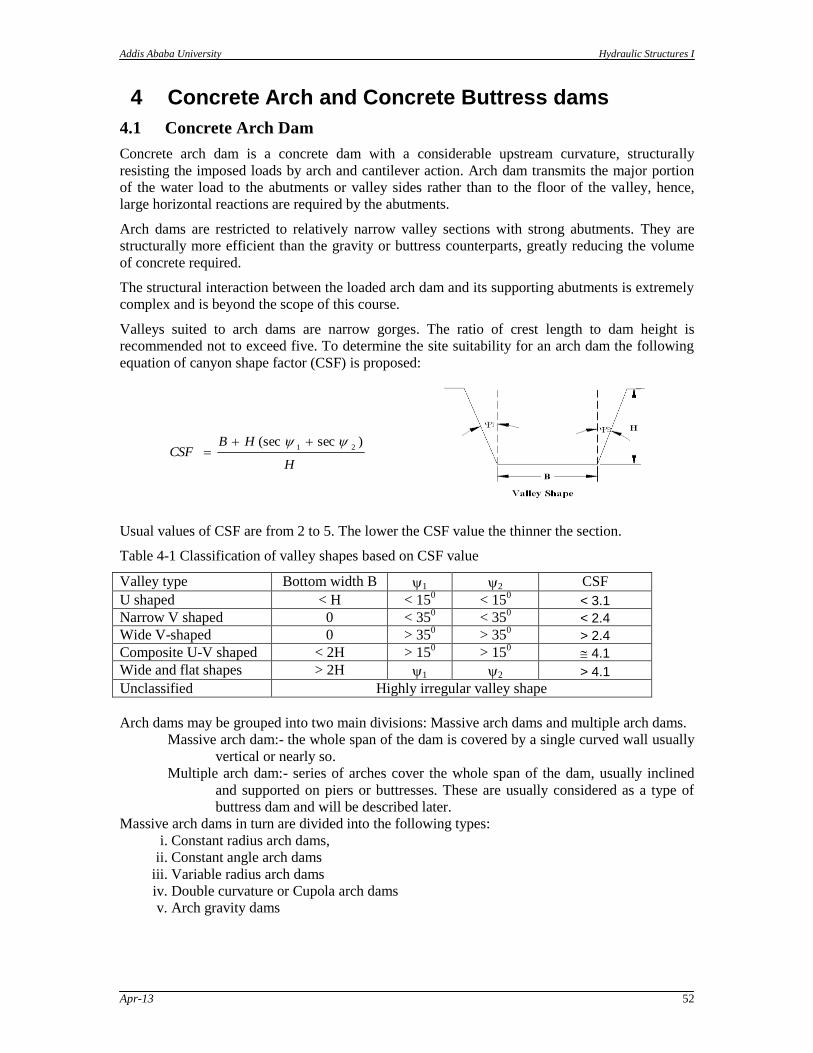
Addis Ababa University Hydraulic Structures I
Apr-13 52
4 Concrete Arch and Concrete Buttress dams
4.1 Concrete Arch Dam
Concrete arch dam is a concrete dam with a considerable upstream curvature, structurally
resisting the imposed loads by arch and cantilever action. Arch dam transmits the major portion
of the water load to the abutments or valley sides rather than to the floor of the valley, hence,
large horizontal reactions are required by the abutments.
Arch dams are restricted to relatively narrow valley sections with strong abutments. They are
structurally more efficient than the gravity or buttress counterparts, greatly reducing the volume
of concrete required.
The structural interaction between the loaded arch dam and its supporting abutments is extremely
complex and is beyond the scope of this course.
Valleys suited to arch dams are narrow gorges. The ratio of crest length to dam height is
recommended not to exceed five. To determine the site suitability for an arch dam the following
equation of canyon shape factor (CSF) is proposed:
H
HBCSF
)sec(sec21
Usual values of CSF are from 2 to 5. The lower the CSF value the thinner the section.
Table 4-1 Classification of valley shapes based on CSF value
Valley type Bottom width B 1 2 CSF
U shaped < H < 150 < 15
0 < 3.1
Narrow V shaped 0 < 350 < 35
0 < 2.4
Wide V-shaped 0 > 350 > 35
0 > 2.4
Composite U-V shaped < 2H > 150 > 15
0 4.1
Wide and flat shapes > 2H 1 2 > 4.1
Unclassified Highly irregular valley shape
Arch dams may be grouped into two main divisions: Massive arch dams and multiple arch dams.
Massive arch dam:- the whole span of the dam is covered by a single curved wall usually
vertical or nearly so.
Multiple arch dam:- series of arches cover the whole span of the dam, usually inclined
and supported on piers or buttresses. These are usually considered as a type of
buttress dam and will be described later.
Massive arch dams in turn are divided into the following types:
i. Constant radius arch dams,
ii. Constant angle arch dams
iii. Variable radius arch dams
iv. Double curvature or Cupola arch dams
v. Arch gravity dams
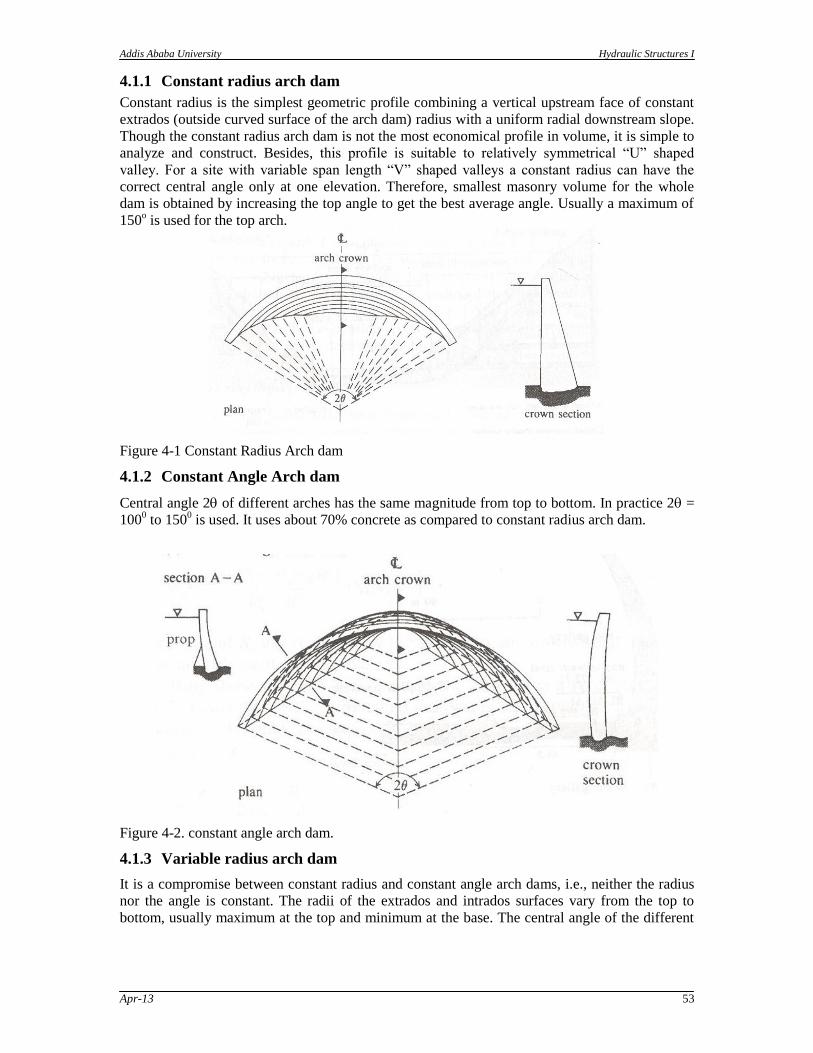
Addis Ababa University Hydraulic Structures I
Apr-13 53
4.1.1 Constant radius arch dam
Constant radius is the simplest geometric profile combining a vertical upstream face of constant
extrados (outside curved surface of the arch dam) radius with a uniform radial downstream slope.
Though the constant radius arch dam is not the most economical profile in volume, it is simple to
analyze and construct. Besides, this profile is suitable to relatively symmetrical “U” shaped
valley. For a site with variable span length “V” shaped valleys a constant radius can have the
correct central angle only at one elevation. Therefore, smallest masonry volume for the whole
dam is obtained by increasing the top angle to get the best average angle. Usually a maximum of
150o is used for the top arch.
Figure 4-1 Constant Radius Arch dam
4.1.2 Constant Angle Arch dam
Central angle 2 of different arches has the same magnitude from top to bottom. In practice 2 =
1000 to 150
0 is used. It uses about 70% concrete as compared to constant radius arch dam.
Figure 4-2. constant angle arch dam.
4.1.3 Variable radius arch dam
It is a compromise between constant radius and constant angle arch dams, i.e., neither the radius
nor the angle is constant. The radii of the extrados and intrados surfaces vary from the top to
bottom, usually maximum at the top and minimum at the base. The central angle of the different
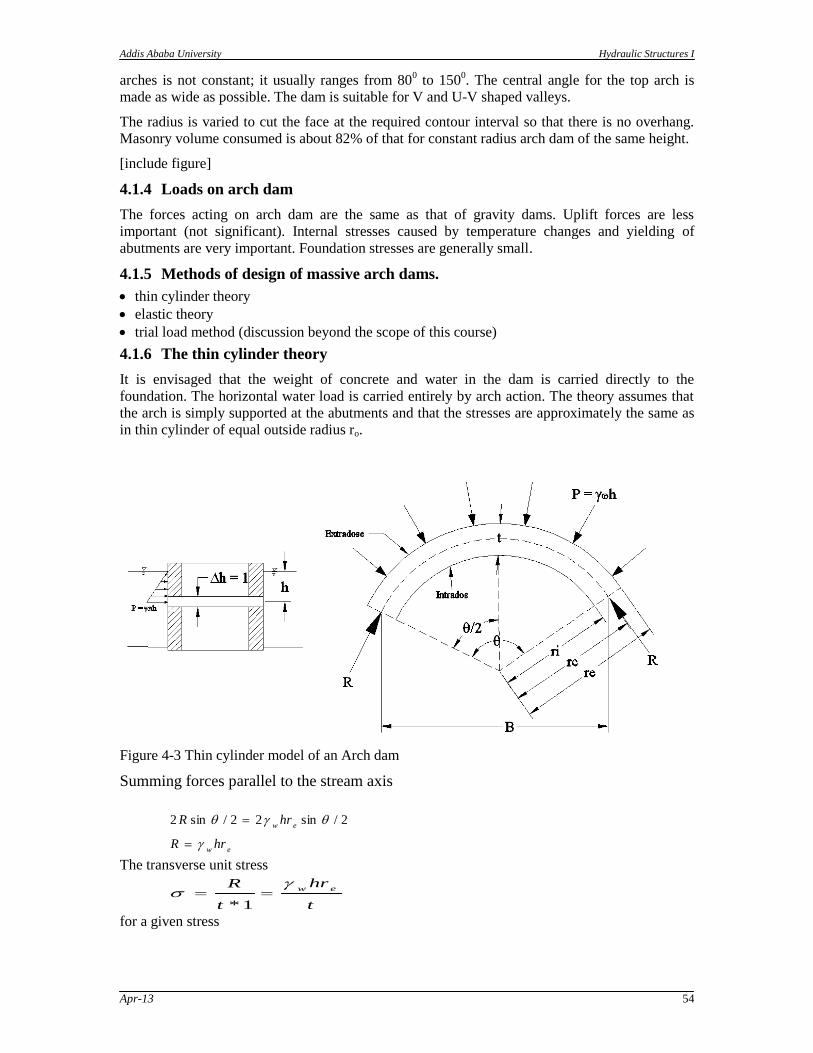
Addis Ababa University Hydraulic Structures I
Apr-13 54
arches is not constant; it usually ranges from 800 to 150
0. The central angle for the top arch is
made as wide as possible. The dam is suitable for V and U-V shaped valleys.
The radius is varied to cut the face at the required contour interval so that there is no overhang.
Masonry volume consumed is about 82% of that for constant radius arch dam of the same height.
[include figure]
4.1.4 Loads on arch dam
The forces acting on arch dam are the same as that of gravity dams. Uplift forces are less
important (not significant). Internal stresses caused by temperature changes and yielding of
abutments are very important. Foundation stresses are generally small.
4.1.5 Methods of design of massive arch dams.
thin cylinder theory
elastic theory
trial load method (discussion beyond the scope of this course)
4.1.6 The thin cylinder theory
It is envisaged that the weight of concrete and water in the dam is carried directly to the
foundation. The horizontal water load is carried entirely by arch action. The theory assumes that
the arch is simply supported at the abutments and that the stresses are approximately the same as
in thin cylinder of equal outside radius ro.
Figure 4-3 Thin cylinder model of an Arch dam
Summing forces parallel to the stream axis
ew
ew
hrR
hrR
2/sin22/sin2
The transverse unit stress
t
hr
t
Rew
1*
for a given stress
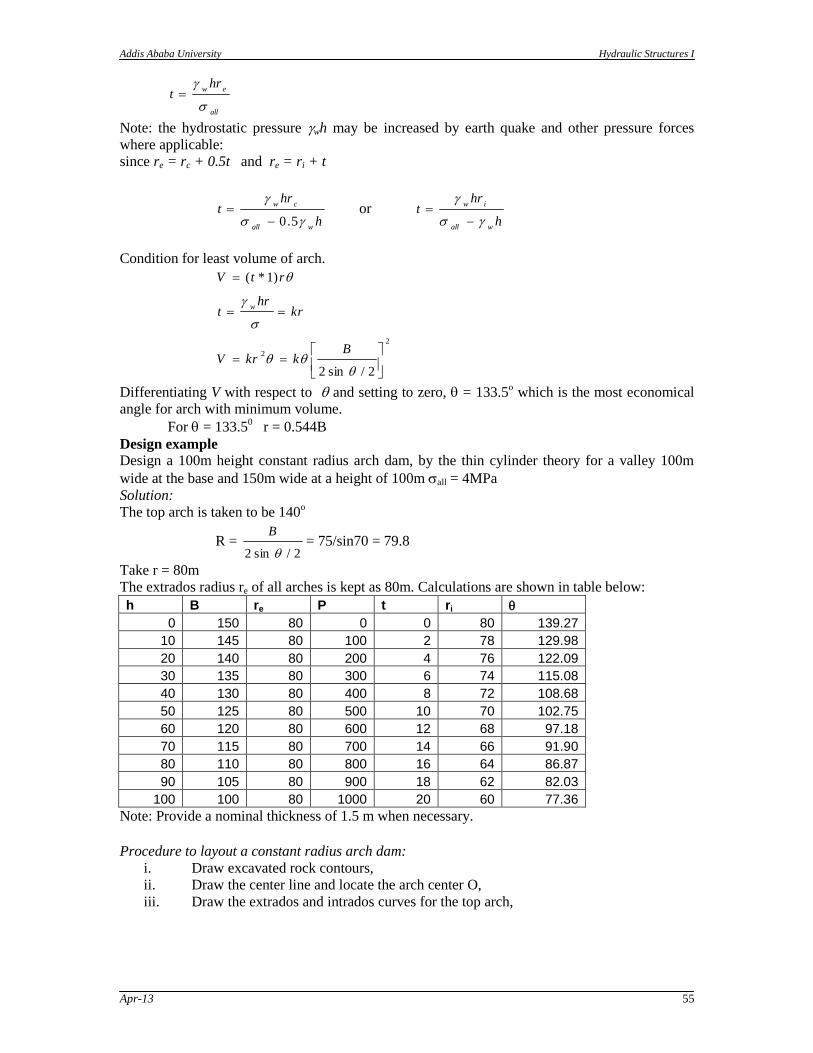
Addis Ababa University Hydraulic Structures I
Apr-13 55
all
ewhr
t
Note: the hydrostatic pressure wh may be increased by earth quake and other pressure forces
where applicable:
since re = rc + 0.5t and re = ri + t
h
hrt
wall
cw
5.0 or
h
hrt
wall
iw
Condition for least volume of arch.
2
2
2/sin2
)1*(
BkkrV
krhr
t
rtV
w
Differentiating V with respect to and setting to zero, = 133.5o which is the most economical
angle for arch with minimum volume.
For = 133.50 r = 0.544B
Design example
Design a 100m height constant radius arch dam, by the thin cylinder theory for a valley 100m
wide at the base and 150m wide at a height of 100m all = 4MPa
Solution:
The top arch is taken to be 140o
R = 2/sin2
B= 75/sin70 = 79.8
Take r = 80m
The extrados radius re of all arches is kept as 80m. Calculations are shown in table below:
h B re P t ri
0 150 80 0 0 80 139.27
10 145 80 100 2 78 129.98
20 140 80 200 4 76 122.09
30 135 80 300 6 74 115.08
40 130 80 400 8 72 108.68
50 125 80 500 10 70 102.75
60 120 80 600 12 68 97.18
70 115 80 700 14 66 91.90
80 110 80 800 16 64 86.87
90 105 80 900 18 62 82.03
100 100 80 1000 20 60 77.36
Note: Provide a nominal thickness of 1.5 m when necessary.
Procedure to layout a constant radius arch dam:
i. Draw excavated rock contours,
ii. Draw the center line and locate the arch center O,
iii. Draw the extrados and intrados curves for the top arch,
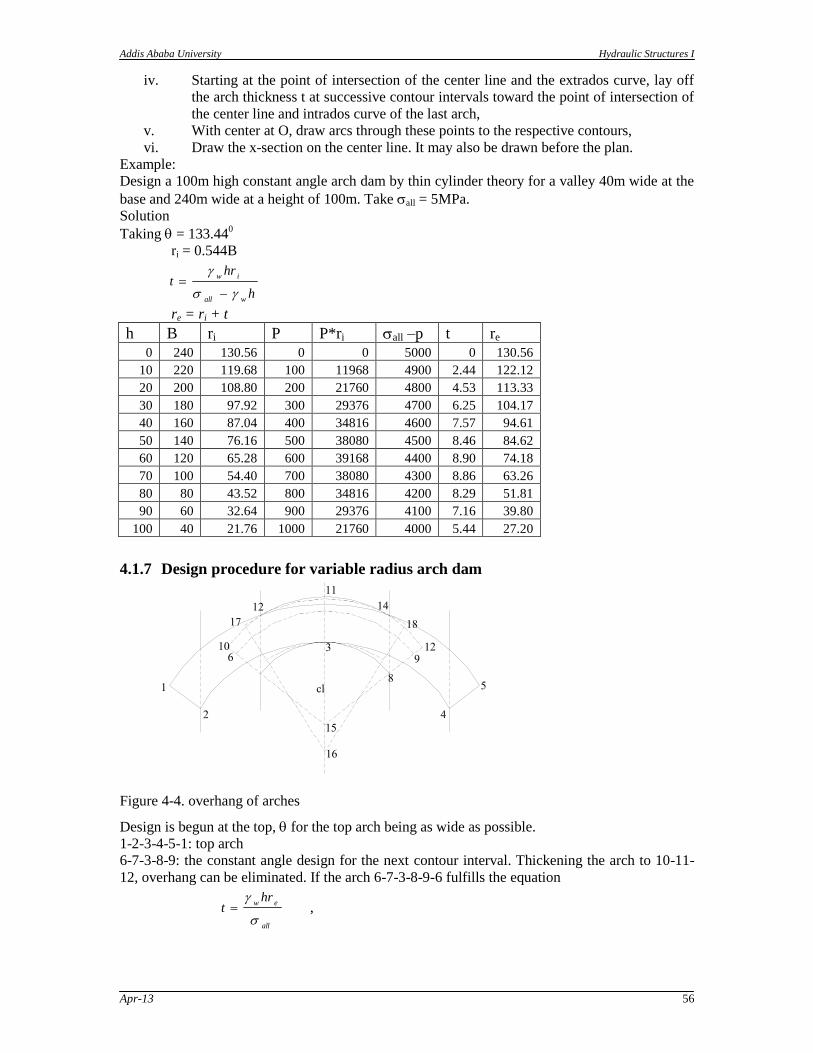
Addis Ababa University Hydraulic Structures I
Apr-13 56
iv. Starting at the point of intersection of the center line and the extrados curve, lay off
the arch thickness t at successive contour intervals toward the point of intersection of
the center line and intrados curve of the last arch,
v. With center at O, draw arcs through these points to the respective contours,
vi. Draw the x-section on the center line. It may also be drawn before the plan.
Example:
Design a 100m high constant angle arch dam by thin cylinder theory for a valley 40m wide at the
base and 240m wide at a height of 100m. Take all = 5MPa.
Solution
Taking = 133.440
ri = 0.544B
h
hrt
wall
iw
re = ri + t
h B ri P P*ri all –p t re
0 240 130.56 0 0 5000 0 130.56
10 220 119.68 100 11968 4900 2.44 122.12
20 200 108.80 200 21760 4800 4.53 113.33
30 180 97.92 300 29376 4700 6.25 104.17
40 160 87.04 400 34816 4600 7.57 94.61
50 140 76.16 500 38080 4500 8.46 84.62
60 120 65.28 600 39168 4400 8.90 74.18
70 100 54.40 700 38080 4300 8.86 63.26
80 80 43.52 800 34816 4200 8.29 51.81
90 60 32.64 900 29376 4100 7.16 39.80
100 40 21.76 1000 21760 4000 5.44 27.20
4.1.7 Design procedure for variable radius arch dam
Figure 4-4. overhang of arches
Design is begun at the top, for the top arch being as wide as possible.
1-2-3-4-5-1: top arch
6-7-3-8-9: the constant angle design for the next contour interval. Thickening the arch to 10-11-
12, overhang can be eliminated. If the arch 6-7-3-8-9-6 fulfills the equation
all
ewhr
t
,
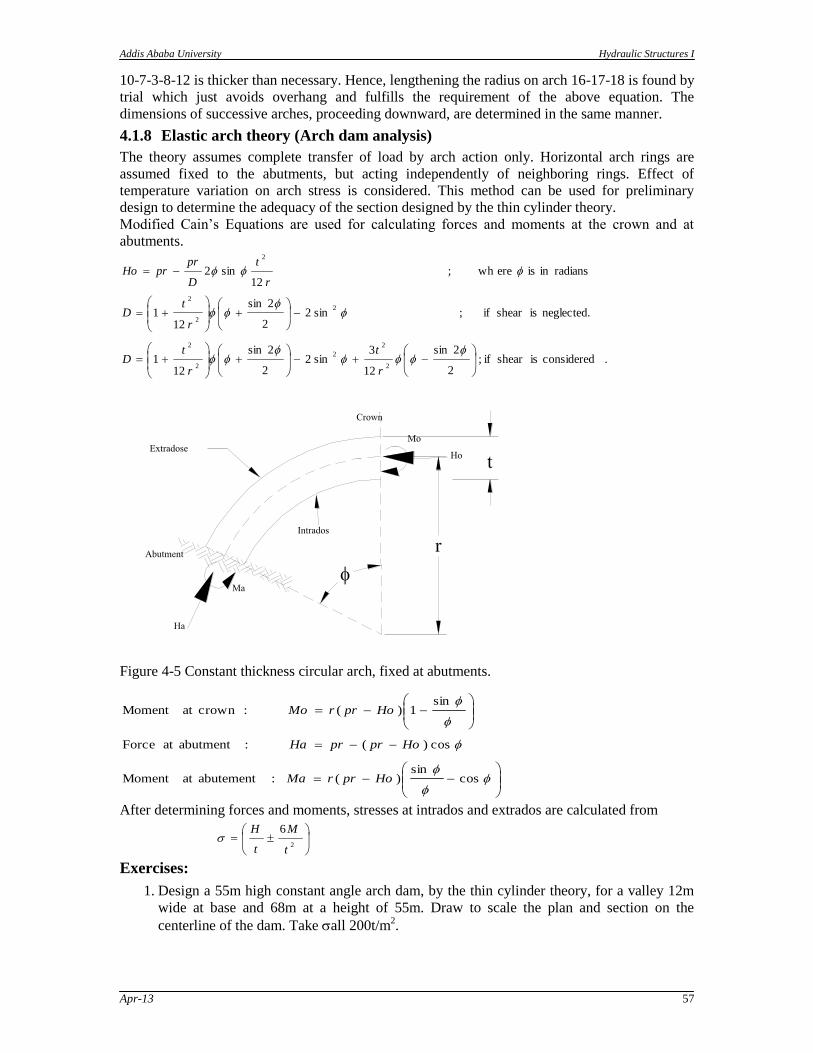
Addis Ababa University Hydraulic Structures I
Apr-13 57
10-7-3-8-12 is thicker than necessary. Hence, lengthening the radius on arch 16-17-18 is found by
trial which just avoids overhang and fulfills the requirement of the above equation. The
dimensions of successive arches, proceeding downward, are determined in the same manner.
4.1.8 Elastic arch theory (Arch dam analysis)
The theory assumes complete transfer of load by arch action only. Horizontal arch rings are
assumed fixed to the abutments, but acting independently of neighboring rings. Effect of
temperature variation on arch stress is considered. This method can be used for preliminary
design to determine the adequacy of the section designed by the thin cylinder theory.
Modified Cain‟s Equations are used for calculating forces and moments at the crown and at
abutments.
.considered isshear if; 2
2sin
12
3sin2
2
2sin
121
neglected. isshear if ; sin22
2sin
121
radiansin is ere wh; 12
sin2
2
2
2
2
2
2
2
2
2
r
t
r
tD
r
tD
r
t
D
prprHo
Figure 4-5 Constant thickness circular arch, fixed at abutments.
cossin
)( :abutementat Moment
cos)( :abutmentat Force
sin1)( :crownat Moment
HoprrMa
HoprprHa
HoprrMo
After determining forces and moments, stresses at intrados and extrados are calculated from
2
6
t
M
t
H
Exercises:
1. Design a 55m high constant angle arch dam, by the thin cylinder theory, for a valley 12m
wide at base and 68m at a height of 55m. Draw to scale the plan and section on the
centerline of the dam. Take all 200t/m2.

Addis Ababa University Hydraulic Structures I
Apr-13 58
2. Determine the stresses at the intrados and extrados of the crown and abutment for the
constant angle arch dam of the previous example at h = 40m.
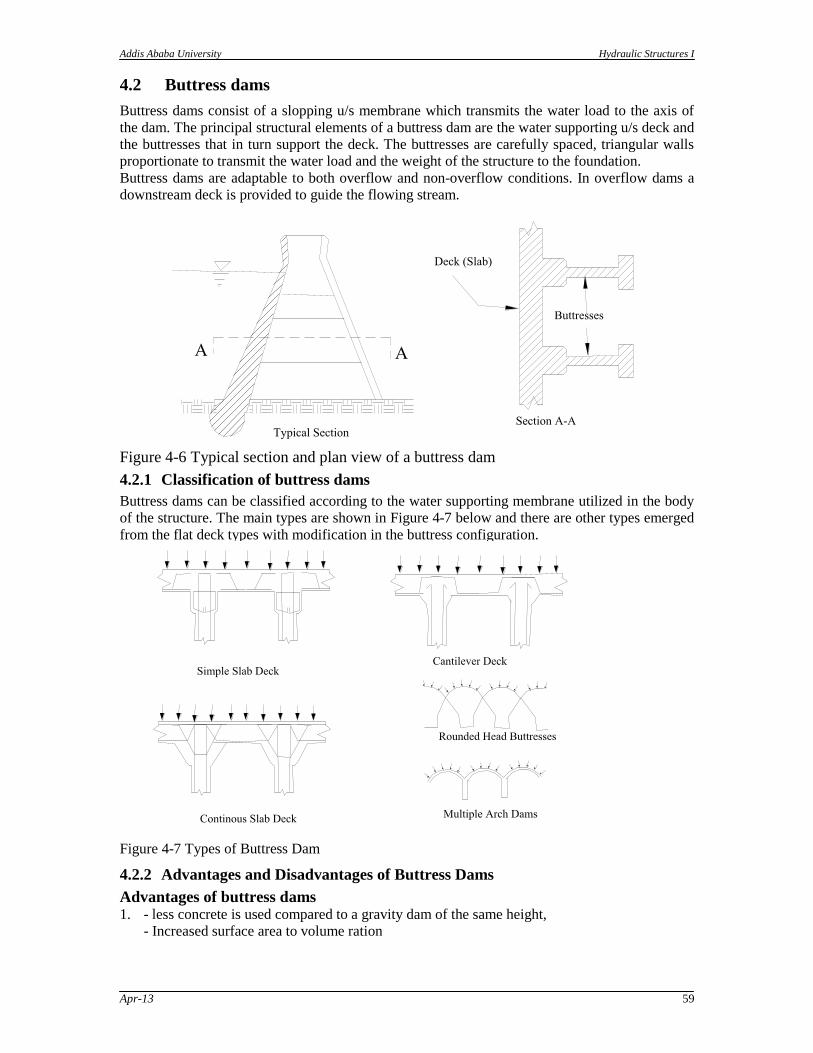
Addis Ababa University Hydraulic Structures I
Apr-13 59
4.2 Buttress dams
Buttress dams consist of a slopping u/s membrane which transmits the water load to the axis of
the dam. The principal structural elements of a buttress dam are the water supporting u/s deck and
the buttresses that in turn support the deck. The buttresses are carefully spaced, triangular walls
proportionate to transmit the water load and the weight of the structure to the foundation.
Buttress dams are adaptable to both overflow and non-overflow conditions. In overflow dams a
downstream deck is provided to guide the flowing stream.
Figure 4-6 Typical section and plan view of a buttress dam
4.2.1 Classification of buttress dams
Buttress dams can be classified according to the water supporting membrane utilized in the body
of the structure. The main types are shown in Figure 4-7 below and there are other types emerged
from the flat deck types with modification in the buttress configuration.
Figure 4-7 Types of Buttress Dam
4.2.2 Advantages and Disadvantages of Buttress Dams
Advantages of buttress dams 1. - less concrete is used compared to a gravity dam of the same height,
- Increased surface area to volume ration
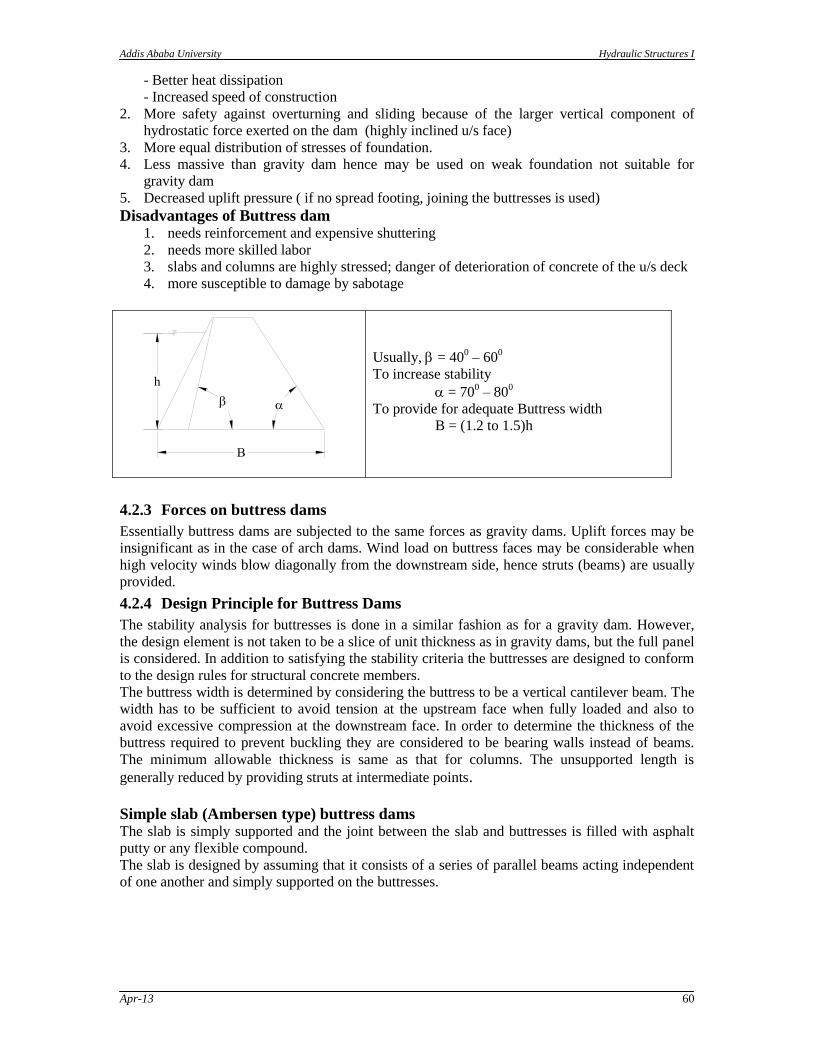
Addis Ababa University Hydraulic Structures I
Apr-13 60
- Better heat dissipation
- Increased speed of construction
2. More safety against overturning and sliding because of the larger vertical component of
hydrostatic force exerted on the dam (highly inclined u/s face)
3. More equal distribution of stresses of foundation.
4. Less massive than gravity dam hence may be used on weak foundation not suitable for
gravity dam
5. Decreased uplift pressure ( if no spread footing, joining the buttresses is used)
Disadvantages of Buttress dam 1. needs reinforcement and expensive shuttering
2. needs more skilled labor
3. slabs and columns are highly stressed; danger of deterioration of concrete of the u/s deck
4. more susceptible to damage by sabotage
Usually, = 400 – 60
0
To increase stability
= 700 – 80
0
To provide for adequate Buttress width
B = (1.2 to 1.5)h
4.2.3 Forces on buttress dams
Essentially buttress dams are subjected to the same forces as gravity dams. Uplift forces may be
insignificant as in the case of arch dams. Wind load on buttress faces may be considerable when
high velocity winds blow diagonally from the downstream side, hence struts (beams) are usually
provided.
4.2.4 Design Principle for Buttress Dams
The stability analysis for buttresses is done in a similar fashion as for a gravity dam. However,
the design element is not taken to be a slice of unit thickness as in gravity dams, but the full panel
is considered. In addition to satisfying the stability criteria the buttresses are designed to conform
to the design rules for structural concrete members.
The buttress width is determined by considering the buttress to be a vertical cantilever beam. The
width has to be sufficient to avoid tension at the upstream face when fully loaded and also to
avoid excessive compression at the downstream face. In order to determine the thickness of the
buttress required to prevent buckling they are considered to be bearing walls instead of beams.
The minimum allowable thickness is same as that for columns. The unsupported length is
generally reduced by providing struts at intermediate points.
Simple slab (Ambersen type) buttress dams The slab is simply supported and the joint between the slab and buttresses is filled with asphalt
putty or any flexible compound.
The slab is designed by assuming that it consists of a series of parallel beams acting independent
of one another and simply supported on the buttresses.
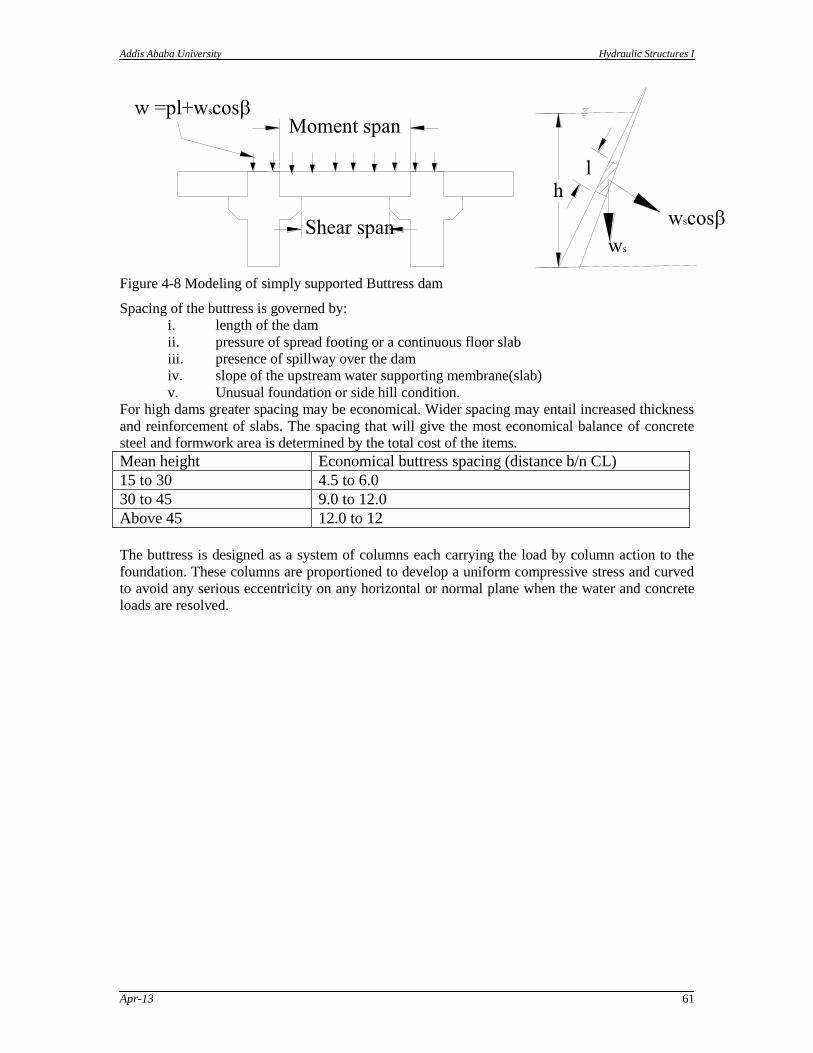
Addis Ababa University Hydraulic Structures I
Apr-13 61
Figure 4-8 Modeling of simply supported Buttress dam
Spacing of the buttress is governed by:
i. length of the dam
ii. pressure of spread footing or a continuous floor slab
iii. presence of spillway over the dam
iv. slope of the upstream water supporting membrane(slab)
v. Unusual foundation or side hill condition.
For high dams greater spacing may be economical. Wider spacing may entail increased thickness
and reinforcement of slabs. The spacing that will give the most economical balance of concrete
steel and formwork area is determined by the total cost of the items.
Mean height Economical buttress spacing (distance b/n CL)
15 to 30 4.5 to 6.0
30 to 45 9.0 to 12.0
Above 45 12.0 to 12
The buttress is designed as a system of columns each carrying the load by column action to the
foundation. These columns are proportioned to develop a uniform compressive stress and curved
to avoid any serious eccentricity on any horizontal or normal plane when the water and concrete
loads are resolved.
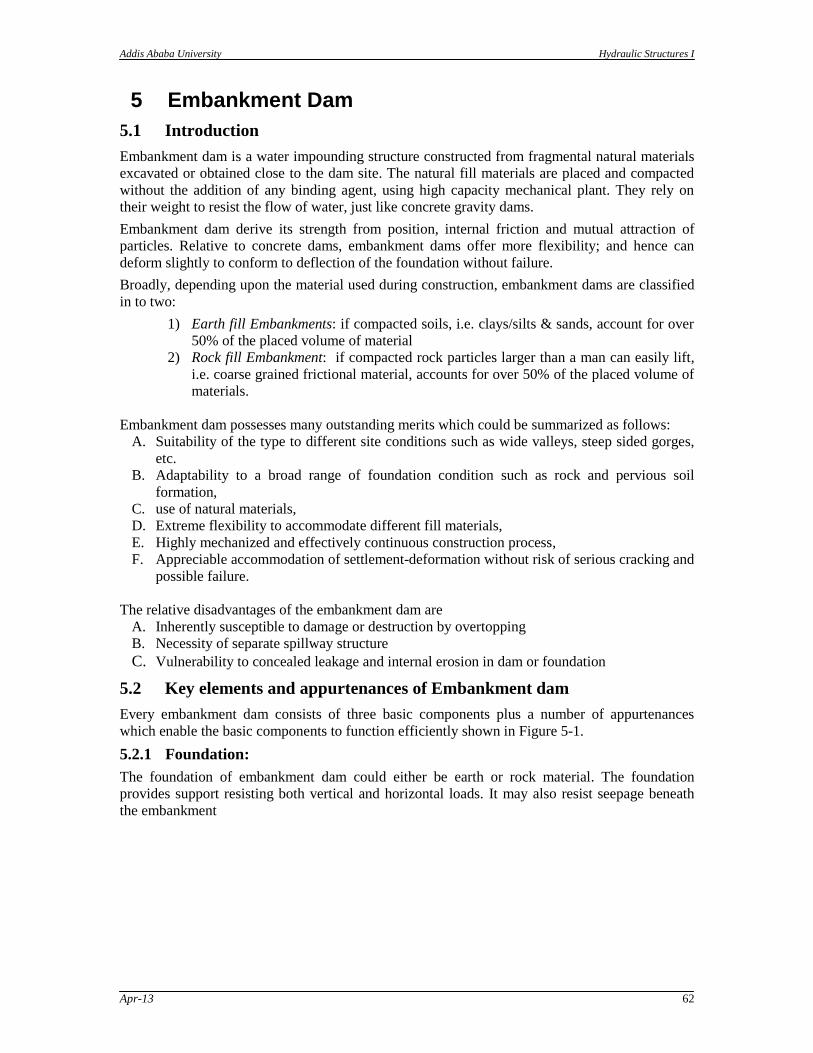
Addis Ababa University Hydraulic Structures I
Apr-13 62
5 Embankment Dam
5.1 Introduction
Embankment dam is a water impounding structure constructed from fragmental natural materials
excavated or obtained close to the dam site. The natural fill materials are placed and compacted
without the addition of any binding agent, using high capacity mechanical plant. They rely on
their weight to resist the flow of water, just like concrete gravity dams.
Embankment dam derive its strength from position, internal friction and mutual attraction of
particles. Relative to concrete dams, embankment dams offer more flexibility; and hence can
deform slightly to conform to deflection of the foundation without failure.
Broadly, depending upon the material used during construction, embankment dams are classified
in to two:
1) Earth fill Embankments: if compacted soils, i.e. clays/silts & sands, account for over
50% of the placed volume of material
2) Rock fill Embankment: if compacted rock particles larger than a man can easily lift,
i.e. coarse grained frictional material, accounts for over 50% of the placed volume of
materials.
Embankment dam possesses many outstanding merits which could be summarized as follows:
A. Suitability of the type to different site conditions such as wide valleys, steep sided gorges,
etc.
B. Adaptability to a broad range of foundation condition such as rock and pervious soil
formation,
C. use of natural materials,
D. Extreme flexibility to accommodate different fill materials,
E. Highly mechanized and effectively continuous construction process,
F. Appreciable accommodation of settlement-deformation without risk of serious cracking and
possible failure.
The relative disadvantages of the embankment dam are
A. Inherently susceptible to damage or destruction by overtopping
B. Necessity of separate spillway structure
C. Vulnerability to concealed leakage and internal erosion in dam or foundation
5.2 Key elements and appurtenances of Embankment dam
Every embankment dam consists of three basic components plus a number of appurtenances
which enable the basic components to function efficiently shown in Figure 5-1.
5.2.1 Foundation:
The foundation of embankment dam could either be earth or rock material. The foundation
provides support resisting both vertical and horizontal loads. It may also resist seepage beneath
the embankment
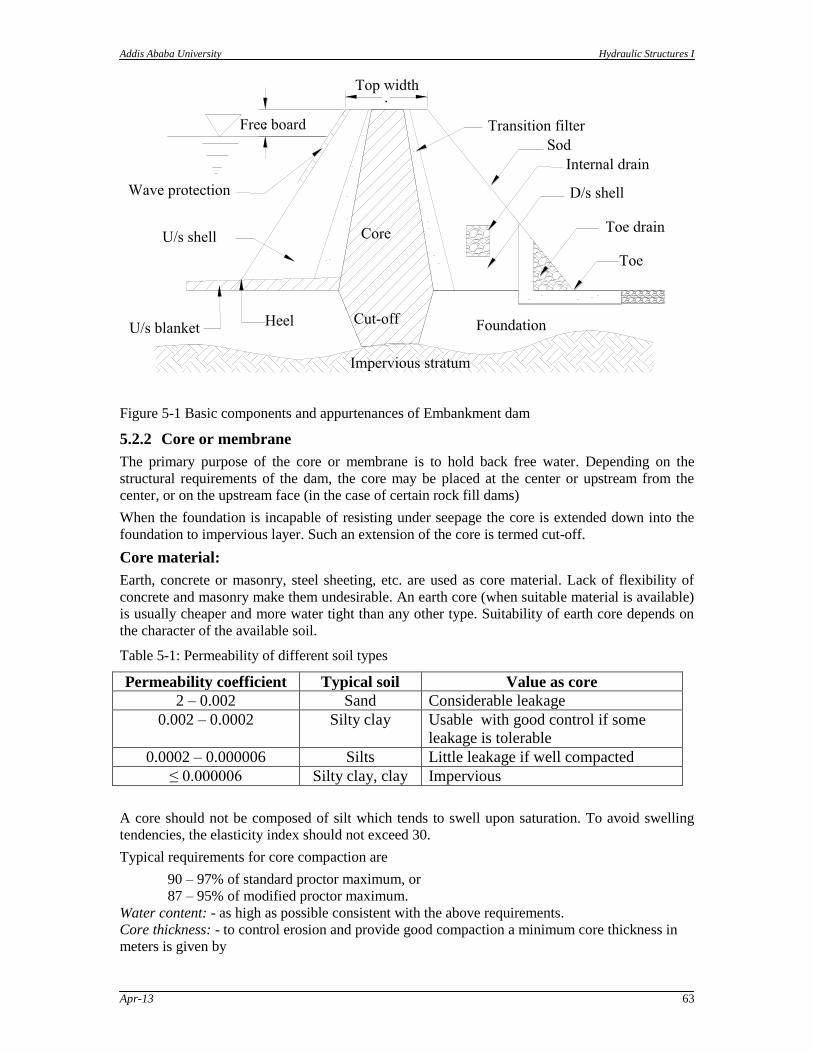
Addis Ababa University Hydraulic Structures I
Apr-13 63
Figure 5-1 Basic components and appurtenances of Embankment dam
5.2.2 Core or membrane
The primary purpose of the core or membrane is to hold back free water. Depending on the
structural requirements of the dam, the core may be placed at the center or upstream from the
center, or on the upstream face (in the case of certain rock fill dams)
When the foundation is incapable of resisting under seepage the core is extended down into the
foundation to impervious layer. Such an extension of the core is termed cut-off.
Core material:
Earth, concrete or masonry, steel sheeting, etc. are used as core material. Lack of flexibility of
concrete and masonry make them undesirable. An earth core (when suitable material is available)
is usually cheaper and more water tight than any other type. Suitability of earth core depends on
the character of the available soil.
Table 5-1: Permeability of different soil types
Permeability coefficient Typical soil Value as core
2 – 0.002 Sand Considerable leakage
0.002 – 0.0002 Silty clay Usable with good control if some
leakage is tolerable
0.0002 – 0.000006 Silts Little leakage if well compacted
≤ 0.000006 Silty clay, clay Impervious
A core should not be composed of silt which tends to swell upon saturation. To avoid swelling
tendencies, the elasticity index should not exceed 30.
Typical requirements for core compaction are
90 – 97% of standard proctor maximum, or
87 – 95% of modified proctor maximum.
Water content: - as high as possible consistent with the above requirements.
Core thickness: - to control erosion and provide good compaction a minimum core thickness in
meters is given by
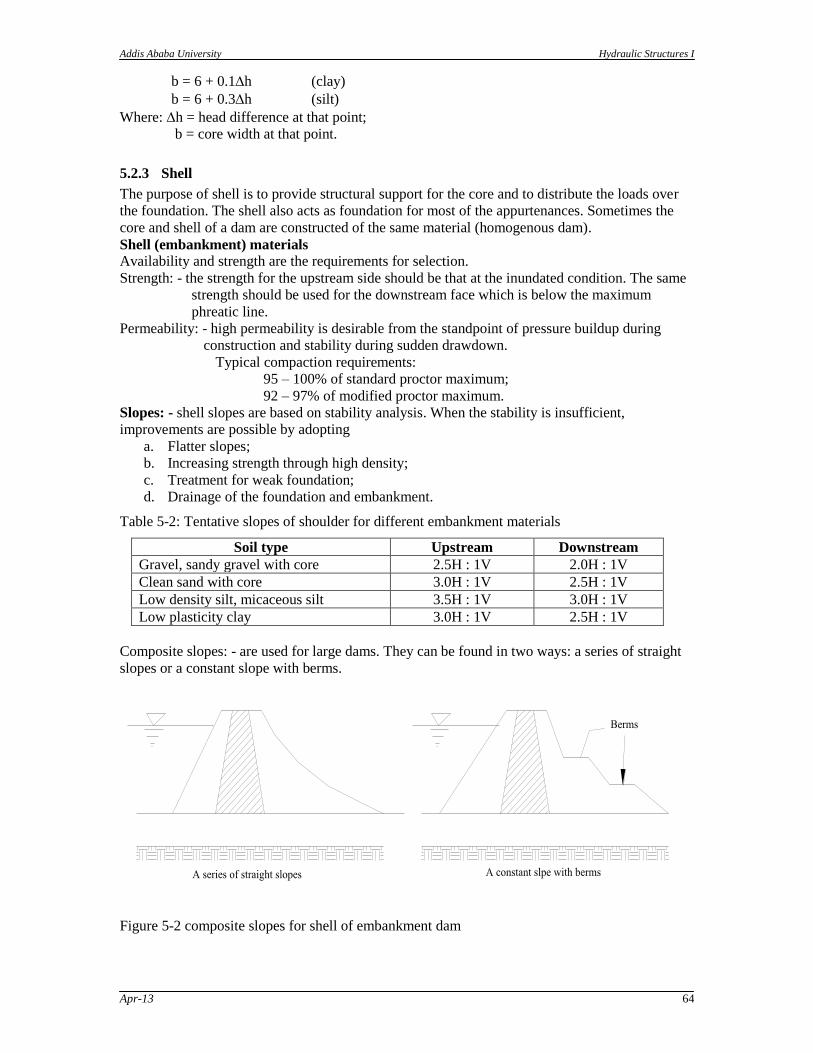
Addis Ababa University Hydraulic Structures I
Apr-13 64
b = 6 + 0.1h (clay)
b = 6 + 0.3h (silt)
Where: h = head difference at that point;
b = core width at that point.
5.2.3 Shell
The purpose of shell is to provide structural support for the core and to distribute the loads over
the foundation. The shell also acts as foundation for most of the appurtenances. Sometimes the
core and shell of a dam are constructed of the same material (homogenous dam).
Shell (embankment) materials
Availability and strength are the requirements for selection.
Strength: - the strength for the upstream side should be that at the inundated condition. The same
strength should be used for the downstream face which is below the maximum
phreatic line.
Permeability: - high permeability is desirable from the standpoint of pressure buildup during
construction and stability during sudden drawdown.
Typical compaction requirements:
95 – 100% of standard proctor maximum;
92 – 97% of modified proctor maximum.
Slopes: - shell slopes are based on stability analysis. When the stability is insufficient,
improvements are possible by adopting
a. Flatter slopes;
b. Increasing strength through high density;
c. Treatment for weak foundation;
d. Drainage of the foundation and embankment.
Table 5-2: Tentative slopes of shoulder for different embankment materials
Soil type Upstream Downstream
Gravel, sandy gravel with core 2.5H : 1V 2.0H : 1V
Clean sand with core 3.0H : 1V 2.5H : 1V
Low density silt, micaceous silt 3.5H : 1V 3.0H : 1V
Low plasticity clay 3.0H : 1V 2.5H : 1V
Composite slopes: - are used for large dams. They can be found in two ways: a series of straight
slopes or a constant slope with berms.
Figure 5-2 composite slopes for shell of embankment dam
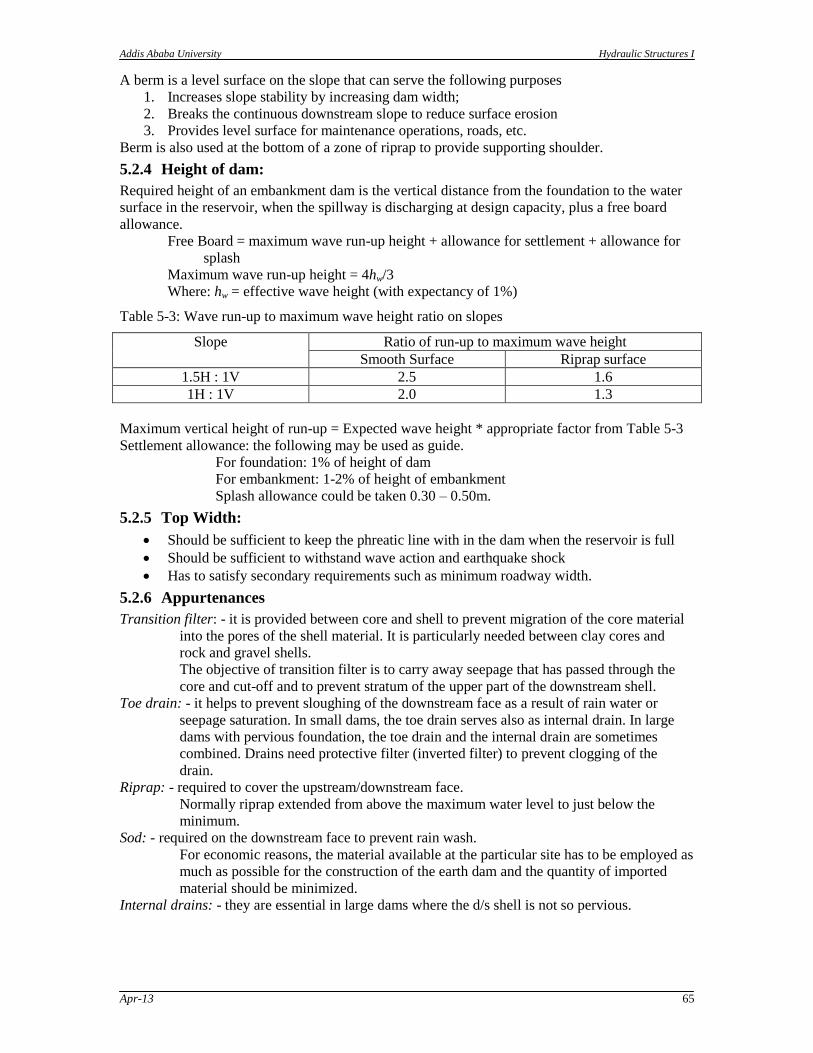
Addis Ababa University Hydraulic Structures I
Apr-13 65
A berm is a level surface on the slope that can serve the following purposes
1. Increases slope stability by increasing dam width;
2. Breaks the continuous downstream slope to reduce surface erosion
3. Provides level surface for maintenance operations, roads, etc.
Berm is also used at the bottom of a zone of riprap to provide supporting shoulder.
5.2.4 Height of dam:
Required height of an embankment dam is the vertical distance from the foundation to the water
surface in the reservoir, when the spillway is discharging at design capacity, plus a free board
allowance.
Free Board = maximum wave run-up height + allowance for settlement + allowance for
splash
Maximum wave run-up height = 4hw/3
Where: hw = effective wave height (with expectancy of 1%)
Table 5-3: Wave run-up to maximum wave height ratio on slopes
Slope Ratio of run-up to maximum wave height
Smooth Surface Riprap surface
1.5H : 1V 2.5 1.6
1H : 1V 2.0 1.3
Maximum vertical height of run-up = Expected wave height * appropriate factor from Table 5-3
Settlement allowance: the following may be used as guide.
For foundation: 1% of height of dam
For embankment: 1-2% of height of embankment
Splash allowance could be taken 0.30 – 0.50m.
5.2.5 Top Width:
Should be sufficient to keep the phreatic line with in the dam when the reservoir is full
Should be sufficient to withstand wave action and earthquake shock
Has to satisfy secondary requirements such as minimum roadway width.
5.2.6 Appurtenances
Transition filter: - it is provided between core and shell to prevent migration of the core material
into the pores of the shell material. It is particularly needed between clay cores and
rock and gravel shells.
The objective of transition filter is to carry away seepage that has passed through the
core and cut-off and to prevent stratum of the upper part of the downstream shell.
Toe drain: - it helps to prevent sloughing of the downstream face as a result of rain water or
seepage saturation. In small dams, the toe drain serves also as internal drain. In large
dams with pervious foundation, the toe drain and the internal drain are sometimes
combined. Drains need protective filter (inverted filter) to prevent clogging of the
drain.
Riprap: - required to cover the upstream/downstream face.
Normally riprap extended from above the maximum water level to just below the
minimum.
Sod: - required on the downstream face to prevent rain wash.
For economic reasons, the material available at the particular site has to be employed as
much as possible for the construction of the earth dam and the quantity of imported
material should be minimized.
Internal drains: - they are essential in large dams where the d/s shell is not so pervious.
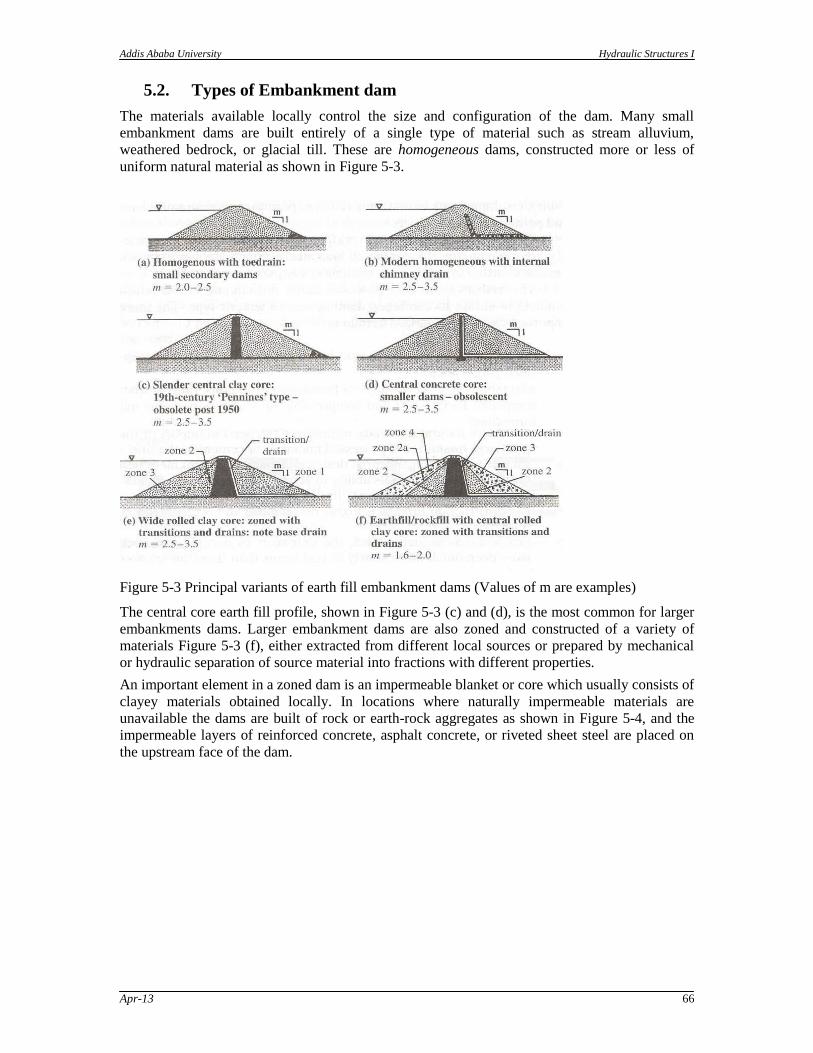
Addis Ababa University Hydraulic Structures I
Apr-13 66
5.2. Types of Embankment dam
The materials available locally control the size and configuration of the dam. Many small
embankment dams are built entirely of a single type of material such as stream alluvium,
weathered bedrock, or glacial till. These are homogeneous dams, constructed more or less of
uniform natural material as shown in Figure 5-3.
Figure 5-3 Principal variants of earth fill embankment dams (Values of m are examples)
The central core earth fill profile, shown in Figure 5-3 (c) and (d), is the most common for larger
embankments dams. Larger embankment dams are also zoned and constructed of a variety of
materials Figure 5-3 (f), either extracted from different local sources or prepared by mechanical
or hydraulic separation of source material into fractions with different properties.
An important element in a zoned dam is an impermeable blanket or core which usually consists of
clayey materials obtained locally. In locations where naturally impermeable materials are
unavailable the dams are built of rock or earth-rock aggregates as shown in Figure 5-4, and the
impermeable layers of reinforced concrete, asphalt concrete, or riveted sheet steel are placed on
the upstream face of the dam.
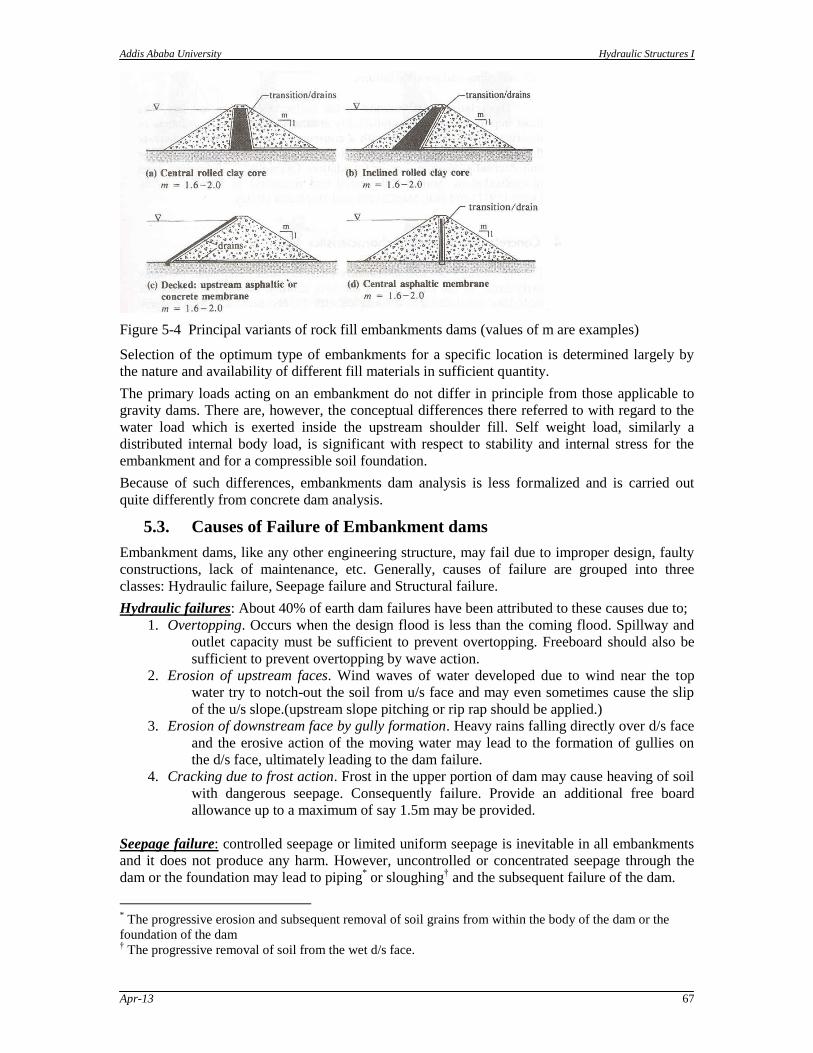
Addis Ababa University Hydraulic Structures I
Apr-13 67
Figure 5-4 Principal variants of rock fill embankments dams (values of m are examples)
Selection of the optimum type of embankments for a specific location is determined largely by
the nature and availability of different fill materials in sufficient quantity.
The primary loads acting on an embankment do not differ in principle from those applicable to
gravity dams. There are, however, the conceptual differences there referred to with regard to the
water load which is exerted inside the upstream shoulder fill. Self weight load, similarly a
distributed internal body load, is significant with respect to stability and internal stress for the
embankment and for a compressible soil foundation.
Because of such differences, embankments dam analysis is less formalized and is carried out
quite differently from concrete dam analysis.
5.3. Causes of Failure of Embankment dams
Embankment dams, like any other engineering structure, may fail due to improper design, faulty
constructions, lack of maintenance, etc. Generally, causes of failure are grouped into three
classes: Hydraulic failure, Seepage failure and Structural failure.
Hydraulic failures: About 40% of earth dam failures have been attributed to these causes due to;
1. Overtopping. Occurs when the design flood is less than the coming flood. Spillway and
outlet capacity must be sufficient to prevent overtopping. Freeboard should also be
sufficient to prevent overtopping by wave action.
2. Erosion of upstream faces. Wind waves of water developed due to wind near the top
water try to notch-out the soil from u/s face and may even sometimes cause the slip
of the u/s slope.(upstream slope pitching or rip rap should be applied.)
3. Erosion of downstream face by gully formation. Heavy rains falling directly over d/s face
and the erosive action of the moving water may lead to the formation of gullies on
the d/s face, ultimately leading to the dam failure.
4. Cracking due to frost action. Frost in the upper portion of dam may cause heaving of soil
with dangerous seepage. Consequently failure. Provide an additional free board
allowance up to a maximum of say 1.5m may be provided.
Seepage failure: controlled seepage or limited uniform seepage is inevitable in all embankments
and it does not produce any harm. However, uncontrolled or concentrated seepage through the
dam or the foundation may lead to piping* or sloughing
† and the subsequent failure of the dam.
* The progressive erosion and subsequent removal of soil grains from within the body of the dam or the
foundation of the dam † The progressive removal of soil from the wet d/s face.
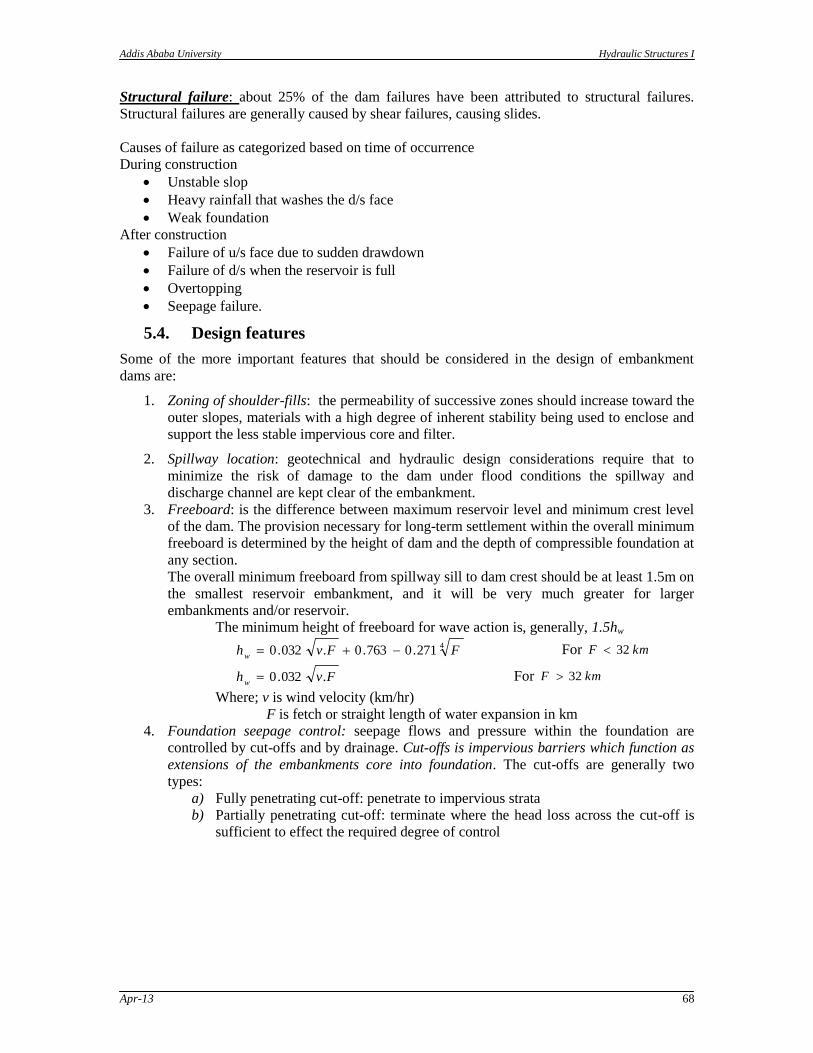
Addis Ababa University Hydraulic Structures I
Apr-13 68
Structural failure: about 25% of the dam failures have been attributed to structural failures.
Structural failures are generally caused by shear failures, causing slides.
Causes of failure as categorized based on time of occurrence
During construction
Unstable slop
Heavy rainfall that washes the d/s face
Weak foundation
After construction
Failure of u/s face due to sudden drawdown
Failure of d/s when the reservoir is full
Overtopping
Seepage failure.
5.4. Design features
Some of the more important features that should be considered in the design of embankment
dams are:
1. Zoning of shoulder-fills: the permeability of successive zones should increase toward the
outer slopes, materials with a high degree of inherent stability being used to enclose and
support the less stable impervious core and filter.
2. Spillway location: geotechnical and hydraulic design considerations require that to
minimize the risk of damage to the dam under flood conditions the spillway and
discharge channel are kept clear of the embankment.
3. Freeboard: is the difference between maximum reservoir level and minimum crest level
of the dam. The provision necessary for long-term settlement within the overall minimum
freeboard is determined by the height of dam and the depth of compressible foundation at
any section.
The overall minimum freeboard from spillway sill to dam crest should be at least 1.5m on
the smallest reservoir embankment, and it will be very much greater for larger
embankments and/or reservoir.
The minimum height of freeboard for wave action is, generally, 1.5hw
4271.0763.0.032.0 FFvh
w For kmF 32
Fvhw
.032.0 For kmF 32
Where; v is wind velocity (km/hr)
F is fetch or straight length of water expansion in km
4. Foundation seepage control: seepage flows and pressure within the foundation are
controlled by cut-offs and by drainage. Cut-offs is impervious barriers which function as
extensions of the embankments core into foundation. The cut-offs are generally two
types:
a) Fully penetrating cut-off: penetrate to impervious strata
b) Partially penetrating cut-off: terminate where the head loss across the cut-off is
sufficient to effect the required degree of control
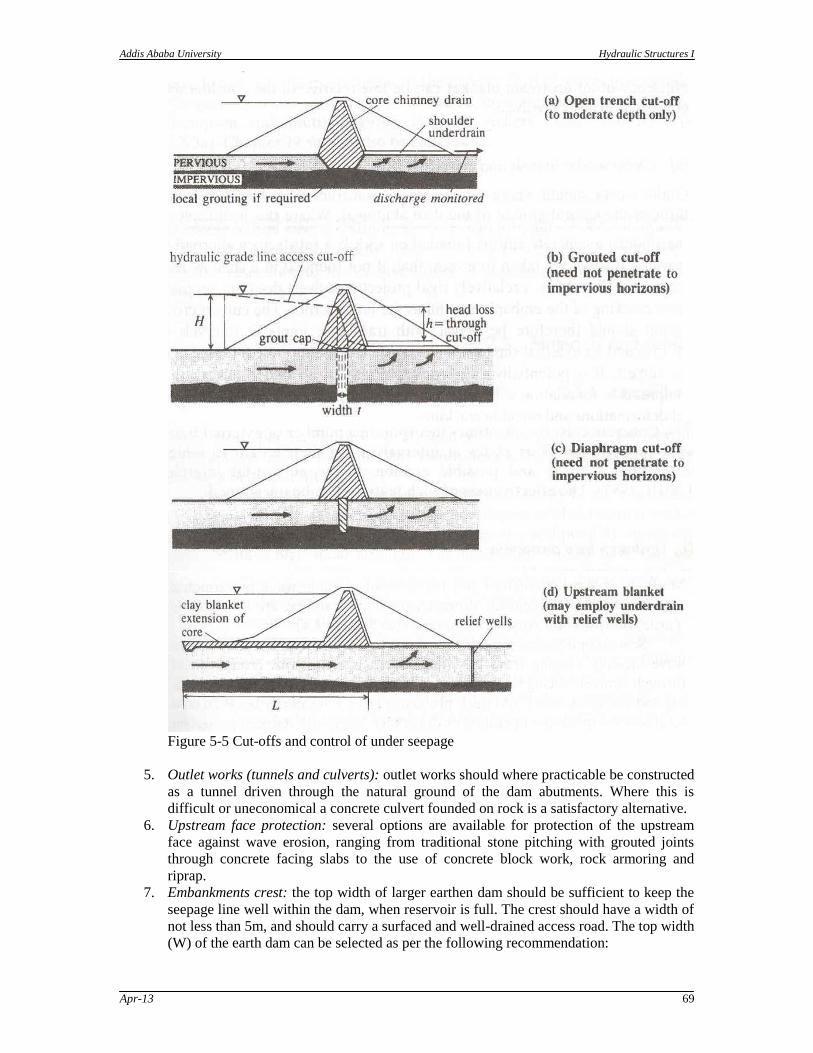
Addis Ababa University Hydraulic Structures I
Apr-13 69
Figure 5-5 Cut-offs and control of under seepage
5. Outlet works (tunnels and culverts): outlet works should where practicable be constructed
as a tunnel driven through the natural ground of the dam abutments. Where this is
difficult or uneconomical a concrete culvert founded on rock is a satisfactory alternative.
6. Upstream face protection: several options are available for protection of the upstream
face against wave erosion, ranging from traditional stone pitching with grouted joints
through concrete facing slabs to the use of concrete block work, rock armoring and
riprap.
7. Embankments crest: the top width of larger earthen dam should be sufficient to keep the
seepage line well within the dam, when reservoir is full. The crest should have a width of
not less than 5m, and should carry a surfaced and well-drained access road. The top width
(W) of the earth dam can be selected as per the following recommendation:
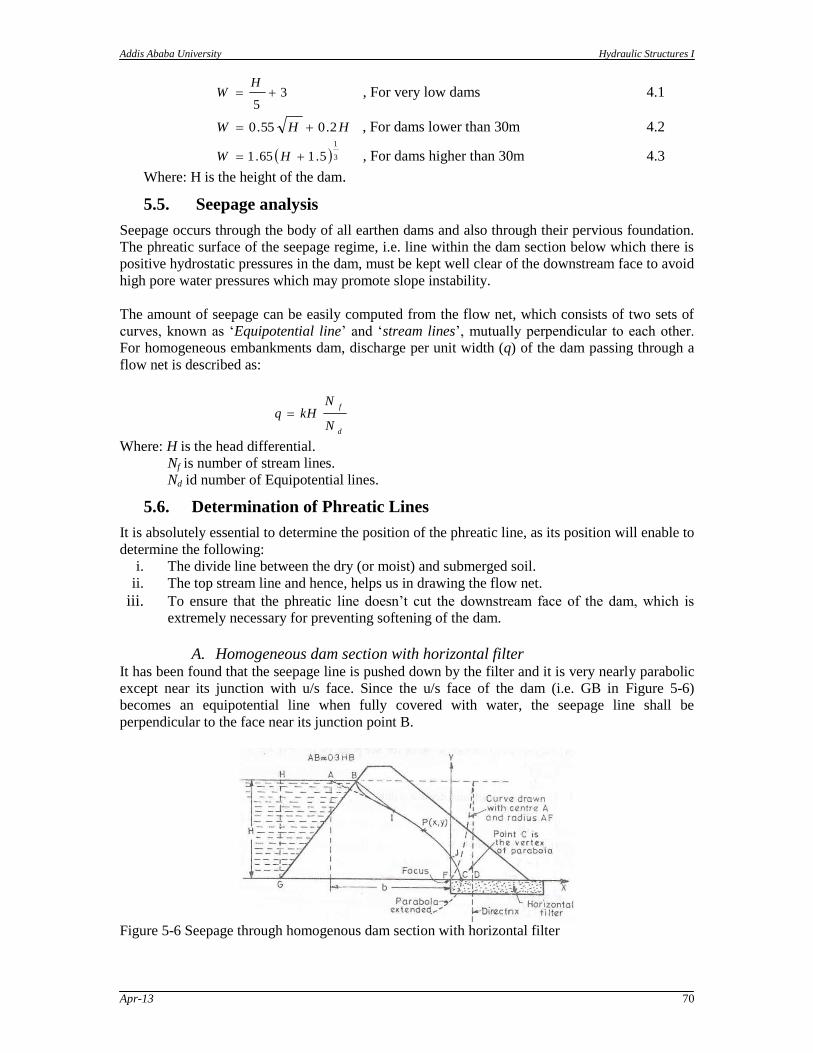
Addis Ababa University Hydraulic Structures I
Apr-13 70
35
H
W , For very low dams 4.1
HHW 2.055.0 , For dams lower than 30m 4.2
3
1
5.165.1 HW , For dams higher than 30m 4.3
Where: H is the height of the dam.
5.5. Seepage analysis
Seepage occurs through the body of all earthen dams and also through their pervious foundation.
The phreatic surface of the seepage regime, i.e. line within the dam section below which there is
positive hydrostatic pressures in the dam, must be kept well clear of the downstream face to avoid
high pore water pressures which may promote slope instability.
The amount of seepage can be easily computed from the flow net, which consists of two sets of
curves, known as „Equipotential line‟ and „stream lines‟, mutually perpendicular to each other.
For homogeneous embankments dam, discharge per unit width (q) of the dam passing through a
flow net is described as:
d
f
N
NkHq
Where: H is the head differential.
Nf is number of stream lines.
Nd id number of Equipotential lines.
5.6. Determination of Phreatic Lines
It is absolutely essential to determine the position of the phreatic line, as its position will enable to
determine the following:
i. The divide line between the dry (or moist) and submerged soil.
ii. The top stream line and hence, helps us in drawing the flow net.
iii. To ensure that the phreatic line doesn‟t cut the downstream face of the dam, which is
extremely necessary for preventing softening of the dam.
A. Homogeneous dam section with horizontal filter It has been found that the seepage line is pushed down by the filter and it is very nearly parabolic
except near its junction with u/s face. Since the u/s face of the dam (i.e. GB in Figure 5-6)
becomes an equipotential line when fully covered with water, the seepage line shall be
perpendicular to the face near its junction point B.
Figure 5-6 Seepage through homogenous dam section with horizontal filter
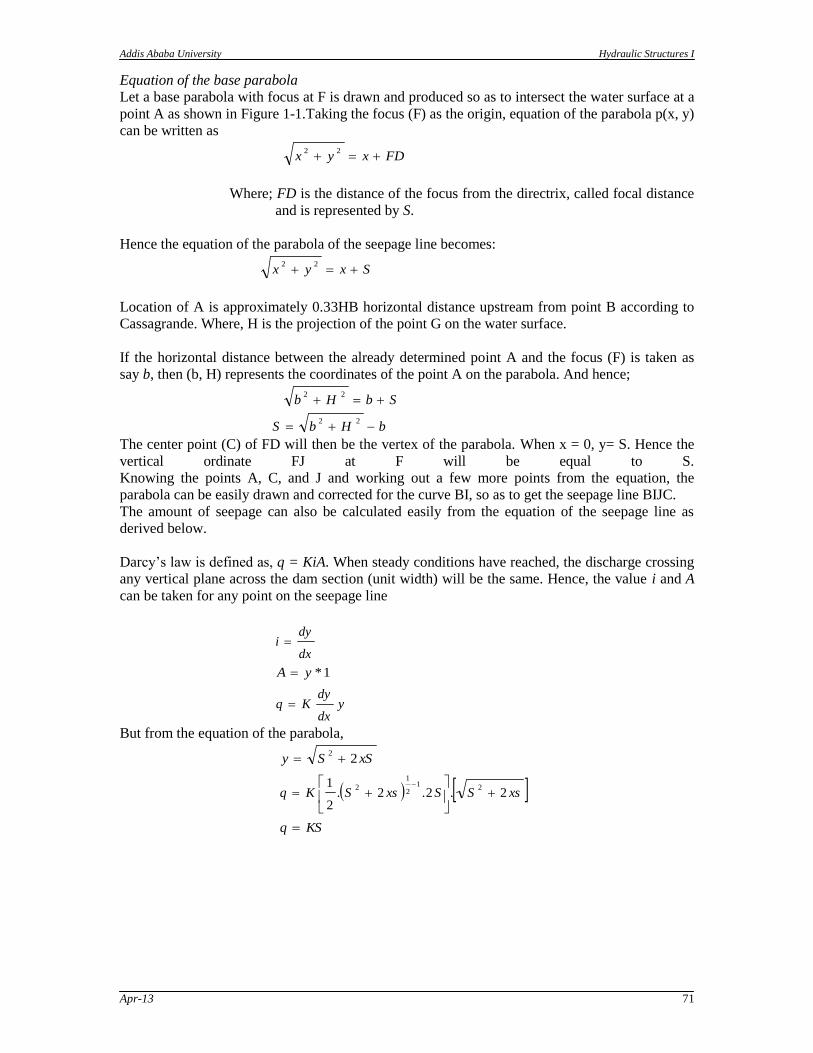
Addis Ababa University Hydraulic Structures I
Apr-13 71
Equation of the base parabola
Let a base parabola with focus at F is drawn and produced so as to intersect the water surface at a
point A as shown in Figure 1-1.Taking the focus (F) as the origin, equation of the parabola p(x, y)
can be written as
FDxyx 22
Where; FD is the distance of the focus from the directrix, called focal distance
and is represented by S.
Hence the equation of the parabola of the seepage line becomes:
Sxyx 22
Location of A is approximately 0.33HB horizontal distance upstream from point B according to
Cassagrande. Where, H is the projection of the point G on the water surface.
If the horizontal distance between the already determined point A and the focus (F) is taken as
say b, then (b, H) represents the coordinates of the point A on the parabola. And hence;
SbHb 22
bHbS 22
The center point (C) of FD will then be the vertex of the parabola. When x = 0, y= S. Hence the
vertical ordinate FJ at F will be equal to S.
Knowing the points A, C, and J and working out a few more points from the equation, the
parabola can be easily drawn and corrected for the curve BI, so as to get the seepage line BIJC.
The amount of seepage can also be calculated easily from the equation of the seepage line as
derived below.
Darcy‟s law is defined as, q = KiA. When steady conditions have reached, the discharge crossing
any vertical plane across the dam section (unit width) will be the same. Hence, the value i and A
can be taken for any point on the seepage line
dx
dyi
1*yA
ydx
dyKq
But from the equation of the parabola,
xSSy 22
xsSSxsSKq 2.2.2.2
1 212
1
2
KSq
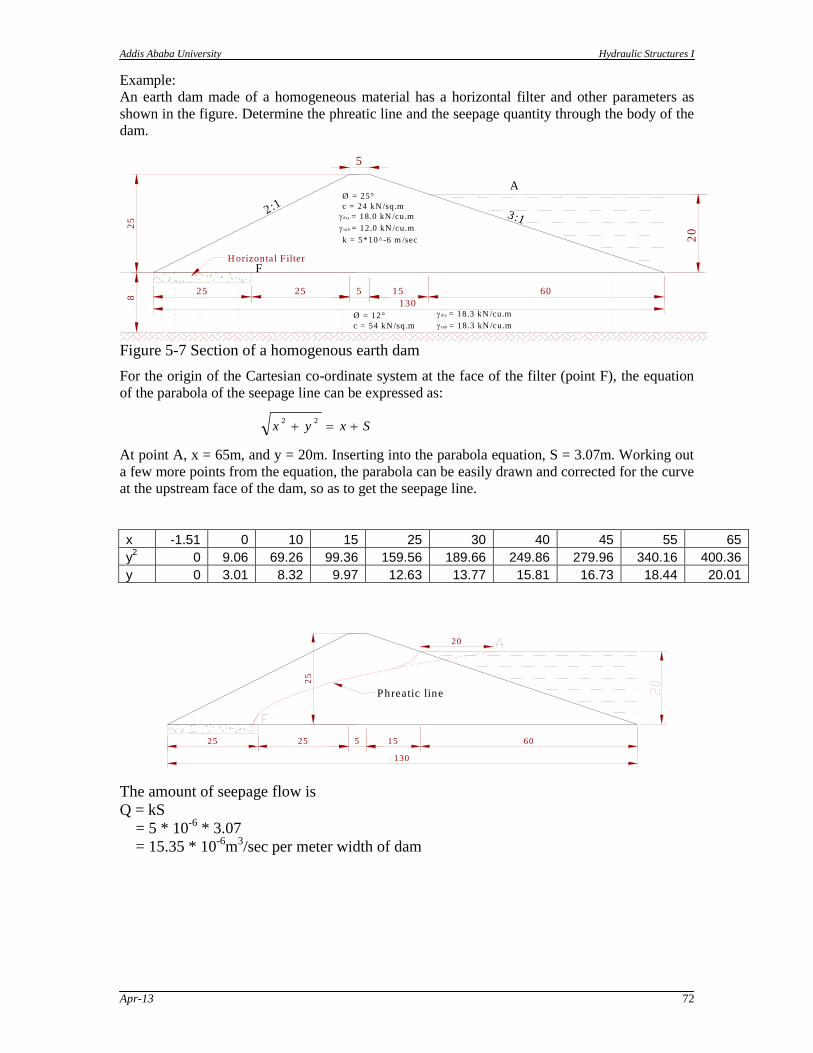
Addis Ababa University Hydraulic Structures I
Apr-13 72
Example:
An earth dam made of a homogeneous material has a horizontal filter and other parameters as
shown in the figure. Determine the phreatic line and the seepage quantity through the body of the
dam.
20
25
25 25 5 15 60
130
A
F
5
2:13:1
8
Ø = 25°
c = 24 kN /sq.m
dry = 18.0 kN /cu.m
sub = 12.0 kN /cu.m
Ø = 12°
c = 54 kN /sq.m
dry = 18.3 kN /cu.m
sub = 18.3 kN /cu.m
k = 5*10^-6 m /sec
Fig. Section of the hom ogeneous earth dam .
H orizontal F ilter
Figure 5-7 Section of a homogenous earth dam
For the origin of the Cartesian co-ordinate system at the face of the filter (point F), the equation
of the parabola of the seepage line can be expressed as:
Sxyx 22
At point A, x = 65m, and y = 20m. Inserting into the parabola equation, S = 3.07m. Working out
a few more points from the equation, the parabola can be easily drawn and corrected for the curve
at the upstream face of the dam, so as to get the seepage line.
x -1.51 0 10 15 25 30 40 45 55 65
y2 0 9.06 69.26 99.36 159.56 189.66 249.86 279.96 340.16 400.36
y 0 3.01 8.32 9.97 12.63 13.77 15.81 16.73 18.44 20.01
25
25 25 5 15 60
130
20
Phreatic line
The amount of seepage flow is
Q = kS
= 5 * 10-6
* 3.07
= 15.35 * 10-6
m3/sec per meter width of dam
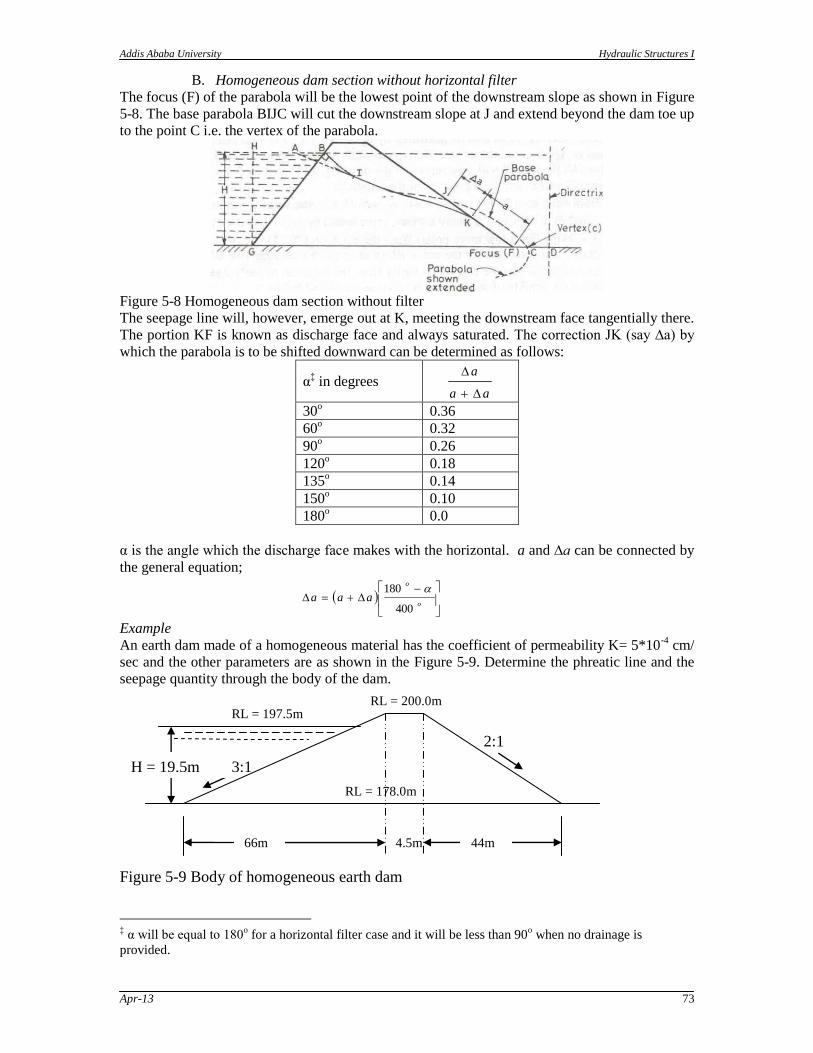
Addis Ababa University Hydraulic Structures I
Apr-13 73
B. Homogeneous dam section without horizontal filter
The focus (F) of the parabola will be the lowest point of the downstream slope as shown in Figure
5-8. The base parabola BIJC will cut the downstream slope at J and extend beyond the dam toe up
to the point C i.e. the vertex of the parabola.
Figure 5-8 Homogeneous dam section without filter
The seepage line will, however, emerge out at K, meeting the downstream face tangentially there.
The portion KF is known as discharge face and always saturated. The correction JK (say ∆a) by
which the parabola is to be shifted downward can be determined as follows:
α‡ in degrees
aa
a
30o
0.36
60o 0.32
90o 0.26
120o 0.18
135o 0.14
150o
0.10
180o
0.0
α is the angle which the discharge face makes with the horizontal. a and ∆a can be connected by
the general equation;
o
o
aaa400
180
Example
An earth dam made of a homogeneous material has the coefficient of permeability K= 5*10-4
cm/
sec and the other parameters are as shown in the Figure 5-9. Determine the phreatic line and the
seepage quantity through the body of the dam.
Figure 5-9 Body of homogeneous earth dam
‡ α will be equal to 180
o for a horizontal filter case and it will be less than 90
o when no drainage is
provided.
4.5m
2:1
3:1
RL = 197.5m
RL = 178.0m
RL = 200.0m
H = 19.5m
66m 44m
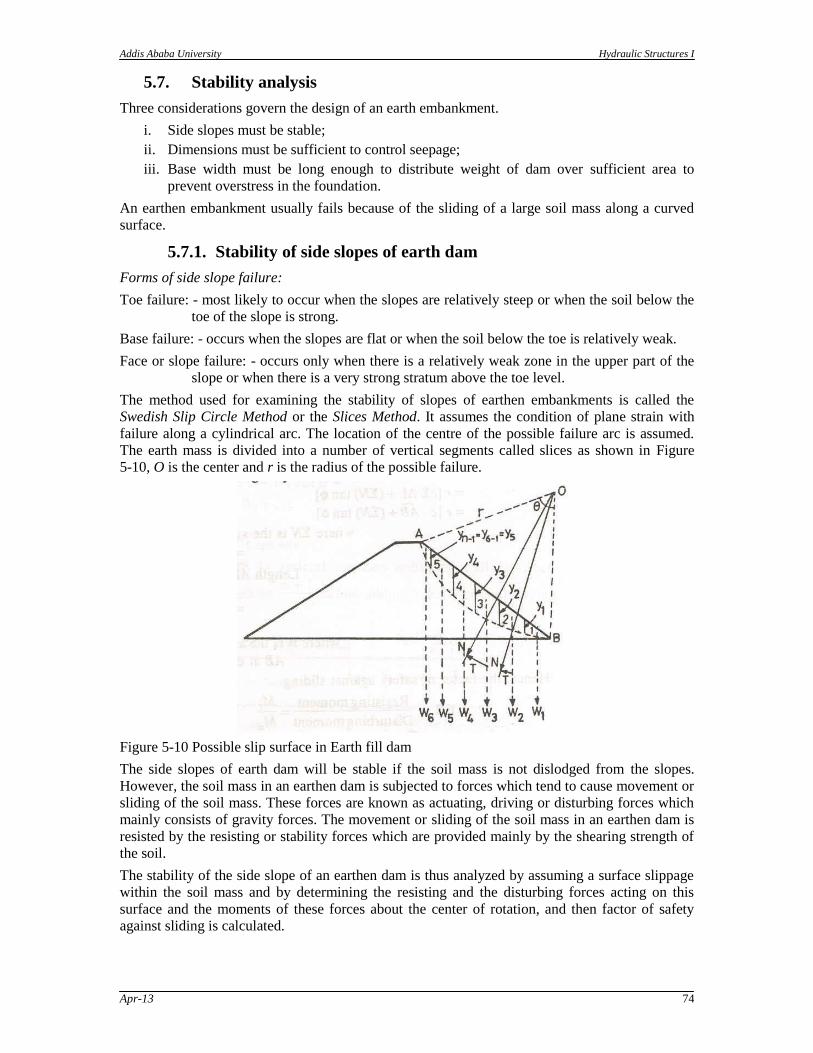
Addis Ababa University Hydraulic Structures I
Apr-13 74
5.7. Stability analysis
Three considerations govern the design of an earth embankment.
i. Side slopes must be stable;
ii. Dimensions must be sufficient to control seepage;
iii. Base width must be long enough to distribute weight of dam over sufficient area to
prevent overstress in the foundation.
An earthen embankment usually fails because of the sliding of a large soil mass along a curved
surface.
5.7.1. Stability of side slopes of earth dam
Forms of side slope failure:
Toe failure: - most likely to occur when the slopes are relatively steep or when the soil below the
toe of the slope is strong.
Base failure: - occurs when the slopes are flat or when the soil below the toe is relatively weak.
Face or slope failure: - occurs only when there is a relatively weak zone in the upper part of the
slope or when there is a very strong stratum above the toe level.
The method used for examining the stability of slopes of earthen embankments is called the
Swedish Slip Circle Method or the Slices Method. It assumes the condition of plane strain with
failure along a cylindrical arc. The location of the centre of the possible failure arc is assumed.
The earth mass is divided into a number of vertical segments called slices as shown in Figure
5-10, O is the center and r is the radius of the possible failure.
Figure 5-10 Possible slip surface in Earth fill dam
The side slopes of earth dam will be stable if the soil mass is not dislodged from the slopes.
However, the soil mass in an earthen dam is subjected to forces which tend to cause movement or
sliding of the soil mass. These forces are known as actuating, driving or disturbing forces which
mainly consists of gravity forces. The movement or sliding of the soil mass in an earthen dam is
resisted by the resisting or stability forces which are provided mainly by the shearing strength of
the soil.
The stability of the side slope of an earthen dam is thus analyzed by assuming a surface slippage
within the soil mass and by determining the resisting and the disturbing forces acting on this
surface and the moments of these forces about the center of rotation, and then factor of safety
against sliding is calculated.
Addis Ababa University Hydraulic Structures I
Apr-13 75
The forces acting on the slices are:
1. The self weight W of the slice acting vertically downward through the center of gravity.
2. The cohesive forces acting tangentially opposite to the direction of probable slippage
3. The soil reaction across the arc. When the soil mass is about to slide, the soil reaction will
act at an angle ф (the angle of internal friction of the soil) to the normal i.e. radial
direction
4. The soil reaction on the two vertical sides of the slice exercised by the adjacent slices on
the right and left respectively.
5. Pore pressures at the base of the arc, and left and right side of the slice.
Usually it is assumed that the soil reactions on the two vertical sides of the slice cancel each other
and so also the pore pressures on the two sides balance each other
The disturbing force is the component of weight of slice in tangential direction i.e.,
sinWT ,
Where: α is the angle which the slope makes with the horizontal.
The total disturbing forces will be summation of disturbing forces for all slices;
....321 TTTT
The total disturbing moments over the sliding surface will be equal to
iiid
TrrTM
The magnitude of shear strength developed in each slice will depend upon the normal
components of that slice. Its magnitude will be:
tanNLc
Where; c is the unit cohesion of the soil
∆L is curved length of the slice
Ф is the angle of internal friction
N is equal to Wcosα
The total resisting force will be summation of resisting forces for all slices;
tanNLc
tan NLc
The total resisting moment over the entire sliding surface will be equal to
tanNLcrMr
Hence the factor of safety against sliding
T
NLc
M
MFS
d
rtan
For determining the stability of the proposed side slope of an earth dam it is necessary to find the
least factor of safety which may occur on any of the possible surfaces of slippage or slip circles.
Slip circle which yields the least factor of safety is the most critical and hence it is known as
critical surface slippage or critical slip circle. For locating the critical surface of slippage, it is
necessary to try several different surfaces of slippage as one trial gives the value of factor of
safety for that arc only.
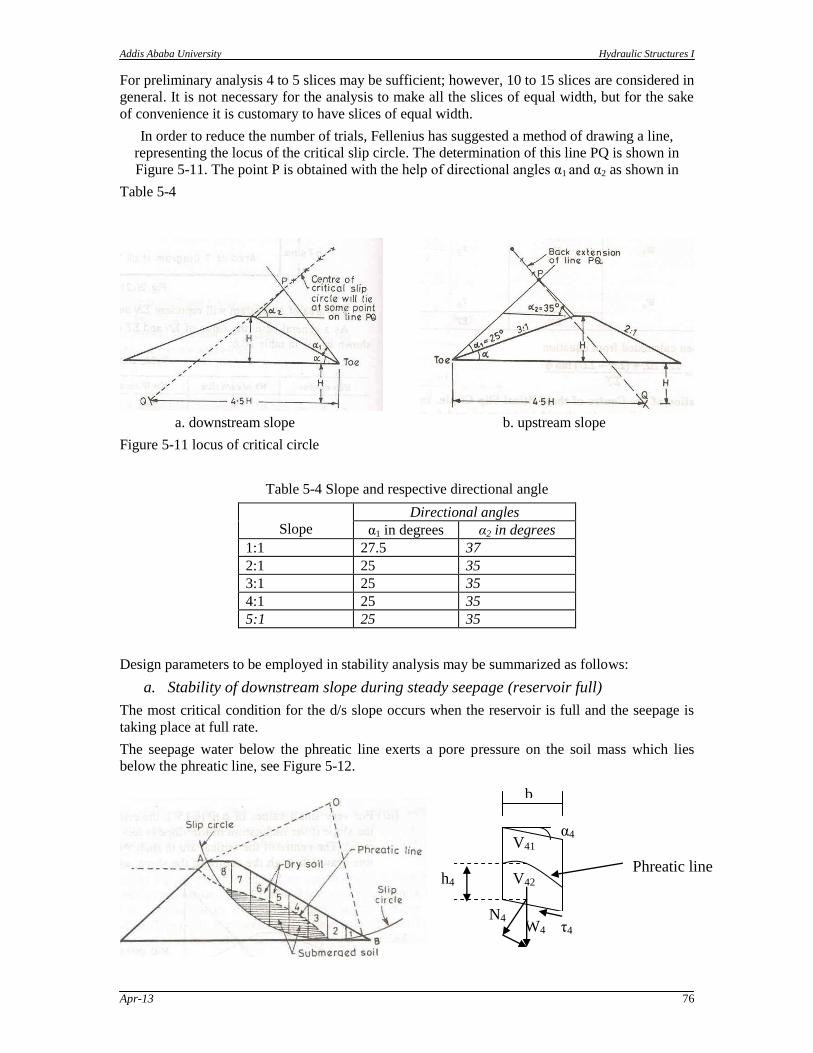
Addis Ababa University Hydraulic Structures I
Apr-13 76
W4
V42
V41
h4
α4
N4
Phreatic line
b
τ4
For preliminary analysis 4 to 5 slices may be sufficient; however, 10 to 15 slices are considered in
general. It is not necessary for the analysis to make all the slices of equal width, but for the sake
of convenience it is customary to have slices of equal width.
In order to reduce the number of trials, Fellenius has suggested a method of drawing a line,
representing the locus of the critical slip circle. The determination of this line PQ is shown in
Figure 5-11. The point P is obtained with the help of directional angles α1 and α2 as shown in
Table 5-4
a. downstream slope b. upstream slope
Figure 5-11 locus of critical circle
Table 5-4 Slope and respective directional angle
Slope
Directional angles
α1 in degrees α2 in degrees
1:1 27.5 37
2:1 25 35
3:1 25 35
4:1 25 35
5:1 25 35
Design parameters to be employed in stability analysis may be summarized as follows:
a. Stability of downstream slope during steady seepage (reservoir full)
The most critical condition for the d/s slope occurs when the reservoir is full and the seepage is
taking place at full rate.
The seepage water below the phreatic line exerts a pore pressure on the soil mass which lies
below the phreatic line, see Figure 5-12.
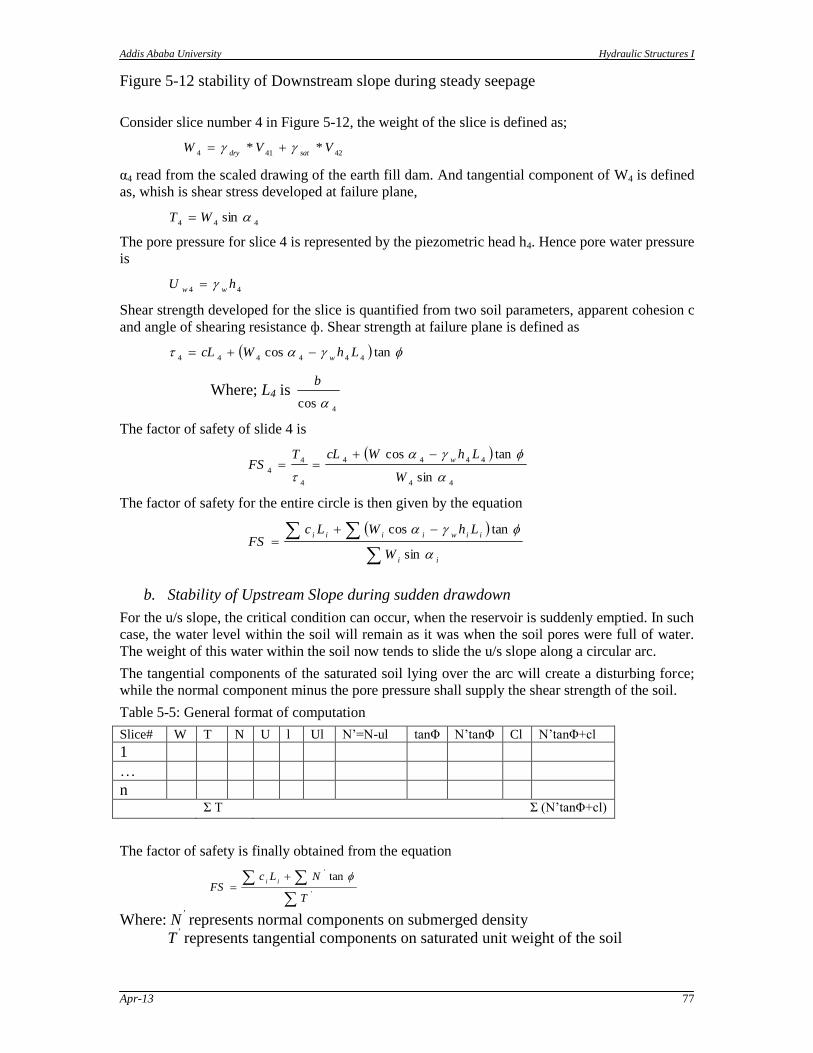
Addis Ababa University Hydraulic Structures I
Apr-13 77
Figure 5-12 stability of Downstream slope during steady seepage
Consider slice number 4 in Figure 5-12, the weight of the slice is defined as;
42414** VVW
satdry
α4 read from the scaled drawing of the earth fill dam. And tangential component of W4 is defined
as, whish is shear stress developed at failure plane,
444sin WT
The pore pressure for slice 4 is represented by the piezometric head h4. Hence pore water pressure
is
44hU
ww
Shear strength developed for the slice is quantified from two soil parameters, apparent cohesion c
and angle of shearing resistance ф. Shear strength at failure plane is defined as
tancos
444444LhWcL
w
Where; L4 is 4
cos
b
The factor of safety of slide 4 is
44
4444
4
4
4sin
tancos
W
LhWcLTFS
w
The factor of safety for the entire circle is then given by the equation
ii
iiwiiii
W
LhWLcFS
sin
tancos
b. Stability of Upstream Slope during sudden drawdown
For the u/s slope, the critical condition can occur, when the reservoir is suddenly emptied. In such
case, the water level within the soil will remain as it was when the soil pores were full of water.
The weight of this water within the soil now tends to slide the u/s slope along a circular arc.
The tangential components of the saturated soil lying over the arc will create a disturbing force;
while the normal component minus the pore pressure shall supply the shear strength of the soil.
Table 5-5: General format of computation
Slice# W T N U l Ul N‟=N-ul tanΦ N‟tanΦ Cl N‟tanΦ+cl
1
…
n
Σ T Σ (N‟tanΦ+cl)
The factor of safety is finally obtained from the equation
'
'tan
T
NLcFS
ii
Where: N’ represents normal components on submerged density
T’ represents tangential components on saturated unit weight of the soil
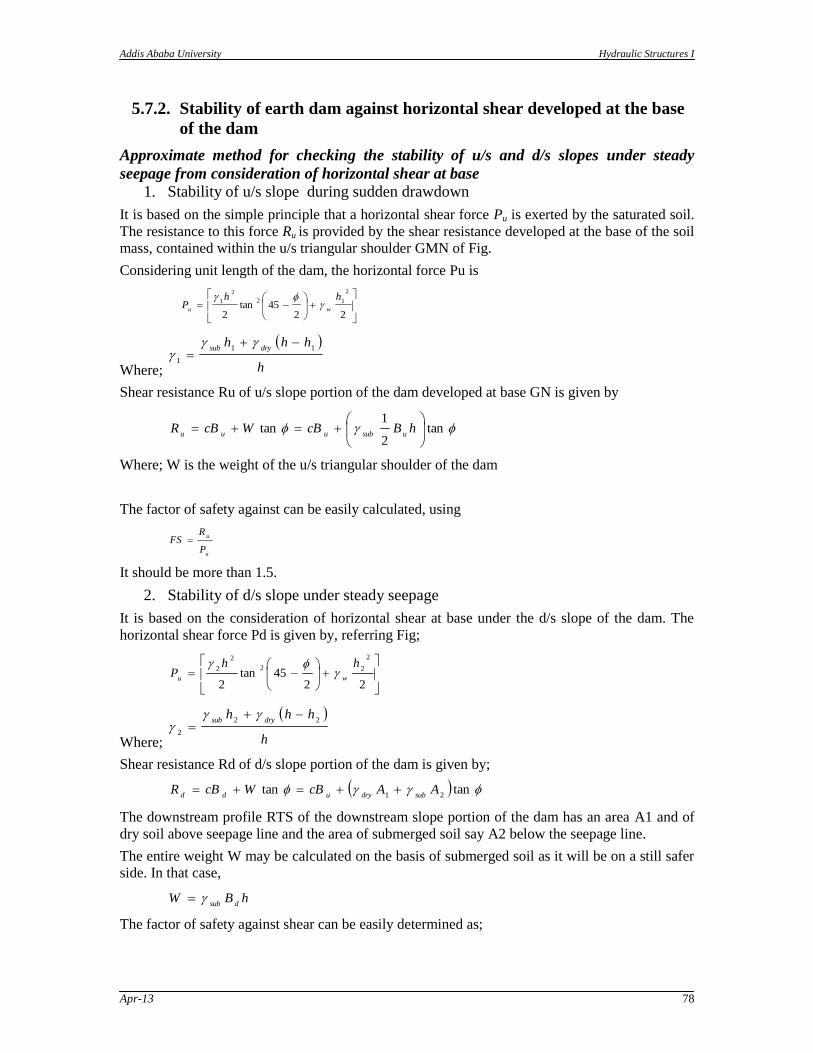
Addis Ababa University Hydraulic Structures I
Apr-13 78
5.7.2. Stability of earth dam against horizontal shear developed at the base
of the dam
Approximate method for checking the stability of u/s and d/s slopes under steady
seepage from consideration of horizontal shear at base
1. Stability of u/s slope during sudden drawdown
It is based on the simple principle that a horizontal shear force Pu is exerted by the saturated soil.
The resistance to this force Ru is provided by the shear resistance developed at the base of the soil
mass, contained within the u/s triangular shoulder GMN of Fig.
Considering unit length of the dam, the horizontal force Pu is
2245tan
2
2
12
2
1hh
Pwu
Where;
h
hhhdrysub 11
1
Shear resistance Ru of u/s slope portion of the dam developed at base GN is given by
tan2
1tan
hBcBWcBR
usubuuu
Where; W is the weight of the u/s triangular shoulder of the dam
The factor of safety against can be easily calculated, using
u
u
P
RFS
It should be more than 1.5.
2. Stability of d/s slope under steady seepage
It is based on the consideration of horizontal shear at base under the d/s slope of the dam. The
horizontal shear force Pd is given by, referring Fig;
2245tan
2
2
22
2
2hh
Pwu
Where;
h
hhhdrysub 22
2
Shear resistance Rd of d/s slope portion of the dam is given by;
tantan
21AAcBWcBR
subdryudd
The downstream profile RTS of the downstream slope portion of the dam has an area A1 and of
dry soil above seepage line and the area of submerged soil say A2 below the seepage line.
The entire weight W may be calculated on the basis of submerged soil as it will be on a still safer
side. In that case,
hBW
dsub
The factor of safety against shear can be easily determined as;
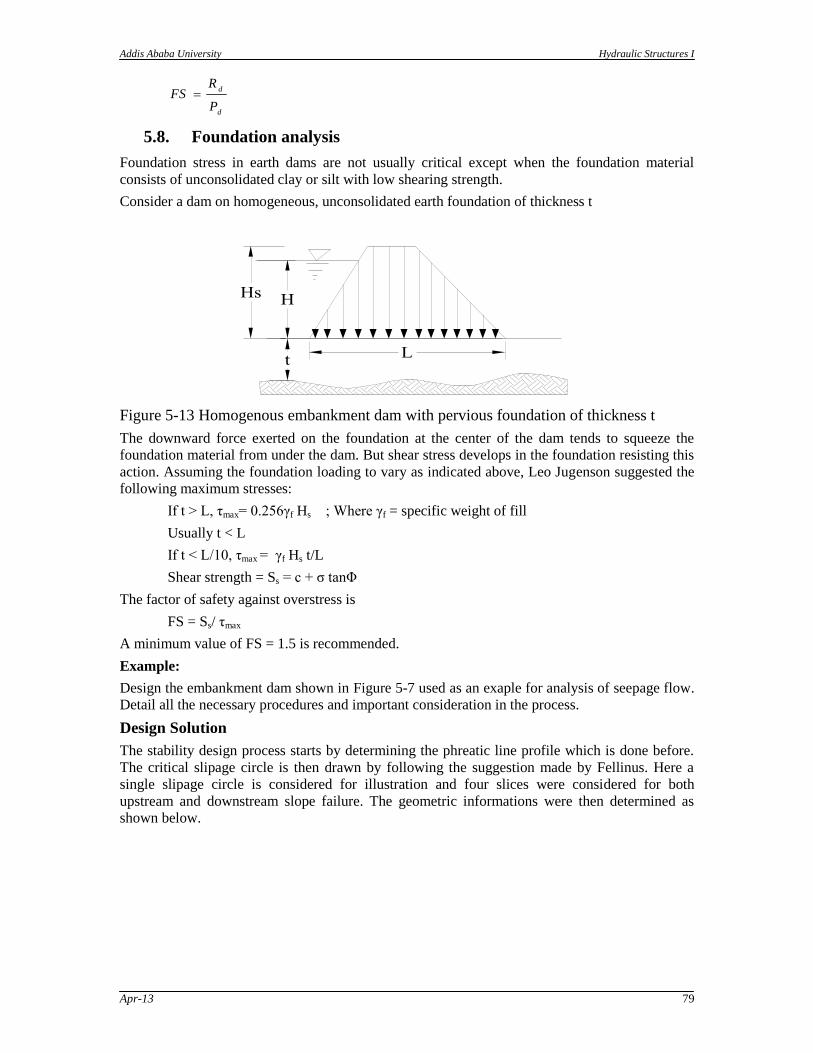
Addis Ababa University Hydraulic Structures I
Apr-13 79
d
d
P
RFS
5.8. Foundation analysis
Foundation stress in earth dams are not usually critical except when the foundation material
consists of unconsolidated clay or silt with low shearing strength.
Consider a dam on homogeneous, unconsolidated earth foundation of thickness t
Figure 5-13 Homogenous embankment dam with pervious foundation of thickness t
The downward force exerted on the foundation at the center of the dam tends to squeeze the
foundation material from under the dam. But shear stress develops in the foundation resisting this
action. Assuming the foundation loading to vary as indicated above, Leo Jugenson suggested the
following maximum stresses:
If t > L, τmax= 0.256γf Hs ; Where γf = specific weight of fill
Usually t < L
If t < L/10, τmax = γf Hs t/L
Shear strength = Ss = c + σ tanΦ
The factor of safety against overstress is
FS = Ss/ τmax
A minimum value of FS = 1.5 is recommended.
Example:
Design the embankment dam shown in Figure 5-7 used as an exaple for analysis of seepage flow.
Detail all the necessary procedures and important consideration in the process.
Design Solution
The stability design process starts by determining the phreatic line profile which is done before.
The critical slipage circle is then drawn by following the suggestion made by Fellinus. Here a
single slipage circle is considered for illustration and four slices were considered for both
upstream and downstream slope failure. The geometric informations were then determined as
shown below.
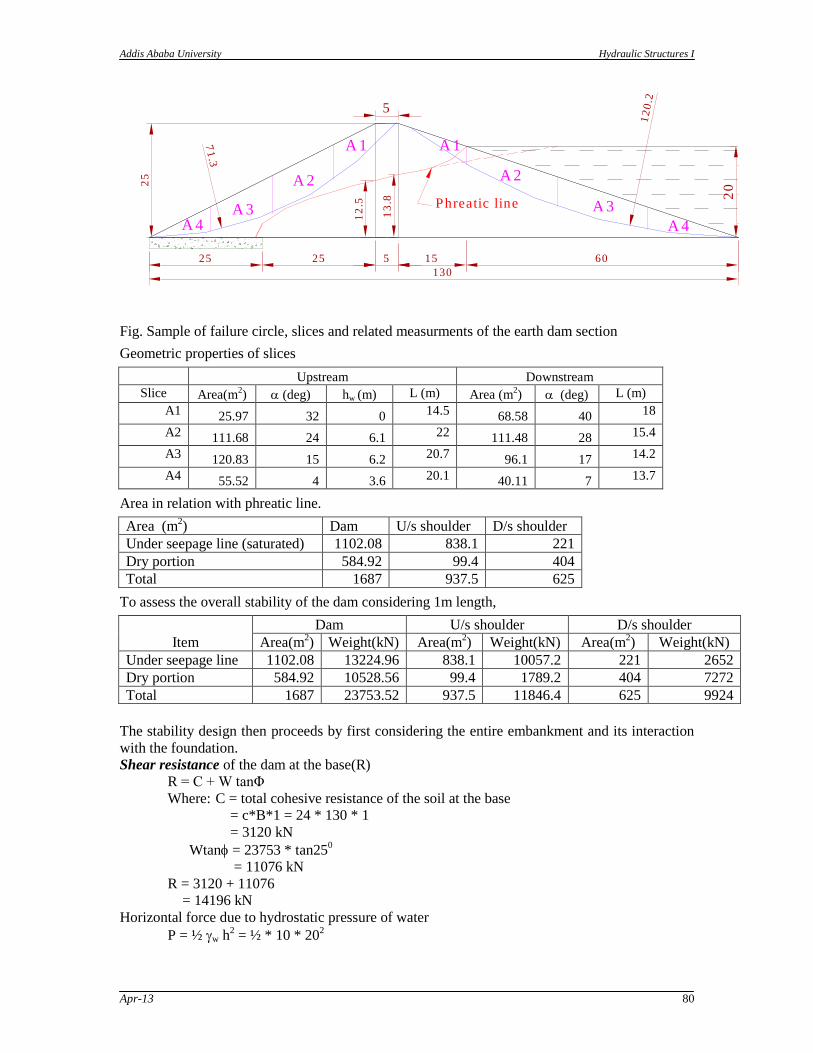
Addis Ababa University Hydraulic Structures I
Apr-13 80
13
.8
12
.5
A 1
A 2
A 3
A 4A 3
A 4
A 2
A 1
202
5
25 25 5 15 60
130
Phreatic line
5
12
0.2
71
.3
Fig. Sample of failure circle, slices and related measurments of the earth dam section
Geometric properties of slices
Upstream Downstream
Slice Area(m2) (deg) hw (m) L (m) Area (m
2) (deg) L (m)
A1 25.97 32 0 14.5 68.58 40 18
A2 111.68 24 6.1 22 111.48 28 15.4
A3 120.83 15 6.2 20.7 96.1 17 14.2
A4 55.52 4 3.6 20.1 40.11 7 13.7
Area in relation with phreatic line.
Area (m2) Dam U/s shoulder D/s shoulder
Under seepage line (saturated) 1102.08 838.1 221
Dry portion 584.92 99.4 404
Total 1687 937.5 625
To assess the overall stability of the dam considering 1m length,
Item
Dam U/s shoulder D/s shoulder
Area(m2) Weight(kN) Area(m
2) Weight(kN) Area(m
2) Weight(kN)
Under seepage line 1102.08 13224.96 838.1 10057.2 221 2652
Dry portion 584.92 10528.56 99.4 1789.2 404 7272
Total 1687 23753.52 937.5 11846.4 625 9924
The stability design then proceeds by first considering the entire embankment and its interaction
with the foundation.
Shear resistance of the dam at the base(R)
R = C + W tanΦ
Where: C = total cohesive resistance of the soil at the base
= c*B*1 = 24 * 130 * 1
= 3120 kN
Wtan = 23753 * tan250
= 11076 kN
R = 3120 + 11076
= 14196 kN
Horizontal force due to hydrostatic pressure of water
P = ½ w h2 = ½ * 10 * 20
2
Addis Ababa University Hydraulic Structures I
Apr-13 81
= 2000kN
Factor of safety against failure due to horizontal shear at the base
FS = R/P = 7.1 > 1.5 Safe!
Check stresses in the foundation
t = 8m < L/10 = 130/10 =13,
Hence,
τmax= γf Hs t/L
= 18.3 * 20* 8/130
= 22.52kN/m2
Shear strength = Ss = c + σ tanΦ
= c + W/L tan
= 54 + 23754/130 * tan 120
= 92.8 kN/m2
The factor of safety against overstress is
FS = Ss/ τmax = 92.8/22.52 = 4.12 > 1.5 Safe!
Stability of u/s and d/s slopes against sliding shear.
Upstream slope (under sudden drawdown):
Considering unit length of the dam, the horizontal force Pu is
7.14
25
8.1325188.13*12
11
1
h
hhhdrysub
6.2816
2
8.1310
2
2545tan
2
25*7.14
2245tan
2
2
2
2
2
12
2
1
hhP
wu
Shear resistance Ru of upstream slope portion of the dam developed at base GN is given by,
1.957447.0*4.1184675*54tan WcBRuu
Where; W is the weight of the upstream triangular shoulder of the dam.
The factor of safety against shear can be easily calculated,
5.14.36.2816
1.9574
u
u
P
RFS Safe!
It has been known that the maximum intensity of shear stress occurs at a distance 0.6Bu (where Bu
is the base length of the upstream shoulder) from the heel and is equal to 1.4 times the average
shear intensity.
Hence, maximum shear stress induced (τmax) = 1.4(Pu/Bu)
= 1.4 (2816.6/75)
= 52.6
The unit shear resistance developed at the same point is
τf = c + 0.6hsubtan
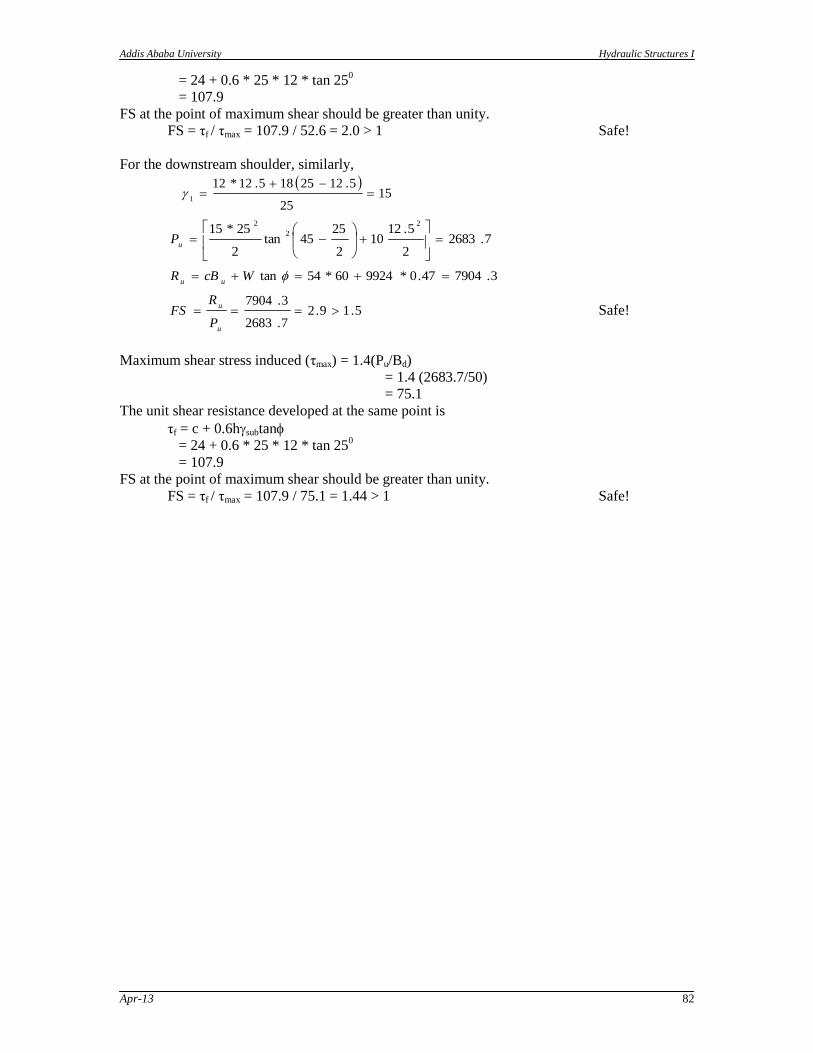
Addis Ababa University Hydraulic Structures I
Apr-13 82
= 24 + 0.6 * 25 * 12 * tan 250
= 107.9
FS at the point of maximum shear should be greater than unity.
FS = τf / τmax = 107.9 / 52.6 = 2.0 > 1 Safe!
For the downstream shoulder, similarly,
15
25
5.1225185.12*121
7.26832
5.1210
2
2545tan
2
25*152
2
2
uP
3.790447.0*992460*54tan WcBRuu
5.19.27.2683
3.7904
u
u
P
RFS Safe!
Maximum shear stress induced (τmax) = 1.4(Pu/Bd)
= 1.4 (2683.7/50)
= 75.1
The unit shear resistance developed at the same point is
τf = c + 0.6hsubtan
= 24 + 0.6 * 25 * 12 * tan 250
= 107.9
FS at the point of maximum shear should be greater than unity.
FS = τf / τmax = 107.9 / 75.1 = 1.44 > 1 Safe!
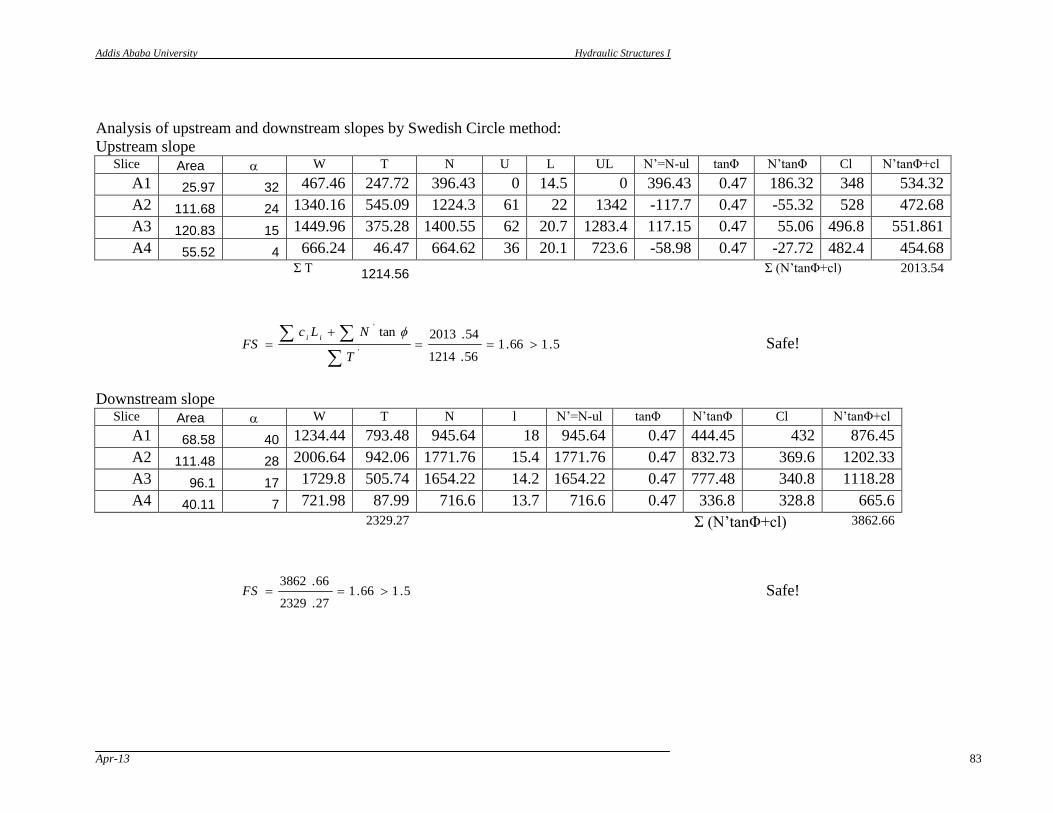
Addis Ababa University Hydraulic Structures I
Apr-13 83
Analysis of upstream and downstream slopes by Swedish Circle method:
Upstream slope Slice Area W T N U L UL N‟=N-ul tanΦ N‟tanΦ Cl N‟tanΦ+cl
A1 25.97 32 467.46 247.72 396.43 0 14.5 0 396.43 0.47 186.32 348 534.32
A2 111.68 24 1340.16 545.09 1224.3 61 22 1342 -117.7 0.47 -55.32 528 472.68
A3 120.83 15 1449.96 375.28 1400.55 62 20.7 1283.4 117.15 0.47 55.06 496.8 551.861
A4 55.52 4 666.24 46.47 664.62 36 20.1 723.6 -58.98 0.47 -27.72 482.4 454.68
Σ T 1214.56 Σ (N‟tanΦ+cl) 2013.54
5.166.156.1214
54.2013tan
'
'
T
NLcFS
ii
Safe!
Downstream slope Slice Area W T N l N‟=N-ul tanΦ N‟tanΦ Cl N‟tanΦ+cl
A1 68.58 40 1234.44 793.48 945.64 18 945.64 0.47 444.45 432 876.45
A2 111.48 28 2006.64 942.06 1771.76 15.4 1771.76 0.47 832.73 369.6 1202.33
A3 96.1 17 1729.8 505.74 1654.22 14.2 1654.22 0.47 777.48 340.8 1118.28
A4 40.11 7 721.98 87.99 716.6 13.7 716.6 0.47 336.8 328.8 665.6
2329.27 Σ (N‟tanΦ+cl) 3862.66
5.166.127.2329
66.3862FS Safe!

Addis Ababa University Hydraulic Structures I
Apr-13 84
5.9. Internal drainage system
General
Purpose of drainage:
1. To reduce the pore pressure thereby increasing the stability of the dam
2. To prevent piping so that soil particles are not carried away from the embankment.
A drainage system consists of two components.
a. the protective filter
b. the conduit which collects and disposes of the seepage.
Protective filter: - serves to allow free drainage and to prevent erosion.
It is provided between
Riprap and embankment
Core and embankment
Embankment and drains
Experiments by Terzaghi, Bertram and others have shown that a filter need only hold the coarse
15% of the grain size. These coarse particles D85 and over, will collect over the filter opening
bridging over it and trapping finer particles.
Size of filter holes, Df D85 ( of the soil being filtered)
From tests, the following criteria are established.
D15 (filter) 4 to 5 D85 (soil); to satisfy prevention of migration of soil particles.
D15 (filter) 4 to 5 D15 (soil); for free drainage.
Filter gradation curve should be smooth and parallel to the soil being filtered. When the soil is
gap graded recompute and re-plot the grain size distribution using only the fraction finer than the
break as representing the entire soil; apply the filter criteria to this distribution
Filter thickness:
Thin filter is desirable to minimize flow resistance. Practical considerations, however, put
minimum sizes as shown in Table 5-6.
Table 5-6: Representative mean filter thickness
Filter Thickness for given head, cm
0 – 25 m 25 – 50 m 50 – 100 m
Fine sand 15 30 45
Coarse sand 25.5 45 60
Gravel 30 60 75
For every fine grained soil a multiple layered filter is necessary. Each successive layer is designed
to fit the D15 and D85 of the finer layer it must filter. The last layer must fit the openings of the
drain conduit which carries the water away.

Addis Ababa University Hydraulic Structures I
Apr-13 85
Example:
Determine the size of the bed material for the embankment dam with the grain size shown below.
Grain size Riprap Dam
D15 70 mm 0.3 mm
D85 130 mm 2.0 mm
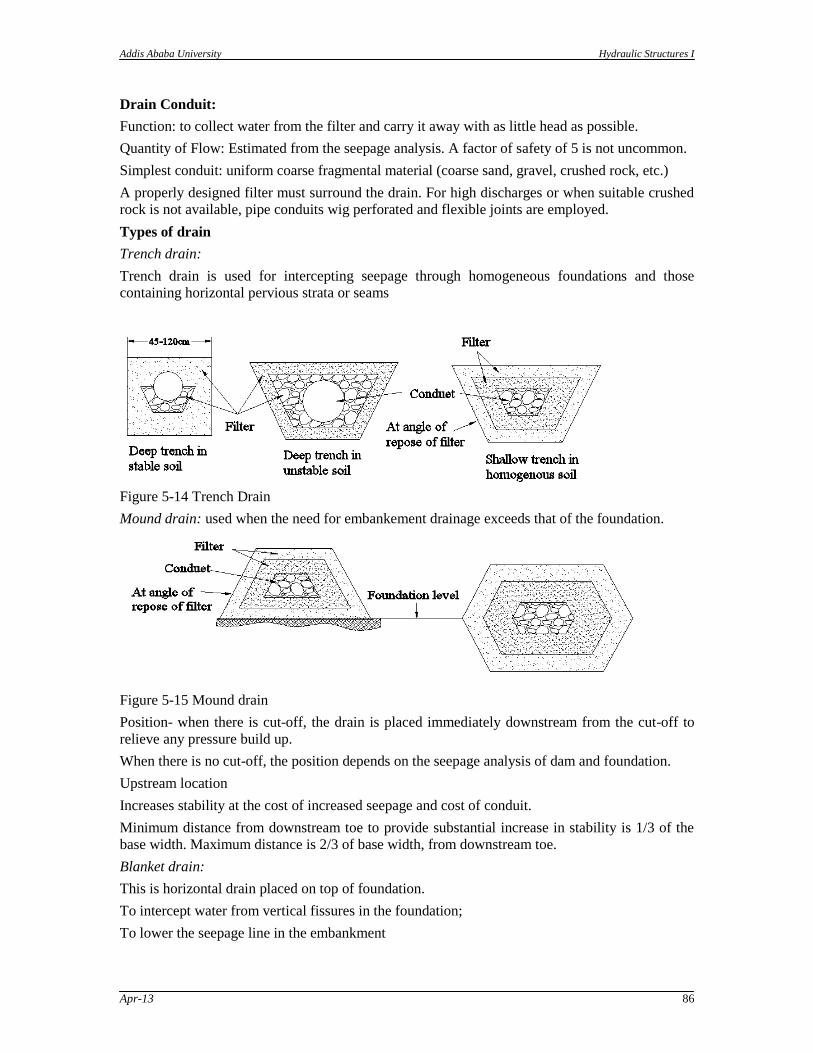
Addis Ababa University Hydraulic Structures I
Apr-13 86
Drain Conduit:
Function: to collect water from the filter and carry it away with as little head as possible.
Quantity of Flow: Estimated from the seepage analysis. A factor of safety of 5 is not uncommon.
Simplest conduit: uniform coarse fragmental material (coarse sand, gravel, crushed rock, etc.)
A properly designed filter must surround the drain. For high discharges or when suitable crushed
rock is not available, pipe conduits wig perforated and flexible joints are employed.
Types of drain
Trench drain:
Trench drain is used for intercepting seepage through homogeneous foundations and those
containing horizontal pervious strata or seams
Figure 5-14 Trench Drain
Mound drain: used when the need for embankement drainage exceeds that of the foundation.
Figure 5-15 Mound drain
Position- when there is cut-off, the drain is placed immediately downstream from the cut-off to
relieve any pressure build up.
When there is no cut-off, the position depends on the seepage analysis of dam and foundation.
Upstream location
Increases stability at the cost of increased seepage and cost of conduit.
Minimum distance from downstream toe to provide substantial increase in stability is 1/3 of the
base width. Maximum distance is 2/3 of base width, from downstream toe.
Blanket drain:
This is horizontal drain placed on top of foundation.
To intercept water from vertical fissures in the foundation;
To lower the seepage line in the embankment
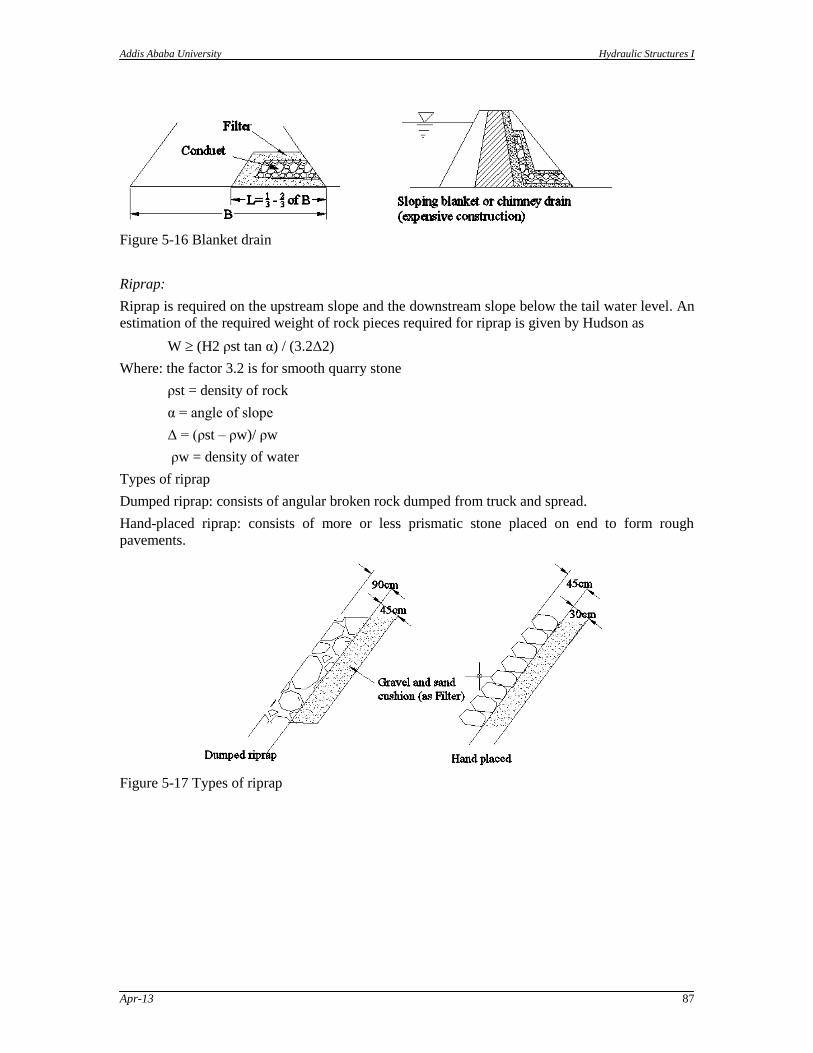
Addis Ababa University Hydraulic Structures I
Apr-13 87
Figure 5-16 Blanket drain
Riprap:
Riprap is required on the upstream slope and the downstream slope below the tail water level. An
estimation of the required weight of rock pieces required for riprap is given by Hudson as
W (H2 ρst tan α) / (3.2Δ2)
Where: the factor 3.2 is for smooth quarry stone
ρst = density of rock
α = angle of slope
Δ = (ρst – ρw)/ ρw
ρw = density of water
Types of riprap
Dumped riprap: consists of angular broken rock dumped from truck and spread.
Hand-placed riprap: consists of more or less prismatic stone placed on end to form rough
pavements.
Figure 5-17 Types of riprap
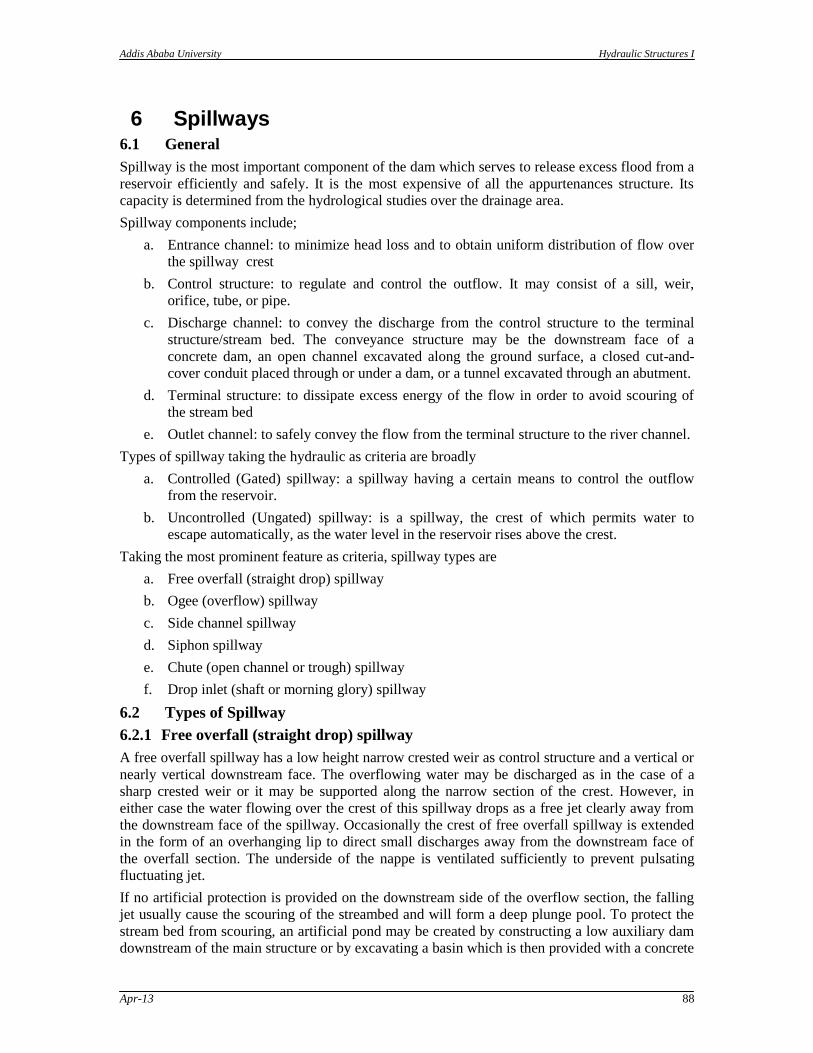
Addis Ababa University Hydraulic Structures I
Apr-13 88
6 Spillways 6.1 General
Spillway is the most important component of the dam which serves to release excess flood from a
reservoir efficiently and safely. It is the most expensive of all the appurtenances structure. Its
capacity is determined from the hydrological studies over the drainage area.
Spillway components include;
a. Entrance channel: to minimize head loss and to obtain uniform distribution of flow over
the spillway crest
b. Control structure: to regulate and control the outflow. It may consist of a sill, weir,
orifice, tube, or pipe.
c. Discharge channel: to convey the discharge from the control structure to the terminal
structure/stream bed. The conveyance structure may be the downstream face of a
concrete dam, an open channel excavated along the ground surface, a closed cut-and-
cover conduit placed through or under a dam, or a tunnel excavated through an abutment.
d. Terminal structure: to dissipate excess energy of the flow in order to avoid scouring of
the stream bed
e. Outlet channel: to safely convey the flow from the terminal structure to the river channel.
Types of spillway taking the hydraulic as criteria are broadly
a. Controlled (Gated) spillway: a spillway having a certain means to control the outflow
from the reservoir.
b. Uncontrolled (Ungated) spillway: is a spillway, the crest of which permits water to
escape automatically, as the water level in the reservoir rises above the crest.
Taking the most prominent feature as criteria, spillway types are
a. Free overfall (straight drop) spillway
b. Ogee (overflow) spillway
c. Side channel spillway
d. Siphon spillway
e. Chute (open channel or trough) spillway
f. Drop inlet (shaft or morning glory) spillway
6.2 Types of Spillway
6.2.1 Free overfall (straight drop) spillway
A free overfall spillway has a low height narrow crested weir as control structure and a vertical or
nearly vertical downstream face. The overflowing water may be discharged as in the case of a
sharp crested weir or it may be supported along the narrow section of the crest. However, in
either case the water flowing over the crest of this spillway drops as a free jet clearly away from
the downstream face of the spillway. Occasionally the crest of free overfall spillway is extended
in the form of an overhanging lip to direct small discharges away from the downstream face of
the overfall section. The underside of the nappe is ventilated sufficiently to prevent pulsating
fluctuating jet.
If no artificial protection is provided on the downstream side of the overflow section, the falling
jet usually cause the scouring of the streambed and will form a deep plunge pool. To protect the
stream bed from scouring, an artificial pond may be created by constructing a low auxiliary dam
downstream of the main structure or by excavating a basin which is then provided with a concrete
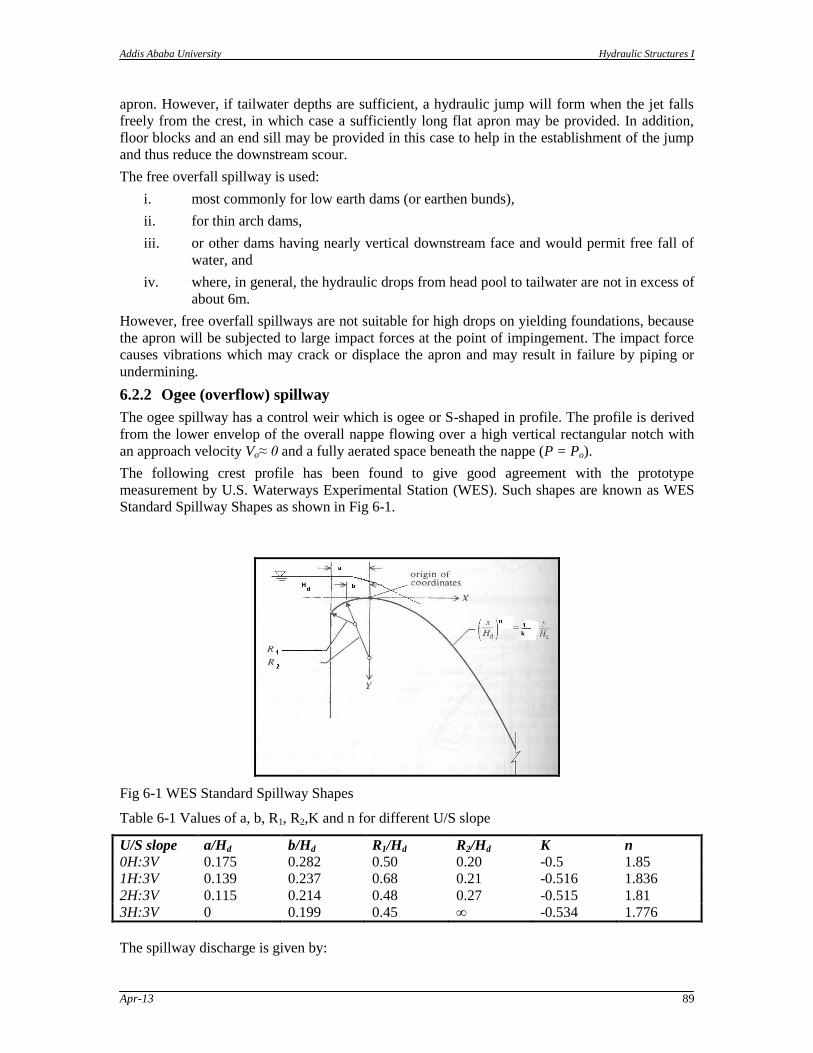
Addis Ababa University Hydraulic Structures I
Apr-13 89
apron. However, if tailwater depths are sufficient, a hydraulic jump will form when the jet falls
freely from the crest, in which case a sufficiently long flat apron may be provided. In addition,
floor blocks and an end sill may be provided in this case to help in the establishment of the jump
and thus reduce the downstream scour.
The free overfall spillway is used:
i. most commonly for low earth dams (or earthen bunds),
ii. for thin arch dams,
iii. or other dams having nearly vertical downstream face and would permit free fall of
water, and
iv. where, in general, the hydraulic drops from head pool to tailwater are not in excess of
about 6m.
However, free overfall spillways are not suitable for high drops on yielding foundations, because
the apron will be subjected to large impact forces at the point of impingement. The impact force
causes vibrations which may crack or displace the apron and may result in failure by piping or
undermining.
6.2.2 Ogee (overflow) spillway
The ogee spillway has a control weir which is ogee or S-shaped in profile. The profile is derived
from the lower envelop of the overall nappe flowing over a high vertical rectangular notch with
an approach velocity Vo≈ 0 and a fully aerated space beneath the nappe (P = Po).
The following crest profile has been found to give good agreement with the prototype
measurement by U.S. Waterways Experimental Station (WES). Such shapes are known as WES
Standard Spillway Shapes as shown in Fig 6-1.
Fig 6-1 WES Standard Spillway Shapes
Table 6-1 Values of a, b, R1, R2,K and n for different U/S slope
U/S slope a/Hd b/Hd R1/Hd R2/Hd K n
0H:3V 0.175 0.282 0.50 0.20 -0.5 1.85
1H:3V 0.139 0.237 0.68 0.21 -0.516 1.836
2H:3V 0.115 0.214 0.48 0.27 -0.515 1.81
3H:3V 0 0.199 0.45 ∞ -0.534 1.776
The spillway discharge is given by:
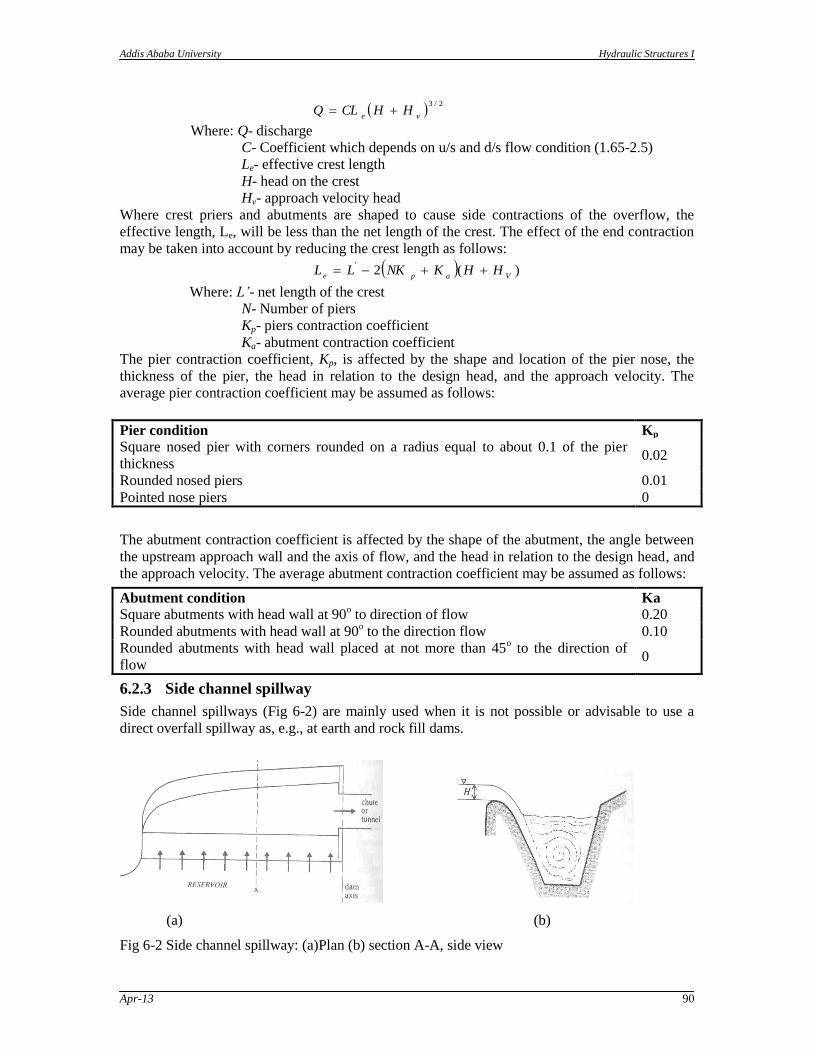
Addis Ababa University Hydraulic Structures I
Apr-13 90
2/3
veHHCLQ
Where: Q- discharge
C- Coefficient which depends on u/s and d/s flow condition (1.65-2.5)
Le- effective crest length
H- head on the crest
Hv- approach velocity head
Where crest priers and abutments are shaped to cause side contractions of the overflow, the
effective length, Le, will be less than the net length of the crest. The effect of the end contraction
may be taken into account by reducing the crest length as follows:
)(2'
VapeHHKNKLL
Where: L’- net length of the crest
N- Number of piers
Kp- piers contraction coefficient
Ka- abutment contraction coefficient
The pier contraction coefficient, Kp, is affected by the shape and location of the pier nose, the
thickness of the pier, the head in relation to the design head, and the approach velocity. The
average pier contraction coefficient may be assumed as follows:
Pier condition Kp
Square nosed pier with corners rounded on a radius equal to about 0.1 of the pier
thickness 0.02
Rounded nosed piers 0.01
Pointed nose piers 0
The abutment contraction coefficient is affected by the shape of the abutment, the angle between
the upstream approach wall and the axis of flow, and the head in relation to the design head, and
the approach velocity. The average abutment contraction coefficient may be assumed as follows:
Abutment condition Ka
Square abutments with head wall at 90o to direction of flow 0.20
Rounded abutments with head wall at 90o to the direction flow 0.10
Rounded abutments with head wall placed at not more than 45o to the direction of
flow 0
6.2.3 Side channel spillway
Side channel spillways (Fig 6-2) are mainly used when it is not possible or advisable to use a
direct overfall spillway as, e.g., at earth and rock fill dams.
(a) (b)
Fig 6-2 Side channel spillway: (a)Plan (b) section A-A, side view
Addis Ababa University Hydraulic Structures I
Apr-13 91
They are placed on the side of the dam and have a spillway proper, the flume (channel)
downstream of the spillway, followed by the chute or tunnel. The spillway proper is usually
designed as a normal overfall spillway. The depth, width, and bed slope of the flume must be
designed in such a way that even the maximum flood discharge passes with a free overfall over
the entire horizontal spillway crest, so that the reservoir level is not influenced by the flow in the
channel. The width of the flume may therefore increases in the direction of the flow. From the
energy dissipation point of view, the deeper the channel and the steeper the side facing the
spillway, the better; on the other hand , this shape is in most cases more expensive to construct
than a shallow wide channel with a gently sloping side.
6.2.4 Siphon spillway
Siphon spillways (Fig 6-3) are closed conduits in the form of an inverted U with an inlet, short
upper leg, throat (control section), lower leg, and outlet.
Fig 6-3 siphon pipe installed within the gravity dam
For very low flows a siphon spillway operates as a weir; as the flow increases, the upstream water
level rises, the velocity in the siphon increases, and the flow in the lower leg begins to exhaust air
from the top of the siphon until this primes and begins to flow full as a pipe, with the discharge
given by
2/12 gHACQ
d
Where: A is the (throat) cross-section of the siphon, H is the difference between the upstream
water level and siphon outlet or downstream water level if the outlet is submerged and
2/1
4321)/(1 KKKKC
d
Where: K1, K2, K3, and K4 are head loss coefficients for the entry, bend, exit, and friction losses
in the siphon.
6.2.5 Chute spillway
A chute spillway is a steep channel conveying the discharge from a low overfall, side channel, or
special shape spillway over the valley side into the river downstream.
For earthen and rock fill dams, a separate spillway is generally constructed in a flank or a saddle,
away from the main valley. Sometimes, even for gravity dams, a separate spillway is required
because of the narrowness of the main valley. In all such circumstances, a separate spillway like
chute could be provided.
A chute spillway essentially consists of a steeply sloping open channel, placed along a dam
abutment or through a flank or a saddle. It leads the water from the reservoir to the downstream
channel below.
The entire channel spillway can hence be divided into the following parts:
I. Entrance channel
II. Control structure (Low Ogee weir)
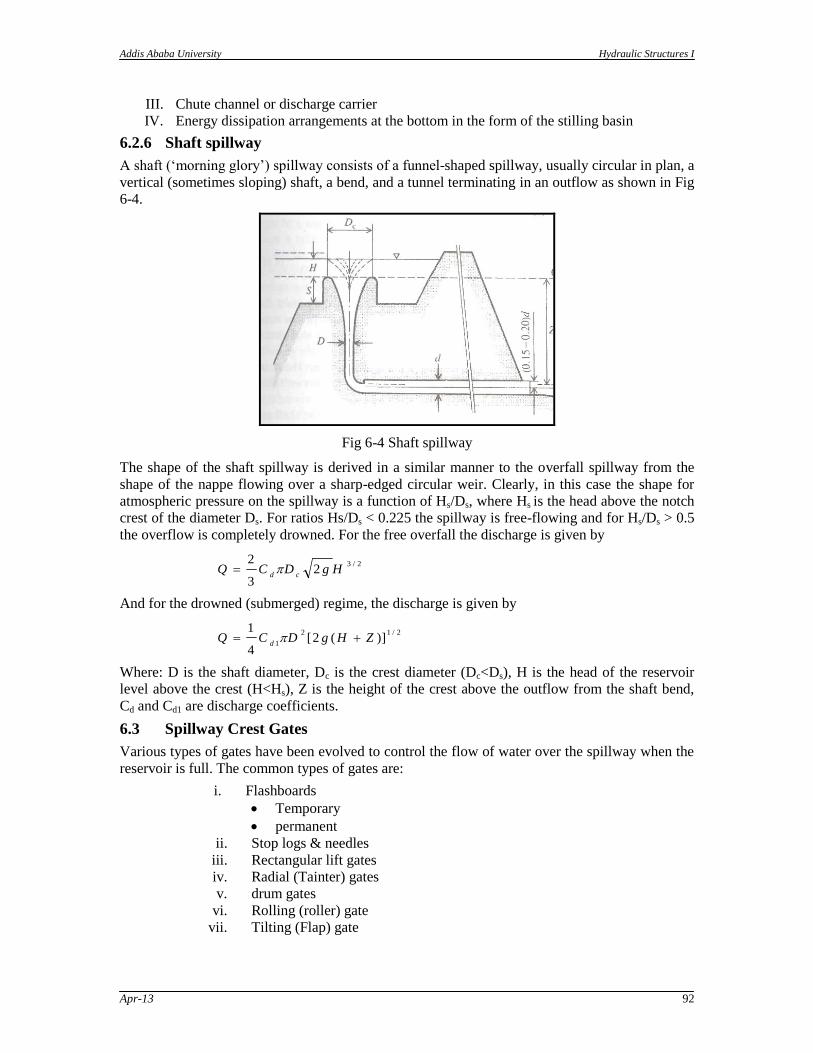
Addis Ababa University Hydraulic Structures I
Apr-13 92
III. Chute channel or discharge carrier
IV. Energy dissipation arrangements at the bottom in the form of the stilling basin
6.2.6 Shaft spillway
A shaft („morning glory‟) spillway consists of a funnel-shaped spillway, usually circular in plan, a
vertical (sometimes sloping) shaft, a bend, and a tunnel terminating in an outflow as shown in Fig
6-4.
Fig 6-4 Shaft spillway
The shape of the shaft spillway is derived in a similar manner to the overfall spillway from the
shape of the nappe flowing over a sharp-edged circular weir. Clearly, in this case the shape for
atmospheric pressure on the spillway is a function of Hs/Ds, where Hs is the head above the notch
crest of the diameter Ds. For ratios Hs/Ds < 0.225 the spillway is free-flowing and for Hs/Ds > 0.5
the overflow is completely drowned. For the free overfall the discharge is given by
2/32
3
2HgDCQ
cd
And for the drowned (submerged) regime, the discharge is given by
2/12
1)](2[
4
1ZHgDCQ
d
Where: D is the shaft diameter, Dc is the crest diameter (Dc<Ds), H is the head of the reservoir
level above the crest (H<Hs), Z is the height of the crest above the outflow from the shaft bend,
Cd and Cd1 are discharge coefficients.
6.3 Spillway Crest Gates
Various types of gates have been evolved to control the flow of water over the spillway when the
reservoir is full. The common types of gates are:
i. Flashboards
Temporary
permanent
ii. Stop logs & needles
iii. Rectangular lift gates
iv. Radial (Tainter) gates
v. drum gates
vi. Rolling (roller) gate
vii. Tilting (Flap) gate
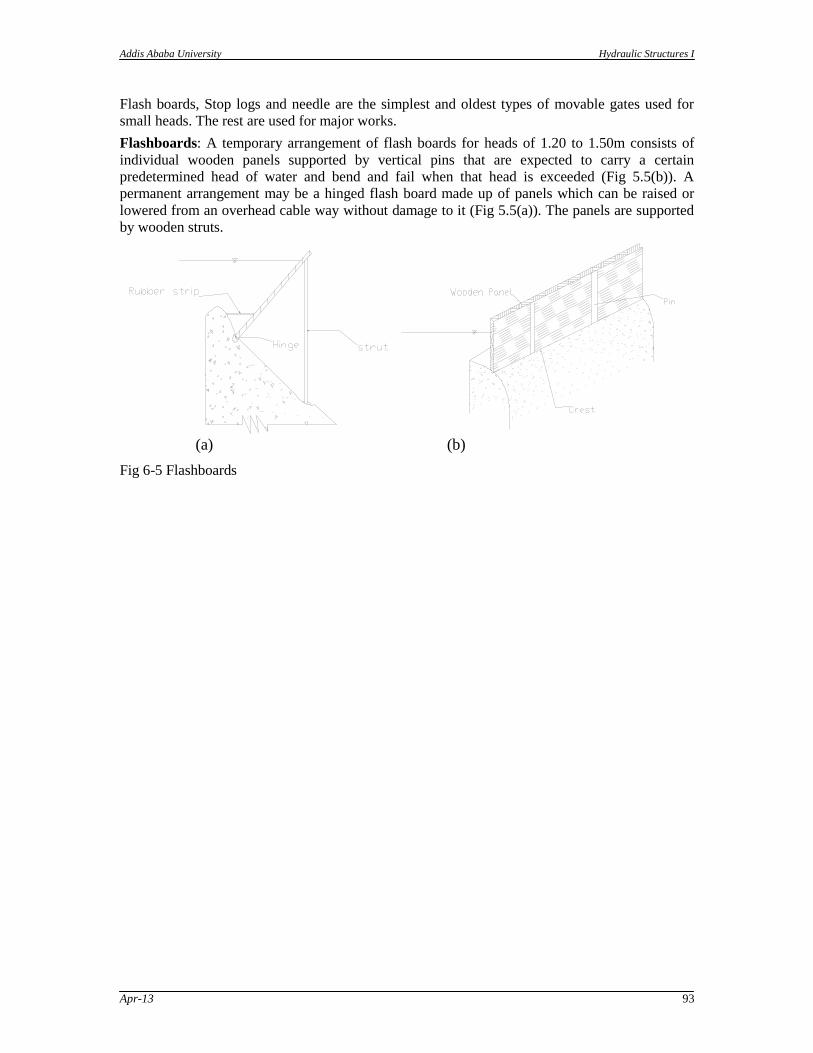
Addis Ababa University Hydraulic Structures I
Apr-13 93
Flash boards, Stop logs and needle are the simplest and oldest types of movable gates used for
small heads. The rest are used for major works.
Flashboards: A temporary arrangement of flash boards for heads of 1.20 to 1.50m consists of
individual wooden panels supported by vertical pins that are expected to carry a certain
predetermined head of water and bend and fail when that head is exceeded (Fig 5.5(b)). A
permanent arrangement may be a hinged flash board made up of panels which can be raised or
lowered from an overhead cable way without damage to it (Fig 5.5(a)). The panels are supported
by wooden struts.
(a) (b)
Fig 6-5 Flashboards
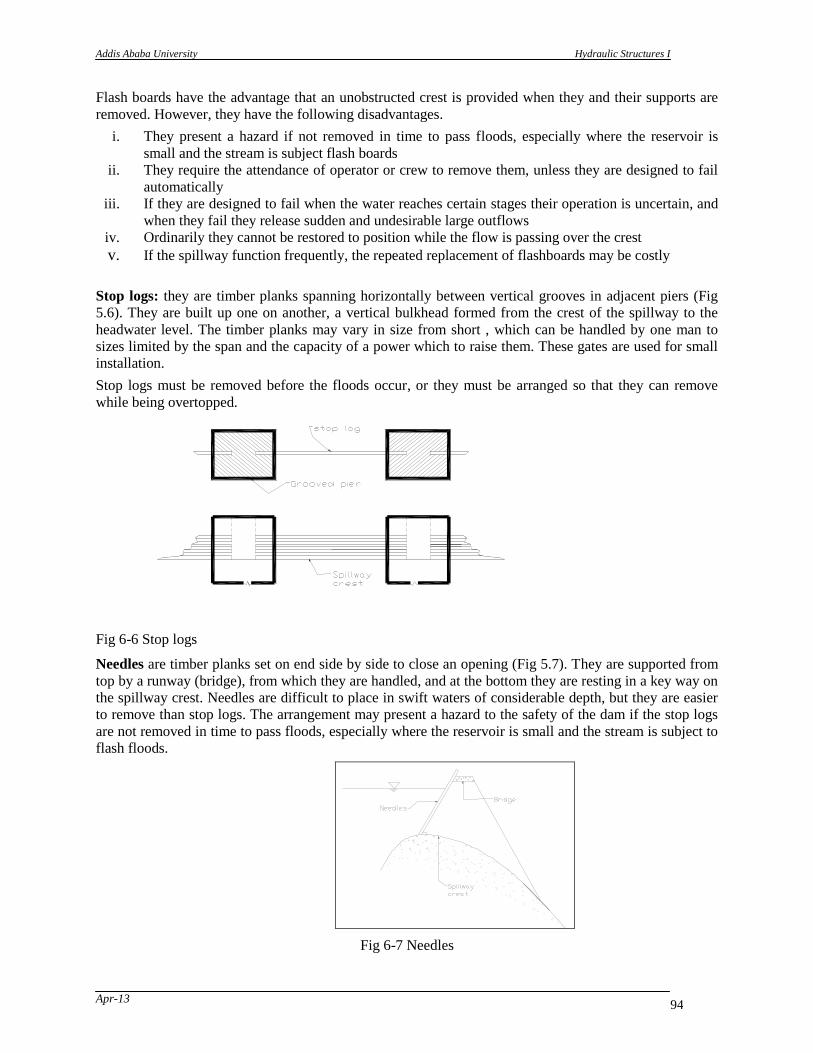
Addis Ababa University Hydraulic Structures I
Apr-13 94
Flash boards have the advantage that an unobstructed crest is provided when they and their supports are
removed. However, they have the following disadvantages.
i. They present a hazard if not removed in time to pass floods, especially where the reservoir is
small and the stream is subject flash boards
ii. They require the attendance of operator or crew to remove them, unless they are designed to fail
automatically
iii. If they are designed to fail when the water reaches certain stages their operation is uncertain, and
when they fail they release sudden and undesirable large outflows
iv. Ordinarily they cannot be restored to position while the flow is passing over the crest
v. If the spillway function frequently, the repeated replacement of flashboards may be costly
Stop logs: they are timber planks spanning horizontally between vertical grooves in adjacent piers (Fig
5.6). They are built up one on another, a vertical bulkhead formed from the crest of the spillway to the
headwater level. The timber planks may vary in size from short , which can be handled by one man to
sizes limited by the span and the capacity of a power which to raise them. These gates are used for small
installation.
Stop logs must be removed before the floods occur, or they must be arranged so that they can remove
while being overtopped.
Fig 6-6 Stop logs
Needles are timber planks set on end side by side to close an opening (Fig 5.7). They are supported from
top by a runway (bridge), from which they are handled, and at the bottom they are resting in a key way on
the spillway crest. Needles are difficult to place in swift waters of considerable depth, but they are easier
to remove than stop logs. The arrangement may present a hazard to the safety of the dam if the stop logs
are not removed in time to pass floods, especially where the reservoir is small and the stream is subject to
flash floods.
Fig 6-7 Needles
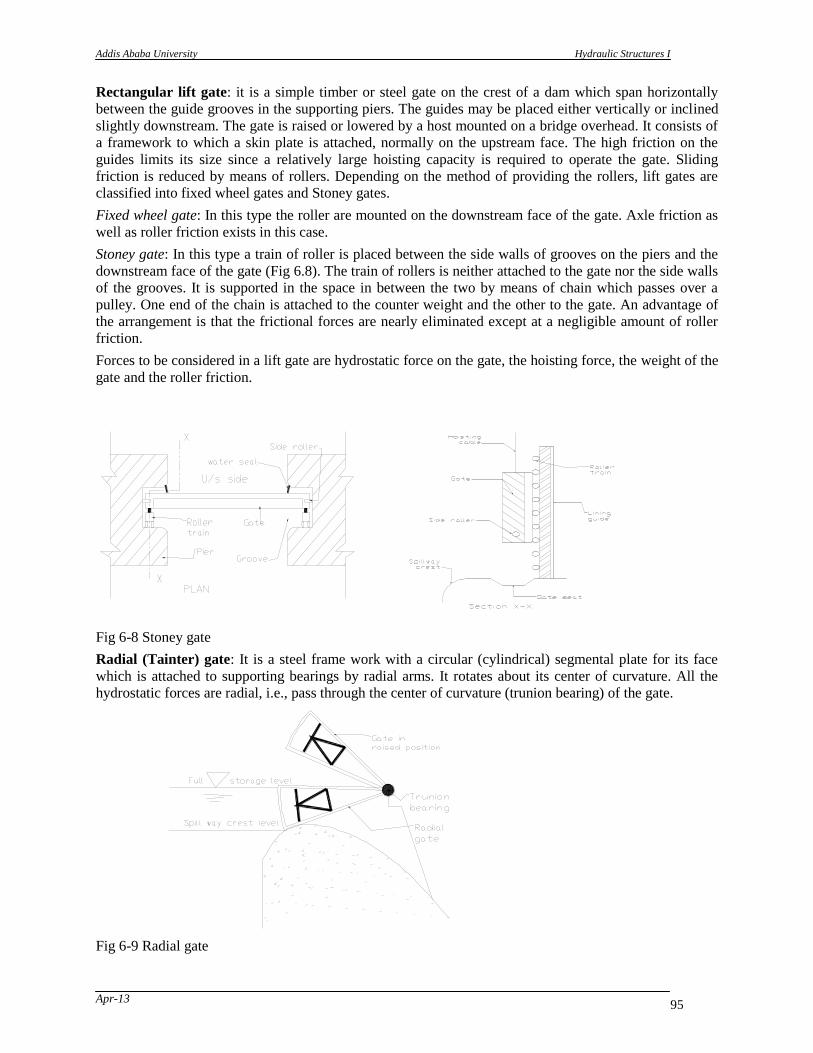
Addis Ababa University Hydraulic Structures I
Apr-13 95
Rectangular lift gate: it is a simple timber or steel gate on the crest of a dam which span horizontally
between the guide grooves in the supporting piers. The guides may be placed either vertically or inclined
slightly downstream. The gate is raised or lowered by a host mounted on a bridge overhead. It consists of
a framework to which a skin plate is attached, normally on the upstream face. The high friction on the
guides limits its size since a relatively large hoisting capacity is required to operate the gate. Sliding
friction is reduced by means of rollers. Depending on the method of providing the rollers, lift gates are
classified into fixed wheel gates and Stoney gates.
Fixed wheel gate: In this type the roller are mounted on the downstream face of the gate. Axle friction as
well as roller friction exists in this case.
Stoney gate: In this type a train of roller is placed between the side walls of grooves on the piers and the
downstream face of the gate (Fig 6.8). The train of rollers is neither attached to the gate nor the side walls
of the grooves. It is supported in the space in between the two by means of chain which passes over a
pulley. One end of the chain is attached to the counter weight and the other to the gate. An advantage of
the arrangement is that the frictional forces are nearly eliminated except at a negligible amount of roller
friction.
Forces to be considered in a lift gate are hydrostatic force on the gate, the hoisting force, the weight of the
gate and the roller friction.
Fig 6-8 Stoney gate
Radial (Tainter) gate: It is a steel frame work with a circular (cylindrical) segmental plate for its face
which is attached to supporting bearings by radial arms. It rotates about its center of curvature. All the
hydrostatic forces are radial, i.e., pass through the center of curvature (trunion bearing) of the gate.
Fig 6-9 Radial gate
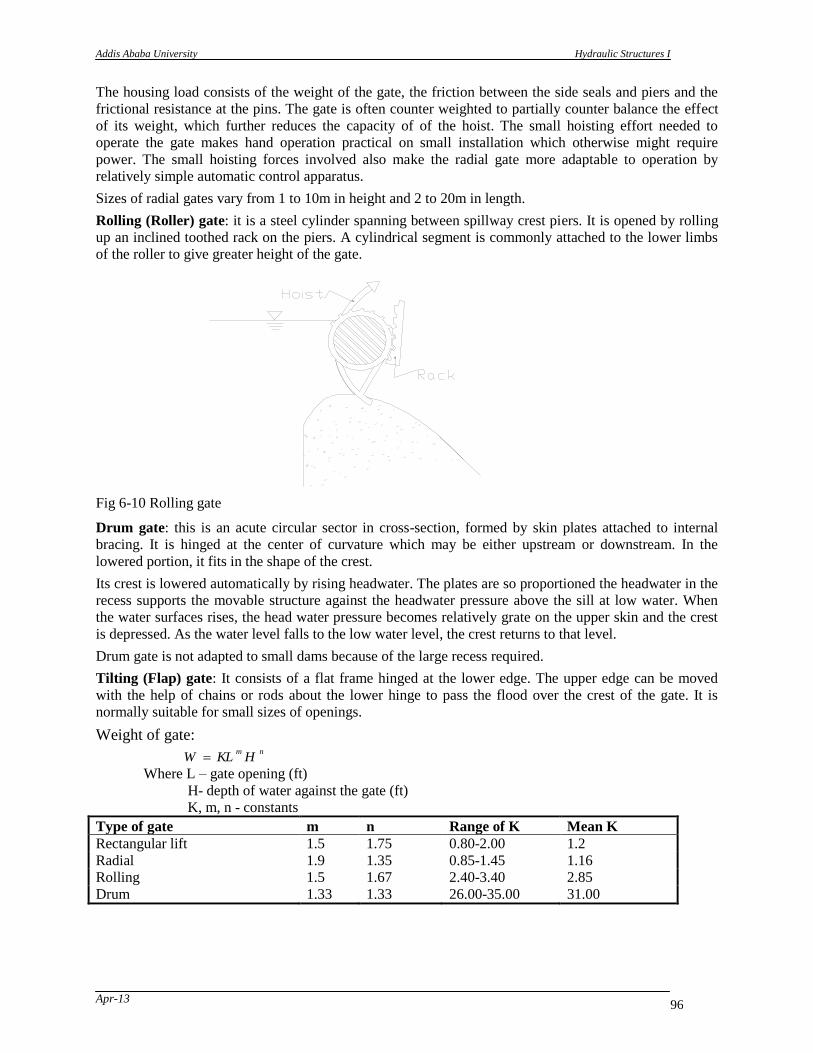
Addis Ababa University Hydraulic Structures I
Apr-13 96
The housing load consists of the weight of the gate, the friction between the side seals and piers and the
frictional resistance at the pins. The gate is often counter weighted to partially counter balance the effect
of its weight, which further reduces the capacity of of the hoist. The small hoisting effort needed to
operate the gate makes hand operation practical on small installation which otherwise might require
power. The small hoisting forces involved also make the radial gate more adaptable to operation by
relatively simple automatic control apparatus.
Sizes of radial gates vary from 1 to 10m in height and 2 to 20m in length.
Rolling (Roller) gate: it is a steel cylinder spanning between spillway crest piers. It is opened by rolling
up an inclined toothed rack on the piers. A cylindrical segment is commonly attached to the lower limbs
of the roller to give greater height of the gate.
Fig 6-10 Rolling gate
Drum gate: this is an acute circular sector in cross-section, formed by skin plates attached to internal
bracing. It is hinged at the center of curvature which may be either upstream or downstream. In the
lowered portion, it fits in the shape of the crest.
Its crest is lowered automatically by rising headwater. The plates are so proportioned the headwater in the
recess supports the movable structure against the headwater pressure above the sill at low water. When
the water surfaces rises, the head water pressure becomes relatively grate on the upper skin and the crest
is depressed. As the water level falls to the low water level, the crest returns to that level.
Drum gate is not adapted to small dams because of the large recess required.
Tilting (Flap) gate: It consists of a flat frame hinged at the lower edge. The upper edge can be moved
with the help of chains or rods about the lower hinge to pass the flood over the crest of the gate. It is
normally suitable for small sizes of openings.
Weight of gate:
nm
HKLW
Where L – gate opening (ft)
H- depth of water against the gate (ft)
K, m, n - constants
Type of gate m n Range of K Mean K
Rectangular lift 1.5 1.75 0.80-2.00 1.2
Radial 1.9 1.35 0.85-1.45 1.16
Rolling 1.5 1.67 2.40-3.40 2.85
Drum 1.33 1.33 26.00-35.00 31.00
Addis Ababa University Hydraulic Structures I
Apr-13 97
6.4 Spillway design
6.4.1 Background
A multi-purpose medium dam is planned to be constructed on the selected location. The dam is intended
to serve for irrigation, power generation and control of flood which has been destroying property worth
millions of birr whenever it occurs.
The overall construction of the project and its future implementation is well accepted by the society living
in the surrounding and the catchment. The socioeconomic importance of the structure is deeply
understood by the people and the cooperation of them is granted before hand by the assessment done for
this particular purpose. This is done because there were structures built with huge amount of investment
and couldn‟t be functional just because of the community unawareness.
A site, which is ideal for the construction of any type of dam, is obtained in a narrow gorge. Then the
contour map of the site is properly prepared and the different spillway options are considered. A
preliminary cost analysis is done for the various types. The preference of each option is justified based on
the site and social condition prevailed in the surrounding and the fund available for the construction of the
dam
The pertinent dimensions of the dam are decided considering different parameters and conditions. For
instance the dam height is selected based on the following conditions.
iv. The fetch of the dam upstream will be prone to flooding and nearby villages will be submerged if
the specified height is exceeded.
v. The amount of storage obtained at this elevation is comparable with the demand projected.
vi. The budget allocated for the project could not go beyond this limit.
vii. The available spilling options function optimally in the elevation already selected.
Therefore, after the appropriate dam height and site is selected the type of dam needs to be decided upon.
For the ogee spillway a gravity dam is proposed along the dam. For the rest cases of spillways an earth
dam can be constructed for it is quite easy to obtain construction material from queries around the dam.
These make the earth dam much economical as compared to the former.
Much of the design procedure is based on the USBR Design of Small Dams and on the experimental
results of the Waterways Experiment Station. Various tables and charts were used from these references.
General description of the dam site and the available data.
Elevation m.a.s.l
Bottom of the dam 1390.0
Top of the dam crest 1428.0
Ogee spillway crest 1420.0
Ogee spillway design water level 1425.0
Chute spillway design water level 1425.0
Normal reservoir water level 1419.0
Dam and spillway
Type: Gravity for the case of ogee spillway and arch or Earth and rock fill (Zoned) with side channel,
siphon spillway or chute spillway.
Length of dam 96.0 m
Design discharge (1000 years return period) 1410 m3/s
Height of dam 35.0 m
Mean annual temperature 250C
Vapour pressure of water 3.595kpa
Addis Ababa University Hydraulic Structures I
Apr-13 98
AlternativeI
Free overflow ogee spillway.
For the free overflow ogee a sound rock foundation is assumed to exist for the construction of the gravity
dam and a ski jump is found to be satisfactory at the toe of the ogee for the dissipation of energy. From
the topography it is observed that there is no need for the construction of an approach channel.
Design data
Design discharge (Q) = 1410 m3/s
River bed elevation = 1390 m
The design head is 6m, but a negative pressure head of 1.0 m is assumed to develop in the crest of the
spillway for economic reasons and the workmanship is assumed to be good enough not to create rough
surface for this negative head to result in cavitation problem. The vapor pressure of water for the spillway
site is 3.595m
Therefore, from the negative pressure head (hu) specified the corresponding design head (hdes) is
hu = h(1-h/hdes)
-1. = 6(1- 6/hdes)
hdes = 5.14 m
P/h = 6
This value (P/h = 6) hence the effect of approach velocity is too small and can be neglected. But a case
where the dam is filled by sediment is considered and P is decreased. Therefore P is assumed to be 2m.
P/h = 2/6
= 0.333
The respective value of Co (coefficient of discharge) from chart is
Co = 2.175
qo = CoH1.5
= 2.175 * 6 1.5
= 32 m3/s/m
vo = q/(P + h)
= 32/(2+6)
= 4 m/sec
Velocity head (ha)
ha = vo2/2*g
= 16/19.62
= 0.81 m
adding 10% of ha for entrance and other losses
ha = 0.9 m
Therefore, He = 6.9 m
Correction for the coefficient of discharge
P/He = 0.29
Co = 2.18 hence, no appreciable change from the previous value.
For an upstream slope of 2:3
Ci/Co = 1.026
Submergence effect is not considered here because the downstream apron is much below the crest level
for any submergence to occur for the design discharge. For similar reason the correction for downstream
apron is not carried out.
Addis Ababa University Hydraulic Structures I
Apr-13 99
Therefore, the final corrected value of the coefficient of discharge for the ogee is
C = 2.18 *1.026
= 2.23
From the discharge equation by Polini
Q = CL‟He1.5
1410 = 2.23 *L‟* 6.91.5
L‟ = 35.00m
For the provision of round nosed piers (kp = 0.01) at every 8m interval along the ogee
Number of piers required = 4
Pier thickness is 2m
Rounded abutments with headwalls at 900 to the direction of flow are used (ka = 0.1)
The effective length of the crest will then be
L= L‟ + 2(nkp + ka)H
= 35.0 +2(4*0.01 +0.1) * 6.9
= 36.93 37.0m Adding the pier width the total width of the crest will be
B = 37.0 + 8
= 45.0 m
The profile of the nape is determined based on the charts available on USBR design of small dams.
Ha/He = 0.9/6.9
= 0.13
For an upstream slope of 1:1
crest position
Xc/He = 0.195
Xc = 1.35m
Yc/He = 0.07
Yc = 0.49m
Profile upstream of the crest
R1/He = 0.465
R1 = 3.21m
R2/He = 0.367
R2 = 2.53m
Down stream of the crest
Y/He = -k(X./He)n
values of the constants are found(from charts on USBR) to be
K = 0.52
n = 1.763
y = -0.119 x1.763
Tabulating values for the above equation,
The point of tangency in the downstream for a slope of m= 0.6
The value of a is obtained from table (a = 1.80)
YT = -HeK(mkn)n/(1-a)
= -9.4m
The coordinate values obtained so far for the ogee nape profile are tabulated and plotted as follows.
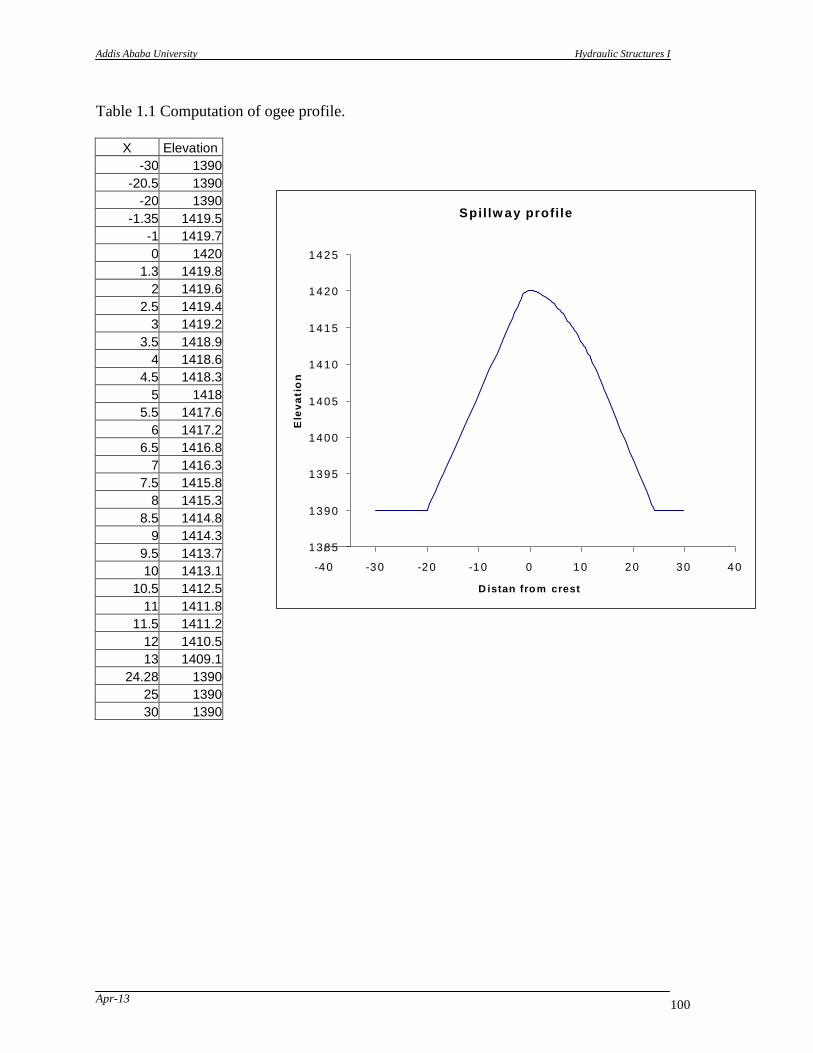
Addis Ababa University Hydraulic Structures I
Apr-13 100
Table 1.1 Computation of ogee profile.
X Elevation
-30 1390
-20.5 1390
-20 1390
-1.35 1419.5
-1 1419.7
0 1420
1.3 1419.8
2 1419.6
2.5 1419.4
3 1419.2
3.5 1418.9
4 1418.6
4.5 1418.3
5 1418
5.5 1417.6
6 1417.2
6.5 1416.8
7 1416.3
7.5 1415.8
8 1415.3
8.5 1414.8
9 1414.3
9.5 1413.7
10 1413.1
10.5 1412.5
11 1411.8
11.5 1411.2
12 1410.5
13 1409.1
24.28 1390
25 1390
30 1390
Spil lw ay profi le
1385
1390
1395
1400
1405
1410
1415
1420
1425
-40 -30 -20 -10 0 10 20 30 40
D istan from crest
Ele
va
tio
n

Addis Ababa University Hydraulic Structures I
Apr-13 101
Alternative II
Siphon spillway
Siphon spillway is a bit complicated to construct and the low elevation difference between the upstream
and downstream water level makes it unsuitable for most dams..
For this particular case a site is selected which is suitable for its construction and a tail water elevation
necessary for the proper functioning of the spillway is maintained by taking advantage of the topography
and building an additional structure.
Design procedure
Siphon cross section at the throat
width (b) 5m
depth (a) 4m
normal water surface elevation is the crest elevation 1420m
design head is as used in the case of the ogee 6m
Pv = 3.595m
The minimum and maximum pressures at the crest elevation
Pomin = 88kpa
Pomax = 108 kpa
Hs = 1420 m
88.06kpa
eP'P
71.75kpa
eP'P
)6956/Hs(
maxo maxo
)6956/Hs(
minomino
The possible negative head to avoid capitation in the siphon is
m95.6h
81.9
56.375.71h
P'Ph
cp
cp
vmino
cp
Hence the design head for the siphon discharge is taken to be 6.9m
for a concrete hood the roughness coefficient () is taken to be 1.5
the total length of the hood is assumed to be 25m
the hydraulic diameter (D) will be
D = 4A/P
= (4*20)/18
= 4.44 m
/D = 0.00034
from Moody‟s chart for the corresponding value of /D, the friction factor(f) for a rough flow
behavior (since the Reynolds number is supposed to be very large),
f = 0.0145
Now siphon coefficient () will be determined
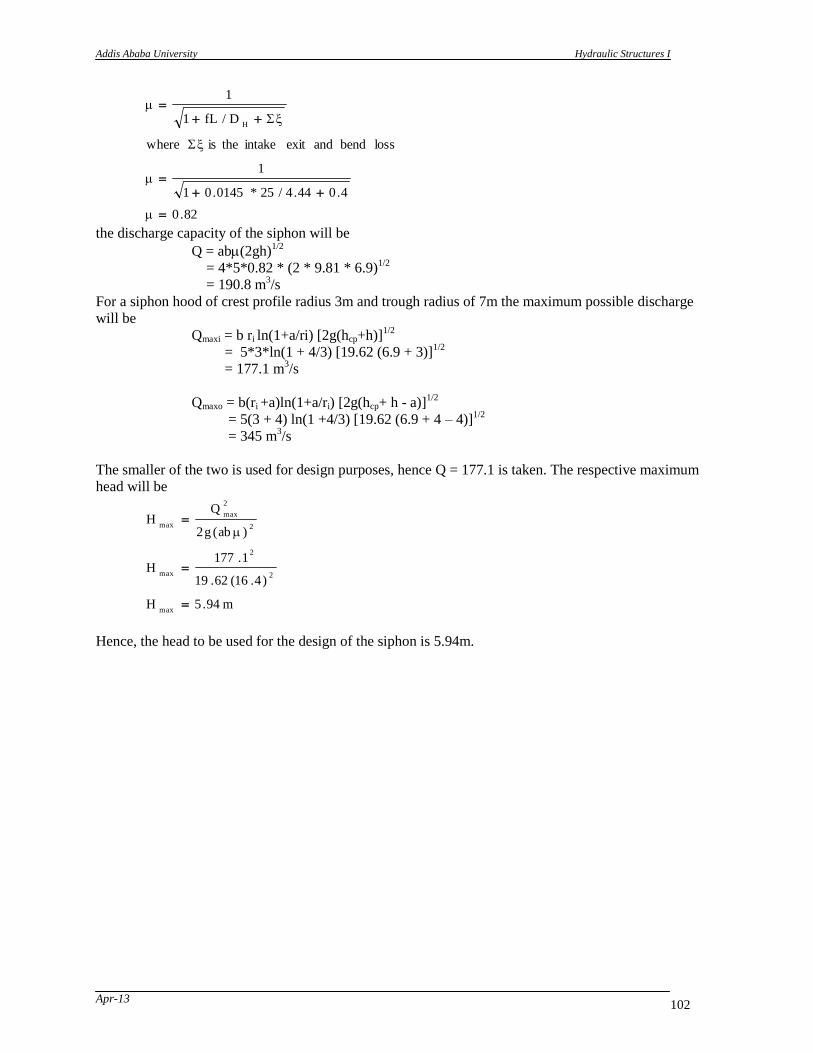
Addis Ababa University Hydraulic Structures I
Apr-13 102
82.0
4.044.4/25*0145.01
1
loss bend andexit intake theis where
D/fL1
1
H
the discharge capacity of the siphon will be
Q = ab(2gh)1/2
= 4*5*0.82 * (2 * 9.81 * 6.9)1/2
= 190.8 m3/s
For a siphon hood of crest profile radius 3m and trough radius of 7m the maximum possible discharge
will be
Qmaxi = b ri ln(1+a/ri) [2g(hcp+h)]1/2
= 5*3*ln(1 + 4/3) [19.62 (6.9 + 3)]1/2
= 177.1 m3/s
Qmaxo = b(ri +a)ln(1+a/ri) [2g(hcp+ h - a)]
1/2
= 5(3 + 4) ln(1 +4/3) [19.62 (6.9 + 4 – 4)]1/2
= 345 m3/s
The smaller of the two is used for design purposes, hence Q = 177.1 is taken. The respective maximum
head will be
m94.5H
)4.16(62.19
1.177H
)ab(g2
QH
max
2
2
max
2
2
max
max
Hence, the head to be used for the design of the siphon is 5.94m.

Addis Ababa University Hydraulic Structures I
Apr-13 103
Alternative III
Side channel spillway
The topography of the dam site reveals that there is a possibility to construct a side channel spillway. An
iterative approach is followed to determine the water surface profile as well as the critical section.The bed
slope is the optimum slope obtained after a minimum adjustment is carried out.
Available data Length 70.00
Design head 6.00
Discharge per length 20.14
Side slope m 0.50
Bottom width 10.00
Manning‟s n 0.02
Alpha 1.00
Bed slope 0.30
Crest elevation 1420.00
Critical profile for the given channel condition is simulated for fictious flow depth to be used in obtaining
the actual profile through interpolation
Table 3.1. Critical flow depth computation.
Y A T D/2 Vc Qc P Rc
1.00 10.50 11.00 0.48 3.07 32.24 12.24 0.86
1.50 16.13 11.50 0.70 3.71 59.82 13.35 1.21
3.00 34.50 13.00 1.33 5.11 176.30 16.71 2.06
4.00 48.00 14.00 1.71 5.79 277.92 18.94 2.53
5.00 62.50 15.00 2.08 6.39 399.38 21.18 2.95
6.00 78.00 16.00 2.44 6.92 539.76 23.42 3.33
7.00 94.50 17.00 2.78 7.39 698.36 25.65 3.68
8.00 112.00 18.00 3.11 7.81 874.72 27.89 4.02
9.00 130.50 19.00 3.43 8.20 1070.10 30.12 4.33
10.00 150.00 20.00 3.75 8.58 1287.00 32.36 4.64
11.00 170.50 21.00 4.06 8.93 1522.57 34.60 4.93
12.00 192.00 22.00 4.36 9.25 1776.00 36.83 5.21
13.00 214.50 23.00 4.66 9.56 2050.62 39.07 5.49
14.00 238.00 24.00 4.96 9.86 2346.68 41.30 5.76
15.00 262.50 25.00 5.25 10.15 2664.38 43.54 6.03
16.00 288.00 26.00 5.54 10.43 3003.84 45.78 6.29
17.00 314.50 27.00 5.82 10.69 3362.01 48.01 6.55
18.00 342.00 28.00 6.11 10.95 3744.90 50.25 6.81
19.00 370.50 29.00 6.39 11.20 4149.60 52.49 7.06
20.00 400.00 30.00 6.67 11.44 4576.00 54.72 7.31
21.00 430.50 31.00 6.94 11.67 5023.94 56.96 7.56
The critical water surface profile with respect to the critical bed is calculated in Table 2 then the critical
depth is transferred to the actual bed slope. An arbitrary elevation (1470 m) is selected and the water
surface profile at critical flow is plotted in fig 1.The lowest point of tangency of the actual channel bed
with the critical bed profile is taken as the control section. The actual flow profile is then determined by
going upstream and downstream from the critical section for subcritical and supercritical flow conditions
respectively as shown in Table 3.1.
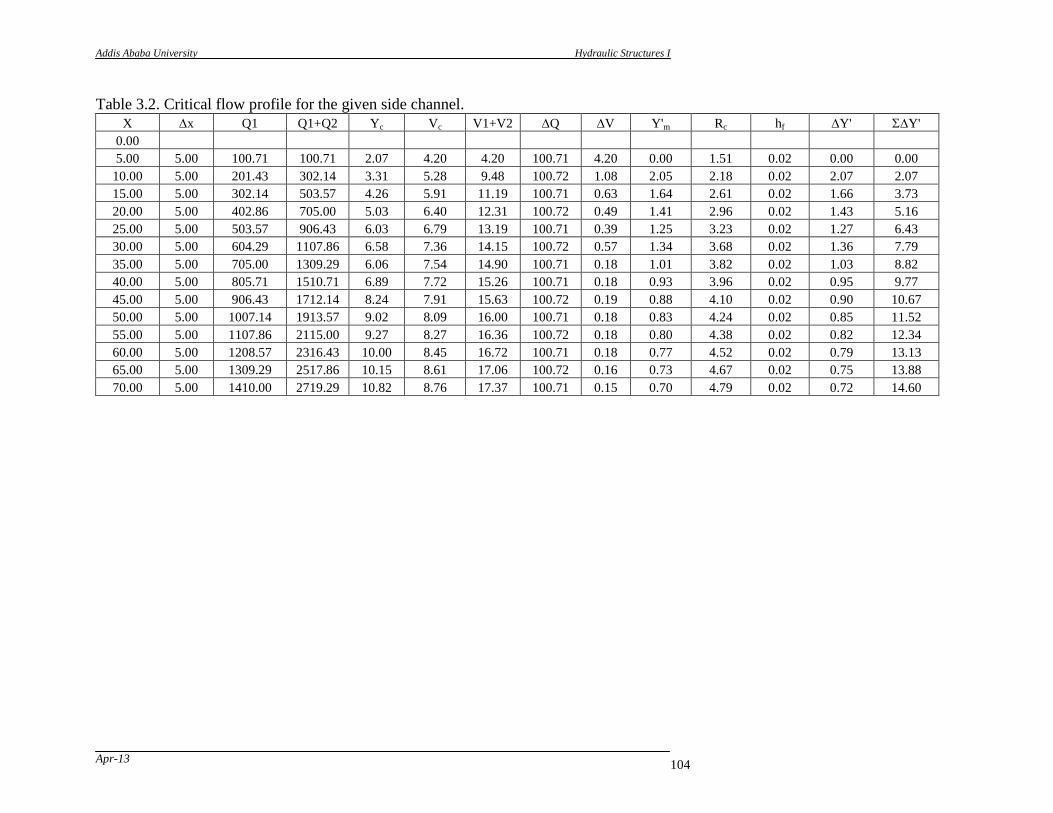
Addis Ababa University Hydraulic Structures I
Apr-13 104
Table 3.2. Critical flow profile for the given side channel.
X x Q1 Q1+Q2 Yc Vc V1+V2 Q V Y'm Rc hf Y' Y'
0.00
5.00 5.00 100.71 100.71 2.07 4.20 4.20 100.71 4.20 0.00 1.51 0.02 0.00 0.00
10.00 5.00 201.43 302.14 3.31 5.28 9.48 100.72 1.08 2.05 2.18 0.02 2.07 2.07
15.00 5.00 302.14 503.57 4.26 5.91 11.19 100.71 0.63 1.64 2.61 0.02 1.66 3.73
20.00 5.00 402.86 705.00 5.03 6.40 12.31 100.72 0.49 1.41 2.96 0.02 1.43 5.16
25.00 5.00 503.57 906.43 6.03 6.79 13.19 100.71 0.39 1.25 3.23 0.02 1.27 6.43
30.00 5.00 604.29 1107.86 6.58 7.36 14.15 100.72 0.57 1.34 3.68 0.02 1.36 7.79
35.00 5.00 705.00 1309.29 6.06 7.54 14.90 100.71 0.18 1.01 3.82 0.02 1.03 8.82
40.00 5.00 805.71 1510.71 6.89 7.72 15.26 100.71 0.18 0.93 3.96 0.02 0.95 9.77
45.00 5.00 906.43 1712.14 8.24 7.91 15.63 100.72 0.19 0.88 4.10 0.02 0.90 10.67
50.00 5.00 1007.14 1913.57 9.02 8.09 16.00 100.71 0.18 0.83 4.24 0.02 0.85 11.52
55.00 5.00 1107.86 2115.00 9.27 8.27 16.36 100.72 0.18 0.80 4.38 0.02 0.82 12.34
60.00 5.00 1208.57 2316.43 10.00 8.45 16.72 100.71 0.18 0.77 4.52 0.02 0.79 13.13
65.00 5.00 1309.29 2517.86 10.15 8.61 17.06 100.72 0.16 0.73 4.67 0.02 0.75 13.88
70.00 5.00 1410.00 2719.29 10.82 8.76 17.37 100.71 0.15 0.70 4.79 0.02 0.72 14.60
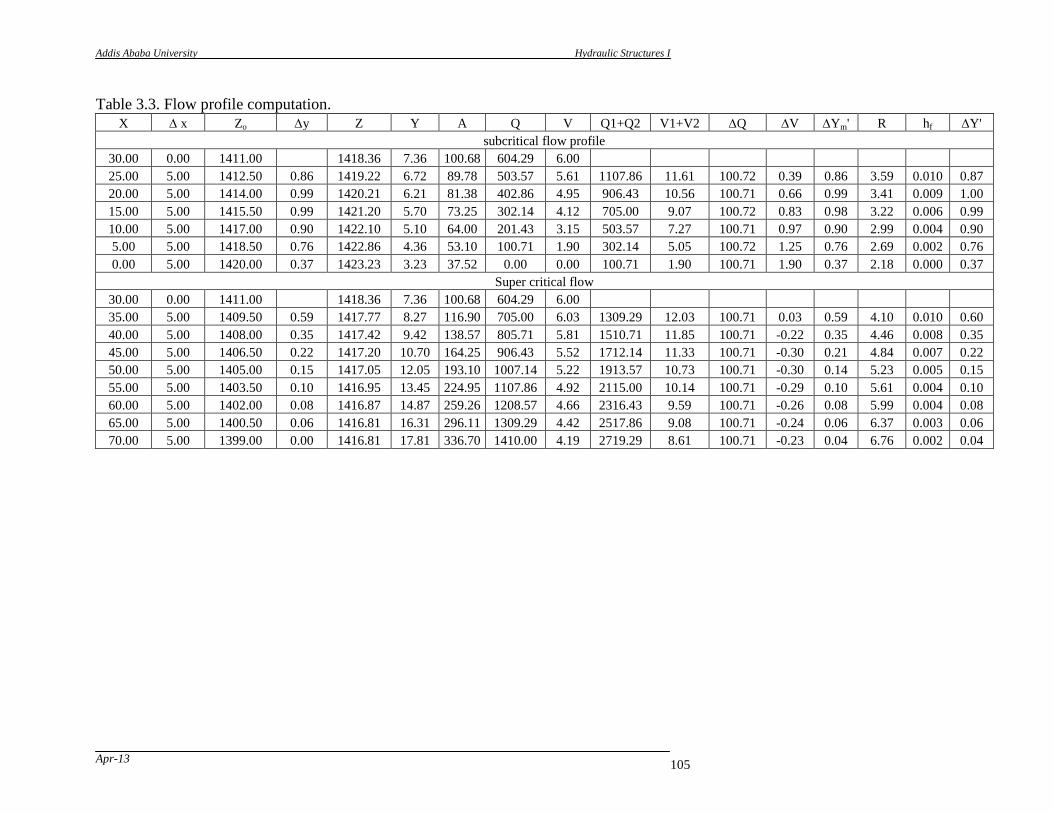
Addis Ababa University Hydraulic Structures I
Apr-13 105
Table 3.3. Flow profile computation.
X x Zo y Z Y A Q V Q1+Q2 V1+V2 Q V Ym' R hf Y'
subcritical flow profile
30.00 0.00 1411.00 1418.36 7.36 100.68 604.29 6.00
25.00 5.00 1412.50 0.86 1419.22 6.72 89.78 503.57 5.61 1107.86 11.61 100.72 0.39 0.86 3.59 0.010 0.87
20.00 5.00 1414.00 0.99 1420.21 6.21 81.38 402.86 4.95 906.43 10.56 100.71 0.66 0.99 3.41 0.009 1.00
15.00 5.00 1415.50 0.99 1421.20 5.70 73.25 302.14 4.12 705.00 9.07 100.72 0.83 0.98 3.22 0.006 0.99
10.00 5.00 1417.00 0.90 1422.10 5.10 64.00 201.43 3.15 503.57 7.27 100.71 0.97 0.90 2.99 0.004 0.90
5.00 5.00 1418.50 0.76 1422.86 4.36 53.10 100.71 1.90 302.14 5.05 100.72 1.25 0.76 2.69 0.002 0.76
0.00 5.00 1420.00 0.37 1423.23 3.23 37.52 0.00 0.00 100.71 1.90 100.71 1.90 0.37 2.18 0.000 0.37
Super critical flow
30.00 0.00 1411.00 1418.36 7.36 100.68 604.29 6.00
35.00 5.00 1409.50 0.59 1417.77 8.27 116.90 705.00 6.03 1309.29 12.03 100.71 0.03 0.59 4.10 0.010 0.60
40.00 5.00 1408.00 0.35 1417.42 9.42 138.57 805.71 5.81 1510.71 11.85 100.71 -0.22 0.35 4.46 0.008 0.35
45.00 5.00 1406.50 0.22 1417.20 10.70 164.25 906.43 5.52 1712.14 11.33 100.71 -0.30 0.21 4.84 0.007 0.22
50.00 5.00 1405.00 0.15 1417.05 12.05 193.10 1007.14 5.22 1913.57 10.73 100.71 -0.30 0.14 5.23 0.005 0.15
55.00 5.00 1403.50 0.10 1416.95 13.45 224.95 1107.86 4.92 2115.00 10.14 100.71 -0.29 0.10 5.61 0.004 0.10
60.00 5.00 1402.00 0.08 1416.87 14.87 259.26 1208.57 4.66 2316.43 9.59 100.71 -0.26 0.08 5.99 0.004 0.08
65.00 5.00 1400.50 0.06 1416.81 16.31 296.11 1309.29 4.42 2517.86 9.08 100.71 -0.24 0.06 6.37 0.003 0.06
70.00 5.00 1399.00 0.00 1416.81 17.81 336.70 1410.00 4.19 2719.29 8.61 100.71 -0.23 0.04 6.76 0.002 0.04
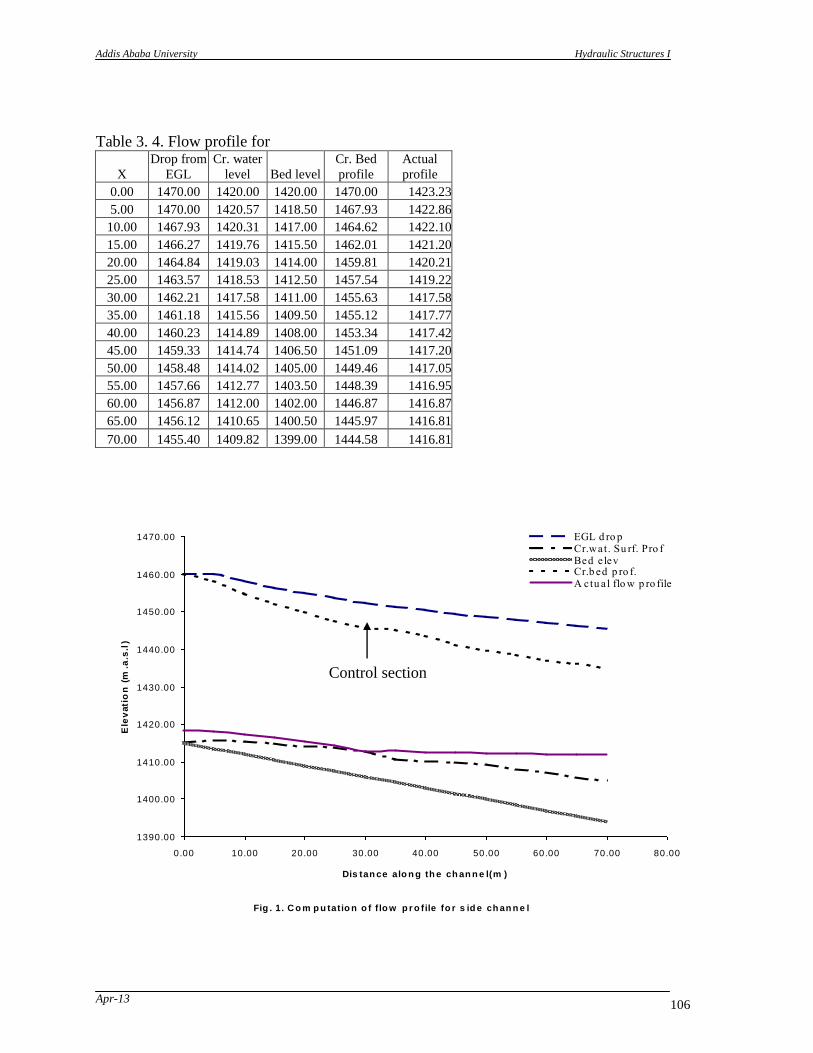
Addis Ababa University Hydraulic Structures I
Apr-13 106
Table 3. 4. Flow profile for
X
Drop from
EGL
Cr. water
level Bed level
Cr. Bed
profile
Actual
profile
0.00 1470.00 1420.00 1420.00 1470.00 1423.23
5.00 1470.00 1420.57 1418.50 1467.93 1422.86
10.00 1467.93 1420.31 1417.00 1464.62 1422.10
15.00 1466.27 1419.76 1415.50 1462.01 1421.20
20.00 1464.84 1419.03 1414.00 1459.81 1420.21
25.00 1463.57 1418.53 1412.50 1457.54 1419.22
30.00 1462.21 1417.58 1411.00 1455.63 1417.58
35.00 1461.18 1415.56 1409.50 1455.12 1417.77
40.00 1460.23 1414.89 1408.00 1453.34 1417.42
45.00 1459.33 1414.74 1406.50 1451.09 1417.20
50.00 1458.48 1414.02 1405.00 1449.46 1417.05
55.00 1457.66 1412.77 1403.50 1448.39 1416.95
60.00 1456.87 1412.00 1402.00 1446.87 1416.87
65.00 1456.12 1410.65 1400.50 1445.97 1416.81
70.00 1455.40 1409.82 1399.00 1444.58 1416.81
Fig . 1. C o m p u tatio n o f f lo w p r o file fo r s id e ch an n e l
1390.00
1400.00
1410.00
1420.00
1430.00
1440.00
1450.00
1460.00
1470.00
0.00 10.00 20.00 30.00 40.00 50.00 60.00 70.00 80.00
Dis tan ce alo n g th e ch an n e l(m )
Ele
vati
on
(m
.a.s
.l)
EGL d ro pCr.wat. Su rf. Pro fBed e levCr.b ed p ro f.A ctu a l flo w p ro file
Control section
Addis Ababa University Hydraulic Structures I
Apr-13 107
Alternative IV
Chute spillway
For the design of the chute spillway three components are considered 1. Design of the approach channel.
2. Design of the control structure.
3. Design of the chute channel.
Spillway crest length is optimized to be 40m.
Round nosed piers of 2m thickness will be used to at every 9m along the spillway.
An approach channel of side slopes 1:1 is suggested to be used to guide the channel to the control
structure.
The height of the control ogee is 6m.
Elevation of bottom of the control structure is 1414m.
Approach channel
For the design of the approach channel first the head over the control structure/ogee/ need to be
determined. From the equation of discharge
Q = CLeHe3/2
Assume the value of the discharge coefficient C = 2.13.
The design head hdes is equal to the total head.
1410 = 2.13 * 32 *h1.5
h = 7.54
Upstream water surface level = crest elevation + h
= 1420 + 7.54
= 1427.54
bed level of the ogee = 1414m
water depth upstream of ogee = 13.54 m
channel width is = 40m
area of the channel = (40 + 13.54) * 13.54
= 724.9 m2
wetted perimeter P = 40 + 2*1.414* 13.54
= 78.3
hydraulic radius R = A/P
= 9.26 m
v = Q/A
= 1.94
ha = v2/ 2g
0.1923
Correction for the coefficient of discharge
P/He = 0.78
Co = 2.128
For an upstream slope of 1:1
Ci/Co = 1.004
To remove any submergence effect at the downstream apron position
hd+d/He = 1.777 > 1.7 and to maintain supercritical flow
hd/He = 1.34
Therefore, the final corrected value of the coefficient of discharge for the ogee is
C = 2.128 *1.004
= 2.13
Addis Ababa University Hydraulic Structures I
Apr-13 108
Design of crest profile
P/He = 0.78
hd/He = 0.025
The upstream profile of the crest is ,therefore, obtained by interpolating for ha/He = 0.025
Table 4.1 coordinates of upstream profile for low ogee weir
X/He
Ha/He
x Elevation 0 0.08 0.12
0 0 0 0 0.00 1220.00
-0.02 0.0004 0.0004 0.0004 -0.15 1420.00
-0.06 0.0036 0.0035 0.0035 -0.46 1420.00
-0.1 0.0103 0.01 0.0099 -0.77 1419.99
-0.12 0.015 0.015 0.0147 -0.93 1419.99
-0.14 0.0207 0.0208 0.0149 -1.08 1419.98
-0.15 0.0239 0.0235 0.0231 -1.16 1419.98
-0.16 0.0275 0.027 0.0265 -1.24 1419.97
-0.175 0.0333 0.0328 0.0325 -1.35 1419.97
-0.19 0.0399 0.0395 0.039 -1.47 1419.96
-0.195 0.0424 0.042 -1.51 1419.96
-0.2 0.045 -1.54 1419.96
The optimum position of the downstream apron is taken as 1414.0m because it is sufficient to maintain
critical flow and avoid submergence effects. From the specific energy at the upstream and downstream of
the control structure the depth of flow at the toe of the ogee is obtained
U/s E = 6.0 + 7.54 + 0.19
= 13.73m
velocity at the d/s
= q/d
d/s E = d + (q/d)2/2g
equating and solving by trial and error the water depth is 2.3m
For the downstream profile of the ogee the equation obtained from table is
Y = -0.115x1.75
And the values are calculated for the elevation range of 1420m and 1414m as shown in the following
table.
Table 4.2 Downstream profile of ogee
x Elevation
0 1420.00
0.50 1419.97
1.00 1419.89
2.00 1419.61
3.00 1419.21
4.00 1418.70
5.00 1418.08
6.00 1417.35
7.00 1416.54
8.00 1415.62
9.00 1414.00
Addis Ababa University Hydraulic Structures I
Apr-13 109
Design of the chute. Critical depth yc = (q
2/g)
1/3
= 5.02m
The critical depth is much higher than the calculated depth, hence the flow is supercritical. The chute
channel should now be given a milder slop for a little distance from toe, keeping the flow in supercritical
condition.
Critical velocity = q/yc = 7.02
From Manning‟s equation
V = 1/n R2/3
s1/2
Inserting the values and calculating for slope
S=0.001
Hence a slope of 1/400 is provided in 40m distance from the toe of the spillway. The bed level at the end
of this slope is 1414-0.1 = 1413.9m.
For the reverse curve at the toe a concave curve of radius 2He is provided.
For the remaining reaches of the channel a slope is given based on the prevailing topography formation of
white water and keeping the flow supercritical. The calculation is shown in the following table.
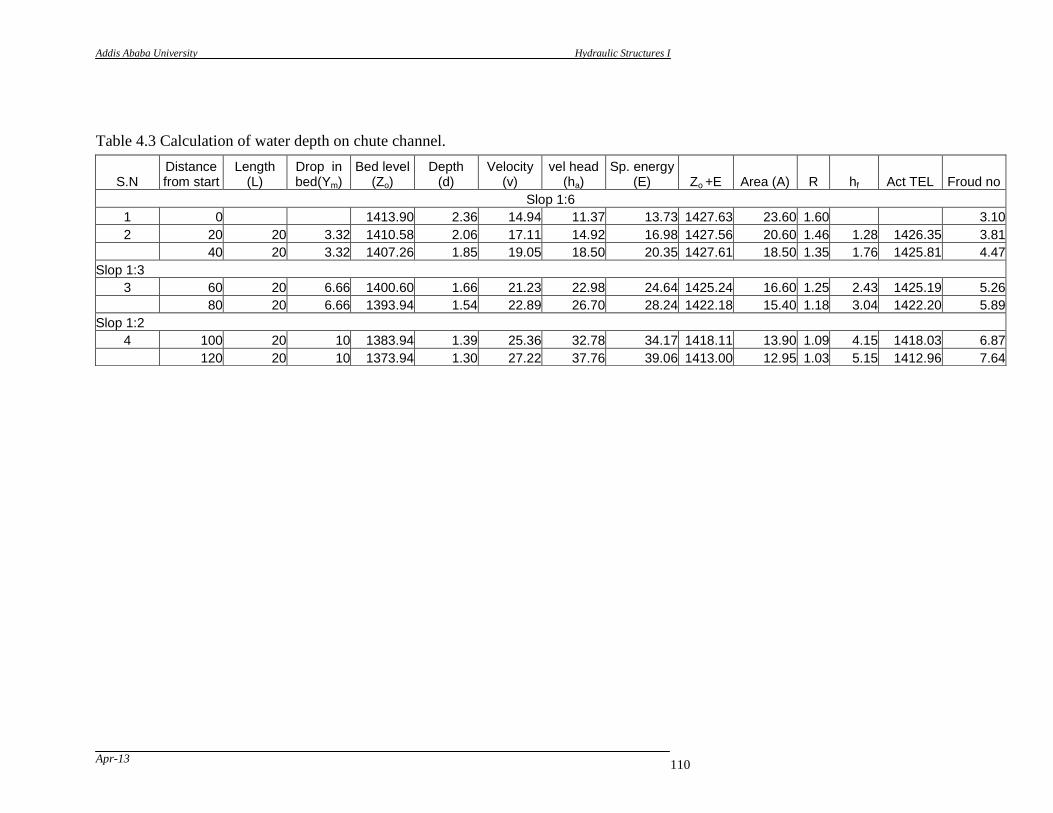
Addis Ababa University Hydraulic Structures I
Apr-13 110
Table 4.3 Calculation of water depth on chute channel.
S.N Distance from start
Length (L)
Drop in bed(Ym)
Bed level (Zo)
Depth (d)
Velocity (v)
vel head (ha)
Sp. energy (E) Zo +E Area (A) R hf Act TEL Froud no
Slop 1:6
1 0 1413.90 2.36 14.94 11.37 13.73 1427.63 23.60 1.60 3.10
2 20 20 3.32 1410.58 2.06 17.11 14.92 16.98 1427.56 20.60 1.46 1.28 1426.35 3.81
40 20 3.32 1407.26 1.85 19.05 18.50 20.35 1427.61 18.50 1.35 1.76 1425.81 4.47
Slop 1:3
3 60 20 6.66 1400.60 1.66 21.23 22.98 24.64 1425.24 16.60 1.25 2.43 1425.19 5.26
80 20 6.66 1393.94 1.54 22.89 26.70 28.24 1422.18 15.40 1.18 3.04 1422.20 5.89
Slop 1:2
4 100 20 10 1383.94 1.39 25.36 32.78 34.17 1418.11 13.90 1.09 4.15 1418.03 6.87
120 20 10 1373.94 1.30 27.22 37.76 39.06 1413.00 12.95 1.03 5.15 1412.96 7.64
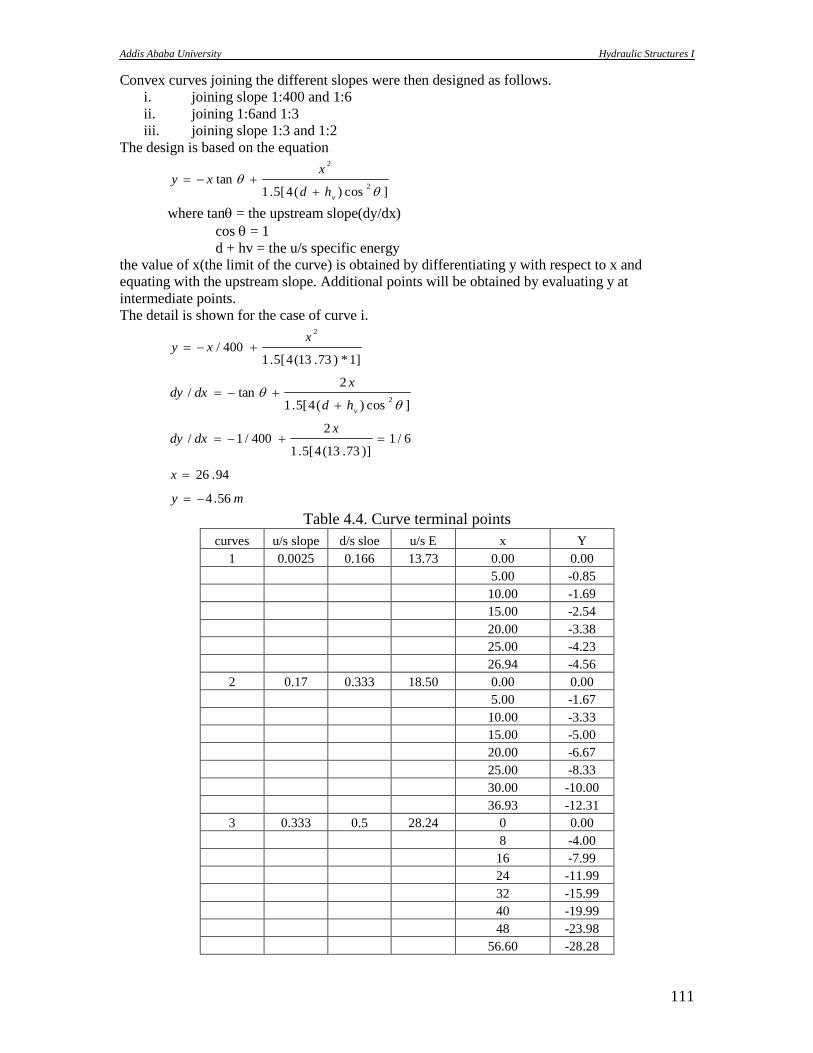
Addis Ababa University Hydraulic Structures I
111
Convex curves joining the different slopes were then designed as follows.
i. joining slope 1:400 and 1:6
ii. joining 1:6and 1:3
iii. joining slope 1:3 and 1:2
The design is based on the equation
]cos)(4[5.1tan
2
2
vhd
xxy
where tan = the upstream slope(dy/dx)
cos = 1
d + hv = the u/s specific energy
the value of x(the limit of the curve) is obtained by differentiating y with respect to x and
equating with the upstream slope. Additional points will be obtained by evaluating y at
intermediate points.
The detail is shown for the case of curve i.
]1*)73.13(4[5.1400/
2x
xy
]cos)(4[5.1
2tan/
2
vhd
xdxdy
my
x
xdxdy
56.4
94.26
6/1)]73.13(4[5.1
2400/1/
Table 4.4. Curve terminal points
curves u/s slope d/s sloe u/s E x Y
1 0.0025 0.166 13.73 0.00 0.00
5.00 -0.85
10.00 -1.69
15.00 -2.54
20.00 -3.38
25.00 -4.23
26.94 -4.56
2 0.17 0.333 18.50 0.00 0.00
5.00 -1.67
10.00 -3.33
15.00 -5.00
20.00 -6.67
25.00 -8.33
30.00 -10.00
36.93 -12.31
3 0.333 0.5 28.24 0 0.00
8 -4.00
16 -7.99
24 -11.99
32 -15.99
40 -19.99
48 -23.98
56.60 -28.28
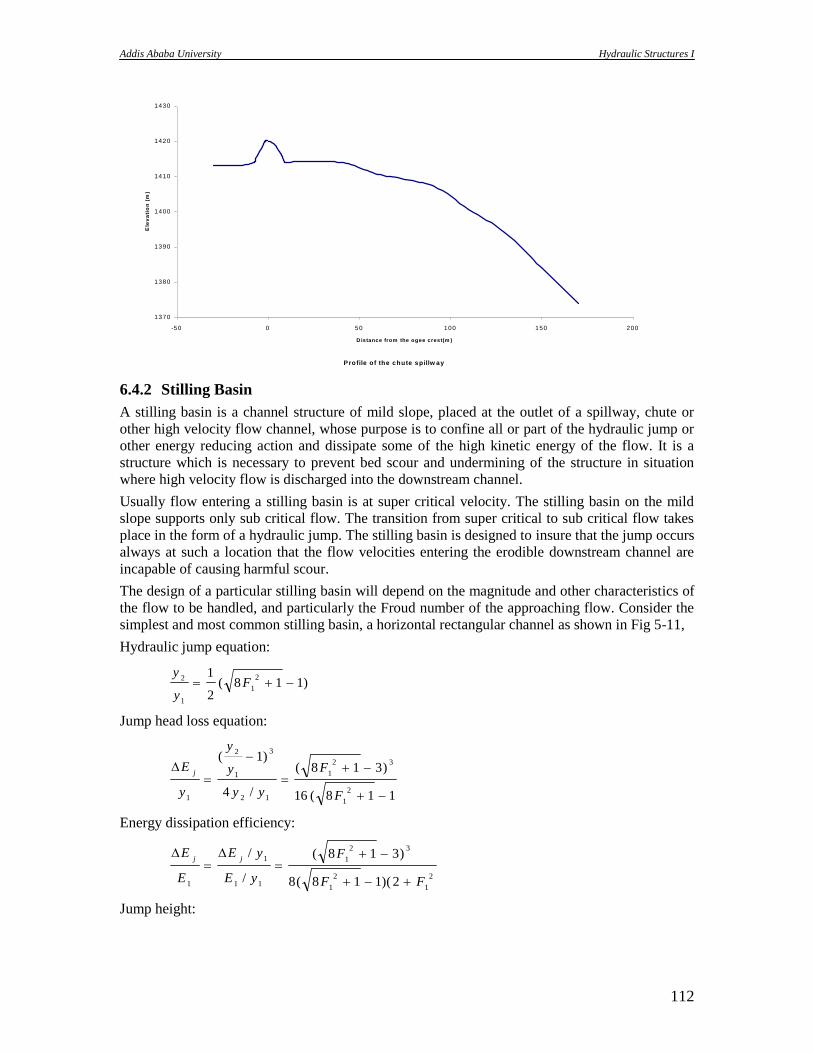
Addis Ababa University Hydraulic Structures I
112
Profile of the chute spillw ay
1370
1380
1390
1400
1410
1420
1430
-50 0 50 100 150 200
D istance from the ogee crest(m )
Ele
va
tio
n (
m)
6.4.2 Stilling Basin
A stilling basin is a channel structure of mild slope, placed at the outlet of a spillway, chute or
other high velocity flow channel, whose purpose is to confine all or part of the hydraulic jump or
other energy reducing action and dissipate some of the high kinetic energy of the flow. It is a
structure which is necessary to prevent bed scour and undermining of the structure in situation
where high velocity flow is discharged into the downstream channel.
Usually flow entering a stilling basin is at super critical velocity. The stilling basin on the mild
slope supports only sub critical flow. The transition from super critical to sub critical flow takes
place in the form of a hydraulic jump. The stilling basin is designed to insure that the jump occurs
always at such a location that the flow velocities entering the erodible downstream channel are
incapable of causing harmful scour.
The design of a particular stilling basin will depend on the magnitude and other characteristics of
the flow to be handled, and particularly the Froud number of the approaching flow. Consider the
simplest and most common stilling basin, a horizontal rectangular channel as shown in Fig 5-11,
Hydraulic jump equation:
)118(2
1 2
1
1
2 F
y
y
Jump head loss equation:
118(16
)318(
/4
)1(
2
1
32
1
12
3
1
2
1
F
F
yy
y
y
y
Ej
Energy dissipation efficiency:
2
1
2
1
32
1
11
1
1 2)(118(8
)318(
/
/
FF
F
yE
yE
E
Ejj
Jump height:
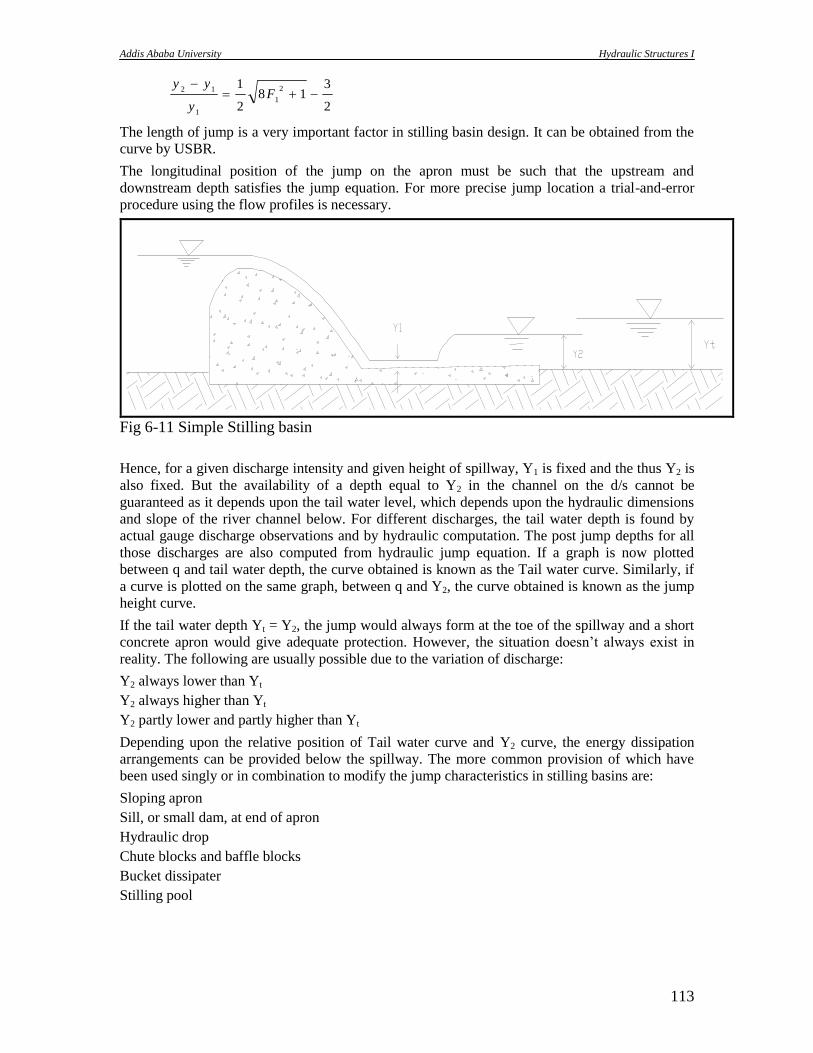
Addis Ababa University Hydraulic Structures I
113
2
318
2
1 2
1
1
12
F
y
yy
The length of jump is a very important factor in stilling basin design. It can be obtained from the
curve by USBR.
The longitudinal position of the jump on the apron must be such that the upstream and
downstream depth satisfies the jump equation. For more precise jump location a trial-and-error
procedure using the flow profiles is necessary.
Fig 6-11 Simple Stilling basin
Hence, for a given discharge intensity and given height of spillway, Y1 is fixed and the thus Y2 is
also fixed. But the availability of a depth equal to Y2 in the channel on the d/s cannot be
guaranteed as it depends upon the tail water level, which depends upon the hydraulic dimensions
and slope of the river channel below. For different discharges, the tail water depth is found by
actual gauge discharge observations and by hydraulic computation. The post jump depths for all
those discharges are also computed from hydraulic jump equation. If a graph is now plotted
between q and tail water depth, the curve obtained is known as the Tail water curve. Similarly, if
a curve is plotted on the same graph, between q and Y2, the curve obtained is known as the jump
height curve.
If the tail water depth Yt = Y2, the jump would always form at the toe of the spillway and a short
concrete apron would give adequate protection. However, the situation doesn‟t always exist in
reality. The following are usually possible due to the variation of discharge:
Y2 always lower than Yt
Y2 always higher than Yt
Y2 partly lower and partly higher than Yt
Depending upon the relative position of Tail water curve and Y2 curve, the energy dissipation
arrangements can be provided below the spillway. The more common provision of which have
been used singly or in combination to modify the jump characteristics in stilling basins are:
Sloping apron
Sill, or small dam, at end of apron
Hydraulic drop
Chute blocks and baffle blocks
Bucket dissipater
Stilling pool

Addis Ababa University Hydraulic Structures I
114
For example, the following energy dissipation mechanism can be provided in cases other than Y2
= Yt,
When Y2 is always lower than Yt, the jump will be submerged and energy dissipation is
very low. To obtain a free hydraulic jump and obtain considerable energy dissipation, Y2
has to be equal to Yt. This can be achieved by providing a sloping apron above the
stream bed level.
In the case of Y2 higher than Yt, lowering of the apron below the stream bed level is
required.
In the case of Y2 partly lower and partly higher than Yt, provide a sloping apron partly
above and partly below the stream bed level so that the jump can form where the sequent
depth is available.
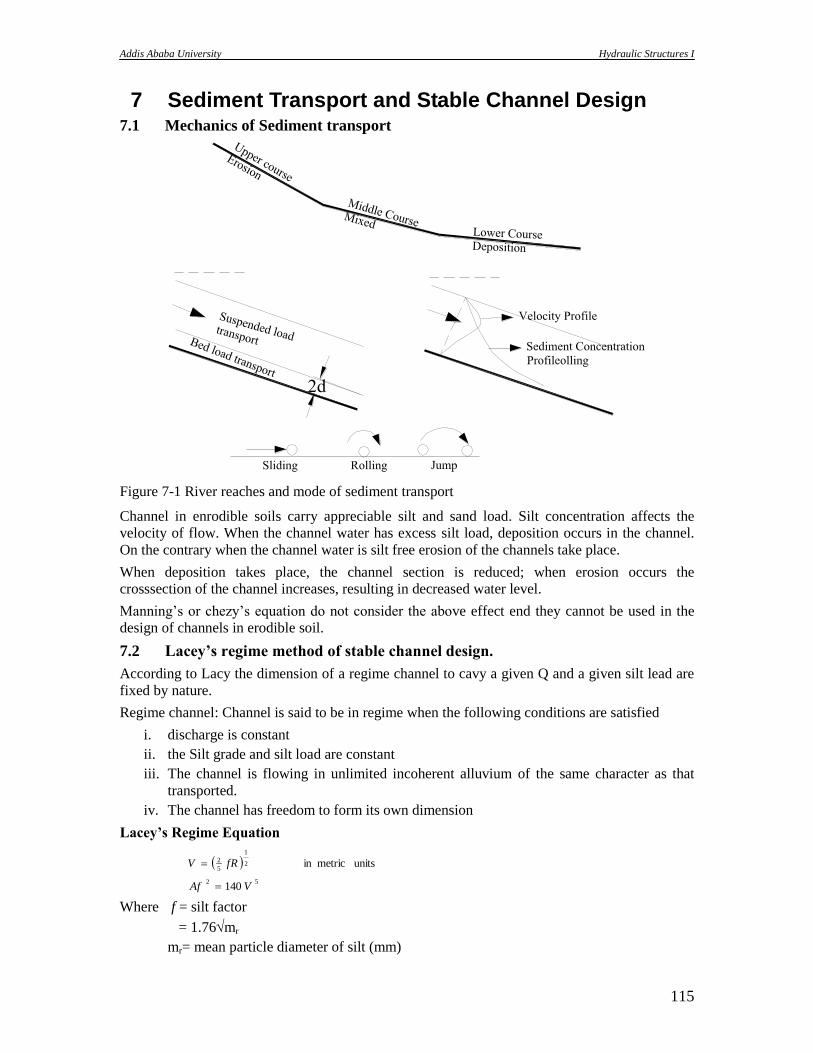
Addis Ababa University Hydraulic Structures I
115
7 Sediment Transport and Stable Channel Design 7.1 Mechanics of Sediment transport
Figure 7-1 River reaches and mode of sediment transport
Channel in enrodible soils carry appreciable silt and sand load. Silt concentration affects the
velocity of flow. When the channel water has excess silt load, deposition occurs in the channel.
On the contrary when the channel water is silt free erosion of the channels take place.
When deposition takes place, the channel section is reduced; when erosion occurs the
crosssection of the channel increases, resulting in decreased water level.
Manning‟s or chezy‟s equation do not consider the above effect end they cannot be used in the
design of channels in erodible soil.
7.2 Lacey’s regime method of stable channel design.
According to Lacy the dimension of a regime channel to cavy a given Q and a given silt lead are
fixed by nature.
Regime channel: Channel is said to be in regime when the following conditions are satisfied
i. discharge is constant
ii. the Silt grade and silt load are constant
iii. The channel is flowing in unlimited incoherent alluvium of the same character as that
transported.
iv. The channel has freedom to form its own dimension
Lacey’s Regime Equation
52
2
1
5
2
140
units metricin
VAf
fRV
Where f = silt factor
= 1.76mr
mr= mean particle diameter of silt (mm)
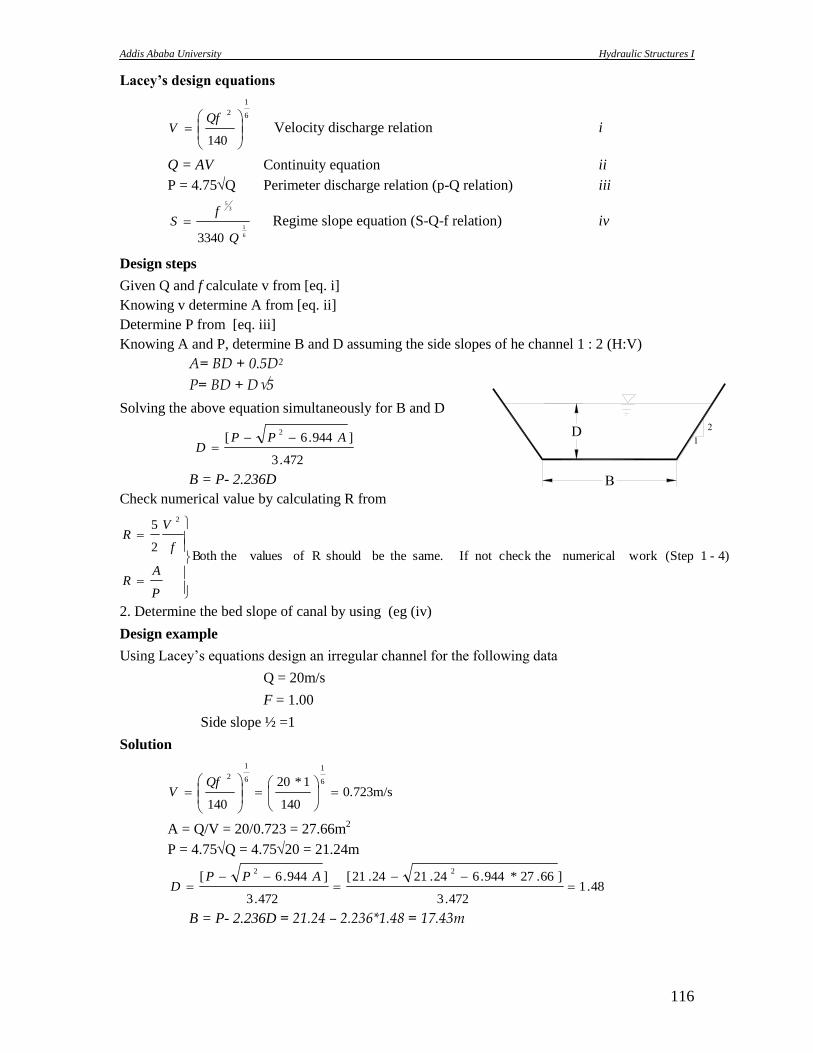
Addis Ababa University Hydraulic Structures I
116
Lacey’s design equations
140
6
1
2
QfV Velocity discharge relation i
Q = AV Continuity equation ii
P = 4.75Q Perimeter discharge relation (p-Q relation) iii
3340 6
1
35
Q
fS Regime slope equation (S-Q-f relation) iv
Design steps
Given Q and f calculate v from [eq. i]
Knowing v determine A from [eq. ii]
Determine P from [eq. iii]
Knowing A and P, determine B and D assuming the side slopes of he channel 1 : 2 (H:V)
A= BD + 0.5D2
P= BD + D5
Solving the above equation simultaneously for B and D
472.3
]944.6[2
APPD
B = P- 2.236D
Check numerical value by calculating R from
4)-1 (Step work numerical check thenot If same. thebe should R of valuesBoth the2
52
P
AR
f
VR
2. Determine the bed slope of canal by using (eg (iv)
Design example
Using Lacey‟s equations design an irregular channel for the following data
Q = 20m/s
F = 1.00
Side slope ½ =1
Solution
0.723m/s 140
1*20
140
6
1
6
1
2
QfV
A = Q/V = 20/0.723 = 27.66m2
P = 4.75Q = 4.7520 = 21.24m
48.1472.3
]66.27*944.624.2124.21[
472.3
]944.6[22
APP
D
B = P- 2.236D = 21.24 – 2.236*1.48 = 17.43m
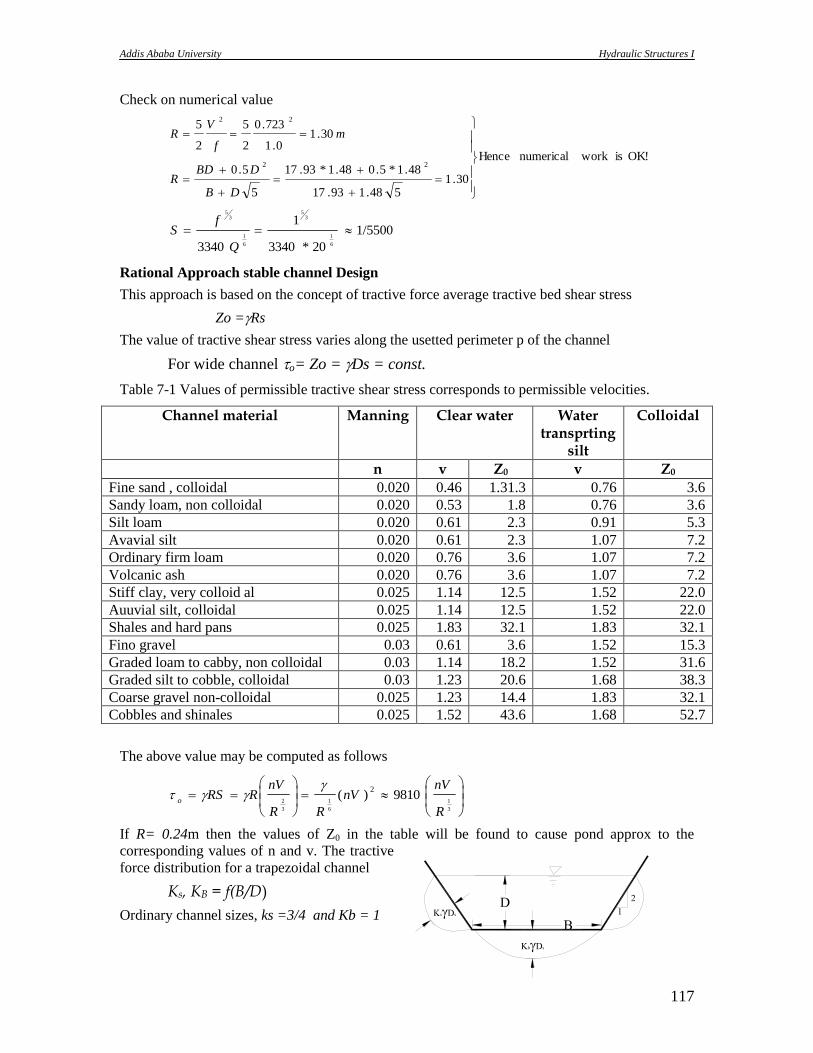
Addis Ababa University Hydraulic Structures I
117
Check on numerical value
OK! is work numerical Hence
30.1548.193.17
48.1*5.048.1*93.17
5
5.0
30.10.1
723.0
2
5
2
5
22
22
DB
DBDR
mf
VR
1/5500
20*3340
1
3340 6
1
35
6
1
35
Q
fS
Rational Approach stable channel Design
This approach is based on the concept of tractive force average tractive bed shear stress
Zo =Rs
The value of tractive shear stress varies along the usetted perimeter p of the channel
For wide channel o= Zo = Ds = const.
Table 7-1 Values of permissible tractive shear stress corresponds to permissible velocities.
Channel material Manning Clear water Water transprting
silt
Colloidal
n v Z0 v Z0
Fine sand , colloidal 0.020 0.46 1.31.3 0.76 3.6
Sandy loam, non colloidal 0.020 0.53 1.8 0.76 3.6
Silt loam 0.020 0.61 2.3 0.91 5.3
Avavial silt 0.020 0.61 2.3 1.07 7.2
Ordinary firm loam 0.020 0.76 3.6 1.07 7.2
Volcanic ash 0.020 0.76 3.6 1.07 7.2
Stiff clay, very colloid al 0.025 1.14 12.5 1.52 22.0
Auuvial silt, colloidal 0.025 1.14 12.5 1.52 22.0
Shales and hard pans 0.025 1.83 32.1 1.83 32.1
Fino gravel 0.03 0.61 3.6 1.52 15.3
Graded loam to cabby, non colloidal 0.03 1.14 18.2 1.52 31.6
Graded silt to cobble, colloidal 0.03 1.23 20.6 1.68 38.3
Coarse gravel non-colloidal 0.025 1.23 14.4 1.83 32.1
Cobbles and shinales 0.025 1.52 43.6 1.68 52.7
The above value may be computed as follows
3
1
6
1
3
29810)(
2
R
nVnV
RR
nVRRS
o
If R= 0.24m then the values of Z0 in the table will be found to cause pond approx to the
corresponding values of n and v. The tractive
force distribution for a trapezoidal channel
Ks, KB = f(B/D)
Ordinary channel sizes, ks =3/4 and Kb = 1
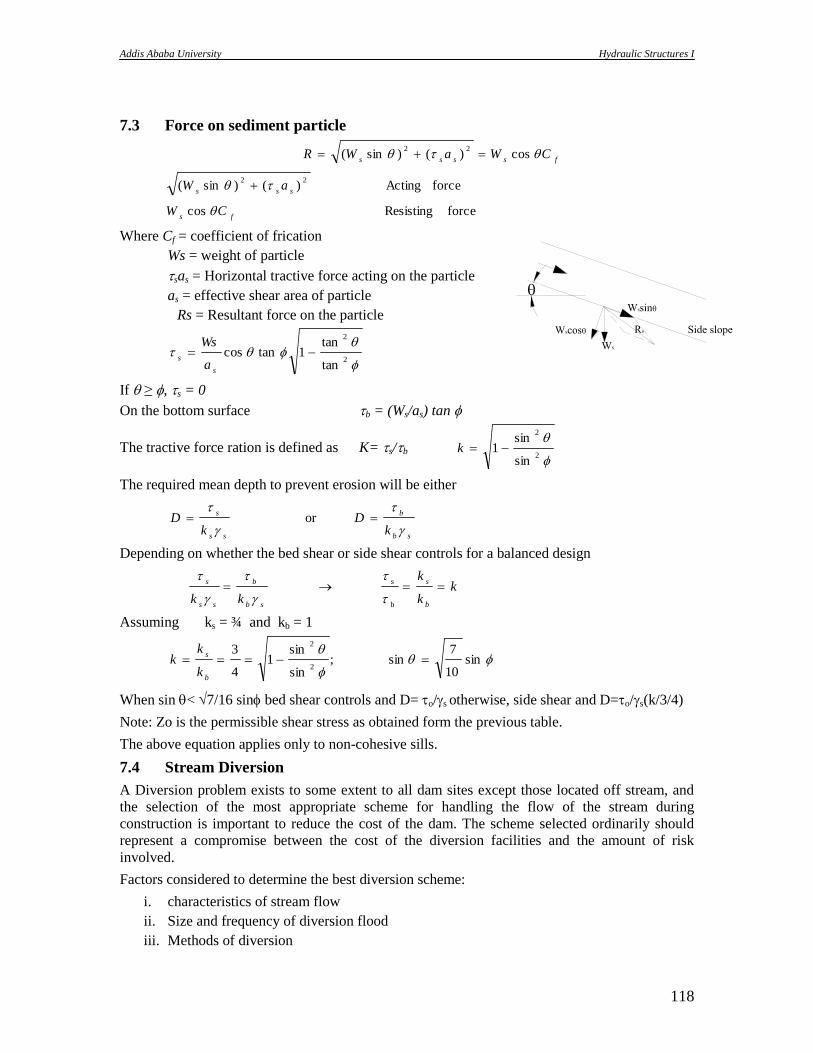
Addis Ababa University Hydraulic Structures I
118
7.3 Force on sediment particle
force Resisting cos
force Acting )()sin(
cos)()sin(
22
22
fs
sss
fssss
CW
aW
CWaWR
Where Cf = coefficient of frication
Ws = weight of particle
sas = Horizontal tractive force acting on the particle
as = effective shear area of particle
Rs = Resultant force on the particle
2
2
tan
tan1tancos
s
sa
Ws
If ≥ , s = 0
On the bottom surface b = (Ws/as) tan
The tractive force ration is defined as K= s/b
2
2
sin
sin1 k
The required mean depth to prevent erosion will be either
sb
b
ss
s
kD
kD
or
Depending on whether the bed shear or side shear controls for a balanced design
kk
k
kkb
s
sb
b
ss
s
b
s
Assuming ks = ¾ and kb = 1
sin
10
7sin ;
sin
sin1
4
3
2
2
b
s
k
kk
When sin < 7/16 sin bed shear controls and D= o/s otherwise, side shear and D=o/s(k/3/4)
Note: Zo is the permissible shear stress as obtained form the previous table.
The above equation applies only to non-cohesive sills.
7.4 Stream Diversion
A Diversion problem exists to some extent to all dam sites except those located off stream, and
the selection of the most appropriate scheme for handling the flow of the stream during
construction is important to reduce the cost of the dam. The scheme selected ordinarily should
represent a compromise between the cost of the diversion facilities and the amount of risk
involved.
Factors considered to determine the best diversion scheme:
i. characteristics of stream flow
ii. Size and frequency of diversion flood
iii. Methods of diversion
Addis Ababa University Hydraulic Structures I
119
iv. Specification requirements.
Objective: to select optimum seneme considering practicability cost and the risks involved.
Diversion provisions commonly used singly or in combination:
i. Tunnels driven through the abutments
ii. Conduits through or under the dam
iii. Temporary channels through the dam
iv. Multiple stage diversion over the tops of alternate construction blocks of a concrete dam.
Common problem: Meeting of d/s equipments when the entire flow of the stream is slopped
during the closure of the diversion works.
Solution: provide by pumping or through by passes or phons until water is stored in the reservoir
to a sufficient level to release by gravity through outlet works.
Tunnels
More feasible for narrow canyons either for a concreter or for an earth fill dam.
Placed in one or both abutments.
If tunnel spillways or tunnel outlet works are provided in the design of the dam. It usually proves
economical to use them in the diversion plan.
Temporary auxiliary steam level conduit leading to the intersection of the horizontal
portion of the spillway tunnel and the inclined shaft (leading to the spillway gate
structure) is provided to by pass the flow.
Shutting of diversion flows; regulation of flow through the diversion tunnel
Example: An arrangement consisting of u/s bulk head with pipes in ht bulk head for regulation of
flow can be provided.
Conduits
Conduit outlet works designed of an earth fill dam may be utilized of diversion.
o Economical especially if the conduit is adequate to carry the diversion flows.
Where diversion requirement is greater than the capacity of outlet works, increase the
capacity:
o By delaying the installation of gates valves, pipe and trash racks until the need
for diversion is over;
o By increasing the height of the cofferdam (increasing the head)
In cases where the intake to outlet works conduit is above the level of the streambed, an
auxiliary steam level conduit may be provided to join the lower portion of the permanent
conduit. Permanent closure of the auxiliary conduit is accomplished by a concrete plug.
Diversion conduits at stream level are sometimes provided through a concrete dam. After
the requirement for diversion is over, the conduits must be permanently closed
throughout their entire length by concrete plugs.
Temporary diversion Channel-Earth fills Dams
A Temporary channel through the earth fill dam;
Side slope should be flatter than 4 to 1:
o To facilitate filling of the gap at the end of the construction period;
o To decrease the danger of cracking of the embankment due to differential
settlements.
o To secure a good bonding surface b/n the previously constructed embankment
and the material to be placed.
Provided when a division tunnel or conduit is net economical;
Adaptable to wide sites
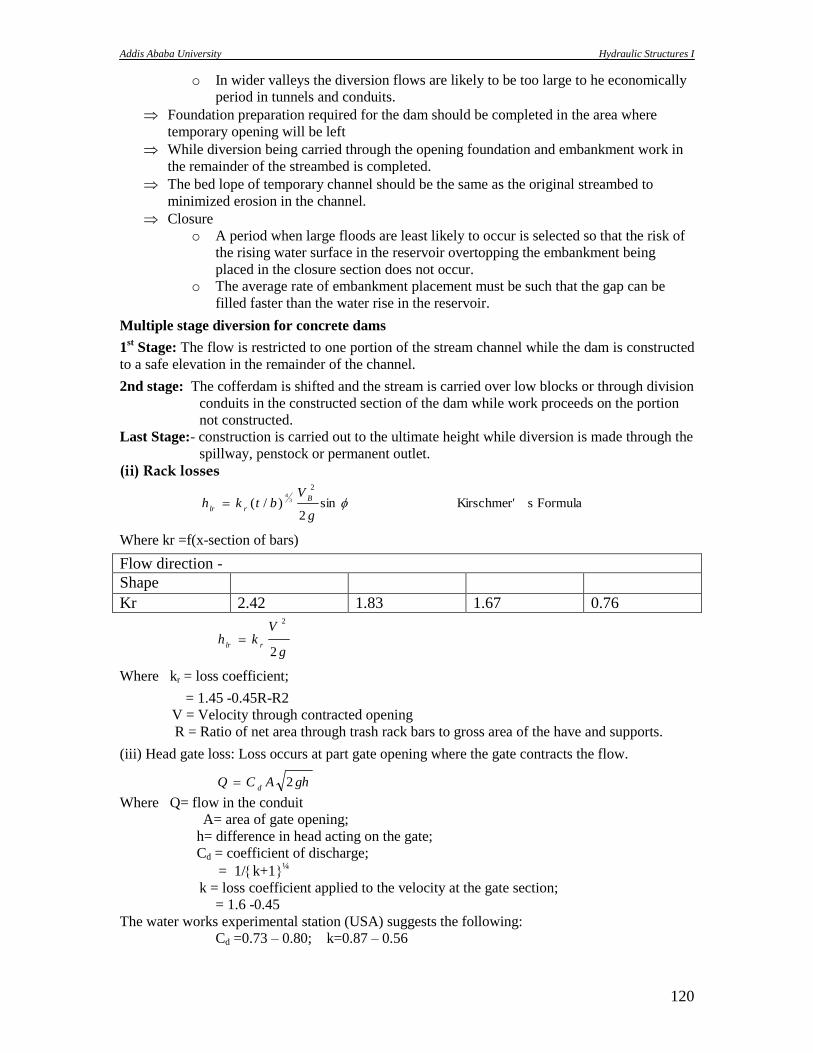
Addis Ababa University Hydraulic Structures I
120
o In wider valleys the diversion flows are likely to be too large to he economically
period in tunnels and conduits.
Foundation preparation required for the dam should be completed in the area where
temporary opening will be left
While diversion being carried through the opening foundation and embankment work in
the remainder of the streambed is completed.
The bed lope of temporary channel should be the same as the original streambed to
minimized erosion in the channel.
Closure
o A period when large floods are least likely to occur is selected so that the risk of
the rising water surface in the reservoir overtopping the embankment being
placed in the closure section does not occur.
o The average rate of embankment placement must be such that the gap can be
filled faster than the water rise in the reservoir.
Multiple stage diversion for concrete dams
1st Stage: The flow is restricted to one portion of the stream channel while the dam is constructed
to a safe elevation in the remainder of the channel.
2nd stage: The cofferdam is shifted and the stream is carried over low blocks or through division
conduits in the constructed section of the dam while work proceeds on the portion
not constructed.
Last Stage:- construction is carried out to the ultimate height while diversion is made through the
spillway, penstock or permanent outlet.
(ii) Rack losses
Formula sKirschmer' sin2
)/(
2
34
g
Vbtkh
B
rlr
Where kr =f(x-section of bars)
Flow direction -
Shape Kr 2.42 1.83 1.67 0.76
g
Vkh
rlr2
2
Where kr = loss coefficient;
= 1.45 -0.45R-R2
V = Velocity through contracted opening
R = Ratio of net area through trash rack bars to gross area of the have and supports.
(iii) Head gate loss: Loss occurs at part gate opening where the gate contracts the flow.
ghACQd
2
Where Q= flow in the conduit
A= area of gate opening;
h= difference in head acting on the gate;
Cd = coefficient of discharge;
= 1/k+1¼
k = loss coefficient applied to the velocity at the gate section;
= 1.6 -0.45
The water works experimental station (USA) suggests the following:
Cd =0.73 – 0.80; k=0.87 – 0.56

Addis Ababa University Hydraulic Structures I
121
In addition to the above three major losses and the friction loss there are other conduit losses
(losses due to expansion, construction, bends, bifurcation, junctions, valve passages and exit).
The expressions for the above may be obtained form any standard text.

Addis Ababa University Hydraulic Structures I
122
References: 1. M.M. Grishin, Hydraulic Structures, vol. 1, Mir Publishers, 1987, Moscow.
2. P.N. Moodi, Irrigation Water Resources and Water Power Engineering, Standard
Book House, 1995, New Delhi.
3. S.K.Garg, Irrigation Engineering and Hydraulic Structures,
4. Design of Small Dams. U.S. Bureau of Reclamation. 4th Ed.
5. Prof. Bollrich ,G Manual on Functional Hydraulic Structures for Dams,.
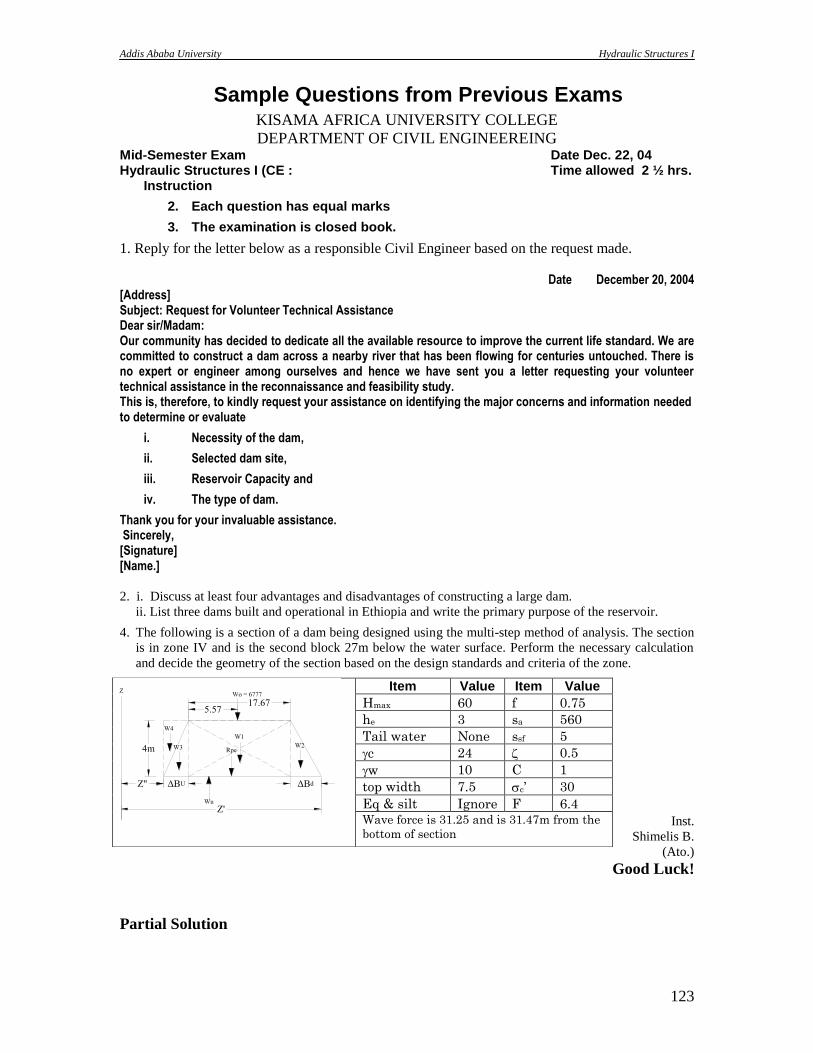
Addis Ababa University Hydraulic Structures I
123
Sample Questions from Previous Exams KISAMA AFRICA UNIVERSITY COLLEGE
DEPARTMENT OF CIVIL ENGINEEREING Mid-Semester Exam Date Dec. 22, 04 Hydraulic Structures I (CE : Time allowed 2 ½ hrs.
Instruction
2. Each question has equal marks
3. The examination is closed book.
1. Reply for the letter below as a responsible Civil Engineer based on the request made.
Date December 20, 2004 [Address] Subject: Request for Volunteer Technical Assistance Dear sir/Madam: Our community has decided to dedicate all the available resource to improve the current life standard. We are committed to construct a dam across a nearby river that has been flowing for centuries untouched. There is no expert or engineer among ourselves and hence we have sent you a letter requesting your volunteer technical assistance in the reconnaissance and feasibility study. This is, therefore, to kindly request your assistance on identifying the major concerns and information needed to determine or evaluate
i. Necessity of the dam,
ii. Selected dam site,
iii. Reservoir Capacity and
iv. The type of dam.
Thank you for your invaluable assistance. Sincerely, [Signature] [Name.]
2. i. Discuss at least four advantages and disadvantages of constructing a large dam.
ii. List three dams built and operational in Ethiopia and write the primary purpose of the reservoir.
4. The following is a section of a dam being designed using the multi-step method of analysis. The section
is in zone IV and is the second block 27m below the water surface. Perform the necessary calculation
and decide the geometry of the section based on the design standards and criteria of the zone.
Inst.
Shimelis B.
(Ato.)
Good Luck!
Partial Solution
Item Value Item Value
Hmax 60 f 0.75
he 3 sa 560
Tail water None ssf 5
c 24 0.5
w 10 C 1
top width 7.5 c’ 30
Eq & silt Ignore F 6.4 Wave force is 31.25 and is 31.47m from the
bottom of section
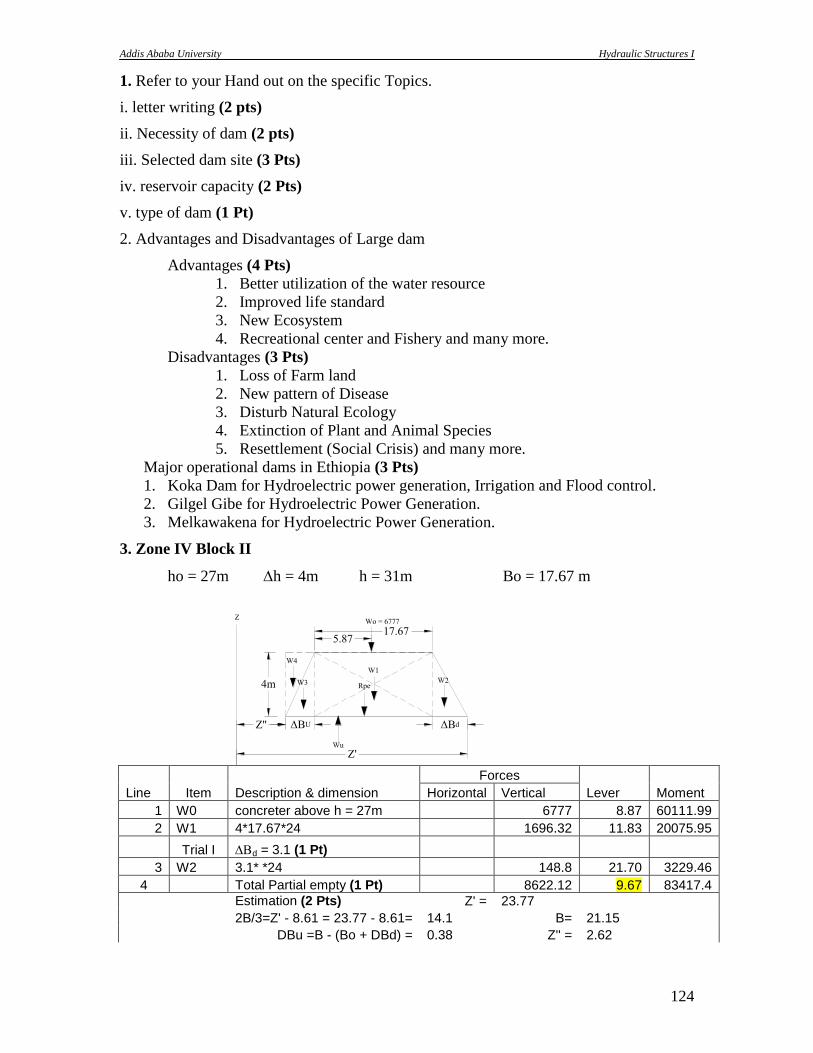
Addis Ababa University Hydraulic Structures I
124
1. Refer to your Hand out on the specific Topics.
i. letter writing (2 pts)
ii. Necessity of dam (2 pts)
iii. Selected dam site (3 Pts)
iv. reservoir capacity (2 Pts)
v. type of dam (1 Pt)
2. Advantages and Disadvantages of Large dam
Advantages (4 Pts)
1. Better utilization of the water resource
2. Improved life standard
3. New Ecosystem
4. Recreational center and Fishery and many more.
Disadvantages (3 Pts)
1. Loss of Farm land
2. New pattern of Disease
3. Disturb Natural Ecology
4. Extinction of Plant and Animal Species
5. Resettlement (Social Crisis) and many more.
Major operational dams in Ethiopia (3 Pts)
1. Koka Dam for Hydroelectric power generation, Irrigation and Flood control.
2. Gilgel Gibe for Hydroelectric Power Generation.
3. Melkawakena for Hydroelectric Power Generation.
3. Zone IV Block II
ho = 27m h = 4m h = 31m Bo = 17.67 m
Line Item Description & dimension
Forces
Lever Moment Horizontal Vertical
1 W0 concreter above h = 27m 6777 8.87 60111.99
2 W1 4*17.67*24 1696.32 11.83 20075.95
Trial I d = 3.1 (1 Pt)
3 W2 3.1* *24 148.8 21.70 3229.46
4 Total Partial empty (1 Pt) 8622.12 9.67 83417.4
Estimation (2 Pts) Z' = 23.77
2B/3=Z' - 8.61 = 23.77 - 8.61= 14.1 B= 21.15
DBu =B - (Bo + DBd) = 0.38 Z'' = 2.62
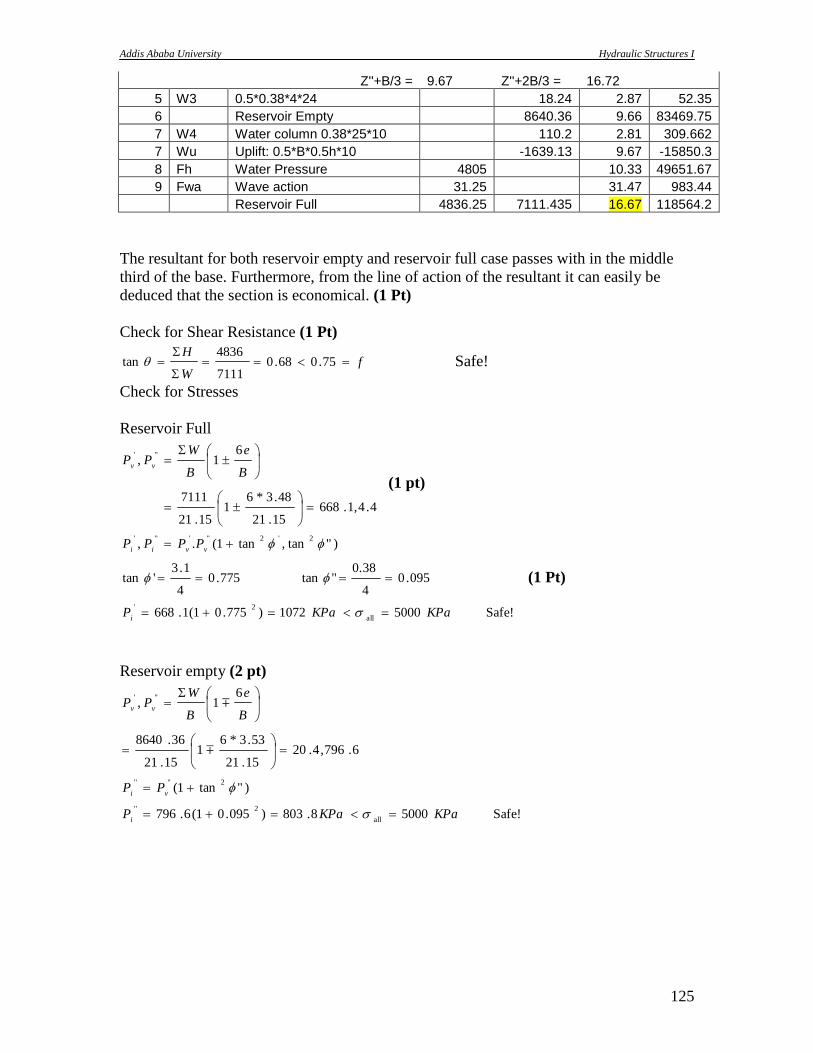
Addis Ababa University Hydraulic Structures I
125
Z''+B/3 = 9.67 Z''+2B/3 = 16.72
5 W3 0.5*0.38*4*24 18.24 2.87 52.35
6 Reservoir Empty 8640.36 9.66 83469.75
7 W4 Water column 0.38*25*10 110.2 2.81 309.662
7 Wu Uplift: 0.5*B*0.5h*10 -1639.13 9.67 -15850.3
8 Fh Water Pressure 4805 10.33 49651.67
9 Fwa Wave action 31.25 31.47 983.44
Reservoir Full 4836.25 7111.435 16.67 118564.2
The resultant for both reservoir empty and reservoir full case passes with in the middle
third of the base. Furthermore, from the line of action of the resultant it can easily be
deduced that the section is economical. (1 Pt)
Check for Shear Resistance (1 Pt)
fW
H
75.068.0
7111
4836tan Safe!
Check for Stresses
Reservoir Full
4.4,1.66815.21
48.3*61
15.21
7111
61,
"'
B
e
B
WPP
vv
(1 pt)
Safe! 5000 1072)775.01(1.668
095.04
0.38 " tan 775.0
4
1.3'tan
)"tan,tan1(.,
all
2'
2'2"'"'
KPaKPaP
PPPP
i
vvii
(1 Pt)
Reservoir empty (2 pt)
Safe! 5000 8.803)095.01(6.796
)"tan1(
6.796,4.2015.21
53.3*61
15.21
36.8640
61,
all
2''
2"''
"'
KPaKPaP
PP
B
e
B
WPP
i
vi
vv
Addis Ababa University Hydraulic Structures I
126
KISAMA AFRICA UNIVERSITY COLLEGE
DEPARTMENT OF CIVIL ENGINEEREING Mid-Semester Exam Date Dec. 22, 04
Hydraulic Structure I: Time allowed 2 ½ hrs.
The examination is Open book.
Part I Multiple Choice
Among the four alternative answers choose the best answer that fits to each question.
Each question has 2 marks.
1. Earthen dams are:
a. rigid dams c. overflow dams
b. non rigid dams d. diversion dams
2. when sand and gravel foundation strata is available at a proposed dam site of moderate
height, the dam may be of the type:
a. Earthen dam or rock fills dam c. double arch dam
b. masonry gravity dam d. concrete gravity dam
3. Yield of a reservoir represents:
a. The inflow into the reservoir c. the outflow demand on the reservoir
b. The capacity of the reservoir d. none of the above
4. The capacity of a storage reservoir can be decided by using:
a. The mass curve of inflow c. by both (a) and (b)
b. The mass curve of outflow d. none of the above.
5. According to thin cylinder theory the volume of concrete required for an arch dam would
be minimum if the central angle is:
a. 150034‟ c. 136
034‟
b. 133034‟ d. 140
034‟
6. The slope of the upstream face of a flat-slab type buttress dam
a. Is always less than 350 c. usually varies from 35
0 to 45
0
b. Is always more than 450 d. none of the above
7. When seepage takes place through the body of an earthen dam, it leads to:
a. development of pore pressures in the dam body c. reduction in the shear stresses in the
dam
b. reduction in the shear strength of the dam d. both (a) and (b)
8. When the water level standing against an earthen embankment, suddenly falls down, then
there is an imminent risk of sliding failure, to the:
a. upstream slope c. both (a) and (b)
b. downstream slope d. none of the above
9. During the maintenance of an earthen dam, the apparent seepage through the foundation
of the dam is best taken care of , by providing:
a. A chimney drain c. a drain trench along the d/s toe
b. A rock toe d. an u/s impervious cutoff
10. Which one of the following spillways is least suited to earthen dams?
a. Ogee spillway c. chute spillway
b. Side channel spillway d. shaft spillway
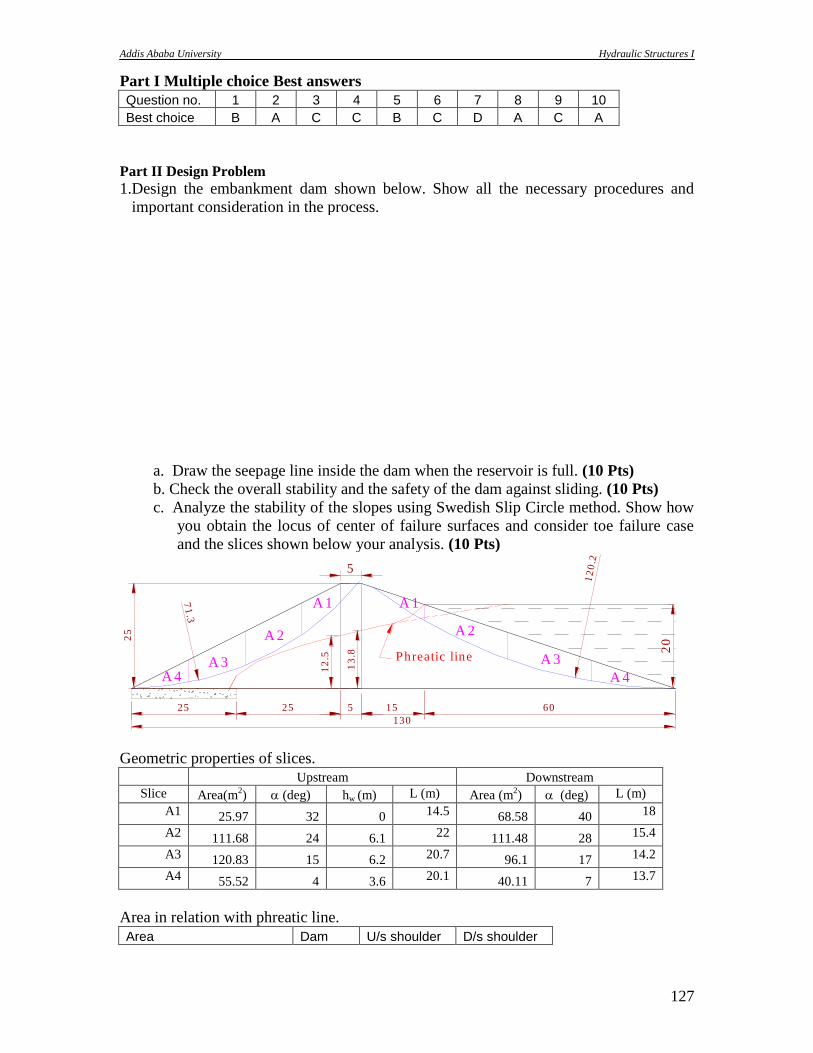
Addis Ababa University Hydraulic Structures I
127
Part I Multiple choice Best answers
Question no. 1 2 3 4 5 6 7 8 9 10
Best choice B A C C B C D A C A
Part II Design Problem 1.Design the embankment dam shown below. Show all the necessary procedures and
important consideration in the process.
a. Draw the seepage line inside the dam when the reservoir is full. (10 Pts)
b. Check the overall stability and the safety of the dam against sliding. (10 Pts)
c. Analyze the stability of the slopes using Swedish Slip Circle method. Show how
you obtain the locus of center of failure surfaces and consider toe failure case
and the slices shown below your analysis. (10 Pts)
13
.8
12
.5
A 1
A 2
A 3
A 4A 3
A 4
A 2
A 1
202
5
25 25 5 15 60
130
5
12
0.2
71
.3
Phreatic line
Geometric properties of slices.
Upstream Downstream
Slice Area(m2) (deg) hw (m) L (m) Area (m
2) (deg) L (m)
A1 25.97 32 0 14.5 68.58 40 18
A2 111.68 24 6.1 22 111.48 28 15.4
A3 120.83 15 6.2 20.7 96.1 17 14.2
A4 55.52 4 3.6 20.1 40.11 7 13.7
Area in relation with phreatic line.
Area Dam U/s shoulder D/s shoulder
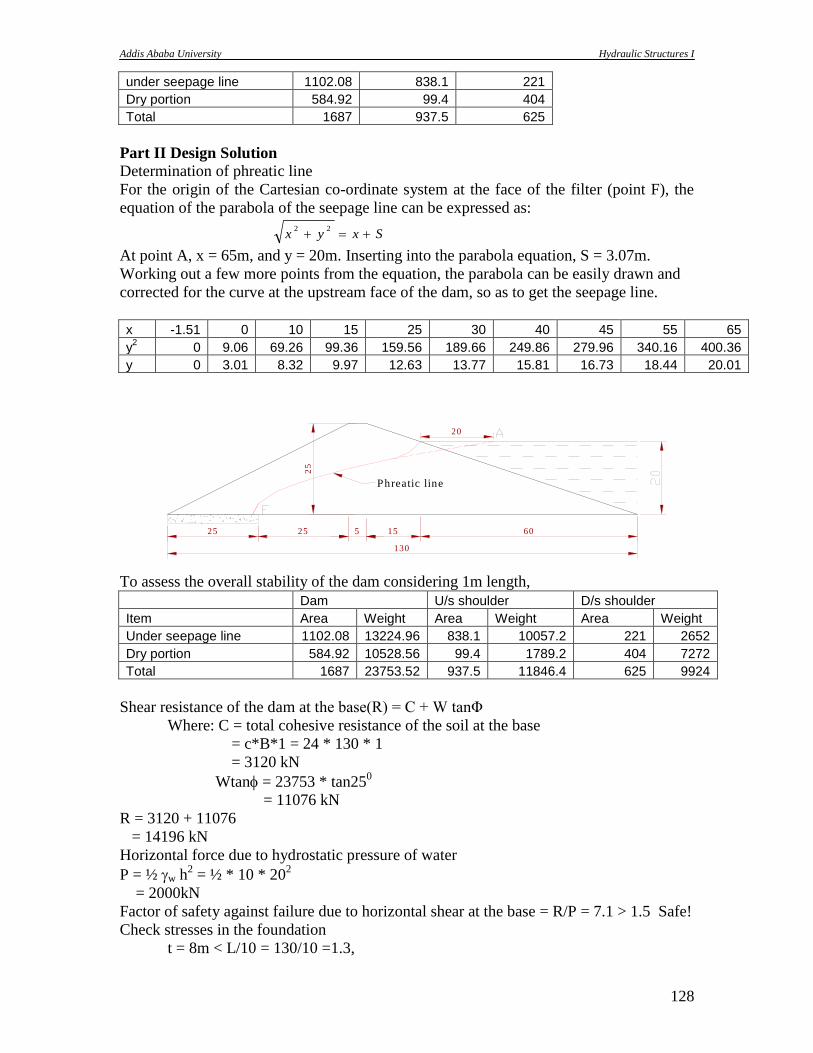
Addis Ababa University Hydraulic Structures I
128
under seepage line 1102.08 838.1 221
Dry portion 584.92 99.4 404
Total 1687 937.5 625
Part II Design Solution
Determination of phreatic line
For the origin of the Cartesian co-ordinate system at the face of the filter (point F), the
equation of the parabola of the seepage line can be expressed as:
Sxyx 22
At point A, x = 65m, and y = 20m. Inserting into the parabola equation, S = 3.07m.
Working out a few more points from the equation, the parabola can be easily drawn and
corrected for the curve at the upstream face of the dam, so as to get the seepage line.
x -1.51 0 10 15 25 30 40 45 55 65
y2 0 9.06 69.26 99.36 159.56 189.66 249.86 279.96 340.16 400.36
y 0 3.01 8.32 9.97 12.63 13.77 15.81 16.73 18.44 20.01
25
25 25 5 15 60
130
20
Phreatic line
To assess the overall stability of the dam considering 1m length,
Dam U/s shoulder D/s shoulder
Item Area Weight Area Weight Area Weight
Under seepage line 1102.08 13224.96 838.1 10057.2 221 2652
Dry portion 584.92 10528.56 99.4 1789.2 404 7272
Total 1687 23753.52 937.5 11846.4 625 9924
Shear resistance of the dam at the base(R) = C + W tanΦ
Where: C = total cohesive resistance of the soil at the base
= c*B*1 = 24 * 130 * 1
= 3120 kN
Wtan = 23753 * tan250
= 11076 kN
R = 3120 + 11076
= 14196 kN
Horizontal force due to hydrostatic pressure of water
P = ½ w h2 = ½ * 10 * 20
2
= 2000kN
Factor of safety against failure due to horizontal shear at the base = R/P = 7.1 > 1.5 Safe!
Check stresses in the foundation
t = 8m < L/10 = 130/10 =1.3,
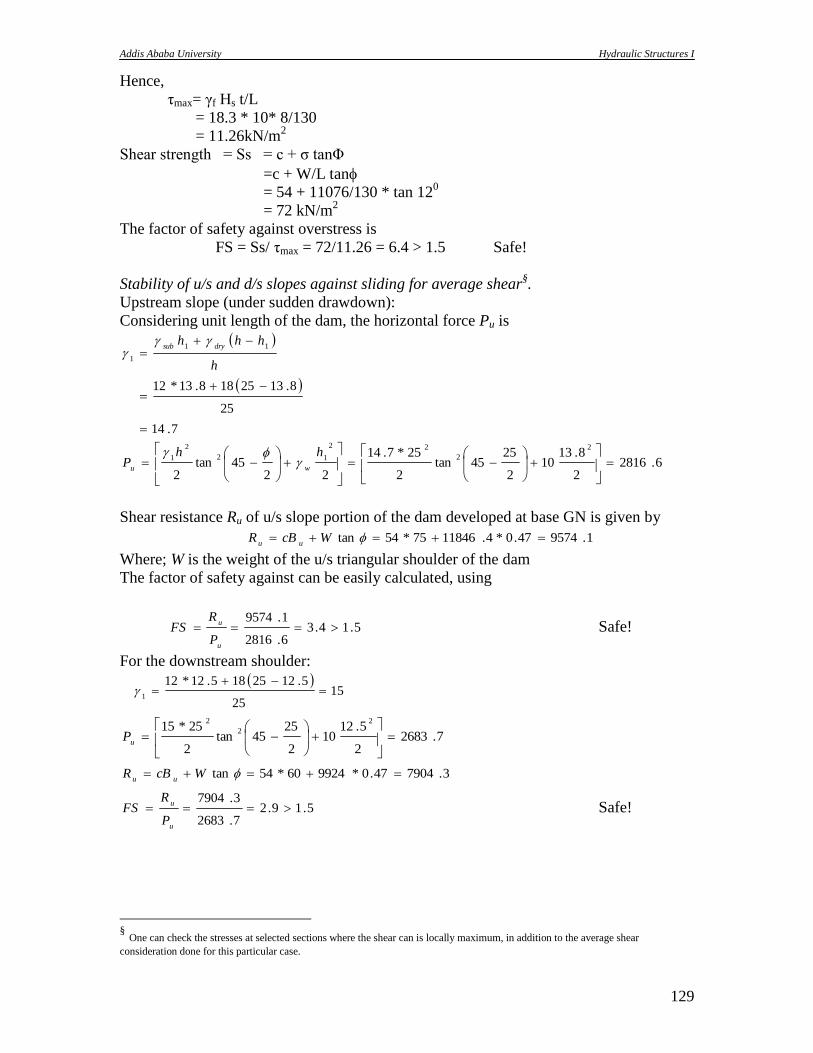
Addis Ababa University Hydraulic Structures I
129
Hence,
τmax= γf Hs t/L
= 18.3 * 10* 8/130
= 11.26kN/m2
Shear strength = Ss = c + σ tanΦ
=c + W/L tan
= 54 + 11076/130 * tan 120
= 72 kN/m2
The factor of safety against overstress is
FS = Ss/ τmax = 72/11.26 = 6.4 > 1.5 Safe!
Stability of u/s and d/s slopes against sliding for average shear§.
Upstream slope (under sudden drawdown):
Considering unit length of the dam, the horizontal force Pu is
7.14
25
8.1325188.13*12
11
1
h
hhhdrysub
6.28162
8.1310
2
2545tan
2
25*7.14
2245tan
2
2
2
22
12
2
1
hhP
wu
Shear resistance Ru of u/s slope portion of the dam developed at base GN is given by
1.957447.0*4.1184675*54tan WcBRuu
Where; W is the weight of the u/s triangular shoulder of the dam
The factor of safety against can be easily calculated, using
5.14.36.2816
1.9574
u
u
P
RFS Safe!
For the downstream shoulder:
15
25
5.1225185.12*121
7.26832
5.1210
2
2545tan
2
25*152
2
2
uP
3.790447.0*992460*54tan WcBRuu
5.19.27.2683
3.7904
u
u
P
RFS Safe!
§ One can check the stresses at selected sections where the shear can is locally maximum, in addition to the average shear
consideration done for this particular case.

Addis Ababa University Hydraulic Structures I
130
Analysis of upstream and downstream slopes by Swedish Circle method:
Slice Area W T N U L UL N‟=N-ul tanΦ N‟tanΦ Cl N‟tanΦ+cl
A1 25.97 32 467.46 247.72 396.43 0 14.5 0 396.43 0.47 186.32 348 534.32
A2 111.68 24 1340.16 545.09 1224.3 61 22 1342 -117.7 0.47 -55.32 528 472.68
A3 120.83 15 1449.96 375.28 1400.55 62 20.7 1283.4 117.15 0.47 55.06 496.8 551.861
A4 55.52 4 666.24 46.47 664.62 36 20.1 723.6 -58.98 0.47 -27.72 482.4 454.68
Σ T 1214.56 Σ (N‟tanΦ+cl) 2013.54
5.166.156.1214
54.2013tan
'
'
T
NLcFS
ii
Safe!
Slice Area W T N l N‟=N-ul tanΦ N‟tanΦ Cl N‟tanΦ+cl
A1 68.58 40 1234.44 793.48 945.64 18 945.64 0.47 444.45 432 876.45
A2 111.48 28 2006.64 942.06 1771.76 15.4 1771.76 0.47 832.73 369.6 1202.33
A3 96.1 17 1729.8 505.74 1654.22 14.2 1654.22 0.47 777.48 340.8 1118.28
A4 40.11 7 721.98 87.99 716.6 13.7 716.6 0.47 336.8 328.8 665.6
2329.27 Σ (N‟tanΦ+cl) 3862.66
5.166.127.2329
66.3862FS Safe!
Addis Ababa University Hydraulic Structures I
131
DANDI BORU UNIVERSITY COLLEGE
DEPARTMENT OF CIVIL ENGINEEREING
Mid-Semester Exam Date 14 April 2005
Hydraulic Structure Time allowed 2 hrs.
Instruction
5. Each question has equal marks
6. The examination is closed book.
1. Explain with illustrative sketch how you determine the capacity of reservoir to avoid
drought.
2. How will you find the dead and live storage of a reservoir?
3. Discuss at least four advantages and disadvantages of constructing a large dam.
4. List three dams built and operational in Ethiopia and write the primary purpose of the
reservoir.
5. List down and discuss briefly the various ways of controlling sedimentation of
reservoirs
6. How are dams classified? Discuss in detail.
7. What factors affect the selection of site for a dam? Discuss them briefly.
8. Compare and contrast the advantages and disadvantages of earth foundation and rock
foundations.
9. Briefly discuss the possible challenges for both earth and rock foundation
10. Describe various ways of treating coarse grained earth foundations against seepage
flow and danger of piping.
Addis Ababa University Hydraulic Structures I
132
DANDI BORU UNIVERSITY COLLEGE
DEPARTMENT OF CIVIL ENGINEEREING
Final Exam Date 23 June 2005
Hydraulic Structure Time allowed 2 hrs.
The examination is Open book.
Part I Multiple Choice
Among the four alternative answers choose the best answer that fits to each question.
Each question has 2 marks.
11. Earthen dams are:
a. rigid dams c. overflow dams
b. non rigid dams d. diversion dams
12. when sand and gravel foundation strata is available at a proposed dam site of moderate
height, the dam may be of the type:
a. Earthen dam or rock fills dam c. double arch dam
b. masonry gravity dam d. concrete gravity dam
13. Yield of a reservoir represents:
a. The inflow into the reservoir c. the outflow demand on the reservoir
b. The capacity of the reservoir d. none of the above
14. The capacity of a storage reservoir can be decided by using:
a. The mass curve of inflow c. by both (a) and (b)
b. The mass curve of outflow d. none of the above.
15. When seepage takes place through the body of an earthen dam, it leads to:
a. development of pore pressures in the dam body c. reduction in the shear stresses in the
dam
b. reduction in the shear strength of the dam d. both (a) and (b)
16. When the water level standing against an earthen embankment, suddenly falls down, then
there is an imminent risk of sliding failure, to the:
a. upstream slope c. both (a) and (b)
b. downstream slope d. none of the above
17. During the maintenance of an earthen dam, the apparent seepage through the foundation
of the dam is best taken care of , by providing:
a. A chimney drain c. a drain trench along the d/s toe
b. A rock toe d. an u/s impervious cutoff
18. Which one of the following spillways is least suited to earthen dams?
a. Ogee spillway c. chute spillway
b. Side channel spillway d. shaft spillway 19. The spillway, which can be called as an “overflow spillway”, is essentially
a. Ogee spillway c. chute spillway
b. Side channel spillway d. shaft spillway
20. The gated regulator, which is constructed in the parent canal near the site of an offtaking
canal, is
a. Canal head regulator c. cross regulator
b. Distributory head regulator d. none of the above

Addis Ababa University Hydraulic Structures I
133
Part II
1. a. What are spillways and what is their necessity? (5 Pts)
b. Enumerate the different types of spillways which are used in dam construction. (5 Pts) c. Discuss briefly the design principles involved in the design of ogee spillway. (5 Pts)
2. a. Draw a neat sketch of a typical earth dam and and describe the basic elements. (5 Pts) b. What are the causes of failures of earth dam? (5 Pts) c. Explain briefly how the stability of earthen slopes is checked by slip circle method. (5
Pts)
3. a. What are the functions of head regulator? (5 Pts) b. How does “scouring sluice” differ from those of “Head sluices”? (5 Pts)
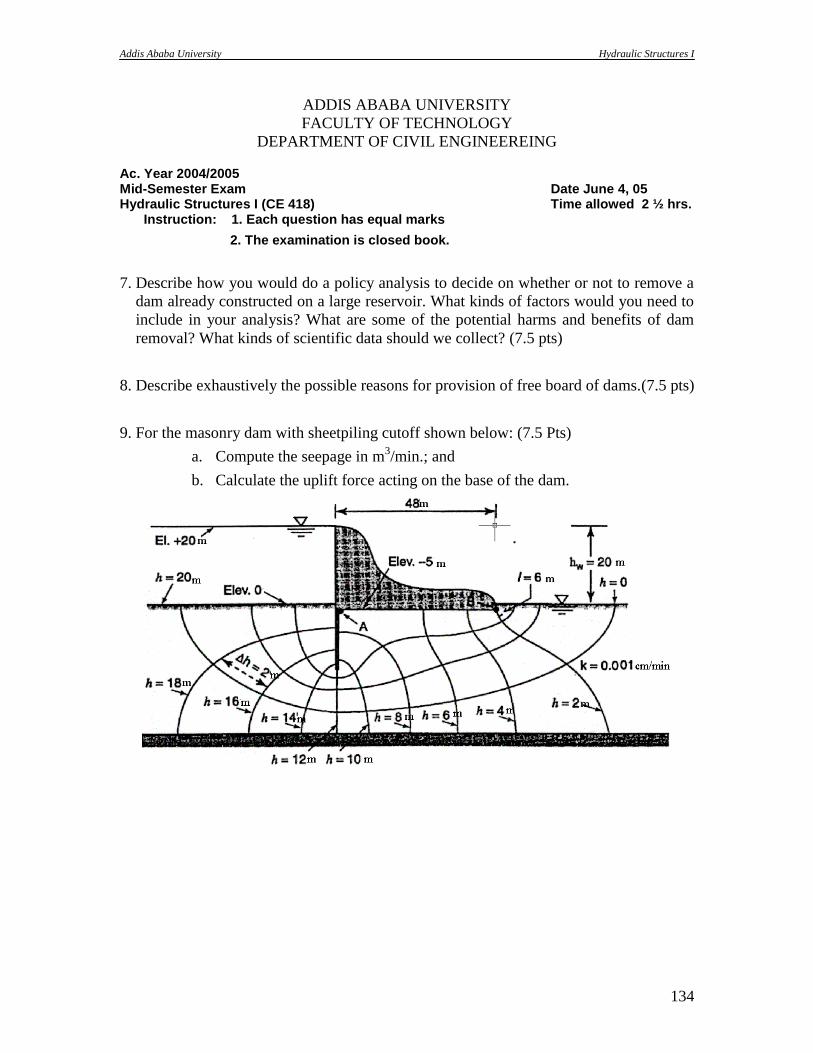
Addis Ababa University Hydraulic Structures I
134
ADDIS ABABA UNIVERSITY
FACULTY OF TECHNOLOGY
DEPARTMENT OF CIVIL ENGINEEREING Ac. Year 2004/2005 Mid-Semester Exam Date June 4, 05 Hydraulic Structures I (CE 418) Time allowed 2 ½ hrs.
Instruction: 1. Each question has equal marks
2. The examination is closed book.
7. Describe how you would do a policy analysis to decide on whether or not to remove a
dam already constructed on a large reservoir. What kinds of factors would you need to
include in your analysis? What are some of the potential harms and benefits of dam
removal? What kinds of scientific data should we collect? (7.5 pts)
8. Describe exhaustively the possible reasons for provision of free board of dams.(7.5 pts)
9. For the masonry dam with sheetpiling cutoff shown below: (7.5 Pts)
a. Compute the seepage in m3/min.; and
b. Calculate the uplift force acting on the base of the dam.
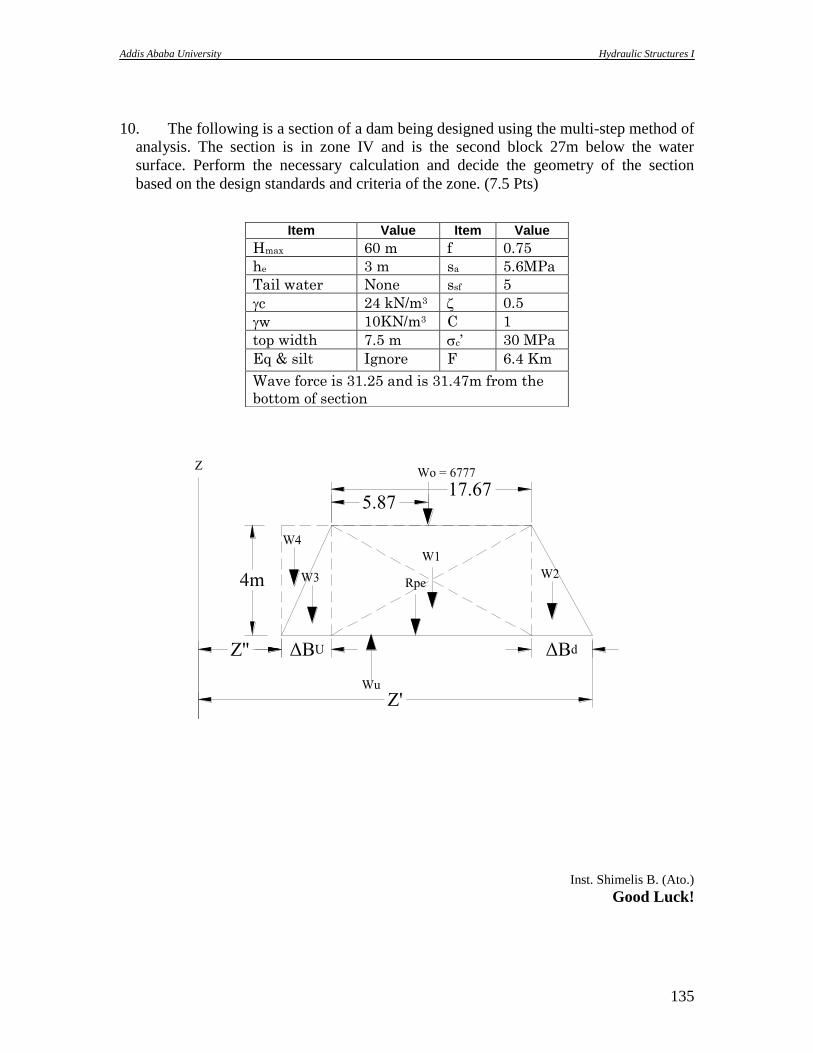
Addis Ababa University Hydraulic Structures I
135
10. The following is a section of a dam being designed using the multi-step method of
analysis. The section is in zone IV and is the second block 27m below the water
surface. Perform the necessary calculation and decide the geometry of the section
based on the design standards and criteria of the zone. (7.5 Pts)
Inst. Shimelis B. (Ato.)
Good Luck!
Item Value Item Value
Hmax 60 m f 0.75
he 3 m sa 5.6MPa
Tail water None ssf 5
c 24 kN/m3 0.5
w 10KN/m3 C 1
top width 7.5 m c’ 30 MPa
Eq & silt Ignore F 6.4 Km
Wave force is 31.25 and is 31.47m from the
bottom of section
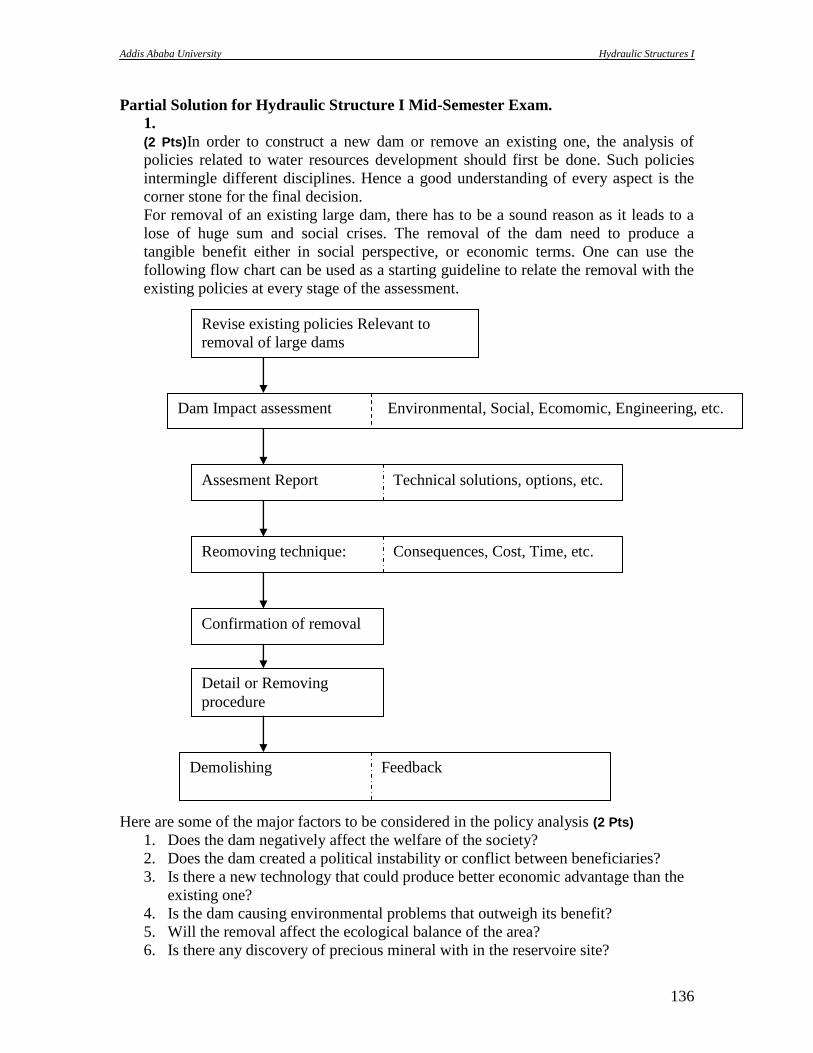
Addis Ababa University Hydraulic Structures I
136
Partial Solution for Hydraulic Structure I Mid-Semester Exam.
1.
(2 Pts)In order to construct a new dam or remove an existing one, the analysis of
policies related to water resources development should first be done. Such policies
intermingle different disciplines. Hence a good understanding of every aspect is the
corner stone for the final decision.
For removal of an existing large dam, there has to be a sound reason as it leads to a
lose of huge sum and social crises. The removal of the dam need to produce a
tangible benefit either in social perspective, or economic terms. One can use the
following flow chart can be used as a starting guideline to relate the removal with the
existing policies at every stage of the assessment.
Here are some of the major factors to be considered in the policy analysis (2 Pts)
1. Does the dam negatively affect the welfare of the society?
2. Does the dam created a political instability or conflict between beneficiaries?
3. Is there a new technology that could produce better economic advantage than the
existing one?
4. Is the dam causing environmental problems that outweigh its benefit?
5. Will the removal affect the ecological balance of the area?
6. Is there any discovery of precious mineral with in the reservoire site?
Dam Impact assessment Environmental, Social, Ecomomic, Engineering, etc.
Assesment Report Technical solutions, options, etc.
Reomoving technique: Consequences, Cost, Time, etc.
Confirmation of removal
Detail or Removing
procedure
Revise existing policies Relevant to
removal of large dams
Demolishing Feedback
Addis Ababa University Hydraulic Structures I
137
7. Is the dam susceptible to failure due to structural defects or geologic reasons that
are not observed during design and construction?
Among the potential harms due to removal of large dams (1 Pt)
Flooding of downstream areas
Lose of money on investments related to the dam such as irrigation schemes,
hydropower, etc.
lose of job for the workers who make their living on activites related to the dam
ecological disturbance
Cost of demolishing
Among the benefits from removal of large dam (1 Pt)
Restoration of the natural water course
More land if the reservoire is suitable for agriculture or urbanization
Avoidance of the risk that lead to the removal of the dam, (eg. Failure, disease,
political or social reasons, etc.)
Better utilization using state of the art technology could be possible
Lesson for future water resource projects
For the analysis various scientific data should be collected (1.5 Pts)
Socio-ecomoic data
Market value of products from the dam (amount of power, irrigation output, etc.)
The impact of the dam on the neigboring areas ( # of deaths, extent of different
dangers imposed due to the presence of the dam)
Need of resettlement if there are areas prone for flooding
Technical data
The total cost of dam construction, dimensions, unique features and the size of the
dam
Hydrologic data
Capacity of the valley
Maxium discharge to be released
Appropriate time for demolishing
Cost of demolishing
Manpower for demolishing etc.
2. The provision of free board for dams is necessary for the following reasons (7.5 Pts)
1. To provide space for wave rise of water in the reservoire
2. To account for settlement of either the foundation or dam or both during the life of
the dam
3. To reduce progressive deterioration of the dam crest due to impact with floating
objects
4. To provide dry and accessible crest of the dam that will not be affected by overflow
of water
5. To put confidence on the layman that excess flood could be taken care of in the
reservoir (psycology)
6. Facilitate spillage of water by damping momentary peak flood
7. To install water level reading staff gauge

Addis Ababa University Hydraulic Structures I
138
3. Seepage flow
To compute the seepage
Alternative I.
h = 2m
k = 0.00001m/min
L[structure] = 48m
I = h/l = 2/6 = 0.33 (1 Pt) q = KIA [Darcy‟s Equation] (1.5 Pt) = 0.00001 * 0.33 * 24
= 8.0 x 10⁻⁵
m3/min Per meter length of structure (1 Pt)
Alternative II
H = 20m is the head differential. (0.5 Pt) Nf = 4 is number of stream lines. (0.5 Pt) Nd = 10 is number of Equipotential lines. (0.5 Pt)
d
f
N
NkHq (1.0 Pt)
min/10*0.810
4*20min*/00001.0
35mm
N
NkHq
d
f (1.0 Pt)
Uplift force on the dam
At point A h1 9m (0.5 Pt) At point B h2 = 2m (0.5 Pt)
Uplift Pressure KPahh
Pwu
552
2910
2
21
(2 Pts)
Uplift force FU = Pu x A = 55 * 48 = 2640 kN per meter length of the structure. (1 Pt)
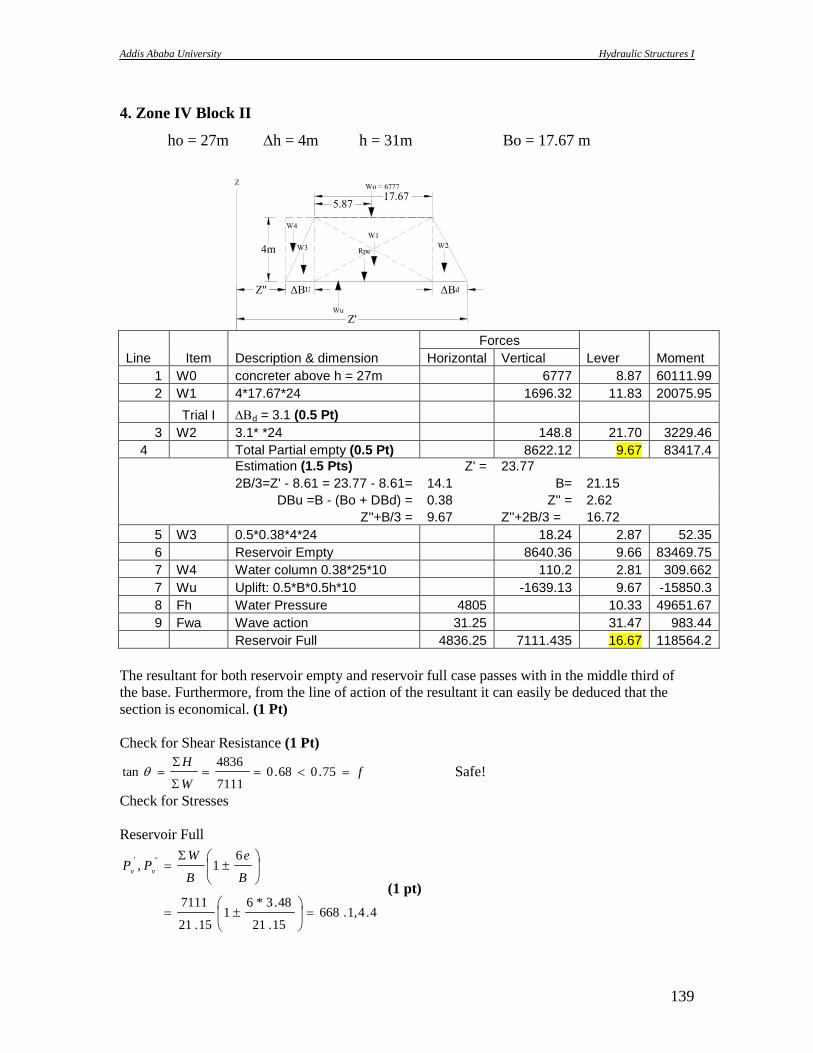
Addis Ababa University Hydraulic Structures I
139
4. Zone IV Block II
ho = 27m h = 4m h = 31m Bo = 17.67 m
Line Item Description & dimension
Forces
Lever Moment Horizontal Vertical
1 W0 concreter above h = 27m 6777 8.87 60111.99
2 W1 4*17.67*24 1696.32 11.83 20075.95
Trial I d = 3.1 (0.5 Pt)
3 W2 3.1* *24 148.8 21.70 3229.46
4 Total Partial empty (0.5 Pt) 8622.12 9.67 83417.4
Estimation (1.5 Pts) Z' = 23.77
2B/3=Z' - 8.61 = 23.77 - 8.61= 14.1 B= 21.15
DBu =B - (Bo + DBd) = 0.38 Z'' = 2.62
Z''+B/3 = 9.67 Z''+2B/3 = 16.72
5 W3 0.5*0.38*4*24 18.24 2.87 52.35
6 Reservoir Empty 8640.36 9.66 83469.75
7 W4 Water column 0.38*25*10 110.2 2.81 309.662
7 Wu Uplift: 0.5*B*0.5h*10 -1639.13 9.67 -15850.3
8 Fh Water Pressure 4805 10.33 49651.67
9 Fwa Wave action 31.25 31.47 983.44
Reservoir Full 4836.25 7111.435 16.67 118564.2
The resultant for both reservoir empty and reservoir full case passes with in the middle third of
the base. Furthermore, from the line of action of the resultant it can easily be deduced that the
section is economical. (1 Pt)
Check for Shear Resistance (1 Pt)
fW
H
75.068.0
7111
4836tan Safe!
Check for Stresses
Reservoir Full
4.4,1.66815.21
48.3*61
15.21
7111
61,
"'
B
e
B
WPP
vv
(1 pt)
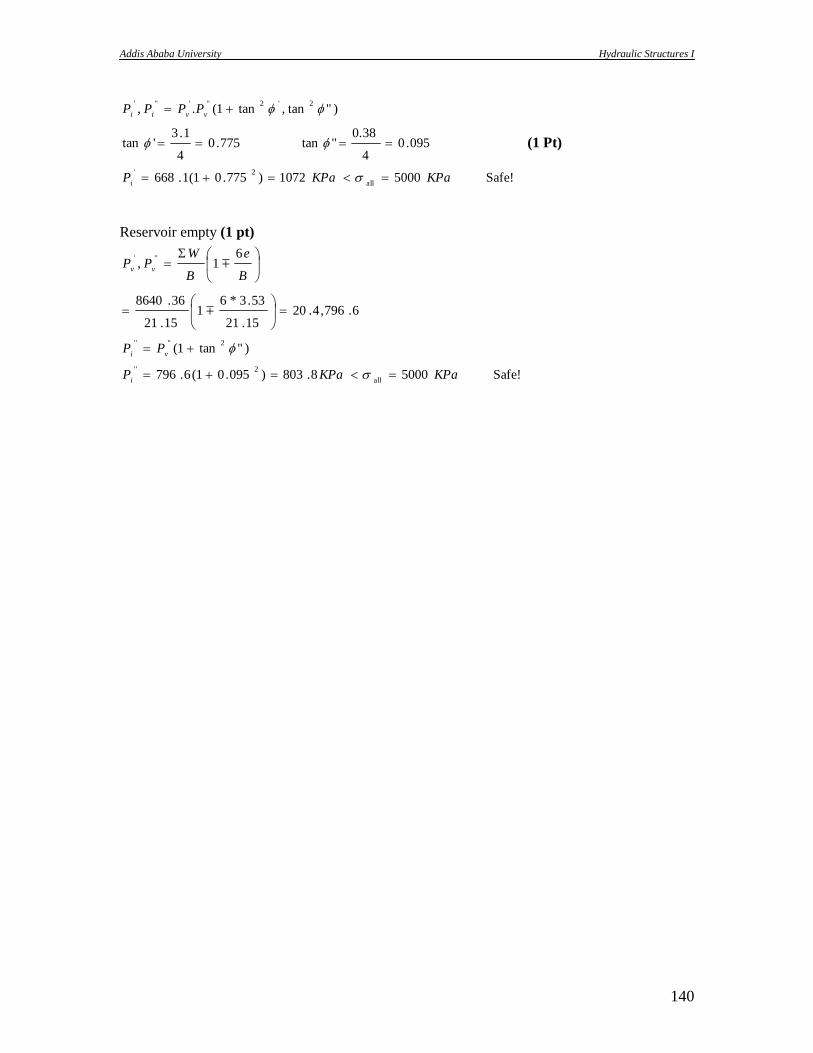
Addis Ababa University Hydraulic Structures I
140
Safe! 5000 1072)775.01(1.668
095.04
0.38 " tan 775.0
4
1.3'tan
)"tan,tan1(.,
all
2'
2'2"'"'
KPaKPaP
PPPP
i
vvii
(1 Pt)
Reservoir empty (1 pt)
Safe! 5000 8.803)095.01(6.796
)"tan1(
6.796,4.2015.21
53.3*61
15.21
36.8640
61,
all
2''
2"''
"'
KPaKPaP
PP
B
e
B
WPP
i
vi
vv
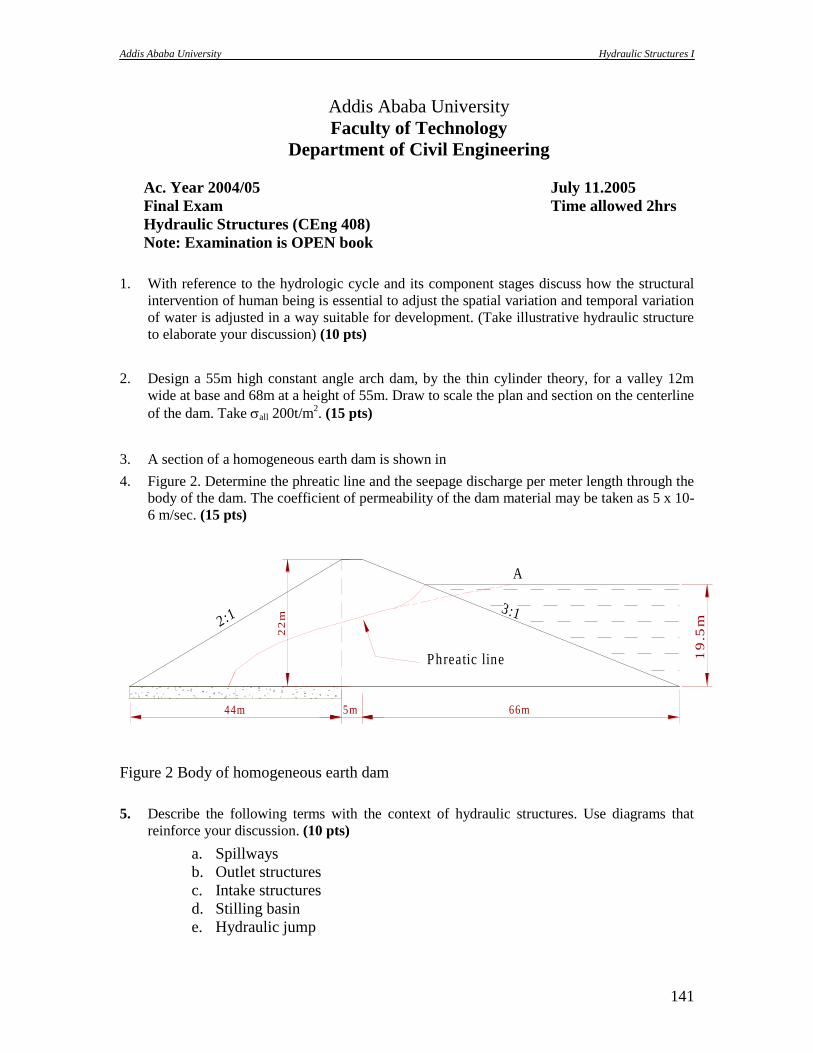
Addis Ababa University Hydraulic Structures I
141
Addis Ababa University
Faculty of Technology
Department of Civil Engineering
Ac. Year 2004/05 July 11.2005
Final Exam Time allowed 2hrs
Hydraulic Structures (CEng 408)
Note: Examination is OPEN book
1. With reference to the hydrologic cycle and its component stages discuss how the structural
intervention of human being is essential to adjust the spatial variation and temporal variation
of water is adjusted in a way suitable for development. (Take illustrative hydraulic structure
to elaborate your discussion) (10 pts)
2. Design a 55m high constant angle arch dam, by the thin cylinder theory, for a valley 12m
wide at base and 68m at a height of 55m. Draw to scale the plan and section on the centerline
of the dam. Take all 200t/m2. (15 pts)
3. A section of a homogeneous earth dam is shown in
4. Figure 2. Determine the phreatic line and the seepage discharge per meter length through the
body of the dam. The coefficient of permeability of the dam material may be taken as 5 x 10-
6 m/sec. (15 pts)
19
.5m
22
m
44m 5m 66m
A
Phreatic line
2:13:1
Figure 2 Body of homogeneous earth dam
5. Describe the following terms with the context of hydraulic structures. Use diagrams that
reinforce your discussion. (10 pts)
a. Spillways
b. Outlet structures
c. Intake structures
d. Stilling basin
e. Hydraulic jump
Addis Ababa University Hydraulic Structures I
142
Final-Semester Exam Partial Solution 1. With reference to the hydrologic cycle and its component stages discuss how the
structural intervention of human being is essential to adjust the spatial variation
and temporal variation of water in a way suitable for development. (Take
illustrative hydraulic structure to elaborate your discussion) (10 pts)
Water is one of the essential prerequisites of life. A country's water resources include all
the water in rivers, lakes, seas, and groundwater which are stages of the hydrologic cycle.
The distribution of water in nature in space and time, however, is such that it is scarce at
some locations and at particular times and excess at other locations (and at another time
at same location). Rainfall, which is the main water input to our ecosystem, is variable in
space and time. This is then reflected, for instance, in river flow, groundwater and lake-
levels. Some areas get more or less uniform and good amount of rainfall most of the year
(like areas in Southwest Ethiopia), whereas other places get their rainfall concentrated in
few months (the wet season). Still there are places that get very scanty rainfall. On the
other hand the society's demand is not in general synchronised with the availability of
water. In fact, some needs, such as irrigation water requirements are high during periods
of no, or less rainfall. Hence man is faced with the task of developing the available water
resources to meet his needs.
With water needs for domestic use and that for food production being the basic
requirements, water needs of a society, both in quantity and quality depend upon its level
of development. Water is needed for energy production (hydropower), industrial use,
recreation, and navigation (waterways), to mention the most common and traditional
ones. Thus projects are designed and implemented to meet all or some of these needs.
The very water that is essential for life may also threaten life. Floods cause from time to
time great losses to human life and property. Thus settlements and developments on
banks of rivers should be protected from occurring floods, high flows in streams should
not cause damage to bridges, etc., for instance by building dykes, In such cases the water
has to be controlled so that its harmful consequences are minimised, if not totally
prevented.
Consider building of a storage reservoir as a case
The absence of natural storage of adequate capacities necessitates construction of some
artificial storage works. Development of natural storages may also be included in this
category sometimes (Cherecherea weir at Lake Tana). In rainy season there is excess
flow down the valley in a river. An impounding reservoir(human intervention) can be
constructed in the valley to store this excess water which will meet the demand in dry
periods.
Ctd….
2. Design a 55m high constant angle arch dam, by the thin cylinder theory, for a
valley 12m wide at base and 68m at a height of 55m. Draw to scale the plan and
section on the centerline of the dam. Take all = 200t/m2. (15 pts)
Taking = 133.440 [1pt]
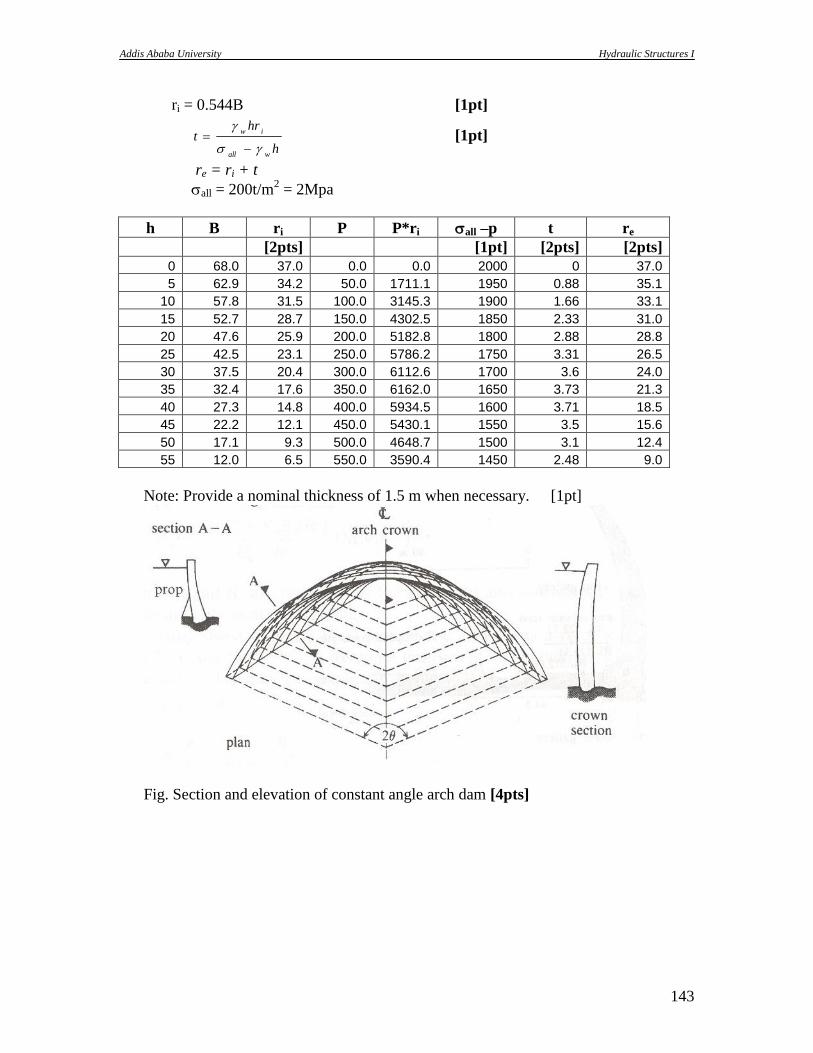
Addis Ababa University Hydraulic Structures I
143
ri = 0.544B [1pt]
h
hrt
wall
iw
[1pt]
re = ri + t
all = 200t/m2 = 2Mpa
h B ri P P*ri all –p t re
[2pts] [1pt] [2pts] [2pts]
0 68.0 37.0 0.0 0.0 2000 0 37.0
5 62.9 34.2 50.0 1711.1 1950 0.88 35.1
10 57.8 31.5 100.0 3145.3 1900 1.66 33.1
15 52.7 28.7 150.0 4302.5 1850 2.33 31.0
20 47.6 25.9 200.0 5182.8 1800 2.88 28.8
25 42.5 23.1 250.0 5786.2 1750 3.31 26.5
30 37.5 20.4 300.0 6112.6 1700 3.6 24.0
35 32.4 17.6 350.0 6162.0 1650 3.73 21.3
40 27.3 14.8 400.0 5934.5 1600 3.71 18.5
45 22.2 12.1 450.0 5430.1 1550 3.5 15.6
50 17.1 9.3 500.0 4648.7 1500 3.1 12.4
55 12.0 6.5 550.0 3590.4 1450 2.48 9.0
Note: Provide a nominal thickness of 1.5 m when necessary. [1pt]
Fig. Section and elevation of constant angle arch dam [4pts]
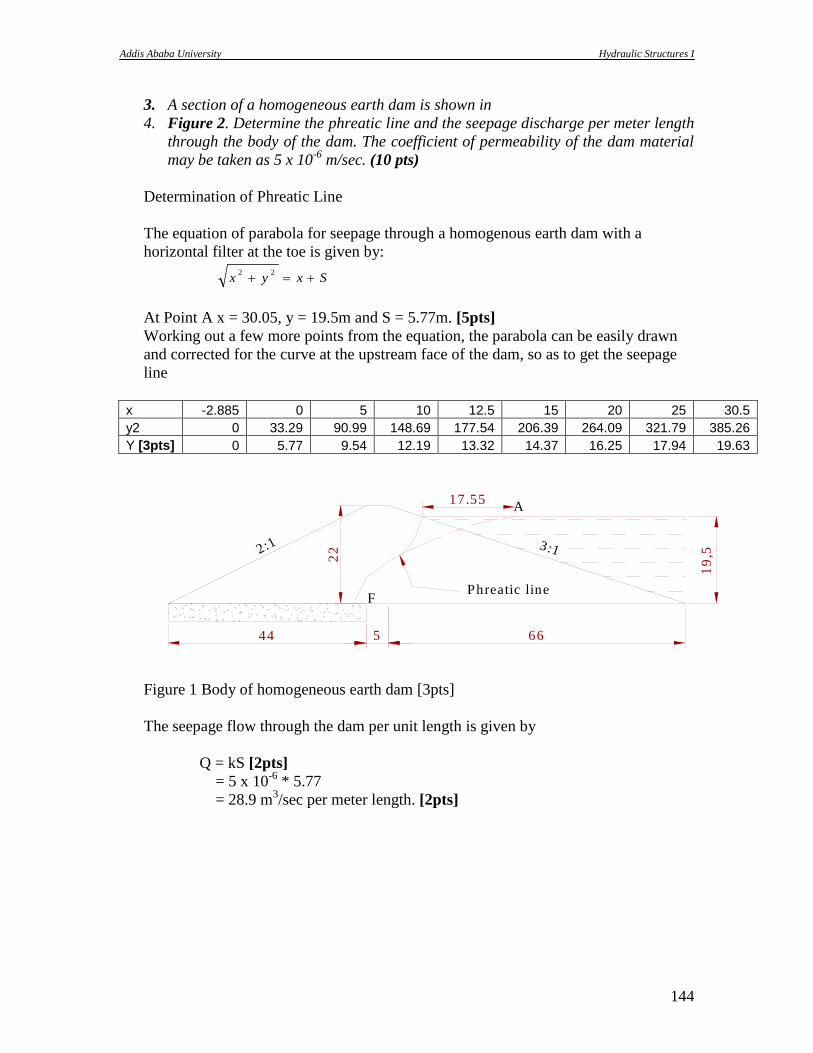
Addis Ababa University Hydraulic Structures I
144
3. A section of a homogeneous earth dam is shown in
4. Figure 2. Determine the phreatic line and the seepage discharge per meter length
through the body of the dam. The coefficient of permeability of the dam material
may be taken as 5 x 10⁻⁶
m/sec. (10 pts)
Determination of Phreatic Line
The equation of parabola for seepage through a homogenous earth dam with a
horizontal filter at the toe is given by:
Sxyx 22
At Point A x = 30.05, y = 19.5m and S = 5.77m. [5pts]
Working out a few more points from the equation, the parabola can be easily drawn
and corrected for the curve at the upstream face of the dam, so as to get the seepage
line
x -2.885 0 5 10 12.5 15 20 25 30.5
y2 0 33.29 90.99 148.69 177.54 206.39 264.09 321.79 385.26
Y [3pts] 0 5.77 9.54 12.19 13.32 14.37 16.25 17.94 19.63
A
2:1 3:1
44 5 66
19
,5
Phreatic line
17.55
22
F
Figure 1 Body of homogeneous earth dam [3pts]
The seepage flow through the dam per unit length is given by
Q = kS [2pts]
= 5 x 10-6
* 5.77
= 28.9 m3/sec per meter length. [2pts]
Addis Ababa University Hydraulic Structures I
145
Addis Ababa University
Faculty of Technology, Department of Civil Engineering
Ac. Year 2004/05 July 11.2005
Final Exam Time allowed 2hrs
Hydraulic Structures (CED 355)
Note: Examination is OPEN book
1. Briefly discuss the checks that are required to be made to investigate the stability
of an earthen dam.
The major types of failures of embankment dam are
Hydraulic failure
Seepage failure
Structural failure
Stability though mainly taken care of through structural analysis the cause could also
be attributed to seepage or/and hydraulic failures. Basically stability of a earthen dam
is assured through the following three considerations govern the design of an earth
embankment.
1. side slopes must be stable;
2. Dimensions must be sufficient to control seepage;
3. Base width must be long enough to distribute weight of dam over sufficient area
to prevent overstress in the foundation.
Therefore the checks needed to investigate stability will be [1pt each total 5 pts]
a. Stability of upstream slope during sudden drawdown
b. Stability of upstream portion of the dam, during sudden drawdown, from
the consideration of horizontal shear developed at base under the upstream
slope of the dam
c. Stability of downstream slope under steady seepage from the
consideration of horizontal shear at base under the downstream slope of
the dam
d. Stability of the foundation against shear
e. Overall stability of the dam section as a whole
2. Explain how the following parameters affect design of an earth dam:
a. Optimum moisture content (1.5 pts)
Optimum moisture content is the moisture content at which the weight of soil grains
obtained in unit volume of the compacted soil mass is maximum. The compaction
of soil in the fill, particularly high earth dam, is to obtain high density of the soil
to reduce settlements, to reduce percolation through the fill, and to increase its
shear resistance. All this factors lead to increased safety and stability of the
embankment dam.
b. C(cohesion) and (internal friction) value of soil; permeability of soil (2
pts)
Both parameters determine the shear strength of embankement soil
tan C
c. Sudden draw-down of the reservoir (1.5 pts)
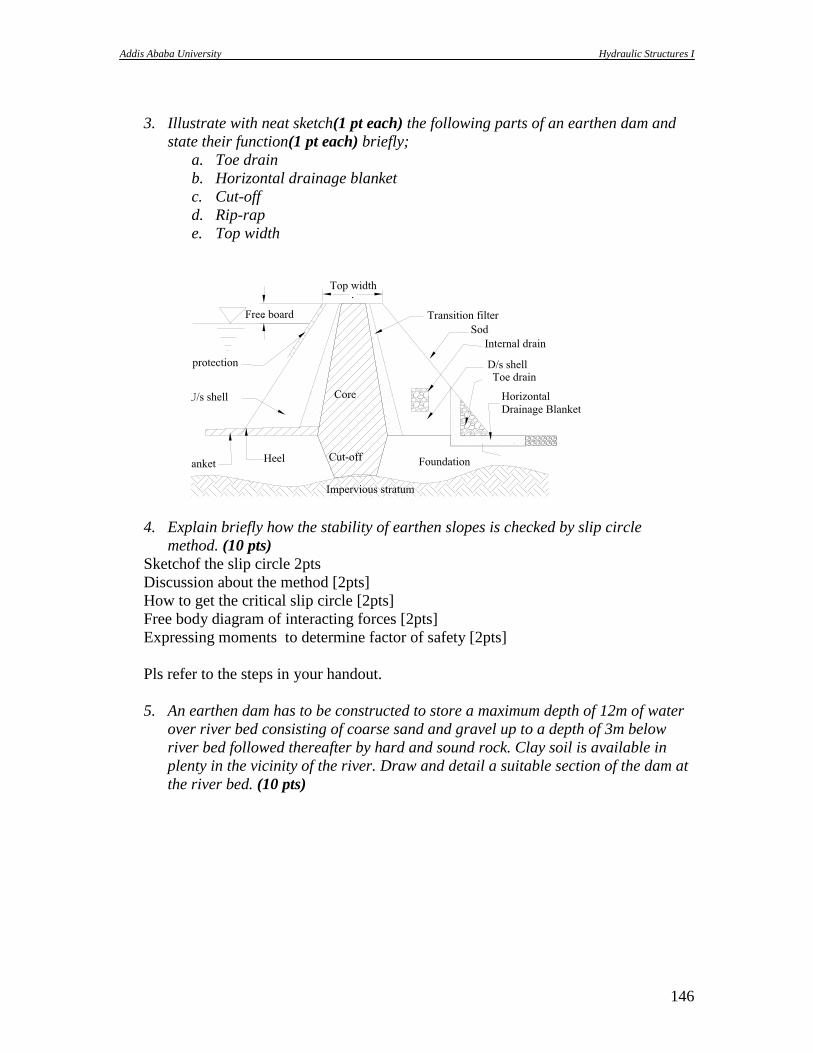
Addis Ababa University Hydraulic Structures I
146
3. Illustrate with neat sketch(1 pt each) the following parts of an earthen dam and
state their function(1 pt each) briefly;
a. Toe drain
b. Horizontal drainage blanket
c. Cut-off
d. Rip-rap
e. Top width
4. Explain briefly how the stability of earthen slopes is checked by slip circle
method. (10 pts)
Sketchof the slip circle 2pts
Discussion about the method [2pts]
How to get the critical slip circle [2pts]
Free body diagram of interacting forces [2pts]
Expressing moments to determine factor of safety [2pts]
Pls refer to the steps in your handout.
5. An earthen dam has to be constructed to store a maximum depth of 12m of water
over river bed consisting of coarse sand and gravel up to a depth of 3m below
river bed followed thereafter by hard and sound rock. Clay soil is available in
plenty in the vicinity of the river. Draw and detail a suitable section of the dam at
the river bed. (10 pts)
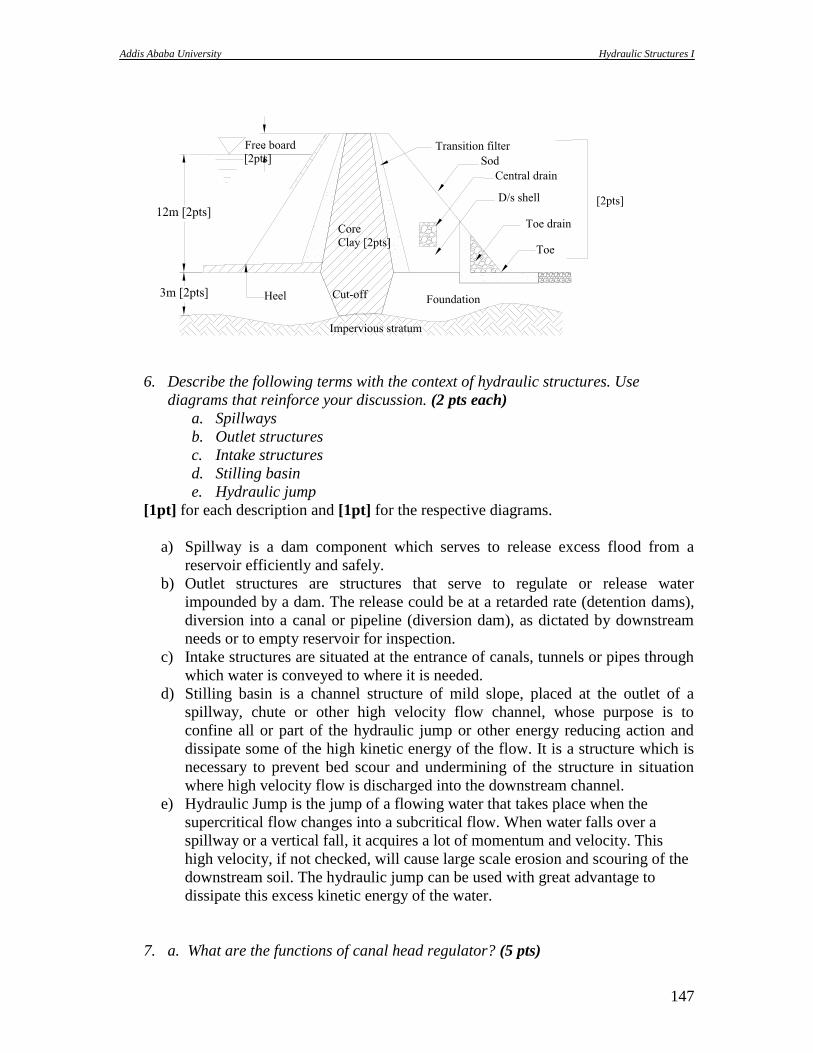
Addis Ababa University Hydraulic Structures I
147
6. Describe the following terms with the context of hydraulic structures. Use
diagrams that reinforce your discussion. (2 pts each)
a. Spillways
b. Outlet structures
c. Intake structures
d. Stilling basin
e. Hydraulic jump
[1pt] for each description and [1pt] for the respective diagrams.
a) Spillway is a dam component which serves to release excess flood from a
reservoir efficiently and safely.
b) Outlet structures are structures that serve to regulate or release water
impounded by a dam. The release could be at a retarded rate (detention dams),
diversion into a canal or pipeline (diversion dam), as dictated by downstream
needs or to empty reservoir for inspection.
c) Intake structures are situated at the entrance of canals, tunnels or pipes through
which water is conveyed to where it is needed.
d) Stilling basin is a channel structure of mild slope, placed at the outlet of a
spillway, chute or other high velocity flow channel, whose purpose is to
confine all or part of the hydraulic jump or other energy reducing action and
dissipate some of the high kinetic energy of the flow. It is a structure which is
necessary to prevent bed scour and undermining of the structure in situation
where high velocity flow is discharged into the downstream channel.
e) Hydraulic Jump is the jump of a flowing water that takes place when the
supercritical flow changes into a subcritical flow. When water falls over a
spillway or a vertical fall, it acquires a lot of momentum and velocity. This
high velocity, if not checked, will cause large scale erosion and scouring of the
downstream soil. The hydraulic jump can be used with great advantage to
dissipate this excess kinetic energy of the water.
7. a. What are the functions of canal head regulator? (5 pts)
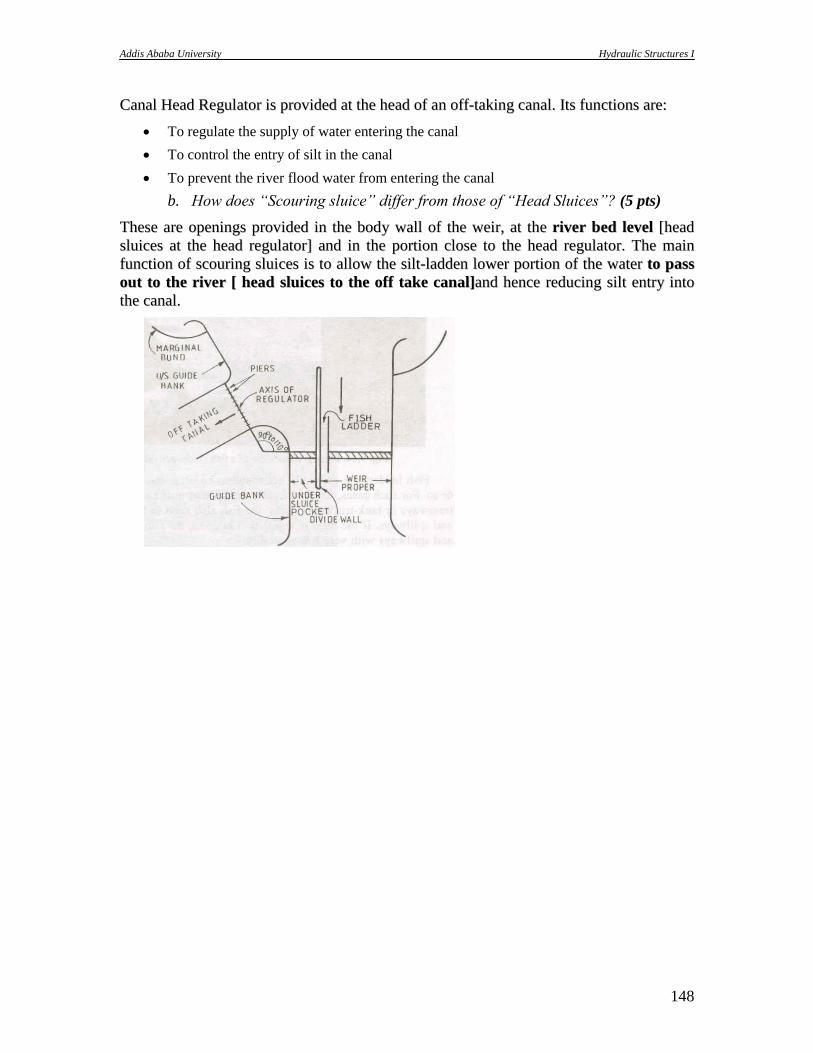
Addis Ababa University Hydraulic Structures I
148
CCaannaall HHeeaadd RReegguullaattoorr iiss pprroovviiddeedd aatt tthhee hheeaadd ooff aann ooffff--ttaakkiinngg ccaannaall.. IIttss ffuunnccttiioonnss aarree::
To regulate the supply of water entering the canal
To control the entry of silt in the canal
To prevent the river flood water from entering the canal
b. How does “Scouring sluice” differ from those of “Head Sluices”? (5 pts)
TThheessee aarree ooppeenniinnggss pprroovviiddeedd iinn tthhee bbooddyy wwaallll ooff tthhee wweeiirr,, aatt tthhee rriivveerr bbeedd lleevveell [[hheeaadd
sslluuiicceess aatt tthhee hheeaadd rreegguullaattoorr]] aanndd iinn tthhee ppoorrttiioonn cclloossee ttoo tthhee hheeaadd rreegguullaattoorr.. TThhee mmaaiinn
ffuunnccttiioonn ooff ssccoouurriinngg sslluuiicceess iiss ttoo aallllooww tthhee ssiilltt--llaaddddeenn lloowweerr ppoorrttiioonn ooff tthhee wwaatteerr ttoo ppaassss
oouutt ttoo tthhee rriivveerr [[ hheeaadd sslluuiicceess ttoo tthhee ooffff ttaakkee ccaannaall]]aanndd hheennccee rreedduucciinngg ssiilltt eennttrryy iinnttoo
tthhee ccaannaall..
Addis Ababa University Hydraulic Structures I
149
KISAMA AFRICA UNIVERSITY COLLEGE
DEPARTMENT OF CIVIL ENGINEEREING Mid-Semester Exam Date Dec. 22, 04
Hydraulic Structure I: Time allowed 2 ½ hrs.
The examination is Open book.
Part I Multiple Choice
Among the four alternative answers choose the best answer that fits to each question.
Each question has 2 marks.
21. Earthen dams are:
a. rigid dams c. overflow dams
b. non rigid dams d. diversion dams
22. when sand and gravel foundation strata is available at a proposed dam site of moderate
height, the dam may be of the type:
a. Earthen dam or rock fills dam c. double arch dam
b. masonry gravity dam d. concrete gravity dam
23. Yield of a reservoir represents:
a. The inflow into the reservoir c. the outflow demand on the reservoir
b. The capacity of the reservoir d. none of the above
24. The capacity of a storage reservoir can be decided by using:
a. The mass curve of inflow c. by both (a) and (b)
b. The mass curve of outflow d. none of the above.
25. According to thin cylinder theory the volume of concrete required for an arch dam would
be minimum if the central angle is:
a. 150034‟ c. 136
034‟
b. 133034‟ d. 140
034‟
26. The slope of the upstream face of a flat-slab type buttress dam
a. Is always less than 350 c. usually varies from 35
0 to 45
0
b. Is always more than 450 d. none of the above
27. When seepage takes place through the body of an earthen dam, it leads to:
a. development of pore pressures in the dam body c. reduction in the shear stresses in the
dam
b. reduction in the shear strength of the dam d. both (a) and (b)
28. When the water level standing against an earthen embankment, suddenly falls down, then
there is an imminent risk of sliding failure, to the:
a. upstream slope c. both (a) and (b)
b. downstream slope d. none of the above
29. During the maintenance of an earthen dam, the apparent seepage through the foundation
of the dam is best taken care of , by providing:
a. A chimney drain c. a drain trench along the d/s toe
b. A rock toe d. an u/s impervious cutoff
30. Which one of the following spillways is least suited to earthen dams?
a. Ogee spillway c. chute spillway
b. Side channel spillway d. shaft spillway
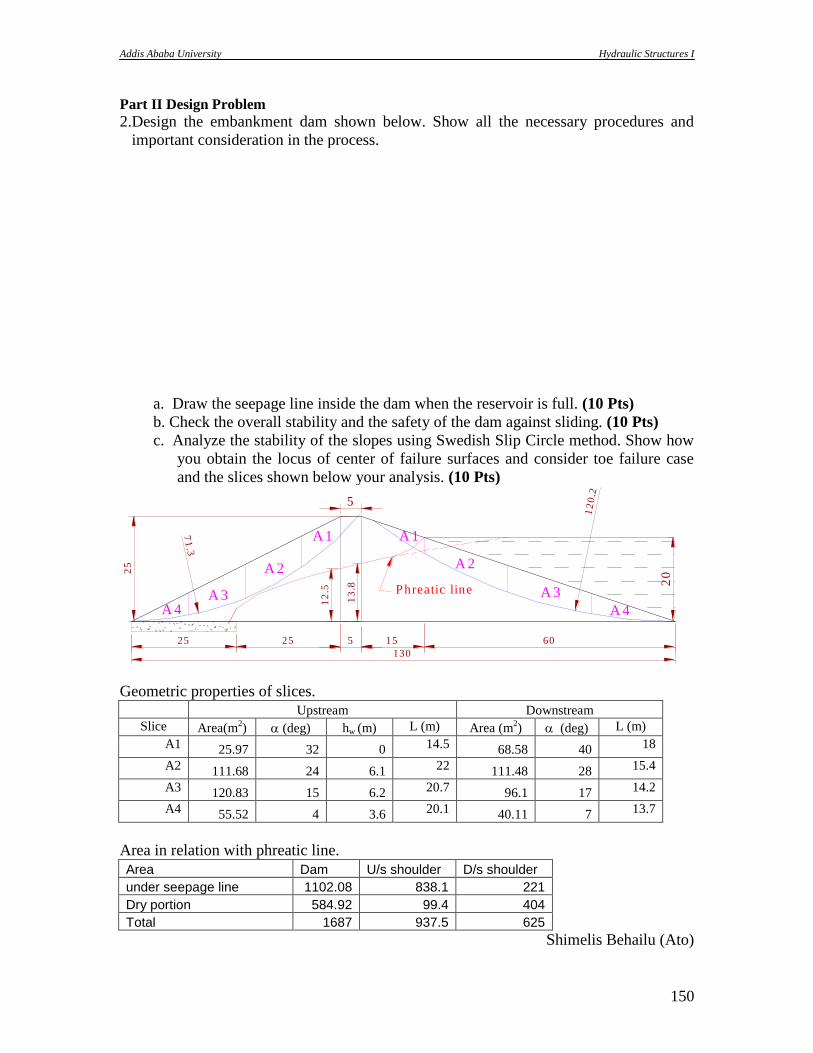
Addis Ababa University Hydraulic Structures I
150
Part II Design Problem 2.Design the embankment dam shown below. Show all the necessary procedures and
important consideration in the process.
a. Draw the seepage line inside the dam when the reservoir is full. (10 Pts)
b. Check the overall stability and the safety of the dam against sliding. (10 Pts)
c. Analyze the stability of the slopes using Swedish Slip Circle method. Show how
you obtain the locus of center of failure surfaces and consider toe failure case
and the slices shown below your analysis. (10 Pts)
13
.8
12
.5
A 1
A 2
A 3
A 4A 3
A 4
A 2
A 1
202
5
25 25 5 15 60
130
5
12
0.2
71
.3
Phreatic line
Geometric properties of slices.
Upstream Downstream
Slice Area(m2) (deg) hw (m) L (m) Area (m
2) (deg) L (m)
A1 25.97 32 0 14.5 68.58 40 18
A2 111.68 24 6.1 22 111.48 28 15.4
A3 120.83 15 6.2 20.7 96.1 17 14.2
A4 55.52 4 3.6 20.1 40.11 7 13.7
Area in relation with phreatic line.
Area Dam U/s shoulder D/s shoulder
under seepage line 1102.08 838.1 221
Dry portion 584.92 99.4 404
Total 1687 937.5 625
Shimelis Behailu (Ato)
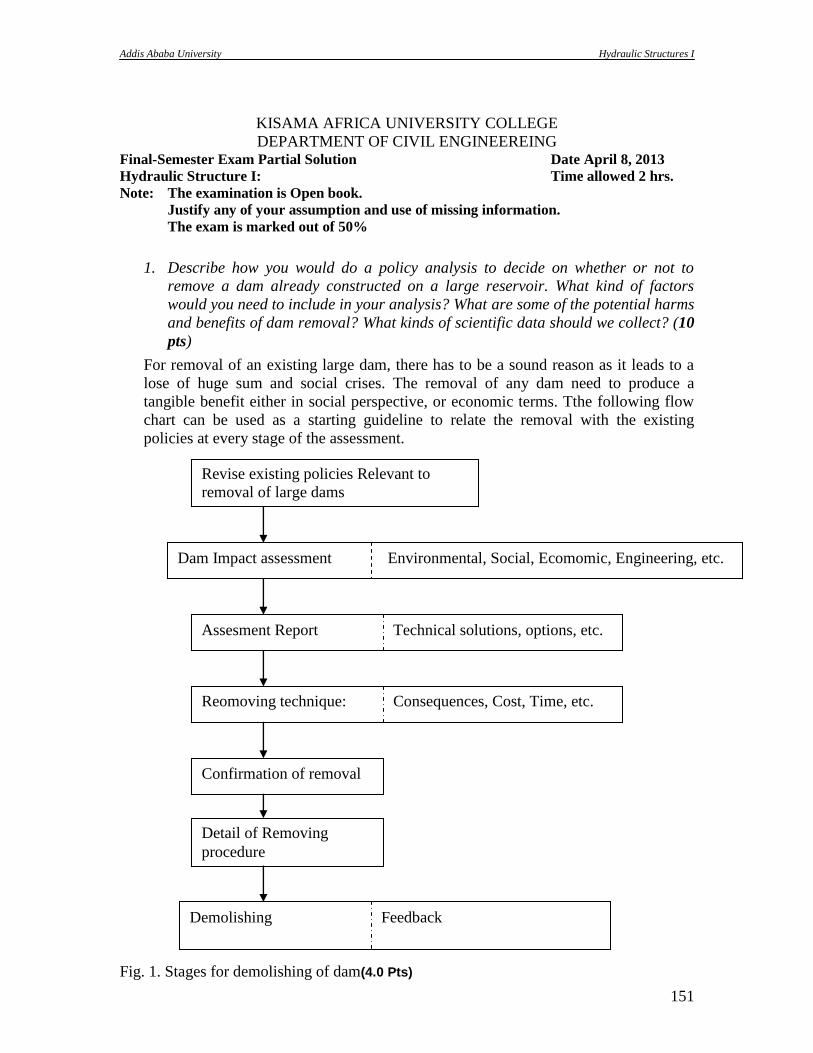
Addis Ababa University Hydraulic Structures I
151
KISAMA AFRICA UNIVERSITY COLLEGE
DEPARTMENT OF CIVIL ENGINEEREING Final-Semester Exam Partial Solution Date April 8, 2013
Hydraulic Structure I: Time allowed 2 hrs.
Note: The examination is Open book.
Justify any of your assumption and use of missing information.
The exam is marked out of 50%
1. Describe how you would do a policy analysis to decide on whether or not to
remove a dam already constructed on a large reservoir. What kind of factors
would you need to include in your analysis? What are some of the potential harms
and benefits of dam removal? What kinds of scientific data should we collect? (10
pts)
For removal of an existing large dam, there has to be a sound reason as it leads to a
lose of huge sum and social crises. The removal of any dam need to produce a
tangible benefit either in social perspective, or economic terms. Tthe following flow
chart can be used as a starting guideline to relate the removal with the existing
policies at every stage of the assessment.
Fig. 1. Stages for demolishing of dam(4.0 Pts)
Dam Impact assessment Environmental, Social, Ecomomic, Engineering, etc.
Assesment Report Technical solutions, options, etc.
Reomoving technique: Consequences, Cost, Time, etc.
Confirmation of removal
Detail of Removing
procedure
Revise existing policies Relevant to
removal of large dams
Demolishing Feedback
Addis Ababa University Hydraulic Structures I
152
Here are some of the major factors to be considered in the policy analysis (2.0 Pts)
8. Does the dam negatively affect the welfare of the society?
9. Does the dam created a political instability or conflict between beneficiaries?
10. Is there a new technology that could produce better economic advantage than the
existing one?
11. Is the dam causing environmental problems that outweigh its benefit?
12. Will the removal affect the ecological balance of the area?
13. Is there any discovery of precious mineral with in the reservoire site?
14. Is the dam susceptible to failure due to structural defects or geologic reasons that
are not observed during design and construction?
Among the potential harms due to removal of large dams (1.0 Pt)
Flooding of downstream areas
Lose of money on investments related to the dam such as irrigation schemes,
hydropower, etc.
lose of job for the workers who make their living on activites related to the dam
ecological disturbance
Cost of demolishing
Among the benefits from removal of large dam (1.0 Pt)
Restoration of the natural water course
More land if the reservoire is suitable for agriculture or urbanization
Avoidance of the risk that lead to the removal of the dam, (eg. Failure, disease,
political or social reasons, etc.)
Better utilization using state of the art technology could be possible
Lesson for future water resource projects
For the analysis various scientific data should be collected (1.0 Pts)
Socio-ecomoic data
Market value of products from the dam (amount of power, irrigation output, etc.)
The impact of the dam on the neigboring areas ( # of casualities, extent of various
damages due to the presence of the dam)
Need of resettlement if there are areas prone for flooding
Technical data
The total cost of dam construction, dimensions, unique features and the size of the
dam
Hydrologic data
Capacity of the valley
Maxium discharge to be released
Appropriate time for demolishing
Cost of demolishing
Manpower for demolishing etc.
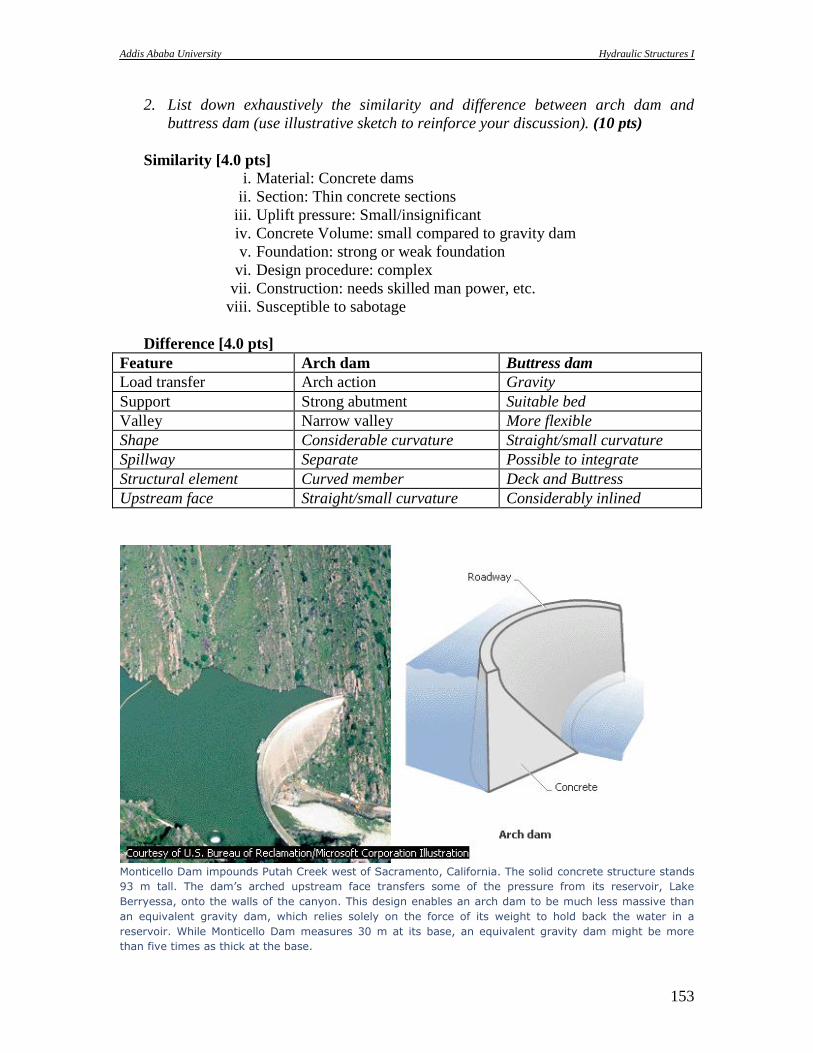
Addis Ababa University Hydraulic Structures I
153
2. List down exhaustively the similarity and difference between arch dam and
buttress dam (use illustrative sketch to reinforce your discussion). (10 pts)
Similarity [4.0 pts]
i. Material: Concrete dams
ii. Section: Thin concrete sections
iii. Uplift pressure: Small/insignificant
iv. Concrete Volume: small compared to gravity dam
v. Foundation: strong or weak foundation
vi. Design procedure: complex
vii. Construction: needs skilled man power, etc.
viii. Susceptible to sabotage
Difference [4.0 pts]
Feature Arch dam Buttress dam
Load transfer Arch action Gravity
Support Strong abutment Suitable bed
Valley Narrow valley More flexible
Shape Considerable curvature Straight/small curvature
Spillway Separate Possible to integrate
Structural element Curved member Deck and Buttress
Upstream face Straight/small curvature Considerably inlined
Monticello Dam impounds Putah Creek west of Sacramento, California. The solid concrete structure stands
93 m tall. The dam’s arched upstream face transfers some of the pressure from its reservoir, Lake
Berryessa, onto the walls of the canyon. This design enables an arch dam to be much less massive than
an equivalent gravity dam, which relies solely on the force of its weight to hold back the water in a
reservoir. While Monticello Dam measures 30 m at its base, an equivalent gravity dam might be more
than five times as thick at the base.
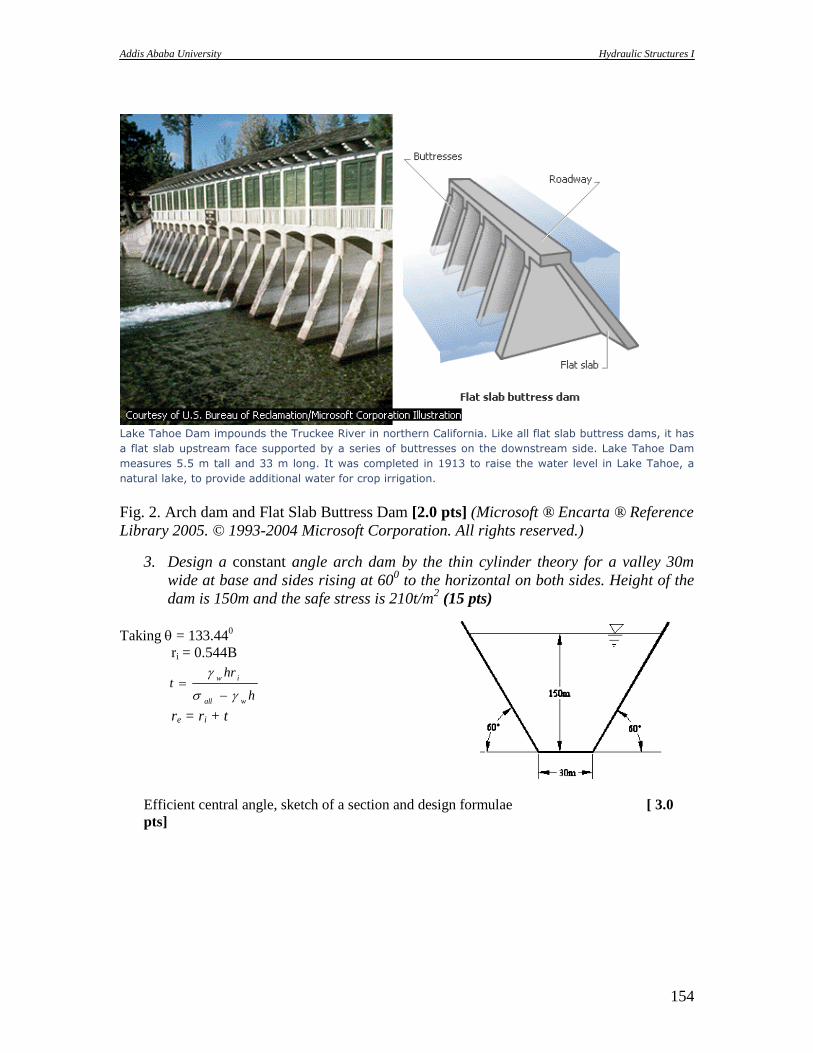
Addis Ababa University Hydraulic Structures I
154
Lake Tahoe Dam impounds the Truckee River in northern California. Like all flat slab buttress dams, it has
a flat slab upstream face supported by a series of buttresses on the downstream side. Lake Tahoe Dam
measures 5.5 m tall and 33 m long. It was completed in 1913 to raise the water level in Lake Tahoe, a
natural lake, to provide additional water for crop irrigation.
Fig. 2. Arch dam and Flat Slab Buttress Dam [2.0 pts] (Microsoft ® Encarta ® Reference
Library 2005. © 1993-2004 Microsoft Corporation. All rights reserved.)
3. Design a constant angle arch dam by the thin cylinder theory for a valley 30m
wide at base and sides rising at 600 to the horizontal on both sides. Height of the
dam is 150m and the safe stress is 210t/m2 (15 pts)
Taking = 133.440
ri = 0.544B
h
hrt
wall
iw
re = ri + t
Efficient central angle, sketch of a section and design formulae [ 3.0
pts]

Addis Ababa University Hydraulic Structures I
155
Table 1. [10 pts]
h B ri P = h P*ri all –p t re
0 203.2 110.5 0 0 2100 0 110.5
10 191.7 104.3 100 10430 2000 5.2 109.5
20 180.1 98 200 19600 1900 10.3 108.3
30 168.6 91.7 300 27510 1800 15.3 107
40 157 85.4 400 34160 1700 20.1 105.5
50 145.5 79.2 500 39600 1600 24.8 104
60 133.9 72.8 600 43680 1500 29.1 101.9
70 122.4 66.6 700 46620 1400 33.3 99.9
80 110.8 60.3 800 48240 1300 37.1 97.4
90 99.3 54 900 48600 1200 40.5 94.5
100 87.7 47.7 1000 47700 1100 43.4 91.1
110 76.2 41.5 1100 45650 1000 45.7 87.2
120 64.6 35.1 1200 42120 900 46.8 81.9
130 53.1 28.9 1300 37570 800 47 75.9
140 41.5 22.6 1400 31640 700 45.2 67.8
150 30 16.3 1500 24450 600 40.8 57.1
Provide a nominal thickness of 2.0m. [ 2.0 pts]
4. a. A section of a homogenous earth dam with 8m long downstream filter layer is
shown below. Draw the profile of the phreatic line and calculate the seepage
discharge per meter length through the body of the dam. The coefficient of
permeability of the dam material is 8 x 10⁻⁵
m/sec. (7 pts)
Fig. 3. Section of homogeneous earth dam
For the origin of the Cartesian co-ordinate system at the face of the filter, the equation of the
parabola of the seepage line can be expressed as:
Sxyx 22
At point A, x = 39m, and y = 12m. Inserting into the parabola equation, S = 1.80m. [ 1.5
pt]Working out a few more points from the equation, the parabola can be easily drawn and
corrected for the curve at the upstream face of the dam, so as to get the seepage line. [ 2.5 pts]
x -0.9 0 5 10 15 20 29 39
y2 0 3.24 21.24 39.24 57.24 75.24 107.64 143.64
y 0 1.8 4.61 6.26 7.57 8.67 10.37 11.98
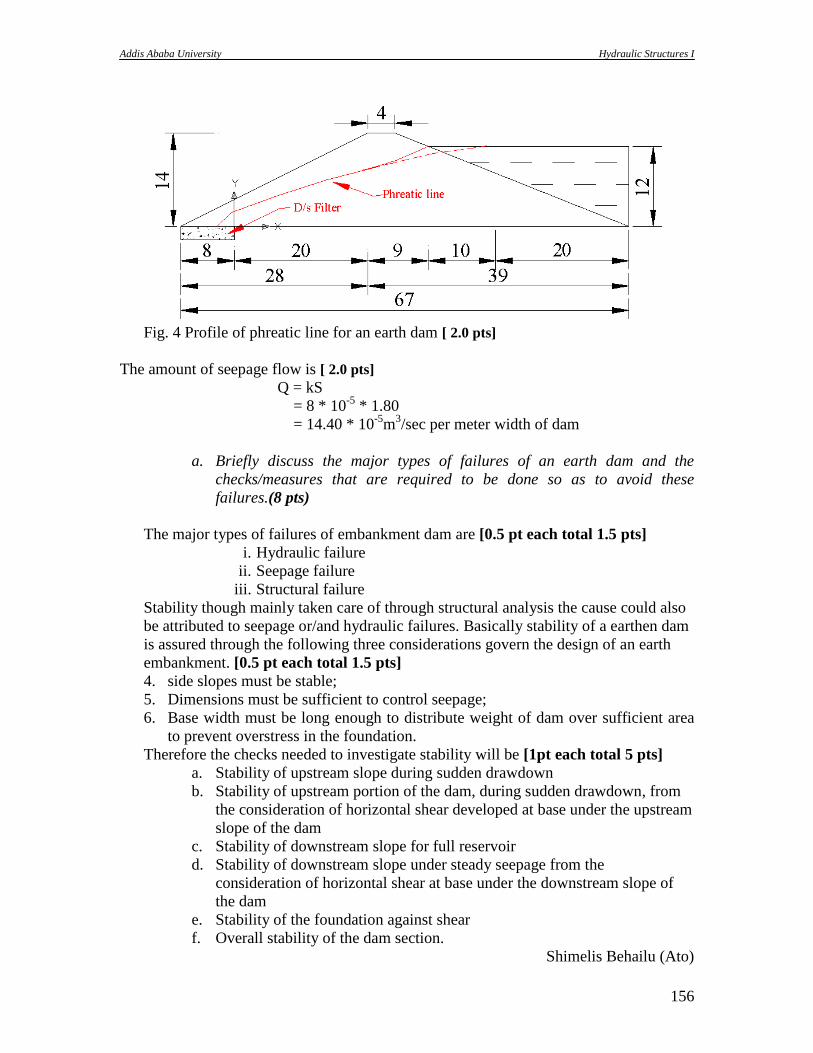
Addis Ababa University Hydraulic Structures I
156
Fig. 4 Profile of phreatic line for an earth dam [ 2.0 pts]
The amount of seepage flow is [ 2.0 pts]
Q = kS
= 8 * 10-5
* 1.80
= 14.40 * 10-5
m3/sec per meter width of dam
a. Briefly discuss the major types of failures of an earth dam and the
checks/measures that are required to be done so as to avoid these
failures.(8 pts)
The major types of failures of embankment dam are [0.5 pt each total 1.5 pts]
i. Hydraulic failure
ii. Seepage failure
iii. Structural failure
Stability though mainly taken care of through structural analysis the cause could also
be attributed to seepage or/and hydraulic failures. Basically stability of a earthen dam
is assured through the following three considerations govern the design of an earth
embankment. [0.5 pt each total 1.5 pts]
4. side slopes must be stable;
5. Dimensions must be sufficient to control seepage;
6. Base width must be long enough to distribute weight of dam over sufficient area
to prevent overstress in the foundation.
Therefore the checks needed to investigate stability will be [1pt each total 5 pts]
a. Stability of upstream slope during sudden drawdown
b. Stability of upstream portion of the dam, during sudden drawdown, from
the consideration of horizontal shear developed at base under the upstream
slope of the dam
c. Stability of downstream slope for full reservoir
d. Stability of downstream slope under steady seepage from the
consideration of horizontal shear at base under the downstream slope of
the dam
e. Stability of the foundation against shear
f. Overall stability of the dam section.
Shimelis Behailu (Ato)
Addis Ababa University Hydraulic Structures I
157
KISAMA AFRICA UNIVERSITY COLLEGE
DEPARTMENT OF CIVIL ENGINEEREING Mid-Semester Exam Date April 8, 2013
Hydraulic Structure I: Time allowed 2 hrs.
Note: The examination is Open book.
Justify any of your assumption and use of missing information.
The exam is marked out of 30%
5. Among water preservation and storage techniques one is construction of
underground dam that stores water with in the pore spaces of the soil/aquifer.
Enumerate the basic necessary engineering investigations that would help for site
selection, planning design and implementation of such projects. (5 Pts) Among the basic Engineering Investigations:
Surface and subsurface hydrology of the ground water basin
The permeability and porosity of the ground aquifer
The geology of the area and the dam site
The strength of the rock/soil for penetration
The areal extent of the aquifer
Relevant criteria among the surface dam site investigation.
Similar informations as for the surface dams on the demand analysis and location of the
area to be seved.
6. Describe in brief general construction procedures and quality control techniques
that you may follow in gravity dam construction. (5 Pts)
The Construction Process
1. Dry construction area: Before construction can begin on any dam, the water in
the streambed must be diverted or stopped from flowing through the site. As in
the case of fill dams, a coffer-dam (a temporary structure to impound the water)
must be built or the water must be diverted into another channel or area down-
stream from the dam site. For large projects, this construction may be done
several seasons before building of the dam begins. The flow of water is closed off
at the very last moment.
2. Foundation: The foundation area for any concrete dam must be immaculate
before the first concrete for the dam is placed. As for fill dams, this is a detailed
process of excavating, cleaning, and repairing the rock throughout the foundation
"footprint" and on both abutments (the sides of the canyon that form the ends of
the dam). Sites immediately downstream of the dam for any powerplant, stilling
basin, or other structure must also be prepared.
At some sites, extensive work may be required. If the rock in the foundation or
abutments is prone to fracturing because of the load imposed by the dam and its
reservoir, earthquake activity, or the properties of the rock, it may be necessary to
install extensive systems of rock bolts or anchor bolts that are grouted into the
rock through potential fracture zones. On the abutments above the dam, systems
of rock bolts and netting may be required to keep large rock fragments from
Addis Ababa University Hydraulic Structures I
158
falling onto the dam. Instruments to monitor groundwater levels, joint movement,
potential seepage, slope movements, and seismic activity are installed beginning
during the early stages of foundation preparation through completion of the dam.
A cutoff wall may be excavated deep into rock or holes may be drilled in the
foundation for the installation of reinforcing steel, called rebars, that extend up
into the dam and will be tied to the steel inside the first lifts of the dam. The idea
is to build a reservoir that, like a bowl, is equally sound around its perimeter. The
water is deepest and heaviest at the dam (when the reservoir is near capacity) so
the dam and its foundation cannot be a weak point in that perimeter.
3. Formwork and concrete casting: Forms made of wood or steel are constructed
along the edges of each section of the dam. Rebar is placed inside the forms and
tied to any adjacent rebar that was previously installed. The concrete is then
poured or pumped in. The height of each lift of concrete is typically only 1.5-3 m
and the length and width of each dam section to be poured as a unit is only about
15 m. Construction continues in this way as the dam is raised section by section
and lift by lift. Some major dams are built in sections called blocks with keys or
inter-locks that link adjacent blocks as well as structural steel connections.
The process is much like constructing a building except that the dam has far less
internal space; surprisingly, however, major concrete dams have observation
galleries at various levels so the condition of the inside of the dam can be
observed for seepage and movement. Inlet and outlet tunnels or other structures
also pass through concrete dams, making them very different from fill dams that
have as few structures penetrating the mass of the dam as possible.
4. Early dam performance: As soon as a significant portion of the dam is built, the
process of filling the reservoir may begin. This is done in a highly controlled
manner to evaluate the stresses on the dam and observe its early performance. A
temporary emergency spillway is constructed if dam building takes more than one
construction season; lengthy construction is usually done in phases called stages,
but each stage is fully complete in itself and is an operational dam. The upstream
cofferdam may be left in place as a temporary precaution, but it is not usually
designed to hold more than minimal stream flows and rainfall and will be
dismantled as soon as practical. Depending on design, some dams are not filled
until construction is essentially complete.
5. Appurtenances: The other structures that make the dam operational are added as
soon as the elevation of their location is reached as the dam rises. The final
components are erosion protection on the upstream (water) side of the dam (and
sometimes downstream at the bases of outlet structures), instruments along the
crest (top) of the dam, and roads, side-walks, streetlights, and retaining walls. A
major dam like Hoover Dam has a full-fledged roadway along its crest; small
dams will have maintenance roads that allow single-file access of vehicles only.
Away from the dam itself, the powerhouse, instrument buildings, and even homes
for resident operators of the dam are also finished. Initial tests of all the facilities
of the dam are performed.
Addis Ababa University Hydraulic Structures I
159
6. Completion: The final details of constructions are wrapped up as the dam is put
into service. The beginning of the dam's working life was also carefully scheduled
as a design item, so that water is available in the reservoir as soon as the supply
system is ready to pump and pipe it downstream, for example. A program of
operations, routine maintenance, rehabilitation, safety checks, instrument
monitoring, and detailed observation will continue and is mandated by law as
long as the dam exists.
Quality Control
There is no dam construction without intensive quality control. The process of building
alone involves heavy equipment and dangerous conditions for construction workers as
well as the public. The population living downstream of the dam has to be protected over
the structure itself; the professionals who design and construct these projects should
absolutely be committed to safety, and they are monitored by local, regional, and federal
agencies.
7. List down exhaustively the strength and weaknesses of Bligh’s, Lane’s and
Khosla’s seepage theories.

Addis Ababa University Hydraulic Structures I
160
8. Design a non-overflow gravity dam by the Single-step method using the
following data. (Ignore earthquake and silt pressure) (15 pts)
Item Value Item Value
Hmax (depth of headwater) 45 m f (friction factor) 0.75
he ( spillway crest to MWL) 3 m sa (Shear strength) 4.5 MPa
Tail water None ssf (Shear safety factor) 5
Top width 7.5 (Uplift factor) 0.5
Hs (depth of silt-water mixture) 4 m C (uplift area factor) 1
Ss(Specific gravity of silt) 1.5 c‟ (concrete ultimate strength) 30 MPa
ss (for horizontal silt water presure 14 kN/m2 F (Fetch length) 5 km
(earthquake factor) 0.12 V (Wind Velocity) 128 km/hr
T (period of EQ vibration) 0.80 sec c (concrete Specific unit weight) 22 MPa
w(water specific unit weight) 10 MPa
Partial design solution Determine the wave height by the empirical equations
m 1.17
0.5*271.05*128032.0763.0
32for 271.0032.0763.0
4/1
4/1
w
w
h
kmffvfh
Rise of water wave = 1.33hw
= 1.56 m;
With an allowance of 0.14 m, free board = 1.70m
Fwv = 2.0wh2
w
= 2.0 * 10 * 1.172
= 27.40 kN/m
Point of application = 3/8 x 1.17 =0.44m above still water level.
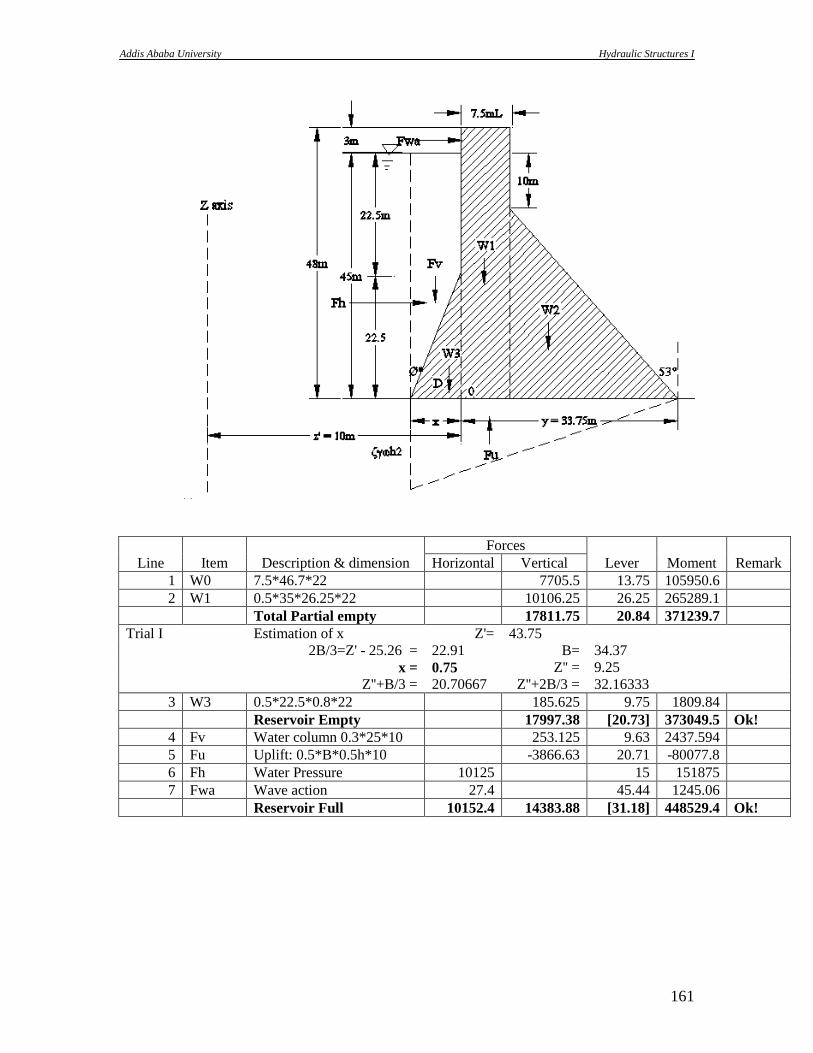
Addis Ababa University Hydraulic Structures I
161
Line Item Description & dimension
Forces
Lever Moment Remark Horizontal Vertical
1 W0 7.5*46.7*22 7705.5 13.75 105950.6
2 W1 0.5*35*26.25*22 10106.25 26.25 265289.1
Total Partial empty 17811.75 20.84 371239.7
Trial I Estimation of x Z'= 43.75
2B/3=Z' - 25.26 = 22.91 B= 34.37
x = 0.75 Z'' = 9.25
Z''+B/3 = 20.70667 Z''+2B/3 = 32.16333
3 W3 0.5*22.5*0.8*22 185.625 9.75 1809.84
Reservoir Empty 17997.38 [20.73] 373049.5 Ok!
4 Fv Water column 0.3*25*10 253.125 9.63 2437.594
5 Fu Uplift: 0.5*B*0.5h*10 -3866.63 20.71 -80077.8
6 Fh Water Pressure 10125 15 151875
7 Fwa Wave action 27.4 45.44 1245.06
Reservoir Full 10152.4 14383.88 [31.18] 448529.4 Ok!
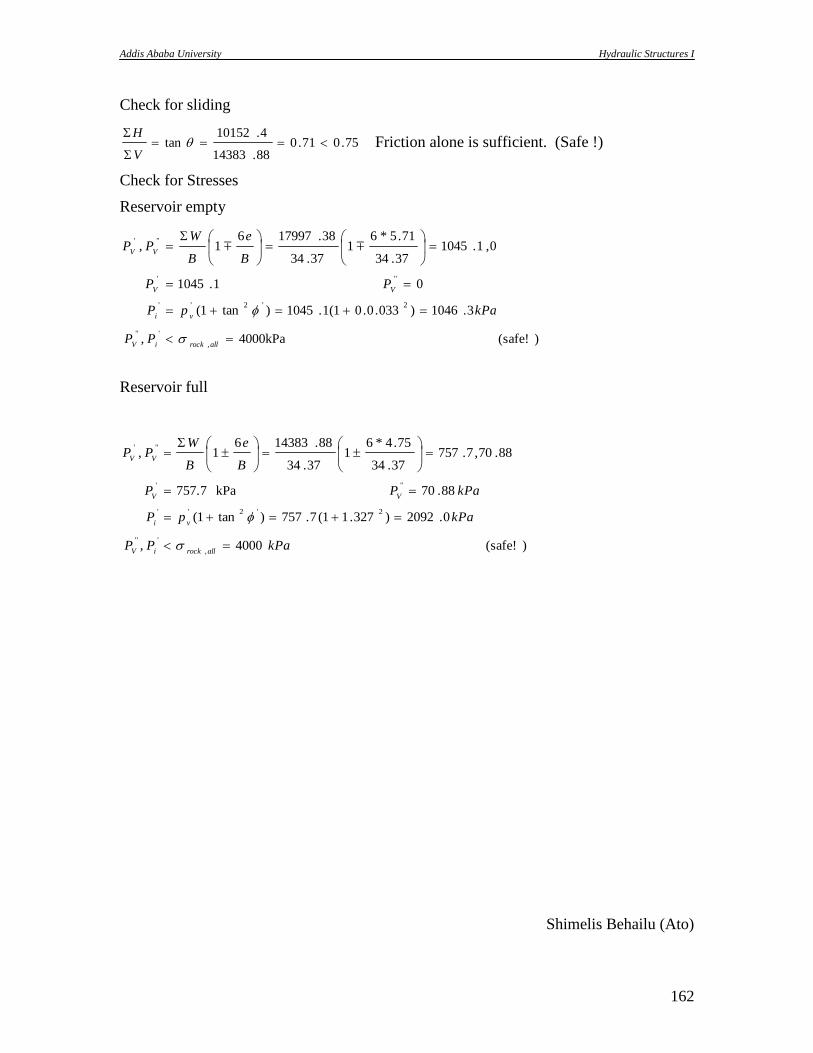
Addis Ababa University Hydraulic Structures I
162
Check for sliding
75.071.088.14383
4.10152tan
V
H Friction alone is sufficient. (Safe !)
Check for Stresses
Reservoir empty
)(safe! 4000kPa ,
3.1046)033.0.01(1.1045)tan1(
0 1.1045
0, 1.104537.34
71.5*61
37.34
38.1799761,
,
'"
2'2''
"'
"'
allrockiV
vi
VV
VV
PP
kPapP
PP
B
e
B
WPP
Reservoir full
Shimelis Behailu (Ato)
)(safe! 4000 ,
0.2092)327.11(7.757)tan1(
88.70 kPa 757.7
88.70,7.75737.34
75.4*61
37.34
88.1438361,
,
'"
2'2''
"'
"'
kPaPP
kPapP
kPaPP
B
e
B
WPP
allrockiV
vi
VV
VV

Addis Ababa University Hydraulic Structures I
163
ADDIS ABABA UNIVERSITY
FACULTY OF TECHNOLOGY
DEPARTMENT OF CIVIL ENGINEEREING
Mid-Semester Exam Partial solution (2005/2006 Ac. Yr.) Date April 8, 2013
Hydraulic Structures I (CEng 408) Time allowed 2.0 hrs. Note: 1. Each question has equal marks [Total 30%]
2. Make valid assumptions whenever necessary. 3. The examination is OPEN book.
11. A reservoir is contemplated on a stream which has an annual average runoff 500 million
m3. Measurements indicate that the average sediment inflow is 2 x 10
9 N/year. Assuming that a
cubic meter of settled sediment will dry out to a density of 12000 N/m3. The original capacity
of the reservoir is 24 x 106 m
3. The percentage of the inflowing sediment retained in the
reservoir, Trap efficiency = 100[1- (1/(1 + 65Z))]2, where Z = capacity - inflow ratio.
Determine the design life of reservoir based on sedimentation of 65% of the original capacity.
Solution
Input information/data [1.0 pts]
Original Reservoir Capacity 24,000,000 M3
Average Annual Inflow 500,000,000 m3/year
Average annual Sediment load 2,000,000,000 N/year
Specific Weight of Sediment 12,000 N/m3
Maximum %age of Sediment deposit 65
a 65
n 2
Trap efficiency 0.573 fraction
Trap efficiency of the reservoir varies with the remaining/residual capacity of the reservoir.
Hence the amount of sediment filling the reservoir each year is varies which then affects the
capacity inflow ratio, z, accordingly. The usual approach is, therefore, to divide the % fill into
five zones and determine the average capacity inflow ratio as shown in the table below.
Steps Res. Capacity Inflow Z Trap Eff. Sed. % Sed. Vol
0 24,000,000 500,000,000 0.048 0
1 20,880,000 500,000,000 0.042 0.536 13 3120000
2 17,760,000 500,000,000 0.036 0.491 26 6240000
3 14,640,000 500,000,000 0.029 0.427 39 9360000
4 11,520,000 500,000,000 0.023 0.359 52 12480000
5 8,400,000 500,000,000 0.017 0.276 65 15600000
Average capacity inflow ratio is 0.418 [2.0 pts]
For an average capacity-inflow ratio of different capacities the number of years in which the
dam will have a water storage capacity of more than 35% is determined as
0.65 x original capacity = # of years x average trap efficiency x sediment yield / specific unit
weight of sediment. [2.5 pts]
0.65 x 24 x 106 m3 = # of years x 0.418 x 2 x 10
9 N/year / 12000 N/m3
Hence design period of the dam will be about 224 years. [2.0 pts]
Addis Ababa University Hydraulic Structures I
164
12. Assume you are assigned as a technical and course of action advisor in a decision process
to demolish a dam already constructed on a large reservoir.
a. Describe how you would perform the strategic analysis to decide on whether or not to
takeout the structure.
b. Detail factors that, in your opinion, are significant and need to be addressed in the analysis.
c. Enumerate potential harms and benefits of the removal.
d. Specify the key data types you may collect from technical (engineering) perspective.
Solution
a. [2.0 pts] In order to construct a new dam or remove an existing one, the analysis of
relevant policies of water resources development in general and construction of dams
and reservoirs in general should first be done. Such policies intermingle different
disciplines; hence, a good understanding of every aspect is the corner stone for the
final decision.
For removal of an existing large dam, there has to be a sound reason as it leads to a
lose of huge sum and social crises otherwise. The removal, therefore, needs to
produce a tangible benefit either in social perspective, political stability, reduced
hazard or economic terms. One can use the following flow chart as a starting
guideline to weigh up the removal with the existing policies at each and every stage
of the appraisal.
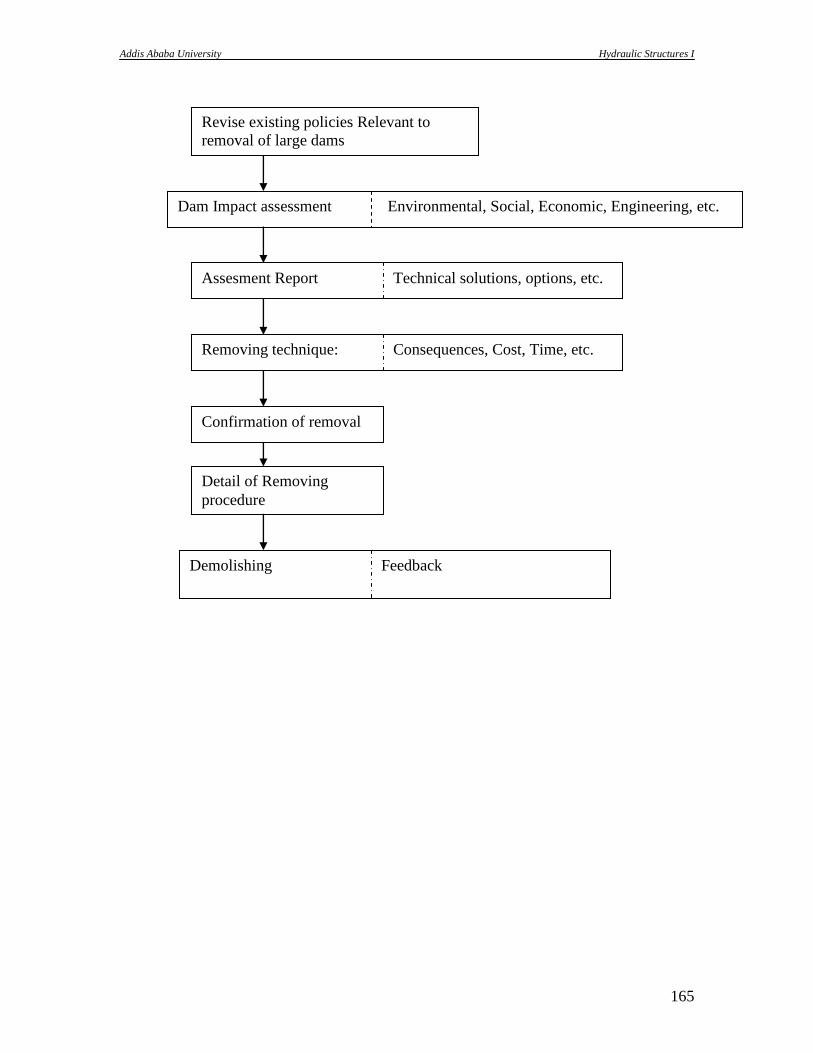
Addis Ababa University Hydraulic Structures I
165
Dam Impact assessment Environmental, Social, Economic, Engineering, etc.
Assesment Report Technical solutions, options, etc.
Removing technique: Consequences, Cost, Time, etc.
Confirmation of removal
Detail of Removing
procedure
Revise existing policies Relevant to
removal of large dams
Demolishing Feedback
Addis Ababa University Hydraulic Structures I
166
b. [2.0 pts] Here are some of the major factors to be considered in the policy analysis
15. Does the dam negatively affect the welfare of the society?
16. Does the dam created a political instability or conflict between beneficiaries?
17. Is there a new technology that could produce better economic advantage than the
existing one?
18. Is the land value of the reservoir/dam more productive if allotted for other
purposes?
19. Is the dam causing environmental problems that outweigh its benefit?
20. Will the removal affect the ecological balance of the area?
21. Is there any discovery of precious mineral with in the reservoir site?
22. Is the dam susceptible to failure due to structural defects or geologic reasons that
were not observed during design and construction? etc.
c. [1.0 pt] Among the potential harms due to removal of large dams
Flooding of downstream areas,
Economic lose of investments relying on the dam/reservoir such as irrigation
schemes, hydropower, etc.
lose of job for the workers who make their living on activities related to the
dam/reservoir,
ecologic disturbance,
Cost of demolishing, etc.
[1.0 pt] Among the benefits from removal of large dam
natural water course and flow will be restored,
More land if the reservoir area is suitable for agriculture or urbanization,
Relief of the risk that led to the removal of the dam, (eg. Failure, disease, political
or social crisis, etc.),
Better utilization using state of the art technology could be possible,
Lesson for future water resource development projects, etc.
d. [1.5 pts] For the analysis various types of data should be collected
Socio-economic data
Market value of products from the dam (amount of power, irrigation output, etc.)
The impact of the dam on the neighborhood ( # of deaths, extent of hazards
imposed by the presence of the dam)
Need of resettlement if there are areas prone to flooding, etc.
Technical data
The total cost of dam construction, dimensions, unique features and the size of the
dam and reservoir,
Hydrologic data,
Capacity of the valley/channel,
Maximum discharge to be released,
Technical/technological capacity for demolishing,
Appropriate time for demolishing and schedule,

Addis Ababa University Hydraulic Structures I
167
Cost of demolishing and material/equipment requirement,
Manpower for demolishing and many more.
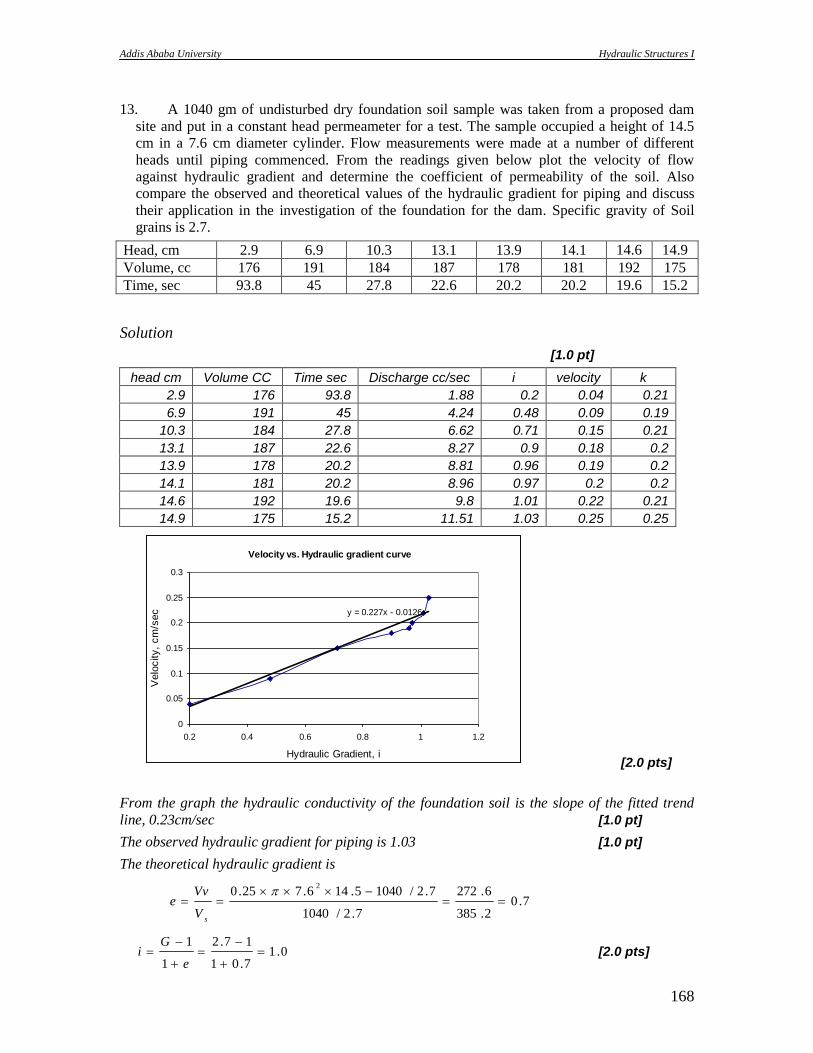
Addis Ababa University Hydraulic Structures I
168
13. A 1040 gm of undisturbed dry foundation soil sample was taken from a proposed dam
site and put in a constant head permeameter for a test. The sample occupied a height of 14.5
cm in a 7.6 cm diameter cylinder. Flow measurements were made at a number of different
heads until piping commenced. From the readings given below plot the velocity of flow
against hydraulic gradient and determine the coefficient of permeability of the soil. Also
compare the observed and theoretical values of the hydraulic gradient for piping and discuss
their application in the investigation of the foundation for the dam. Specific gravity of Soil
grains is 2.7.
Head, cm 2.9 6.9 10.3 13.1 13.9 14.1 14.6 14.9
Volume, cc 176 191 184 187 178 181 192 175
Time, sec 93.8 45 27.8 22.6 20.2 20.2 19.6 15.2
Solution
[1.0 pt]
head cm Volume CC Time sec Discharge cc/sec i velocity k
2.9 176 93.8 1.88 0.2 0.04 0.21
6.9 191 45 4.24 0.48 0.09 0.19
10.3 184 27.8 6.62 0.71 0.15 0.21
13.1 187 22.6 8.27 0.9 0.18 0.2
13.9 178 20.2 8.81 0.96 0.19 0.2
14.1 181 20.2 8.96 0.97 0.2 0.2
14.6 192 19.6 9.8 1.01 0.22 0.21
14.9 175 15.2 11.51 1.03 0.25 0.25
Velocity vs. Hydraulic gradient curve
y = 0.227x - 0.0126
0
0.05
0.1
0.15
0.2
0.25
0.3
0.2 0.4 0.6 0.8 1 1.2
Hydraulic Gradient, i
Velo
city,
cm
/sec
[2.0 pts]
From the graph the hydraulic conductivity of the foundation soil is the slope of the fitted trend
line, 0.23cm/sec [1.0 pt]
The observed hydraulic gradient for piping is 1.03 [1.0 pt]
The theoretical hydraulic gradient is
7.02.385
6.272
7.2/1040
7.2/10405.146.725.02
sV
Vve
0.17.01
17.2
1
1
e
Gi [2.0 pts]

Addis Ababa University Hydraulic Structures I
169
Discussion of applications of the above gradients [0.5 pt]
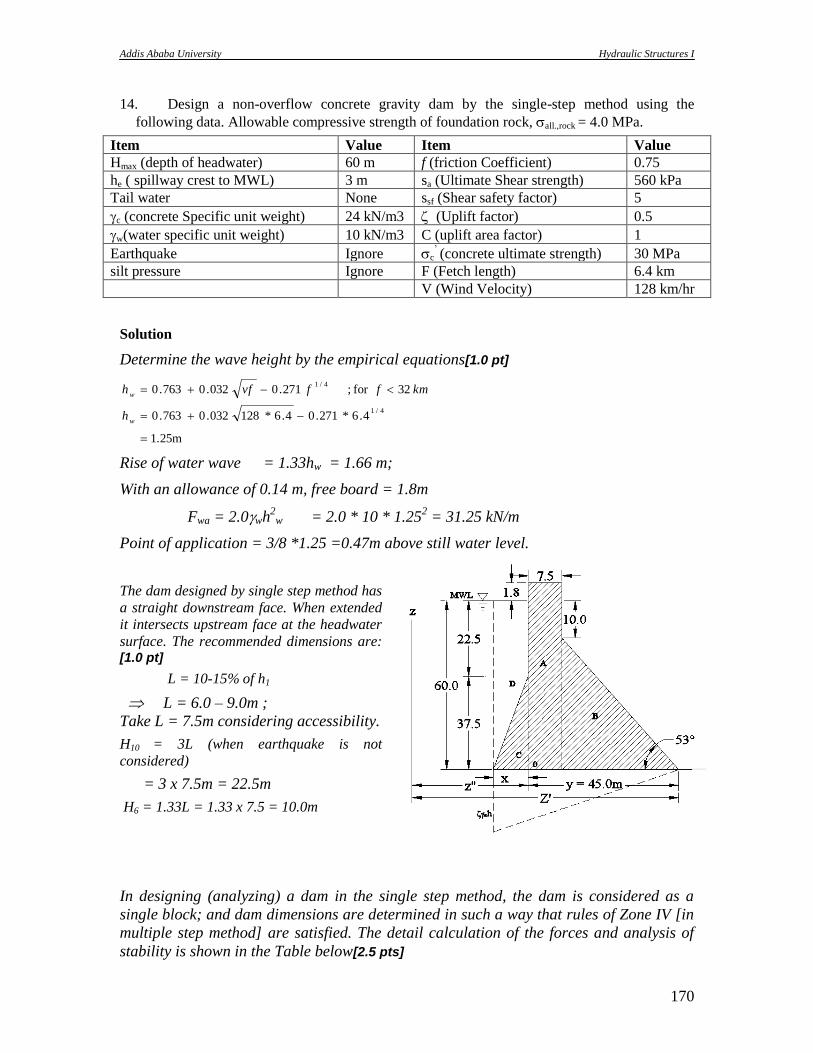
Addis Ababa University Hydraulic Structures I
170
14. Design a non-overflow concrete gravity dam by the single-step method using the
following data. Allowable compressive strength of foundation rock, all.,rock = 4.0 MPa.
Item Value Item Value
Hmax (depth of headwater) 60 m f (friction Coefficient) 0.75
he ( spillway crest to MWL) 3 m sa (Ultimate Shear strength) 560 kPa
Tail water None ssf (Shear safety factor) 5
c (concrete Specific unit weight) 24 kN/m3 (Uplift factor) 0.5
w(water specific unit weight) 10 kN/m3 C (uplift area factor) 1
Earthquake Ignore c‟ (concrete ultimate strength) 30 MPa
silt pressure Ignore F (Fetch length) 6.4 km
V (Wind Velocity) 128 km/hr
Solution
Determine the wave height by the empirical equations[1.0 pt]
1.25m
4.6*271.04.6*128032.0763.0
32for ; 271.0032.0763.0
4/1
4/1
w
w
h
kmffvfh
Rise of water wave = 1.33hw = 1.66 m;
With an allowance of 0.14 m, free board = 1.8m
Fwa = 2.0wh2
w = 2.0 * 10 * 1.252 = 31.25 kN/m
Point of application = 3/8 *1.25 =0.47m above still water level.
The dam designed by single step method has
a straight downstream face. When extended
it intersects upstream face at the headwater
surface. The recommended dimensions are: [1.0 pt]
L = 10-15% of h1
L = 6.0 – 9.0m ;
Take L = 7.5m considering accessibility.
H10 = 3L (when earthquake is not
considered)
= 3 x 7.5m = 22.5m
H6 = 1.33L = 1.33 x 7.5 = 10.0m
In designing (analyzing) a dam in the single step method, the dam is considered as a
single block; and dam dimensions are determined in such a way that rules of Zone IV [in
multiple step method] are satisfied. The detail calculation of the forces and analysis of
stability is shown in the Table below[2.5 pts]
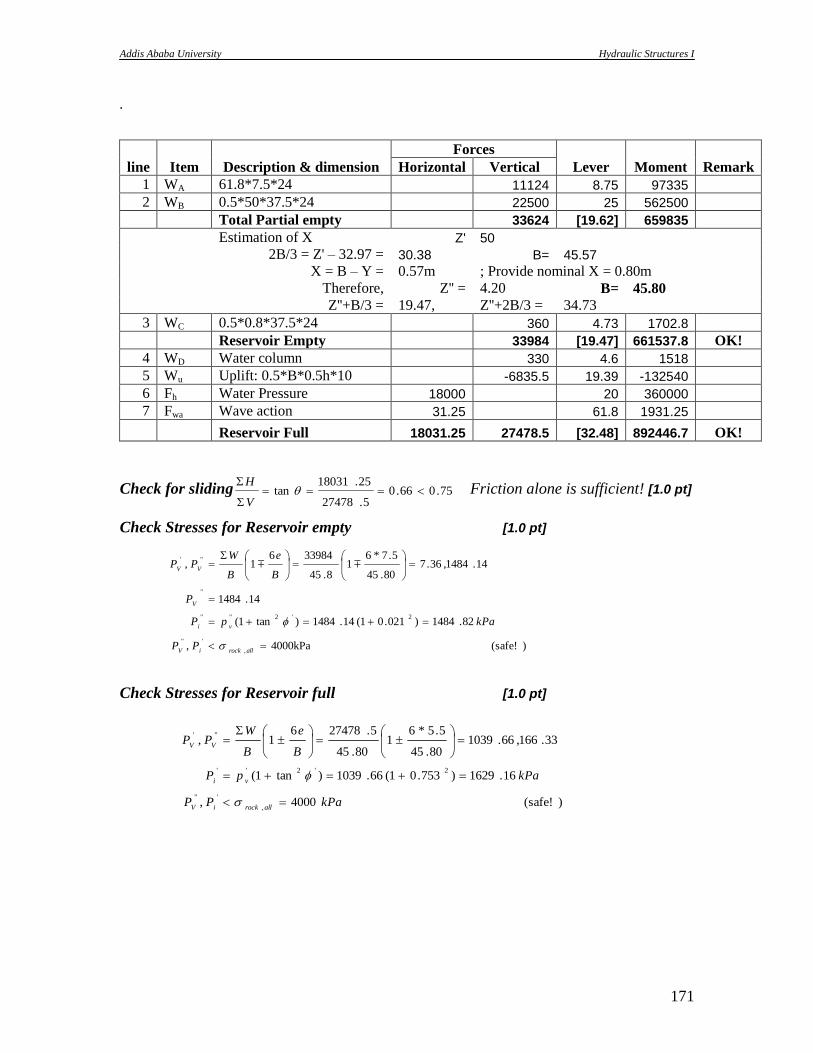
Addis Ababa University Hydraulic Structures I
171
.
line Item Description & dimension
Forces
Lever Moment Remark Horizontal Vertical
1 WA 61.8*7.5*24 11124 8.75 97335
2 WB 0.5*50*37.5*24 22500 25 562500
Total Partial empty 33624 [19.62] 659835
Estimation of X Z' 50
2B/3 = Z' – 32.97 = 30.38 B= 45.57
X = B – Y = 0.57m ; Provide nominal X = 0.80m
Therefore, Z'' = 4.20 B= 45.80
Z''+B/3 = 19.47, Z''+2B/3 = 34.73
3 WC 0.5*0.8*37.5*24 360 4.73 1702.8
Reservoir Empty 33984 [19.47] 661537.8 OK!
4 WD Water column 330 4.6 1518
5 Wu Uplift: 0.5*B*0.5h*10 -6835.5 19.39 -132540
6 Fh Water Pressure 18000 20 360000
7 Fwa Wave action 31.25 61.8 1931.25
Reservoir Full 18031.25 27478.5 [32.48] 892446.7 OK!
Check for sliding 75.066.05.27478
25.18031tan
V
H Friction alone is sufficient! [1.0 pt]
Check Stresses for Reservoir empty [1.0 pt]
)(safe! 4000kPa ,
82.1484)021.01(14.1484)tan1(
14.1484
14.1484,36.780.45
5.7*61
8.45
3398461,
,
'"
2'2""
"
"'
allrockiV
vi
V
VV
PP
kPapP
P
B
e
B
WPP
Check Stresses for Reservoir full [1.0 pt]
)(safe! 4000 ,
16.1629)753.01(66.1039)tan1(
33.166,66.103980.45
5.5*61
80.45
5.2747861,
,
'"
2'2''
"'
kPaPP
kPapP
B
e
B
WPP
allrockiV
vi
VV
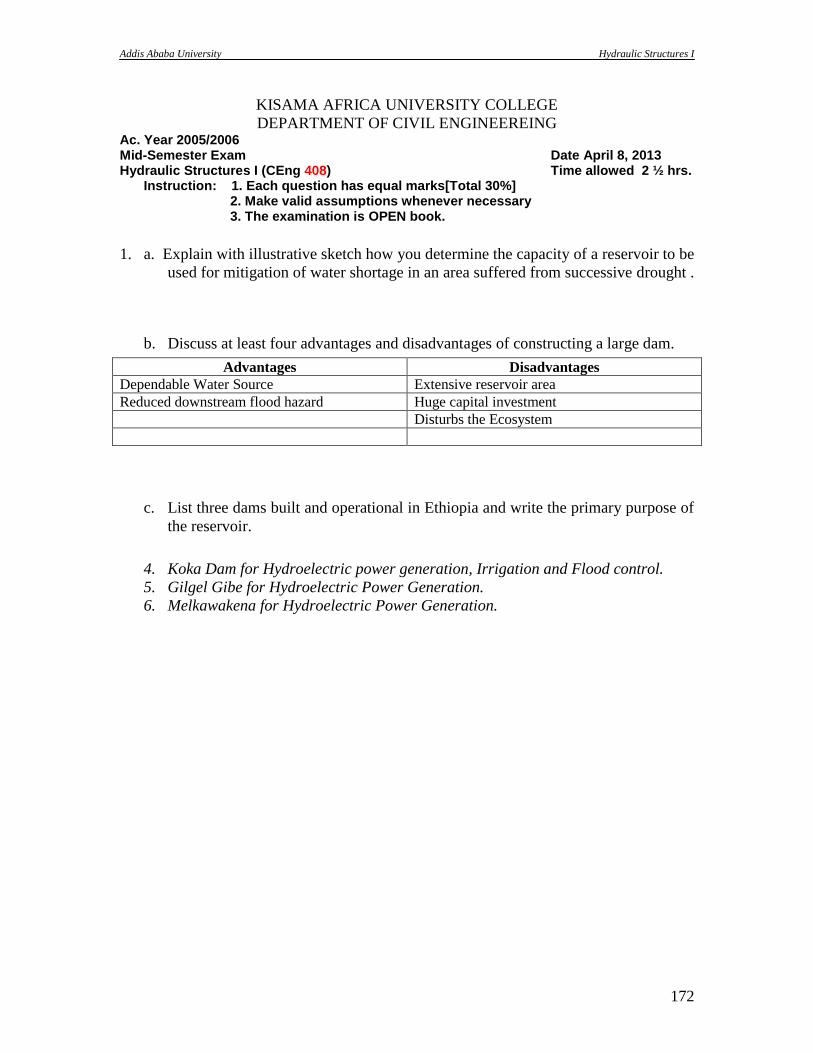
Addis Ababa University Hydraulic Structures I
172
KISAMA AFRICA UNIVERSITY COLLEGE
DEPARTMENT OF CIVIL ENGINEEREING Ac. Year 2005/2006 Mid-Semester Exam Date April 8, 2013 Hydraulic Structures I (CEng 408) Time allowed 2 ½ hrs.
Instruction: 1. Each question has equal marks[Total 30%] 2. Make valid assumptions whenever necessary 3. The examination is OPEN book.
1. a. Explain with illustrative sketch how you determine the capacity of a reservoir to be
used for mitigation of water shortage in an area suffered from successive drought .
b. Discuss at least four advantages and disadvantages of constructing a large dam.
Advantages Disadvantages
Dependable Water Source Extensive reservoir area
Reduced downstream flood hazard Huge capital investment
Disturbs the Ecosystem
c. List three dams built and operational in Ethiopia and write the primary purpose of
the reservoir.
4. Koka Dam for Hydroelectric power generation, Irrigation and Flood control.
5. Gilgel Gibe for Hydroelectric Power Generation.
6. Melkawakena for Hydroelectric Power Generation.
Addis Ababa University Hydraulic Structures I
173
2. With reference to the hydrologic cycle and its component stages discuss how the
structural intervention of human being on the natural cycle is essential to adjust the
spatial variation and temporal variation of water in a way that brings sustainable
development in harmony with the ecosystem and environment. (Take an illustrative
hydraulic structure to elaborate your discussion if necessary)
Water is one of the essential prerequisites of life. A country's water resources include all
the water in rivers, lakes, seas, and groundwater which are stages of the hydrologic
cycle. The distribution of water in nature in space and time, however, is such that it is
scarce at some locations and at particular times and excess at other locations (and at
another time at same location). Rainfall, which is the main water input to our ecosystem,
is variable in space and time. This is then reflected, for instance, in river flow,
groundwater and lake-levels. Some areas get more or less uniform and good amount of
rainfall most of the year (like areas in Southwest Ethiopia), whereas other places get
their rainfall concentrated in few months (the wet season). Still there are places that get
very scanty rainfall. On the other hand the society's demand is not in general
synchronised with the availability of water. In fact, some needs, such as irrigation water
requirements are high during periods of no, or less rainfall. Hence man is faced with the
task of developing the available water resources to meet his needs.
With water needs for domestic use and that for food production being the basic
requirements, water needs of a society, both in quantity and quality depend upon its level
of development. Water is needed for energy production (hydropower), industrial use,
recreation, and navigation (waterways), to mention the most common and traditional
ones. Thus projects are designed and implemented to meet all or some of these needs.
The very water that is essential for life may also threaten life. Floods cause from time to
time great losses to human life and property. Thus settlements and developments on
banks of rivers should be protected from occurring floods, high flows in streams should
not cause damage to bridges, etc., for instance by building dykes, In such cases the water
has to be controlled so that its harmful consequences are minimised, if not totally
prevented.
Consider building of a storage reservoir as a case
The absence of natural storage of adequate capacities necessitates construction of some
artificial storage works. Development of natural storages may also be included in this
category sometimes (Cherecherea weir at Lake Tana). In rainy season there is excess
flow down the valley in a river. An impounding reservoir(human intervention) can be
constructed in the valley to store this excess water which will meet the demand in dry
periods.
Ctd….
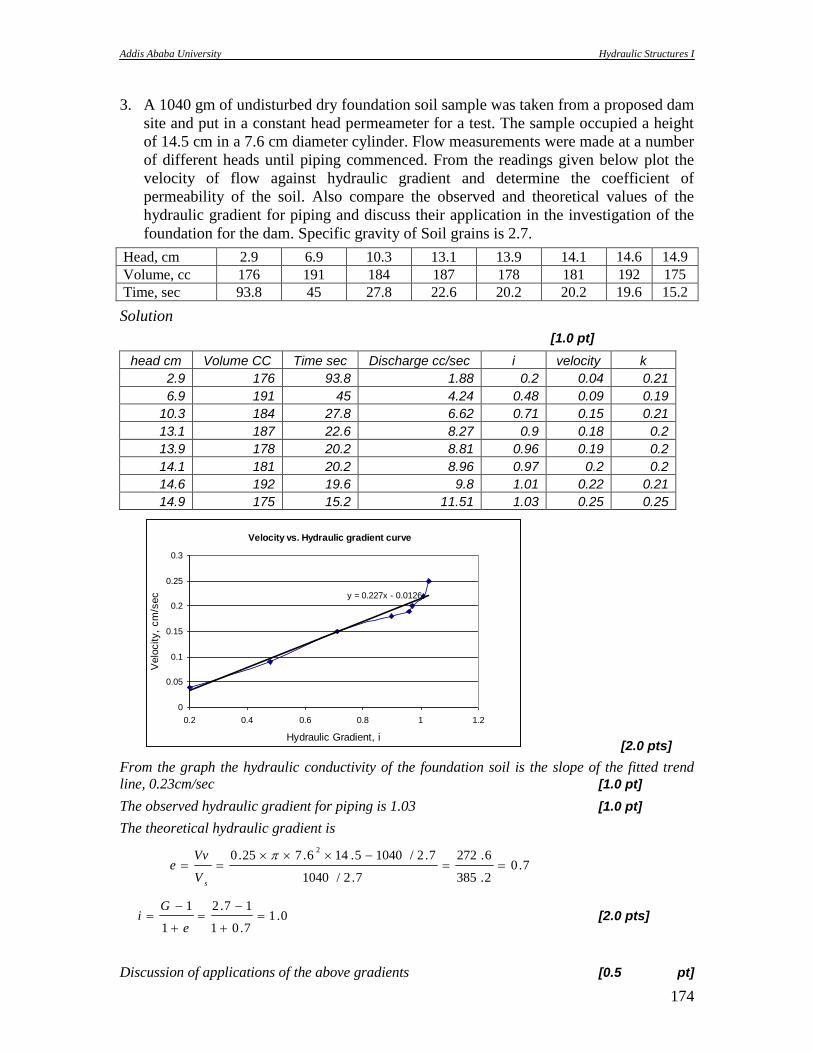
Addis Ababa University Hydraulic Structures I
174
3. A 1040 gm of undisturbed dry foundation soil sample was taken from a proposed dam
site and put in a constant head permeameter for a test. The sample occupied a height
of 14.5 cm in a 7.6 cm diameter cylinder. Flow measurements were made at a number
of different heads until piping commenced. From the readings given below plot the
velocity of flow against hydraulic gradient and determine the coefficient of
permeability of the soil. Also compare the observed and theoretical values of the
hydraulic gradient for piping and discuss their application in the investigation of the
foundation for the dam. Specific gravity of Soil grains is 2.7.
Head, cm 2.9 6.9 10.3 13.1 13.9 14.1 14.6 14.9
Volume, cc 176 191 184 187 178 181 192 175
Time, sec 93.8 45 27.8 22.6 20.2 20.2 19.6 15.2
Solution
[1.0 pt]
head cm Volume CC Time sec Discharge cc/sec i velocity k
2.9 176 93.8 1.88 0.2 0.04 0.21
6.9 191 45 4.24 0.48 0.09 0.19
10.3 184 27.8 6.62 0.71 0.15 0.21
13.1 187 22.6 8.27 0.9 0.18 0.2
13.9 178 20.2 8.81 0.96 0.19 0.2
14.1 181 20.2 8.96 0.97 0.2 0.2
14.6 192 19.6 9.8 1.01 0.22 0.21
14.9 175 15.2 11.51 1.03 0.25 0.25
Velocity vs. Hydraulic gradient curve
y = 0.227x - 0.0126
0
0.05
0.1
0.15
0.2
0.25
0.3
0.2 0.4 0.6 0.8 1 1.2
Hydraulic Gradient, i
Velo
city,
cm
/sec
[2.0 pts]
From the graph the hydraulic conductivity of the foundation soil is the slope of the fitted trend
line, 0.23cm/sec [1.0 pt]
The observed hydraulic gradient for piping is 1.03 [1.0 pt]
The theoretical hydraulic gradient is
7.02.385
6.272
7.2/1040
7.2/10405.146.725.02
sV
Vve
0.17.01
17.2
1
1
e
Gi [2.0 pts]
Discussion of applications of the above gradients [0.5 pt]
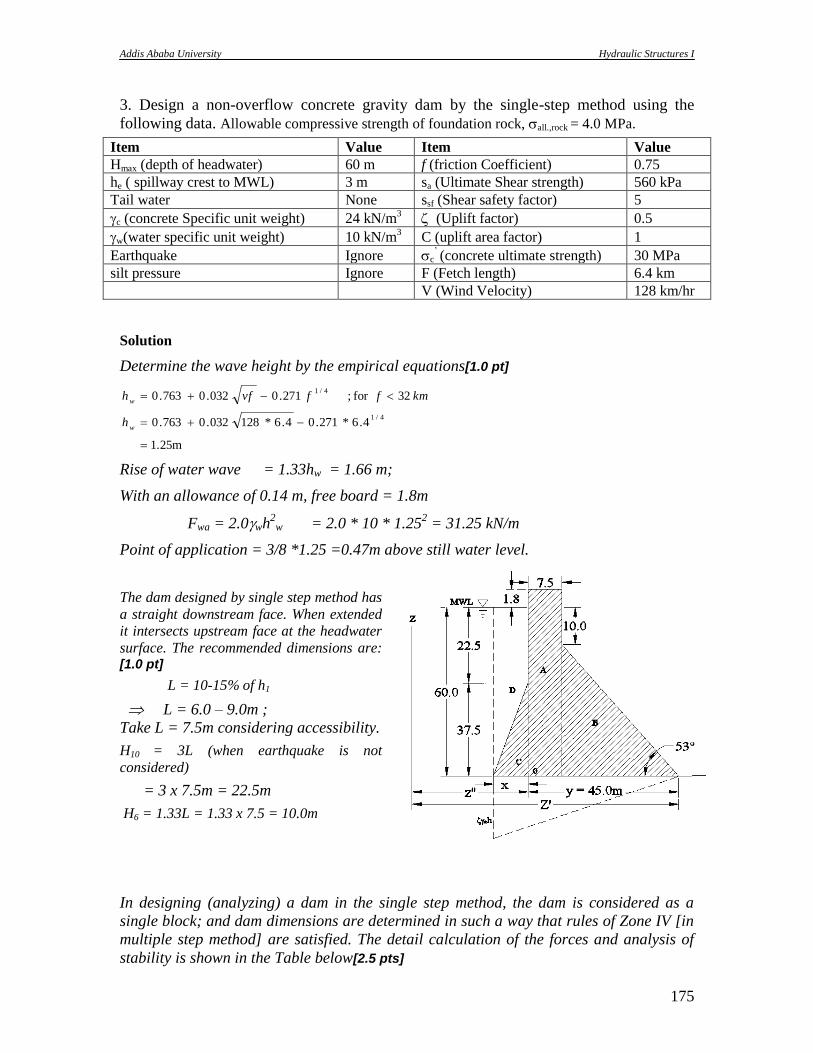
Addis Ababa University Hydraulic Structures I
175
3. Design a non-overflow concrete gravity dam by the single-step method using the
following data. Allowable compressive strength of foundation rock, all.,rock = 4.0 MPa.
Item Value Item Value
Hmax (depth of headwater) 60 m f (friction Coefficient) 0.75
he ( spillway crest to MWL) 3 m sa (Ultimate Shear strength) 560 kPa
Tail water None ssf (Shear safety factor) 5
c (concrete Specific unit weight) 24 kN/m3 (Uplift factor) 0.5
w(water specific unit weight) 10 kN/m3 C (uplift area factor) 1
Earthquake Ignore c‟ (concrete ultimate strength) 30 MPa
silt pressure Ignore F (Fetch length) 6.4 km
V (Wind Velocity) 128 km/hr
Solution
Determine the wave height by the empirical equations[1.0 pt]
1.25m
4.6*271.04.6*128032.0763.0
32for ; 271.0032.0763.0
4/1
4/1
w
w
h
kmffvfh
Rise of water wave = 1.33hw = 1.66 m;
With an allowance of 0.14 m, free board = 1.8m
Fwa = 2.0wh2
w = 2.0 * 10 * 1.252 = 31.25 kN/m
Point of application = 3/8 *1.25 =0.47m above still water level.
The dam designed by single step method has
a straight downstream face. When extended
it intersects upstream face at the headwater
surface. The recommended dimensions are: [1.0 pt]
L = 10-15% of h1
L = 6.0 – 9.0m ;
Take L = 7.5m considering accessibility.
H10 = 3L (when earthquake is not
considered)
= 3 x 7.5m = 22.5m
H6 = 1.33L = 1.33 x 7.5 = 10.0m
In designing (analyzing) a dam in the single step method, the dam is considered as a
single block; and dam dimensions are determined in such a way that rules of Zone IV [in
multiple step method] are satisfied. The detail calculation of the forces and analysis of
stability is shown in the Table below[2.5 pts]
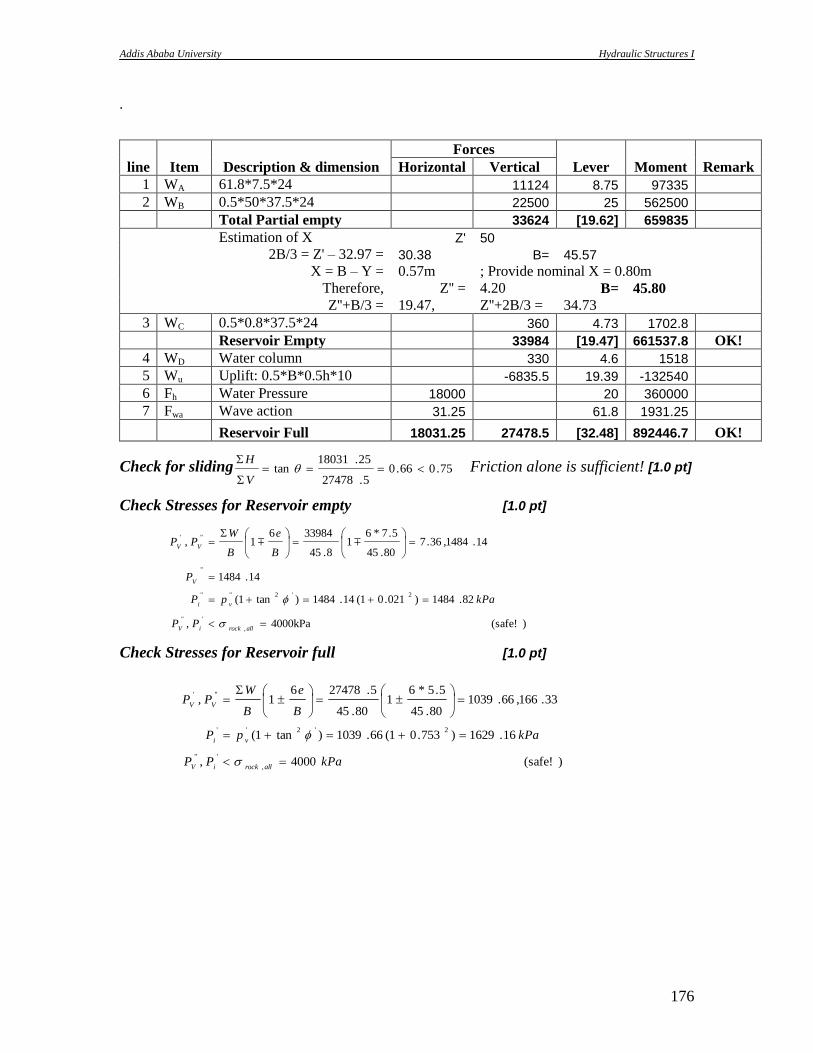
Addis Ababa University Hydraulic Structures I
176
.
line Item Description & dimension
Forces
Lever Moment Remark Horizontal Vertical
1 WA 61.8*7.5*24 11124 8.75 97335
2 WB 0.5*50*37.5*24 22500 25 562500
Total Partial empty 33624 [19.62] 659835
Estimation of X Z' 50
2B/3 = Z' – 32.97 = 30.38 B= 45.57
X = B – Y = 0.57m ; Provide nominal X = 0.80m
Therefore, Z'' = 4.20 B= 45.80
Z''+B/3 = 19.47, Z''+2B/3 = 34.73
3 WC 0.5*0.8*37.5*24 360 4.73 1702.8
Reservoir Empty 33984 [19.47] 661537.8 OK!
4 WD Water column 330 4.6 1518
5 Wu Uplift: 0.5*B*0.5h*10 -6835.5 19.39 -132540
6 Fh Water Pressure 18000 20 360000
7 Fwa Wave action 31.25 61.8 1931.25
Reservoir Full 18031.25 27478.5 [32.48] 892446.7 OK!
Check for sliding 75.066.05.27478
25.18031tan
V
H Friction alone is sufficient! [1.0 pt]
Check Stresses for Reservoir empty [1.0 pt]
)(safe! 4000kPa ,
82.1484)021.01(14.1484)tan1(
14.1484
14.1484,36.780.45
5.7*61
8.45
3398461,
,
'"
2'2""
"
"'
allrockiV
vi
V
VV
PP
kPapP
P
B
e
B
WPP
Check Stresses for Reservoir full [1.0 pt]
)(safe! 4000 ,
16.1629)753.01(66.1039)tan1(
33.166,66.103980.45
5.5*61
80.45
5.2747861,
,
'"
2'2''
"'
kPaPP
kPapP
B
e
B
WPP
allrockiV
vi
VV

Addis Ababa University Hydraulic Structures I
177

Addis Ababa University Hydraulic Structures I
178
Appendix 1 Complete list of Greek Letters
Symbol
Name Capital Small
A Alpha
Beta
Gamma
Delta
Epsilon
Z Zeta
H Eta
Theta
I Iota
K Kappa
Lambda
M Mu
N Nu
Xi
O Omicron
Pi
Rho
Sigma
T Tau
Y Upsilon
Phi
X Chi
Psi
Omega