
Open-File Report 85-560...arch, buttress, or gravity dams, and earth- or rock-fill dams. Natural...
59
UNITED STATES DEPARTMENT OF THE INTERIOR GEOLOGICAL SURVEY FLOODS FROM DAM FAILURES By John E. Costa Open-File Report 85-560 Denver, Colorado 1985
Transcript of Open-File Report 85-560...arch, buttress, or gravity dams, and earth- or rock-fill dams. Natural...
UNITED STATESDEPARTMENT OF THE INTERIOR
GEOLOGICAL SURVEY
FLOODS FROM DAM FAILURES
By John E. Costa
Open-File Report 85-560
Denver, Colorado 1985
UNITED STATES DEPARTMENT OF THE INTERIOR
DONALD PAUL HODEL, SECRETARY
GEOLOGICAL SURVEY
Dallas L. Peck, Director
For additional information write to:
John E. Costa U.S. Geological Survey Water Resources Division Box 25046, MS 413, DFC Denver, CO 80225
Copies of this report can be purchased from:
Open-File Services Section Western Distribution Branch Box 25425, Federal Center Denver, Colorado 80225 (Telephone: (303) 236-7476)
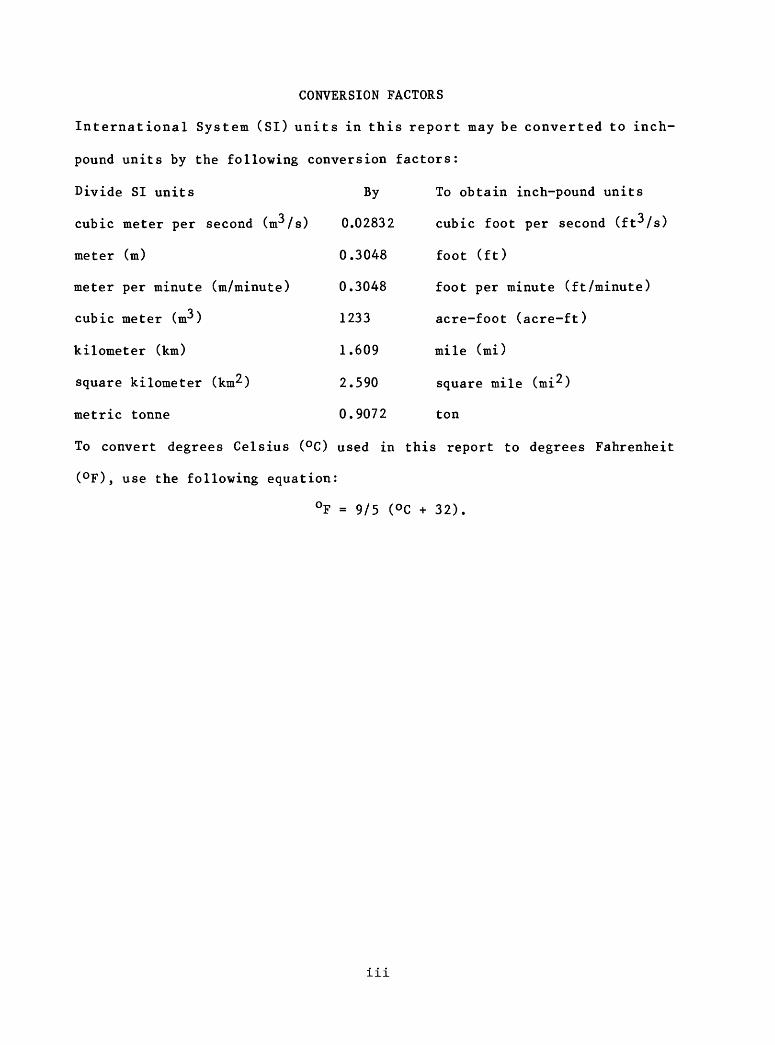
CONVERSION FACTORS
International System (SI) units in this report may be converted to inch-
pound units by the following conversion factors:
Divide SI units By
cubic meter per second (nr/s) 0.02832
meter (m) 0.3048
meter per minute (m/minute) 0.3048
cubic meter (nr*) 1233
kilometer (km) 1.609
square kilometer (km^) 2.590
metric tonne
To obtain inch-pound units
cubic foot per second (ft^/s)
foot (ft)
foot per minute (ft/minute)
acre-foot (acre-ft)
mile (mi)
square mile (mi^)
ton0.9072
To convert degrees Celsius (°C) used in this report to degrees Fahrenheit
(°F), use the following equation:
°F = 9/5 (°C + 32).
111
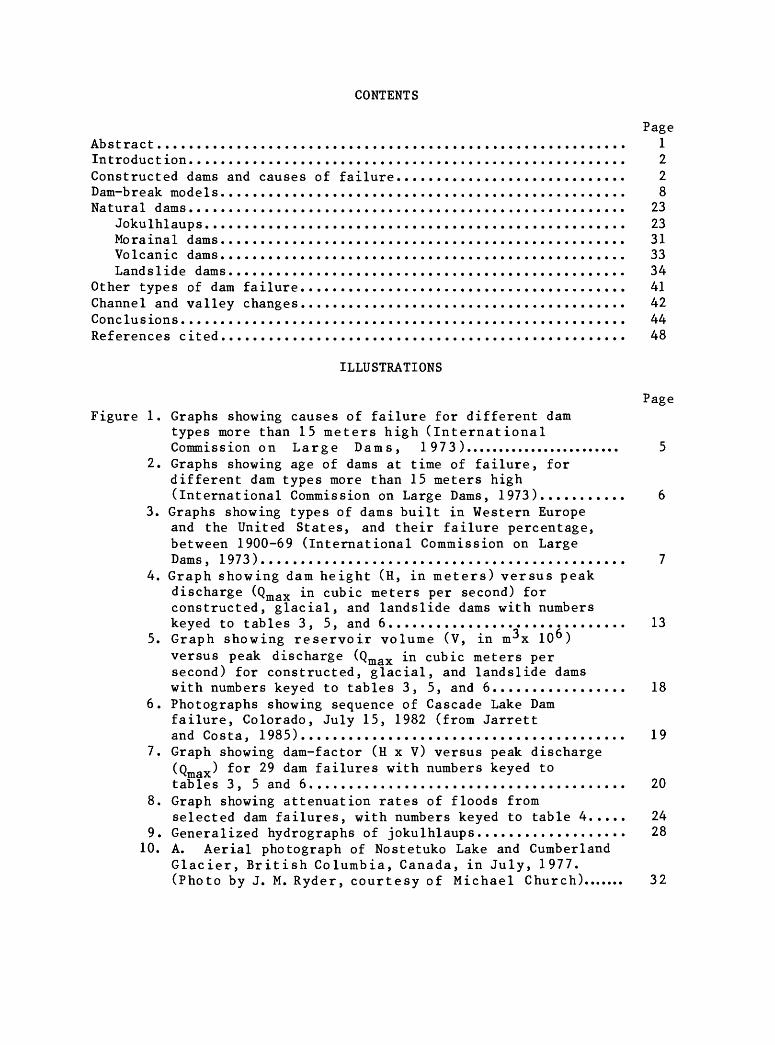
CONTENTS
PageAbstract........................................................... 1Introduction....................................................... 2Constructed dams and causes of failure............................. 2Dam-break models................................................... 8Natural dams....................................................... 23
Jokulhlaups..................................................... 23Morainal dams................................................... 31Volcanic dams................................................... 33Landslide dams.................................................. 34
Other types of dam failure......................................... 41Channel and valley changes......................................... 42Conclusions........................................................ 44References cited................................................... 48
ILLUSTRATIONS
PageFigure 1. Graphs showing causes of failure for different dam
types more than 15 meters high (international Commission on Large Dams, 1973)........................ 5
2. Graphs showing age of dams at time of failure, for different dam types more than 15 meters high (international Commission on Large Dams, 1973)........... 6
3. Graphs showing types of dams built in Western Europe and the United States, and their failure percentage, between 1900-69 (International Commission on Large Dams, 1973).............................................. 7
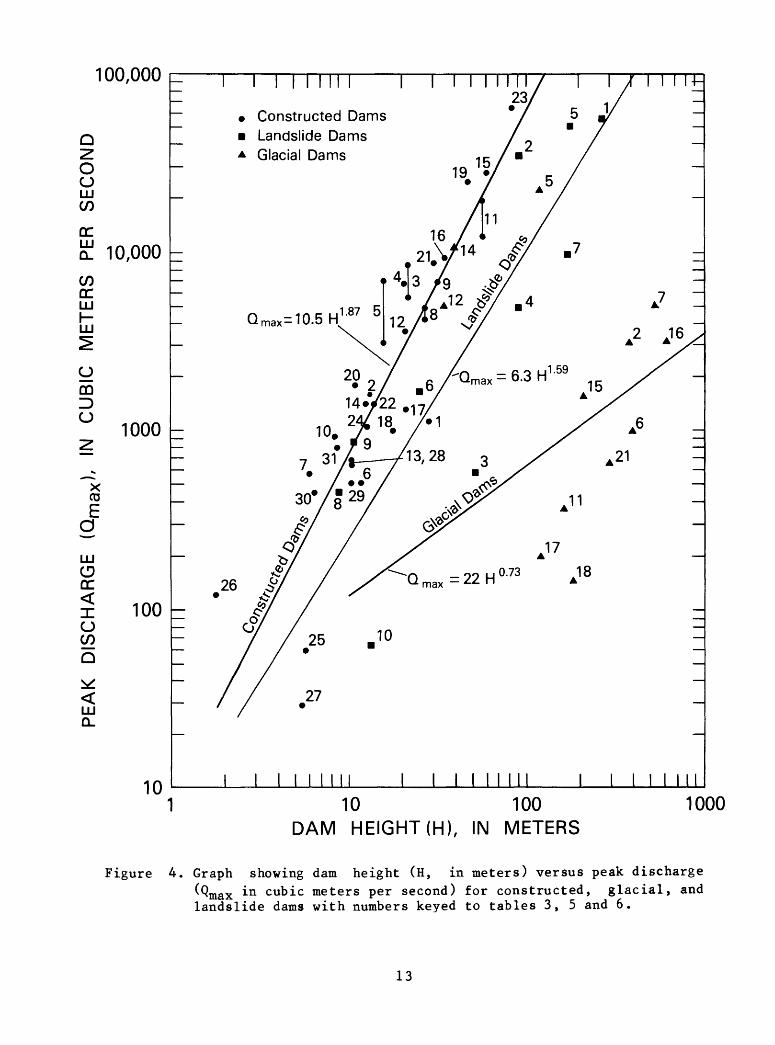
4. Graph showing dam height (H, in meters) versus peak discharge (Qmax in cubic meters per second) for constructed, glacial, and landslide dams with numbers keyed to tables 3, 5, and 6.............................. 13
5. Graph showing reservoir volume (V, in m^x 10") versus peak discharge (Qmax in cubic meters per second) for constructed, glacial, and landslide dams with numbers keyed to tables 3, 5, and 6................. 18
6. Photographs showing sequence of Cascade Lake Dam failure, Colorado, July 15, 1982 (from Jarrett and Costa, 1985)......................................... 19
7. Graph showing dam-factor (H x V) versus peak discharge (Qmax ) for 29 dam failures with numbers keyed to tables 3, 5 and 6. ....................................... 20
8. Graph showing attenuation rates of floods fromselected dam failures, with numbers keyed to table 4..... 24
9. Generalized hydrographs of Jokulhlaups................... 2810. A. Aerial photograph of Nostetuko Lake and Cumberland
Glacier, British Columbia, Canada, in July, 1977. (Photo by J. M. Ryder, courtesy of Michael Church)....... 32
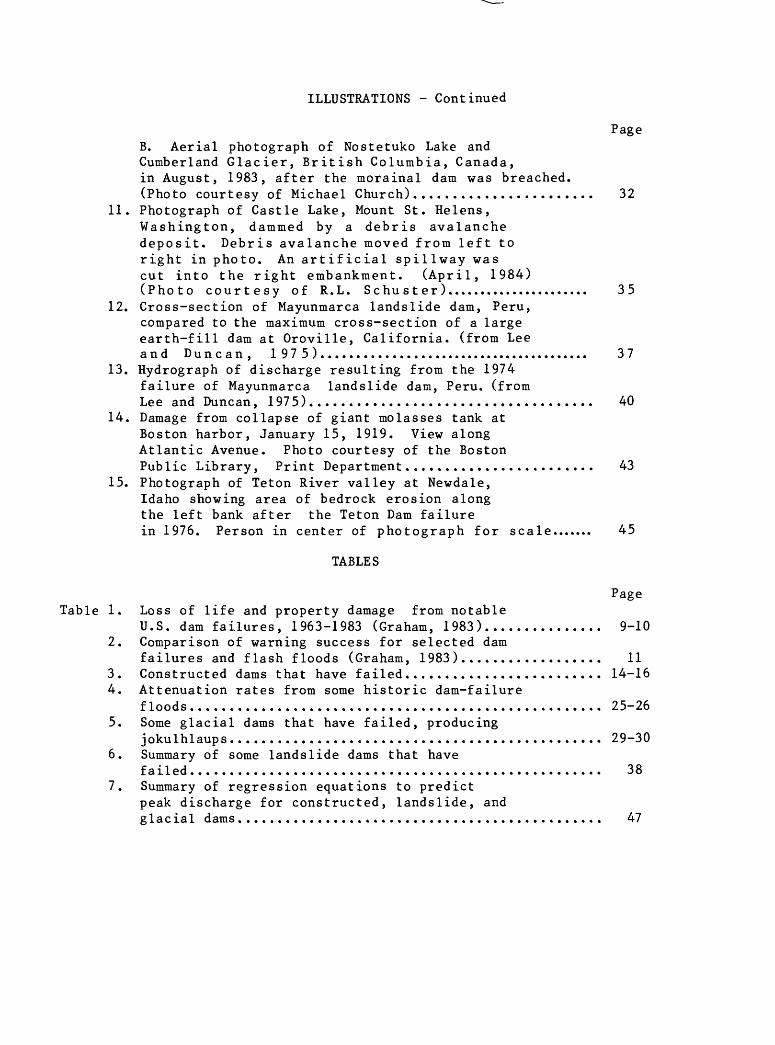
ILLUSTRATIONS - Continued
PageB. Aerial photograph of Nostetuko Lake and Cumberland Glacier, British Columbia, Canada, in August, 1983, after the morainal dam was breached. (Photo courtesy of Michael Church)....................... 32
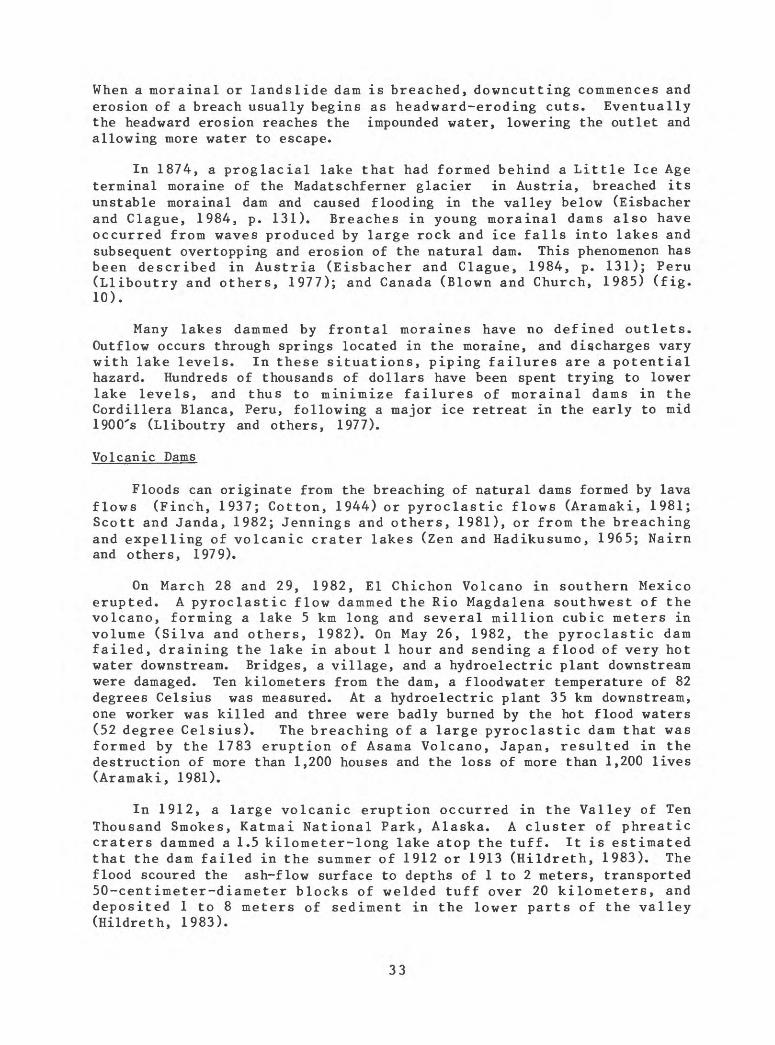
11. Photograph of Castle Lake, Mount St. Helens, Washington, dammed by a debris avalanche deposit. Debris avalanche moved from left to right in photo. An artificial spillway was cut into the right embankment. (April, 1984) (Photo courtesy of R.L. Schu st er)...................... 35
12. Cross-section of Mayunmarca landslide dam, Peru, compared to the maximum cross-section of a large earth-fill dam at Oroville, California, (from Lee and Duncan, 1975)........................................ 37
13. Hydrograph of discharge resulting from the 1974 failure of Mayunmarca landslide dam, Peru, (from Lee and Duncan, 197 5).................................... 40
14. Damage from collapse of giant molasses tank at Boston harbor, January 15, 1919. View along Atlantic Avenue. Photo courtesy of the Boston Public Library, Print Department........................ 43
15. Photograph of Teton River valley at Newdale, Idaho showing area of bedrock erosion along the left bank after the Teton Dam failure in 1976. Person in center of photograph for scale....... 45
TABLES
Page Table 1. Loss of life and property damage from notable
U.S. dam failures, 1963-1983 (Graham, 1983)............... 9-102. Comparison of warning success for selected dam
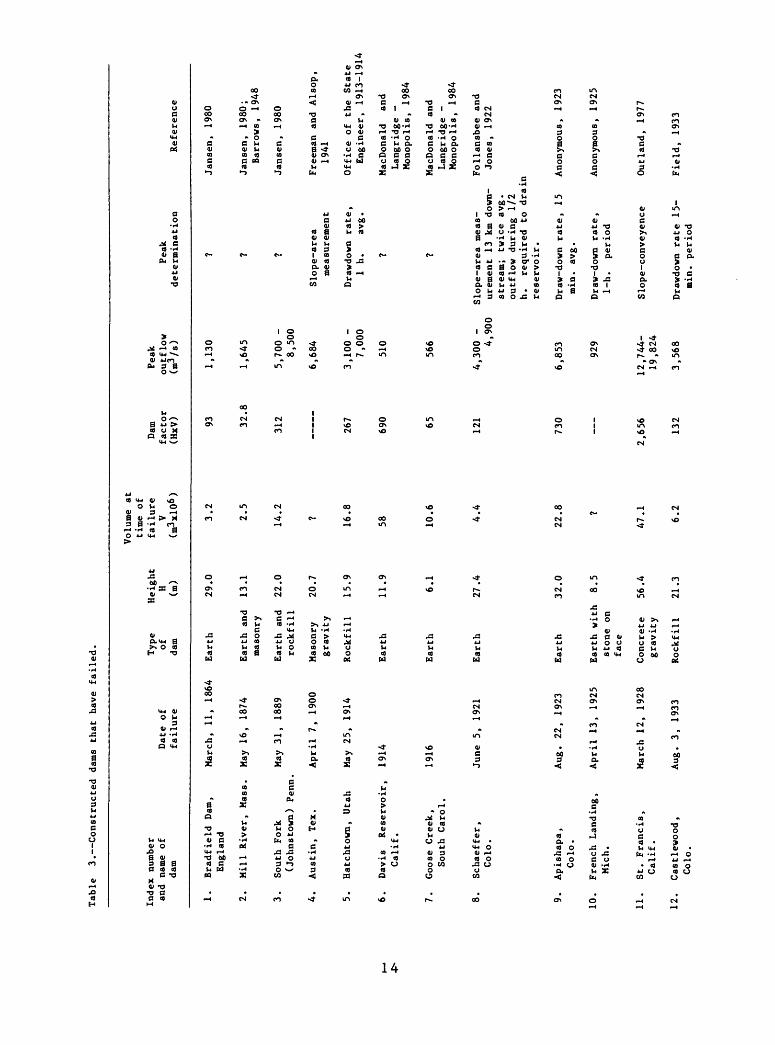
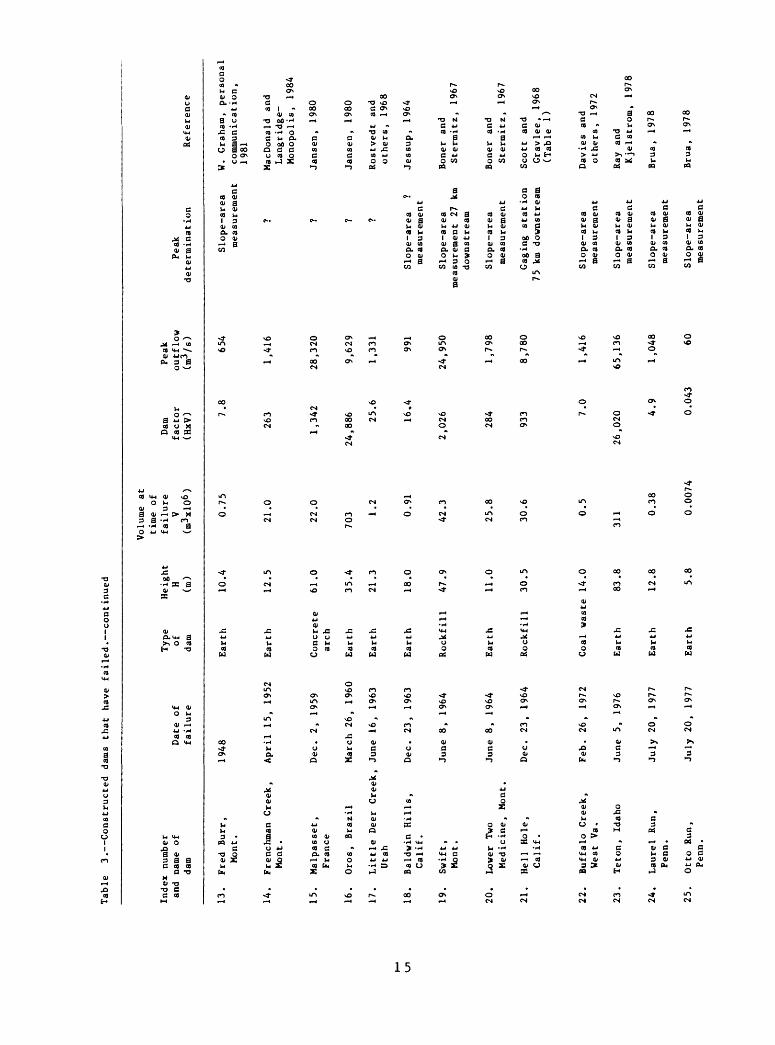
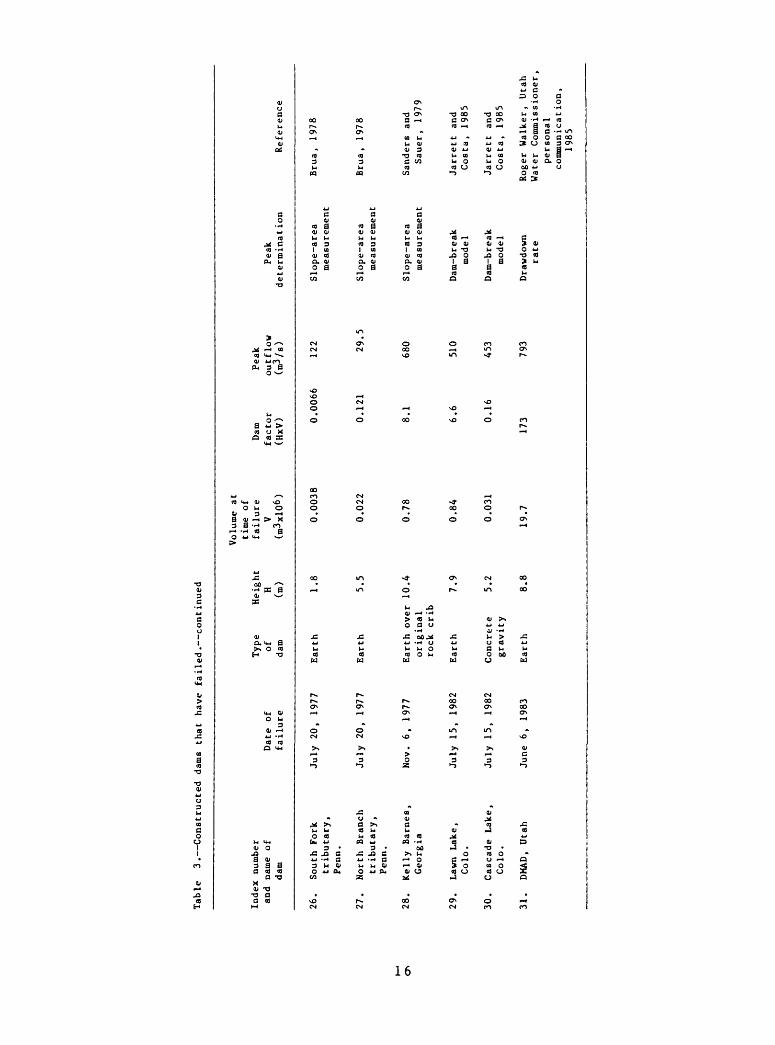
failures and flash floods (Graham, 1983).................. 113. Constructed dams that have failed......................... 14-164. Attenuation rates from some historic dam-failure
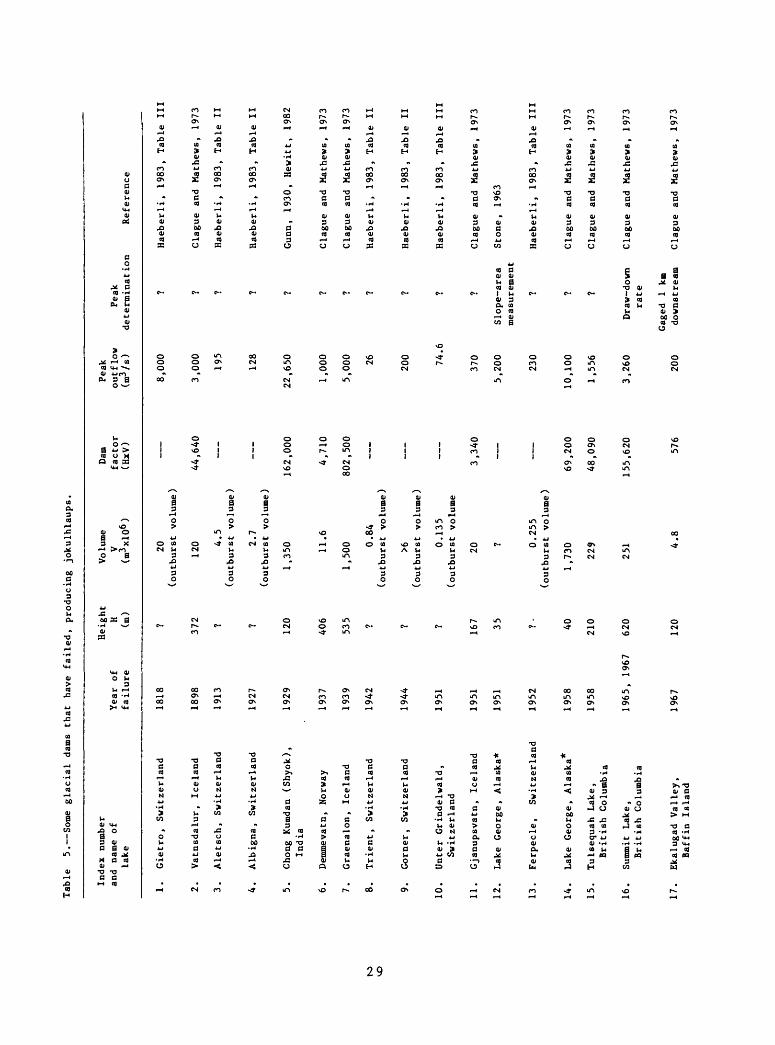
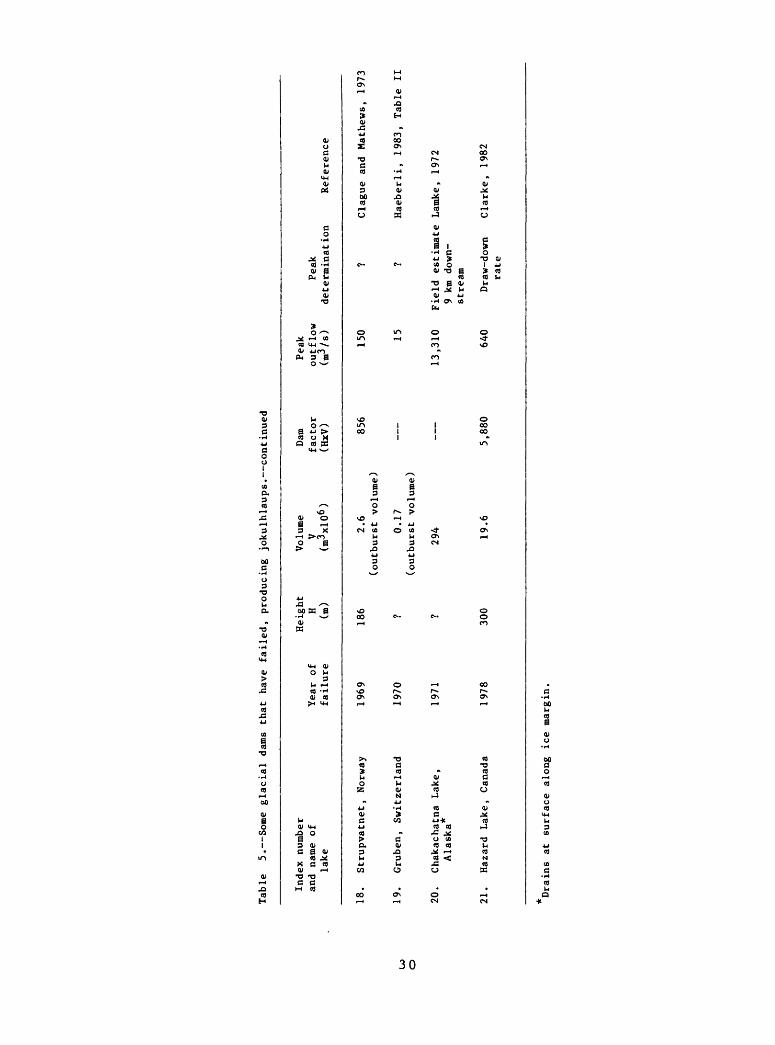
floods.................................................... 25-265. Some glacial dams that have failed, producing
jokulhlaups............................................... 29-306. Summary of some landslide dams that have
failed.................................................... 387. Summary of regression equations to predict
peak discharge for constructed, landslide, andglacial dams.............................................. 47
FLOODS FROM DAM FAILURES
by John E. Costa
ABSTRACT
Floods resulting from dam failures usually are much larger than those originating from snowmelt or rainfall. Dams can be classified as constructed dams and natural dams. Constructed dams are usually concrete arch, buttress, or gravity dams, and earth- or rock-fill dams. Natural dams include ice dams, morainal dams, volcanic dams, and landslide dams. Other unusual kinds of dam failures include drainage of lakes by underground mining, bursts of large water-diversion pipes, bursts of water stored in peatlands (bog-bursts), and failures of large-volume industrial containers.
During the last 100 years, there have been about 200 significant failures of constructed dams, resulting in the death of more than 11,100 people. More than 60 percent of this loss of life occurred in three failures alone: Vaiont, Italy, 1963 (2,600), South Fork (Johnstown) Pennsylvania, U.S.A., 1889 (2,200), and Machhu II, India, 1974 (2,000 +). Major causes of constructed- dam failures are overtopping due to an inadequate spillway (34 percent), foundation defects (30 percent), and piping and seepage (28 percent). An order-of-magnitude estimate of risk of dam failure is approximately 10" per dam-year. In the United States for the last 2 decades, the annual loss of life from dam failures has been about 14. The average number of fatalities per dam failure is 19 times greater when there is inadequate or no warning.
The release of ice-dammed lakes can occur by raising the ice barrier by hydrostatic flotation, or by drainage and subsequent enlargement of cracks and tunnels in the ice dam. Flood peaks predicted from failure of glacial dams have the lowest standard error of prediction using the product of dam height and reservoir volume. Flood peaks from failure of ice dams generally are smaller than flood peaks resulting from failure of constructed and landslide dams of the same height or impounding the same volume. However the largest flood known to have occurred on the surface of the Earth, the "Spokane Flood" in eastern Washington, U.S.A., originated from the sudden release of water from Glacial Lake Missoula when an ice dam failed between 16,000 and 12,000 years ago.
Landslide dams are a world-wide phenomenon. They typically are much wider and involve larger volumes of sediment than constructed dams of the same height. Consequently when a landslide dam fails, there commonly is much more sediment and debris to erode before a full breach is developed. Thus floods resulting from failure of landslide dams generally have smaller flood peaks than floods from failed constructed dams with the same dam height and reservoir volume. Natural dams of pyroclastic sediments seem to be the most susceptable to rapid failure.
For rapid prediction purposes, when potential loss of life or property is involved, a conservative peak-discharge estimate based on envelope curves developed from historic dam failures can be made from knowledge of
dam height and reservoir volume. For reconstructing past flood peaks from dam failures for paleohydrological or sedimentological investigations, regression equations with dam height and volume as independent variables produce equations with standard errors of 75 to 147 percent. For all types of dams, the dam factor (height times volume of water), a rough measure of potential energy, produced the lowest average standard error.
After large floods from dam failures, one or more of the following characteristics can be expected: (1) Aggradation of the valley upstream by trapped sediment, (2) triggering of landslides by the rapid draw-down of reservoir water levels, (3) large amounts of local scour and deposition downstream, (4) erosion of bedrock along valley walls, and (5) the formation of wide, shallow, braided channels downstream.
INTRODUCTION
The purpose of this report is to summarize, in a general way, information about the hydrology and geomorphology of floods produced from the failure of natural and constructed dams. Floods resulting from dam failures usually are much larger than those originating from snowmelt or rainfall. The sudden release of large quantities of stored water from a breached dam can cause great destruction to property and potential loss of life downstream. The volumes and magnitudes of some floods from dam failures may be unprecedented in the cultural and natural history of the affected valley. Tremendous quantities of sediment and debris eroded, transported, and deposited downstream can cause significant modifications to channels and valley morphology. Floods from dam failures have produced shear stresses and unit stream powers comparable to the largest rainfall- runoff or snowmelt floods ever measured in the United States (J. E. Costa, U.S. Geological Survey, unpub. data, 1985).
Dams generally can be categorized as constructed dams and natural dams. Within each category there are numerous types.
CONSTRUCTED DAMS AND CAUSES OF FAILURES
The construction of dams to create reservoirs for water supply was one of the earliest engineering undertakings. Remains of one of the oldest constructed dams in the world, believed to date from ca. 2900 B.C., still survive in the Wadi el-Garawi about 32 km south of Cairo, Egypt. This rubble-masonry structure was 107 m long, 11 m high, and had a reservoir capacity of 570,000 m^ (Jansen, 1980). The Romans built many stone dams throughout their empire, the earliest near Toledo, Spain sometime after 193 B.C. In the United States, the first dams were constructed to impound water to run gristmills and sawmills. One of the earliest dams was erected in 1623 to run the first sawmill in America on the Piscataqua River at South Windham, Maine. On the western coast of the United States, Jesuits constructed one of the earliest dams on the San Diego River in 1770 (Jansen, 1980).
In the United States, the National Dam Inspection Program (Public Law 92-367) compiled data on about 68,000 dams that were either more than 7.6 m high, or impounded at least 61,650 m^ at maximum water-storage elevation. Earth- and rockfill dams by far constitute the largest percentage of dam types (93 percent). Their characteristics consist of an impermeable barrier made from compaction of fine-grained materials, combined with a mass of earth and rock material to impound water. An earthfill dam is an embankment dam in which more than 50 percent of the total volume is formed of compacted fine-grained material obtained from a borrow area. A rockfill dam is an embankment dam in which more than 50 percent of the total volume consists of compacted or dumped pervious natural or crushed rock. Foundation requirements are less stringent than for other types of dams.
A gravity dam, constructed of concrete or masonry or both, relies on its weight for stability. Gravity dams represented 5 percent of the investigated dams. An arch dam (0.4 percent of the sample) is a concrete or masonry dam that is curved in plan so as to transmit the major proportion of the water stress to the bedrock abutments. Buttress dams (0.3 percent of the sample) consist of a watertight upstream face supported at intervals on the downstream side by a series of buttresses.
Of the 8,639 dams inspected by the U.S. Army Corps of Engineers by September, 1981, 1/3 were declared unsafe. The primary defect of 82 percent of the dams was inadequate spillway capacity. The two largest groups of owners of unsafe dams are one or more individuals (27.4 percent), and State, city, or county governments (26.4 percent) (Morrison, 1982). By May 1982, no corrective measures had been initiated at 64 percent of the unsafe dams, principally because of the owners' lack of resources (Committee on the Safety of Existing Dams, 1983).
Ever since the earliest dams were built, there have been dam failures. The history and description of the failure of some famous constructed dams throughout the world can be found in Jansen (1980). There have been approximately 2,000 failures of constructed dams throughout the world since the 12th century (Jansen, 1980), and many thousands more failures of natural dams. During the last 100 years, there have been about 200 significant failures of constructed dams, in which more than 11,100 people died; 6,800 lives were lost in three failures alone: Vaiont, Italy, 1963, (2,600), South Fork (Johnstown) Pennsylvania, U.S.A., 1889 (2,200), and Machhu II, India, 1974 (2,000 + ) (Jansen, 1980). Financial losses associated with dam failures probably are inestimable.
Several investigations have attempted to summarize the causes of major dam failures throughout the world. In 1961 the Spanish publication "Revista de Obras Publicas" presented the results of an investigation of 1,620 major dams (as reported in Gruner, 1963). In the 145 years between 1799 and 1944, 308 dams suffered serious accidents or failures. Of these, 57 percent were fill or embankment dams, 23 percent were gravity dams, 3 percent were arch dams, and the remaining 17 percent were other types.
Reported causes of failure were foundation failure (51 percent) including uneven settlement and earthquakes; inadequate spillways (23
percent); piping and seepage (7 percent), including high pore pressures and embankment slips; and various other causes (19 percent), including improper construction, acts of war, defective materials, and incorrect operation.
In a study of more than 300 dam failures throughout the world, Biswas and Chatterjee (1971) reported that about 35 percent were a result of floods exceeding the spillway capacity, and 25 percent resulted from foundation problems such as seepage, piping, excess pore pressure, inadequate cut-off, fault movement, settlement, or rock slides. The remaining 40 percent of the failures were caused by various problems including improper design or construction, inferior materials, misuse, wave action, and acts of war.
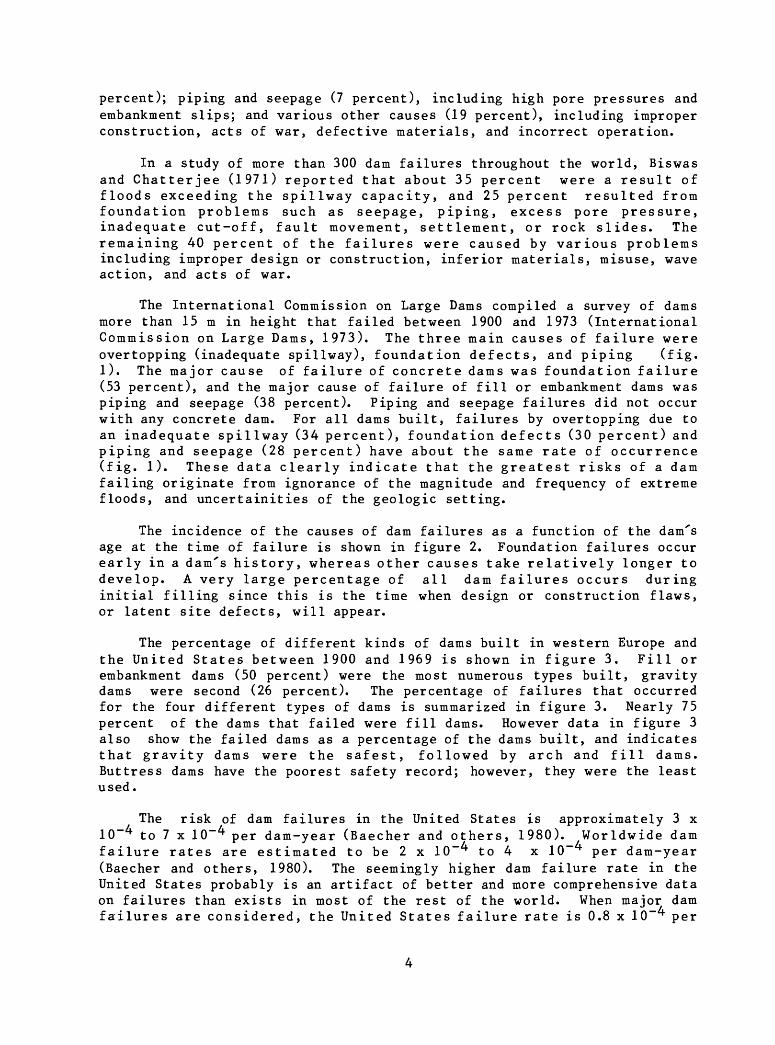
The International Commission on Large Dams compiled a survey of dams more than 15 m in height that failed between 1900 and 1973 (International Commission on Large Dams, 1973). The three main causes of failure were overtopping (inadequate spillway), foundation defects, and piping (fig* 1). The major cause of failure of concrete dams was foundation failure (53 percent), and the major cause of failure of fill or embankment dams was piping and seepage (38 percent). Piping and seepage failures did not occur with any concrete dam. For all dams built, failures by overtopping due to an inadequate spillway (34 percent), foundation defects (30 percent) and piping and seepage (28 percent) have about the same rate of occurrence (fig. 1). These data clearly indicate that the greatest risks of a dam failing originate from ignorance of the magnitude and frequency of extreme floods, and uncertainities of the geologic setting.
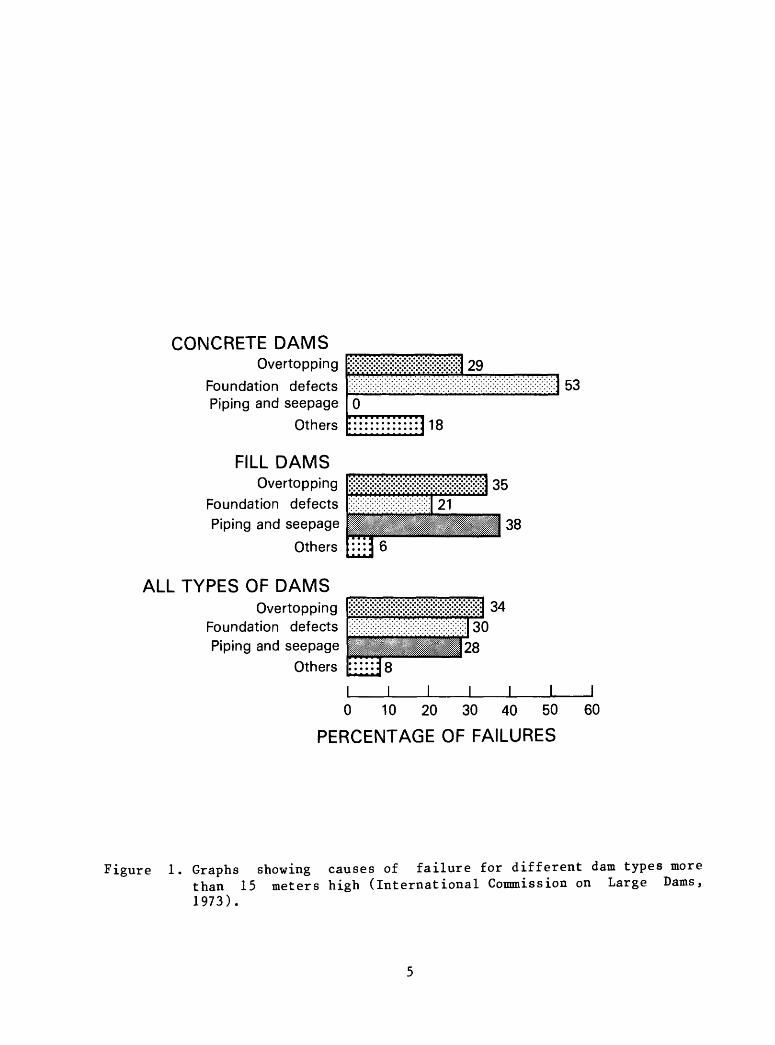
The incidence of the causes of dam failures as a function of the dam's age at the time of failure is shown in figure 2. Foundation failures occur early in a dam's history, whereas other causes take relatively longer to develop. A very large percentage of all dam failures occurs during initial filling since this is the time when design or construction flaws, or latent site defects, will appear.
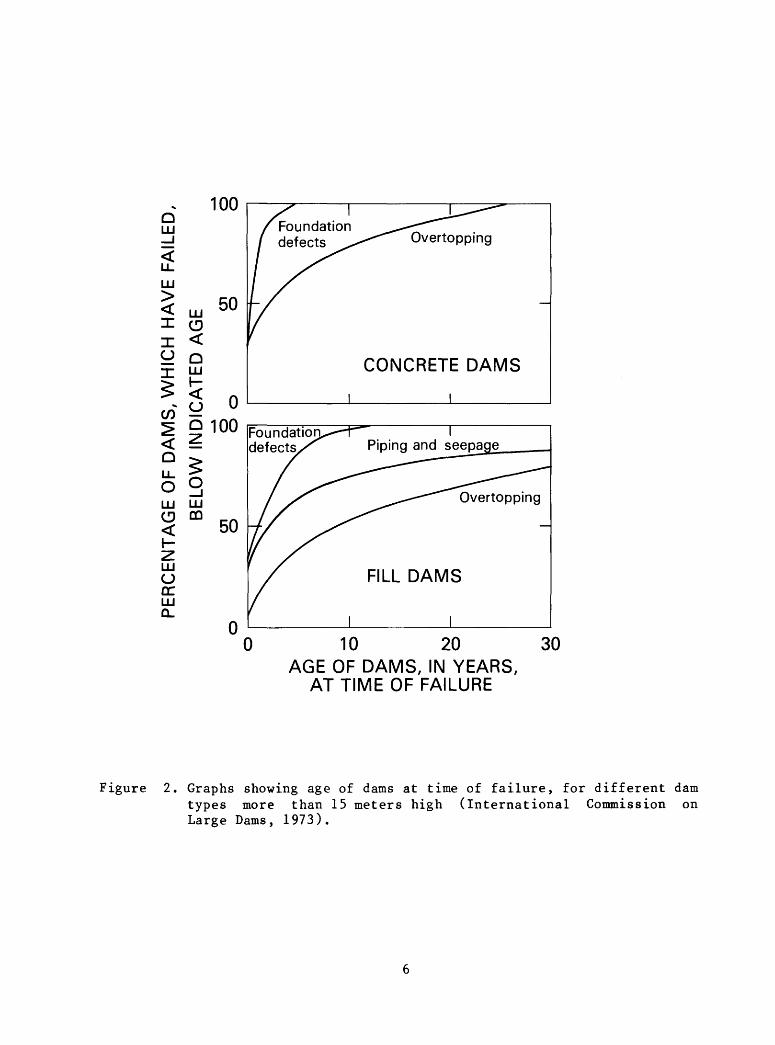
The percentage of different kinds of dams built in western Europe and the United States between 1900 and 1969 is shown in figure 3. Fill or embankment dams (50 percent) were the most numerous types built, gravity dams were second (26 percent). The percentage of failures that occurred for the four different types of dams is summarized in figure 3. Nearly 75 percent of the dams that failed were fill dams. However data in figure 3 also show the failed dams as a percentage of the dams built, and indicates that gravity dams were the safest, followed by arch and fill dams. Buttress dams have the poorest safety record; however, they were the least used.
The risk of dam failures in the United States is approximately 3 x 10~^ to 7 x 10~^ per dam-year (Baecher and others, 1980). Worldwide dam failure rates are estimated to be 2 x 10"^ to 4 x 10"^ per dam-year (Baecher and others, 1980). The seemingly higher dam failure rate in the United States probably is an artifact of better and more comprehensive data on failures than exists in most of the rest of the world. When major dam failures are considered, the United States failure rate is 0.8 x 10~^ per
CONCRETE DAMSOvertopping
Foundation defects Piping and seepage
Others
FILL DAMSOvertopping
Foundation defectsPiping and seepage
Others
ALL TYPES OF DAMSOvertopping
Foundation defectsPiping and seepage
Others
29J53
0 10 20 30 40 50
PERCENTAGE OF FAILURES
60
Figure 1. Graphs showing causes of failure for different dam types more than 15 meters high (International Commission on Large Dams, 1973).
CKJ
OQ
(D
T3
(T>
03
pT
CO
O fa
S
en
S
O
pr
03
l~t
O«
ro
«;
rf
OQpr pj
pj
'
3
OQ fD
I 1
Ln
O i-h
3 (D
O
, rt
fa
(D
B
-{
OT
COP>
pr
rr
!-
OQ
rr
M
O3
i-h
rr 0)
i-h
n
fa3
H
-pa
(
'rr
C
p.
nO
0)
PE
RC
EN
TA
GE
OF
DA
MS
, W
HIC
H H
AV
E F
AIL
ED
,
BE
LOW
IN
DIC
AT
ED
AG
E
O O
O,
0
i-hH
- l-h
co ro
tn
nf"
(D
O
33
rr
DAM TYPE
( Arch
CONCRETE < Buttress
( Gravity
FILL
10
26
20 40
58I
60 80PERCENTAGE OF DAMS BUILT
CONCRETE
Arch
< Buttress
( Gravity
FILL
12
20 40 60 PERCENTAGE OF FAILURES
74
80
CONCRETE
TOTAL
( Arch
= } Buttress
f Gravity
ConcreteFill
Xv
' !
8
m& 0.7M :̂m:imm:Mm-. 2.60.3
0.7
1.2I l I I
1 2 3FAILED DAMS, IN PERCENTAGE
OF DAMS BUILT
Figure 3. Graphs showing types of dams built in Western Europe and the United States, and their failure percentage, between 1900-69 (international Commission on Large Dams, 1973).

dam-year, and the world failure rate 2 x 10 ^ per dam-year (Mark and Stuart-Alexander, 1977). There are many uncertainties in these kinds of estimates, and the only consistent conclusion available is that an order- of-magnitude estimate of risk of dam failure anywhere in the world is approximately 10 per dam-year. This failure rate has been shown to be a significant factor in the cost-benefit analysis of large dams where there is potential for large loss of life (Mark and Stuart-Alexander, 1977; Rose, 1978).
In the United States between 1963 and 1983, the average annual loss of life from dam failures was about 14 deaths (table 1). This figure compares with 200 deaths per year from flooding, 25 deaths from mass movements, 12 deaths from earthquakes, and 6 deaths from tsunamis (Costa and Baker, 1981, p. 462). Interestingly, the failure of constructed dams less than 15 m in height caused about 90 percent of all dam-failure fatalities during this period. On the basis of a sample of 20 dams that failed in the United States during this century, Wayne Graham (U.S. Bureau of Reclamation, written commun., 1984) found that the average number of fatalities per dam failure was 19 times greater when there was inadequate or no warning, than when there was adequate warning. The effects of successful warning for some recent dam failures, and the Big Thompson River, Colorado flash flood of 1976, are given in table 2. The data show that in the absence of early detection and warning, a significant percentage of the people exposed to the flood hazard can lose their lives. For example, the failure of the relatively low Laurel Run Dam in Pennsylvania (12.8 m high) at 4:00 a.m. claimed the lives of about 1 out of every 4 people potentially exposed to floodwaters, because there was no warning. The failure of the 93-m high Teton Dam, Idaho, at 11:57 a.m. was preceded by a warning, and only about 1 out of every 3,000 people potentially exposed to the floodwaters died.
Obviously, there is great benefit to be derived from early warning of the failure of a dam. Some relatively inexpensive actions that communities downstream from hazardous dams could undertake include development of emergency action plans, establishment of an early-warning and notification system, preparation of evacuation plans, stockpiling repair materials, locating local repair forces, training operation personnel, and increasing inspection frequency. However, risk can never be completely eliminated. In 1969, a 76-year-old earth dam near Wheatland, Wyoming, failed without warning, flooding more than 40 km 2 of cropland. The failure occurred in dry weather less than 10 hours after the dam had been inspected and found safe (Anonymous, 1969).
DAM-BREAK MODELS
Many types of dam-break models exist, ranging from simple computations based on historical dam-failure data that can be performed manually, to complex models that require computer analyses. The purpose of each model is to predict the characteristics (such as peak discharge or stage, volume, and flood-wave travel time) of a dam-failure flood.
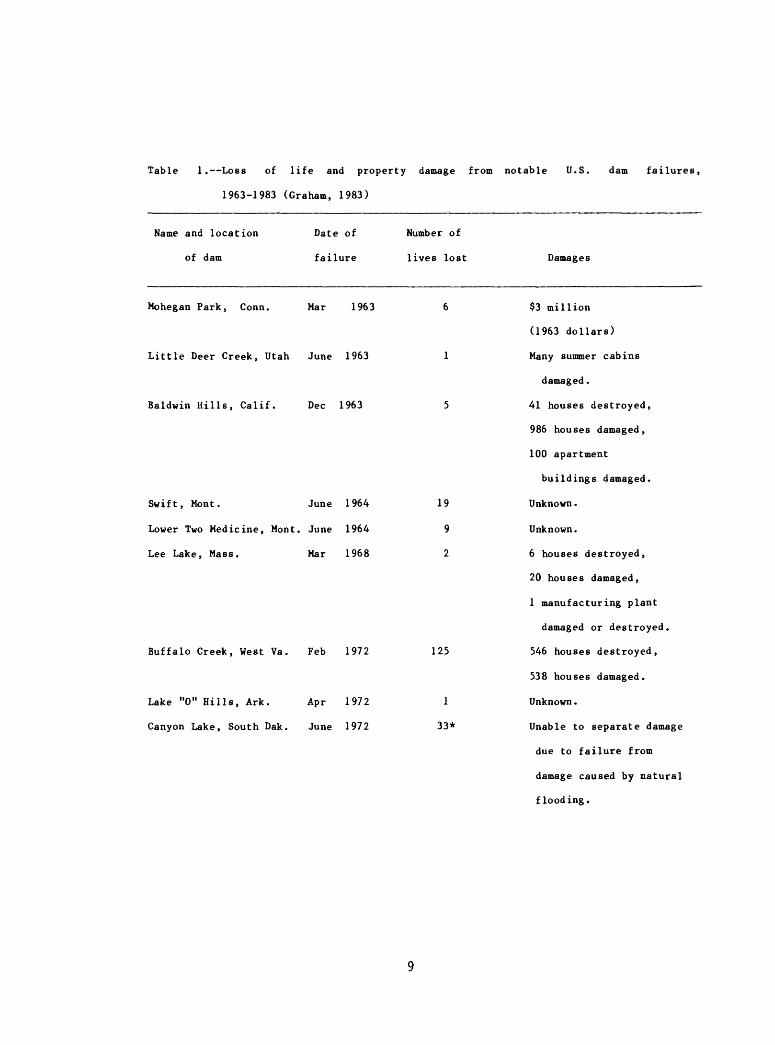
Table 1. Loss of life and property damage from notable U.S. dam failures,
1963-1983 (Graham, 1983)
Name and location
of dam
Date of
failure
Number of
lives lost Damages
Mohegan Park, Conn. Mar 1963
Little Deer Creek, Utah June 1963
Baldwin Hills, Calif. Dec 1963
Swift, Mont. June 1964
Lower Two Medicine, Mont. June 1964
Lee Lake, Mass. Mar 1968
Buffalo Creek, West Va. Feb 1972
Lake "0" Hills, Ark. Apr 1972
Canyon Lake, South Dak. June 1972
19
9
2
125
1
33*
$3 million
(1963 dollars)
Many summer cabins
damaged.
41 houses destroyed,
986 houses damaged,
100 apartment
buildings damaged.
Unknown.
Unknown.
6 houses destroyed,
20 houses damaged,
1 manufacturing plant
damaged or destroyed.
546 houses destroyed,
538 houses damaged.
Unknown.
Unable to separate damage
due to failure from
damage caused by natural
flooding.
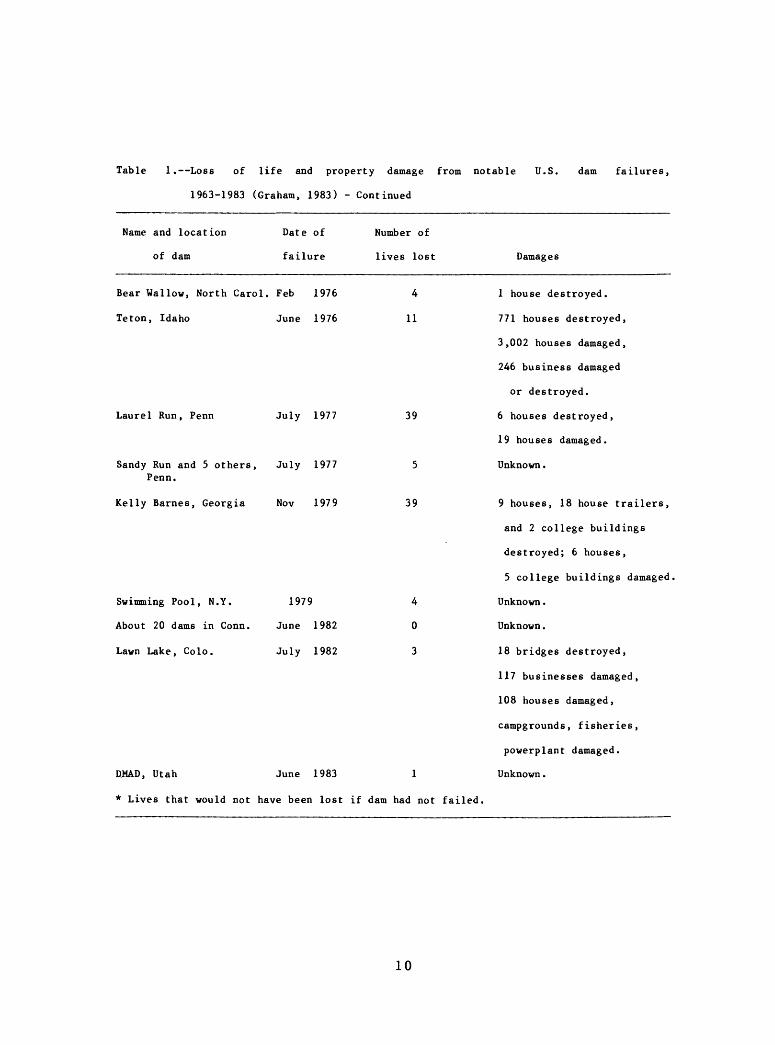
Table 1. Loss of life and property damage from notable U.S. dam failures,
1963-1983 (Graham, 1983) - Continued
Name and location
of dam
Date of
failure
Number of
lives lost Damages
Bear Wallow, North Carol. Feb 1976
Teton, Idaho June 1976
Laurel Run, Penn July 1977
Sandy Run and 5 others, July 1977 Penn.
Kelly Barnes, Georgia Nov 1979
Swimming Pool, N.Y. 1979
About 20 dams in Conn. June 1982
Lawn Lake, Colo. July 1982
4
11
39
39
DMAD, Utah June 1983 1
* Lives that would not have been lost if dam had not failed.
1 house destroyed.
771 houses destroyed,
3,002 houses damaged,
246 business damaged
or destroyed.
6 houses destroyed,
19 houses damaged.
Unknown.
9 houses, 18 house trailers,
and 2 college buildings
destroyed; 6 houses,
5 college buildings damaged,
Unknown.
Unknown.
18 bridges destroyed,
117 businesses damaged,
108 houses damaged,
campgrounds, fisheries,
powerplant damaged.
Unknown.
10
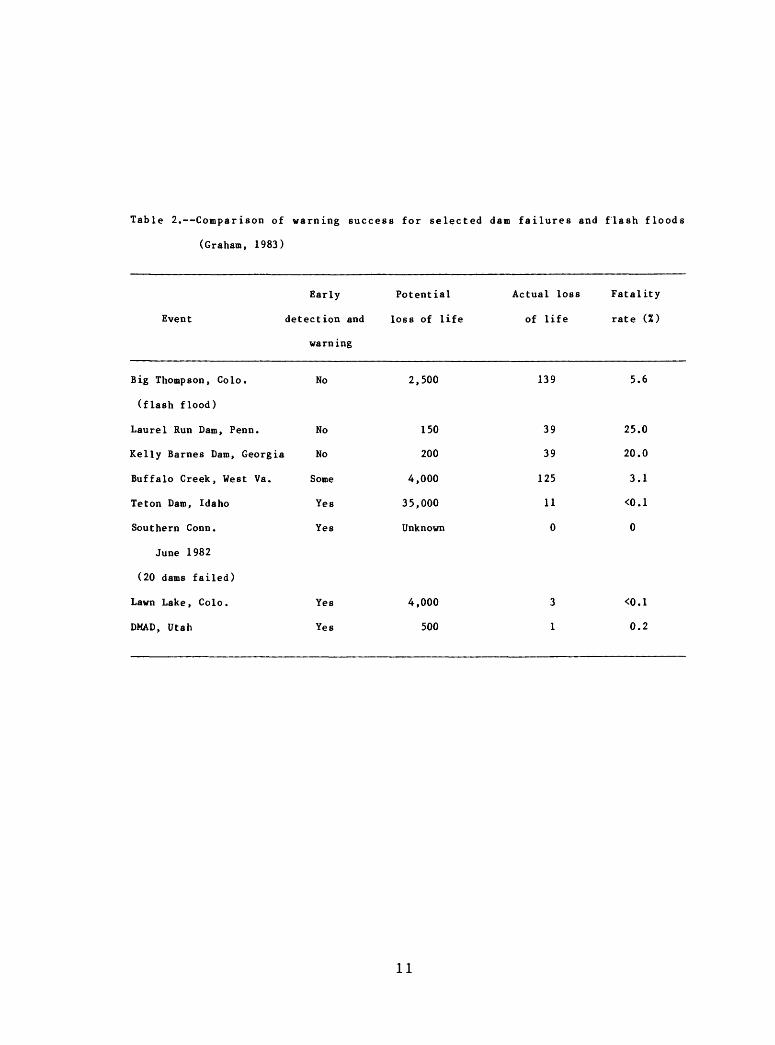
Table 2.--Comparison of warning success for selected dam failures and flash floods
(Graham, 1983)
Early Potential Actual loss Fatality
Event detection and loss of life of life rate (%)
warning
Big Thompson, Colo. No
(flash flood)
Laurel Run Dam, Penn.
Kelly Barnes Dam, Georgia
Buffalo Creek, West Va.
Teton Dam, Idaho
Southern Conn.
June 1982
(20 dams failed)
Lawn Lake, Colo. Yes
DMAD, Utah Yes
2,500
4,000
500
139 5.6
No
No
Some
Yes
Yes
150
200
4,000
35,000
Unknown
39
39
125
11
0
25.0
20.0
3.1
<0.1
0
0.2
11
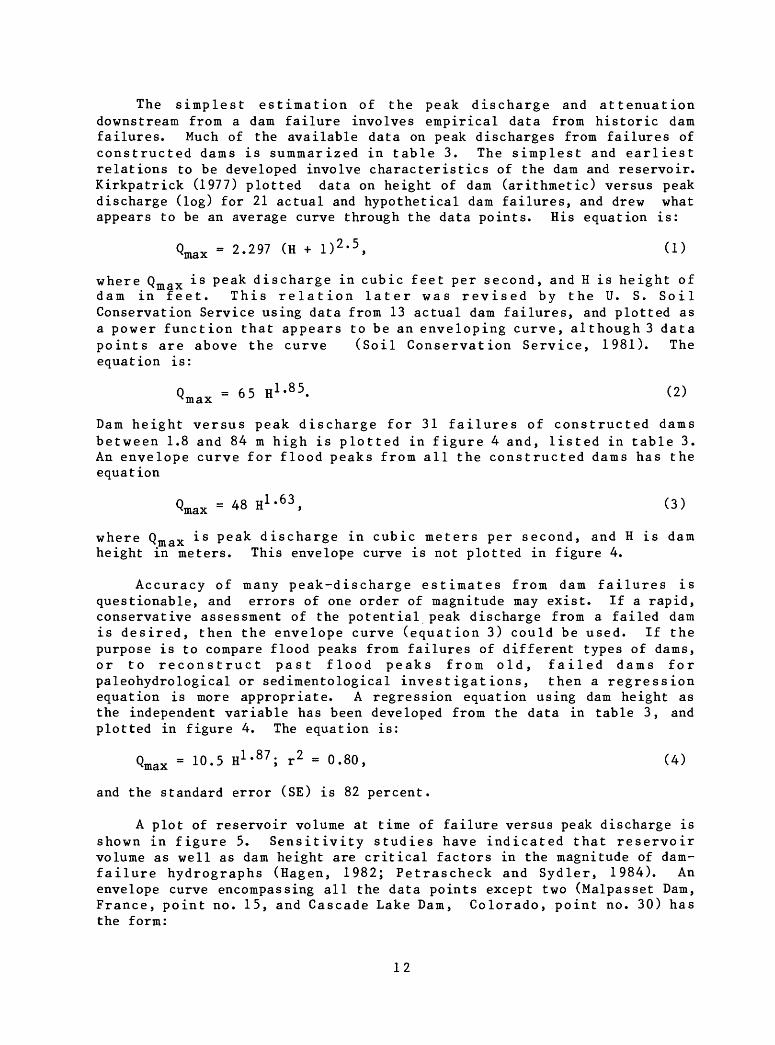
The simplest estimation of the peak discharge and attenuation downstream from a dam failure involves empirical data from historic dam failures. Much of the available data on peak discharges from failures of constructed dams is summarized in table 3. The simplest and earliest relations to be developed involve characteristics of the dam and reservoir. Kirkpatrick (1977) plotted data on height of dam (arithmetic) versus peak discharge (log) for 21 actual and hypothetical dam failures, and drew what appears to be an average curve through the data points. His equation is:
Qmax = 2.297 (H + I) 2 ' 5 , (1)
where Q max is peak discharge in cubic feet per second, and H is height of dam in feet. This relation later was revised by the U. S. Soil Conservation Service using data from 13 actual dam failures, and plotted as a power function that appears to be an enveloping curve, although 3 data points are above the curve (Soil Conservation Service, 1981). The equation is:
" H 1 '85 . (2)
Dam height versus peak discharge for 31 failures of constructed dams between 1.8 and 84 m high is plotted in figure 4 and, listed in table 3. An envelope curve for flood peaks from all the constructed dams has the equation
Qmax = 48 H1 ' 63 , (3)
where Q max ^ s P ea^ discharge in cubic meters per second, and H is dam height in meters. This envelope curve is not plotted in figure 4.
Accuracy of many peak-discharge estimates from dam failures is questionable, and errors of one order of magnitude may exist. If a rapid, conservative assessment of the potential peak discharge from a failed dam is desired, then the envelope curve (equation 3) could be used. If the purpose is to compare flood peaks from failures of different types of dams, or to reconstruct past flood peaks from old, failed dams for paleohydrological or sedimentological investigations, then a regression equation is more appropriate. A regression equation using dam height as the independent variable has been developed from the data in table 3, and plotted in figure 4. The equation is:
<max - 10.5 H 1 ' 87 ; r 2 - 0.80, (4)
and the standard error (SE) is 82 percent.
A plot of reservoir volume at time of failure versus peak discharge is shown in figure 5. Sensitivity studies have indicated that reservoir volume as well as dam height are critical factors in the magnitude of dam- failure hydrographs (Hagen, 1982; Petrascheck and Sydler, 1984). An envelope curve encompassing all the data points except two (Malpasset Dam, France, point no. 15, and Cascade Lake Dam, Colorado, point no. 30) has the form:
12
100,000 rz
o oLU
DC
a! 10,000
DC LUI- LU
O
00=>
° 1000
xCD
aLU O DC <Xo
LUQ.
100
10
I I I I I II 23,
I I I I-H
Constructed Dams Landslide Dams Glacial Dams
Q
26
10 100 DAM HEIGHT (H), IN METERS
1000
Figure 4. Graph showing dam height (H, in meters) versus peak discharge(Qmax in cubic meters per second) for constructed, glacial, andlandslide dams with numbers keyed to tables 3, 5 and 6.
13
Table
3. Constructed dams th
at have fa
iled
.
Index
number
and
name
of
Da
te of
dam
failure
1. 2. 3. 4. 5. 6. 7. 8.
Brad
fiel
d Dam,
Marc
h, 11,
1864
Engl
and
Mill
Ri
ver,
Mass.
May
16,
1874
Sout
h Fork
May
31,
1889
(Joh
nsto
wn)
Penn.
Aust
in,
Tex.
April
7, 19
00
Hatchtown, Utah
May
25,
1914
Davi
s Re
serv
oir,
19
14Ca
lif.
Goos
e Cr
eek,
19
16South
Carol.
Scha
effe
r,
June 5, 1921
Colo.
Volume at
ti
me of
Type
He
ight
failure
of
H V
dam
(m)
(m3x!06
)
Earth
29.0
3.2
Eart
h an
d 13
.1
2.5
masonry
Eart
h an
d 22.0
14.2
rock
fill
Maso
nry
20.7
?
gravity
Rockfill
15.9
16.8
Eart
h 11
.9
58
Earth
6.1
10.6
Earth
27.4
4.4
Dam
Peak
factor
outflow
(HxV
) (m
3/s)
93
1,13
0
32.8
1,
645
312
5,700
-8,
500
6,68
4
267
3,10
0 -
7,000
690
510
65
566
121
4,300
-4,
900
Peak
dete
rmin
atio
n
? ? ?
Slope-area
meas
urem
ent
Drawdown rate,
1 h.
avg.
? ?
Slope-area meas
urem
ent
13 km down
stre
am;
twic
e avg.
outflow du
ring
1/
2
Reference
Jans
en,
1980
Jansen,
1980;
Barrows, 19
48
Jans
en,
1980
Free
man
and
Also
p,1941
Offi
ce of
th
e St
ate
Engi
neer
, 1913-1914
MacDonald
and
Langridge
-Mo
nopo
lis,
19
84
MacDonald an
dLangridge
-Mo
nopo
lis,
1984
Follansbee an
dJo
nes,
19
22
h.
requ
ired
to
drain
9.
10.
11.
12.
Apishapa,
Aug. 22
, 1923
Colo.
French La
ndin
g,
Apri
l 13
, 1925
Mich
.
St.
Francis,
March 12
, 19
28Ca
lif.
Castlewood,
Aug. 3, 19
33Co
lo.
Eart
h 32.0
22.8
Earth with
8.5
?stone
onface
Concrete
56.4
47.1
grav
ity
Rockfill
21.3
6.
2
730
6,853
929
2,65
6 12
,744
-19
,824
132
3,568
reservoir.
Draw-down rate,
15min
. av
g .
Draw
-dow
n ra
te,
1-h.
period
Slop
e-co
nvey
ence
Draw
down
rate 15
-min. period
Anon ymou s
, 1 9 2
3
Anon
ymou
s, 19
25
Out la
nd,
1977
Fiel
d, 1933
Table
3. Constructed da
ms that ha
ve failed. continued
Index
number
Type
Height
and
name
of
Dateof
of
H da
m fa
ilur
e da
m (m
)
13.
14.
15.
16.
17.
18.
19.
20.
21.
22.
23.
24.
25.
Fred
Burr,
1948
Earth
10.4
Mont.
Fren
chma
n Creek,
April
15,
1952
Earth
12.5
Mont
.
Malpasset,
Dec. 2,
1959
Concrete
61.0
France
arch
Oros,
Braz
il
Marc
h 26,
1960
Earth
35.4
Little Deer Creek, Ju
ne 16,
1963
Earth
21.3
Utah
Bald
win
Hills,
Dec. 23
, 19
63
Eart
h 18
.0Ca
lif.
Swif
t,
June
8, 19
64
Rockfill
47.9
Mont.
Lower
Two
June
8, 19
64
Eart
h 11
.0Me
dici
ne,
Mont
.
Hell Hole,
Dec. 23
, 19
64
Rockfill
30.5
Cali
f.
Buff
alo
Creek,
Feb. 26
, 1972
Coal waste
14.0
West
Va.
Teto
n, Idaho
June 5,
19
76
Earth
83.8
Laurel Run,
July 20
, 1977
Earth
12.8
Penn.
Otto
Run,
July 20,
1977
Ea
rth
5.8
Penn.
Vo 1 ume
a t
time of
fa
ilur
e Da
m Peak
V factor
outf
low
(m3x!06
) (HxV)
(m3/s
)
0.75
7.8
654
21.0
26
3 1,
416
22.0
1,342
28,320
703
24,886
9,629
1.2
25.6
1,33
1
0.91
16,4
99
1
42.3
2,026
24,950
25.8
284
1,79
8
30.6
933
8,780
0.5
7.0
1,41
6
311
26,020
65,136
0.38
4.9
1,048
0.00
74
0.04
3 60
Peak
de
term
inat
ion
Slope-area
meas
urem
ent
7 ? ? 7
Slope-area
?measurement
Slop
e-ar
eameasurement 27 km
downstream
Slope-area
measurement
Gagi
ng st
atio
n75
km
downstream
Slope-area
measurement
Slope-area
measurement
Slope-area
measurement
Slop
e-ar
eameasurement
Reference
W. Graham,
personal
comm
on ica
t io
n ,
1981
MacDonald
and
Langridge-
Monopolis, 1984
Jans
en,
1980
Jans
en,
1980
Rost
vedt
an
dothers,
1968
Jess
up,
1964
Bone
r an
dSt
ermi
tz,
1967
Bone
r an
dSt
ermi
tz,
1967
Scott
and
Gravlee, 19
68(T
able
1)
Davi
es an
dothers,
1972
Ray
and
Kjelstrom, 19
78
Brua,
1978
Brua
, 1978
Table
3. Constructed dams th
at ha
ve failed. continued
Index
and
26.
27.
28.
29.
30.
31.
number
name
of
dam
South Fo
rk
tributary,
Penn.
North Branch
tributary,
Penn
.
Kelly Ba
rnes
, Georgia
Lawn Lake ,
Colo
.
Cascade La
ke,
Colo.
DMAD,
Utah
Type
Date of
of
failure
dam
July 20,
1977
Earth
July
20
, 1977
Earth
Nov.
6,
1977
Earth over
original
rock crib
July
15,
1982
Earth
July
15,
1982
Concrete
gravity
June 6,
19
83
Earth
Height
H (m) 1.8
5.5
10.4
7.9
5.2
8.8
Volume at
ti
me of
failure
V (m3xlo6)
0.0038
0.022
0.78
0.84
0.031
19.7
Dam
Peak
fact
or
outflow
(HxV)
(m3/s)
0.0066
122
0.121
29.5
8.1
680
6.6
510
0.16
453
173
793
Peak
determination
Slope-area
measurement
Slope-area
measurement
Slope-area
measurement
Dam-break
model
Dam-break
model
Drawdown
rate
Reference
Brua,
1978
Brua,
1978
Sand
ers
and
Saue
r, 1979
Jarrett and
Cost
a, 1985
Jarr
ett
and
Cost
a, 1985
Roger Wa
lker
, Utah
Water
Commissioner,
personal
communication,
1985
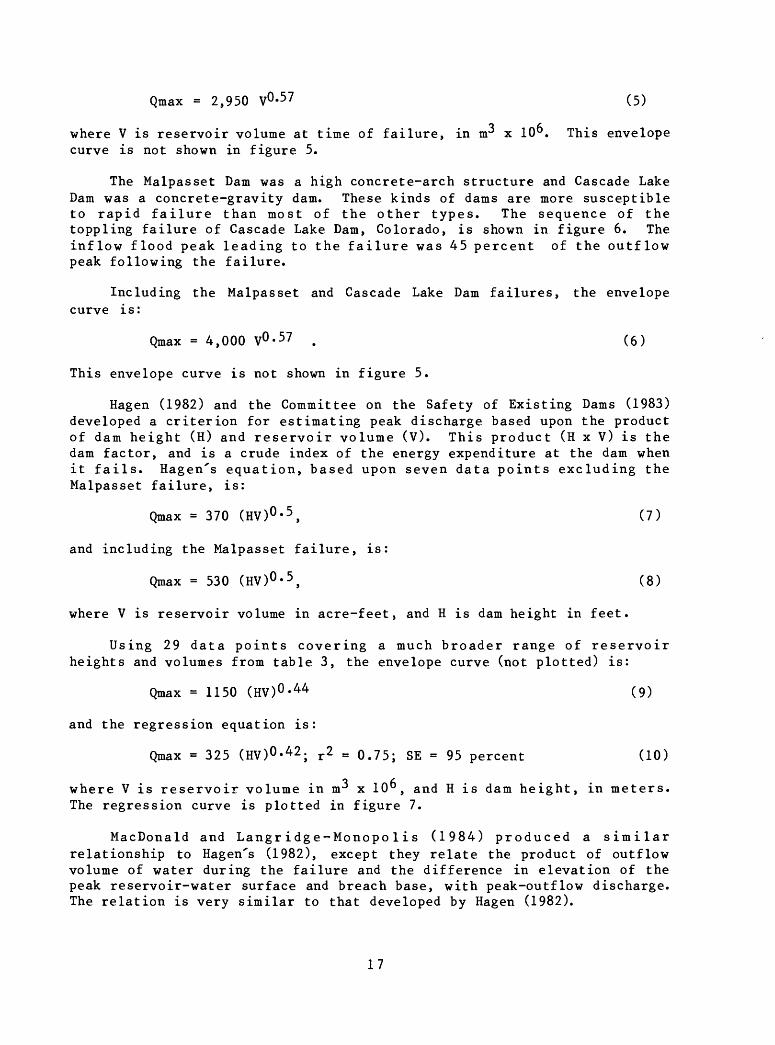
Qmax = 2,950 V0 - 57 (5)
where V is reservoir volume at time of failure, in m^ x 10". This envelope curve is not shown in figure 5.
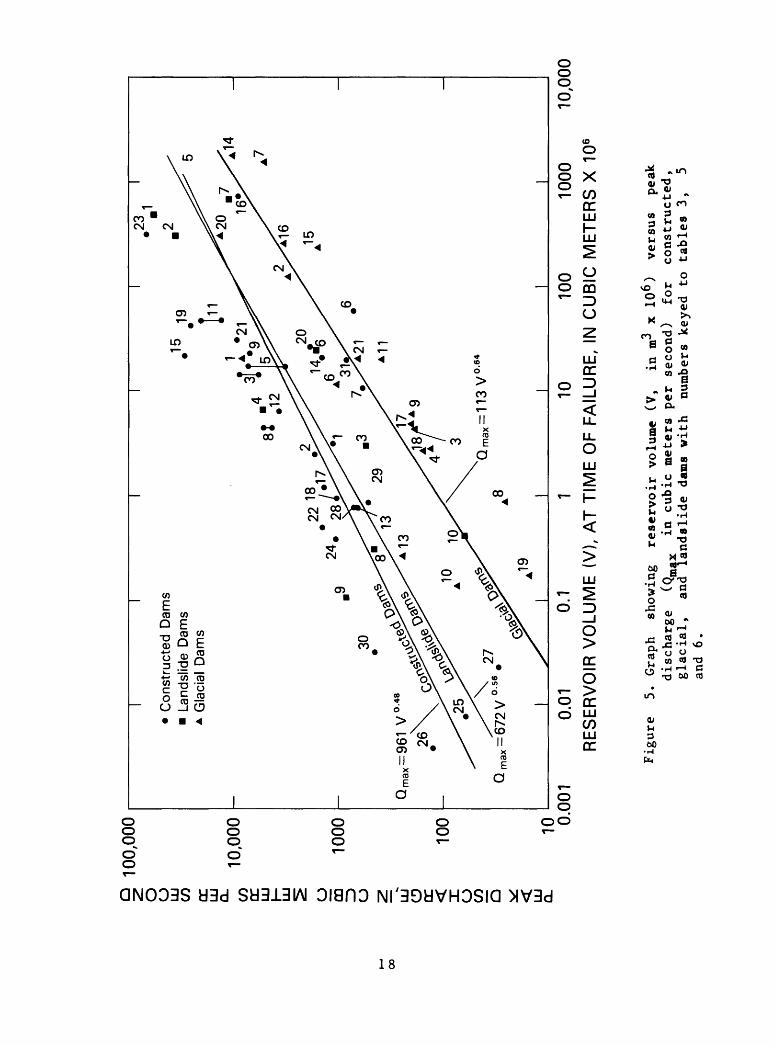
The Malpasset Dam was a high concrete-arch structure and Cascade Lake Dam was a concrete-gravity dam. These kinds of dams are more susceptible to rapid failure than most of the other types. The sequence of the toppling failure of Cascade Lake Dam, Colorado, is shown in figure 6. The inflow flood peak leading to the failure was 45 percent of the outflow peak following the failure.
Including the Malpasset and Cascade Lake Dam failures, the envelope curve is:
Qmax = 4,000 V0 - 57 . (6)
This envelope curve is not shown in figure 5.
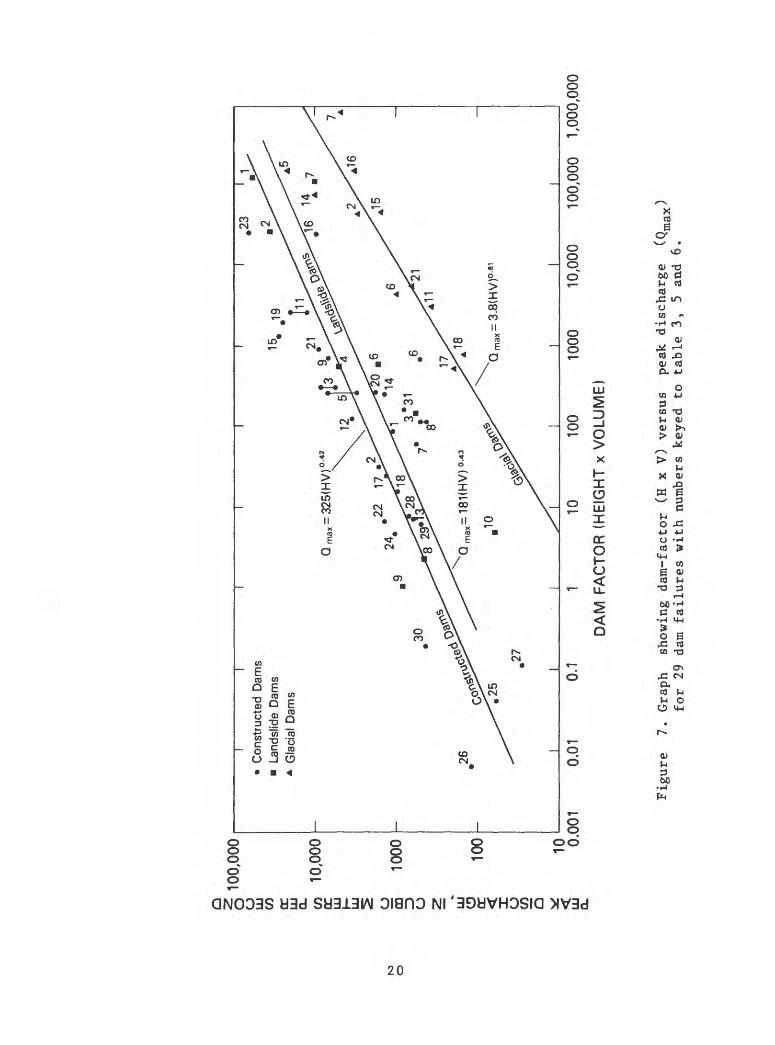
Hagen (1982) and the Committee on the Safety of Existing Dams (1983) developed a criterion for estimating peak discharge based upon the product of dam height (H) and reservoir volume (V). This product (H x V) is the dam factor, and is a crude index of the energy expenditure at the dam when it fails. Hagen's equation, based upon seven data points excluding the Malpasset failure, is:
Qmax = 370 (HV)°- 5 , (7)
and including the Malpasset failure, is:
Qmax = 530 (HV)°- 5 , (8)
where V is reservoir volume in acre-feet, and H is dam height in feet.
Using 29 data points covering a much broader range of reservoir heights and volumes from table 3, the envelope curve (not plotted) is:
Qmax = 1150 (HV)°- 44 (9)
and the regression equation is:
Qmax = 325 (HV)°- 42 ; r 2 = 0.75; SE = 95 percent (10)
where V is reservoir volume in m^ x 10", and H is dam height, in meters. The regression curve is plotted in figure 7.
MacDonald and Langridge-Monopo1 is (1984) produced a similar relationship to Hagen's (1982), except they relate the product of outflow volume of water during the failure and the difference in elevation of the peak reservoir-water surface and breach base, with peak-outflow discharge. The relation is very similar to that developed by Hagen (1982).
17
00
100,
000
o
(J LLJ
CO cr
in
o_ CO oc LLJ h- O QQ ID
O (D
DC O
CO LLJ
Q.
10
,00
0
1000 10
0 10
03
T
.1C
onst
ruct
ed D
ams
Land
slid
e D
ams
Gla
cial
Dam
s
15
Qm
ax
64
Q m
ax =
672V
0.00
1 0.
01
0.1
1 10
10
0 10
00
RE
SE
RV
OIR
VO
LUM
E (
V),
AT
TIM
E O
F F
AIL
UR
E,
IN C
UB
IC M
ET
ER
S X
106
10,0
00
Figu
re
5. Graph
show
ing
reservoir
volume (V
, in
m^ x
10")
vers
us
peak
discharge
(Qmax
i-n cu
bic
meters pe
r se
cond
) fo
r constructed,
glac
ial,
an
d la
ndsl
ide
dams with
numbers
keyed
to tables 3,
5 and
6.
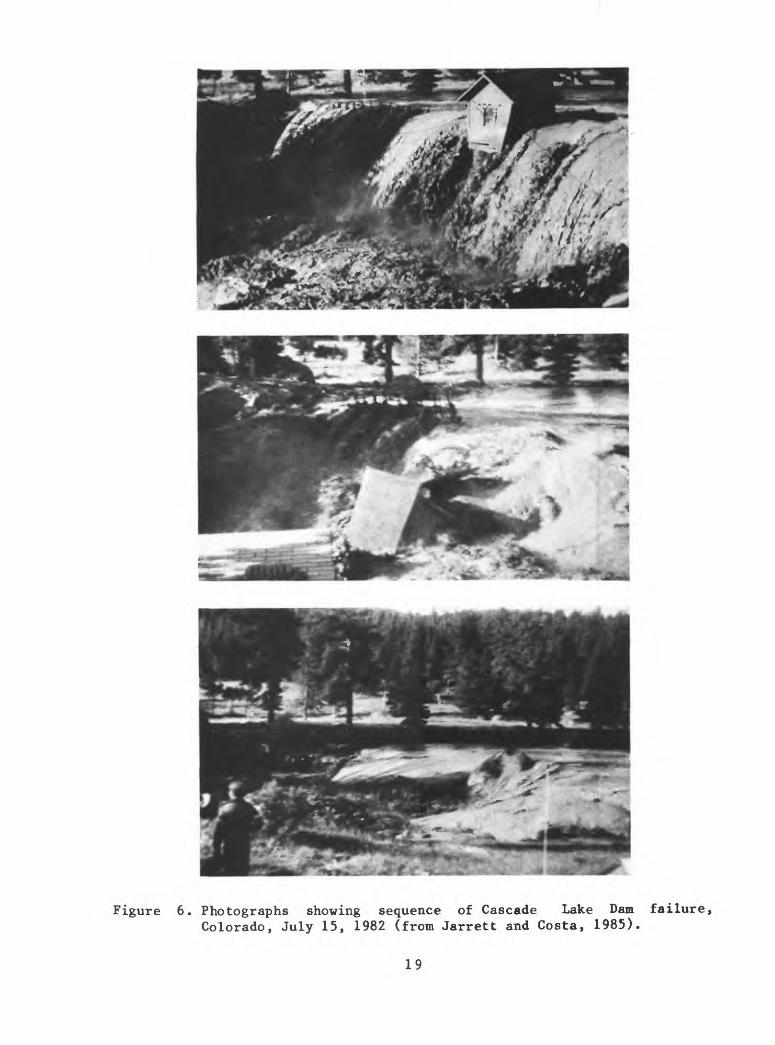
Figure 6. Photographs showing sequence of Cascade Lake Dam failure, Colorado, July 15, 1982 (from Jarrett and Costa, 1985).
19
§ 1
00,0
00
(J LLJ
CO tr
LU co
10,0
00
cc LU h-
LU O
CQ D
O LU (D CC.
<
X
O
CO Q
1000 10
0 10 0.00
1
I I
C
onst
ruct
ed D
ams
La
ndsl
ide
Dam
s
Gla
cial
Dam
s
0.01
0.1
1 10
10
0 10
00
DA
M F
AC
TOR
(H
EIG
HT
x V
OLU
ME
)
10,0
00
100,
000
1,00
0,00
0
Fig
ure
7
. G
raph
sh
owin
g dam
-fac
tor
(H
x V
) v
ers
us
pea
k
dis
charg
e
(Qm
ax)
for
29
dam
fa
ilure
s w
ith
num
bers
k
eyed
to
ta
ble
3
, 5
and
6.
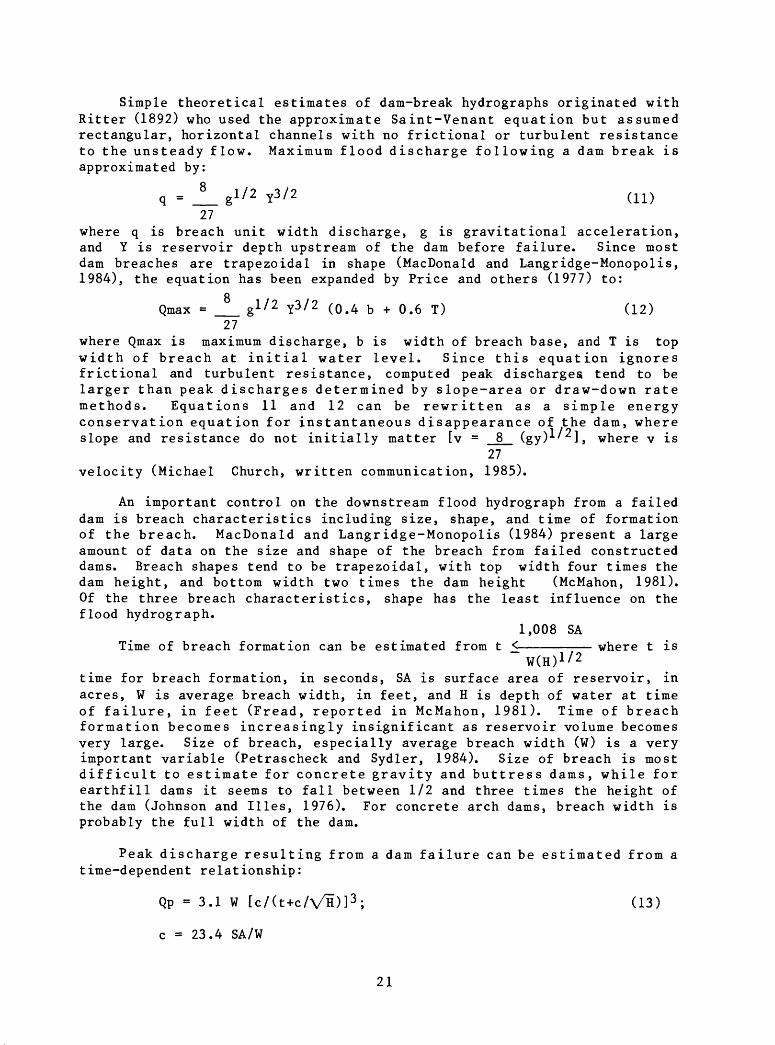
Simple theoretical estimates of dam-break hydrographs originated with Ritter (1892) who used the approximate Saint-Venant equation but assumed rectangular, horizontal channels with no frictional or turbulent resistance to the unsteady flow. Maximum flood discharge following a dam break is approximated by:
q = _L- g 1 / 2 Y3 / 2 (11)
27where q is breach unit width discharge, g is gravitational acceleration, and Y is reservoir depth upstream of the dam before failure. Since most dam breaches are trapezoidal in shape (MacDonald and Langridge-Monopolis, 1984), the equation has been expanded by Price and others (1977) to:
o
Qmax = __ g 1 / 2 Y3 / 2 (0.4 b + 0.6 T) (12)27
where Qmax is maximum discharge, b is width of breach base, and T is top width of breach at initial water level. Since this equation ignores frictional and turbulent resistance, computed peak discharges tend to be larger than peak discharges determined by slope-area or draw-down rate methods. Equations 11 and 12 can be rewritten as a simple energy conservation equation for instantaneous disappearance of the dam, where slope and resistance do not initially matter [v = 8 (gy) ' 1, where v is
27 velocity (Michael Church, written communication, 1985).
An important control on the downstream flood hydrograph from a failed dam is breach characteristics including size, shape, and time of formation of the breach. MacDonald and Langridge-Monopolis (1984) present a large amount of data on the size and shape of the breach from failed constructed dams. Breach shapes tend to be trapezoidal, with top width four times the dam height, and bottom width two times the dam height (McMahon, 1981). Of the three breach characteristics, shape has the least influence on the flood hydrograph.
1,008 SATime of breach formation can be estimated from t < where t is
W(H) 1 / 2
time for breach formation, in seconds, SA is surface area of reservoir, in acres, W is average breach width, in feet, and H is depth of water at time of failure, in feet (Fread, reported in McMahon, 1981). Time of breach formation becomes increasingly insignificant as reservoir volume becomes very large. Size of breach, especially average breach width (W) is a very important variable (Petrascheck and Sydler, 1984). Size of breach is most difficult to estimate for concrete gravity and buttress dams, while for earthfill dams it seems to fall between 1/2 and three times the height of the dam (Johnson and Hies, 1976). For concrete arch dams, breach width is probably the full width of the dam.
Peak discharge resulting from a dam failure can be estimated from a time-dependent relationship:
Qp = 3.1 W tc/(t+c/\/H)] 3 ; (13)
c = 23.4 SA/W
21
where Qp is peak discharge, W is average breach width (ft), t is time (hrs) of breach formation, H is height (H) of the dam, and SA is reservoir- surface area (acres) at the dam crest (Wetmore and Fread, 1981). With this equation, peak discharge sensitivity can be computed for various estimated values of t. For a conservative estimate, the maximum expected breach width and minimum expected breach time would be used to estimate peak discharge. Equations 11, 12, and 13 are general forms of the broad-crested wier formula (Brater and King, 1976).
Within the last decade, numerous computer programs have been developed to simulate dam-break hydrographs. Peak discharges, depths, and areas inundated downstream need to be known to minimize loss of life and property. Two popular examples are the HEC-1 program of the Corps of Engineers, and the National Weather Service DAMBRK model (Fread, 1980). The National Weather Service DAMBRK model, modified by Land (1980b), uses a hydraulic routing procedure based on a nonlinear implicit finite-difference algorthm for the equations of continuity and momentum. References to other programs can be found in Land (1980 a, b). The purpose of these models is to predict the behavior of flood waters released from a dam failure. The initial outflow hydrograph from a failed dam usually is approximated by a triangle. After the dam-break outflow hydrograph is determined by one of the methods described previously the hydrograph must be routed through the downstream valley. The models usually require river cross sections, Manning's n-values, and upstream and downstream boundary conditions. Model output should include prediction of flood-wave travel time, peak discharges and volumes at different locations downstream, and inundation areas.
Land (1980a) makes some interesting comparisons among four dam-break flood-wave models by using data from three actual dam failures, and provides suggestions for finding the most accurate, stable, and economical models to use. Dam-failure models are constrained by inaccuracies in estimates of breaching characteristics such as timing, size, and shape; by estimations of roughness coefficients, volume losses, debris and sediment effects, and by channel hydraulics inadequately described by one- dimensional flow equations. Consequently results of dam-break models can have large and significant errors, and operating the more complicated models can be a difficult task (Land, 1980a). In simulation the user specifies the timing, size, and shape of the final breach. Breach parameters have little impact on flood characteristics far downstream from the dam (Petrascheck and Sydler, 1984). Morphological characteristics of breaches in historic constructed dams are described by Johnson and Illes (1976) and MacDonald and Langridge-Monopolis (1984).
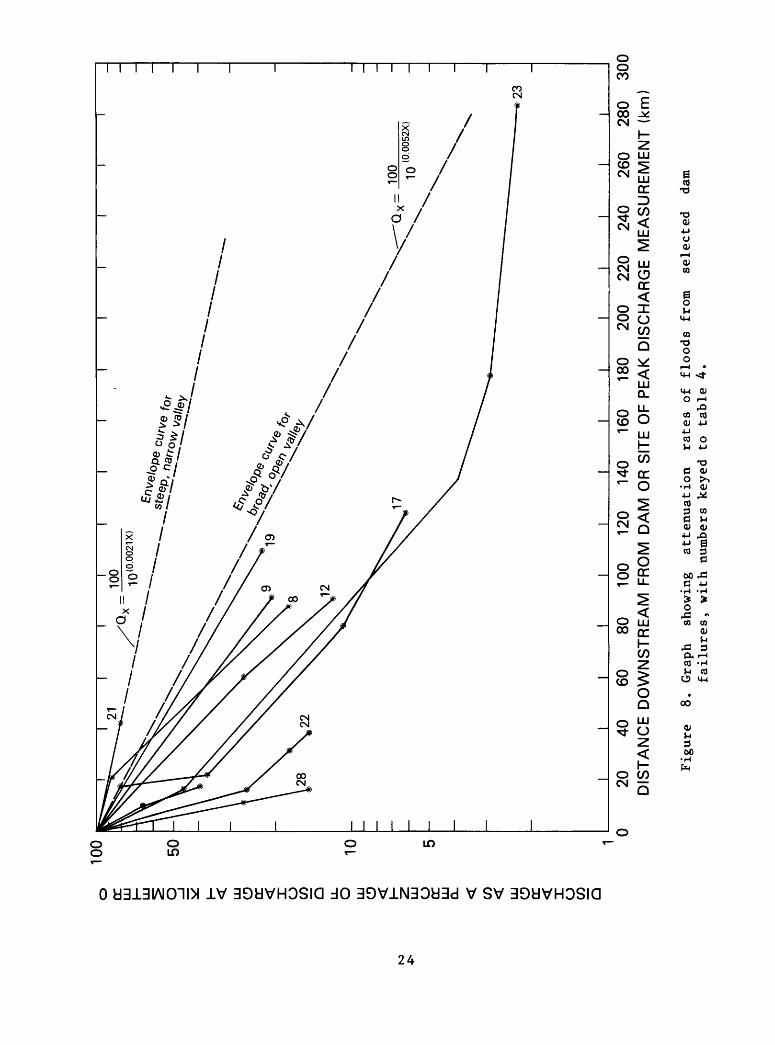
An analysis of some failed dams for which downstream hydraulic measurements were made allows an estimate of attenuation rates based upon empirical data. Available downstream flow data from some failed dams are listed in table 4. Downstream peak discharges are related to peak discharge from the dam failure, and downstream distance from the dam. Attenuation rates as a percentage of upstream discharge are plotted against distance downstream in figure 8. A conservative envelope curve that encompasses all plotted data points for constructed dams, and includes steep, narrow downstream valleys is:
22
100 QX =
10 (0.0021x)
where Qx = discharge as a percentage of the peak discharge at kilometer 0, and x = distance downstream from location of peak discharge determination, in kilometers. For broader, more open valleys, a conservative empirical enveloping curve has the form,
100 QX =
10 (0.0052x)
Knowledge of the valley geometry downstream should be used to modify the previous equations as necessary. Wide flood plains and high infiltration rates may lead to more rapid attenuation than the curves would indicate. Flood elevations and inundation areas can be determined from depth-discharge and depth-area curves.
NATURAL "DAMS
A wide variety of types of natural dams have failed, producing large floods. Hutchinson (1957) provides a comprehensive overview of the origins of lakes and includes discussion of failures of natural dams. The most common types of natural dams that have failed producing large floods are ice dams, morainal dams, volcanic flow dams, and landslide dams.
Jokulhlaups
Jokulhlaup ('glacier burst') is an Icelandic term for a flood caused by the sudden and often catastrophic release of water impounded within or behind glacial ice (Thorarinsson, 1953). The largest flood known to have occurred on the surface of the Earth, the "Spokane Flood" in eastern Washington, originated from the sudden release of water from Glacial Lake Missoula in the valley of the Clark Fork River in western Montana when an ice dam formed by a lobe of the Cordilleran Ice Sheet failed between 16,000 and 12,000 years ago (Baker, 1973). The lake had a volume of 2 x 101? in and failure of the ice dam produced a flood with an estimated peak discharge of 21 x 10 6 m3 /s (Baker, 1973).
Jokulhlaups can occur in any area covered by continental or valley glaciers. They have caused large loss of life and property damage in many places throughout the world including Iceland (Thorarinsson, 1953, 1957); northern India (Hewitt, 1982); Pakistan (Nash and others, 1985); Peru (Lliboutry and others, 1977); Norway (Aitkenhead, 1960); Alaska (Post and Mayo, 1971); Switzerland, France, and Italy (Eisbacher and Clague, 1984); and Canada (Clarke, 1982; Young, 1980).
In a study of more than 50 Jokulhlaups in the Alps, over 95 percent occurred in the months of June to September, inclusive, with maxima in June and August (Tufnell, 1984). Glacial lakes often drain periodically, which
23
to
o OC LJJ
LJJ
^ g
5 LJJ (D OC X o C/D Q LL
O
LJJ
O
OC LJJ
Q_
<
C/D
LJJ
X o C/D
Q
20
40
60
80
100
120
140
160
180
200
220
240
260
280
300
DIS
TA
NC
E D
OW
NS
TR
EA
M F
RO
M D
AM
OR
SIT
E O
F P
EA
K D
ISC
HA
RG
E
ME
AS
UR
EM
EN
T (
km)
Figu
re
8. Graph
show
ing
attenuation
rates
of fl
oods from
selected
dam
fail
ures
, wi
th nu
mber
s keyed
to table
4.
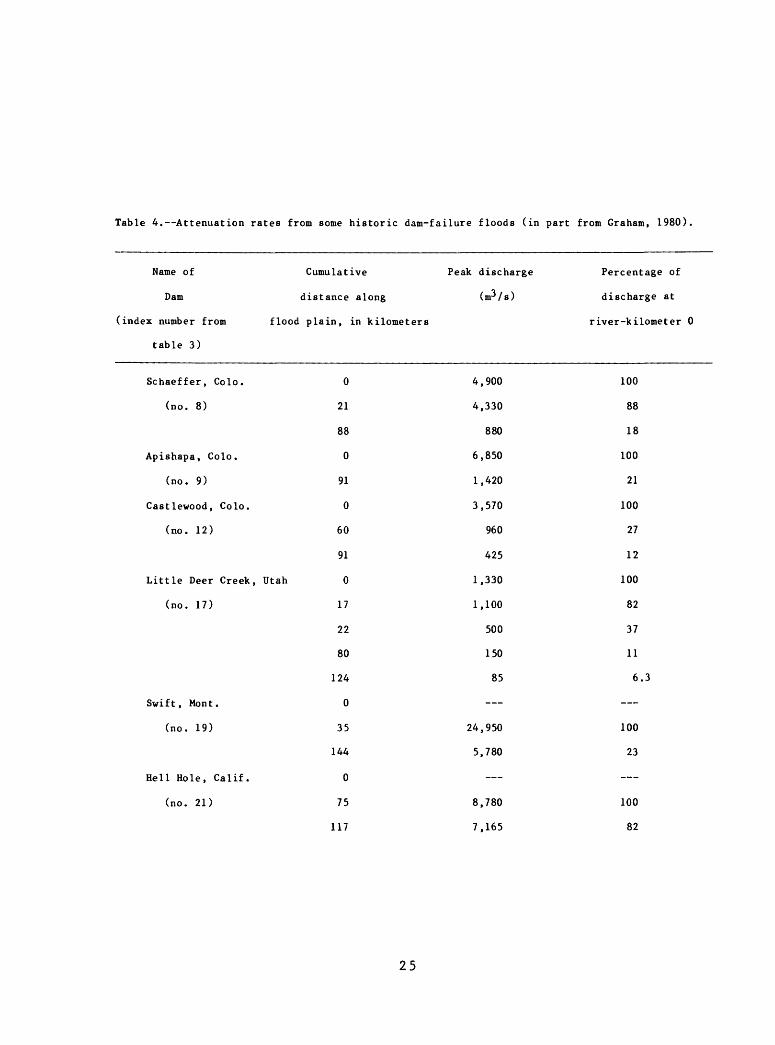
Table 4. Attenuation rates from some historic dam-failure floods (in part from Graham, 1980).
Name of Cumulative Peak discharge
Dam distance along (nr/s)
(index number from flood plain, in kilometers
table 3)
Schaeffer, Colo.
(no. 8)
Apishapa, Colo.
(no. 9)
Castlewood, Colo.
(no. 12)
Little Deer Creek, Utah
(no. 17)
Swift, Mont.
(no. 19)
Hell Hole, Calif.
(no. 21)
0
21
88
0
91
0
60
91
0
17
22
80
124
0
35
144
0
75
117
4,900
4,330
880
6,850
1,420
3,570
960
425
1,330
1,100
500
150
85
24,950
5,780
8,780
7,165
Percentage of
discharge at
river-kilometer 0
100
88
18
100
21
100
27
12
100
82
37
11
6.3
100
23
100
82
25
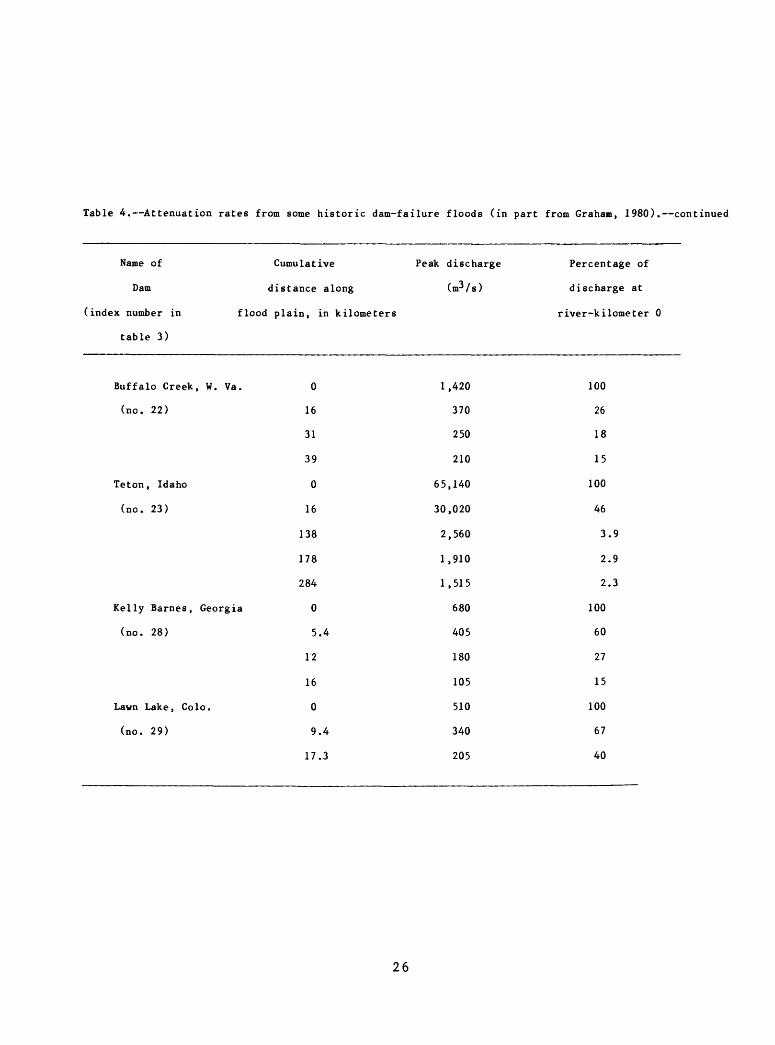
Table 4. Attenuation rates from some historic dam-failure floods (in part from Graham, 1980). continued
Name of Cumulative
Dam distance along
(index number in flood plain, in kilometers
table 3)
Buffalo Creek, W. Va. 0
(no. 22) 16
31
39
Teton, Idaho 0
(no. 23) 16
138
178
284
Kelly Barnes, Georgia 0
(no. 28) 5.4
12
16
Lawn Lake, Colo. 0
(no. 29) 9.4
17.3
Peak discharge
(m3 /s)
1,420
370
250
210
65,140
30,020
2,560
1,910
1,515
680
405
180
105
510
340
205
Percentage of
discharge at
river-kilometer 0
100
26
18
15
100
46
3.9
2.9
2.3
100
60
27
15
100
67
40
26
suggests that the depth of water (and consequent hydrostatic pressure) may be the primary factor controlling when a lake drains. The release of glacier-dammed lakes can occur by the formation of a drainage channel under, through, or over the ice. Several proposed mechanisms for failure of ice-dammed lakes include (1) slow plastic yielding of ice from hydrostatic pressure differences between the lake and adjacent, less-dense ice (2) raising of the ice barrier by hydrostatic flotation, (3) crack progression under combined shear stress from glacier flow and high hydrostatic pressure, (4) drainage through small, pre-existing channels at the ice-rock interface and consequent enlargement of ice tunnels by melting by heat in the lake water, and heat produced from kinetic energy of the water from the rapidly draining lake; (5) water overflowing the ice dam, generally along the margin; (6) subglacial melting by volcanic heat; and (7) weakening of the ice dam by earthquakes (Post and Mayo, 1971). Factors (1) through (4) are controlled by thickness of the ice dam, which determines the necessary pressure for floatation, and controls ice dynamical behavior such as tunnel closure rate and crevasse behavior. Lake depth, meanwhile, is limited by the elevation of the lowest bedrock divide or col.
When a lake drains, drainage tumrels freeze in the winter and runoff collects behind the ice dam in the spring and summer, during which time the ice dam may fail again. The characteristics and behavior of ice-dammed lakes can change drastically as ice advances or retreats in response to local climate variations. Lakes dammed by polar and subpolar ice in cold regions normally drain supraglacially or marginally through downmelting of the outlet channel, while ice dams in more temperate climates are more liable to sudden englacial or subglacial breaching (Blachut and Bellantyne, 1976).
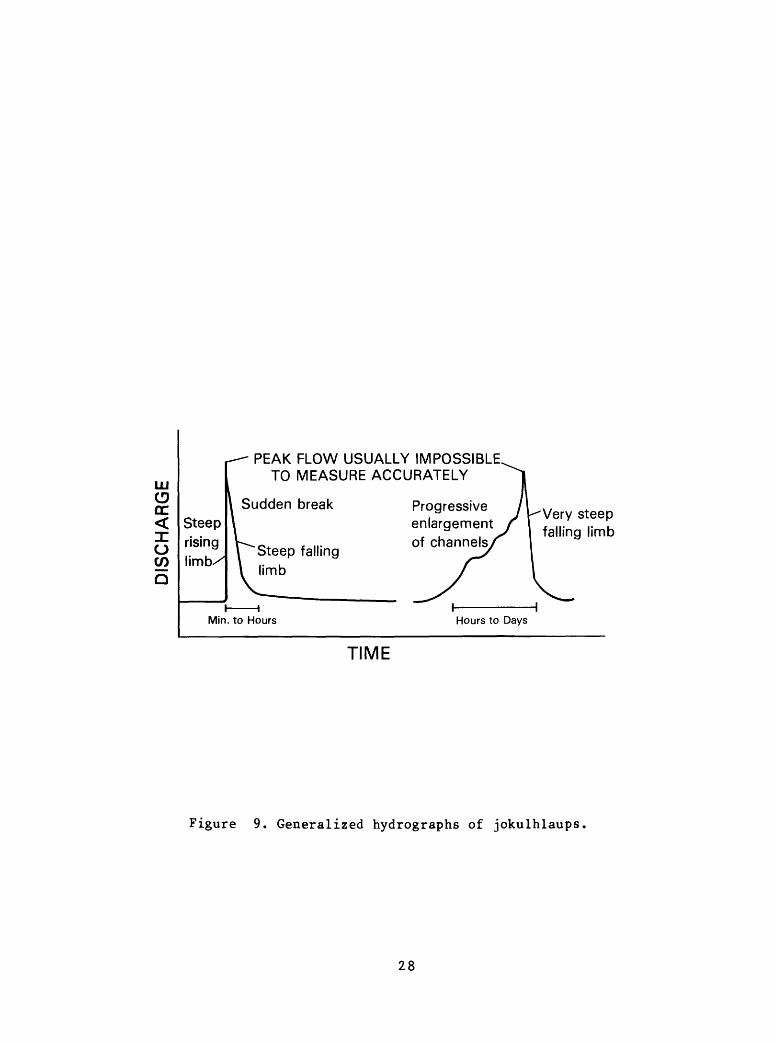
Jokulhlaups can produce enormous floods (Table 5). The largest floods seem to be outbursts produced by subglacial melting of ice by volcanoes. The most intense observed floods occur from Myrdalsjokull in Iceland where peak discharges may exceed 100,000 m /s (Thorarinsson, 1957). Hypothetical hydrographs of two types of Jokulhlaups are shown in figure 9. Dams that burst suddenly are characterized by a steep rising limb, sharp peak, and a steep recession limb (Young, 1980). Floods produced by progressive enlargement of veins and channels by passing waters have more gradually rising limbs, sharp peaks, and steep recessional limbs (Haeberli, 1983). Some examples of actual jokulhlaup hydrographs can be found in Thorarinsson (1953) and Stone (1963). The time of year when a jokulhlaup occurs can be an important factor in determining the magnitude of the flood. In January 1969, the drainage of a glacial lake into the Kenai River, Alaska, fractured the river ice and formed large ice jams that plugged the channel, resulting in severe flooding (Post and Mayo, 1971).
The timing and potential magnitude of Jokulhlaups only can be crudely estimated. If the hydrostatic flotation theory of Thorarinsson (1953) is applicable, subglacial drainage becomes possible when the hydrostatic pressure of water from a lake exceeds the ice overburden pressure in a dam. This occurs when the depth of water in the glacial lake reaches about 0.9 times the height of the ice barrier. Knowing the height of the ice barrier
27
PEAK FLOW USUALLY IMPOSSIBLE TO MEASURE ACCURATELY
Sudden break
Steep falling limb
Progressive enlargement of channels
Very steep falling limb
Min. to Hours Hours to Days
TIME
Figure 9. Generalized hydrographs of jokulhlaups
28
Table
5. Some glacial dams th
at ha
ve failed,
producing jokulhlaups,
to
Index
number
and
name of
lake
1. 2. 3. 4. 5. 6. 7. 8. 9.
10.
11.
12.
13.
14.
15.
Giet
ro,
Switzerland
Vatnsdalur, Ic
elan
d
Aletsch, Switzerland
Albigna, Switzerland
Chong Kumdan (Shy ok)
,India
Demmevatn, Norway
Graenalon, Iceland
Trient, Switzerland
Corn
er,
Switzerland
Unter Grindelwald,
Switzerland
Gjanupsvatn, Iceland
Lake George,
Alaska*
Ferp
ecle
, Switzerland
Lake
Ge
orge
, Alaska
Tulsequah Lake,
Year of
failure
1818
1898
1913
1927
1929
1937
1939
1942
1944
1951
1951
1951
1952
1958
1958
Heig
ht
Volu
me
Dam
H V
factor
(m)
(m3x!
06
) (HxV)
? 20
(out
burs
t volume)
372
120
44,640
? 4.
5(o
utbu
rst
volume)
? 2.7
(outburst
volume)
120
1,350
162,000
406
11.6
4,710
535
1,500
802,500
? 0.
84(o
utbu
rst
volume)
? >6
(out
burs
t volume)
? 0.135
(out
burs
t volume
167
20
3,340
35
?
?-
0.255
(outburst volume)
40
1,730
69,200
210
229
48,090
Peak
outflow
(m3/s)
8,00
0
3,000
195
128
22,650
1,000
5,00
0 26
200 74.6
370
5,200
230
10,100
1,55
6
Peak
determination
Reference
? Haeberli, 1983,
Table III
? Clague an
d Ma
thew
s, 19
73
? Haeberli, 1983,
Table II
? Haeberli, 1983,
Table II
? Gunn, 1930,
Hewitt,
1982
? Clague an
d Ma
thew
s, 19
73
? Clague an
d Mathews, 19
73
? Haeberli, 1983,
Table II
? Haeberli, 1983,
Tabl
e II
? Haeberli, 1983,
Table
III
? Clague an
d Mathews, 1973
Slope-area
Stone, 19
63measurement
? Haeberli, 1983,
Table III
? Clague an
d Mathews, 19
73
? Clague an
d Ma
thew
s, 19
73British Columbia
16.
Summit Lake,
British Columbia
17.
Ekalugad Va
lley
, Baffin Island
19
65,
1967
62
025
1
1967
120
4.8
155,6
20
576
3,2
60
Dra
w-d
own
Cla
gue
and
Ha t
hew
s,
1973
ra
te
Gag
ed
1 km
20
0 do
wns
trea
m
Cla
gue
and
Mat
hew
s,
1973
Tabl
e 5. Some gl
acia
l da
ms that ha
ve fa
iled
, pr
oduc
ing
jokulhlaups. continued
Inde
x number
and
18.
19.
20.
21.
name
of
lake
Stru
pvat
net
, No
rway
Grub
en,
Swit
zerl
and
Chakachatna
Lake
, Alaska*
Haza
rd La
ke ,
Cana
da
Year of
fa
ilur
e
1969
1970
1971
1978
Heig
ht
Volu
me
Dam
H V
factor
(m)
(m3x
!06
) (H
xV)
186
2.6
856
(out
burs
t vo
lume
)
? 0.17
(out
burs
t vo
lume
)
? 29
4
300
19.6
5,
880
Peak
outflow
(m3/s
)
150 15
13,3
10 640
Peak
de
term
inat
ion
Refe
renc
e
? Cl
ague
and
Mathews, 19
73
? Haeberli,
1983
, Ta
ble
II
Field
esti
mate
Lamke, 1972
9 km
down
stre
am
Draw
-dow
n Cl
arke
, 19
82ra
te
Drai
ns at
su
rfac
e along
ice
marg
in.
and monitoring depth of lake water may allow warnings to be given when critical depths are approached. Unfortunately, jokulhlaups can occur long before critical depths for flotation are reached (Mathews, 1965).
The magnitude of jokulhlaups can be estimated from the empirical relationship between lake volume and peak discharge developed by Clague and Mathews (1973):
Qmax = 75 V0 - 67 ; r 2 = 0.96 (16)
where Qmax is maximum discharge in nr*/s and V is lake storage in mj x 10 . A more comprehensive data set that does not include the Pleistocene Lake Missoula flood is in table 5. Using these data, the regression equation is:
Qmax = 113 v°-64 ; r2 = 0.80; SE = 106 percent. (17)
The curve is plotted in figure 5. Because glacial dams can drain in a variety of ways, dam height does not seem to be a good indicator of peak discharge. A regression equation using, data from table 5 is:
Qmax = 21 - 6 H°- 73 ; r2 = 0.08; SE = 236 percent. (18)
However the dam-factor (H x V) regression equation has a much lower standard error:
= 3.8 (HV) 0 ' 61 ; r 2 = 0.79; SE = 75 percent. (19)
This curve is plotted in figure 7.
Theoretical investigations of glacier-outburst floods have been undertaken by Mathews (1973), Nye (1976), and Clarke (1982). These hydraulic-thermodynamic models are based upon tunnel geometry, continuity, energy conservation, and heat transfer, and require estimation or direct measurement of several critical parameters, including roughness coefficients and lake temperatures. These models do not do equally well in all circumstances. Models of jokulhlaups are subject to many of the same difficulties and uncertainities as models of constructed dam failures. The phenomena are more complex than can easily be analyzed, and therefore models are not very reliable.
Morainal Dams
Terminal or recessional moraines in glaciated areas may be sufficiently well-preserved that they dam the stream that replaces the melting glacier. The advances and retreats of mountain glaciers in different parts of the world over the past few hundred years have created a large number of small, unstable morainal dams. These dams subsequently may fail by overtopping and erosion of the dam by large runoff events, or large waves (fig. 10). Most constructed dams are zoned to minimize leakage, and riprapped to minimize surface erosion. However, morainal and landslide dams are heterogenous mixtures of a variety of particle sizes.
31
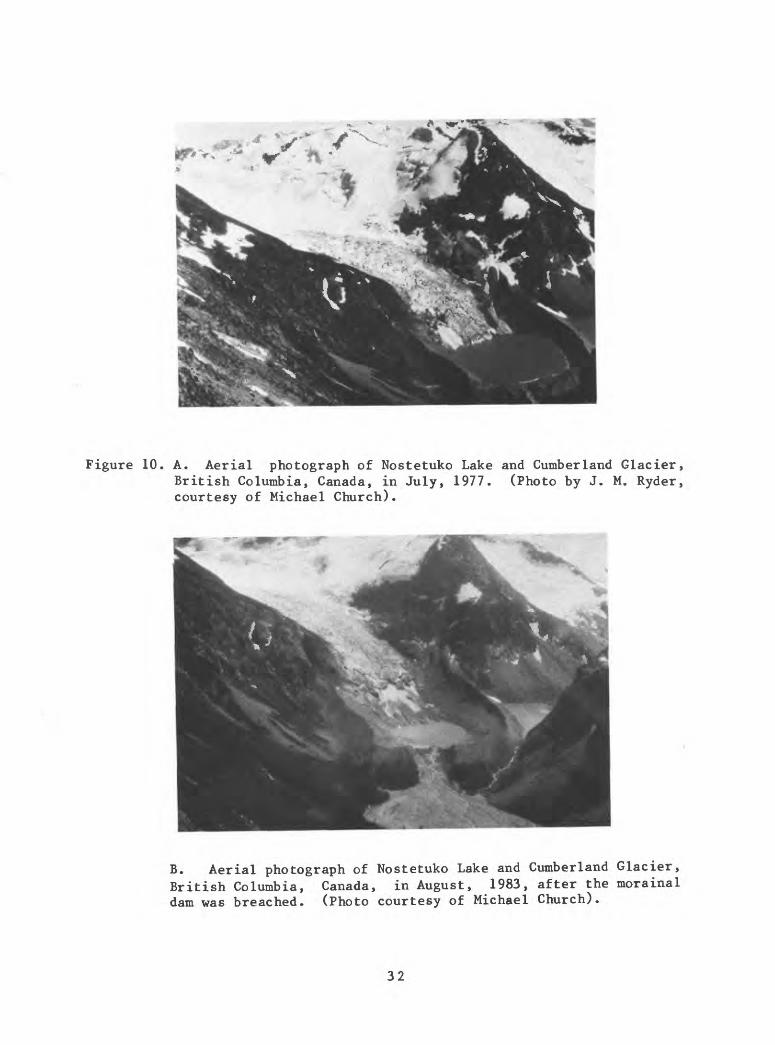
Figure 10. A. Aerial photograph of Nostetuko Lake and Cumberland Glacier, British Columbia, Canada, in July, 1977. (Photo by J. M. Ryder, courtesy of Michael Church).
B. Aerial photograph of Nostetuko Lake and Cumberland Glacier, British Columbia, Canada, in August, 1983, after the morainal dam was breached. (Photo courtesy of Michael Church).
32
When a morainal or landslide dam is breached, downcutting commences and erosion of a breach usually begins as headward-eroding cuts. Eventually the headward erosion reaches the impounded water, lowering the outlet and allowing more water to escape.
In 1874, a proglacial lake that had formed behind a Little Ice Age terminal moraine of the Madatschferner glacier in Austria, breached its unstable morainal dam and caused flooding in the valley below (Eisbacher and Clague, 1984, p. 131). Breaches in young morainal dams also have occurred from waves produced by large rock and ice falls into lakes and subsequent overtopping and erosion of the natural dam. This phenomenon has been described in Austria (Eisbacher and Clague, 1984, p. 131); Peru (Lliboutry and others, 1977); and Canada (Blown and Church, 1985) (fig. 10).
Many lakes dammed by frontal moraines have no defined outlets. Outflow occurs through springs located in the moraine, and discharges vary with lake levels. In these situations, piping failures are a potential hazard. Hundreds of thousands of dollars have been spent trying to lower lake levels, and thus to minimize failures of morainal dams in the Cordillera Blanca, Peru, following a major ice retreat in the early to mid 1900's (Lliboutry and others, 1977).
Volcanic Dams
Floods can originate from the breaching of natural dams formed by lava flows (Finch, 1937; Cotton, 1944) or pyroclastic flows (Aramaki, 1981; Scott and Janda, 1982; Jennings and others, 1981), or from the breaching and expelling of volcanic crater lakes (Zen and Hadikusumo, 1965; Nairn and others, 1979).
On March 28 and 29, 1982, El Chichon Volcano in southern Mexico erupted. A pyroclastic flow dammed the Rio Magdalena southwest of the volcano, forming a lake 5 km long and several million cubic meters in volume (Silva and others, 1982). On May 26, 1982, the pyroclastic dam failed, draining the lake in about 1 hour and sending a flood of very hot water downstream. Bridges, a village, and a hydroelectric plant downstream were damaged. Ten kilometers from the dam, a floodwater temperature of 82 degrees Celsius was measured. At a hydroelectric plant 35 km downstream, one worker was killed and three were badly burned by the hot flood waters (52 degree Celsius). The breaching of a large pyroclastic dam that was formed by the 1783 eruption of Asama Volcano, Japan, resulted in the destruction of more than 1,200 houses and the loss of more than 1,200 lives (Aramaki, 1981).
In 1912, a large volcanic eruption occurred in the Valley of Ten Thousand Smokes, Katmai National Park, Alaska. A cluster of phreatic craters dammed a 1.5 kilometer-long lake atop the tuff. It is estimated that the dam failed in the summer of 1912 or 1913 (Hildreth, 1983). The flood scoured the ash-flow surface to depths of 1 to 2 meters, transported 50-centimeter-diameter blocks of welded tuff over 20 kilometers, and deposited 1 to 8 meters of sediment in the lower parts of the valley (Hildreth, 1983).
33
Landslide dams
Landslides that move into stream valleys and dam rivers are very common, yet no comprehensive investigation has ever been undertaken to investigate this world-wide phenomena. If a landslide dam fills and overspills, rapid erosion of the landslide deposits can lead to catastrophic flood discharges and great loss of life and property. Landslide dams form in all kinds of physiographic settings, ranging from rock avalanches in steep mountainous terrains, to quick-clay failures in flat river lowlands. Earthquakes appear to be a significant cause of landslides that dam valleys (Adams, 1981; Keefer, 1984). One of the earliest reported landslide dams formed in 563 AD in the St. Barthelemy Basin, Switzerland. The debris blocked the upper Rhone River and the subsequent failure killed many people as floodwaters flowed into Lake Geneva (Eisbacher and Clague, 1984).
Probably the greatest landslide dam failure disaster was the Indus River landslide dam failure of 1841 (Mason, 1929). During the winter of 1840 and 1841, part of Nanga Parbat collapsed into the Indus River following an earthquake. The landslide dam formed a lake 305 m deep and 64 km long. In June, 1841, the dam was breached by the Indus, and a tremendous flood resulted. At Attock, over 400 km downstream, the water rose to over 30 m deep, engulfing a Sikh army camp on the floodplain near Attock, killing 500. Hundreds of villages were washed away, and thousands of lives were lost (Mason, 1929).
Following the May 1980 eruption of Mount St. Helens, Washington, debris-avalanche deposits impounded three large lakes (Coldwater Creek, South Fork Castle Creek, and Spirit Lakes) and several smaller ones (fig. 11). Coldwater Creek Lake, had it been allowed to fill naturally, would have developed an estimated maximum volume of 123 x 10° mj by late 1981. If this dam had overtopped, Dunne and Fairchild (1983) estimated that a vertical erosion rate of 0.3 m/minute would occur, developing a rectangular breach with width-depth ratio of two, and a maximum incision of 30 m. Clear-water peak discharge through the breach was calculated using the broad-crested weir formula to be 14,000 m3 /s within 100 minutes, and 18,000 m /s after bulking up the floodwaters with easily eroded unconsolidated sediment. The U.S. Army Corps of Engineers constructed a permanent spillway for Coldwater Creek and South Fork Castle Creek Lakes during the summer of 1981 that stabilized their volumes at 82.6 x 10" m and 24 x 106 m3 respectively (Schuster, 1984).
For the debris avalanche dam impounding Spirit Lake, the expected flood hydrograph from the hypothetical failure of the debris dam was simulated with the National Weather Service DAMBRK model (Fread, 1980) and appropriate revisions (Land, 1980a) for an overtopping failure (Jennings and others, 1981), and for a piping failure at lower reservoir levels (Swift and Kresch, 1983). Dunne and Fairchild (1983) employed the same procedure of estimating erosion rates, breach characteristics, and peak discharge that they used for Coldwater Creek Lake. Clear-water peak dischange values were 17,400 m 3 /s, 15,000 m 3 /s, and 15,600 m 3 /s
34
Figure 11. Photograph of Castle Lake, Mount St. Helens, Washington, dammed by a debris avalanche deposit. Debris avalanche moved from left to right in photo. An artificial spillway was cut into the right embankment. (April, 1984) (Photo courtesy of R. L. Schuster).
35
respectively. It was expected that these clear-water peak flows would quickly entrain large volumes of sediment, so when the flows were routed downstream, large volumes of sediment were added to simulate muddy floodwaters or debris flows.
The hazard presented by the volcanic debris-avalanche dam of Spirit Lake has been mitigated by constructing a permanent drainage tunnel in bedrock at a cost of $14 million (Sager and others, 1984; Schuster, 1985).
Numerous smaller lakes were formed by the unstable volcanic debris surrounding Mount St. Helens, and several breakout floods have been produced. A landslide dam that accumulated water from Castle and Maratta Creeks failed on August 19, 1980. The floodwaters were reimpounded in another dam near Elk Rock. This dam was overtopped and breached on August 27, 1980, releasing 0.3 x 10⁶ m3 of water into the North Fork Toutle River. The estimated flood peak was 450 m^/s, and 2.8 x 10-* mj of material was
' c oeroded from the debris dam, depositing 2.0 x 10 D m of material in the channel of the North Fork Toutle River (Meier and others, 1981; Jennings and others, 1981).
Although data are scarce at the present time, it seems that landslide and volcanic dams consisting of pyroclastic debris, if they are going to fail, fail during filling more quickly than other types of landslide or volcanic dams (Michael Church, written communication, 1985). This may be related to unique density, packing, composition, or texture of pyroclastic sediments in natural dams. Obviously this is an important area for further investigation.
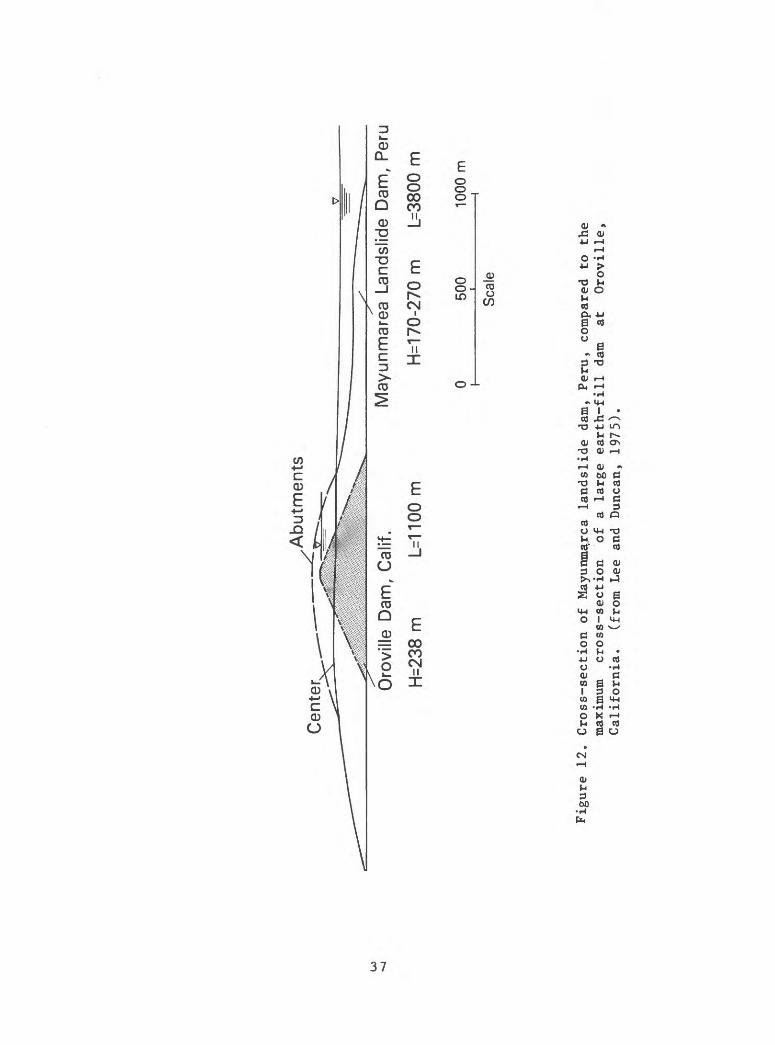
Landslide dams are different from constructed fill dams in several important aspects. Landslide dams are a heterogenous mixture of rock and soil whose permeability can vary greatly. Commonly landslide sediments will plug the valley and flow or slide for some distance down-valley. Landslide dams are typically much wider than constructed dams. For example, the South Nation River landslide dam in Canada was 2.5 km wide (Eden and others, 1971). A transverse section of the Mayunmarca landslide dam in Peru is compared with the Oroville Dam, a large earthf ill dam in California in figure 12. The landslide dam is higher at the abutments and almost as high as the constructed dam in the center, , but over three times as wide. Landslide dams typically involve large volumes of sediment. The Madison Canyon landslide that dammed the Madison River forming Earthquake Lake in 1959, had a base width five to eight times as great as would have been used in building a rock-fill dam of the same height (Knight and Bennett, 1960).
When a landslide dam is overtopped, there is commonly much more sediment and debris for water to erode before a full breach is developed. This is probably why flood peaks from failed landslide dams appear to be smaller than constructed dam failures with the same dam height and reservoir volume (figs. 4,5; table 6).
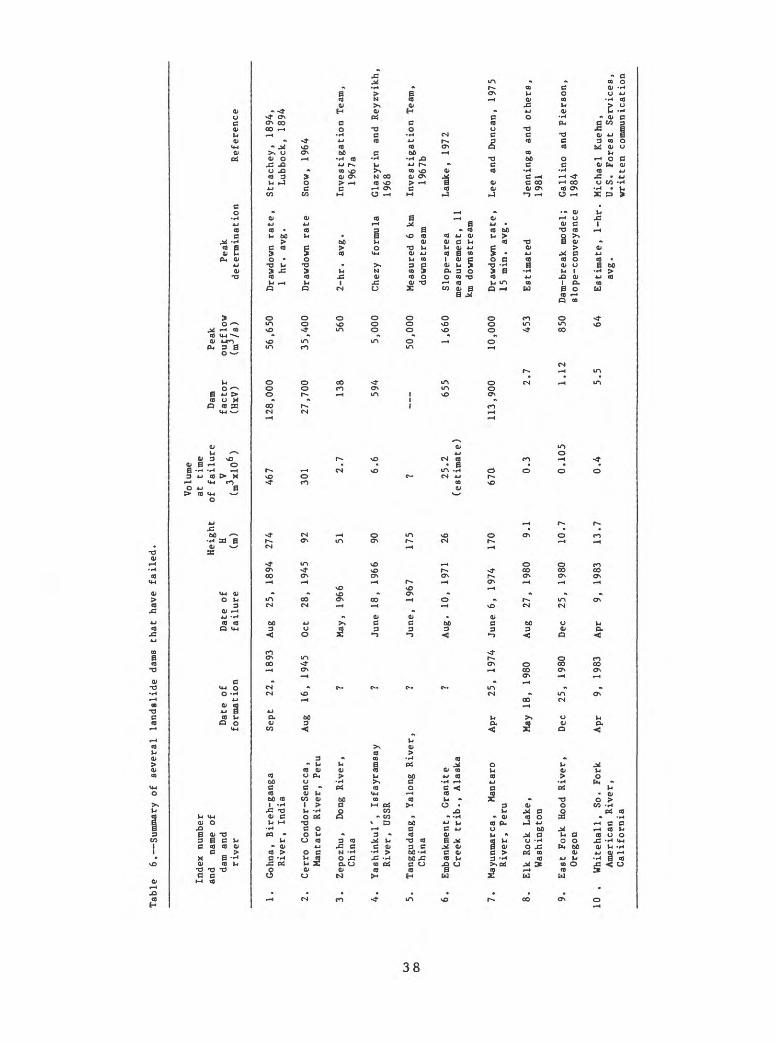
Regression equations have been devleoped to predict peak discharge from the landslide dam failure data in table 6. Knowing the height of the
36
Cen
ter,
Abutm
ents
OJ
Oro
ville
Dam
, C
alif.
H=2
38 m
L=
1100
m
May
unm
area
Lan
dslid
e D
am,
Per
u
H=1
70-2
70 m
L=
3800
m
500
Scale
1000
m i
Figu
re 12
. Cross-section
of Ma
yunm
arrca
land
slid
e dam, Peru
, co
mpar
ed to th
e ma
ximu
m cr
oss-
sect
ion
of a
large
earth-fill da
m at
Or
ovil
le,
California.
(fro
m Le
e and
Duncan,
1975).
Table
6. Summary of se
vera
l la
ndsl
ide
dams th
at ha
ve fa
iled
.
Index
number
and
name
of
dam
and
rive
rD
ate
of
form
atio
nDa
te of
fa
ilur
e
Height
U (m)
Volume
at time
of fa
ilur
eV
(m3x!06
)
Dam
factor
(HxV)
Peak
ou
tflo
w (m
3/s
)Peak
dete
rmin
atio
nReference
00
1.
Gohna, Bireh-ganga
Sept
22,
1893
Aug
25,
1894
274
River, In
dia
2.
Cerr
o Co
ndor
-Sen
eca,
Aug
16,
1945
Oct
28,
1945
92
Ma
ntar
o Ri
ver,
Pe
ru
3.
Zepozhu,
Dong
Ri
ver,
Ch
ina
4.
Yashinkul',
Isfa
yram
say
River, US
SR
5.
Tanggudang,
Yalong River,
China
6.
Embankment,
Gran
ite
Cree
k tr
ib.,
Al
aska
7.
Mayu
nmar
ca,
Mant
aro
River, Peru
8.
Elk
Rock Lake,
Washington
9.
East Fork Ho
od Ri
ver,
Or
egon
10
. Whitehall, So.
Fork
Am
eric
an River,
Cali
forn
ia
? M
ay,
1966
51
? Ju
ne
18
, 19
66
90
? Ju
ne,
19
67
175
? A
ug.
10
, 19
71
26
Apr
2
5,
1974
Ju
ne
6,
1974
17
0
May
18
, 19
80
Aug
2
7,
1980
9.1
Dec
2
5,
1980
D
ec
25
, 19
80
10.7
Apr
9,
1983
A
pr
9,
1983
13.7
467
128,0
00
56,6
50
Dra
wdo
wn
rate
, S
trachey,
1894,
1 h
r.
avg
. L
ubbock
, 18
94
301
27,7
00
35
,40
0
Dra
wdo
wn
rate
S
now
, 19
64
25.2
(e
stim
ate
)
670 0.3
0.1
05
0.4
138
594
655
11
3,9
00
560
2-h
r.
avg
. In
vest
igati
on
Tea
m,
1967
a
5,0
00
C
hezy
fo
rmu
la
Gla
zyri
n
and
Rey
zvik
h,
1968
50,000
Measured 6 km
Inve
stig
atio
n Te
am,
downstream
1967
b
1,660
Slope-area
Lamke, 19
72
meas
urem
ent,
11
km do
wnst
ream
10,000
Draw
down
ra
te,
Lee
and
Dune
an,
1975
15 min. avg.
2.7
453
Esti
mate
d Je
nnin
gs an
d ot
hers
,19
81
1.1
2
850
Dam
-bre
ak
mo
del
; G
all
ino
and
Pie
rso
n,
slo
pe-
con
vey
ance
19
84
5.5
64
E
stim
ate
, 1
-hr.
M
ichae
l K
uehn
,av
g.
U.S
. F
ore
st
Serv
ices,
w
ritt
en
com
munic
atio
n
dam in meters:
Qmax = 6.3 H1 - 59 ; r 2 = 0.74; SE = 147 percent; (20)
o Aknowing the volume (V) at time of failure, in m x 10 :
= 672 V0 - 56 ; r 2 = 0.73; SE = 142 percent; (21)
and finally, using the dam factor (H x V):
Qmax = 18KHV) 0 - 43 ; r 2 = 0.76; SE = 129 percent. (22)
These curves are plotted in figures 4, 5, and 7.
Hydrographs resulting from landslide dam failures depend on the rate of breach erosion and reservoir characteristics. A hydrograph for the 1974 Mayunmarca landslide dam failure in Peru is shown in figure 13.
The reasons some landslide dams fail and others do not are uncertain. Water seepage through some debris dams 'obviously maintains lake levels at safe depths and volumes (Adams, 1981). A large percentage of coarse boulders in a debris dam can retard or prohibit erosion if overtopping occurs, and can form, a natural riprapped spillway channel, with particles too coarse to move, through which the lake can drain.
Swanson and others (1985) proposed that larger dams blocking smaller rivers will have a smaller probability of failure than a smaller landslide dam below a larger drainage area. In a plot of watershed area versus landslide volume for nine sites in Japan, failed landslide dams clearly cluster as a separate population of smaller landslide volumes in larger drainage areas. With more data, a discriminant function between stable and failed landslide dams may be possible to ascertain, which would allow prediction of the potential for a catastrophic failure.
Today most landslide dams are viewed as serious flood threats, and extraordinary engineering feats are used to remove the dam or control the reservoir levels. In China, a large landslide dammed the Bailong River in 1981. Three hundred metric tons of dynamite were used to blast through the landslide (Li and Hu, 1982). In the Soviet Union, a large landslide dammed the Zeravshan River north of Afghanistan. The ancient city of Samarkand lay directly in the flood path should the dam fail. A spillway was blasted through the landslide before the lake reached its full capacity of 490 x 10 m (Anonymous, 1964). Another landslide dam formed in the previous year in Yugoslavia near the Bulgarian border. An evacuated village was already submerged in 30 meters of backwater when an emergency spillway was blasted and dug into the landslide dam (Anonymous, 1963).
In the United States, one of the best-known landslide dams that was modified before it overtopped or failed was the dam created by the 1959 Madison Canyon landslide of August 17, 1959, near Yellowstone National Park in Wyoming. An emergency spillway 75 m wide and 0.8 km long, and designed to pass a discharge of 280 m /s, was quickly bulldozed into the landslide
39
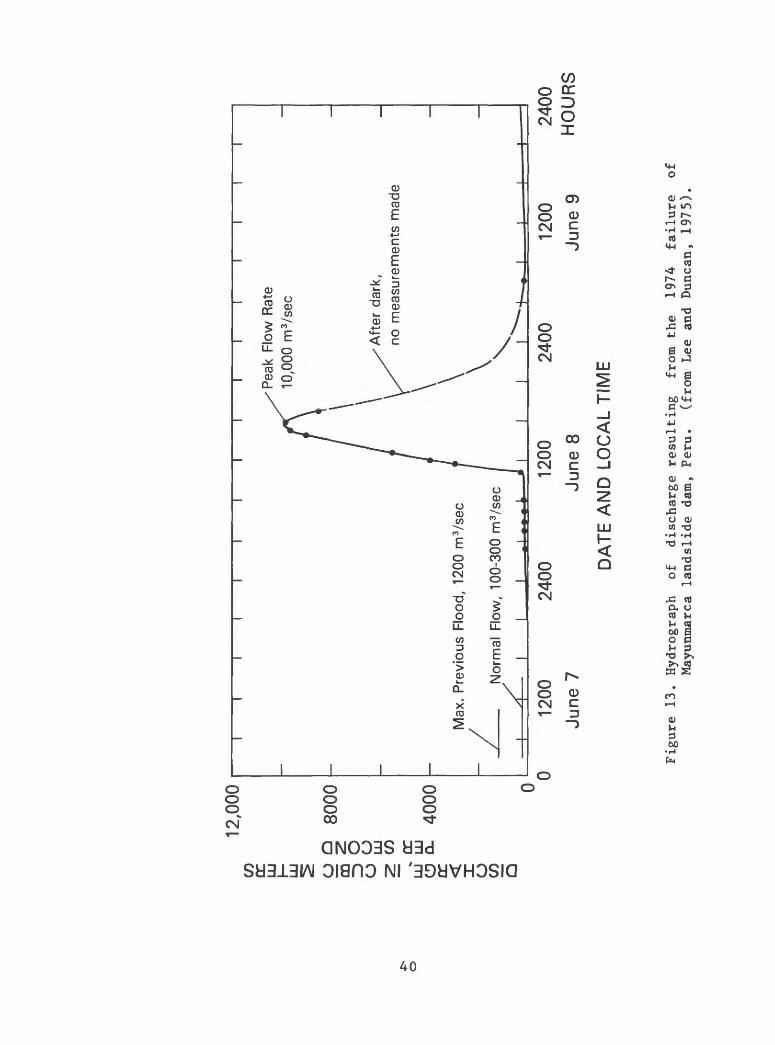
DISCHARGE, IN CUBIC METERS PER SECOND
OQC
2
O OQ
{to o 3 fti
O- en fD oD*a. o CO h|0 OQ
fD fD
Sen C
H>OQ
0 H> hi
f On 0(T)
p -JO -P-
OH>
O>m
O O
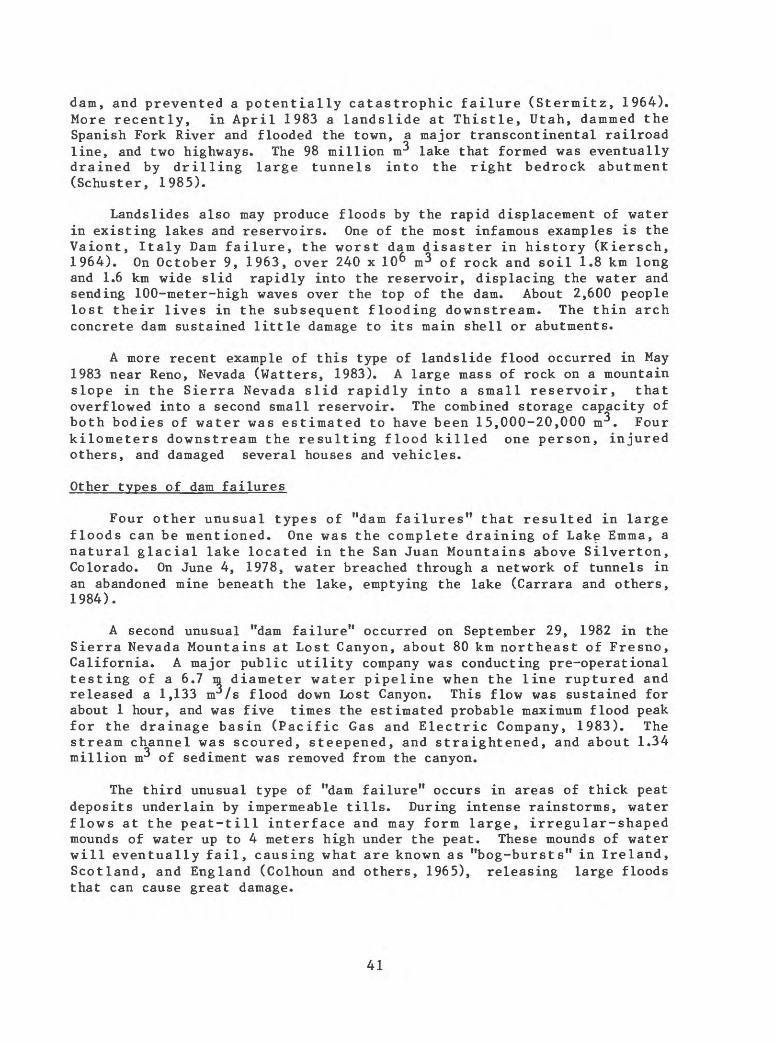
dam, and prevented a potentially catastrophic failure (Stermitz, 1964). More recently, in April 1983 a landslide at Thistle, Utah, dammed the Spanish Fork River and flooded the town, a major transcontinental railroad line, and two highways. The 98 million m3 lake that formed was eventually drained by drilling large tunnels into the right bedrock abutment (Schuster, 1985).
Landslides also may produce floods by the rapid displacement of water in existing lakes and reservoirs. One of the most infamous examples is the Vaiont, Italy Dam failure, the worst dam disaster in history (Kiersch, 1964). On October 9, 1963, over 240 x 10 6 m 3 of rock and soil 1.8 km long and 1.6 km wide slid rapidly into the reservoir, displacing the water and sending 100-meter-high waves over the top of the dam. About 2,600 people lost their lives in the subsequent flooding downstream. The thin arch concrete dam sustained little damage to its main shell or abutments.
A more recent example of this type of landslide flood occurred in May 1983 near Reno, Nevada (Watters, 1983). A large mass of rock on a mountain slope in the Sierra Nevada slid rapidly into a small reservoir, that overflowed into a second small reservoir. The combined storage capacity of both bodies of water was estimated to have been 15,000-20,000 m . Four kilometers downstream the resulting flood killed one person, injured others, and damaged several houses and vehicles.
Other types of dam failures
Four other unusual types of "dam failures" that resulted in large floods can be mentioned. One was the complete draining of Lake Emma, a natural glacial lake located in the San Juan Mountains above Silverton, Colorado. On June 4, 1978, water breached through a network of tunnels in an abandoned mine beneath the lake, emptying the lake (Carrara and others, 1984).
A second unusual "dam failure" occurred on September 29, 1982 in the Sierra Nevada Mountains at Lost Canyon, about 80 km northeast of Fresno, California. A major public utility company was conducting pre-operational testing of a 6.7 m diameter water pipeline when the line ruptured and released a 1,133 m /s flood down Lost Canyon. This flow was sustained for about 1 hour, and was five times the estimated probable maximum flood peak for the drainage basin (Pacific Gas and Electric Company, 1983). The stream channel was scoured, steepened, and straightened, and about 1.34 million m3 of sediment was removed from the canyon.
The third unusual type of "dam failure" occurs in areas of thick peat deposits underlain by impermeable tills. During intense rainstorms, water flows at the peat-till interface and may form large, irregular-shaped mounds of water up to 4 meters high under the peat. These mounds of water will eventually fail, causing what are known as "bog-bursts" in Ireland, Scotland, and England (Colhoun and others, 1965), releasing large floods that can cause great damage.
41
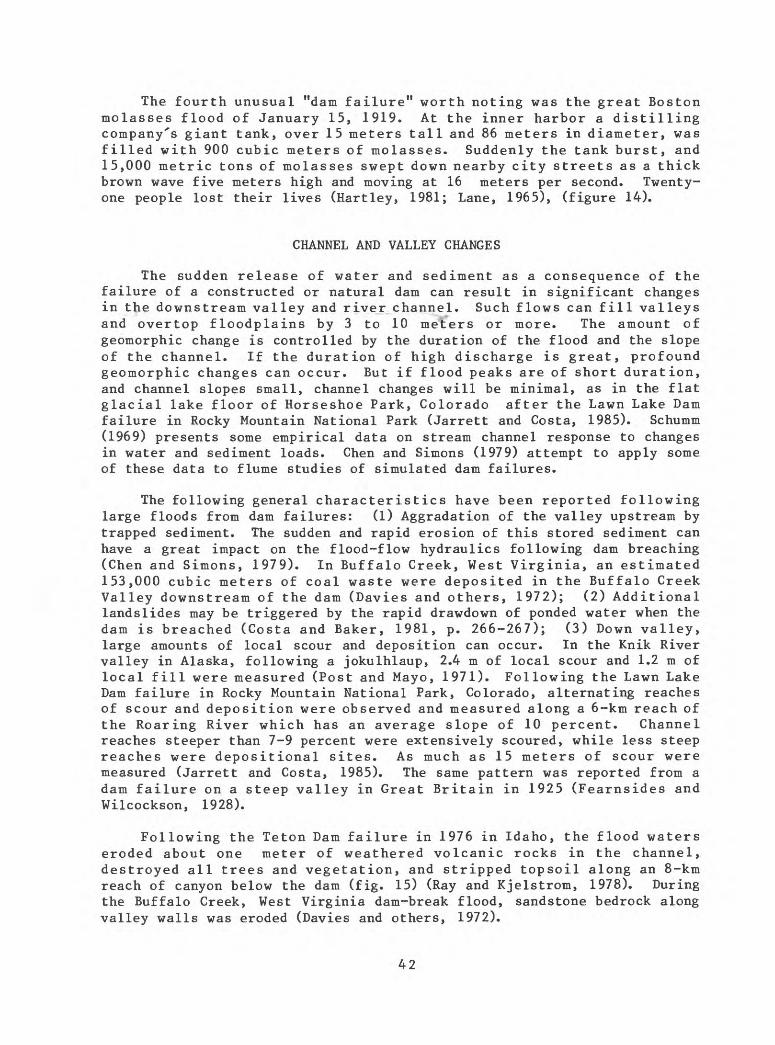
The fourth unusual "dam failure" worth noting was the great Boston molasses flood of January 15, 1919. At the inner harbor a distilling company's giant tank, over 15 meters tall and 86 meters in diameter, was filled with 900 cubic meters of molasses. Suddenly the tank burst, and 15,000 metric tons of molasses swept down nearby city streets as a thick brown wave five meters high and moving at 16 meters per second. Twenty- one people lost their lives (Hartley, 1981; Lane, 1965), (figure 14).
CHANNEL AND VALLEY CHANGES
The sudden release of water and sediment as a consequence of the failure of a constructed or natural dam can result in significant changes in the downstream valley and river channel. Such flows can fill valleys and overtop floodplains by 3 to 10 meters or more. The amount of geomorphic change is controlled by the duration of the flood and the slope of the channel. If the duration of high discharge is great, profound geomorphic changes can occur. But if flood peaks are of short duration, and channel slopes small, channel changes will be minimal, as in the flat glacial lake floor of Horseshoe Park, Colorado after the Lawn Lake Dam failure in Rocky Mountain National Park (Jarrett and Costa, 1985). Schumm (1969) presents some empirical data on stream channel response to changes in water and sediment loads. Chen and Simons (1979) attempt to apply some of these data to flume studies of simulated dam failures.
The following general characteristics have been reported following large floods from dam failures: (1) Aggradation of the valley upstream by trapped sediment. The sudden and rapid erosion of this stored sediment can have a great impact on the flood-flow hydraulics following dam breaching (Chen and Simons, 1979). In Buffalo Creek, West Virginia, an estimated 153,000 cubic meters of coal waste were deposited in the Buffalo Creek Valley downstream of the dam (Davies and others, 1972); (2) Additional landslides may be triggered by the rapid drawdown of ponded water when the dam is breached (Costa and Baker, 1981, p. 266-267); (3) Down valley, large amounts of local scour and deposition can occur. In the Knik River valley in Alaska, following a jokulhlaup, 2.4 m of local scour and 1.2 m of local fill were measured (Post and Mayo, 1971). Following the Lawn Lake Dam failure in Rocky Mountain National Park, Colorado, alternating reaches of scour and deposition were observed and measured along a 6-km reach of the Roaring River which has an average slope of 10 percent. Channel reaches steeper than 7-9 percent were extensively scoured, while less steep reaches were depositional sites. As much as 15 meters of scour were measured (Jarrett and Costa, 1985). The same pattern was reported from a dam failure on a steep valley in Great Britain in 1925 (Fearnsides and Wilcockson, 1928).
Following the Teton Dam failure in 1976 in Idaho, the flood waters eroded about one meter of weathered volcanic rocks in the channel, destroyed all trees and vegetation, and stripped topsoil along an 8-km reach of canyon below the dam (fig. 15) (Ray and Kjelstrom, 1978). During the Buffalo Creek, West Virginia dam-break flood, sandstone bedrock along valley walls was eroded (Davies and others, 1972).
42
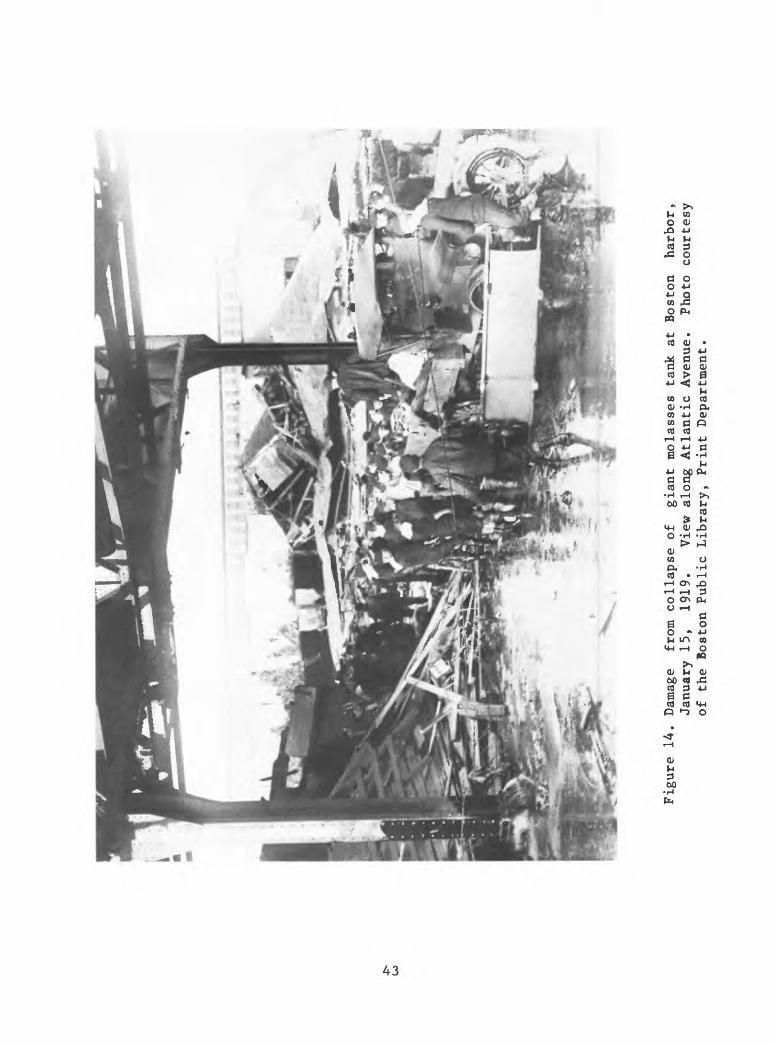
-p*
u>
Figure 14
. Da
mage
fr
om co
llap
se of
gian
t mo
lass
es ta
nk at Bo
ston
ha
rbor
, Ja
nuar
y 15
, 1919.
View along
Atla
ntic
Avenue.
Photo
courtesy
of the
Boston Public Library, Pr
int
Department.
If a landslide dam fails, the large amount of sediment from the dam available for transport can result in wide-spread valley aggradation. The Madison River, Montana, aggraded to an average depth of over 9 meters in 2 months following the Madison Canyon landslide and spillway construction (Hanly, 1964). Following the failure of a large landslide dam in Peru, Snow (1964) documented rapid channel aggradation for many kilometers downstream. As these flood sediments became incised by later flows, terraces formed in the valley. These terraces consisted of poorly sorted, unstratified angular fragments of landslide debris. Upstream of the dam, incision formed terraces in sediments deposited in the ponded water. These terraces contained well-sorted, rounded, imbricated, and stratified stream gravels.
Sediments scoured from local surficial deposits during a dam failure can form distinctive depositional features. In Rocky Mountain National Park, Colorado, the Lawn Lake Dam failure flood scoured local moraines and formed an alluvial fan of 0.17 km 2 (Jarrett and Costa, 1985). In an investigation of the potential floods accompanying the hypothetical breaching of two large debris dams formed in pyroclastic sediments from the 1980 eruption of Mount St. Helens, Dunne and Fairchild (1983) assumed that the release of a large volume of water onto loose, unconsolidated volcanic deposits would result in rapid erosion and bulking of the floodwaters. They modeled flood peaks assuming sediment concentrations of 300,000 to 1,180,000 mg/1.
Augmented sediment loads in channels downstream from breached dams require steepened slopes for efficient sediment transport. This results in channels that are wide, shallow, and highly braided, such as that of the Gros Ventre River near Kelly, Wyoming following the failure of a landslide- dammed lake in 1927 (Alden, 1928).
CONCLUSIONS
Some of the largest floods to have occurred on the Earth have resulted from the failure of dams. Both constructed dams and natural dams have failed with the resulting loss of many thousands of lives and millions of dollars in property. Estimation of peak discharges from hypothetical dam failures, and routing of those floods down-valley remains an imprecise art. The diversity of dam types, failure mechanisms, and down-valley sediments and morphology make the prediction of channel changes, scour, and deposition speculative. One point becomes clear, however: the ability to estimate the hydrology, hydraulics, and geomorphology of all types of dam failures is predicated upon our knowledge of historic events and appropriate measurements and observations.
For rapid prediction purposes when loss of life or property is involved, a conservative peak discharge estimate based on envelope curves developed from historic dam failures can be made from knowledge of dam height and volume using equations 3, 5, 6, or 9. If breach dimensions can be estimated, equations 11, 12, or 13 may be used.
44
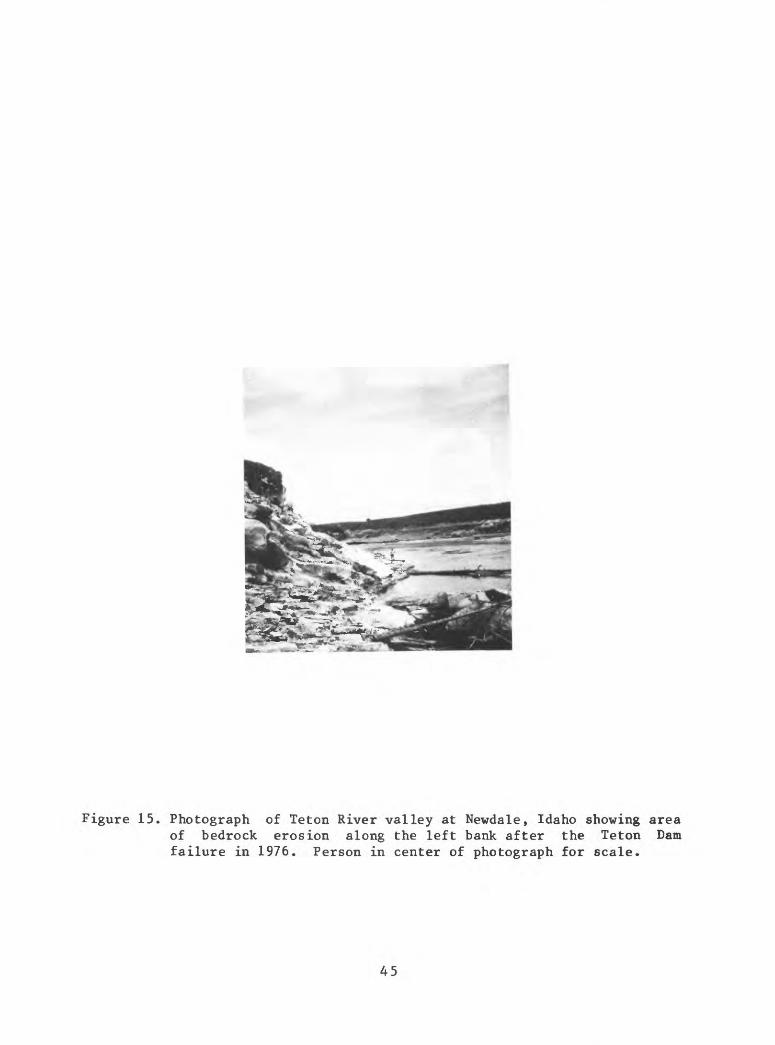
Figure 15. Photograph of Teton River valley at Newdale, Idaho showing area of bedrock erosion along the left bank after the Teton Dam failure in 1976. Person in center of photograph for scale.
45
For reconstructing past flood peaks from dam failures for paleohydrological or sedimentological investigations, regression equations with peak discharge as the dependent variable, probably provide a reasonable estimation if dam height and volume of stored water are known. For constructed dams, equation 4 requires knowledge of the dam height to predict peak discharge. For glacial dams and landslide dams, equations 19 and 22 can be used to reconstruct peak discharge.
Regression equations for constructed, landslide, and glacial dams are summarized in table 7. Dam height is the best independent variable to estimate peak discharge for constructed dams. Dam factor (height times volume) is the best independent variable for estimating flood peaks from landslide and glacial dams. For all kinds of dams, dam factor has a lower overall average standard error, and is an approximate measure of the energy expended at the dam at time of failure. Enough well-documented, intensive investigations of dam failures simply do not exist, especially for landslide dams. These are obvious areas for new and innovative hydrologic and geomorphic research, and the returns will have many practical as well as scientific merits.
46
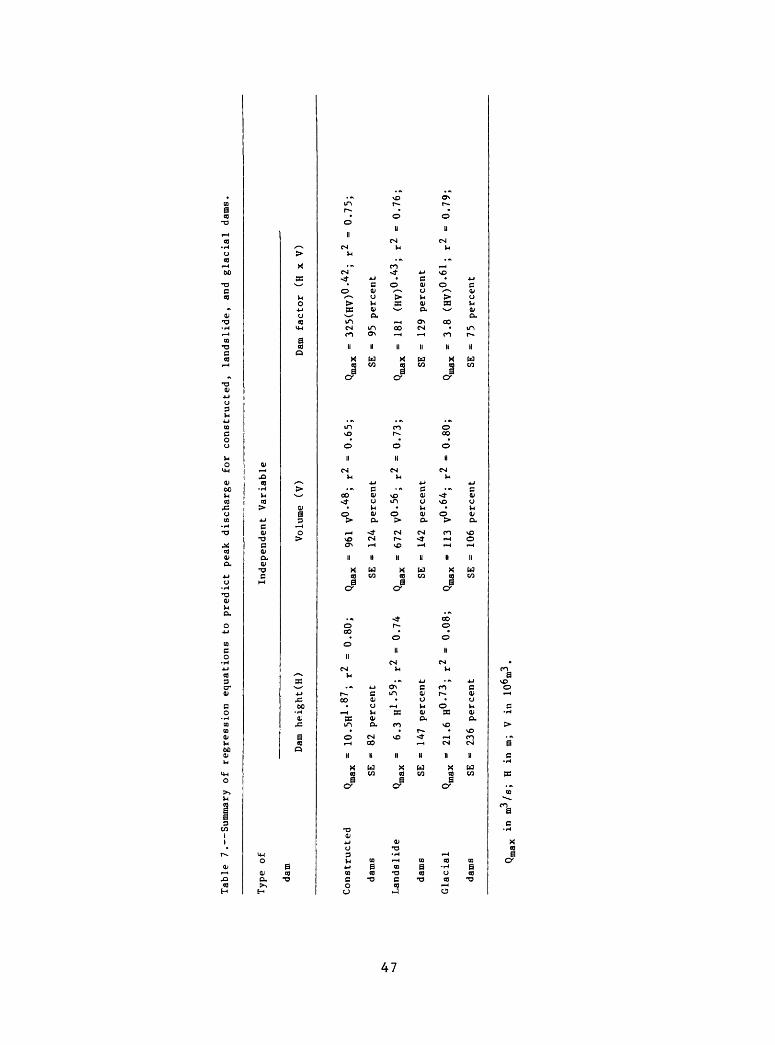
Tabl
e 7. Summary of regression equations to pr
edic
t peak discharge for
constructed, la
ndsl
ide,
an
d glacial dams,
Type
of
dam
Independent Variable
Dam
height(H)
Volu
me (V
)Dam fa
ctor
(H
x
V)
Constructed
Qmax =
10.5H1
-87
; r2
= 0.80;
Qmax =
961
v°'48
; r2
= 0.65;
dams
SE
=
82 pe
rcen
t SE =
124
percent
Landslide
Qmax =
6.3
H1
-59
; r2
= 0.74
Qmax =
672
V0
-56
; r2
= 0.
73;
dams
SE =
147
percent
SE =
142
percent
Glacial
Q^., =
21.6
H0
-73
; r2
= 0.08;
Q^.^ =
113
y0
'64
; r2
= 0.
80;
dams
SE =
236
percent
SE =
106
perc
ent
Qmax =
325(HV)°'42
; r2
= 0.
75;
SE =
95 percent
Qmax =
181
(HV)
0-43
; r2
- 0.
76;
SE =
129
percent
Qmax -
3.8
(HV)
0'61
; r2
= 0.79;
SE =
75 pe
rcen
t
; H
in m
i v
in 10
6m3
.
Acknowledgments
I would like to thank Robert L. Schuster, David C. Froehlich, Robert D. Jarrett, and Julie M. Stewart, U.S. Geological Survey, and Michael Church, University of British Columbia, for excellent constructive reviews of this report.
REFERENCES CITED
Adams, John, 1981, Earthquake-dammed lakes in New Zealand: Geology, v.9, p. 215-219.
Aitkenhead, N., 1960, Observations on the drainage of a glacier-dammedlake in Norway: Journal of Glaciology, v. 3, p. 607-609.
Alden, W. C., 1928, Landslide and flood at Gros Ventre, Wyoming: AmericanInstitute of Mining and Metallurgical Engineers Transactions, v. 76,p. 347-358.
Anonymous, 1923, Failure of Apishapa earth dam in southern Colorado - II:Engineering News-Record, Sept. 13, p. 418-424.
Anonymous, 1925, Undermining causes failure of French Landing Dam:Engineering News-Record, April 30, p. 735-736
Anonymous, 1963, Engineers fear dam won't hold: Engineering News-Record,April 11, p. 22.
Anonymous, 1964, Russians blast through landslide dam: Engineering News- Record, May 7, p. 24.
Anonymous, 1969, Wyoming dam fails: Engineering News-Record, July 17,p. 16.
Aramaki, Shigeo, 1981, The sequence and nature of 1783 eruption of Asamavolcano: in 1981 IAVCEI Symposium, Arc Volcanism, Tokyo and Hakone,Abstracts: Tokyo, Volcanology Society of Japan and InternationalAssociation of Volcanology and Chemistry of the Earth's Interior, p.11-12.
Baecher, G. B., Pate, M. E., and de Neufville, Richard, 1980, Risk of damfailure in benefit-cost analysis: Water Resources Research, v. 16, p.449-456.
Baker, V. R., 1973, Paleohydrology and sedimentology of Lake Missoulaflooding in eastern Washington: Geological Society of AmericanSpecial Paper 144, 79 p.
Barrows, H. K., 1948, Floods, their hydrology and control: New York,McGraw-Hill Book Co., 432 p.
Biswas, A. K., and Chatterjee, Semar, 1971, Dam disasters An assessment:Engineering Journal (Canada), v. 54, no. 3, p. 3-8.
Blachut, S. P. and Ballantyne, C. K., 1976, Ice-dammed lakes--A criticalreview of their nature and behaviour: Hamilton, Ontario, McMasterUniversity Department of Geography Discussion Paper No. 6, 90 p.
Blown, lain, and Church, Michael, 1985, Catastrophic lake drainage withinthe Homathko River basin, British Columbia: Canadian GeotechnicalJournal, v. 22, no. 4, (in press).
Boner, F. C., and Stermitz, Frank, 1967, Floods of June 1964 innorthwestern Montana: U.S. Geological Survey Water-Supply Paper1840-B, 242 p.
48
Brater, E. F., and King, H. W., 1976, Handbook of hydraulics: New York,McGraw-Hill Book Co.
Brua, S. A., 1978, Floods of July 19-20, 1977 in the Johnstown area,western Pennsylvania: U.S. Geological Survey Open-File Report 78-963,62 p.
Carrara, P. E., Mode, W. N., Rubin, Meyer, and Robinson, S. W., 1984,Deglaciation and postglacial timberline in the San Juan Mountains,Colorado: Quaternary Research, v. 21, p. 42-55.
Chen, Y. H., and Simons, D. B., 1979, An experimental study of hydraulicand geomorphic changes in an alluvial channel induced by failure of adam: Water Resources Research, v. 15, p. 1183-1188.
Clague, J. J., and Mathews, W. H., 1973, The magnitude of jokulhlaups:Journal of Glaciology, v. 12, p. 501-504.
Clarke, G. K. C., 1982, Glacier outburst floods from "Hazard Lake", YukonTerritory, and the problem of flood magnitude prediction: Journal ofGlaciology, v. 28, p. 3-21.
Colhoun, E. A., Common, R., and Cruickshank, M. M., 1965, Recent bog flowsand debris slides in the north of Ireland: Scientific Proceedings ofthe Royal Dublin Society, series A, v. 2, no. 10, p. 163-174.
Committee on the Safety of Existing Dams, 1983, Safety of existing dams,evaluation and improvement: Washington, D. C., National AcademyPress, 354 p.
Costa, J. E. and Baker, V. R., 1981, Surficial Geology: Building with theearth: New York, John Wiley and Sons, Inc., 498 p.
Cotton, C. A., 1944, Volcanoes as landscape forms: Christchurch andLondon, Whitcombe and Tombs, 416 p.
Davies, W. E., Bailey, J. F., and Kelly, D. B., 1972, West Virginia'sBuffalo Creek flood A study of the hydrology and engineeringgeology: U.S. Geological Survey Circular 667, 32 p.
Dunne, Thomas, and Fairchild, L. H., 1983, Estimation of flood andsedimentation hazards around Mt. St. Helens: Shin-Sabo (Journal ofJapanese Erosion Control Society) v. 36, p. 12-22.
Eden, W. J., Fletcher, E. B., and Mitchell, R. J., 1971, South Nation Riverlandslide, 16 May 1971: Canadian Geotechnical Journal, v. 8, p. 446-451.
Eisbacher, G. H. and Clague, J. J., 1984, Destructive mass movements inhigh mountains Hazard and management: Geological Survey of CanadaPaper 84-16, 230 p.
Fearnsides, W. G., and Wilcockson, W. H., 1928, A topographical study ofthe flood-swept course of the Porth Llwyd above Dolgarrog:Geographical Journal, v. 72,. p. 401-419.
Field, J. E., 1933, Data on Castlewood Dam failure and flood: EngineeringNews-Record, Sept. 7, p. 279-280.
Finch, R. H., 1937, A tree-ring calendar for dating volcanic events, CinderCove, Lassen National Park, California: American Journal of Science,v. 33, p. 140-146.
Follansbee, Robert, and Jones, E. E., 1922, The Arkansas River flood ofJune 3-5, 1921: U.S. Geological Survey Water Supply Paper 487, 44 p.
Fread, D. L., 1980, DAMBRK The NWS dam-break flood forecasting model:Silver Spring, Maryland, National Weather Service, Office ofHydrology, Maryland, 37 p.
49
Freeman, G.L., and Alsop, R. B., 1941, Underpinning Austin Dam:Engineering News-Record, January 30, 1941, p. 52-57.
Gallino, G. L., and Pierson, T. C., 1984, The 1980 Polallie Creek debrisflow and subsequent dam-break flood, East Fork Hood River basin,Oregon: U.S. Geological Survey Open-File Report 84-578, 37 p.
Glazyrin, G. Ye., and Reyzvikh, V. N., 1968, Computation of the flowhydrograph for the breach of landslide lakes: Soviet Hydrology, no.5, p. 592-496.
Graham, W. J., 1980, Value of inundation maps in dam failure emergencies:Denver, Colorado, U.S. Bureau of Reclamation, unpublished report,12 p.
Graham, W. J., 1983, Dam failure warning effectiveness: Denver, Colorado,U.S. Bureau of Reclamation, unpublished report, 5 p.
Gruner, Edward, 1963, Dam disasters: Proceedings, Institution of CivilEngineers, London, v. 24, p. 47-60.
Gunn, J. P., 1930, The Shyok flood, 1929: The Himalayan Journal, v. 2, p.,35-47.
Haeberli, Wilfried, 1983, Frequency and characteristics of glacier floodsin the Swiss Alps: Annals of Glaciology, v. 4, p. 85-90.
Hagen, V. K., 1982, Re-evaluation of design floods and dam safety: paperpresented at 14th International Commission on Large Dams Congress, Riode Janeiro.
Hanly, T. F., 1964, Sediment studies on the Madison River after the HebgenLake earthquake: U.S. Geological Survey Professional Paper 435-M, p.151-158.
Hartley, J. A., 1981, Boston's great molasses flood: Modern Maturity, v.24, no. 4, p. 16-18.
Hewitt, Kenneth, 1982, Natural dams and outburst floods of the KarakoramHimalaya, in Glen, J. W., ed., Hydrological aspects of alpine andhigh-mountain areas: International Association of HydrologicalSciences Publication 138, p. 259-269.
Hildreth, Wes, 1983, The compositionally zoned eruption of 1912 in theValley of Ten Thousand Smokes, Katmai National Park, Alaska: Journalof Volcanology and Geothermal Research, v. 18, p. 1-56.
Hutchinson, G. E., 1957, A treatise on limnology; vol. 1: New York, JohnWiley & Sons, 1015 p.
International Commission on Large Dams, 1973, Lessons from dam incidents:Boston, Massachusetts, Abridged edition, U.S. Commission on LargeDams.
Investigation Team of the Zepozhu Landslide-dammed River, 1967a,Investigation Report of the Zepozhu landslide-dammed lake, Dong River,Xichang County, Sichuan Province, unpublished report, 18 p. (inChinese).
Investigation Team of the Tanggudang Landslide Dam, 1967b, An investigationreport on the Landslide dam of Tanggudang on the Yalong River,unpublished report, Chinese Science Committee, Chengdu, 34 p. (inChinese).
Jansen, R. B., 1980, Dams and public safety: Denver, Colorado, U.S.Department of the Interior, Bureau of Reclamation, Denver, Colorado,332 p.
50
Jarrett, R. D. and Costa, J. E., 1985, Hydrology, geomorphology, and dam- break modeling of the July 15, 1982 Lawn Lake Dam and Cascade Lake Dam failures, Larimer County, Colorado: U.S. Geological Survey Open-File Report 84-612, 109 p.
Jennings, M. E., Schneider, V. R., and Smith, P. E., 1981, Computer assessments of potential flood hazards from breaching of two debris dams, Toutle River and Cowlitz River systems, in Lipman, P. W. and Mullineaux, D. R., eds., The 1980 eruption of Mount St. Helens, Washington, U.S. Geological Survey Professional Paper 1250, p. 829- 836.
Jessup, W. E., 1964, Baldwin Hills Dam failure: Civil Engineering, v. 34, p. 60-62.
Johnson, F. A., and Illes, P., 1976, A classification of dam failures: International Water Power and Dam Construction, Dec., p. 43-45.
Keefer, D. K., 1984, Landslides caused by earthquakes: Geological Society of America Bulletin, v. 95, p. 406-421.
Kiersch, G. A., 1964, The Vaiont River disaster: Civil Engineering, v. 34, p. 32-39.
Kirkpatrick, G. W., 1977, Evaluation guidelines for spillway adequacy, in The Evaluation of Dam Safety, .Engineering Foundation Conference, Pacific Grove, California, Proceedings: New York, American Society of Civil Engineers, p. 395-414.
Knight, D. K. , and Bennett, P.T., 1960, Stability of slide dam and recommendations on development of overflow spillway: in Report on Flood Emergency, Madison River Slide, Appendix VI: Riverdale, North Dakota, U.S. Army Corps of Engineers, 5 p.
Lamke, R. D., 1972, Floods of the summer of 1971 in south-central Alaska: U.S. Geological Survey Open-File Report, 88 p.
Land, L. F., 1980a, Evaluation of selected dam-break floodwave models by using field data: U.S. Geological Survey Water-Resources Investigations 80-44, 54 p.
Land, L. F., 1980b, Mathematical simulations of the Toccoa Falls, Georgia, dam-break flood: Water Resources Bulletin, v. 16, p. 1041-1048.
Lane, F. W., 1965, The elements rage: Philadelphia and New York, Chilton Books, p. 165.
Lee, K. L., and Duncan, J.M., 1975, Landslide of April 25, 1974 on the Mantaro River, Peru: Washington, D.C., National Academy of Sciences, 72 p.
Li Gong-Shou and Hu Tis-Fu, 1982, The activity and taming of Zhouqu landslide-earthflow, in Landslides and Mudflows, Reports of Alma-Ata International Seminar, Centre of International Projects, GKNT, Moscow, p. 466-470.
Lliboutry, Louis, Arnao, B. M., Pautre, Andre, and Schneider, Bernard, 1977, Glaciological problems set by the control of dangerous lakes in Cordillera Blanca, Peru. I. Historical failures of morainic dams, their causes and prevention: Journal of Glaciology, v. 18, p. 239-254,
Lubbock, Guy, 1894, The Gohna Lake: Geographical Journal, v. 4, p. 457.MacDonald, T. C., and Langridge-Monopolis, Jennifer, 1984, Breaching
characteristics of dam failures: Journal of Hydraulic Engineering, v. 110, no. 5, p. 567-586.
51
Mark, R.K., and Stuart-Alexander, D. E., 1977, Disasters as a necessarypart of benefit-cost analyses: Science, v. 197, p. 1160-1162.
Mason, Kenneth, 1929, Indus floods and Shyok glaciers: Himalayan Journal,v. 1, p. 10-29.
Mathews, W. H., 1965, Two self-dumping ice-dammed lakes in BritishColumbia: Geographical Review, v. 55, p. 46-52.
Mathews, W. H., 1973, Record of two jokulhlaups: International Associationof Scientific Hydrology Publication 95, p. 99-110.
McMahon, G. F., 1981, Developing dam-break flood zone ordinance: AmericanSociety of Civil Engineers, Journal of the Water Resources Division,v. 107, no. WR 2, p. 461-476.
Meier, M. F., Carpenter, P. J., and Janda, R. J., 1981, Hydrologic effectsof Mount St. Helen's 1980 eruption: EOS, v. 62, p. 625-626.
Morrison, R. E., 1982, United States dams-statistical data:Association of Engineering Geologists Newsletter, v. 25, p. 19-21.
Nairn, I. A., Wood, C. P., and Hewson, C. A. Y., 1979, Phreatic eruptionsof Ruapehu--Apri1 1975: New Zealand Journal of Geology andGeophysics, v. 22, p. 155-173.
Nash, D. F. T., Brunsden, D. K., Hughes, R. E., Jones, D. K. C., andWhalley, B. F., 1985, A catastrophic debris flow near Gupis, northernareas, Pakistan: International Conference on Soil Mechanics andFoundation Engineering, llth, San Francisco, 1985, Proceedings,4 p.
Nye, J. F., 1976, Water flow in glaciers Jokulhlaups, tunnels, and veins:Journal of Glaciology, v. 17, p. 181-207.
Office of the State Engineer, 1913-1914, Ninth biennial report of StateEngineer: Salt Lake City, Utah, 343 p.
Outland, C. F., 1977, Man-made disaster--The story of St. Francis Dam:Glendale, California, Arthur H. Clark Co., 275 p.
Pacific Gas and Electric Company, 1983, Description of the environmentaffected by the Lost Canyon pipe failure: San Francisco, 108 p.
Petrascheck, A. W., and Sydler, P. A., 1984, Routing of dam break floods:International Water Power and Dam Construction, v. 36, p. 29-32.
Post, Austin, and Mayo, L. R., 1971, Glacier dammed lakes and outburstfloods in Alaska: U.S. Geological Survey Hydrologic InvestigationsAtlas HA-455, 10 p.
Price, J. T., Lowe, G. W., and Garrison, J. M., 1977, Unsteady flowmodeling of dam-break waves, in Dam-Break Flood Routing ModelWorkshop, Bethesda, Maryland, 1977, Proceedings: U.S. Water ResourcesCouncil, Hydrology Committee, available only from National TechnicalInformation Service, Springfield, Virginia, PB-275-437.
Ray, H. A., and Kjelstrom, L. C., 1978, The flood in southeastern Idahofrom the Teton Dam failure of June 5, 1976: U.S. Geological SurveyOpen-File Report 77-765, 48 p.
Ritter, A., 1892, Die fortpflanzung der wasserwellen: Zeitschrift desVereines Deutscher Ingenieure, v. 36, no. 33, p. 947-954.
Rose, Don, 1978, Risk of catastrophic failure of major dams: AmericanSociety of Civil Engineers, Journal of the Hydraulics Division, v.104, no. HY9, p. 1349-1351.
Rostvedt, J. 0., and others, 1968, Summary of floods in the United Statesduring 1963: U.S. Geological Survey Water Supply Paper 1830-B, p.B84-B86.
52
Sager, J. W., Griffiths, J. B., and Fargo, N. J., 1984, Spirit Lake outlettunnel: National Research Council, Tunneling Technology Newsletter,no. 48, p. 1-5.
Sanders, C. L., and Sauer, V. B., 1979, Kelly Barnes Dam flood of November6, 1977, near Toccoa, Georgia: U.S. Geological Survey HydrologicInvestigations Atlas HA-613, 2 sheets.
Schumm, S. A., 1969, River metamorphosis: American Society of CivilEngineers, Journal of the Hydraulics Division, v. 95, no. HY 1, p.255-273.
Schuster, R. L., 1984, Effects of landslides and mudflows associated withthe May 1980 eruption of Mount St. Helens, northwestern U.S.A.:Journal of Japan Landslide Society, v. 21, p. 1-10.
Schuster, R. L., 1985, Landslide dams in the western United States:International Conference and Field Workshop on Landslides, IV, Tokyo1985, Proceedings, 8 p.
Scott, K. M., and Gravlee, G.C., Jr., 1968, Flood surge on the RubiconRiver, California Hydrology, hydraulics, and boulder transport:U.S. Geological Survey Professional Paper 422-M, 40 p.
Scott, K. M., and Janda, R. J., 1982, Preliminary map of lahar inundationduring the Pine Creek eruptive period in the Toutle-Cowlitz Riversystem, Mount St. Helens, Washington: U.S. Geological Survey Water- Resources Investigations Report 82-4067.
Silva, L., Cocheme, J. J., Canul, R., Duffield, W. A., and Tilling, R. I.,1982, El Chichon volcano: Washington, D. C., Scientific Event AlertNetwork (SEAN) Bulletin, v. 7, no. 5, p. 2-6.
Snow, D. T., 1964, Landslide of Cerro Condor-Sencea, Department ofAyacucho, Peru, in G. A. Kiersch, ed., Engineering Geology CaseHistories No. 5: Geological Society of America, p. 1-6.
Soil Conservation Service, 1981, Simplified dam-breach routing procedure:U. S. Department of Agriculture, Technical Release 66, Washington,D.C., 25 p. plus appendix.
Stermitz, Frank, 1964, Effects of the Hebgen Lake earthquake on surfacewater: U.S. Geological Survey Professional Paper 435-L, p. 139-150.
Stone, K. H., 1963, The annual emptying of Lake George, Alaska: Arctic,v. 16, p. 26-40.
Strachey, R., 1894, The landslip at Gohna, in British Garwhal:Geographical Journal, v. 4, p. 162-170.
Swanson, F. J., Graham, R. L., and Grant, G. E., 1985, Some effects ofslope movements on river channels, in International Symposium onErosion, Debris flow, and Disaster Prevention, Tsukuba, 1985,Proceedings: Tsukuba, Japan,Erosion Control Engineering Society ofJapan, 6 p.
Swift, C. H., and Kresch, D. L., 1983, Mudflow hazards along the Toutle andCowlitz Rivers from a hypothetical failure of Spirit Lake blockage:U.S. Geological Survey Water-Resources Investigations Report 82-4125,10 p.
Thorarinsson, Sigurdur, 1953, Some new aspects of the Grimsvotn problem:Journal of Glaciology, v. 2, p. 267-275.
Thorarinsson, Sigurdur, 1957, The jokulhlaup from the Katla area in 1955compared with other jokulhlaups in Iceland: Reykjavik, Museum ofNatural History Miscellaneous Papers No., 18, p. 21-25.
53
Tufuell, Lance, 1984, Glacier hazards: London, Longman, 97 p.U.S. Bureau of Reclamation, 1982, Ertan hydroelectric project: Denver,
Report of U.S. Bureau of Reclamation Team visit to Peoples Republicof China.
Watters, R. J., 1983, A landslide induced waterflood-debris flow: Bulletinof the International Association of Engineering Geology, v. 28, p.177-182.
Wetmore, J. N., and Fread, D. L., 1981, The NWS simplified dam-break floodforecasting model: Canadian Hydrotechnical Conference, 5th,Fredericton, Canada, 1981, Proceedings, 24 p.
Young, G. J., 1980, Monitoring glacier outburst floods: Nordic Hydrology,v. 11, p. 285-300.
Zen, M. T. and Hadikusumo, D., 1965, The future danger of Mount Kelut(eastern Java-Indonesia): Bulletin of Volcanologie, v. 28, p. 275-282.
54
U.S. GOVERNMENT PRINTING OFFICE' 1985 676-913/45050 REGION NO. 8