Sector-Level Productivity, Structural Change, and ... · Sector-Level Productivity, Structural...
32
Sector-Level Productivity, Structural Change, and Rebalancing in China Malhar Nabar and Kai Yan
Transcript of Sector-Level Productivity, Structural Change, and ... · Sector-Level Productivity, Structural...

Sector-Level Productivity, Structural Change, and Rebalancing in China
Malhar Nabar and Kai Yan
© 2013 International Monetary Fund WP/13/240
IMF Working Paper
Asia and Pacific Department
Sector-Level Productivity, Structural Change, and Rebalancing in China
Prepared by Malhar Nabar and Kai Yan1
Authorized for distribution by Steven Barnett
November 2013
Abstract
This paper studies structural changes underlying China's remarkable and unprecedented growth in recent years. While patterns of structural transformation across China's provinces are broadly in line with international experience, one important difference is in labor productivity differentials between services and the rest of the economy. Specifically, the gap between labor productivity in the rest of the economy and services has widened across China's provinces as they have moved from low to middle income, which is contrary to the trend observed in cross-country experience. Evidence from a panel of China's provinces suggests that credit and labor market frictions have inhibited labor productivity growth in services relatively more than in the rest of the economy. Reducing these frictions is essential for achieving the next stage of China's development, one in which the service sector will need to play a more prominent role as an engine of growth. The evidence also suggests that improving labor productivity in services will lift the consumption share of GDP, thereby advancing the needed rebalancing of domestic demand in China.
JEL Classification Numbers: E22, O11, O53
Keywords: China, structural change, service sector, productivity
Author’s E-Mail Address: [email protected]; [email protected] 1 Kai Yan is a PhD student in economics at Yale. This paper was completed during his 2013 summer internship in the Asia and Pacific Department. The authors are grateful to Alla Myrvoda and Lesa Yee for outstanding assistance. The paper has benefited from helpful comments and discussions with Steve Barnett, Nigel Chalk, Hoe Ee Khor, Andre Meier, Markus Rodlauer, Chikahisa Sumi, Papa N’Diaye, Rachel van Elkan, and seminar participants at the IMF’s Asia and Pacific Department. The authors bear all responsibility for remaining errors.
This Working Paper should not be reported as representing the views of the IMF. The views expressed in this Working Paper are those of the author(s) and do not necessarily represent those of the IMF or IMF policy. Working Papers describe research in progress by the author(s) and are published to elicit comments and to further debate.
2
Contents Page
I. Introduction ............................................................................................................................4
II. Structural Change: The Development Experience of China’s Provinces in Light of Cross-Country Trends .......................................................................................................4
A. OECD Economies ............................................................................................................7 B. Upper Middle-Income Countries ......................................................................................8 C. Asian Economies ..............................................................................................................9 D. China’s Provinces .............................................................................................................9 E. Manufacturing and Service Productivity Among Chinese Provinces ............................11
III. The Influence of Macro Policy Initiatives on the Relative Efficiency of the Service Sector ..............................................................................................................................14
A. Relative Efficiency of the Service Sector: The Role of Policy Levers ................................15 B. Service Sector Productivity ............................................................................................16 C. Service Sector Employment Ratio..................................................................................18
IV. The Role of Factor Market Frictions .................................................................................19 A. Proxies for Labor and Credit Market Frictions .............................................................19 B. Factor Market Frictions versus Macro Policies.................................................................21
V. From Eliminating Factor Market Frictions to Rebalancing Demand .................................25
VI. Summary ............................................................................................................................27
References ................................................................................................................................31 Tables 1. Policy Initiatives and Relative Efficiency of Service Sector ...............................................15 2. Policy Initiatives and Service Sector Productivity ...............................................................17 3. Policy Initiatives and the Service Sector Employment Ratio ..............................................18 4. Factor Market Frictions and Relative Efficiency of the Service ..........................................22 5. Factor Market Frictions and Service Sector Productivity ....................................................23 6. Factor Market Frictions and the Service Sector Employment Ratio ...................................24 7. Relative Efficiency of the Service Sector and Consumption Share of Services ..................26 8. Service Sector Productivity and Service Consumption Level .............................................27 Figures 1. OECD .....................................................................................................................................7 2. Upper Middle Income Countries ...........................................................................................8 3. Asia ........................................................................................................................................9 4. China ....................................................................................................................................10 5. Manufacturing and Service Sector Productivity ..................................................................12 6. China’s Provinces—Sector-Level Productivity Differentials ..............................................13 7. Interest Rate Spread .............................................................................................................21

3
Appendix ..................................................................................................................................28 Appendix Tables 1. Policy Initiatives and Urban-Rural Income Gap ..................................................................28 2. Policy Initiatives and Interest Rate Distortions ...................................................................29
4
I. INTRODUCTION
Three decades into China’s remarkable economic transformation, the service sector has become the most important part of the economy in terms of employment and is only marginally lower than the secondary sector in terms of value added. This is an important marker in China’s ongoing historic growth performance, which has already lifted some 500 million people out of poverty at an unprecedented pace. The shift to a services-based economy represents a natural transition toward the next phase of China’s economic development, and is essential for sustaining the economy’s convergence to the level of high income economies.2 While substantial progress has been made in this regard, China’s service sector still remains relatively underdeveloped compared to other economies at the same level of GDP per capita. Understanding the sources of service sector under-development in China is therefore important for gaining perspective on the measures needed for smoothly transitioning to the next stage of the country’s economic transformation. Against this backdrop, this paper documents and analyzes aspects of structural change in China with an emphasis on the service sector share of GDP and the transition from manufacturing to services. While patterns of structural transformation across China’s provinces are broadly in line with international experience—albeit they have occurred at an accelerated pace—one important aspect along which China stands out is the evolution of sector-level productivity differentials. Specifically, as Section II illustrates, the gap between labor productivity in services and the rest of the economy has widened across China's provinces as they have moved from low to middle income, which is contrary to the trend observed in cross-country experience. Evidence from a panel of China's provinces—presented in Sections III and IV—suggests that credit and labor market frictions have inhibited labor productivity growth in services relatively more than in other parts of the economy. Reducing and ultimately eliminating the factor market frictions is essential for achieving the next stage of China’s development. The evidence also suggests that improving labor productivity in services will lift the consumption share of GDP (Section V), thereby advancing the needed rebalancing of domestic demand in China. Based on the patterns in the data, Section VI draws together the main policy conclusions.
II. STRUCTURAL CHANGE: THE DEVELOPMENT EXPERIENCE OF CHINA’S PROVINCES IN
LIGHT OF CROSS-COUNTRY TRENDS
Economic growth and sustained increases in income per capita are typically accompanied by vast changes in allocation of factor inputs across sectors, occupational choices, residential location decisions, and spending patterns. A simple, shorthand way of summarizing these changes is through shifts in the sector shares of GDP as income per capita rises. Typically, the process moves through three main stages—at low levels of income per capita, the primary sector
2 Nabar and N’Diaye (2013).
5
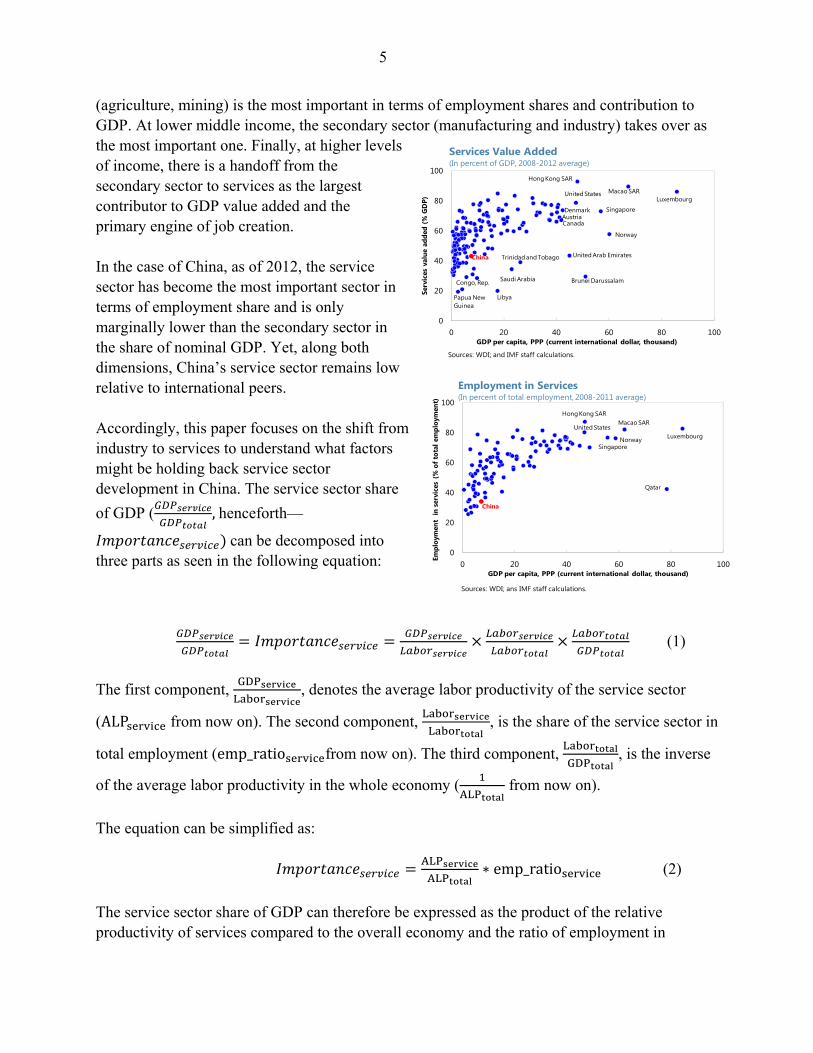
(agriculture, mining) is the most important in terms of employment shares and contribution to GDP. At lower middle income, the secondary sector (manufacturing and industry) takes over as the most important one. Finally, at higher levels of income, there is a handoff from the secondary sector to services as the largest contributor to GDP value added and the primary engine of job creation. In the case of China, as of 2012, the service sector has become the most important sector in terms of employment share and is only marginally lower than the secondary sector in the share of nominal GDP. Yet, along both dimensions, China’s service sector remains low relative to international peers. Accordingly, this paper focuses on the shift from industry to services to understand what factors might be holding back service sector development in China. The service sector share
of GDP ( ,henceforth—
can be decomposed into three parts as seen in the following equation:
(1)
The first component, , denotes the average labor productivity of the service sector
(ALP from now on). The second component, , is the share of the service sector in
total employment (emp_ratio from now on). The third component, , is the inverse
of the average labor productivity in the whole economy ( from now on).
The equation can be simplified as:
∗ emp_ratio (2)
The service sector share of GDP can therefore be expressed as the product of the relative productivity of services compared to the overall economy and the ratio of employment in
0
20
40
60
80
100
0 20 40 60 80 100
Empl
oym
ent
in s
ervi
ces
(% o
f tot
al e
mpl
oym
ent)
GDP per capita, PPP (current international dollar, thousand)
Employment in Services(In percent of total employment, 2008-2011 average)
Hong Kong SARMacao SAR
LuxembourgNorwaySingapore
Qatar
China
United States
Sources: WDI; ans IMF staff calculations.
0
20
40
60
80
100
0 20 40 60 80 100
Serv
ices
val
ue a
dded
(%
GD
P)
GDP per capita, PPP (current international dollar, thousand)
Services Value Added (In percent of GDP, 2008-2012 average)
Hong Kong SAR
Macao SARLuxembourg
Norway
Singapore
United Arab Emirates
Brunei Darussalam
Libya
Saudi Arabia
Trinidad and Tobago
Papua New Guinea
Congo, Rep.
China
United States
CanadaAustriaDenmark
Sources: WDI; and IMF staff calculations.
6
services. The first term measures the relative efficiency of the service sector. The second term measures the relative scale of the service sector. Decomposing the service sector share of GDP into these two terms allows for a distinction between efficiency and scale, and permits a cross-country comparison along these two dimensions of service sector development.
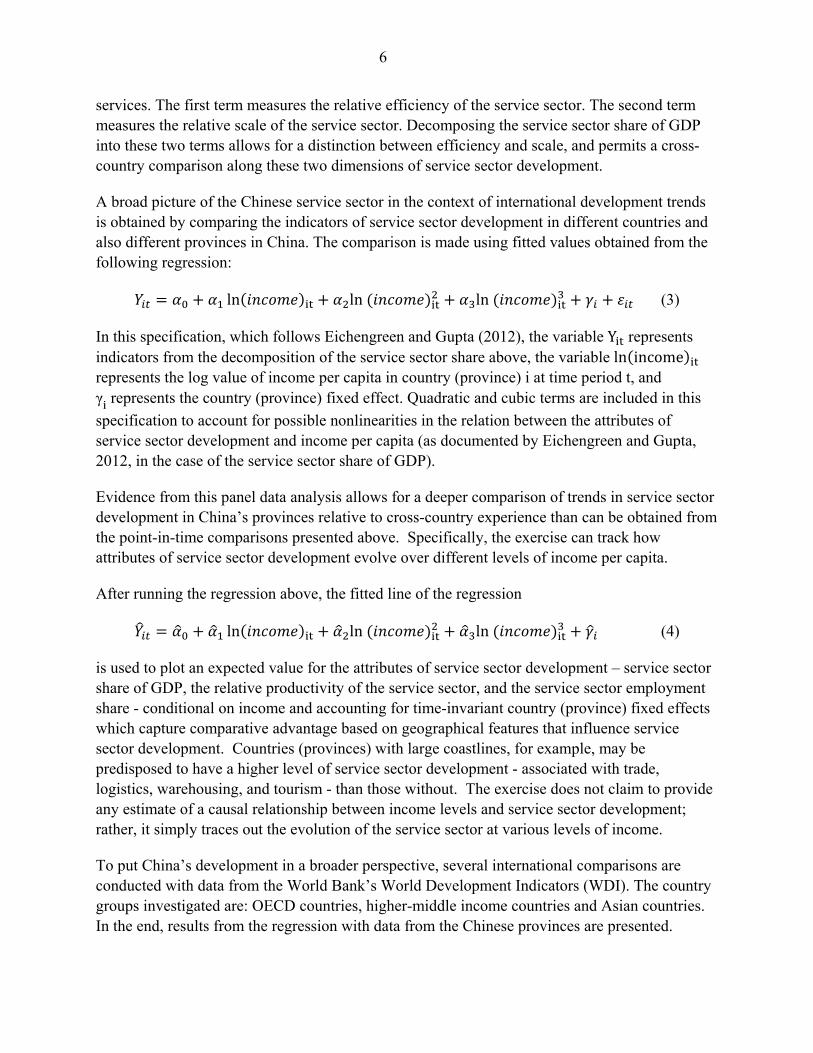
A broad picture of the Chinese service sector in the context of international development trends is obtained by comparing the indicators of service sector development in different countries and also different provinces in China. The comparison is made using fitted values obtained from the following regression:
ln ln ln (3)
In this specification, which follows Eichengreen and Gupta (2012), the variable Y represents indicators from the decomposition of the service sector share above, the variable ln income represents the log value of income per capita in country (province) i at time period t, and γ represents the country (province) fixed effect. Quadratic and cubic terms are included in this
specification to account for possible nonlinearities in the relation between the attributes of service sector development and income per capita (as documented by Eichengreen and Gupta, 2012, in the case of the service sector share of GDP).
Evidence from this panel data analysis allows for a deeper comparison of trends in service sector development in China’s provinces relative to cross-country experience than can be obtained from the point-in-time comparisons presented above. Specifically, the exercise can track how attributes of service sector development evolve over different levels of income per capita.
After running the regression above, the fitted line of the regression
ln ln ln (4)
is used to plot an expected value for the attributes of service sector development – service sector share of GDP, the relative productivity of the service sector, and the service sector employment share - conditional on income and accounting for time-invariant country (province) fixed effects which capture comparative advantage based on geographical features that influence service sector development. Countries (provinces) with large coastlines, for example, may be predisposed to have a higher level of service sector development - associated with trade, logistics, warehousing, and tourism - than those without. The exercise does not claim to provide any estimate of a causal relationship between income levels and service sector development; rather, it simply traces out the evolution of the service sector at various levels of income.
To put China’s development in a broader perspective, several international comparisons are conducted with data from the World Bank’s World Development Indicators (WDI). The country groups investigated are: OECD countries, higher-middle income countries and Asian countries. In the end, results from the regression with data from the Chinese provinces are presented.
7
A. OECD Economies
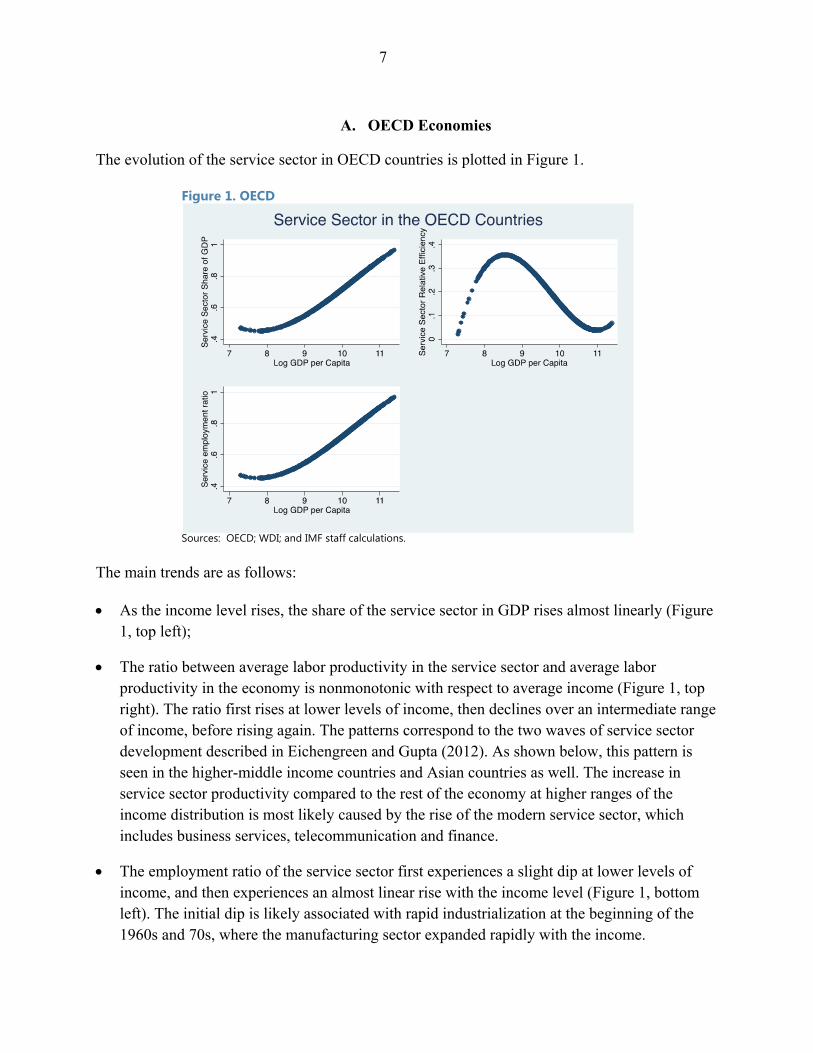
The evolution of the service sector in OECD countries is plotted in Figure 1.
Figure 1. OECD
Sources: OECD; WDI; and IMF staff calculations.
The main trends are as follows: As the income level rises, the share of the service sector in GDP rises almost linearly (Figure
1, top left);
The ratio between average labor productivity in the service sector and average labor productivity in the economy is nonmonotonic with respect to average income (Figure 1, top right). The ratio first rises at lower levels of income, then declines over an intermediate range of income, before rising again. The patterns correspond to the two waves of service sector development described in Eichengreen and Gupta (2012). As shown below, this pattern is seen in the higher-middle income countries and Asian countries as well. The increase in service sector productivity compared to the rest of the economy at higher ranges of the income distribution is most likely caused by the rise of the modern service sector, which includes business services, telecommunication and finance.
The employment ratio of the service sector first experiences a slight dip at lower levels of income, and then experiences an almost linear rise with the income level (Figure 1, bottom left). The initial dip is likely associated with rapid industrialization at the beginning of the 1960s and 70s, where the manufacturing sector expanded rapidly with the income.
8
B. Upper Middle-Income Countries
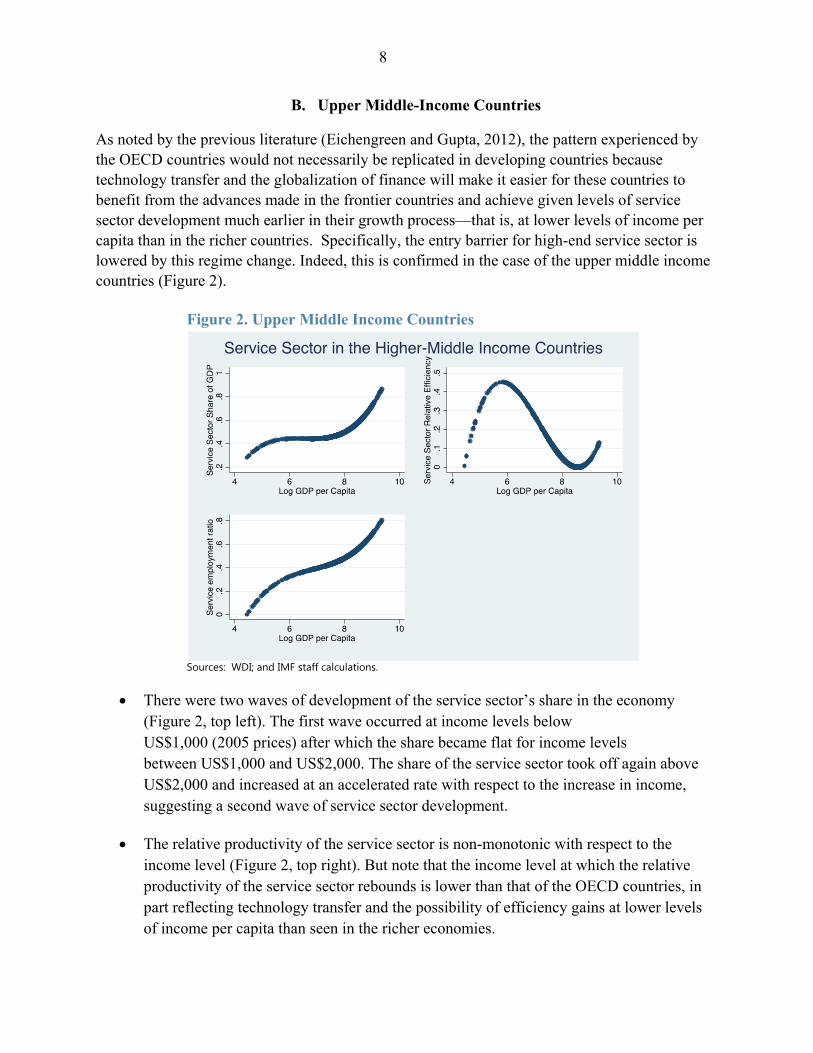
As noted by the previous literature (Eichengreen and Gupta, 2012), the pattern experienced by the OECD countries would not necessarily be replicated in developing countries because technology transfer and the globalization of finance will make it easier for these countries to benefit from the advances made in the frontier countries and achieve given levels of service sector development much earlier in their growth process—that is, at lower levels of income per capita than in the richer countries. Specifically, the entry barrier for high-end service sector is lowered by this regime change. Indeed, this is confirmed in the case of the upper middle income countries (Figure 2).
Figure 2. Upper Middle Income Countries
Sources: WDI; and IMF staff calculations.
There were two waves of development of the service sector’s share in the economy (Figure 2, top left). The first wave occurred at income levels below US$1,000 (2005 prices) after which the share became flat for income levels between US$1,000 and US$2,000. The share of the service sector took off again above US$2,000 and increased at an accelerated rate with respect to the increase in income, suggesting a second wave of service sector development.
The relative productivity of the service sector is non-monotonic with respect to the income level (Figure 2, top right). But note that the income level at which the relative productivity of the service sector rebounds is lower than that of the OECD countries, in part reflecting technology transfer and the possibility of efficiency gains at lower levels of income per capita than seen in the richer economies.
9
The employment ratio increases monotonically with income, which is similar to what happened in the OECD countries (Figure 2, bottom left).
C. Asian Economies
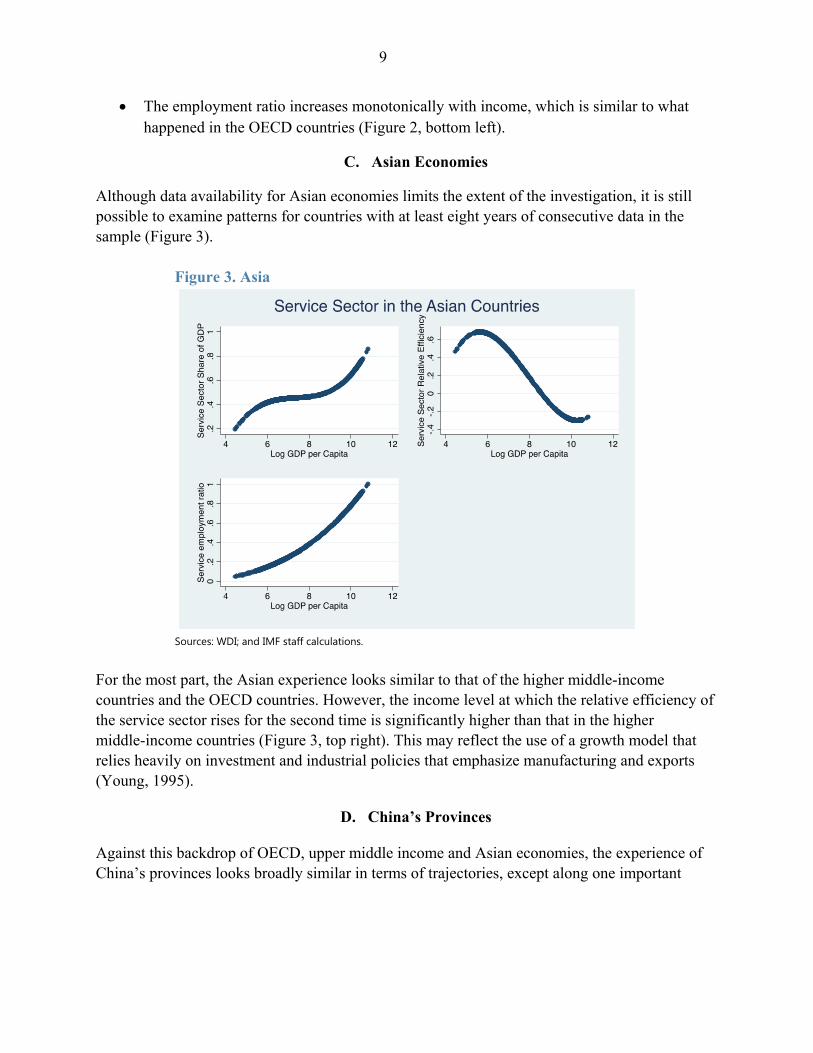
Although data availability for Asian economies limits the extent of the investigation, it is still possible to examine patterns for countries with at least eight years of consecutive data in the sample (Figure 3).
Figure 3. Asia
Sources: WDI; and IMF staff calculations.
For the most part, the Asian experience looks similar to that of the higher middle-income countries and the OECD countries. However, the income level at which the relative efficiency of the service sector rises for the second time is significantly higher than that in the higher middle-income countries (Figure 3, top right). This may reflect the use of a growth model that relies heavily on investment and industrial policies that emphasize manufacturing and exports (Young, 1995).
D. China’s Provinces
Against this backdrop of OECD, upper middle income and Asian economies, the experience of China’s provinces looks broadly similar in terms of trajectories, except along one important
10
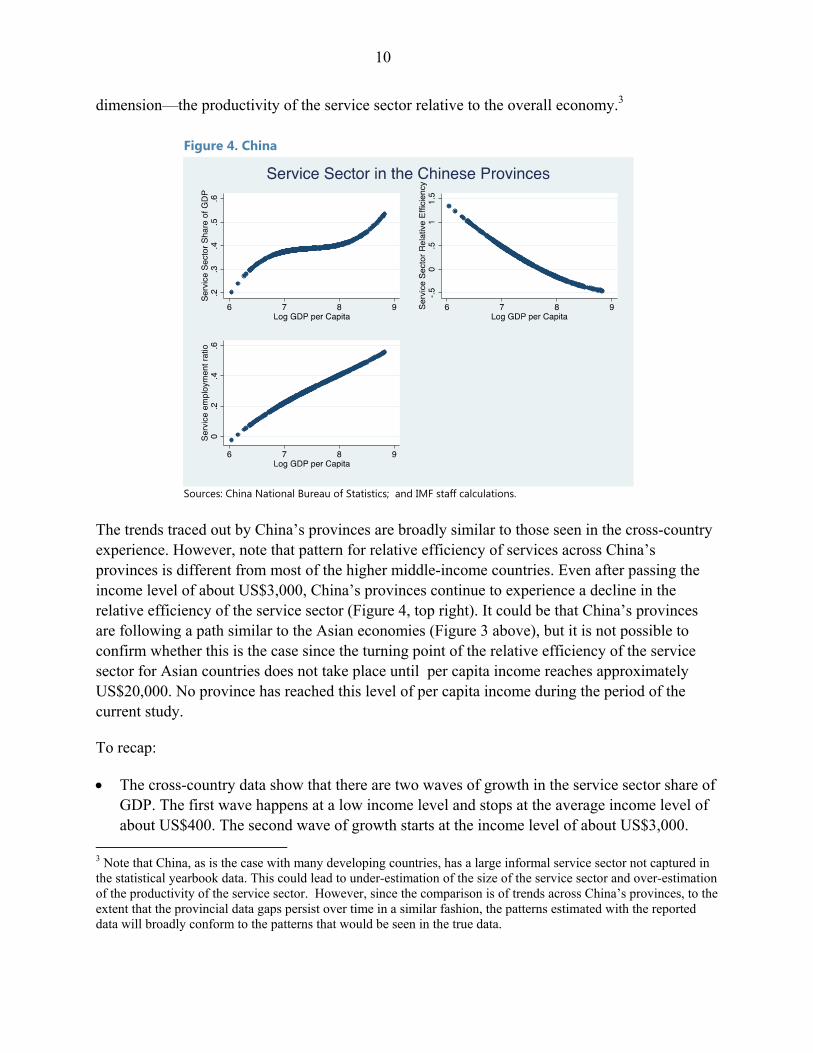
dimension—the productivity of the service sector relative to the overall economy.3
Figure 4. China
Sources: China National Bureau of Statistics; and IMF staff calculations.
The trends traced out by China’s provinces are broadly similar to those seen in the cross-country experience. However, note that pattern for relative efficiency of services across China’s provinces is different from most of the higher middle-income countries. Even after passing the income level of about US$3,000, China’s provinces continue to experience a decline in the relative efficiency of the service sector (Figure 4, top right). It could be that China’s provinces are following a path similar to the Asian economies (Figure 3 above), but it is not possible to confirm whether this is the case since the turning point of the relative efficiency of the service sector for Asian countries does not take place until per capita income reaches approximately US$20,000. No province has reached this level of per capita income during the period of the current study.
To recap:
The cross-country data show that there are two waves of growth in the service sector share of GDP. The first wave happens at a low income level and stops at the average income level of about US$400. The second wave of growth starts at the income level of about US$3,000.
3 Note that China, as is the case with many developing countries, has a large informal service sector not captured in the statistical yearbook data. This could lead to under-estimation of the size of the service sector and over-estimation of the productivity of the service sector. However, since the comparison is of trends across China’s provinces, to the extent that the provincial data gaps persist over time in a similar fashion, the patterns estimated with the reported data will broadly conform to the patterns that would be seen in the true data.
11
This pattern is present in the middle income countries, the higher-middle income countries, the Asian countries and also among China’s provinces.
The employment share rises monotonically as the income level grows. This pattern is also prevalent in all four data samples studied.
The relative efficiency of the service sector differs vastly across China’s provinces compared to other samples. Across OECD, upper middle income countries, and Asian economies, there are two waves of increase in the average labor productivity in the service sector. In OECD countries, the first wave of increase started at a low income level and stopped at about US$5,000 average income. The second wave of increase started at about US$59,000. In the higher-middle income countries, the second wave of increase started at a much lower level (about US$8,000). This pattern is more pronounced if the middle-income countries are included. The Asian countries however experienced a much higher income threshold for the second wave of growth in the relative productivity of the service sector. This in part reflects the use of a growth model heavily reliant on investment and exports.
In contrast to the other three samples, the relative level of service sector productivity among China’s provinces decreases monotonically with per capita income.
Since China’s provinces appear to differ from the other countries’ development experience along the dimension of the relative efficiency of the service sector, the analysis presented below
focuses mainly on this ratio ( . Results are subsequently presented for the employment
ratio in services.
E. Manufacturing and Service Productivity among Chinese Provinces
Looking more closely at the dynamics of the relative efficiency of the service sector, it appears that the main reason behind the decline in this ratio across China’s provinces is the fall in the ratio of labor productivity in services relative to manufacturing as income increases. Moreover, it is the rapid growth of manufacturing productivity and the slow growth of service sector productivity that appears to generate the patterns seen across China’s provinces.
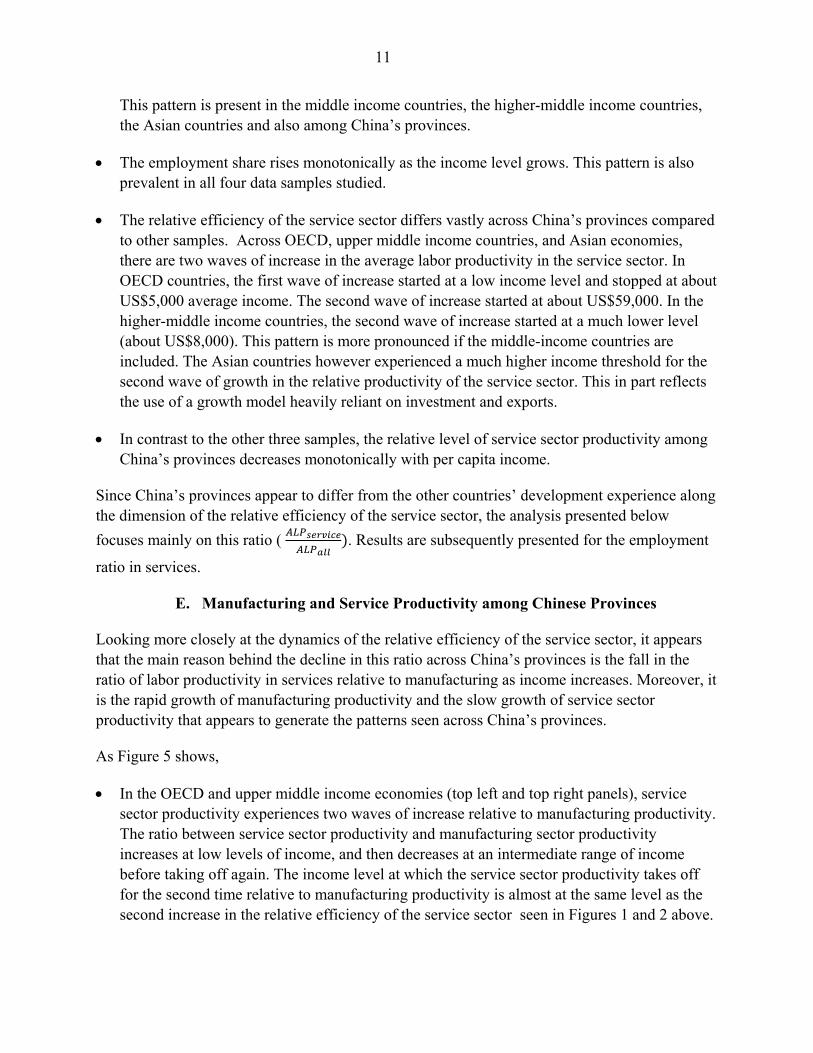
As Figure 5 shows,
In the OECD and upper middle income economies (top left and top right panels), service sector productivity experiences two waves of increase relative to manufacturing productivity. The ratio between service sector productivity and manufacturing sector productivity increases at low levels of income, and then decreases at an intermediate range of income before taking off again. The income level at which the service sector productivity takes off for the second time relative to manufacturing productivity is almost at the same level as the second increase in the relative efficiency of the service sector seen in Figures 1 and 2 above.
12
In Asian economies and China’s provinces (bottom left and bottom right panels), the ratio of service sector productivity to manufacturing productivity behaves differently compared to OECD and higher-middle income countries. In the Asian economies, the ratio traces out an inverse U-shape. In China’s provinces, the ratio declines monotonically as income rises. For Asian economies and China’s provinces, the ratio does not experience an increase once the economies cross the intermediate range of income, as is the case with OECD and upper middle income economies.
Figure 5. Manufacturing and Service Sector Productivity
Sources: OECD; WDI; China National Bureau of Statistics; and IMF staff calculations.
Notes: Top left—OECD; top right—upper middle income; bottom left—Asia; bottom right—China.
Across China’s provinces, the decline in the ratio is driven by the rapid increase in manufacturing productivity compared with that of service sector productivity. This is the case at all levels of provincial income, as seen in the experiences of Shanghai, Sichuan, and Guizhou—at the upper end, median, and lower end of the distribution.
-1-.
50
.51
Pro
duct
ivity
: Ser
vice
v.s
. Man
ufac
turi
ng
7 8 9 10 11Log GDP per Capita
-1.5
-1-.
50
Pro
duct
ivity
: Ser
vice
v.s
. Man
ufac
turi
ng
4 6 8 10Log GDP per Capita
-1-.
50
.5
Pro
duct
ivity
: Ser
vice
v.s
. Man
ufac
turi
ng
4 6 8 10 12Log GDP per Capita
-1-.
50
.5
Pro
duct
ivity
: Ser
vice
v.s
. Man
ufac
turi
ng
6 7 8 9Log GDP per Capita
The Gap Between Manufacturing and Service Sector Productivity
13
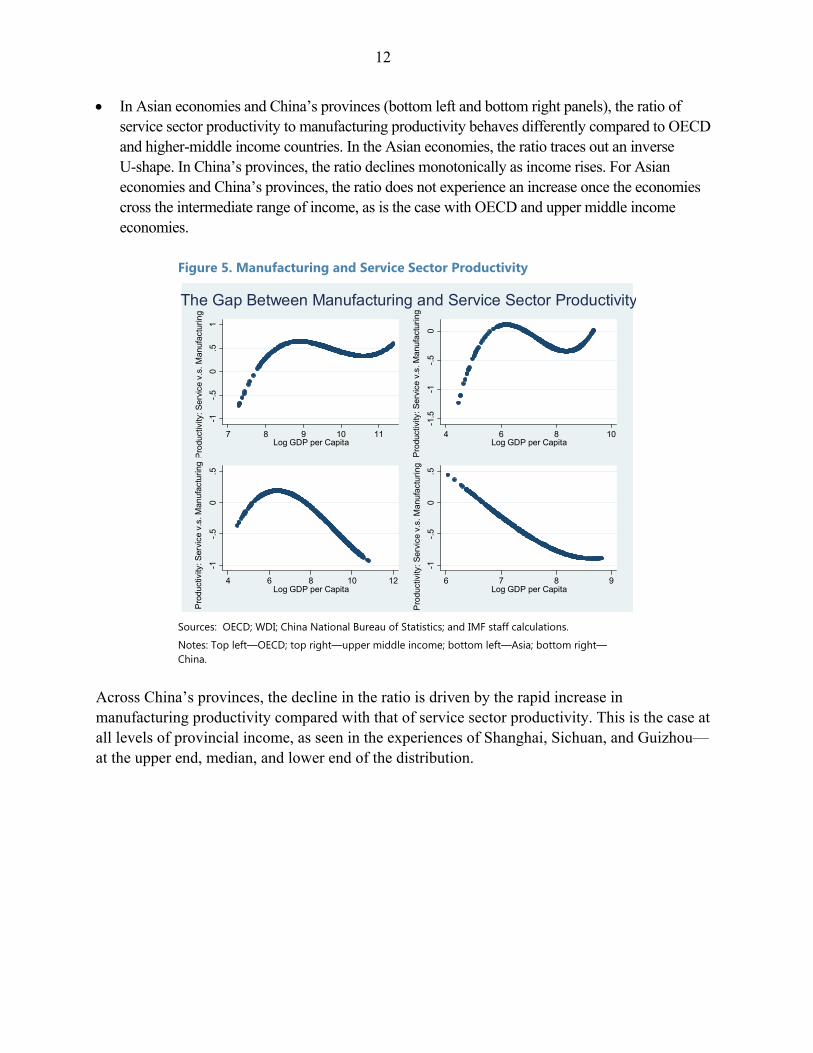
Figure 6. China’s Provinces—Sector-Level Productivity Differentials
Sources: China National Bureau of Statistics; and IMF staff calculations.
The growth experience of China’s provinces features rapid growth in the manufacturing sector, intermediate service sector growth, and low agricultural sector growth. As a result, the productivity ratio between the service sector and the manufacturing sector puts downward pressure on the service sector productivity relative to the rest of the economy, while the productivity ratio between the service sector and the agricultural sector acts in the opposite direction. Netting out these two effects, it appears that the downward pattern of the relative efficiency of the service sector presented in the previous section can be attributed to the downward trend in the ratio between service productivity and manufacturing productivity.4
4 By running a regression between the productivity of the service sector relative to the overall economy and two other productivity ratios—services relative to manufacturing and services relative to agriculture —we can see that one standard deviation increase of the first ratio has over five times the impact on productivity of the service sector relative to the overall economy than the other ratio does. This is because the agricultural sector productivity is too small to exhibit any significant influence on the relative efficiency of the service sector.
0
5
10
15
20
1992 1994 1996 1998 2000 2002 2004 2006 2008 2010
Shanghai: Productivity
Services
Manufacturing
Agriculture
0
1
2
3
4
5
6
7
8
1992 1994 1996 1998 2000 2002 2004 2006 2008 2010
Sichuan: Productivity
Services
Manufacturing
Agriculture
0
1
2
3
4
5
6
7
1992 1994 1996 1998 2000 2002 2004 2006 2008 2010
Guizhou: Productivity
Services
Manufacturing
Agriculture
14
III. THE INFLUENCE OF MACRO POLICY INITIATIVES ON THE RELATIVE EFFICIENCY OF THE
SERVICE SECTOR
Lifting the service sector share of China’s GDP will involve, in part, concerted policy effort to reverse the trend of relative decline in labor productivity in services compared to the rest of the economy. This section examines how different policy levers—human capital accumulation and education, various dimensions of infrastructure spending, and targeted campaigns to develop lagging regions—have influenced the relative productivity of services. These policy levers can affect labor productivity in services through a number of ways:
Human Capital Accumulation can enhance the development of the high-end service industries, for example finance, telecommunication, information technology and business services. Human capital across provinces is measured as in Nabar and N’Diaye (2013), using provincial educational attainment shares and returns to education estimated in the labor literature. Improvements in education delivery and training could boost human capital accumulation and thereby enhance productivity of labor in services. Additional benefits could accrue through knowledge spillovers and a faster diffusion of technology across better-educated workers. However, the industrial sector could also benefit from human capital accumulation and therefore the net effect on the relative productivity of the service sector could go either way.
Fiscal expenditure can influence the development of the service sector and its productivity relative to the rest of the economy both by directly inducing changes in the supply of services (for example, subsidies to boost the growth of telecommunications) as well as by affecting the demand for services (for example, agriculture subsidies boosting the rise of the agricultural sector, which raises demand for transport, warehousing, and retail distribution). The role of fiscal expenditure in the development of the service sector therefore depends on how it is allocated across different sectors of the economy.
Contestability and the degree of competitiveness of the market environment, which would spur growth of after-sales service and also catalyze development of business support services such as market research, advertizing, accounting, legal, retail and distribution. Contestability is difficult to measure at the provincial level. The approach followed is the one used in Nabar and N’Diaye (2013), which uses the share of foreign direct investment in fixed asset investment as a proxy for contestability. The idea behind this proxy is that the more open a province is to market entry, the higher will be the foreign direct investment share of the provinces total fixed asset investment.
National Economic Campaigns. From 2002 onward, the central government carried out a series of national economic campaigns, such as the Great Development of the West, the Revival of the North-Eastern Old Industrial Region, and the Rise of the Middle Region. The original intention was to support the economic development of the less-developed regions through national level fiscal and resource transfers. While these initiatives would be expected
15
to contribute to the overall development of the province, they could arguably end up favoring relatively less developed sectors within these regions where the potential for catch-up growth in the presence of targeted campaigns of this nature could be higher.
Infrastructure. The regression analysis uses highway and railway mileage as indicators for provincial infrastructure quality. Due to data limitations, the dimensions studied do not include telecommunication and information technology infrastructure, which are both essential for the development of the high-end service industries. But these are likely to be highly correlated with the infrastructure in railways (particularly since 2008, when the emphasis has been on high speed rail), which requires signaling and communications equipment. This is different from fiscal expenditure in two ways. First of all, infrastructure is a stock variable while fiscal expenditure is a flow variable. The second difference is that only a very limited amount of fiscal expenditure is invested in infrastructure each year, and different provinces differ vastly with respect to their fiscal emphasis on infrastructure investment.
The post-2008 stimulus program. The specifications also examine whether the sweeping, Yuan 4 trillion stimulus affected the impact any of these drivers have had on the relative efficiency of the service sector.
A. Relative Efficiency of the Service Sector: The Role of Policy Levers
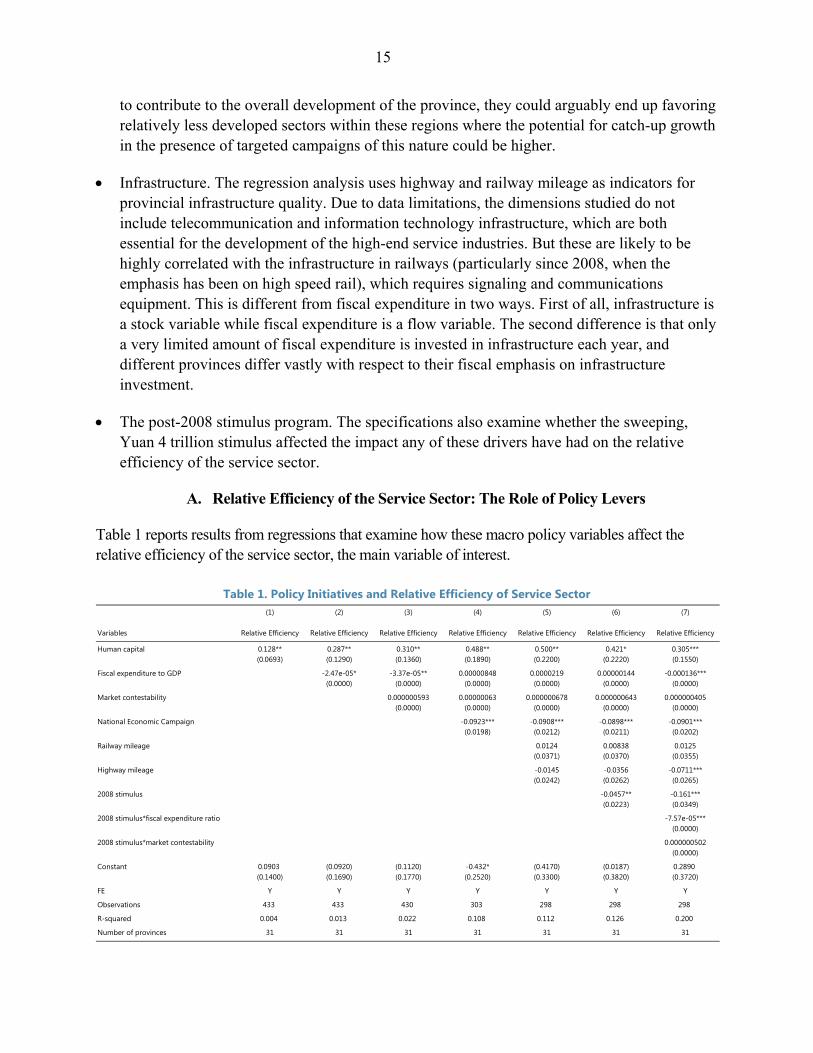
Table 1 reports results from regressions that examine how these macro policy variables affect the relative efficiency of the service sector, the main variable of interest.
Table 1. Policy Initiatives and Relative Efficiency of Service Sector (1) (2) (3) (4) (5) (6) (7)
Variables Relative Efficiency Relative Efficiency Relative Efficiency Relative Efficiency Relative Efficiency Relative Efficiency Relative Efficiency
Human capital 0.128** 0.287** 0.310** 0.488** 0.500** 0.421* 0.305***(0.0693) (0.1290) (0.1360) (0.1890) (0.2200) (0.2220) (0.1550)
Fiscal expenditure to GDP -2.47e-05* -3.37e-05** 0.00000848 0.0000219 0.00000144 -0.000136***(0.0000) (0.0000) (0.0000) (0.0000) (0.0000) (0.0000)
Market contestability 0.000000593 0.00000063 0.000000678 0.000000643 0.000000405(0.0000) (0.0000) (0.0000) (0.0000) (0.0000)
National Economic Campaign -0.0923*** -0.0908*** -0.0898*** -0.0901***(0.0198) (0.0212) (0.0211) (0.0202)
Railway mileage 0.0124 0.00838 0.0125(0.0371) (0.0370) (0.0355)
Highway mileage -0.0145 -0.0356 -0.0711***(0.0242) (0.0262) (0.0265)
2008 stimulus -0.0457** -0.161***(0.0223) (0.0349)
2008 stimulus*fiscal expenditure ratio -7.57e-05***(0.0000)
2008 stimulus*market contestability 0.000000502(0.0000)
Constant 0.0903 (0.0920) (0.1120) -0.432* (0.4170) (0.0187) 0.2890(0.1400) (0.1690) (0.1770) (0.2520) (0.3300) (0.3820) (0.3720)
FE Y Y Y Y Y Y Y
Observations 433 433 430 303 298 298 298
R-squared 0.004 0.013 0.022 0.108 0.112 0.126 0.200
Number of provinces 31 31 31 31 31 31 31

16
As Table 1 shows, human capital accumulation is positively correlated with the relative efficiency of the service sector, which indicates that the accumulation of human capital benefits the service sector relatively more than the rest of the economy.
The results presented from the second column onward show that fiscal expenditure is negatively associated with the relative efficiency of the service sector. However, the magnitude is small and not robust to the inclusion of additional controls. The effect can be considered as neutral. The national economic campaigns are negatively correlated with the relative efficiency of the service sector. While these targeted economic campaigns may have promoted GDP growth in certain areas or on the national level, it appears that they have either held back service sector productivity or have helped boost productivity in other sectors, especially the manufacturing sector, to a relatively larger extent. Either way, this result could be interpreted as indicating that the targeted economic campaigns have had a negative impact on the economy’s rebalancing process.
Infrastructure (road highway length) also contributes negatively to the relative productivity of the service sector. As is the case with the results of the impact of fiscal expenditure on the relative productivity of the service sector, the finding shows that this dimension of infrastructure appears to have helped the development of the rest of the economy more than the service sector. Put differently, service sector productivity growth appears to have been inhibited relative to the rest of the economy as the infrastructure build-out has had a relatively larger impact on other sectors.
B. Service Sector Productivity
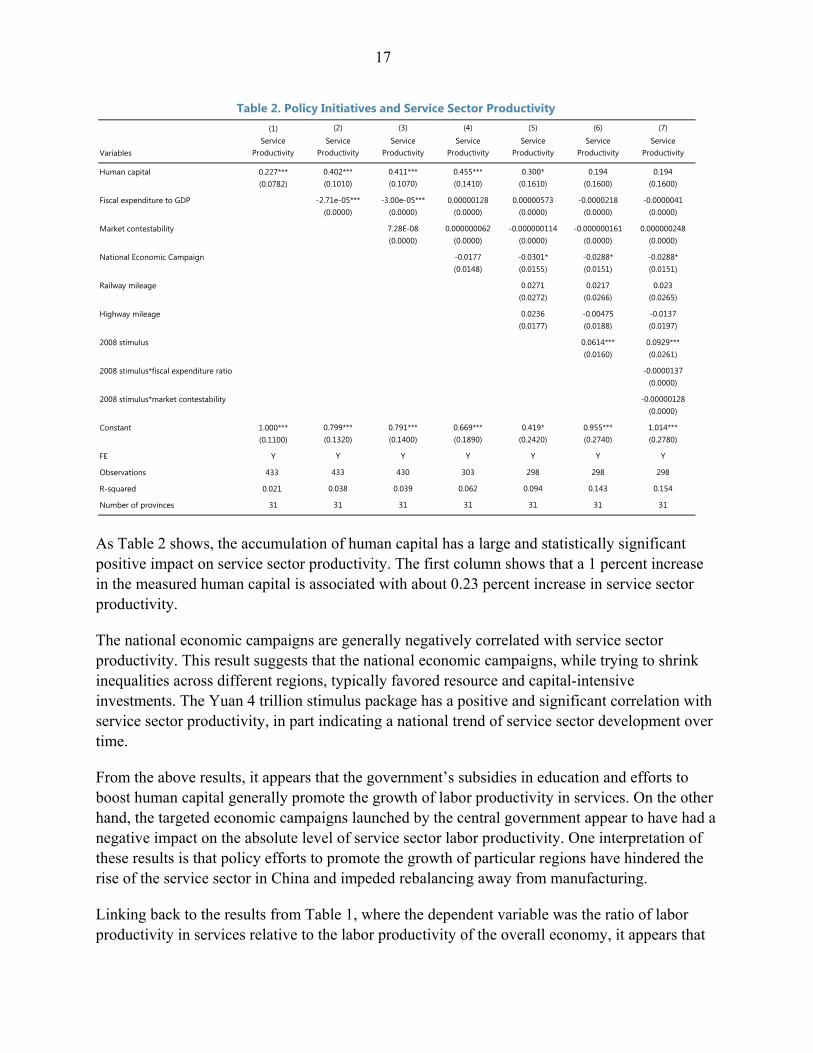
The preceding table shows the results using the ratio between the productivity of the service sector and that of the entire economy as the dependent variable—the efficiency term in decomposition (1). It is therefore unclear whether the sign of the estimated effect comes from the correlation with the nominator or the denominator. To provide some more direct evidence, Table 2 presents results of regressions where the dependent variable is the absolute levels of labor productivity in the service sector.
17
Table 2. Policy Initiatives and Service Sector Productivity
As Table 2 shows, the accumulation of human capital has a large and statistically significant positive impact on service sector productivity. The first column shows that a 1 percent increase in the measured human capital is associated with about 0.23 percent increase in service sector productivity.
The national economic campaigns are generally negatively correlated with service sector productivity. This result suggests that the national economic campaigns, while trying to shrink inequalities across different regions, typically favored resource and capital-intensive investments. The Yuan 4 trillion stimulus package has a positive and significant correlation with service sector productivity, in part indicating a national trend of service sector development over time.
From the above results, it appears that the government’s subsidies in education and efforts to boost human capital generally promote the growth of labor productivity in services. On the other hand, the targeted economic campaigns launched by the central government appear to have had a negative impact on the absolute level of service sector labor productivity. One interpretation of these results is that policy efforts to promote the growth of particular regions have hindered the rise of the service sector in China and impeded rebalancing away from manufacturing.
Linking back to the results from Table 1, where the dependent variable was the ratio of labor productivity in services relative to the labor productivity of the overall economy, it appears that
(1) (2) (3) (4) (5) (6) (7)
VariablesService
ProductivityService
ProductivityService
ProductivityService
ProductivityService
ProductivityService
ProductivityService
Productivity
Human capital 0.227*** 0.402*** 0.411*** 0.455*** 0.300* 0.194 0.194(0.0782) (0.1010) (0.1070) (0.1410) (0.1610) (0.1600) (0.1600)
Fiscal expenditure to GDP -2.71e-05*** -3.00e-05*** 0.00000128 0.00000573 -0.0000218 -0.0000041(0.0000) (0.0000) (0.0000) (0.0000) (0.0000) (0.0000)
Market contestability 7.28E-08 0.000000062 -0.000000114 -0.000000161 0.000000248(0.0000) (0.0000) (0.0000) (0.0000) (0.0000)
National Economic Campaign -0.0177 -0.0301* -0.0288* -0.0288*(0.0148) (0.0155) (0.0151) (0.0151)
Railway mileage 0.0271 0.0217 0.023(0.0272) (0.0266) (0.0265)
Highway mileage 0.0236 -0.00475 -0.0137(0.0177) (0.0188) (0.0197)
2008 stimulus 0.0614*** 0.0929***(0.0160) (0.0261)
2008 stimulus*fiscal expenditure ratio -0.0000137(0.0000)
2008 stimulus*market contestability -0.00000128(0.0000)
Constant 1.000*** 0.799*** 0.791*** 0.669*** 0.419* 0.955*** 1.014***(0.1100) (0.1320) (0.1400) (0.1890) (0.2420) (0.2740) (0.2780)
FE Y Y Y Y Y Y Y
Observations 433 433 430 303 298 298 298
R-squared 0.021 0.038 0.039 0.062 0.094 0.143 0.154
Number of provinces 31 31 31 31 31 31 31
18
some of these variables are negatively correlated with the relative productivity of the service sector because they enhance labor productivity in the rest of the economy more than they boost labor productivity in services.
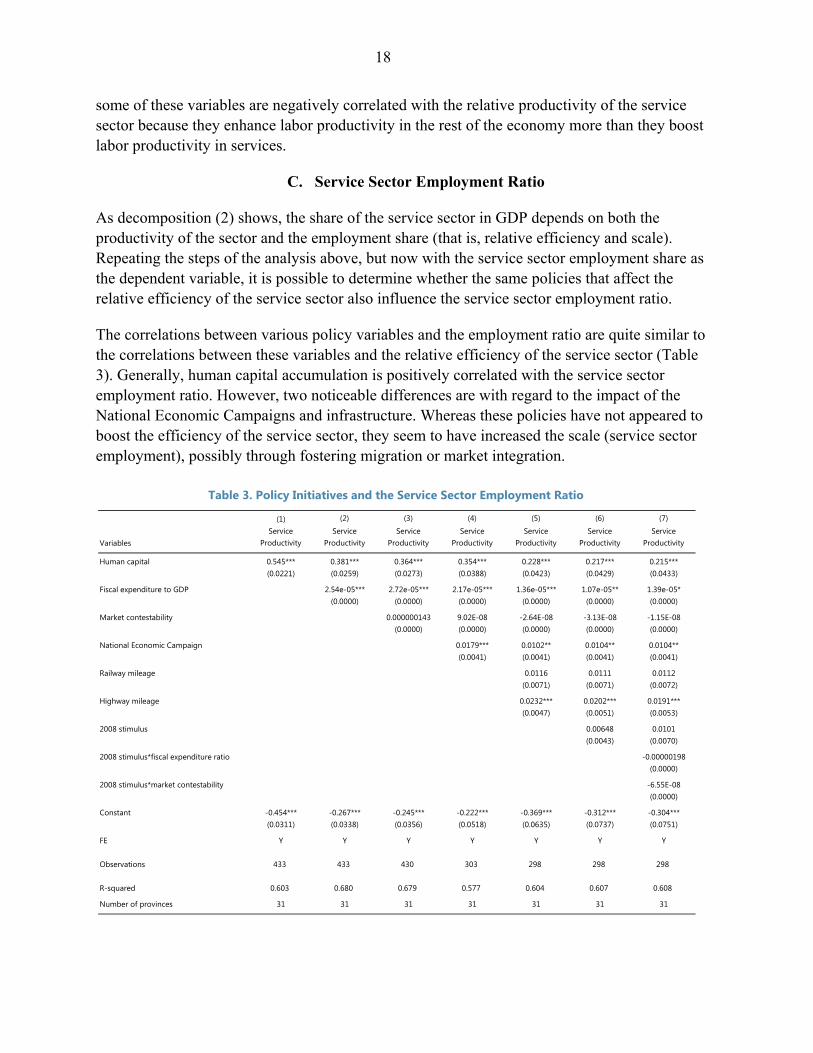
C. Service Sector Employment Ratio
As decomposition (2) shows, the share of the service sector in GDP depends on both the productivity of the sector and the employment share (that is, relative efficiency and scale). Repeating the steps of the analysis above, but now with the service sector employment share as the dependent variable, it is possible to determine whether the same policies that affect the relative efficiency of the service sector also influence the service sector employment ratio.
The correlations between various policy variables and the employment ratio are quite similar to the correlations between these variables and the relative efficiency of the service sector (Table 3). Generally, human capital accumulation is positively correlated with the service sector employment ratio. However, two noticeable differences are with regard to the impact of the National Economic Campaigns and infrastructure. Whereas these policies have not appeared to boost the efficiency of the service sector, they seem to have increased the scale (service sector employment), possibly through fostering migration or market integration.
Table 3. Policy Initiatives and the Service Sector Employment Ratio
(1) (2) (3) (4) (5) (6) (7)
VariablesService
ProductivityService
ProductivityService
ProductivityService
ProductivityService
ProductivityService
ProductivityService
Productivity
Human capital 0.545*** 0.381*** 0.364*** 0.354*** 0.228*** 0.217*** 0.215***(0.0221) (0.0259) (0.0273) (0.0388) (0.0423) (0.0429) (0.0433)
Fiscal expenditure to GDP 2.54e-05*** 2.72e-05*** 2.17e-05*** 1.36e-05*** 1.07e-05** 1.39e-05*(0.0000) (0.0000) (0.0000) (0.0000) (0.0000) (0.0000)
Market contestability 0.000000143 9.02E-08 -2.64E-08 -3.13E-08 -1.15E-08(0.0000) (0.0000) (0.0000) (0.0000) (0.0000)
National Economic Campaign 0.0179*** 0.0102** 0.0104** 0.0104**(0.0041) (0.0041) (0.0041) (0.0041)
Railway mileage 0.0116 0.0111 0.0112(0.0071) (0.0071) (0.0072)
Highway mileage 0.0232*** 0.0202*** 0.0191***(0.0047) (0.0051) (0.0053)
2008 stimulus 0.00648 0.0101(0.0043) (0.0070)
2008 stimulus*fiscal expenditure ratio -0.00000198(0.0000)
2008 stimulus*market contestability -6.55E-08(0.0000)
Constant -0.454*** -0.267*** -0.245*** -0.222*** -0.369*** -0.312*** -0.304***(0.0311) (0.0338) (0.0356) (0.0518) (0.0635) (0.0737) (0.0751)
FE Y Y Y Y Y Y Y
Observations 433 433 430 303 298 298 298
R-squared 0.603 0.680 0.679 0.577 0.604 0.607 0.608
Number of provinces 31 31 31 31 31 31 31

19
IV. THE ROLE OF FACTOR MARKET FRICTIONS
The trends presented in the preceding sections and the correlations with the different policy levers can be interpreted as a reflection of macro policies that favor the rest of the economy (mainly manufacturing) relatively more than services. However, one possibility is that policies may themselves simply be correlated with market outcomes driven by the comparative advantage of different provinces based on their stage of development and underlying micro-level fundamentals of product, labor, and credit markets.5 If that is the case, then the results presented above may not necessarily be a sign of policies impeding a natural transformation of the growth model across China’s provinces. A feature of product, labor and credit markets in China is that administrative guidance has an important influence in determining outcomes. Nevertheless, if resources are allocated efficiently, then the marginal product of capital and labor should be equalized across industries. Klenow and Hsieh (2009) document that this is not the case within the manufacturing sector, pointing to factor misallocation and potential productivity gains from reallocating factors more efficiently across firms and industries. Furthermore, barriers to entry in product markets often leave the incumbents at an advantage while labor productivity in the economy as a whole is appreciably less than would have been the case in a more competitive environment (see Ahuja, 2012). In labor markets, the system of household registration—the hukou system—prevents an equalization of wages across different locations and impedes the efficient matching of workers to vacancies. In addition to administrative barriers, there are innate frictions that arise in any environment due to information asymmetries, heterogeneities, and search costs, all of which together can impede factor mobility and prevent an equalization of marginal productivity across firms and sectors. Therefore, investigating the correlation between spreads of marginal productivities and different macro policies at the provincial level can help shed light on whether these macro policies alleviate or exacerbate the micro frictions in different factor markets. The analysis presented below assesses the role of micro frictions versus the macro level policies from the preceding section. The appendix addresses the question of whether macro level policies have reduced or worsened the micro frictions.
A. Proxies for Labor and Credit Market Frictions
Two proxies are developed to measure frictions in the labor and credit markets. For the labor market, the proxy used is the urban-rural wage differential. This reflects frictions in urban-rural migration, induced in part by the hukou system. Wider urban-rural wage differentials are
5 As discussed by Kutznets (1966) and more recently by Rebelo and Xie (2001) and Acemoglu and Guerrieri (2012), structural change in an economy results from either increases in the level of income or evolving comparative advantage, or as a by-product of the capital deepening process.
20
associated with stronger frictions in the labor market at the provincial level.
The credit market friction is the estimated difference between the lending rate of the service sector and industrial sector, controlling for firm-level heterogeneity, as well as firm and industry fixed effects. This difference captures whether the province favors manufacturing over services by lending to the firms in the first category at a lower average interest rate than the firms in the second category have to pay.
The effective interest rate is deduced from the firm’s balance sheet as the ratio of interest expenditure in year t to the total stock of debt outstanding in year (t-1). The effective interest rate for firm i is given by:
, ,
, , (5)
Separate regressions are run for manufacturing and service sector firms:
, , , ′ , , , , (6)
, , , ′ , , , , (7)
In these regressions, i denotes firm, j denotes province, and t denotes time. The first regression is the service-sector firm-level interest rate regression. Explanatory variables , , include firm-
specific factors such as total assets, employment, profitability, costs, indebtedness, location, and ownership status. Variable is a firm-level fixed effect to control for firm-level unobserved, time-invariant characteristics. The estimate of interest is the coefficient on the province and time specific dummy variable , , which is the province-level average interest rate premium in
addition to firm-specific risk factors. The coefficient on this dummy variable measures the interest rate premium of the service sector in a certain province in a certain year. The second regression repeats the steps for the manufacturing sector. Finally, the province-level credit spread between services and manufacturing is measured as:
, , , (8)
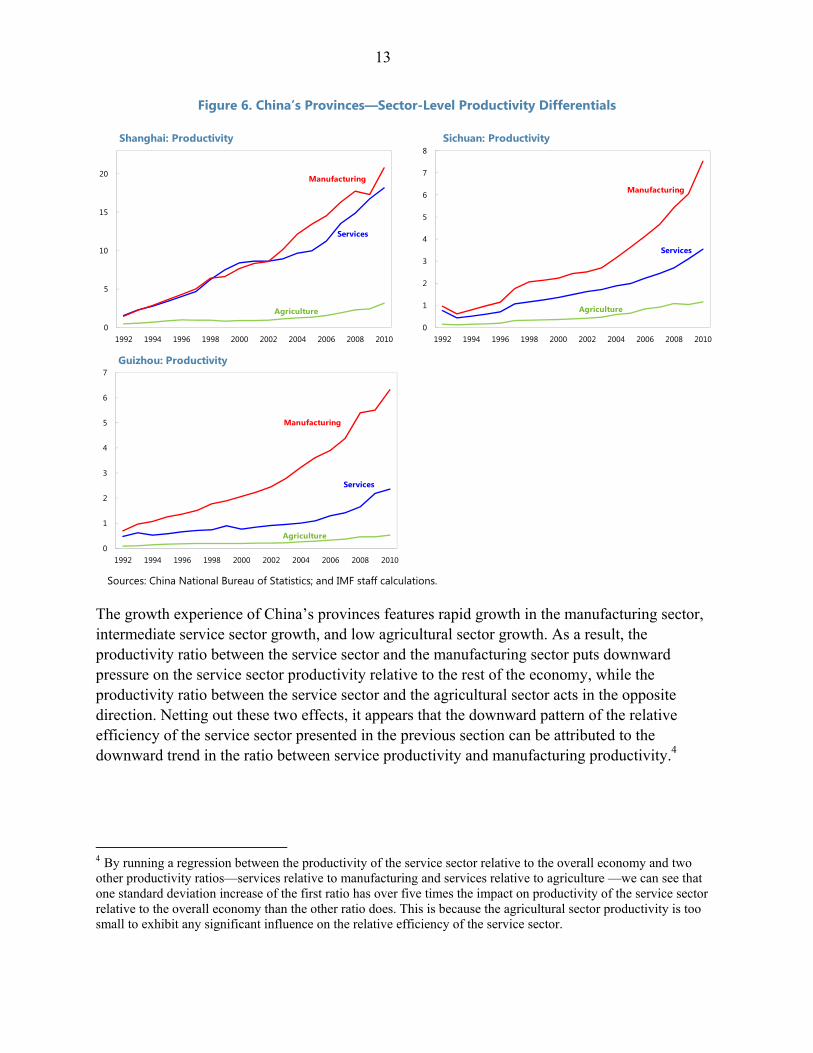
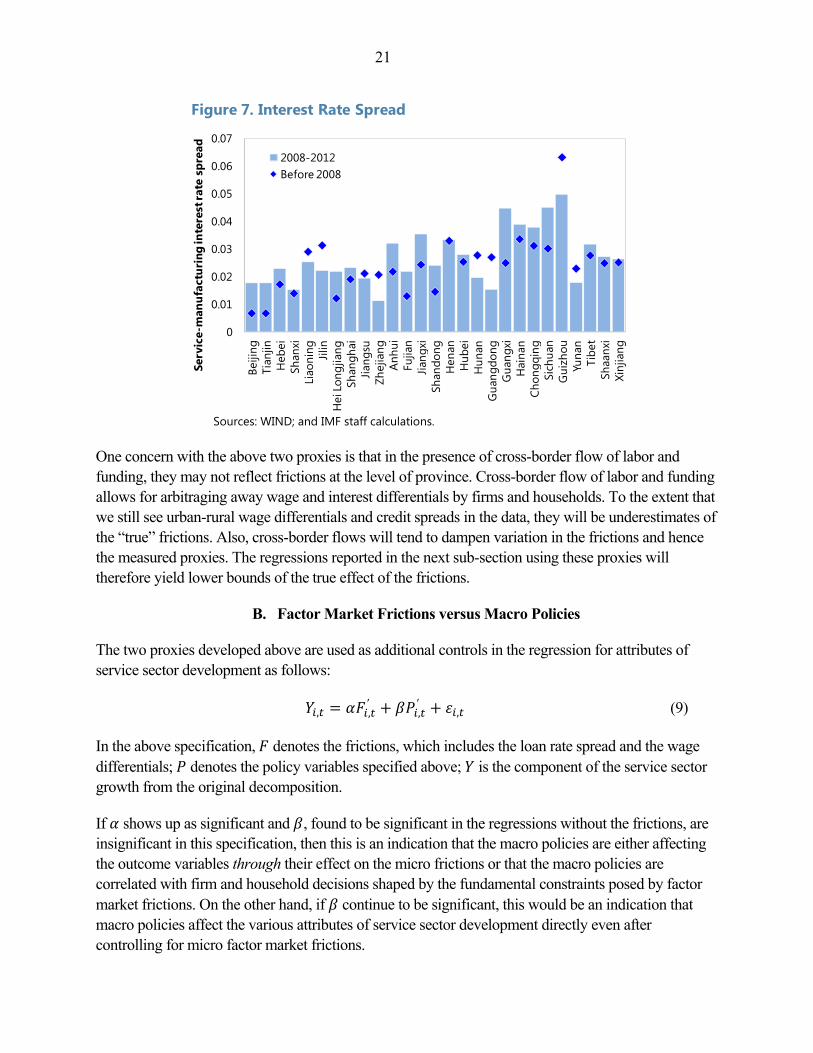
This measure removes any firm-specific characteristics and also industry-specific characteristics by controlling for firm-level characteristics and also firm-level fixed effects. Therefore, the spread refers to the unobserved province-level interest rate premiums that change over time. As seen in Figure 7, the premium is generally positive and has widened over time for most provinces, suggesting that the service sector firms on average have experienced higher borrowing costs than manufacturing firms and that the difference has grown over time.
21
Sources: WIND; and IMF staff calculations.
One concern with the above two proxies is that in the presence of cross-border flow of labor and funding, they may not reflect frictions at the level of province. Cross-border flow of labor and funding allows for arbitraging away wage and interest differentials by firms and households. To the extent that we still see urban-rural wage differentials and credit spreads in the data, they will be underestimates of the “true” frictions. Also, cross-border flows will tend to dampen variation in the frictions and hence the measured proxies. The regressions reported in the next sub-section using these proxies will therefore yield lower bounds of the true effect of the frictions.
B. Factor Market Frictions versus Macro Policies
The two proxies developed above are used as additional controls in the regression for attributes of service sector development as follows:
, ,′
,′
, (9)
In the above specification, denotes the frictions, which includes the loan rate spread and the wage differentials; denotes the policy variables specified above; is the component of the service sector growth from the original decomposition.
If shows up as significant and , found to be significant in the regressions without the frictions, are insignificant in this specification, then this is an indication that the macro policies are either affecting the outcome variables through their effect on the micro frictions or that the macro policies are correlated with firm and household decisions shaped by the fundamental constraints posed by factor market frictions. On the other hand, if continue to be significant, this would be an indication that macro policies affect the various attributes of service sector development directly even after controlling for micro factor market frictions.
0
0.01
0.02
0.03
0.04
0.05
0.06
0.07
Beiji
ngTi
anjin
Heb
eiSh
anxi
Liao
ning Jilin
Hei
Lon
gjia
ngSh
angh
aiJia
n gsu
Zhej
iang
Anh
uiFu
jian
Jian g
xiSh
ando
ngH
enan
Hub
eiH
unan
Gua
ngdo
ngG
uang
xiH
aina
nCh
ongq
ing
Sich
uan
Gui
zhou
Yuna
nTi
bet
Shaa
nxi
Xinj
iang
Serv
ice-
man
ufac
turi
ng in
tere
st ra
te s
prea
d
2008-2012Before 2008
Figure 7. Interest Rate Spread
22
Table 4. Factor Market Frictions and Relative Efficiency of the Service
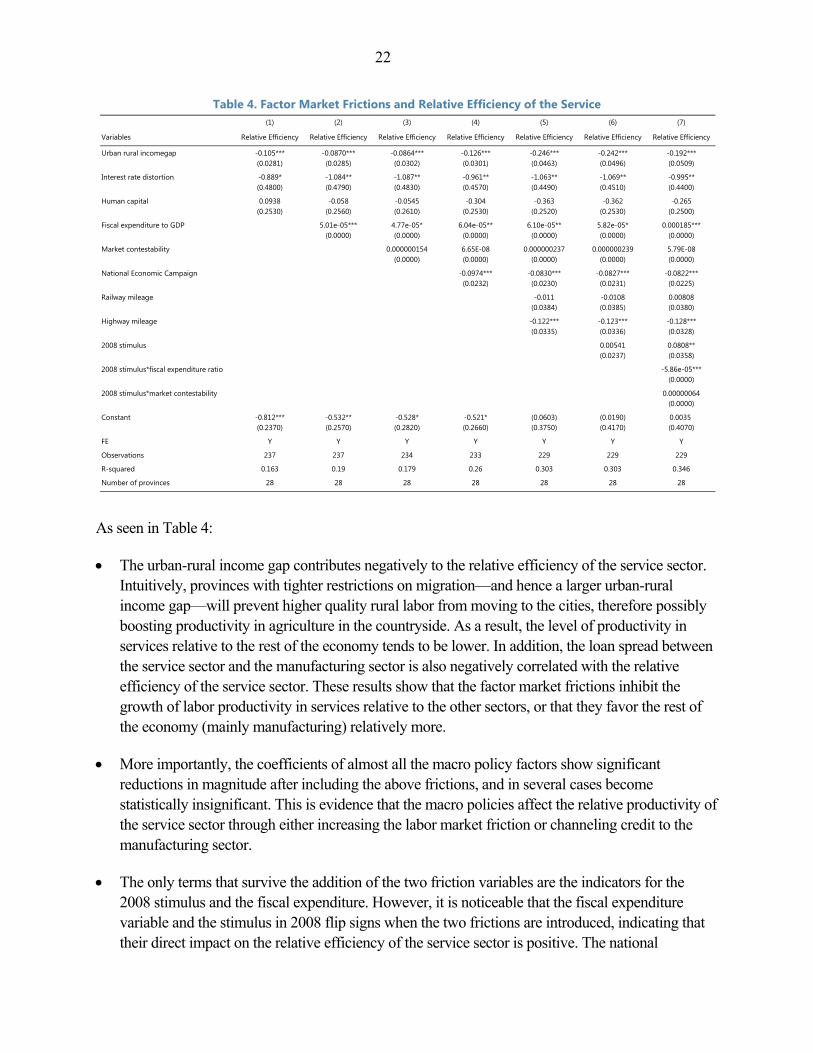
As seen in Table 4:
The urban-rural income gap contributes negatively to the relative efficiency of the service sector. Intuitively, provinces with tighter restrictions on migration—and hence a larger urban-rural income gap—will prevent higher quality rural labor from moving to the cities, therefore possibly boosting productivity in agriculture in the countryside. As a result, the level of productivity in services relative to the rest of the economy tends to be lower. In addition, the loan spread between the service sector and the manufacturing sector is also negatively correlated with the relative efficiency of the service sector. These results show that the factor market frictions inhibit the growth of labor productivity in services relative to the other sectors, or that they favor the rest of the economy (mainly manufacturing) relatively more.
More importantly, the coefficients of almost all the macro policy factors show significant reductions in magnitude after including the above frictions, and in several cases become statistically insignificant. This is evidence that the macro policies affect the relative productivity of the service sector through either increasing the labor market friction or channeling credit to the manufacturing sector.
The only terms that survive the addition of the two friction variables are the indicators for the 2008 stimulus and the fiscal expenditure. However, it is noticeable that the fiscal expenditure variable and the stimulus in 2008 flip signs when the two frictions are introduced, indicating that their direct impact on the relative efficiency of the service sector is positive. The national
(1) (2) (3) (4) (5) (6) (7)
Variables Relative Efficiency Relative Efficiency Relative Efficiency Relative Efficiency Relative Efficiency Relative Efficiency Relative Efficiency
Urban rural incomegap -0.105*** -0.0870*** -0.0864*** -0.126*** -0.246*** -0.242*** -0.192***(0.0281) (0.0285) (0.0302) (0.0301) (0.0463) (0.0496) (0.0509)
Interest rate distortion -0.889* -1.084** -1.087** -0.961** -1.063** -1.069** -0.995**(0.4800) (0.4790) (0.4830) (0.4570) (0.4490) (0.4510) (0.4400)
Human capital 0.0938 -0.058 -0.0545 -0.304 -0.363 -0.362 -0.265(0.2530) (0.2560) (0.2610) (0.2530) (0.2520) (0.2530) (0.2500)
Fiscal expenditure to GDP 5.01e-05*** 4.77e-05* 6.04e-05** 6.10e-05** 5.82e-05* 0.000185***(0.0000) (0.0000) (0.0000) (0.0000) (0.0000) (0.0000)
Market contestability 0.000000154 6.65E-08 0.000000237 0.000000239 5.79E-08(0.0000) (0.0000) (0.0000) (0.0000) (0.0000)
National Economic Campaign -0.0974*** -0.0830*** -0.0827*** -0.0822***(0.0232) (0.0230) (0.0231) (0.0225)
Railway mileage -0.011 -0.0108 0.00808(0.0384) (0.0385) (0.0380)
Highway mileage -0.122*** -0.123*** -0.128***(0.0335) (0.0336) (0.0328)
2008 stimulus 0.00541 0.0808**(0.0237) (0.0358)
2008 stimulus*fiscal expenditure ratio -5.86e-05***(0.0000)
2008 stimulus*market contestability 0.00000064(0.0000)
Constant -0.812*** -0.532** -0.528* -0.521* (0.0603) (0.0190) 0.0035(0.2370) (0.2570) (0.2820) (0.2660) (0.3750) (0.4170) (0.4070)
FE Y Y Y Y Y Y Y
Observations 237 237 234 233 229 229 229
R-squared 0.163 0.19 0.179 0.26 0.303 0.303 0.346
Number of provinces 28 28 28 28 28 28 28
23
economic campaigns also affect the relative efficiency of the service sector directly through channels other than credit and labor market, such as direct tax subsidies.
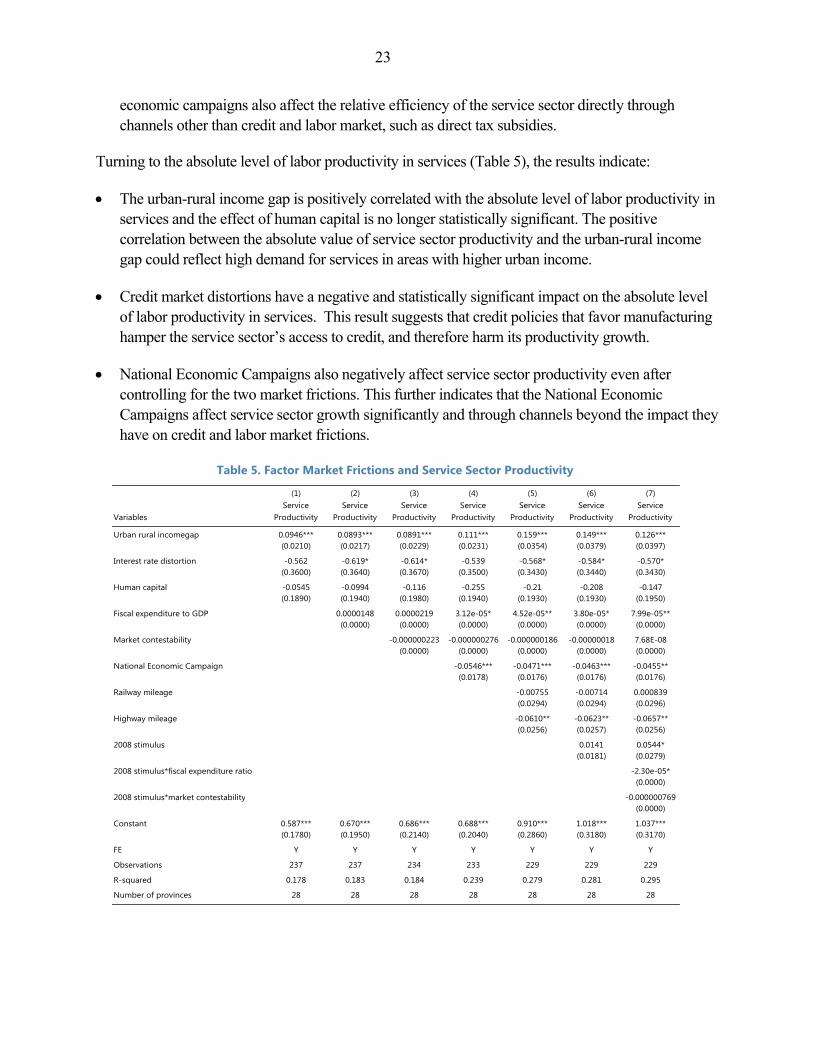
Turning to the absolute level of labor productivity in services (Table 5), the results indicate:
The urban-rural income gap is positively correlated with the absolute level of labor productivity in services and the effect of human capital is no longer statistically significant. The positive correlation between the absolute value of service sector productivity and the urban-rural income gap could reflect high demand for services in areas with higher urban income.
Credit market distortions have a negative and statistically significant impact on the absolute level of labor productivity in services. This result suggests that credit policies that favor manufacturing hamper the service sector’s access to credit, and therefore harm its productivity growth.
National Economic Campaigns also negatively affect service sector productivity even after controlling for the two market frictions. This further indicates that the National Economic Campaigns affect service sector growth significantly and through channels beyond the impact they have on credit and labor market frictions.
Table 5. Factor Market Frictions and Service Sector Productivity
(1) (2) (3) (4) (5) (6) (7)
VariablesService
ProductivityService
ProductivityService
ProductivityService
ProductivityService
ProductivityService
ProductivityService
Productivity
Urban rural incomegap 0.0946*** 0.0893*** 0.0891*** 0.111*** 0.159*** 0.149*** 0.126***(0.0210) (0.0217) (0.0229) (0.0231) (0.0354) (0.0379) (0.0397)
Interest rate distortion -0.562 -0.619* -0.614* -0.539 -0.568* -0.584* -0.570*(0.3600) (0.3640) (0.3670) (0.3500) (0.3430) (0.3440) (0.3430)
Human capital -0.0545 -0.0994 -0.116 -0.255 -0.21 -0.208 -0.147(0.1890) (0.1940) (0.1980) (0.1940) (0.1930) (0.1930) (0.1950)
Fiscal expenditure to GDP 0.0000148 0.0000219 3.12e-05* 4.52e-05** 3.80e-05* 7.99e-05**(0.0000) (0.0000) (0.0000) (0.0000) (0.0000) (0.0000)
Market contestability -0.000000223 -0.000000276 -0.000000186 -0.00000018 7.68E-08(0.0000) (0.0000) (0.0000) (0.0000) (0.0000)
National Economic Campaign -0.0546*** -0.0471*** -0.0463*** -0.0455**(0.0178) (0.0176) (0.0176) (0.0176)
Railway mileage -0.00755 -0.00714 0.000839(0.0294) (0.0294) (0.0296)
Highway mileage -0.0610** -0.0623** -0.0657**(0.0256) (0.0257) (0.0256)
2008 stimulus 0.0141 0.0544*(0.0181) (0.0279)
2008 stimulus*fiscal expenditure ratio -2.30e-05*(0.0000)
2008 stimulus*market contestability -0.000000769(0.0000)
Constant 0.587*** 0.670*** 0.686*** 0.688*** 0.910*** 1.018*** 1.037***(0.1780) (0.1950) (0.2140) (0.2040) (0.2860) (0.3180) (0.3170)
FE Y Y Y Y Y Y Y
Observations 237 237 234 233 229 229 229
R-squared 0.178 0.183 0.184 0.239 0.279 0.281 0.295
Number of provinces 28 28 28 28 28 28 28
24
To recap, adding the frictions to the regressions significantly reduces the magnitude and statistical significance of the policy variables. This indicates that the policy variables are either affecting service sector development through these two frictions, or that they are correlated with firm and household decisions that affect labor productivity and are themselves shaped by the factor market frictions. Reducing and ultimately eliminating these frictions is therefore essential for China’s next stage of development, one in which the service sector will need to play a more prominent role as an engine of growth.
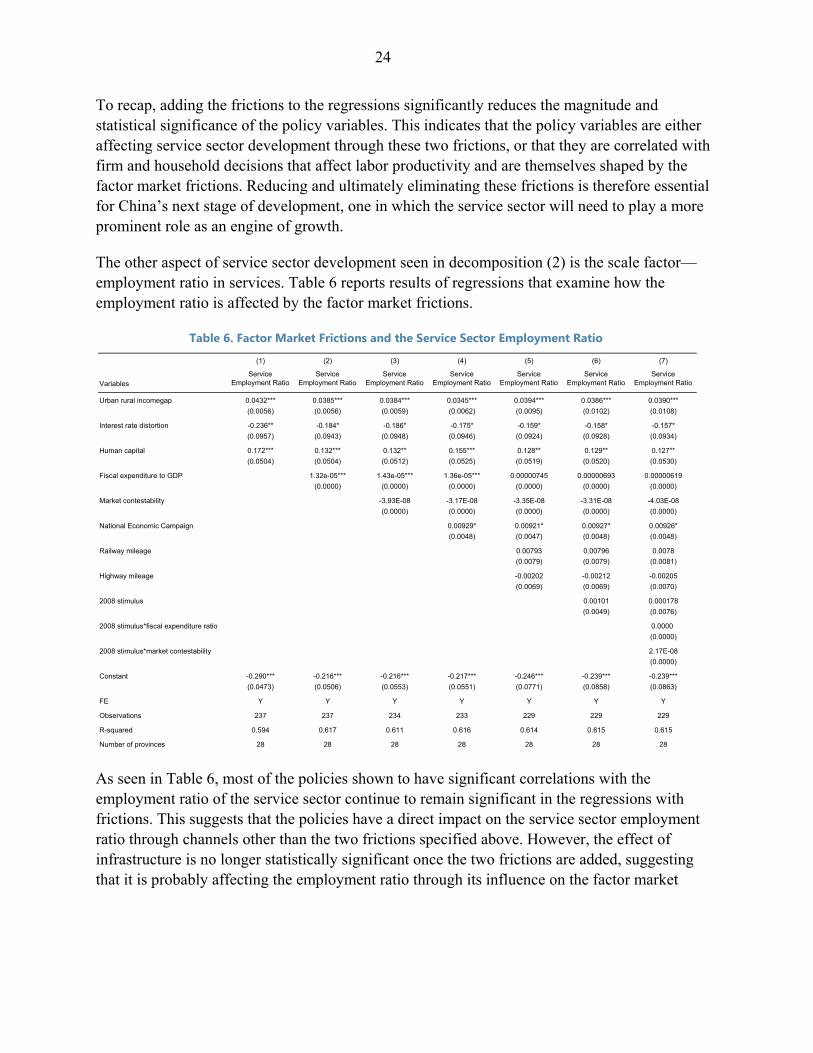
The other aspect of service sector development seen in decomposition (2) is the scale factor—employment ratio in services. Table 6 reports results of regressions that examine how the employment ratio is affected by the factor market frictions.
Table 6. Factor Market Frictions and the Service Sector Employment Ratio
As seen in Table 6, most of the policies shown to have significant correlations with the employment ratio of the service sector continue to remain significant in the regressions with frictions. This suggests that the policies have a direct impact on the service sector employment ratio through channels other than the two frictions specified above. However, the effect of infrastructure is no longer statistically significant once the two frictions are added, suggesting that it is probably affecting the employment ratio through its influence on the factor market
(1) (2) (3) (4) (5) (6) (7)
VariablesService
Employment RatioService
Employment RatioService
Employment RatioService
Employment RatioService
Employment RatioService
Employment RatioService
Employment Ratio
Urban rural incomegap 0.0432*** 0.0385*** 0.0384*** 0.0345*** 0.0394*** 0.0386*** 0.0390***
(0.0056) (0.0056) (0.0059) (0.0062) (0.0095) (0.0102) (0.0108)
Interest rate distortion -0.236** -0.184* -0.186* -0.175* -0.159* -0.158* -0.157*
(0.0957) (0.0943) (0.0948) (0.0946) (0.0924) (0.0928) (0.0934)
Human capital 0.172*** 0.132*** 0.132** 0.155*** 0.128** 0.129** 0.127**
(0.0504) (0.0504) (0.0512) (0.0525) (0.0519) (0.0520) (0.0530)
Fiscal expenditure to GDP 1.32e-05*** 1.43e-05*** 1.36e-05*** 0.00000745 0.00000693 0.00000619
(0.0000) (0.0000) (0.0000) (0.0000) (0.0000) (0.0000)
Market contestability -3.93E-08 -3.17E-08 -3.35E-08 -3.31E-08 -4.03E-08
(0.0000) (0.0000) (0.0000) (0.0000) (0.0000)
National Economic Campaign 0.00929* 0.00921* 0.00927* 0.00926*
(0.0048) (0.0047) (0.0048) (0.0048)
Railway mileage 0.00793 0.00796 0.0078
(0.0079) (0.0079) (0.0081)
Highway mileage -0.00202 -0.00212 -0.00205
(0.0069) (0.0069) (0.0070)
2008 stimulus 0.00101 0.000178
(0.0049) (0.0076)
2008 stimulus*fiscal expenditure ratio 0.0000
(0.0000)
2008 stimulus*market contestability 2.17E-08
(0.0000)
Constant -0.290*** -0.216*** -0.216*** -0.217*** -0.246*** -0.239*** -0.239***
(0.0473) (0.0506) (0.0553) (0.0551) (0.0771) (0.0858) (0.0863)
FE Y Y Y Y Y Y Y
Observations 237 237 234 233 229 229 229
R-squared 0.594 0.617 0.611 0.616 0.614 0.615 0.615
Number of provinces 28 28 28 28 28 28 28
25
frictions.6
V. FROM ELIMINATING FACTOR MARKET FRICTIONS TO REBALANCING DEMAND
The evidence presented above indicates that the relative underdevelopment in the productivity of the service sector is in part a function of factor market frictions that distort resource allocation. Reducing or eliminating these frictions will help boost labor productivity in services relative to the rest of the economy. If this were to occur, what impact would that have on the consumption of services? In particular, would supply side measures to eliminate factor market distortions actually help achieve the rebalancing of demand by increasing the consumption of services? To build the connection between a reduction in factor market frictions and the rebalancing of demand, links need to be established between service sector demand and service sector productivity.
Theoretically, it has been shown that productivity growth in the service sector can lead to more consumption in the service sector through either the income effect (Kongsamut, Rebelo, and Xie, 2001) or relative price changes (Ngai and Pissarides, 2007). The evidence presented below suggests that in the case of China’s provinces higher labor productivity in the service sector can indeed serve as a driving force for rebalancing by boosting consumption of services.
The regressions establish that higher service sector productivity in China can lead to an increase in service sector consumption, after controlling for other factors that normally determine consumption of services. Specifically, increasing the relative efficiency of the service sector can lead to an increase of the share of consumption that is devoted to services
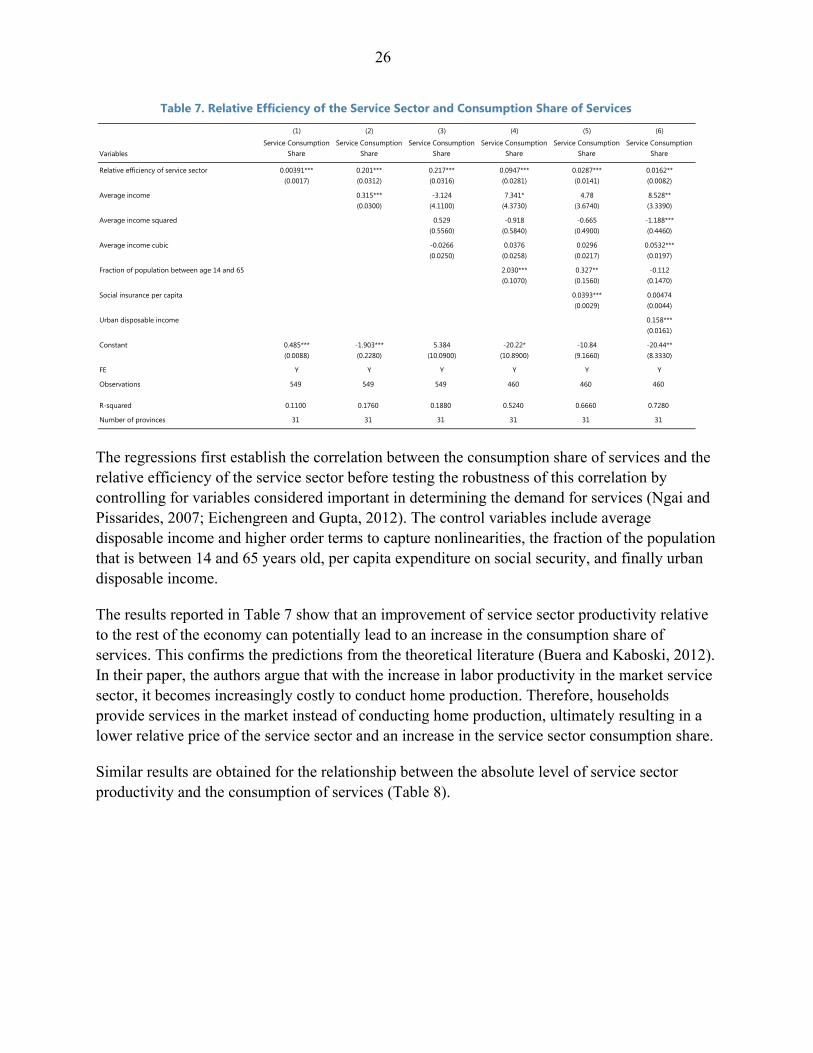
Table 7 shows that the relative efficiency of services is positively correlated with the consumption share of services. This regression examines the relative price channel of the service sector productivity growth—that is, as the ratio of labor productivity in services relative to the rest of the economy rises, the relative price of services falls, inducing more consumption of services (outsourcing of services as opposed to producing in-house).
6 See the appendix for regressions that examine whether macro policies alleviate or exacerbate the micro factor market frictions.
26
Table 7. Relative Efficiency of the Service Sector and Consumption Share of Services
The regressions first establish the correlation between the consumption share of services and the relative efficiency of the service sector before testing the robustness of this correlation by controlling for variables considered important in determining the demand for services (Ngai and Pissarides, 2007; Eichengreen and Gupta, 2012). The control variables include average disposable income and higher order terms to capture nonlinearities, the fraction of the population that is between 14 and 65 years old, per capita expenditure on social security, and finally urban disposable income.
The results reported in Table 7 show that an improvement of service sector productivity relative to the rest of the economy can potentially lead to an increase in the consumption share of services. This confirms the predictions from the theoretical literature (Buera and Kaboski, 2012). In their paper, the authors argue that with the increase in labor productivity in the market service sector, it becomes increasingly costly to conduct home production. Therefore, households provide services in the market instead of conducting home production, ultimately resulting in a lower relative price of the service sector and an increase in the service sector consumption share.
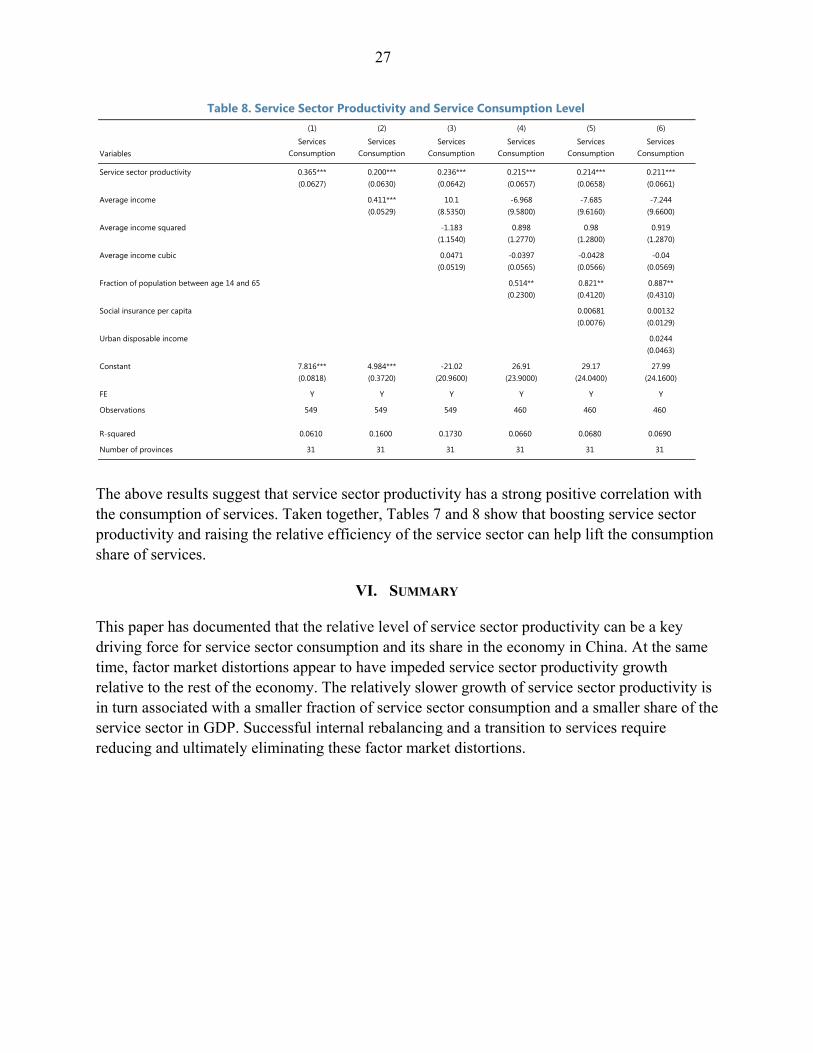
Similar results are obtained for the relationship between the absolute level of service sector productivity and the consumption of services (Table 8).
(1) (2) (3) (4) (5) (6)
VariablesService Consumption
ShareService Consumption
ShareService Consumption
ShareService Consumption
ShareService Consumption
ShareService Consumption
Share
Relative efficiency of service sector 0.00391*** 0.201*** 0.217*** 0.0947*** 0.0287*** 0.0162**(0.0017) (0.0312) (0.0316) (0.0281) (0.0141) (0.0082)
Average income 0.315*** -3.124 7.341* 4.78 8.528**(0.0300) (4.1100) (4.3730) (3.6740) (3.3390)
Average income squared 0.529 -0.918 -0.665 -1.188***(0.5560) (0.5840) (0.4900) (0.4460)
Average income cubic -0.0266 0.0376 0.0296 0.0532***(0.0250) (0.0258) (0.0217) (0.0197)
Fraction of population between age 14 and 65 2.030*** 0.327** -0.112(0.1070) (0.1560) (0.1470)
Social insurance per capita 0.0393*** 0.00474(0.0029) (0.0044)
Urban disposable income 0.158***(0.0161)
Constant 0.485*** -1.903*** 5.384 -20.22* -10.84 -20.44**(0.0088) (0.2280) (10.0900) (10.8900) (9.1660) (8.3330)
FE Y Y Y Y Y Y
Observations 549 549 549 460 460 460
R-squared 0.1100 0.1760 0.1880 0.5240 0.6660 0.7280
Number of provinces 31 31 31 31 31 31
27
Table 8. Service Sector Productivity and Service Consumption Level
The above results suggest that service sector productivity has a strong positive correlation with the consumption of services. Taken together, Tables 7 and 8 show that boosting service sector productivity and raising the relative efficiency of the service sector can help lift the consumption share of services.
VI. SUMMARY
This paper has documented that the relative level of service sector productivity can be a key driving force for service sector consumption and its share in the economy in China. At the same time, factor market distortions appear to have impeded service sector productivity growth relative to the rest of the economy. The relatively slower growth of service sector productivity is in turn associated with a smaller fraction of service sector consumption and a smaller share of the service sector in GDP. Successful internal rebalancing and a transition to services require reducing and ultimately eliminating these factor market distortions.
(1) (2) (3) (4) (5) (6)
VariablesServices
ConsumptionServices
ConsumptionServices
ConsumptionServices
ConsumptionServices
ConsumptionServices
Consumption
Service sector productivity 0.365*** 0.200*** 0.236*** 0.215*** 0.214*** 0.211***(0.0627) (0.0630) (0.0642) (0.0657) (0.0658) (0.0661)
Average income 0.411*** 10.1 -6.968 -7.685 -7.244(0.0529) (8.5350) (9.5800) (9.6160) (9.6600)
Average income squared -1.183 0.898 0.98 0.919(1.1540) (1.2770) (1.2800) (1.2870)
Average income cubic 0.0471 -0.0397 -0.0428 -0.04(0.0519) (0.0565) (0.0566) (0.0569)
Fraction of population between age 14 and 65 0.514** 0.821** 0.887**(0.2300) (0.4120) (0.4310)
Social insurance per capita 0.00681 0.00132(0.0076) (0.0129)
Urban disposable income 0.0244(0.0463)
Constant 7.816*** 4.984*** -21.02 26.91 29.17 27.99(0.0818) (0.3720) (20.9600) (23.9000) (24.0400) (24.1600)
FE Y Y Y Y Y Y
Observations 549 549 549 460 460 460
R-squared 0.0610 0.1600 0.1730 0.0660 0.0680 0.0690
Number of provinces 31 31 31 31 31 31
28
APPENDIX: DETERMINANTS OF THE RELATIVE EFFICIENCY OF SERVICES: DO THEY
AFFECT THE OUTCOME OF INTEREST THROUGH FACTOR MARKET FRICTIONS?
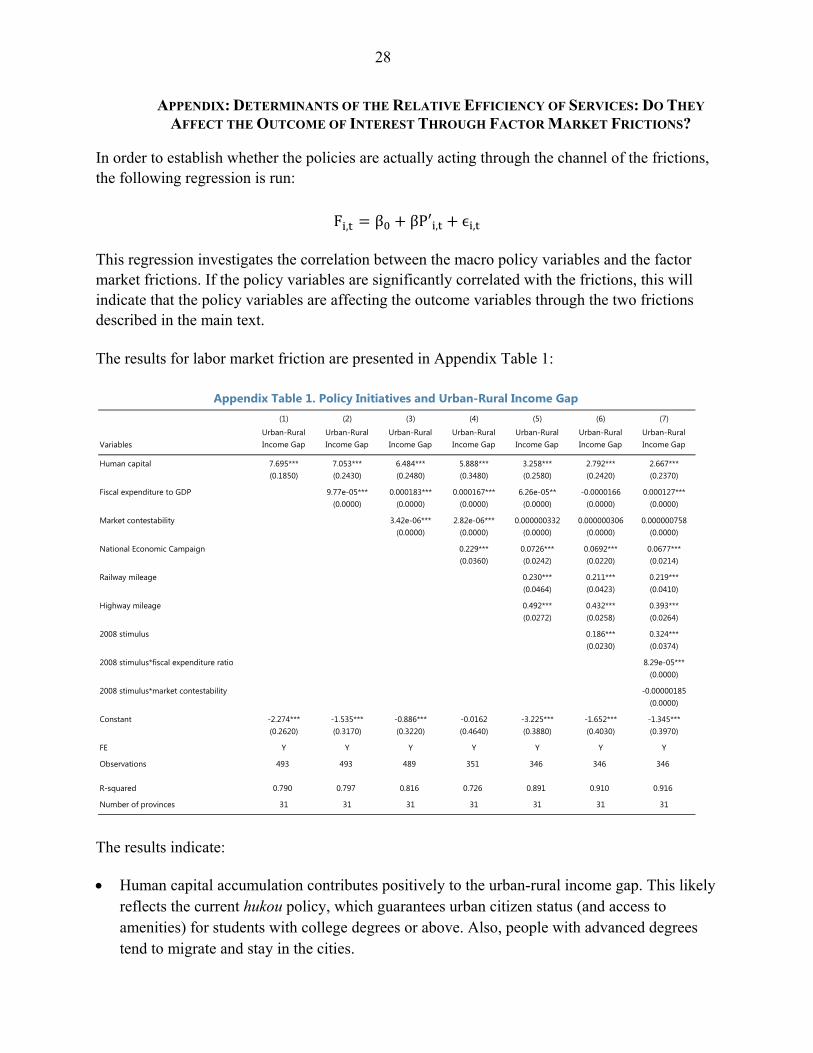
In order to establish whether the policies are actually acting through the channel of the frictions, the following regression is run:
F , β βP′ , ϵ , This regression investigates the correlation between the macro policy variables and the factor market frictions. If the policy variables are significantly correlated with the frictions, this will indicate that the policy variables are affecting the outcome variables through the two frictions described in the main text. The results for labor market friction are presented in Appendix Table 1:
Appendix Table 1. Policy Initiatives and Urban-Rural Income Gap
The results indicate: Human capital accumulation contributes positively to the urban-rural income gap. This likely
reflects the current hukou policy, which guarantees urban citizen status (and access to amenities) for students with college degrees or above. Also, people with advanced degrees tend to migrate and stay in the cities.
(1) (2) (3) (4) (5) (6) (7)
VariablesUrban-Rural Income Gap
Urban-Rural Income Gap
Urban-Rural Income Gap
Urban-Rural Income Gap
Urban-Rural Income Gap
Urban-Rural Income Gap
Urban-Rural Income Gap
Human capital 7.695*** 7.053*** 6.484*** 5.888*** 3.258*** 2.792*** 2.667***(0.1850) (0.2430) (0.2480) (0.3480) (0.2580) (0.2420) (0.2370)
Fiscal expenditure to GDP 9.77e-05*** 0.000183*** 0.000167*** 6.26e-05** -0.0000166 0.000127***(0.0000) (0.0000) (0.0000) (0.0000) (0.0000) (0.0000)
Market contestability 3.42e-06*** 2.82e-06*** 0.000000332 0.000000306 0.000000758(0.0000) (0.0000) (0.0000) (0.0000) (0.0000)
National Economic Campaign 0.229*** 0.0726*** 0.0692*** 0.0677***(0.0360) (0.0242) (0.0220) (0.0214)
Railway mileage 0.230*** 0.211*** 0.219***(0.0464) (0.0423) (0.0410)
Highway mileage 0.492*** 0.432*** 0.393***(0.0272) (0.0258) (0.0264)
2008 stimulus 0.186*** 0.324***(0.0230) (0.0374)
2008 stimulus*fiscal expenditure ratio 8.29e-05***(0.0000)
2008 stimulus*market contestability -0.00000185(0.0000)
Constant -2.274*** -1.535*** -0.886*** -0.0162 -3.225*** -1.652*** -1.345***(0.2620) (0.3170) (0.3220) (0.4640) (0.3880) (0.4030) (0.3970)
FE Y Y Y Y Y Y Y
Observations 493 493 489 351 346 346 346
R-squared 0.790 0.797 0.816 0.726 0.891 0.910 0.916
Number of provinces 31 31 31 31 31 31 31
29
National development campaigns and also the national stimulus packages generally increase the urban-rural income gap. This is perhaps an indication of the national economic campaigns’ emphasis on urban areas. Moreover, the 2008 stimulus package also exacerbated the distortionary effect of fiscal policy, indicating that fiscal policy after 2007 distorts urban-rural migration more than it did before 2007.
Infrastructure reduces the urban-rural income gap. This is most likely the effect of the role of highways and railways in promoting local business in the rural areas and facilitating rural-urban migration.
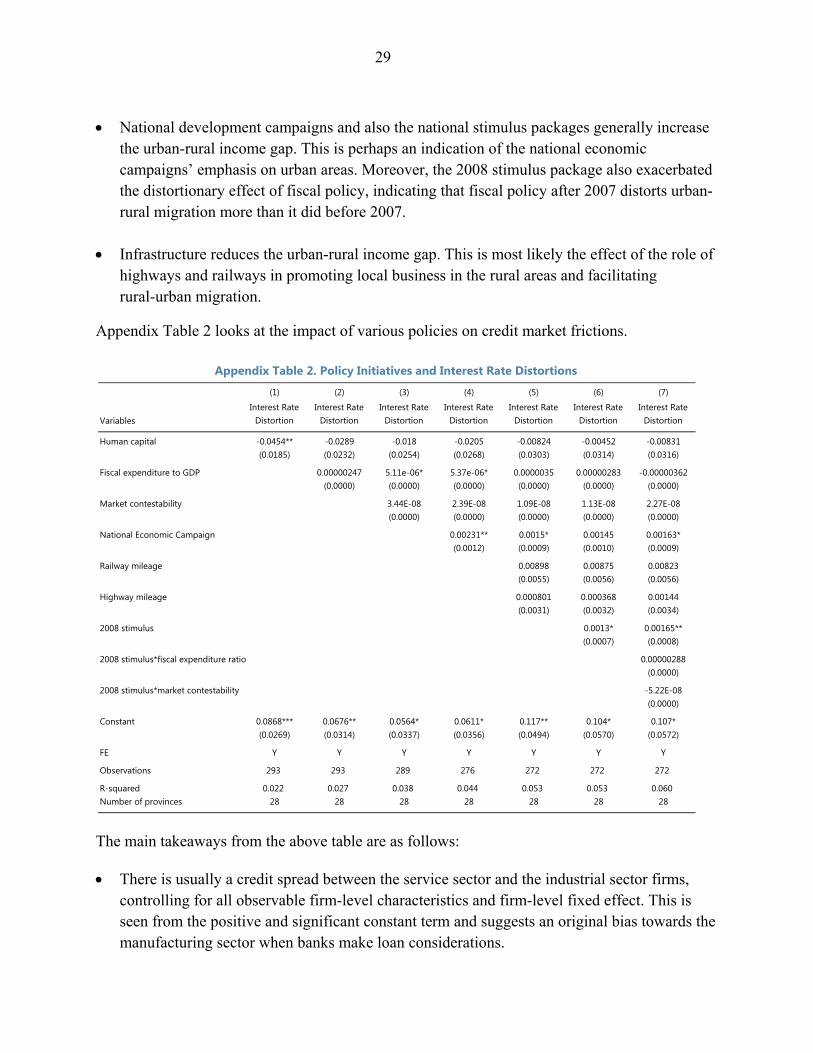
Appendix Table 2 looks at the impact of various policies on credit market frictions.
Appendix Table 2. Policy Initiatives and Interest Rate Distortions
The main takeaways from the above table are as follows: There is usually a credit spread between the service sector and the industrial sector firms,
controlling for all observable firm-level characteristics and firm-level fixed effect. This is seen from the positive and significant constant term and suggests an original bias towards the manufacturing sector when banks make loan considerations.
(1) (2) (3) (4) (5) (6) (7)
VariablesInterest Rate
DistortionInterest Rate
DistortionInterest Rate
DistortionInterest Rate
DistortionInterest Rate
DistortionInterest Rate
DistortionInterest Rate
Distortion
Human capital -0.0454** -0.0289 -0.018 -0.0205 -0.00824 -0.00452 -0.00831(0.0185) (0.0232) (0.0254) (0.0268) (0.0303) (0.0314) (0.0316)
Fiscal expenditure to GDP 0.00000247 5.11e-06* 5.37e-06* 0.0000035 0.00000283 -0.00000362(0.0000) (0.0000) (0.0000) (0.0000) (0.0000) (0.0000)
Market contestability 3.44E-08 2.39E-08 1.09E-08 1.13E-08 2.27E-08(0.0000) (0.0000) (0.0000) (0.0000) (0.0000)
National Economic Campaign 0.00231** 0.0015* 0.00145 0.00163*(0.0012) (0.0009) (0.0010) (0.0009)
Railway mileage 0.00898 0.00875 0.00823(0.0055) (0.0056) (0.0056)
Highway mileage 0.000801 0.000368 0.00144(0.0031) (0.0032) (0.0034)
2008 stimulus 0.0013* 0.00165**(0.0007) (0.0008)
2008 stimulus*fiscal expenditure ratio 0.00000288(0.0000)
2008 stimulus*market contestability -5.22E-08(0.0000)
Constant 0.0868*** 0.0676** 0.0564* 0.0611* 0.117** 0.104* 0.107*(0.0269) (0.0314) (0.0337) (0.0356) (0.0494) (0.0570) (0.0572)
FE Y Y Y Y Y Y Y
Observations 293 293 289 276 272 272 272
R-squared 0.022 0.027 0.038 0.044 0.053 0.053 0.060Number of provinces 28 28 28 28 28 28 28

30
Human capital accumulation helps lower the spread between the service sector and the manufacturing sector. This likely reflects modern service sector development – and service sector firms with better quality collateral in areas with more abundant human capital.
Fiscal expenditure and infrastructure construction are positively correlated with the credit market spread. This is probably a reflection that the bulk of projects in fiscal spending involve heavy manufacturing. Fiscal spending can increase demand for output of manufacturing firms, which will lead to an increase in their profits, decrease in their loan rates, and therefore a widening of spreads relative to service sector firms.
The stimulus package in 2008 also tended to widen the credit spread between service sector firms and manufacturing firms. This is an indication of high reliance on investment and the manufacturing sector during the stimulus.
These findings suggest that a number of macro policies affect the relative efficiency of the service sector through their impact on labor and credit market distortions. The underdevelopment of the service sector can in part be attributed to policies that distort factor allocations.
31
REFERENCES
Acemoglu, D. and V.Guerrieri, 2012, “Capital Deepening and Non-Balanced Economic Growth,” Journal of Political Economy, 2008, Vol. 116, No. 3, pp. 467–98.
Ahuja, A., 2012, “De-Monopolization Toward Long-Term Prosperity in China,” IMF Working Paper No. 12/75 (Washington: International Monetary Fund).
Eichengreen, B. and P. Gupta, 2012, “Two Waves of Service Sector Growth,” Oxford Economic Papers.
Hsieh, Chang-Tai and P. Klenow, 2009, “Misallocation and Manufacturing TFP in China and India”, Quarterly Journal of Economics, Vol. 124, No. 4.
Kongsamut, P., S. Rebelo, and D. Xie, 2001, “Beyond Balanced Growth,” Review of Economic Studies, Vol. 68, No. 4.
Kuznets, S., 1966, Modern Economic Growth (New Haven: Yale University Press).
Nabar, M. and P. N’Diaye, 2013, “Enhancing China’s Medium-Term Growth Prospects: Toward a High Income Economy,” IMF Working Paper No. 13/204 (Washington: International Monetary Fund).
Ngai, R. and C. A. Pissarides, 2007, “Structural Change in a Multisector Model of Growth,” American Economic Review, Vol. 97, No. 1.
Young, A., 1995, “The Tyranny of Numbers: Confronting the Statistical Realities of the East Asian Countries,” Quarterly Journal of Economics, Vol. 110, No. 3.