Task A: Sector performance and structural sector...
92
Deliverable 2: Rapid assessment of the sector performance Task A: Sector performance and structural sector reform April 2017 REVISED FINAL REPORT Report produced in April 2017 Data & analyses up-dates available within Task C and Task A final reports and within Task C Technical & Financial improvements reports Public Disclosure Authorized Public Disclosure Authorized Public Disclosure Authorized ed
Transcript of Task A: Sector performance and structural sector...

Deliverable 2: Rapid assessment of the sector performance
Task A: Sector performance and
structural sector reform
April 2017
REVISED FINAL REPORT
Report produced in April 2017
Data & analyses up-dates available within Task C and Task A final reports
and within Task C Technical & Financial improvements reports
Pub
lic D
iscl
osur
e A
utho
rized
Pub
lic D
iscl
osur
e A
utho
rized
Pub
lic D
iscl
osur
e A
utho
rized
Pub
lic D
iscl
osur
e A
utho
rized
Prepared for The World BankStrategy& | PwC
Disclaimer and copyright note
This document has been prepared only for the International
Bank of Reconstruction and Development ("IBRD") and solely
for the purpose and on the terms agreed with the IBRD in our
agreement dated 21 March 2017 relating to Task A.
The scope of our work was limited to a review of documentary
evidence made available to us. We have not independently
verified any information given to us relating to the services.
We accept no liability (including for negligence) to anyone else
in connection with this document. We have agreed with you
that the report will be provided by you to GECOL for their
consideration. We would ask that it not be provided to anyone
else unless otherwise agreed in writing by us.
This is a draft prepared for discussion purposes only and
should not be relied upon; the contents are subject to
amendment or withdrawal and our final conclusions and
findings will be set out in our final deliverable.
© 2017
PricewaterhouseCoopers
LLP
All rights reserved. In this
document, 'PwC' refers to the
UK member firm, and may
sometimes refer to the PwC
network. Each member firm
is a separate legal entity.
Please see
www.pwc.com/structure for
further details
1

Prepared for The World BankStrategy& | PwC
Objective is to rapidly identify the issues affecting the sector – Analyses are then further deep-dived in following reports
Considerations on current report
Document objectives
• Revise the Libyan electricity demand towards 2030
• Review the Libyan electricity sector, by business area (generation, transmission, distribution & supply)
• Identify preliminary considerations on the country’s supply & demand balance
• Provide an high-level overview of the sector governance and structure
Document intends to: The document is NOT
• Review the electricity demand projections
towards 2030
• Rapidly identify at a high-level the issues
affecting the Libyan electricity sector in order
to provide to the project team members with
an overview and the preliminary directions on
which to focus on with the next deliverables
(including Task B and Task D)
• Allow project team members and
stakeholders to initiate discussions on the real
issues affecting the Libyan sector today
• The document does not represent the final
assessment of the Libyan sector performance
(this assessment is to be made with the following
deliverables planned within Task A and Task C)
2
Prepared for The World BankStrategy& | PwC
Demand
Generation
Transmission
Distribution and supply
Supply / demand balance
Governance and sector structure
References for analysis update
3
Prepared for The World BankStrategy& | PwC
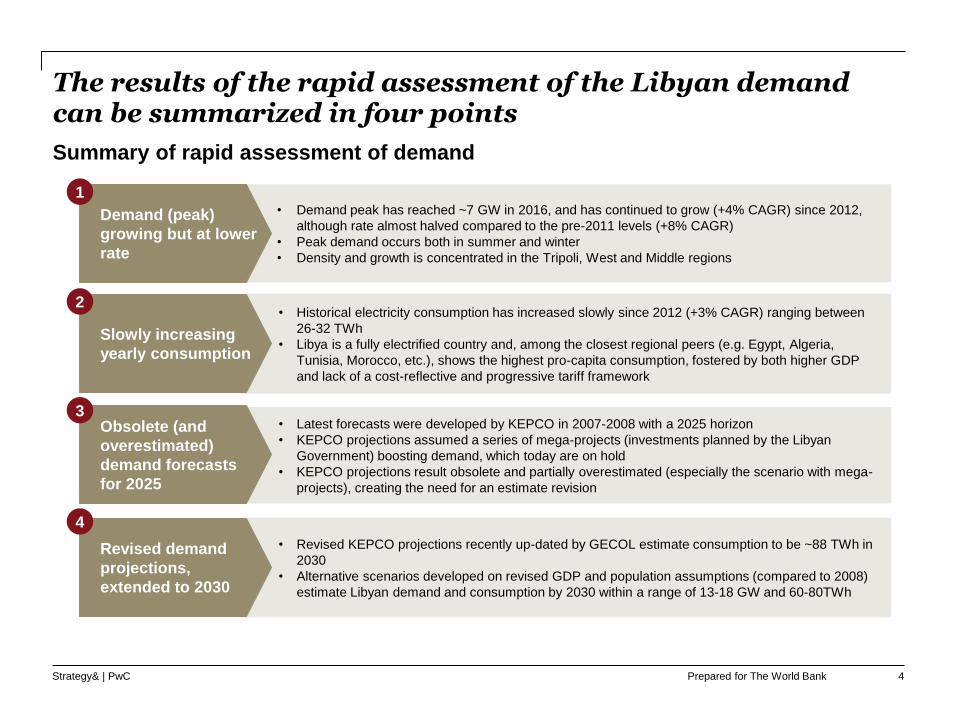
The results of the rapid assessment of the Libyan demand can be summarized in four points
Summary of rapid assessment of demand
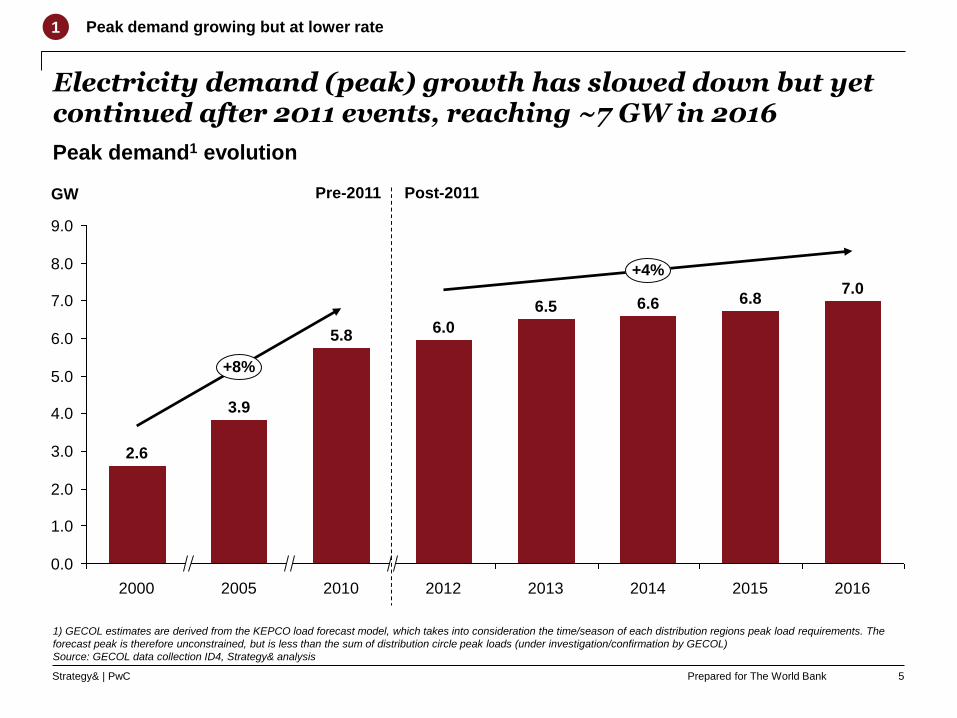
• Demand peak has reached ~7 GW in 2016, and has continued to grow (+4% CAGR) since 2012,
although rate almost halved compared to the pre-2011 levels (+8% CAGR)
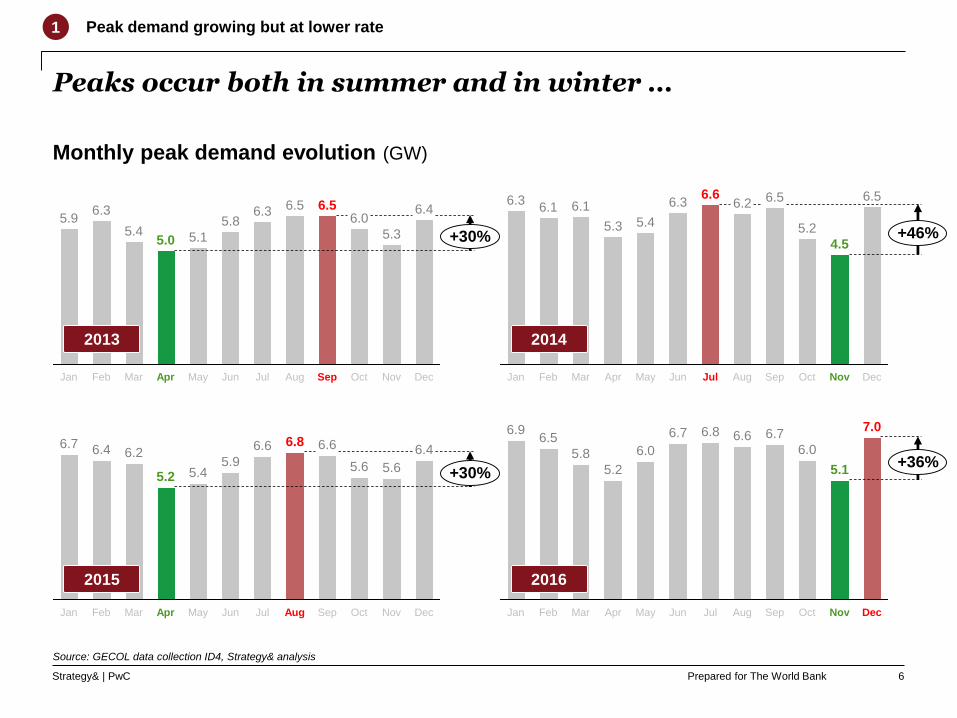
• Peak demand occurs both in summer and winter
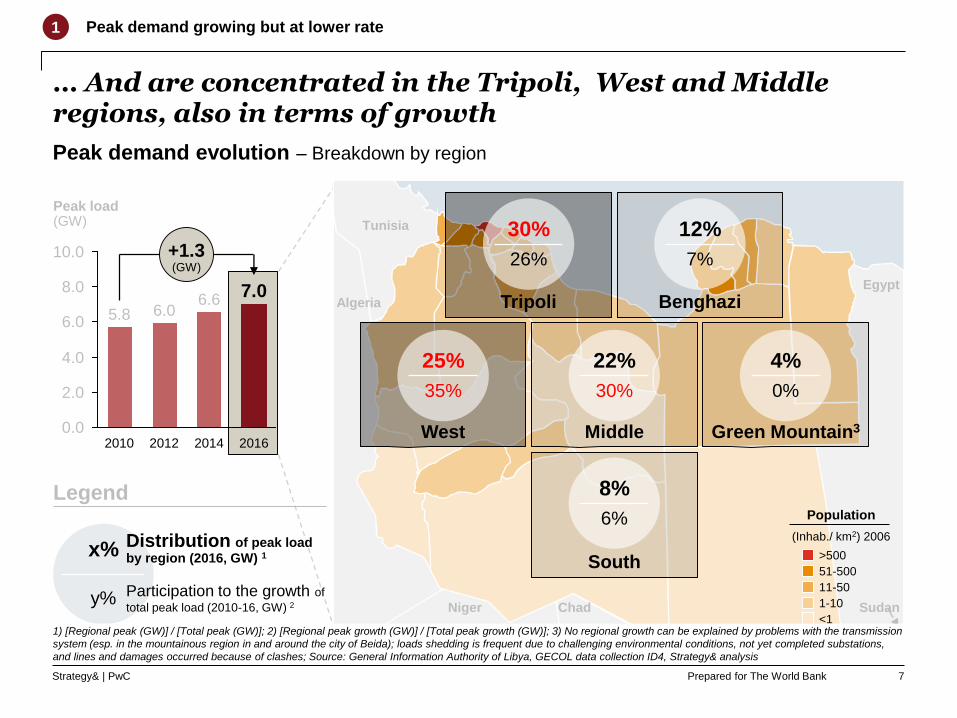
• Density and growth is concentrated in the Tripoli, West and Middle regions
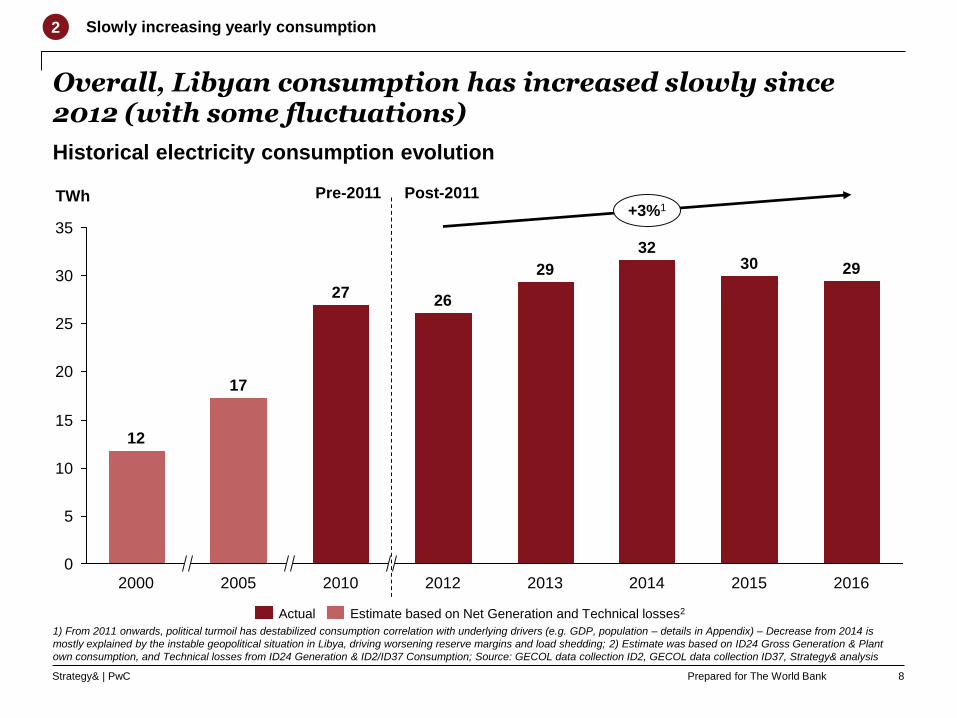
• Historical electricity consumption has increased slowly since 2012 (+3% CAGR) ranging between
26-32 TWh
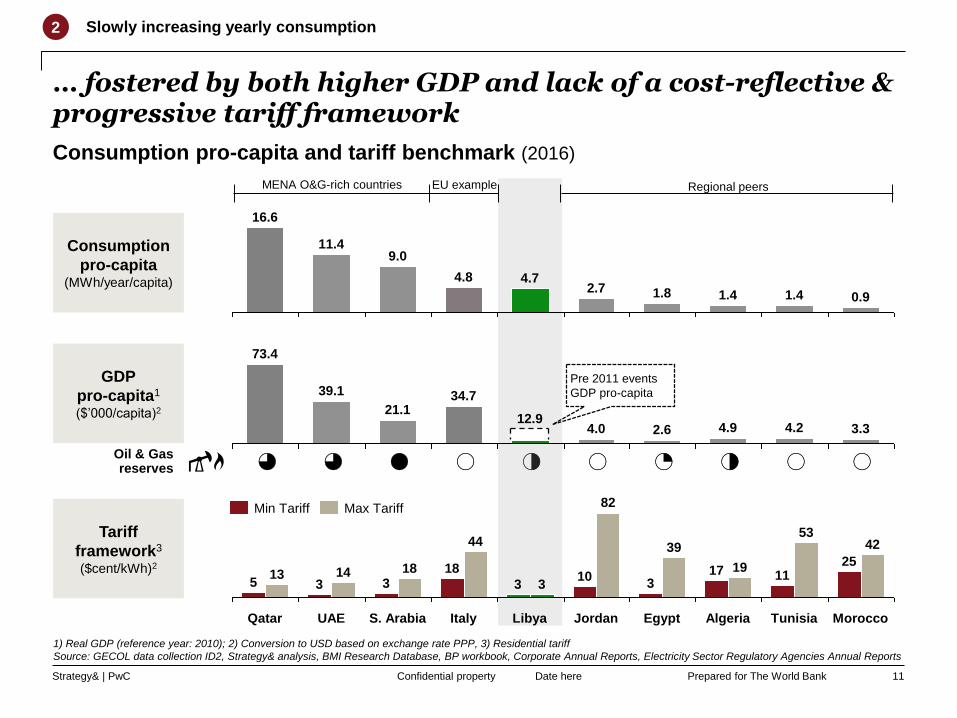
• Libya is a fully electrified country and, among the closest regional peers (e.g. Egypt, Algeria,
Tunisia, Morocco, etc.), shows the highest pro-capita consumption, fostered by both higher GDP
and lack of a cost-reflective and progressive tariff framework
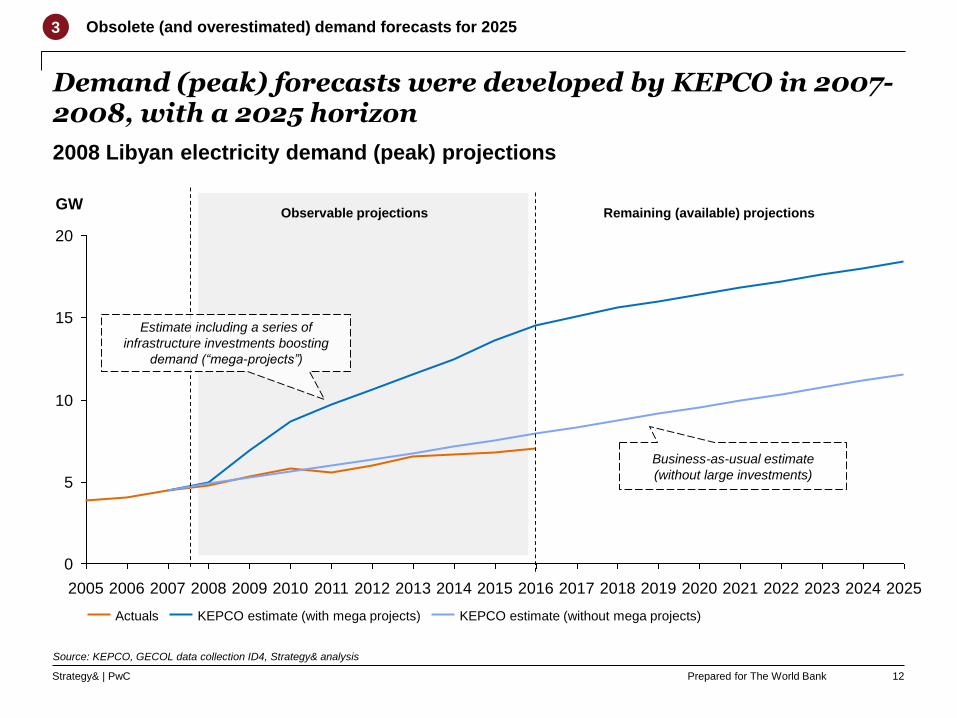
• Latest forecasts were developed by KEPCO in 2007-2008 with a 2025 horizon
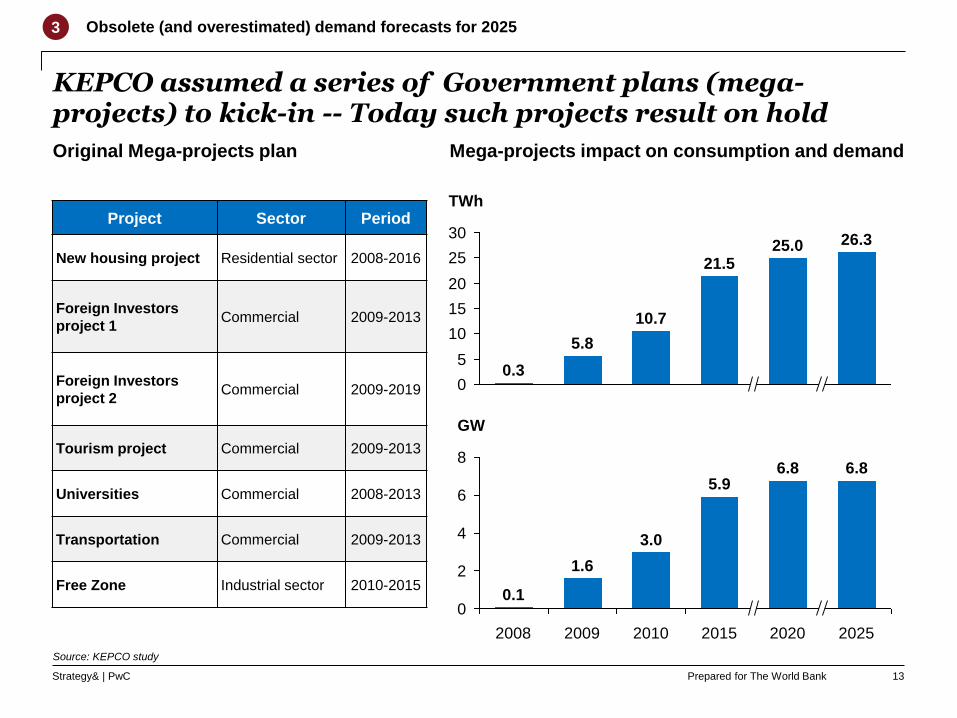
• KEPCO projections assumed a series of mega-projects (investments planned by the Libyan
Government) boosting demand, which today are on hold
• KEPCO projections result obsolete and partially overestimated (especially the scenario with mega-
projects), creating the need for an estimate revision
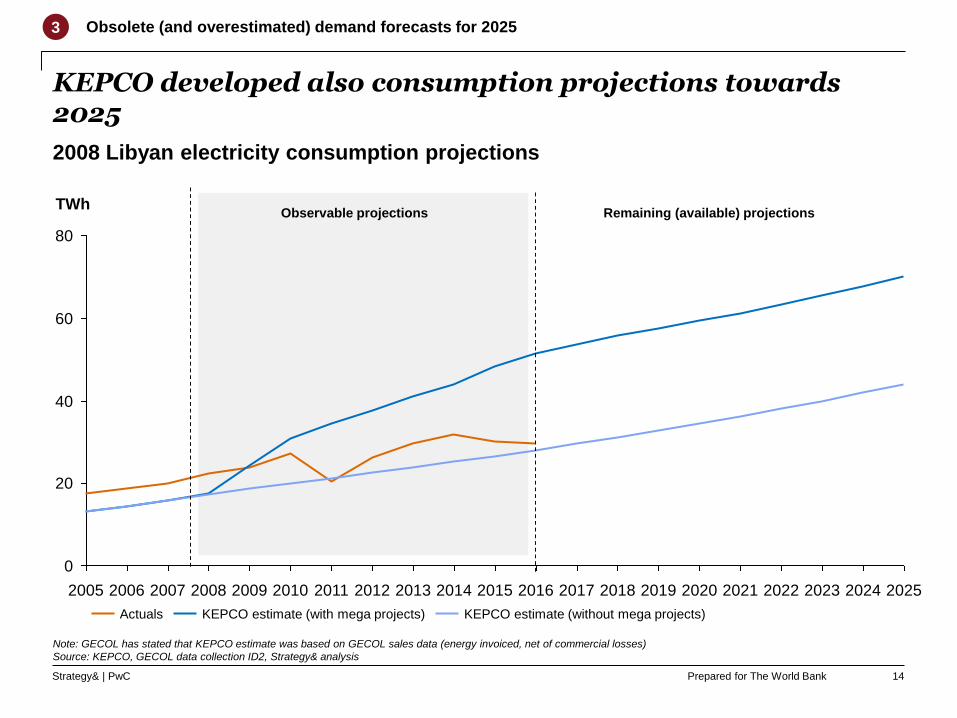
• Revised KEPCO projections recently up-dated by GECOL estimate consumption to be ~88 TWh in
2030
• Alternative scenarios developed on revised GDP and population assumptions (compared to 2008)
estimate Libyan demand and consumption by 2030 within a range of 13-18 GW and 60-80TWh
Slowly increasing
yearly consumption
Obsolete (and
overestimated)
demand forecasts
for 2025
Revised demand
projections,
extended to 2030
Demand (peak)
growing but at lower
rate
1
2
3
4
4
Prepared for The World BankStrategy& | PwC
Electricity demand (peak) growth has slowed down but yet continued after 2011 events, reaching ~7 GW in 2016
9.0
4.0
7.0
5.0
3.0
1.0
6.0
8.0
2.0
0.0
2005
5.8
GW
6.5
20162010 20152000
6.6
3.9
2012
6.8
6.0
2.6
2014
+4%
+8%
2013
7.0
1) GECOL estimates are derived from the KEPCO load forecast model, which takes into consideration the time/season of each distribution regions peak load requirements. The
forecast peak is therefore unconstrained, but is less than the sum of distribution circle peak loads (under investigation/confirmation by GECOL)
Source: GECOL data collection ID4, Strategy& analysis
Peak demand growing but at lower rate1
Post-2011Pre-2011
Peak demand1 evolution
5
Prepared for The World BankStrategy& | PwC
Peaks occur both in summer and in winter …
Aug Sep
6.56.0
6.4
+30%
DecNov
5.3
Oct
6.35.8
5.0
MarFeb
5.4
JulJun
5.1
Jan
6.3
Apr May
5.96.5
5.3
Jan AprFeb
6.36.1
5.4
Mar
6.1
May
6.26.6
Jun Jul
6.3 6.5
DecNov
5.2
4.5
Oct
+46%
Sep
6.5
Aug
DecNovOct
5.6
Aug
6.66.8
5.6
Sep
+30%
6.66.26.4
5.2
Apr
5.9
JulJunJan May
5.4
MarFeb
6.7 6.4
Nov
6.8
Jun
5.1
DecOct
6.0
Sep
6.76.7 7.0
+36%
Aug
6.6
JulAprMar May
6.0
5.2
5.8
Feb
6.56.9
Jan
2013 2014
2015 2016
Monthly peak demand evolution (GW)
1
Source: GECOL data collection ID4, Strategy& analysis
Peak demand growing but at lower rate
6
Prepared for The World BankStrategy& | PwC
… And are concentrated in the Tripoli, West and Middle regions, also in terms of growth
Peak demand evolution – Breakdown by region
Algeria
Niger Chad
Tunisia
Sudan
Egypt
Tripoli Benghazi
West Middle Green Mountain3
South >500
51-500
11-50
1-10
<1
Population
(Inhab./ km2) 2006
30%
26%
12%
7%
22%
30%
8%
6%
25%
35%
4%
0%
Legend
x%
y%
Distribution of peak load
by region (2016, GW) 1
Participation to the growth of
total peak load (2010-16, GW) 2
1 Peak demand growing but at lower rate
1) [Regional peak (GW)] / [Total peak (GW)]; 2) [Regional peak growth (GW)] / [Total peak growth (GW)]; 3) No regional growth can be explained by problems with the transmission
system (esp. in the mountainous region in and around the city of Beida); loads shedding is frequent due to challenging environmental conditions, not yet completed substations,
and lines and damages occurred because of clashes; Source: General Information Authority of Libya, GECOL data collection ID4, Strategy& analysis
7
10.0
6.0
8.0
4.0
2.0
0.0
Peak load(GW)
20122010
6.05.8
+1.3(GW)
7.0
20162014
6.6
Prepared for The World BankStrategy& | PwC
Overall, Libyan consumption has increased slowly since 2012 (with some fluctuations)
5
15
20
0
10
35
30
25
TWh
2015
+3%1
2016
29
2012
32
2010
27
17
26
20142005
3029
12
20132000
Historical electricity consumption evolution
1) From 2011 onwards, political turmoil has destabilized consumption correlation with underlying drivers (e.g. GDP, population – details in Appendix) – Decrease from 2014 is
mostly explained by the instable geopolitical situation in Libya, driving worsening reserve margins and load shedding; 2) Estimate was based on ID24 Gross Generation & Plant
own consumption, and Technical losses from ID24 Generation & ID2/ID37 Consumption; Source: GECOL data collection ID2, GECOL data collection ID37, Strategy& analysis
2 Slowly increasing yearly consumption
Actual Estimate based on Net Generation and Technical losses2
Post-2011Pre-2011
8

Prepared for The World BankStrategy& | PwC
Similarly to peak demand, density is concentrated in the Tripoli, West and Middle areas
Consumption evolution – Breakdown by region1
Algeria
Niger Chad
Tunisia
Sudan
Egypt
Tripoli4 Benghazi
West5 Middle6 Green Mountain7
South >500
51-500
11-50
1-10
<1
Population
(Inhab./ km2) 2006
37%
145%
15%
-33%
16%
76%
7%
-53%
17%
-63%
8%
30%
0.0
30.0
20.0
40.0
10.0
2014
Consumption(TWh) +2.5
(TWh)
2016
29.527.0
20122010
31.7
26.2
Legend
x%
y%
Distribution of consumption by region (2016, TWh) 2
Participation to the growth of
total consumption (2010-16, TWh) 3
2 Slowly increasing yearly consumption
1) Based on Energy supplied to 11kV distribution network (consumption data breakdown by region still to be provided); 2) [Regional consumption (TWh)] / [Total consumption
(TWh)]; 3) [Regional consumption growth (TWh)] / [Total consumption growth (TWh)]; 4) Includes the central government and Jfara; 5) Includes Western Mountain and Gharyan;
6) Includes Tarhouna ; 7) Includes Green Mountain and Derna; Source: General Information Authority of Libya, GECOL data collection ID21, Strategy& analysis
9

Prepared for The World BankStrategy& | PwC
Compared to its regional peers, Libya shows the highest pro-capita and residential electricity consumption …
Date hereConfidential property 10
48%62% 56% 61% 53% 59%
38% 41%47%39%44%52%
100%
Algeria MoroccoTunisia2Libya EgyptJordan
ResidentialOther
0
1
2
3
4
5 4.8
1.3
2.5
Egypt
1.31.7
Libya AlgeriaJordan Morocco
0.9
Tunisia
Slowly increasing yearly consumption2
1) Electrification rate stands for % of population access to electricity. Data refers to 2015, latest historical data-point available
2) Data refers to 2014, latest historical data-point available
Source: GECOL data collection ID2, Strategy& analysis, BMI Research Database, Corporate Annual Reports, Electricity Sector Regulatory Agencies Annual Reports
Consumption
pro-capita(MWh/year/capita)
Share of
residential
consumption(%)
Consumption pro-capita regional benchmark (2015)
Electrification
Rate1100% 99.9% 100% 99.1% 99.8%2 99.2%
Libyan pre 2011 events
share of residential
consumption 35%
Prepared for The World BankStrategy& | PwC
3 3 4 0 2 0 1 2 0 0
… fostered by both higher GDP and lack of a cost-reflective & progressive tariff framework
Date hereConfidential property 11
0.91.4
4.74.8
9.0
1.41.82.7
11.4
16.6
Consumption pro-capita and tariff benchmark (2016)
1) Real GDP (reference year: 2010); 2) Conversion to USD based on exchange rate PPP, 3) Residential tariff
Source: GECOL data collection ID2, Strategy& analysis, BMI Research Database, BP workbook, Corporate Annual Reports, Electricity Sector Regulatory Agencies Annual Reports
Consumption
pro-capita(MWh/year/capita)
Oil & Gasreserves
Pre 2011 events
GDP pro-capita
Slowly increasing yearly consumption2
4.9 4.2 3.32.64.012.9
34.7
73.4
21.1
39.1GDP
pro-capita1
($’000/capita)2
Tariff
framework3
($cent/kWh)2
Algeria
17
Egypt Morocco
2511
Qatar UAE
35
Libya Jordan
310
3
Italy
183
S. Arabia Tunisia
42
13
44
14 18 19
39
3
82
53
Min Tariff Max Tariff
MENA O&G-rich countries Regional peersEU example
Prepared for The World BankStrategy& | PwC
Demand (peak) forecasts were developed by KEPCO in 2007-2008, with a 2025 horizon
Source: KEPCO, GECOL data collection ID4, Strategy& analysis
2008 Libyan electricity demand (peak) projections
2019 20222014 20232017
0
2016 2021 2025202420202018201520132012201120102007 20082006 20092005
10
15
20
5
GW
KEPCO estimate (without mega projects)Actuals KEPCO estimate (with mega projects)
Obsolete (and overestimated) demand forecasts for 20253
Observable projections Remaining (available) projections
Estimate including a series of
infrastructure investments boosting
demand (“mega-projects”)
Business-as-usual estimate
(without large investments)
12
Prepared for The World BankStrategy& | PwC
KEPCO assumed a series of Government plans (mega-projects) to kick-in -- Today such projects result on hold
Project Sector Period
New housing project Residential sector 2008-2016
Foreign Investors
project 1Commercial 2009-2013
Foreign Investors
project 2Commercial 2009-2019
Tourism project Commercial 2009-2013
Universities Commercial 2008-2013
Transportation Commercial 2009-2013
Free Zone Industrial sector 2010-2015
0
25
15
5
10
20
3025.0 26.3
21.5
5.8
0.3
10.7
TWh
Source: KEPCO study
Obsolete (and overestimated) demand forecasts for 20253
Original Mega-projects plan Mega-projects impact on consumption and demand
13
2
0
4
6
86.8
3.0
2025
GW
6.8
20202015
5.9
2010
1.6
0.1
20092008
Prepared for The World BankStrategy& | PwC
KEPCO developed also consumption projections towards 2025
Note: GECOL has stated that KEPCO estimate was based on GECOL sales data (energy invoiced, net of commercial losses)
Source: KEPCO, GECOL data collection ID2, Strategy& analysis
2008 Libyan electricity consumption projections
60
2020 2025
0
2015
20
80
40
20102005 20192017 20232014 20242012 20132006 20092007 2008 2011 2016 2018 2021 2022
TWh
KEPCO estimate (with mega projects)Actuals KEPCO estimate (without mega projects)
Obsolete (and overestimated) demand forecasts for 20253
Remaining (available) projectionsObservable projections
14
Prepared for The World BankStrategy& | PwC
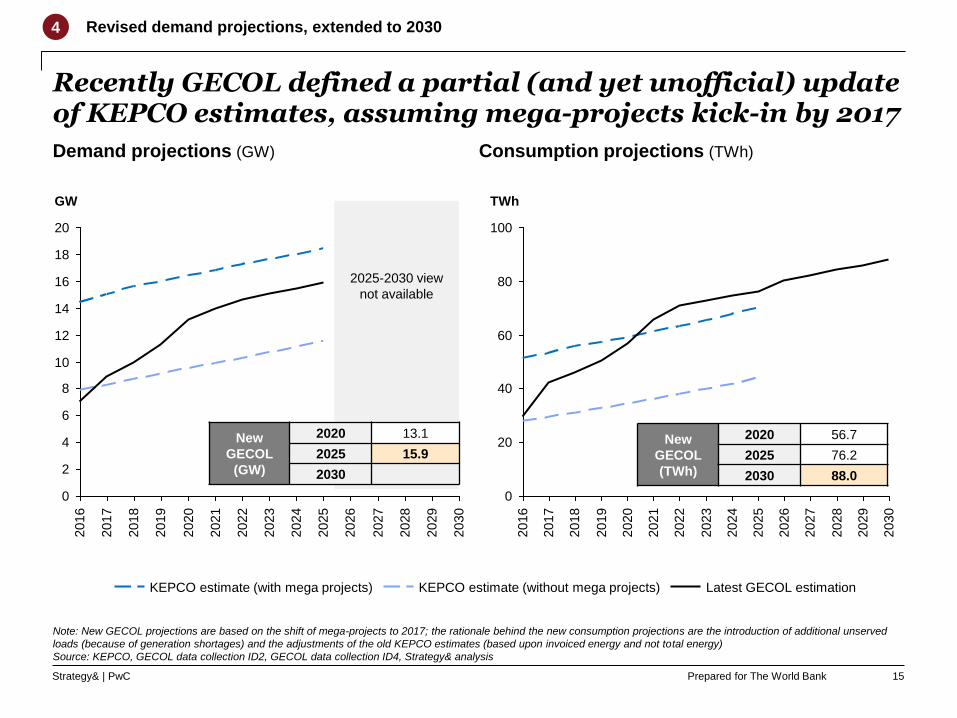
Recently GECOL defined a partial (and yet unofficial) update of KEPCO estimates, assuming mega-projects kick-in by 2017
Demand projections (GW) Consumption projections (TWh)
2025
18
16
12
14
4
6
2029
2
2027
2026
0
20
2024
10
8
2028
2030
2023
2022
2021
2020
2019
2018
2017
2016
GW
KEPCO estimate (without mega projects) Latest GECOL estimationKEPCO estimate (with mega projects)
2017
2018
2016
100
40
2030
2029
2028
20
2026
2025
2024
2023
2027
2021
2022
2020
2019
80
60
0
TWh
Note: New GECOL projections are based on the shift of mega-projects to 2017; the rationale behind the new consumption projections are the introduction of additional unserved
loads (because of generation shortages) and the adjustments of the old KEPCO estimates (based upon invoiced energy and not total energy)
Source: KEPCO, GECOL data collection ID2, GECOL data collection ID4, Strategy& analysis
New
GECOL
(TWh)
2020 56.7
2025 76.2
2030 88.0
2025-2030 view
not available
New
GECOL
(GW)
2020 13.1
2025 15.9
2030
4 Revised demand projections, extended to 2030
15
Prepared for The World BankStrategy& | PwC
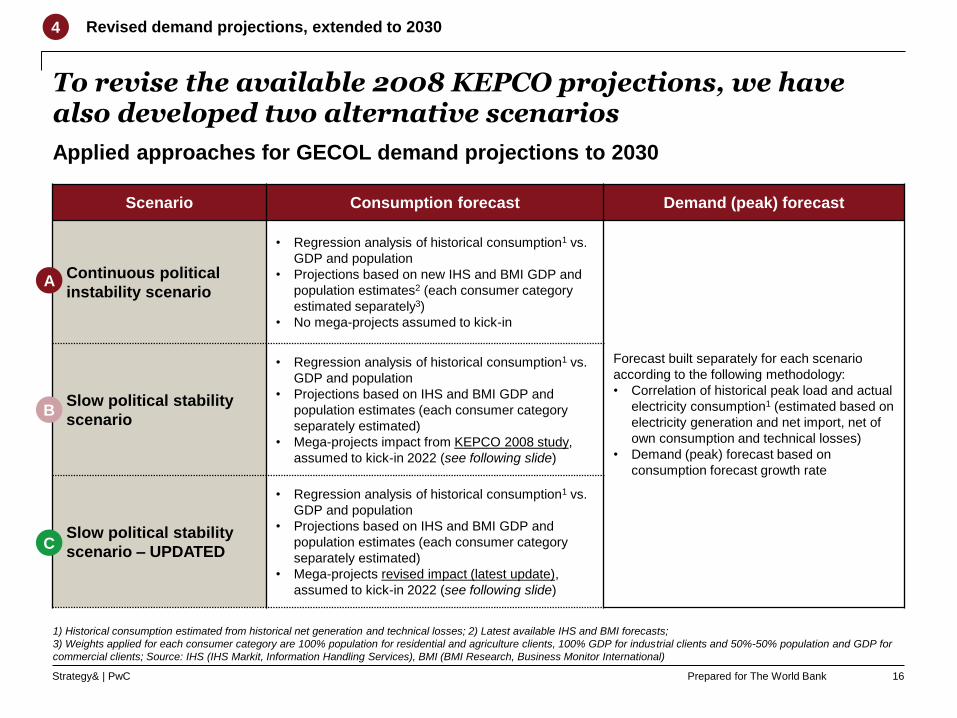
To revise the available 2008 KEPCO projections, we have also developed two alternative scenarios
1) Historical consumption estimated from historical net generation and technical losses; 2) Latest available IHS and BMI forecasts;
3) Weights applied for each consumer category are 100% population for residential and agriculture clients, 100% GDP for industrial clients and 50%-50% population and GDP for
commercial clients; Source: IHS (IHS Markit, Information Handling Services), BMI (BMI Research, Business Monitor International)
Applied approaches for GECOL demand projections to 2030
4 Revised demand projections, extended to 2030
Scenario Consumption forecast Demand (peak) forecast
Continuous political
instability scenario
• Regression analysis of historical consumption1 vs.
GDP and population
• Projections based on new IHS and BMI GDP and
population estimates2 (each consumer category
estimated separately3)
• No mega-projects assumed to kick-in
Forecast built separately for each scenario
according to the following methodology:
• Correlation of historical peak load and actual
electricity consumption1 (estimated based on
electricity generation and net import, net of
own consumption and technical losses)
• Demand (peak) forecast based on
consumption forecast growth rate
Slow political stability
scenario
• Regression analysis of historical consumption1 vs.
GDP and population
• Projections based on IHS and BMI GDP and
population estimates (each consumer category
separately estimated)
• Mega-projects impact from KEPCO 2008 study,
assumed to kick-in 2022 (see following slide)
Slow political stability
scenario – UPDATED
• Regression analysis of historical consumption1 vs.
GDP and population
• Projections based on IHS and BMI GDP and
population estimates (each consumer category
separately estimated)
• Mega-projects revised impact (latest update),
assumed to kick-in 2022 (see following slide)
A
B
16
C
Prepared for The World BankStrategy& | PwC
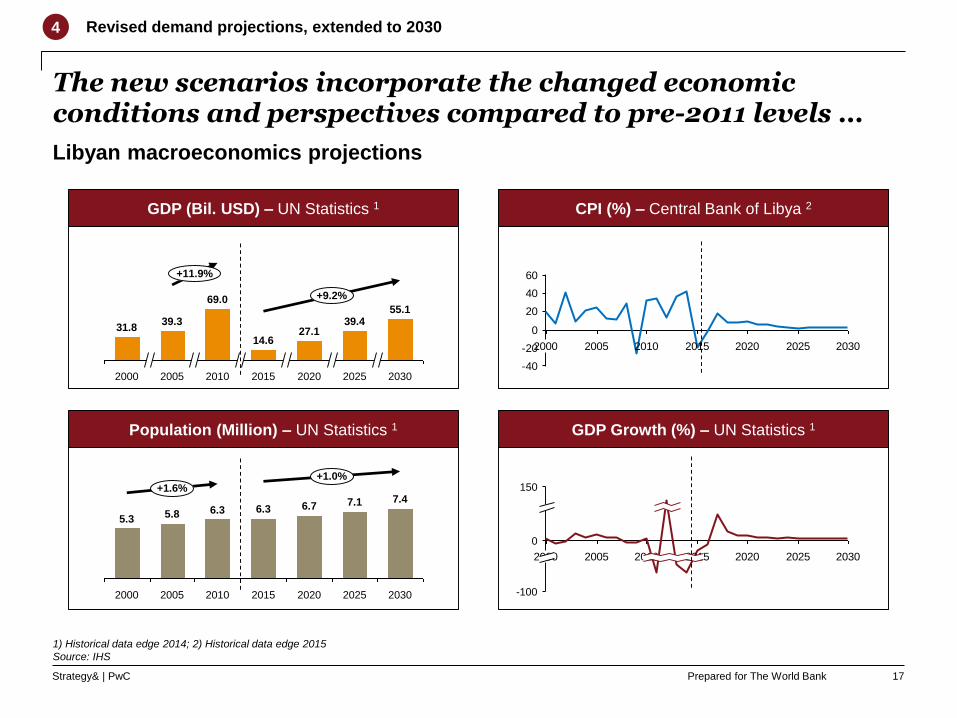
The new scenarios incorporate the changed economic conditions and perspectives compared to pre-2011 levels …
CPI (%) – Central Bank of Libya 2
GDP Growth (%) – UN Statistics 1
-40
-20
0
20
40
60
2000 2005 2010 2015 2020 2025 2030
2000 2005 2010 2015 2020 2025 2030
150
-100
0
Libyan macroeconomics projections
GDP (Bil. USD) – UN Statistics 1
Population (Million) – UN Statistics 1
2000 2025
7.1
+1.6%
20102005
5.36.3
7.4
2020
6.7
2015 2030
6.35.8
+1.0%
2005
39.355.1
+9.2%
39.4
14.6
2015
+11.9%
2020
27.1
2010
69.0
20252000
31.8
2030
1) Historical data edge 2014; 2) Historical data edge 2015
Source: IHS
4 Revised demand projections, extended to 2030
17

Prepared for The World BankStrategy& | PwC
12
14
10
24
20
4
6
0
8
2
16
22
18
20292028
TWh
2030
23.3
21.5
0.0
20272025
10.7
15.1
20232022
0.3
13.1
18.7
2026
5.8
17.1
2020 20242021
0.0
2019
0.0
2018
0.0
2017
0.0
Period of renewed political stability and public investments
16
12
10
8
18
6
4
2
0
22
20
14
24
20272026
6.75.7
202320222020
0.0
2019
0.0 0.0
2018
0.0
2017
10.2
2.5
0.1
7.5
9.58.2
2025 20292028
TWh
2024
4.7
2021
0.0
2030
… And include an updated view on “mega-projects” ramp-up (now estimated to start in 2022) and impact
“Mega-projects” ramp-up projections
Source: KEPCO, IHS, Strategy& analysis
4 Revised demand projections, extended to 2030
18
Political instability
period conservatively
assumed to last for five
more years
Revision of the impact
of the 650 development
projects in GECOL’s
database
Scenario B
Scenario C
Mega-projects
(KEPCO 2008
impact)
Mega-projects
(latest update)
Prepared for The World BankStrategy& | PwC
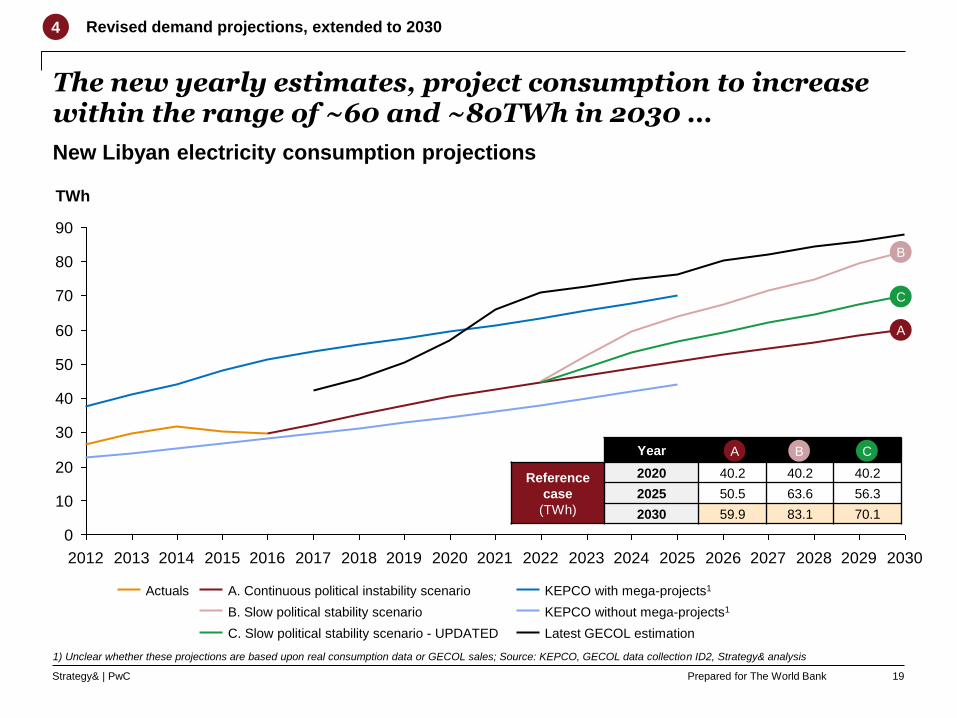
The new yearly estimates, project consumption to increase within the range of ~60 and ~80TWh in 2030 …
New Libyan electricity consumption projections
4
1) Unclear whether these projections are based upon real consumption data or GECOL sales; Source: KEPCO, GECOL data collection ID2, Strategy& analysis
Revised demand projections, extended to 2030
2012 2013 2014 2015 2016 2017 2018 2019 2020 2021 2022 2023 2024 2025 2026 2027 2028 2029 2030
70
40
90
80
50
60
30
20
10
0
TWh
KEPCO with mega-projects1A. Continuous political instability scenario
KEPCO without mega-projects1
Latest GECOL estimation
B. Slow political stability scenario
Actuals
C. Slow political stability scenario - UPDATED
Year A B C
Reference
case
(TWh)
2020 40.2 40.2 40.2
2025 50.5 63.6 56.3
2030 59.9 83.1 70.1
B
A
A B
19
C
C
Prepared for The World BankStrategy& | PwC
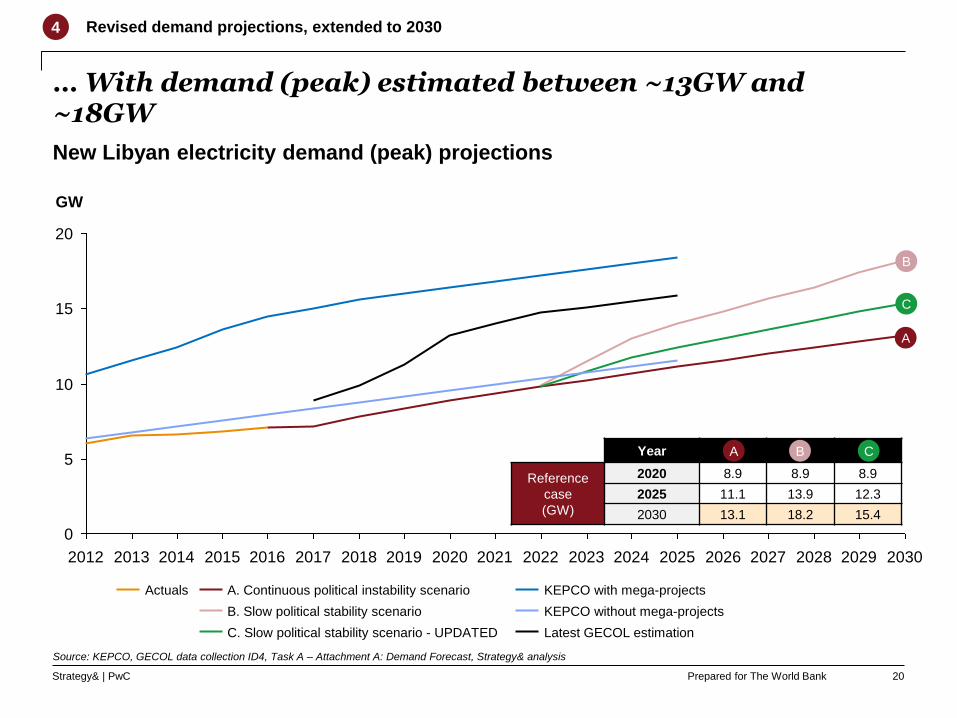
… With demand (peak) estimated between ~13GW and ~18GW
New Libyan electricity demand (peak) projections
4
Source: KEPCO, GECOL data collection ID4, Task A – Attachment A: Demand Forecast, Strategy& analysis
Revised demand projections, extended to 2030
2012 2013 2014 2015 2016 2017 2018 2019 2020 2021 2022 2023 2024 2025 2026 2027 2028 2029 2030
20
0
5
15
10
GW
C. Slow political stability scenario - UPDATED
B. Slow political stability scenario
Actuals
KEPCO without mega-projects
Latest GECOL estimation
KEPCO with mega-projectsA. Continuous political instability scenario
Year A B C
Reference
case
(GW)
2020 8.9 8.9 8.9
2025 11.1 13.9 12.3
2030 13.1 18.2 15.4
A
B
A B
20
C
C

Prepared for The World BankStrategy& | PwC
Demand
Generation
Transmission
Distribution and supply
Supply / demand balance
Governance and sector structure
References for analysis update
21

Prepared for The World BankStrategy& | PwC
Libyan generation sector today is fully managed by GECOL, who produces electricity through 15 thermal power plants
Libyan power generation overview
Sources: GECOL data collection ID1, GECOL data collection ID12, GECOL data collection ID17, GECOL data collection ID22, Strategy& analysis
Steam turbine Gas turbine Combined Cycle
Technology
Libyan power generation in a nutshell
Generation capacity
(2016)
• Nameplate: 10.3 GW
• Installed: 7.5 GW
Technology mix
(% of installed capacity
by technology, 2016)
• Steam turbine: 14%
• Gas turbine: 48%
• Combined Cycle: 38%
No. of units
(2016)
68 (of which active 61),
15 thermal power plants
Sector operator 100% GECOL
No. of FTE employed
in the generation
sector (2016 y/e)
5,326 employees (11% of total
FTEs)
Generation
asset value
(Net asset value, 2014)
1.28 Bn LD
Number of FTEs per
MW installed capacity
(2016)
0.52 FTEs / MW
Zawia Tripoli
Khoms
Misurata
Benghazi
Derna
Sarir
ZwetinaWest Mountain
Khaleej
Tobruk
22
Prepared for The World BankStrategy& | PwC
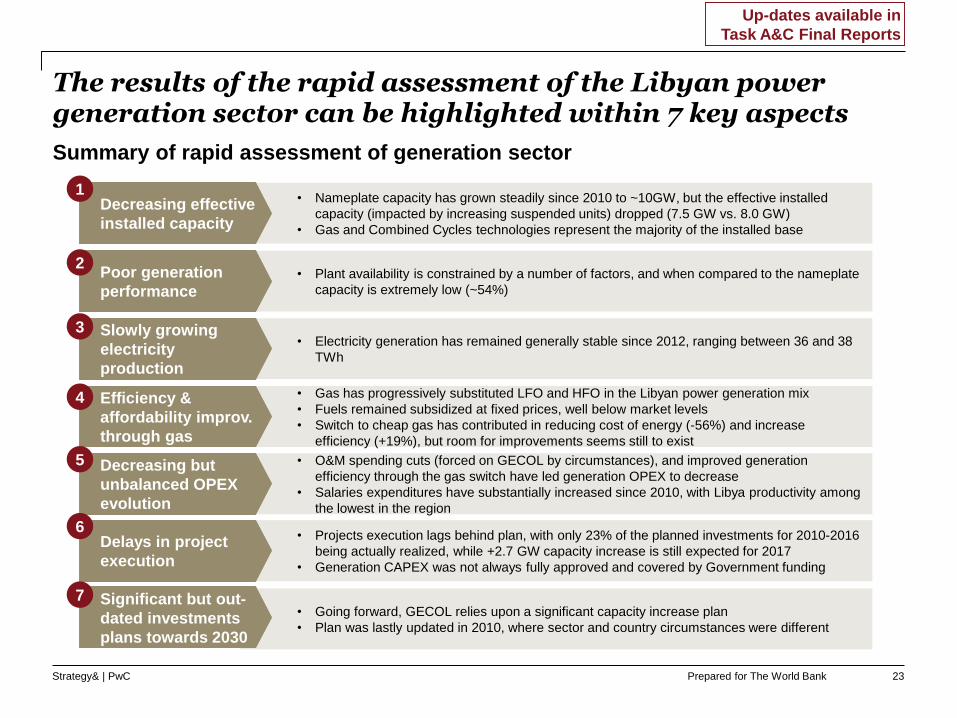
• Going forward, GECOL relies upon a significant capacity increase plan
• Plan was lastly updated in 2010, where sector and country circumstances were different
• Nameplate capacity has grown steadily since 2010 to ~10GW, but the effective installed
capacity (impacted by increasing suspended units) dropped (7.5 GW vs. 8.0 GW)
• Gas and Combined Cycles technologies represent the majority of the installed base
The results of the rapid assessment of the Libyan power generation sector can be highlighted within 7 key aspects
Summary of rapid assessment of generation sector
Decreasing effective
installed capacity
• Plant availability is constrained by a number of factors, and when compared to the nameplate
capacity is extremely low (~54%)
Poor generation
performance
• O&M spending cuts (forced on GECOL by circumstances), and improved generation
efficiency through the gas switch have led generation OPEX to decrease
• Salaries expenditures have substantially increased since 2010, with Libya productivity among
the lowest in the region
Decreasing but
unbalanced OPEX
evolution
• Projects execution lags behind plan, with only 23% of the planned investments for 2010-2016
being actually realized, while +2.7 GW capacity increase is still expected for 2017
• Generation CAPEX was not always fully approved and covered by Government funding
Delays in project
execution
Significant but out-
dated investments
plans towards 2030
• Electricity generation has remained generally stable since 2012, ranging between 36 and 38
TWh
Slowly growing
electricity
production
1
6
7
2
• Gas has progressively substituted LFO and HFO in the Libyan power generation mix
• Fuels remained subsidized at fixed prices, well below market levels
• Switch to cheap gas has contributed in reducing cost of energy (-56%) and increase
efficiency (+19%), but room for improvements seems still to exist
Efficiency &
affordability improv.
through gas
5
4
3
23
Up-dates available in
Task A&C Final Reports
Prepared for The World BankStrategy& | PwC
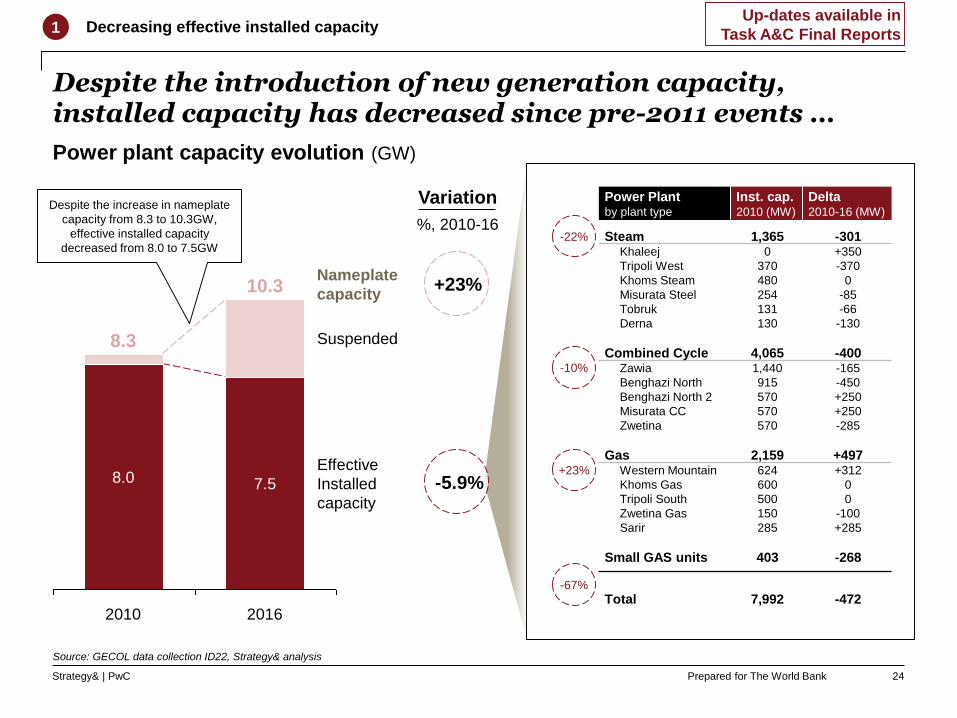
Despite the introduction of new generation capacity, installed capacity has decreased since pre-2011 events …
Source: GECOL data collection ID22, Strategy& analysis
Decreasing effective installed capacity1
Power plant capacity evolution (GW)
8.3
2016
10.3
8.0 7.5
2010
Effective
Installed
capacity
Suspended
Power Plantby plant type
Inst. cap.2010 (MW)
Delta2010-16 (MW)
Steam 1,365 -301Khaleej 0 +350
Tripoli West 370 -370
Khoms Steam 480 0
Misurata Steel 254 -85
Tobruk 131 -66
Derna 130 -130
Combined Cycle 4,065 -400Zawia 1,440 -165
Benghazi North 915 -450
Benghazi North 2 570 +250
Misurata CC 570 +250
Zwetina 570 -285
Gas 2,159 +497Western Mountain 624 +312
Khoms Gas 600 0
Tripoli South 500 0
Zwetina Gas 150 -100
Sarir 285 +285
Small GAS units 403 -268
Total 7,992 -472
-22%
-10%
+23%
-67%
+23%
Variation
%, 2010-16
Nameplate
capacity
-5.9%
Despite the increase in nameplate
capacity from 8.3 to 10.3GW,
effective installed capacity
decreased from 8.0 to 7.5GW
24
Up-dates available in
Task A&C Final Reports
Prepared for The World BankStrategy& | PwC
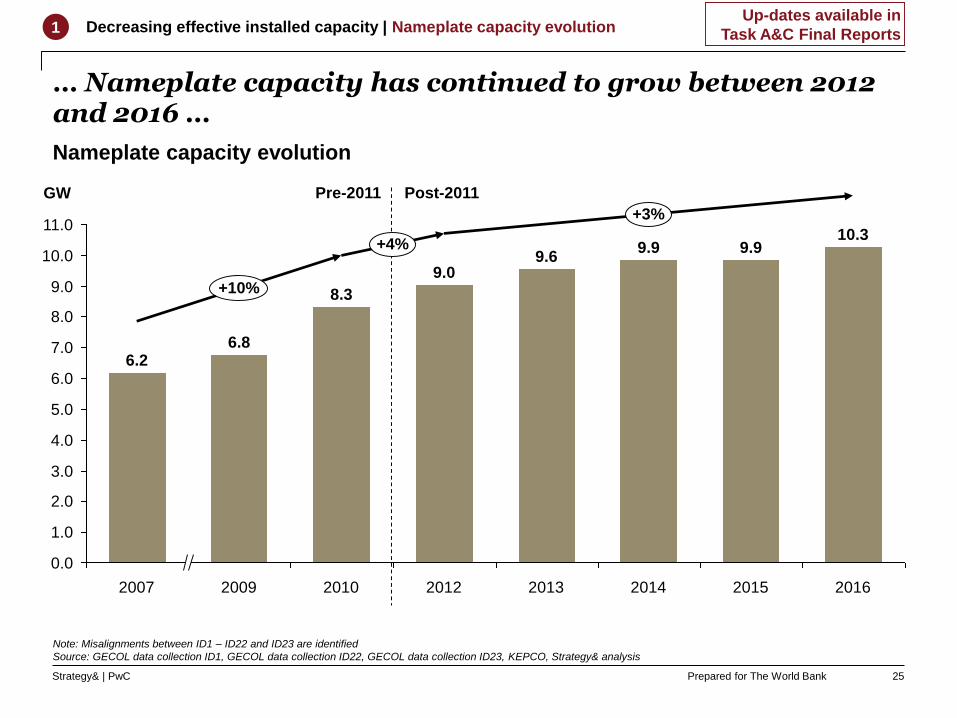
… Nameplate capacity has continued to grow between 2012 and 2016 …
11.0
10.0
4.0
1.0
9.0
5.0
8.0
6.0
7.0
3.0
2.0
0.0
+4%
2016
10.3
+10%
+3%
8.3
GW
2009 2012
6.2
2013
9.9
2007
6.8
9.69.9
2010 2014
9.0
2015
Note: Misalignments between ID1 – ID22 and ID23 are identified
Source: GECOL data collection ID1, GECOL data collection ID22, GECOL data collection ID23, KEPCO, Strategy& analysis
Post-2011Pre-2011
Nameplate capacity evolution
1 Decreasing effective installed capacity | Nameplate capacity evolution
25
Up-dates available in
Task A&C Final Reports

Prepared for The World BankStrategy& | PwC
9.69.9
10.39.9
6.86.2
8.3
9.0
11.0
4.0
2.0
8.0
10.0
6.0
0.0
3.0
5.0
9.0
7.0
1.0
GW
+10%
7.77.68.0
2009
6.47.1
7.9
2010
6.1
2014201320122007
-6% +2%
2016
7.5
2015
… But with increasingly suspended units the effective installed capacity decreased to 7.5GW (vs. 8GW in 2010)
1) The installed capacity includes all nameplate capacity of generating units available in that year, including the small Diesel and Gas turbine (most of them out of life time) and
excludes the generating units suspended in that year (over-time / long-term maintenance, cannibalized units)
Source: GECOL data collection ID1, GECOL data collection ID22, GECOL data collection ID23, KEPCO, Strategy& analysis
Post-2011Pre-2011
Effective installed capacity evolution
1 Decreasing effective installed capacity | Effective installed capacity evolution
Suspended units1 (e.g. long-term
maintenance, cannibalized units)
Effective installed capacity
26
Up-dates available in
Task A&C Final Reports

Prepared for The World BankStrategy& | PwC
Installed capacity density and growth is concentrated in Tripoli and the Middle regions …
Effective installed capacity overview – Breakdown by region1
1) Breakdown does not include installed capacity of small and rented gas / diesel plants;
2) [Regional installed capacity (GW)] / [Total installed capacity (GW)]; 3) [Regional installed capacity growth (GW)] / [Total installed capacity growth (GW)];
Source: General Information Authority of Libya, GECOL data collection ID22, Strategy& analysis
Algeria
Niger Chad
Tunisia
Sudan
Egypt
Tripoli Benghazi
West Middle Green Mountain
South
38%
-35%
17%
-42%
22%
-51%
8%
+60%
12%
+66%
1%
-42%
10.0
6.0
2.0
4.0
0.0
8.0
Effective installedcapacity(GW)
7.5
2014 2016
-0.5(GW)
8.0
2012
7.1
2010
7.6
Legend
x%
y%
Distribution of installed capacity by region (2016, GW) 2
Participation to the growth of
total installed capacity (2010-16, GW) 3
1 Decreasing effective installed capacity | Effective installed capacity evolution
27
Prepared for The World BankStrategy& | PwC
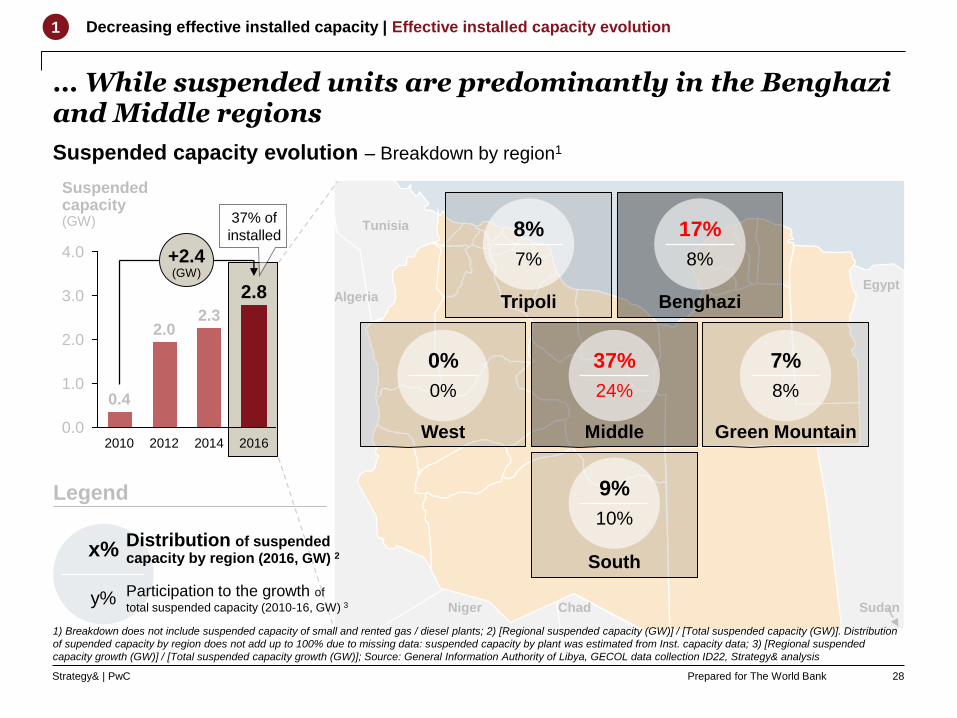
… While suspended units are predominantly in the Benghazi and Middle regions
Suspended capacity evolution – Breakdown by region1
Algeria
Niger Chad
Tunisia
Sudan
Egypt
Tripoli Benghazi
West Middle Green Mountain
South
8%
7%
17%
8%
37%
24%
9%
10%
0%
0%
7%
8%
4.0
0.0
1.0
3.0
2.0
Suspendedcapacity(GW)
2.8
2010
0.4
+2.4(GW)
20162014
2.3
2012
2.0
Legend
x%
y%
Distribution of suspended capacity by region (2016, GW) 2
Participation to the growth of
total suspended capacity (2010-16, GW) 3
37% of
installed
1 Decreasing effective installed capacity | Effective installed capacity evolution
28
1) Breakdown does not include suspended capacity of small and rented gas / diesel plants; 2) [Regional suspended capacity (GW)] / [Total suspended capacity (GW)]. Distribution
of supended capacity by region does not add up to 100% due to missing data: suspended capacity by plant was estimated from Inst. capacity data; 3) [Regional suspended
capacity growth (GW)] / [Total suspended capacity growth (GW)]; Source: General Information Authority of Libya, GECOL data collection ID22, Strategy& analysis
Prepared for The World BankStrategy& | PwC
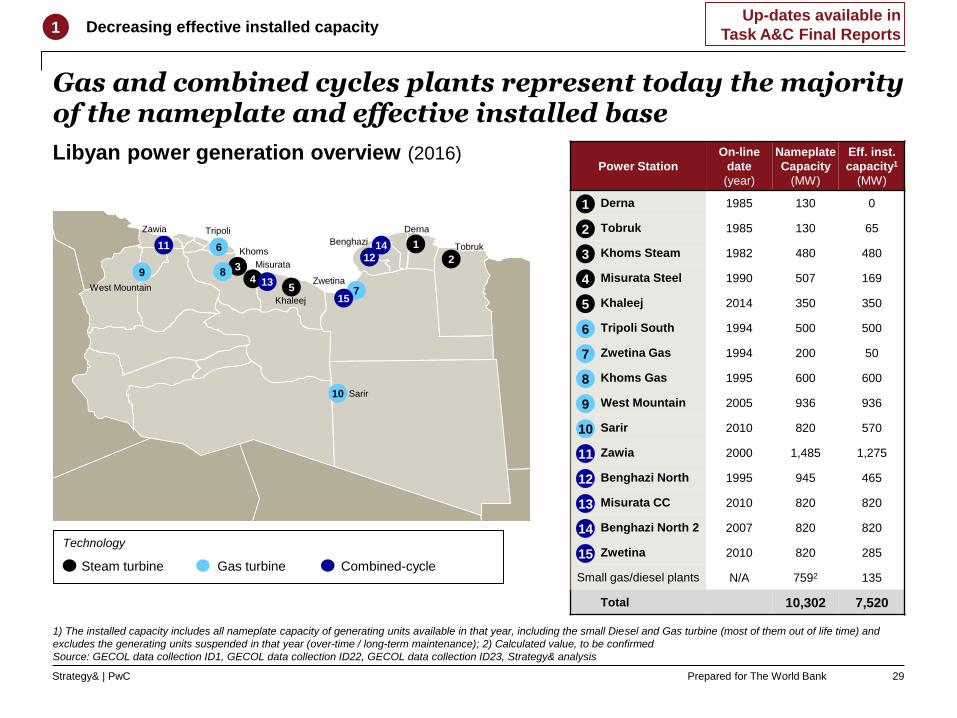
Gas and combined cycles plants represent today the majority of the nameplate and effective installed base
Power Station
On-line
date
(year)
Nameplate
Capacity
(MW)
Eff. inst.
capacity1
(MW)
Derna 1985 130 0
Tobruk 1985 130 65
Khoms Steam 1982 480 480
Misurata Steel 1990 507 169
Khaleej 2014 350 350
Tripoli South 1994 500 500
Zwetina Gas 1994 200 50
Khoms Gas 1995 600 600
West Mountain 2005 936 936
Sarir 2010 820 570
Zawia 2000 1,485 1,275
Benghazi North 1995 945 465
Misurata CC 2010 820 820
Benghazi North 2 2007 820 820
Zwetina 2010 820 285
Small gas/diesel plants N/A 7592 135
Total 10,302 7,520
1
2
3
4
5
6
7
8
9
10
11
12
13
14
Libyan power generation overview (2016)
1) The installed capacity includes all nameplate capacity of generating units available in that year, including the small Diesel and Gas turbine (most of them out of life time) and
excludes the generating units suspended in that year (over-time / long-term maintenance); 2) Calculated value, to be confirmed
Source: GECOL data collection ID1, GECOL data collection ID22, GECOL data collection ID23, Strategy& analysis
Decreasing effective installed capacity1
15Steam turbine Gas turbine Combined-cycle
Technology
29
Zawia Tripoli
Khoms
Misurata
Benghazi
Derna
Sarir
ZwetinaWest Mountain
Khaleej
Tobruk1
23
4
6
7
89
10
1112
13
14
155
Up-dates available in
Task A&C Final Reports
Prepared for The World BankStrategy& | PwC
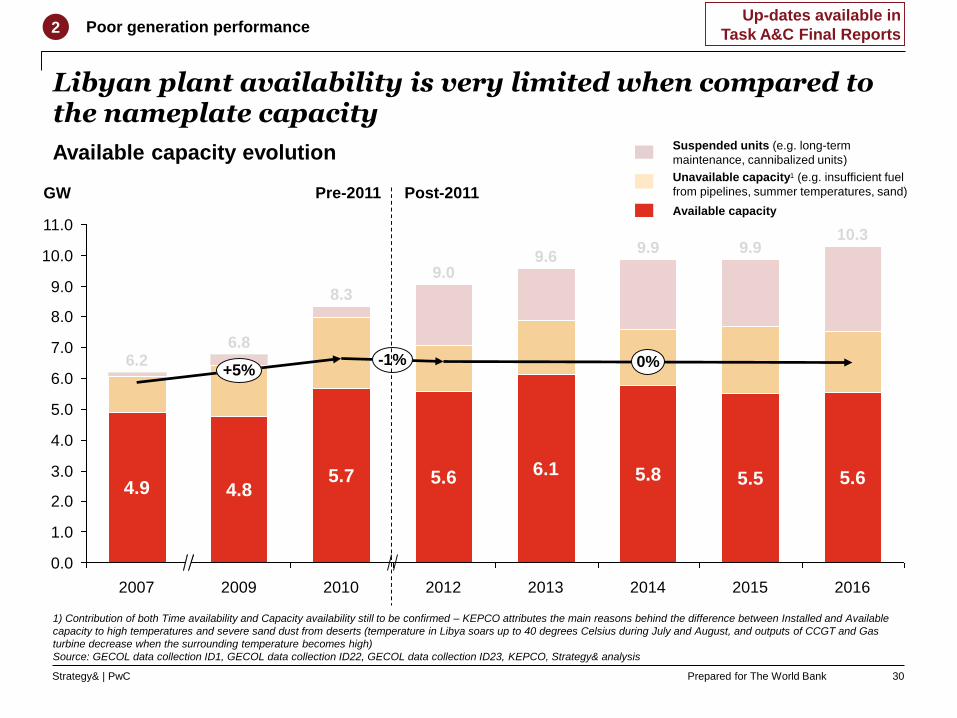
9.0
9.99.6
6.2
9.910.3
8.3
6.8
4.0
1.0
10.0
6.0
9.0
2.0
0.0
8.0
7.0
3.0
11.0
5.0
5.5
GW
2014
5.6
+5%
2016
5.8
2012
-1% 0%
20152013
6.1
2010
5.7
2009
5.64.9
2007
4.8
Libyan plant availability is very limited when compared to the nameplate capacity
1) Contribution of both Time availability and Capacity availability still to be confirmed – KEPCO attributes the main reasons behind the difference between Installed and Available
capacity to high temperatures and severe sand dust from deserts (temperature in Libya soars up to 40 degrees Celsius during July and August, and outputs of CCGT and Gas
turbine decrease when the surrounding temperature becomes high)
Source: GECOL data collection ID1, GECOL data collection ID22, GECOL data collection ID23, KEPCO, Strategy& analysis
Post-2011Pre-2011
Available capacity evolution
Poor generation performance2
Suspended units (e.g. long-term
maintenance, cannibalized units)
Unavailable capacity1 (e.g. insufficient fuel
from pipelines, summer temperatures, sand)
Available capacity
30
Up-dates available in
Task A&C Final Reports
Prepared for The World BankStrategy& | PwC
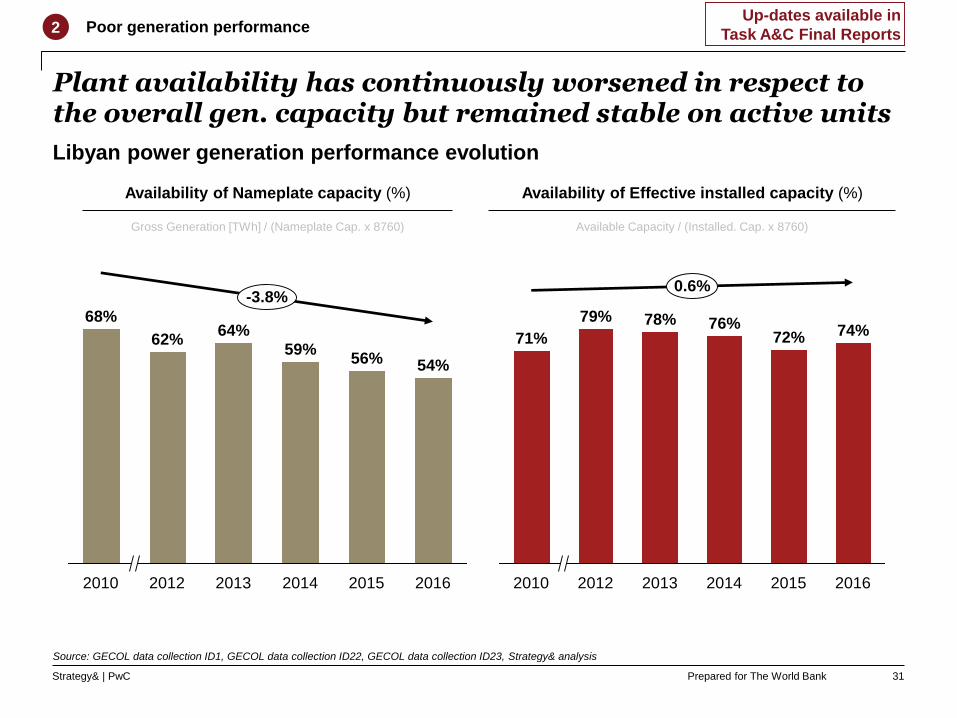
Plant availability has continuously worsened in respect to the overall gen. capacity but remained stable on active units
Availability of Nameplate capacity (%)
Source: GECOL data collection ID1, GECOL data collection ID22, GECOL data collection ID23, Strategy& analysis
-3.8%
56%
2014 2015
59%
2013 2016
54%
62%
2010
68%64%
2012
Gross Generation [TWh] / (Nameplate Cap. x 8760)
Poor generation performance2
Libyan power generation performance evolution
2010 2013 2014
71%
2012
0.6%
74%76%78%
2015 2016
79%
72%
Availability of Effective installed capacity (%)
Available Capacity / (Installed. Cap. x 8760)
31
Up-dates available in
Task A&C Final Reports

Prepared for The World BankStrategy& | PwC
Overall electricity generation has remained mostly stable since 2012, ranging between 36 and 38 TWh
10
5
20
40
35
30
25
15
0
TWh
2000 2015
37.7
2010
32.5
2013
37.9
15.3
2012
36.234.0
2005
36.4
22.4
-1%
20162014
Source: GECOL data collection ID24, Strategy& analysis
Slowly growing electricity generation3
Electricity generated
Electricity Generated (ID24)
Electricity generated (ID 37) 36.8 35.431.0 34.431.5 N/A
32
Prepared for The World BankStrategy& | PwC
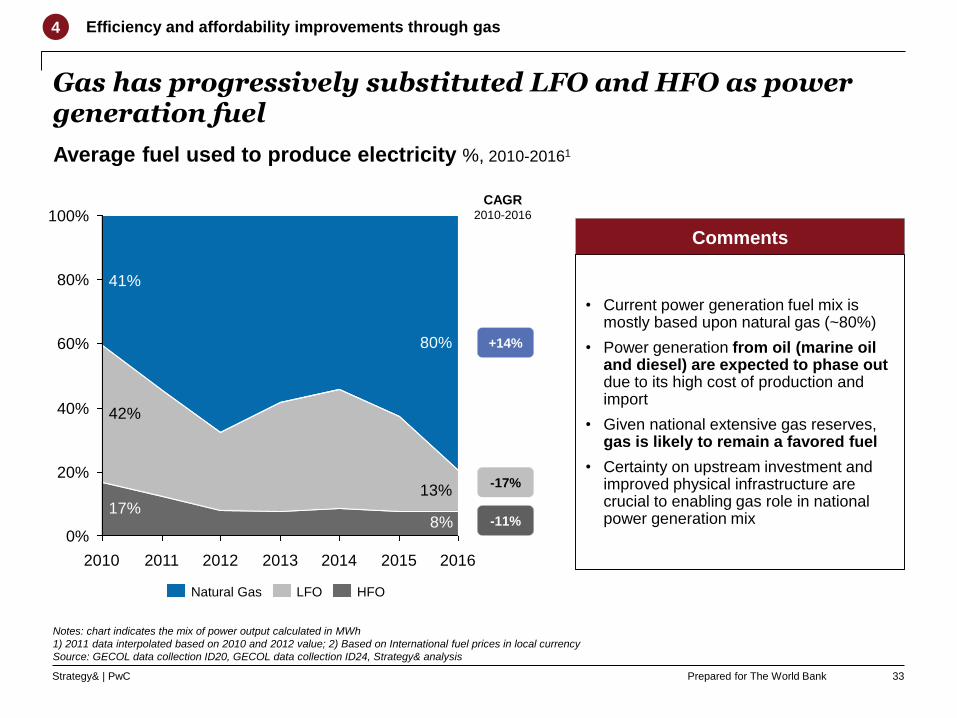
Gas has progressively substituted LFO and HFO as power generation fuel
+14%
-11%
CAGR2010-2016
Notes: chart indicates the mix of power output calculated in MWh
1) 2011 data interpolated based on 2010 and 2012 value; 2) Based on International fuel prices in local currency
Source: GECOL data collection ID20, GECOL data collection ID24, Strategy& analysis
-17%
Average fuel used to produce electricity %, 2010-20161
Efficiency and affordability improvements through gas4
8%17%
13%
42%
80%
41%80%
40%
20%
0%
60%
100%
2012 20132010 2011 201620152014
HFONatural Gas LFO
• Current power generation fuel mix is mostly based upon natural gas (~80%)
• Power generation from oil (marine oil and diesel) are expected to phase out due to its high cost of production and import
• Given national extensive gas reserves, gas is likely to remain a favored fuel
• Certainty on upstream investment and improved physical infrastructure are crucial to enabling gas role in national power generation mix
Comments
33

Prepared for The World BankStrategy& | PwC
18.436.0
18.418.418.4
2009-162006 2007 20082002-05
Fuels have remained at fixed prices well below market (but also officially-set?) levels
1) International fuel price in local currency; 2) In 2008, a Governement decree officially set a gas price increase which, however, was never implemented
Source: GECOL data collection ID20, Strategy& analysis
27%
10%
98%
73%
90%
100%
HFOLFOGas
2%
344555377
Price paid (by GECOL)Differential to international
fuel price in local currency
GECOL prices paid vs. market levels1
(2015, % and LD / m3 and LD/1000m3 for gas)
Fuel price evolution (GECOL price paid 2002-2016, market levels 2015)
8.48.48.4 8.4 20.0
NG
LD/ 1000m3
HFO
LD/ m3
LFO
LD/ m3
NOC has continued to
invoice GECOL the previous2
rate of 8.4 LD/ 1000m3
Market
price1
377.1
344.2
554.8
Efficiency and affordability improvements through gas4
LD/ 1000m3
34
150.0
56.036.066.0 86.0
Prepared for The World BankStrategy& | PwC
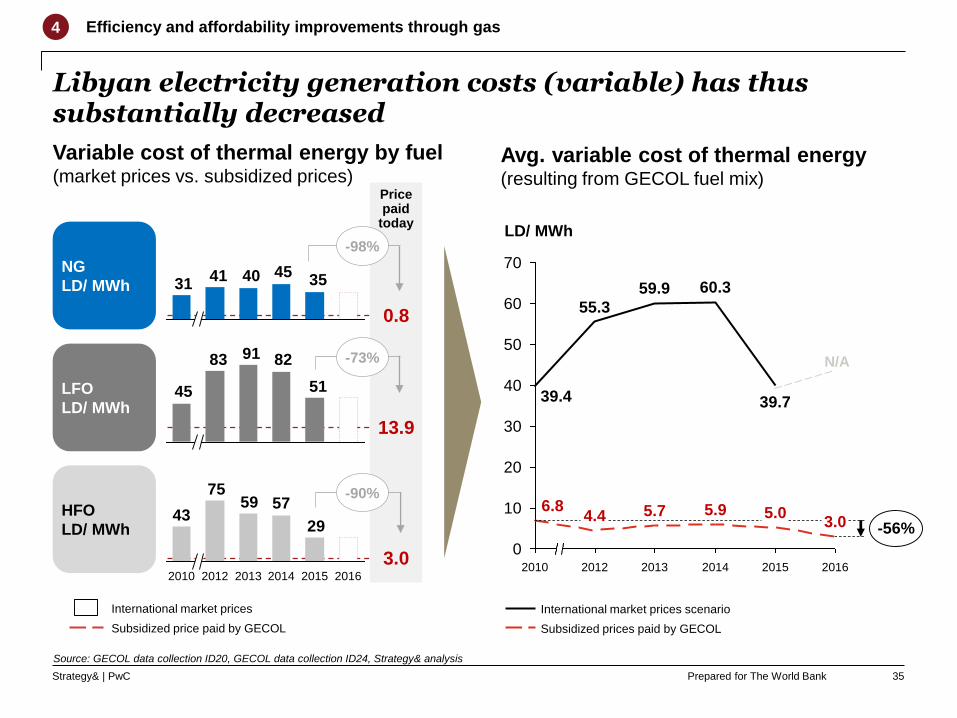
Libyan electricity generation costs (variable) has thus substantially decreased
35
Efficiency and affordability improvements through gas4
NG
LD/ MWh
HFO
LD/ MWh
LFO
LD/ MWh
Variable cost of thermal energy by fuel(market prices vs. subsidized prices)
0.8
13.9
3.0
35454041
31
29
575975
43
2010 2013 2014 201620152012
51
829183
45
Avg. variable cost of thermal energy(resulting from GECOL fuel mix)
Subsidized prices paid by GECOL
International market prices scenario
Source: GECOL data collection ID20, GECOL data collection ID24, Strategy& analysis
0
10
20
30
40
50
60
70
2012 20132010 2015 20162014
LD/ MWh
55.3
60.3
-56%5.0
39.7
4.4
59.9
3.05.95.76.8
39.4
N/A
-98%
-73%
-90%
International market prices
Subsidized price paid by GECOL
Price paid
today
Prepared for The World BankStrategy& | PwC
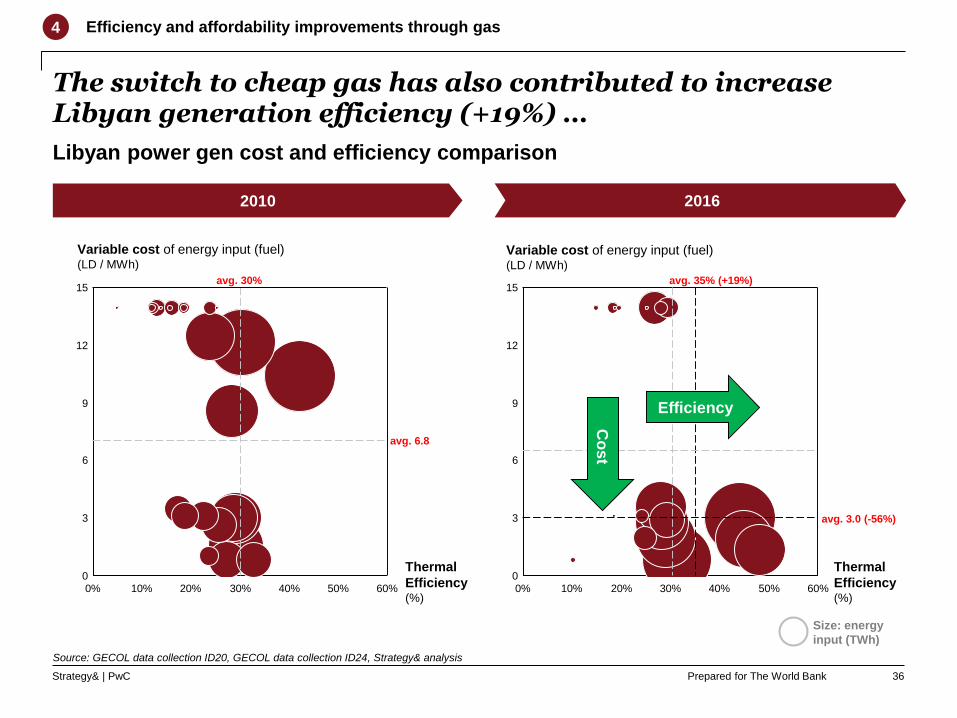
The switch to cheap gas has also contributed to increase Libyan generation efficiency (+19%) …
40%
15
12
6
9
3
060%30% 50%20%10%0% 60%
12
040%
15
6
3
30% 50%0%
9
20%10%
avg. 30% avg. 35% (+19%)
avg. 3.0 (-56%)
Variable cost of energy input (fuel)(LD / MWh)
Variable cost of energy input (fuel)(LD / MWh)
Thermal
Efficiency (%)
Thermal
Efficiency (%)
2010 2016
Co
st
Libyan power gen cost and efficiency comparison
Efficiency and affordability improvements through gas4
Source: GECOL data collection ID20, GECOL data collection ID24, Strategy& analysis
Efficiency
36
Size: energy
input (TWh)
avg. 6.8
Prepared for The World BankStrategy& | PwC
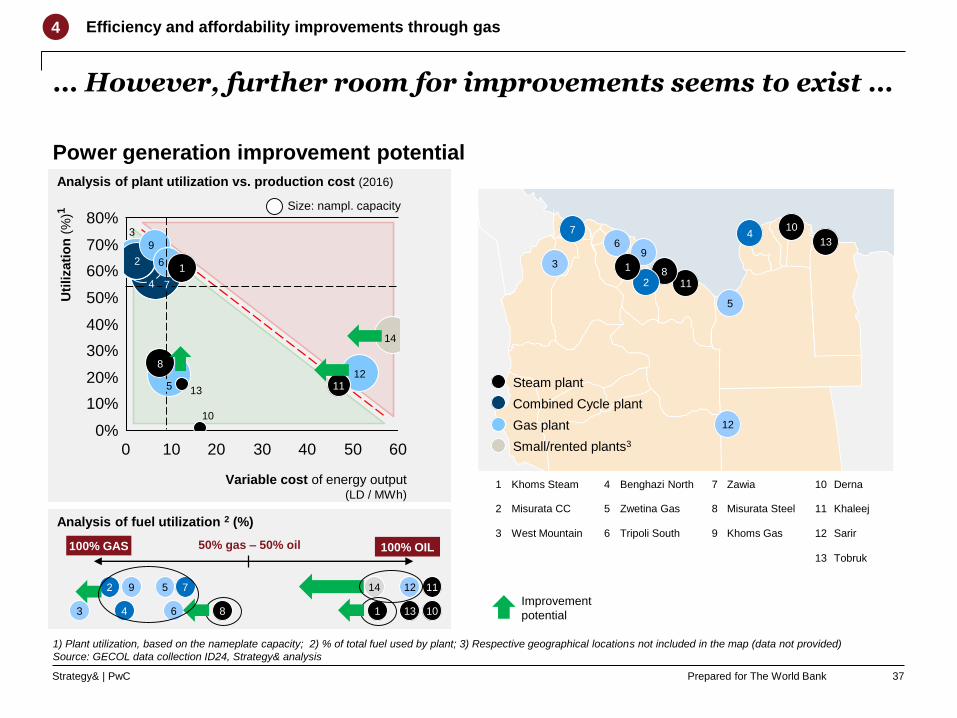
Analysis of plant utilization vs. production cost (2016)
Analysis of fuel utilization 2 (%)
… However, further room for improvements seems to exist …
1) Plant utilization, based on the nameplate capacity; 2) % of total fuel used by plant; 3) Respective geographical locations not included in the map (data not provided)
Source: GECOL data collection ID24, Strategy& analysis
Efficiency and affordability improvements through gas4
13
12
11
10
9
8
7
6
5
4
3
2
1
1
2
3
4
5
Khoms Steam
Misurata CC
West Mountain
Benghazi North
Zwetina Gas
6
7
8
9
10
Tripoli South
Zawia
Misurata Steel
Khoms Gas
Derna
11
12
13
Khaleej
Sarir
Tobruk
60
80%
30%
10%
0 10
20%
30
40%
0%
50%
60%
70%
504020
13
Uti
lizati
on
(%
)1
Variable cost of energy output(LD / MWh)
14
1
1211
7
5
3
9
8
4
2
10
6
Small/rented plants3
Combined Cycle plant
Gas plant
Steam plant
100% GAS 100% OIL
5
43 6 8
92 7 14 11
1 1013
12
50% gas – 50% oil
Power generation improvement potential
Size: nampl. capacity
Improvement
potential
37

Prepared for The World BankStrategy& | PwC
Khoms Steam 61%
Misurata CC 63%
Western Mountain 64%
Benghazi North 63%
Zwetina Gas 20%
Tripoli South 63%
Zawia 59%
Misurata Steel 25%
Khoms Gas 69%
Sarir 16%
Small/rented plants 35%
Derna 0.2%
Khaleej 21%
Tobruk 17%
… In 2016 for example, 18% of production was still generated by plants fueled with oil (possible gas supply constraints?)
38
2
120
503
403
1,052
223
1,144
299
395
194
304
177
0
2,484
Fuel type by plant (2016)
0
15
3,340
0
2,370
0
1,197
4,933
330
0
6,491
5,264
4,428
79
GAS-based production (MWh) OIL-based production (MWh)
6.6 TWh18% of total
production(2016)
13
12
11
10
9
8
7
6
5
4
3
2
1
14
Possible
constraints on
gas supply?
Utilization1
1) Plant utilization, based on the nameplate capacity
Source: GECOL data collection ID24, Strategy& analysis
Efficiency and affordability improvements through gas4
224 Mn LYD
Theoretical savings (2016). Scenario based on:
• CC plants 100% fueled with gas, at 85% utilization
• Sarir plant 100% fueled with gas, at 2016 utilization Gas plant
Small/rented plants
Steam plant
CC plant
Prepared for The World BankStrategy& | PwC
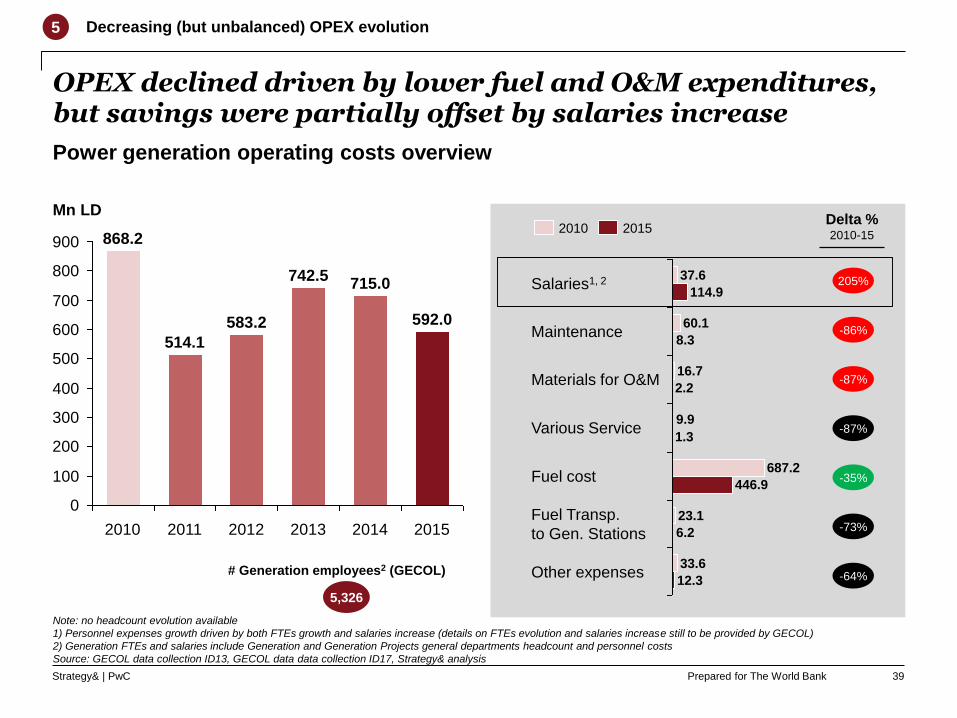
OPEX declined driven by lower fuel and O&M expenditures, but savings were partially offset by salaries increase
600
400
200
0
800
700
900
500
100
300
514.1
2010
868.2
2015
715.0
Mn LD
20142013
742.5
592.0
2012
583.2
2011
Power generation operating costs overview
33.6
687.2Fuel cost
23.1
16.7
6.2
Materials for O&M
Other expenses
Fuel Transp.
to Gen. Stations
446.9
Various Service
12.3
1.3
9.9
2.2
Maintenance8.3
37.6
60.1
Salaries1, 2114.9
20152010
5,326
# Generation employees2 (GECOL)
Delta %2010-15
205%
-86%
-35%
-73%
-87%
-87%
-64%
Note: no headcount evolution available
1) Personnel expenses growth driven by both FTEs growth and salaries increase (details on FTEs evolution and salaries increase still to be provided by GECOL)
2) Generation FTEs and salaries include Generation and Generation Projects general departments headcount and personnel costs
Source: GECOL data collection ID13, GECOL data data collection ID17, Strategy& analysis
Decreasing (but unbalanced) OPEX evolution5
39
Prepared for The World BankStrategy& | PwC
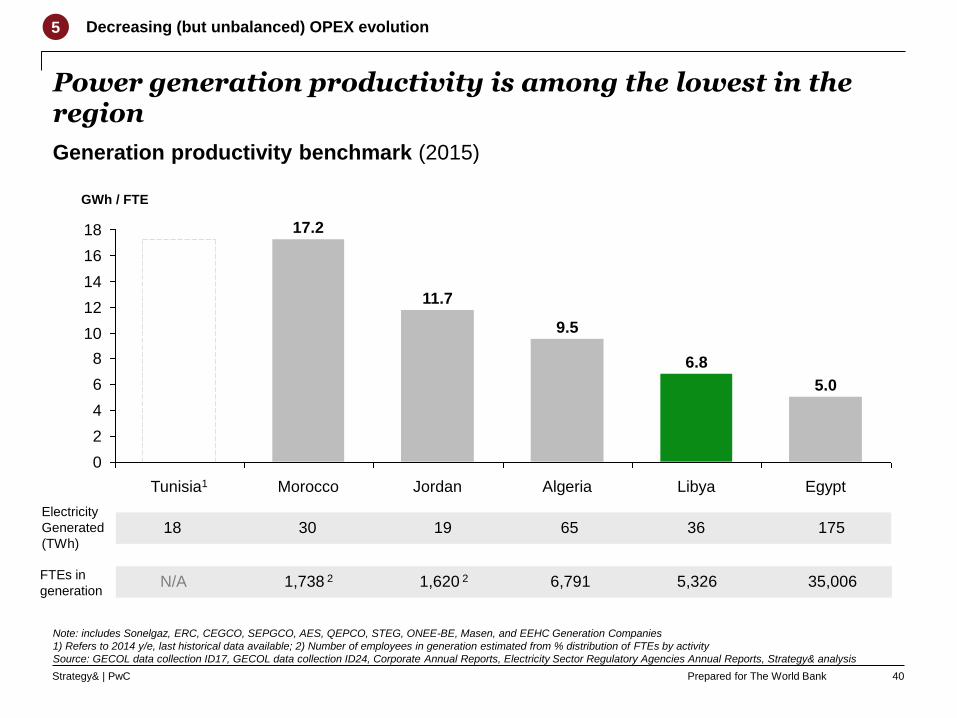
Power generation productivity is among the lowest in the region
Generation productivity benchmark (2015)
Note: includes Sonelgaz, ERC, CEGCO, SEPGCO, AES, QEPCO, STEG, ONEE-BE, Masen, and EEHC Generation Companies
1) Refers to 2014 y/e, last historical data available; 2) Number of employees in generation estimated from % distribution of FTEs by activity
Source: GECOL data collection ID17, GECOL data collection ID24, Corporate Annual Reports, Electricity Sector Regulatory Agencies Annual Reports, Strategy& analysis
18 30 19 65 17536Electricity
Generated
(TWh)
N/A 1,738 2 1,620 2 6,791 5,326 35,006FTEs in
generation
0
2
4
6
8
10
12
14
16
18
Tunisia1
6.8
Libya
17.2
Jordan
9.5
Algeria
11.7
Morocco
GWh / FTE
Egypt
5.0
Decreasing (but unbalanced) OPEX evolution5
40

Prepared for The World BankStrategy& | PwC
Projects execution lagged behind plan, with only 23% of the planned investments for 2010-2016 being actually realized
Planned capacity expansions (nameplate) vs. realized GW, 2010-2016
2
94
5
Under
Construction
& Contracted
2010-2016
77%
Actually
realized
2010-20164
Total Planned,
contracted
and under
construction
2010-2016
Planned
Projects
2010-2016
PlannedGeneration
typeMW1,2 On-line
date
Misurata II Combined
Cycle
750 2014
Militah 1400 2015
Bumba Gulf - 1,500 2015
Tripoli East Steam 350 2018
Under construction
and contracted
Generation
typeMW1,2 On-line
date
Sarir
Gas
285 2011
Ubari 750 2012
Misurata I
Combined
Cycle
250 2011
Benghazi North II 250 2011
Zwetina I 250 2013
Khaleej (or Gulf)
Steam
1,400 2013
Tripoli West II 1,400 2014
1) Nameplate capacity breakdown by plant still to be provided (data to be confirmed)
2) Considering the entry into force at full capacity;
3) Plant extension has been fully commissioned but due to technical or operational problems some unit
Are either suspended, out of service or not operational; full operation is thus estimated in 2017
4) Data inconsistency about nameplate capacity to be resolved (possibly includes also additional plants)
Source: GECOL data collection ID1, GECOL presentation (2010), Strategy& analysis
Old plan
Delays in project execution6
Projects planned in 2010, fully finalized in 2016
Projects planned in 2010, partially finalized in 2016
Projects planned in 2010, still not operative in 2016
3
3
41
Up-dates available in
Task A&C Final Reports

Prepared for The World BankStrategy& | PwC
Since 2012, Government did not always approve the
CAPEX actually expensed by GECOL
CAPEX slowed down substantially, and despite this the expenditures were not always fully ratified by Government
Generation CAPEX evolution1
Note: In accordance with Libyan subsidized tariff framework, to date all investment in electricity infrastructure (incl. generation capacity) has been made by Gov’t, either directly or
indirectly; CAPEX is normally compensated to GECOL ex-post, with Ministry of planning approving the proposed CAPEX budget, and Ministry of Finance allocating such funding
Sources: GECOL data collection ID15, Strategy& analysis
0
1,000
500
2,000
1,500
2010 2011
502
1,936
137
1,191
2012
485
2013
704
2015
-36%
1,223
20162014
Mn LD
CAPEX (effectively expensed by sector opreator) CAPEX approved by Government
Delays in project execution6
42

Prepared for The World BankStrategy& | PwC
Going forward, GECOL relies upon a significant capacity increase plan (name-plate) …
Source: GECOL data collection ID1, GECOL data collection ID23, GECOL presentation (2010 ), Strategy& analysis
PlannedGeneration
typeMW
On-line
date
Tripoli East
Steam
1,400 2021
Tobruk 700 2021
Derna 700 2022
Benghazi West 1,400 2026
SabhaGas
855 2021
Tripoli South II 855 2023
Misurata II
Combined
Cycle
750 2021
Militah 1,640 2021
Zwetina II 820 2021
Tubrok 820 2022
AbouKammash 820 2025
Under construction
and commissioning
Generation
typeMW
On-line
date
KhaleejSteam
1,050 2019
Tripoli West II 1,400 2020
Ubari
Gas
470 2018
Ubari 154 2017
Alhoms II 524 2017
Tripoli South I 141 2017
Zahra 94 2017
Nameplate capacity planned expansion GW, 2017-2030
Significant but outdated investments plans towards 20307
8
-2
12
4
2
6
10
0
14
1614.6
0.9
2030
2027
2029
2028
2026
0.7
2025
13.9
0.6
2024
3.3
2022
-0.2
0.6
2023
-0.2
12.413.0
10.3
11.8
1.5
2020
0.9
2021
0.9
-1.3-0.6
1.1
-0.3
1.8
2018
0.8
2019
2017
0.4
2.0
7.0
4.6
1.7
Divestments
Under constr. & contr.
Planned
New capacity (nameplate, cumulated)
43
Up-dates available in
Task A&C Final Reports

Prepared for The World BankStrategy& | PwC
Demand
Generation
Transmission
Distribution and supply
Supply / demand balance
Governance and sector structure
References for analysis update
44
Prepared for The World BankStrategy& | PwC
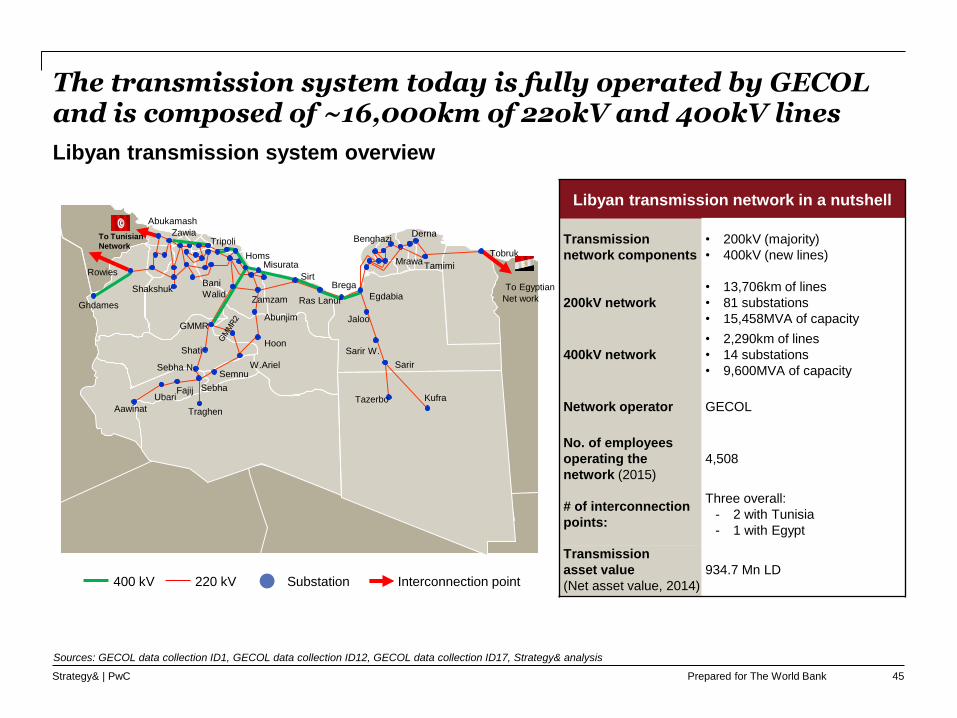
The transmission system today is fully operated by GECOL and is composed of ~16,000km of 22okV and 400kV lines
Libyan transmission network in a nutshell
Transmission
network components
• 200kV (majority)
• 400kV (new lines)
200kV network
• 13,706km of lines
• 81 substations
• 15,458MVA of capacity
400kV network
• 2,290km of lines
• 14 substations
• 9,600MVA of capacity
Network operator GECOL
No. of employees
operating the
network (2015)
4,508
# of interconnection
points:
Three overall:
- 2 with Tunisia
- 1 with Egypt
Transmission
asset value
(Net asset value, 2014)
934.7 Mn LD
Libyan transmission system overview
400 kV 220 kV Interconnection pointSubstation
Sources: GECOL data collection ID1, GECOL data collection ID12, GECOL data collection ID17, Strategy& analysis
Kufra
Sarir W.
Benghazi
Egdabia
Sirt
Hoon
GMMR
Homs
TripoliZawia
Tobruk
Sebha
To Tunisian
Network
Tazerbo
Sarir
Jaloo
Brega
Ras LanufZamzam
Abunjim
W.Ariel
Traghen
Semnu
Shati
FajijUbari
Aawinat
Bani
Walid
TamimiMrawa
Derna
Misurata
Abukamash
Shakshuk
Rowies
Sebha N.
Ghdames
To Egyptian
Net work
45

Prepared for The World BankStrategy& | PwC
• Network has suffered from substantial damages in the past years, which caused inefficiencies to
the grid operation & management
• Libyan transmission losses have remained constant at pre-2011 levels at ~1.8%
• Technical performance is in line with regional peers
• Transmission OPEX are continuously increasing, driven by salaries
The results of the rapid assessment of the Libyan transmission sector can be summarized in 4 key areas
Summary of rapid assessment of transmission sector
Stable technical
performance
Continuous cost
increase
Structurally weak /
damaged network
• CAPEX in transmission have substantially decreased
• Government has not always approved CAPEX actually expended by the sector operator
• GECOL is pursuing plans to reinforce the transmission system with 400kV lines, but the status of
implementation is uncertain and seems to lag behind
Decreasing
investments and
unclear new
projects status
1
3
4
2
46
Up-dates available in
Task A&C Final Reports

Prepared for The World BankStrategy& | PwC
In the last years the transmission system has suffered from damages, evidencing structural weaknesses
Structural network weaknesses
Structurally weak / damaged network1
Sources: GECOL data collection ID2, GECOL data collection ID22, Strategy& analysis
Issues / damages occurred in the period 2011-2016
Damages / issues overview
• Since 2011 the Libyan transmission system
suffered many incidence of damage due to:
– Military clashes between factions
– Acts of vandalism and theft
• Overall lines, sub-stations & cables were affected
• Incidents led to isolation of complete regions until
GECOL was able to repair or replace the
damaged infrastructure (in some cases repairs
took several months or even years)
• Most severe and longest lasting cases are
damages in the south and west of Benghazi city in
2014/2015 (yellow circle in the map), which led to:
– Separation of network into an Eastern and
Western section
– Load shedding in Benghazi
– Shortages in generation in the Western
network and consequent load shedding
• Other damages to the transmission have led to
prolonged outages in the south western and south
eastern regions, with consequent isolation of
power plants or reduction in supplies
• In almost every case GECOL has been able to
eventually repair, replace or compensate for the
damaged parts of the network
400 kV 220 kV Interconnection pointSubstation
Kufra
Sarir W.
Benghazi
Egdabia
Sirt
Hoon
GMMR
Homs
TripoliZawia
Tobruk
Sebha
To Tunisian
Network
Tazerbo
Sarir
Jaloo
Brega
Ras LanufZamzam
Abunjim
W.Ariel
Traghen
Semnu
Shati
FajijUbari
Aawinat
Bani
Walid
TamimiMrawa
Derna
Misurata
Abukamash
Shakshuk
Rowies
Sebha N.
Ghdames
To Egyptian
Net work
47

Prepared for The World BankStrategy& | PwC
Technical performances remained constant, with losses generally maintained at pre-2011 levels
Stable technical performance2
1.0%
2.5%
1.5%
0.0%
0.5%
2.0%
3.0%
1.8% 1.7%
2.5%
2014
1.7%
1.8%
1.8%
201520132012
2.5%
(%)2
1.6%
2011
2.4%
1.7%
1.7%
2010
25
10
5
30
40
20
35
15
0
TWh and %
Electricity
generated
(ID37)
34.81.8%35.4
Electricity
entered the
distribution
network
98.2%
-0.6
Transmission
Losses
100%
1) Transmission losses are assumed by GECOL based on the load flow studies (further investigations ongoing); 2) Transmission losses: (net electricity generated – electricity
entered the distribution network) / (net electricity generated); 3) Additional transmission losses if generation data from ID24 is considered (delta ID24 vs. ID37 is proportionally
distributed between transmission and Distribution losses of ID37); Source: GECOL data collection ID24, GECOL data collection ID37, Strategy& analysis
Evolution of transmission losses1 Electricity entering distribution system (2015)
Transmission Losses incidence on Generation (ID37)
Inconsistency vs. Generation (ID24)3
36.2 TWh
(ID 24)
48
PRELIMINARY

Prepared for The World BankStrategy& | PwC
Performances showed are in line with regional peers
0%
5%
10%
15%
20%
25%
30%
35%
40%
500200 4001000 300
Total Length of the T&D System (‘000 km)
Transmission grid length (%)
as % of total T&D grid length
JordanEgypt
Tunisia1
Morocco
Libya
Algeria
4%
4%
4%
2%
2%
2%
3%0% 4% 5%2%1%
Jordan
Egypt
Tunisia1
Libya
Morocco
Algeria
Note: includes Sonelgaz, NEPCO, STEG, ONEE-BE and Egyptian Electricity Transmission Company
1) Data refers to STEG annual report 2014, last available data point; 2) Indicate numbers are estimated
Sources: GECOL data collection ID1 and ID37, BMI Research Database, Corporate Annual Reports, Electricity Sector Regulatory Agencies Annual Reports, Strategy& analysis
Benchmarking sample (2015) Transmission losses benchmarking (2015) 2
Stable technical performance2
49
PRELIMINARY

Prepared for The World BankStrategy& | PwC
OPEX have continuously increased, mostly driven by salaries
140
120
100
80
60
40
20
0
92.8
Mn LD
2014
130.4
2010 2012
113.1
20152013
128.5
69.6
119.2
+6.7%
2011
Continuous cost increase3
Transmission O&M cost overview
Fuel Transp.
to Gen. Stations 0
0
Other expenses
11.4
Materials for O&M
4.1
0.3
0.4
6.2
16.0
Maintenance
Fuel cost
Salaries1
0.8
108.0
37.6
Various Service
18.6
13.9
4.0
20152010
4,508
# Transmission FTEs1 (GECOL) - 2016
Delta %2010-15
+187%
-39%
+74%
N.A.
-74%
-96%
-71%
Note: No headcount evolution available
1) Transmission FTEs and salaries include Transmission, Transmission Projects and Control general departments headcount and personnel costs
Source: GECOL data collection ID13, GECOL data collection ID17, Strategy& analysis
50

Prepared for The World BankStrategy& | PwC
Since 2012, Government did not always approve the
CAPEX actually expensed by GECOL
CAPEX in the transmission sector slowed down substantially and was not always fully approved by Government …
Transmission CAPEX evolution1
Note: In accordance with the Libyan subsidized tariff framework, CAPEX expenses are separately covered by the government through ad-hoc capital injections; CAPEX is normally
compensated to the sector operator (GECOL) ex-post, with Ministry of planning approving the proposed CAPEX budget, and Ministry of Finance allocating such funding
1) Includes both new transmission grids investments and major overhauls; data on the exact split of the two components has not been received
Sources: GECOL data collection ID15, Strategy& analysis
400
600
1,000
1,200
800
0
200
1,100
300
500
900
100
700
Mn LD
20162015
-35%
86
191
20112010
484
2012 2013
305
163
1,174
2014
446
CAPEX approved by GovernmentCAPEX (effectively expensed by sector opreator)
Decreasing investments and unclear new projects status4
51
Prepared for The World BankStrategy& | PwC
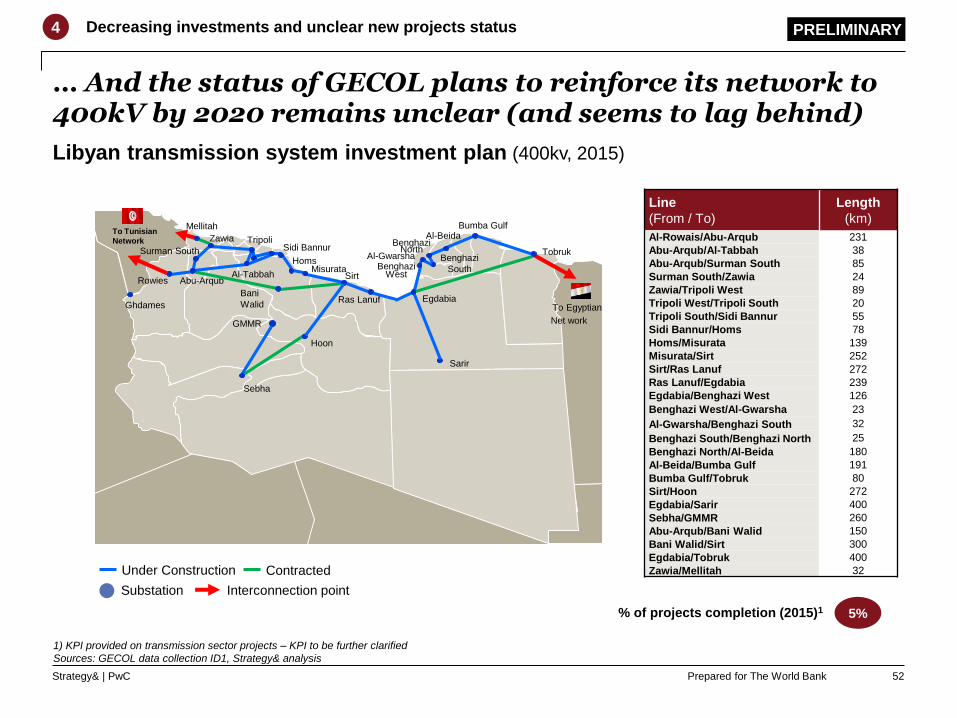
… And the status of GECOL plans to reinforce its network to 400kV by 2020 remains unclear (and seems to lag behind)
Libyan transmission system investment plan (400kv, 2015)
Under Construction Contracted
Interconnection pointSubstation
Line
(From / To)
Length
(km)
Al-Rowais/Abu-Arqub 231
Abu-Arqub/Al-Tabbah 38
Abu-Arqub/Surman South 85
Surman South/Zawia 24
Zawia/Tripoli West 89
Tripoli West/Tripoli South 20
Tripoli South/Sidi Bannur 55
Sidi Bannur/Homs 78
Homs/Misurata 139
Misurata/Sirt 252
Sirt/Ras Lanuf 272
Ras Lanuf/Egdabia 239
Egdabia/Benghazi West 126
Benghazi West/Al-Gwarsha 23
Al-Gwarsha/Benghazi South 32
Benghazi South/Benghazi North 25
Benghazi North/Al-Beida 180
Al-Beida/Bumba Gulf 191
Bumba Gulf/Tobruk 80
Sirt/Hoon 272
Egdabia/Sarir 400
Sebha/GMMR 260
Abu-Arqub/Bani Walid 150
Bani Walid/Sirt 300
Egdabia/Tobruk 400
Zawia/Mellitah 32
PRELIMINARY
1) KPI provided on transmission sector projects – KPI to be further clarified
Sources: GECOL data collection ID1, Strategy& analysis
Decreasing investments and unclear new projects status4
5%% of projects completion (2015)1
BenghaziNorth
Egdabia
Sirt
Hoon
Homs
TripoliZawia
Tobruk
Sebha
To Egyptian
Net work
Sarir
Ras LanufBani
Walid
Misurata
Surman South
Abu-ArqubRowies
Ghdames
Sidi Bannur
BenghaziWest
Al-Gwarsha Benghazi
South
Al-BeidaBumba GulfMellitah
To Tunisian
Network
Al-Tabbah
GMMR
52

Prepared for The World BankStrategy& | PwC
Demand
Generation
Transmission
Distribution and supply
Supply / demand balance
Governance and sector structure
References for analysis update
53
Prepared for The World BankStrategy& | PwC
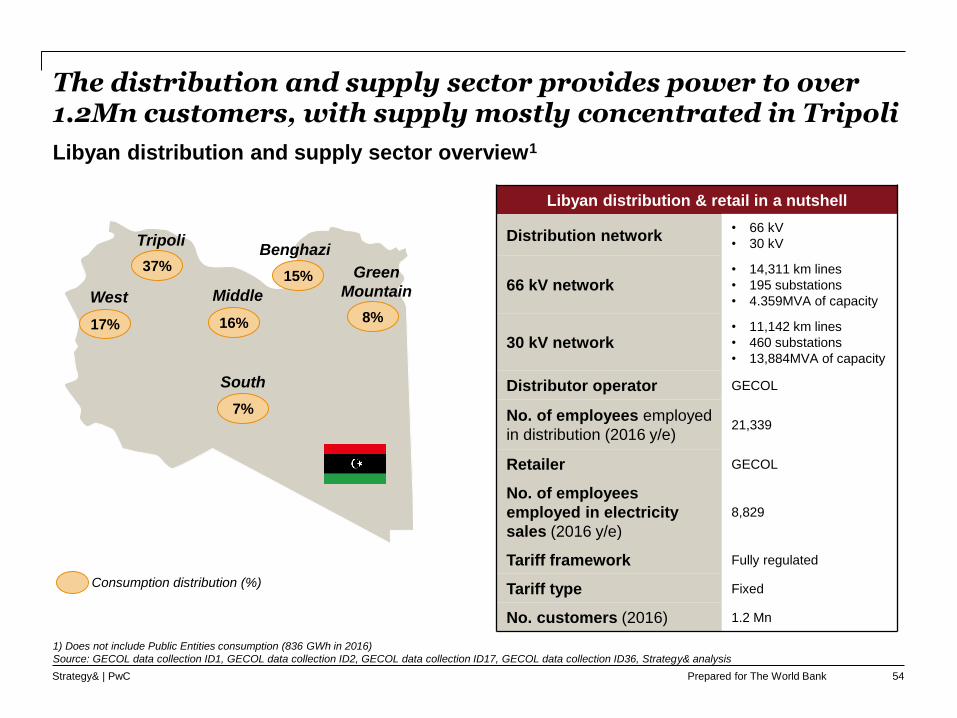
The distribution and supply sector provides power to over 1.2Mn customers, with supply mostly concentrated in Tripoli
Libyan distribution & retail in a nutshell
Distribution network• 66 kV
• 30 kV
66 kV network• 14,311 km lines
• 195 substations
• 4.359MVA of capacity
30 kV network• 11,142 km lines
• 460 substations
• 13,884MVA of capacity
Distributor operator GECOL
No. of employees employed
in distribution (2016 y/e)21,339
Retailer GECOL
No. of employees
employed in electricity
sales (2016 y/e)
8,829
Tariff framework Fully regulated
Tariff type Fixed
No. customers (2016) 1.2 Mn
Libyan distribution and supply sector overview1
Consumption distribution (%)
17%
West
8%
Green
Mountain
37%
Tripoli
16%
Middle
7%
South
Benghazi
15%
1) Does not include Public Entities consumption (836 GWh in 2016)
Source: GECOL data collection ID1, GECOL data collection ID2, GECOL data collection ID17, GECOL data collection ID36, Strategy& analysis
54
Prepared for The World BankStrategy& | PwC
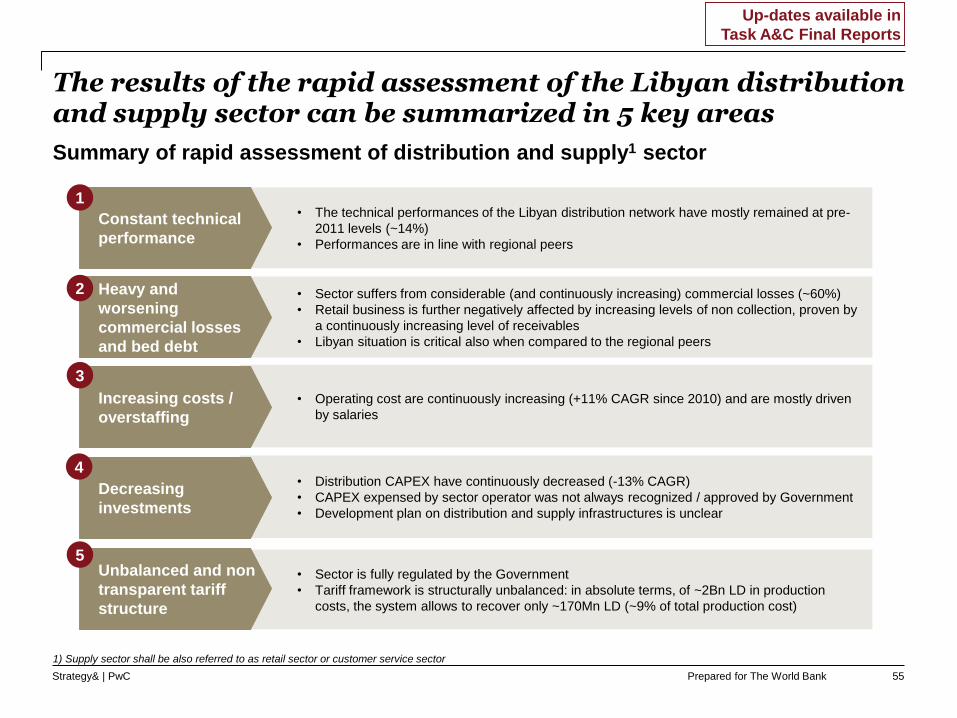
• Sector suffers from considerable (and continuously increasing) commercial losses (~60%)
• Retail business is further negatively affected by increasing levels of non collection, proven by
a continuously increasing level of receivables
• Libyan situation is critical also when compared to the regional peers
• Operating cost are continuously increasing (+11% CAGR since 2010) and are mostly driven
by salaries
• Sector is fully regulated by the Government
• Tariff framework is structurally unbalanced: in absolute terms, of ~2Bn LD in production
costs, the system allows to recover only ~170Mn LD (~9% of total production cost)
The results of the rapid assessment of the Libyan distribution and supply sector can be summarized in 5 key areas
Summary of rapid assessment of distribution and supply1 sector
Increasing costs /
overstaffing
Unbalanced and non
transparent tariff
structure
Heavy and
worsening
commercial losses
and bed debt
• The technical performances of the Libyan distribution network have mostly remained at pre-
2011 levels (~14%)
• Performances are in line with regional peers
Constant technical
performance
• Distribution CAPEX have continuously decreased (-13% CAGR)
• CAPEX expensed by sector operator was not always recognized / approved by Government
• Development plan on distribution and supply infrastructures is unclear
Decreasing
investments
2
3
5
1
4
1) Supply sector shall be also referred to as retail sector or customer service sector
55
Up-dates available in
Task A&C Final Reports

Prepared for The World BankStrategy& | PwC
The technical performance of the distribution network have remained at pre-2011 levels …
0%
5%
10%
15%
20%
12.3%13.4%12.9%13.7%12.8%
19.3%
13.8%
2014 2015
12.9%
2010 2012
18.5%
13.1%
2011
18.9%
(%)2
2013
10
5
35
0
25
30
40
20
15
-4.7
13.4%
TWh and %
1.8%
Transmission
Losses
35.4
Electricity
generated
(ID37)
-0.6
100%84.8%
Distribution
Losses
30.1
Electricity
consumed
1) Distribution losses assumed with measurements made by GECOL (further investigations ongoing); 2) Distribution losses: (electricity consumed – net electricity generated) / (net
electricity generated); 3) Additional distribution losses if generation data from ID24 is considered (delta ID24 vs. ID37 is proportionally distributed between transmission and
distribution losses of ID37); Source: GECOL data collection ID2, ID24, ID37, Strategy& analysis
Distribution Losses incidence on Generation (ID37)
Inconsistency vs. Generation (ID24) 3
Evolution of Libyan distribution losses1 Electricity consumed vs. generated (2015)
Constant technical performance1
36.2 TWh
(ID 24)
56
Prepared for The World BankStrategy& | PwC
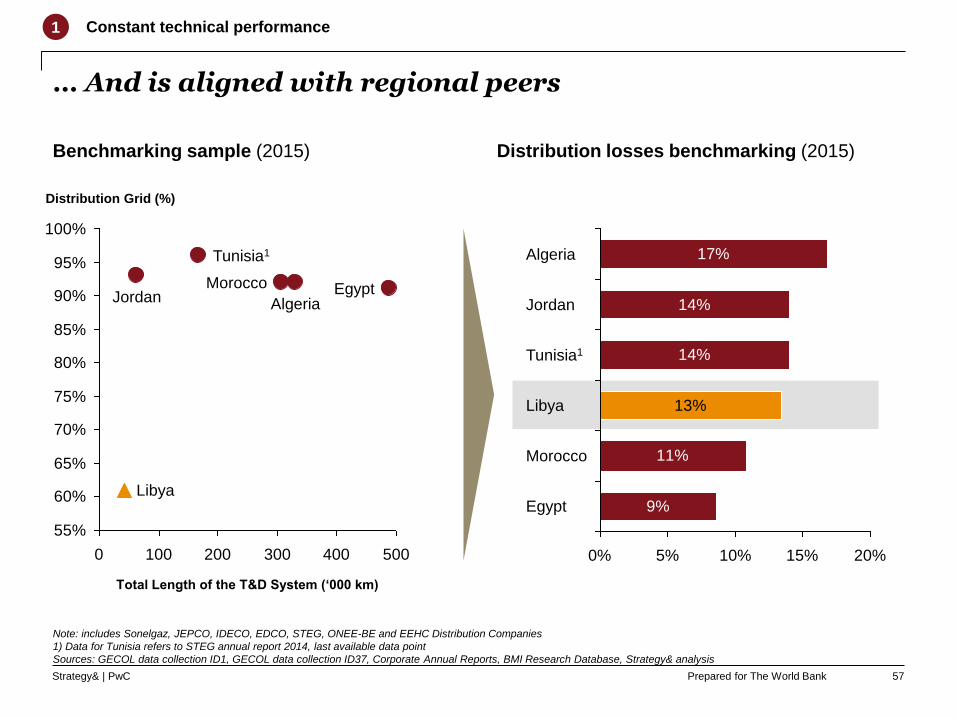
… And is aligned with regional peers
55%
60%
65%
70%
75%
80%
85%
90%
95%
100%
5004003002001000
Distribution Grid (%)
Total Length of the T&D System (‘000 km)
Morocco Egypt
Tunisia1
Libya
AlgeriaJordan
17%
14%
14%
11%
9%
13%
5%0% 10% 15% 20%
Tunisia1
Jordan
Algeria
Egypt
Libya
Morocco
Note: includes Sonelgaz, JEPCO, IDECO, EDCO, STEG, ONEE-BE and EEHC Distribution Companies
1) Data for Tunisia refers to STEG annual report 2014, last available data point
Sources: GECOL data collection ID1, GECOL data collection ID37, Corporate Annual Reports, BMI Research Database, Strategy& analysis
Benchmarking sample (2015) Distribution losses benchmarking (2015)
1 Constant technical performance
57
Prepared for The World BankStrategy& | PwC
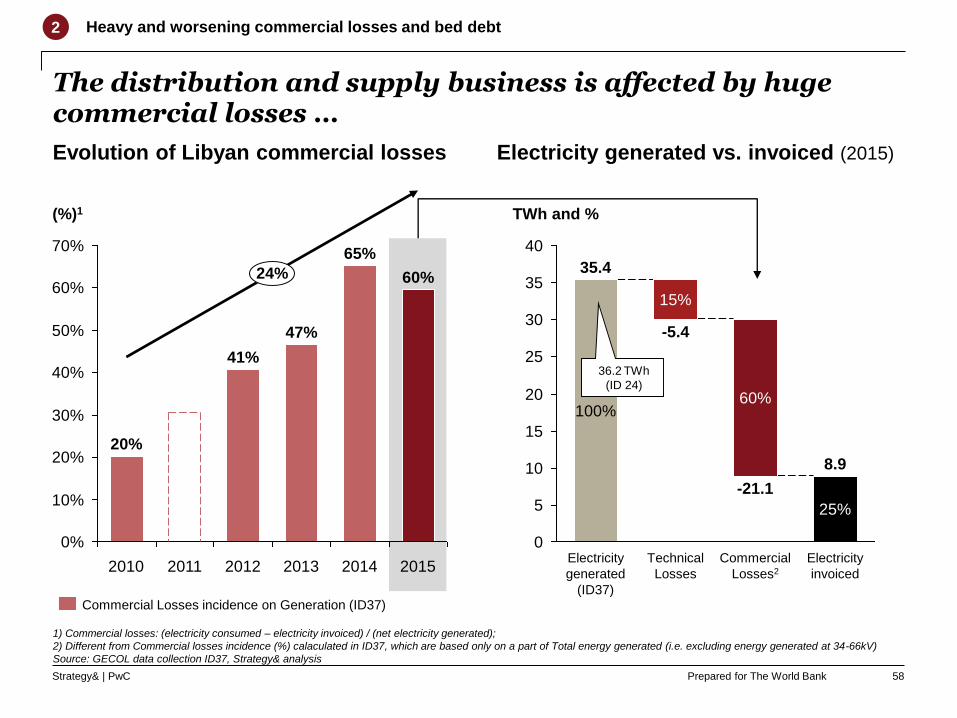
The distribution and supply business is affected by huge commercial losses …
0%
10%
20%
30%
40%
50%
60%
70%
2014
47%
2010 2015
60%
2012
41%
65%
24%
20132011
20%
(%)1
1) Commercial losses: (electricity consumed – electricity invoiced) / (net electricity generated);
2) Different from Commercial losses incidence (%) calaculated in ID37, which are based only on a part of Total energy generated (i.e. excluding energy generated at 34-66kV)
Source: GECOL data collection ID37, Strategy& analysis
Commercial Losses incidence on Generation (ID37)
Heavy and worsening commercial losses and bed debt2
Evolution of Libyan commercial losses Electricity generated vs. invoiced (2015)
0
30
10
15
40
35
20
25
5
Commercial
Losses2
8.9
60%100%
25%
35.4
15%
Technical
Losses
Electricity
generated
(ID37)
-5.4
-21.1
Electricity
invoiced
TWh and %
36.2 TWh
(ID 24)
58

Prepared for The World BankStrategy& | PwC
… Further aggravated by increasing bed debt
2
Electricity collected vs. generated (e2015)
1) Non paid (%): (electricity invoiced – electricity collected) / (net generation);
2) Estimation based on revenues collected (only partial breakdown by sector available) and current tariff structure
Source: GECOL data collection ID7, GECOL data collection ID12, GECOL data collection ID21, GECOL data collection ID37, Strategy& analysis
15
35
20
40
25
30
10
0
5
100%
-21.1
Comm.
Losses
Electricity
generated
(ID37)
Non paid1
5.62
Techn.
Losses
Electricity
collected
TWh & %
15%
-3.4 15%
10%2
35.4
-5.4
60%
36.2 TWh
(ID 24)
Heavy and worsening commercial losses and bed debt
2,400
0
800
600
200
400
1,000
1,200
1,400
1,600
1,800
2,000
2,200
1,320
1,928
2010
1,611
2011
15%
1,971
2013
2,269
2014 2015
Mn LD
2012
Evolution of GECOL receivables
N/AReceivables
59
Prepared for The World BankStrategy& | PwC
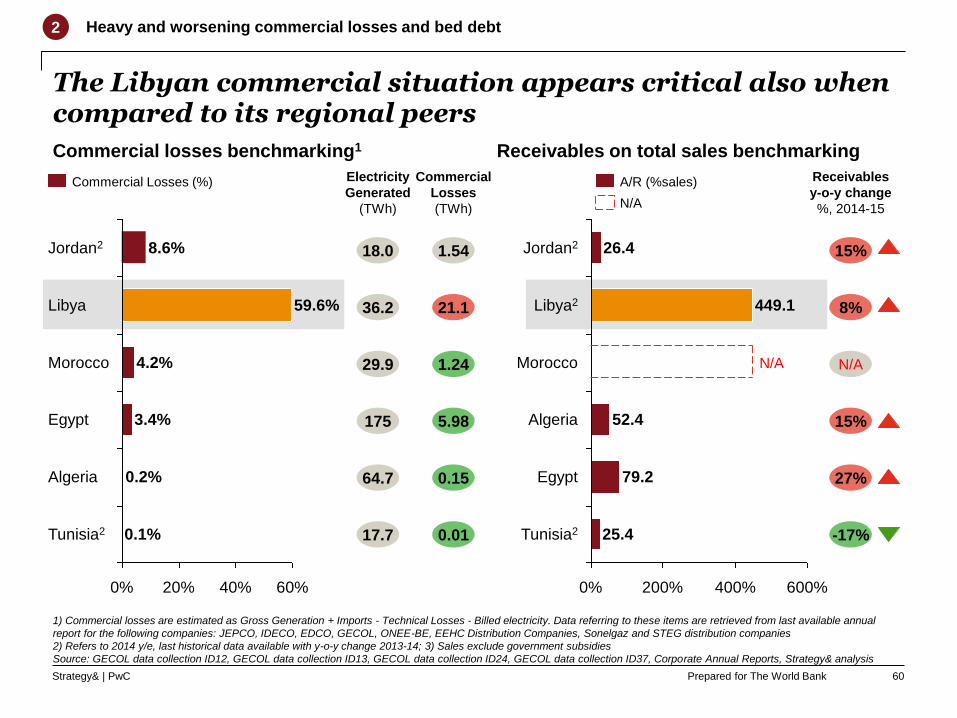
The Libyan commercial situation appears critical also when compared to its regional peers
Commercial losses benchmarking1 Receivables on total sales benchmarking
60%40%20%0%
Tunisia2 0.1%
Jordan2
4.2%
Libya
Algeria 0.2%
3.4%Egypt
Morocco
59.6%
8.6%
1) Commercial losses are estimated as Gross Generation + Imports - Technical Losses - Billed electricity. Data referring to these items are retrieved from last available annual
report for the following companies: JEPCO, IDECO, EDCO, GECOL, ONEE-BE, EEHC Distribution Companies, Sonelgaz and STEG distribution companies
2) Refers to 2014 y/e, last historical data available with y-o-y change 2013-14; 3) Sales exclude government subsidies
Source: GECOL data collection ID12, GECOL data collection ID13, GECOL data collection ID24, GECOL data collection ID37, Corporate Annual Reports, Strategy& analysis
Electricity
Generated
(TWh)
Commercial
Losses
(TWh)
0% 400% 600%200%
Egypt
Libya2
Tunisia2
Algeria
Morocco
Jordan2
79.2
N/A
26.4
25.4
52.4
449.1
15%
8%
N/A
15%
27%
-17%
Receivables
y-o-y change
%, 2014-15N/A
A/R (%sales)
18.0
36.2
29.9
175
64.7
17.7
1.54
21.1
1.24
5.98
0.15
0.01
Commercial Losses (%)
2 Heavy and worsening commercial losses and bed debt
60

Prepared for The World BankStrategy& | PwC
Operating costs have continuously increased, mostly driven by salaries
100
800
700
500
600
0
200
400
300
245
711
466
369
100
423482
2011
269
2010
110
2012
312
177 173
687
514
174
2013
548
2014
658
2015
722
11%Mn LD
Distribution & supply operating costs evolution
21,339# sector employees1
(GECOL)
3
8,829
Distribution
Supply
Increasing costs / overstaffing
634Salaries1
Fuel cost1
23
Fuel Transp.
to Gen. Stations
Other expenses23
246
00
43
Materials for O&M
Various Service10
1
Maintenance5325
284
2010 2015Delta %2010-15
+157%
+113%
+8%
N/A
-77%
-98%
-2%
1) Distribution FTEs and salaries include Distribution, Distribution Projects and Medium Voltage general departments headcount and personnel costs
Source: GECOL data collection ID13, GECOL data collection ID17, Strategy& analysis
61

Prepared for The World BankStrategy& | PwC
Since 2012, Government did not always approve the
CAPEX actually spent by GECOL
Distribution sector CAPEX have slowed down since 2010, and was not always fully approved by Government
Decreasing investments and unclear development plan4
Distribution CAPEX evolution1
Note: In accordance with the Libyan subsidized tariff framework, CAPEX expenses are separately covered by the government through ad-hoc capital injections; CAPEX is normally
compensated to the sector operator (GECOL) ex-post, with Ministry of planning approving the proposed CAPEX budget, and Ministry of Finance allocating such funding
Sources: GECOL data collection ID15, Strategy& analysis
1,500
1,000
500
0
Mn LD
2014
330
2012
279
783
-13%
20162015
314
635
399
2013
486
20112010
CAPEX (effectively expensed by sector opreator) CAPEX approved by Government
62
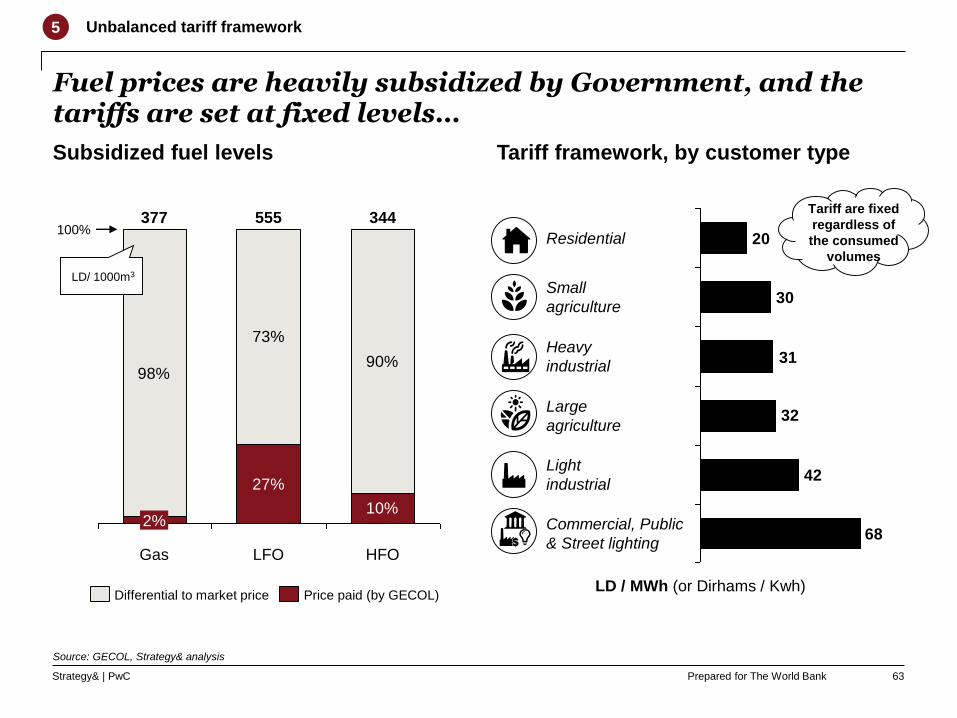
Prepared for The World BankStrategy& | PwC
Fuel prices are heavily subsidized by Government, and the tariffs are set at fixed levels…
27%
10%
98%
73%
90%
2%
100%344
LFO
555
Gas HFO
377
Price paid (by GECOL)Differential to market price
LD/ 1000m3
Source: GECOL, Strategy& analysis
Unbalanced tariff framework5
68
42
32
31
30
20
Commercial, Public
& Street lighting
Light
industrial
LD / MWh (or Dirhams / Kwh)
Heavy
industrial
Residential
Large
agriculture
Small
agriculture
Tariff are fixed
regardless of
the consumed
volumes
Subsidized fuel levels Tariff framework, by customer type
63
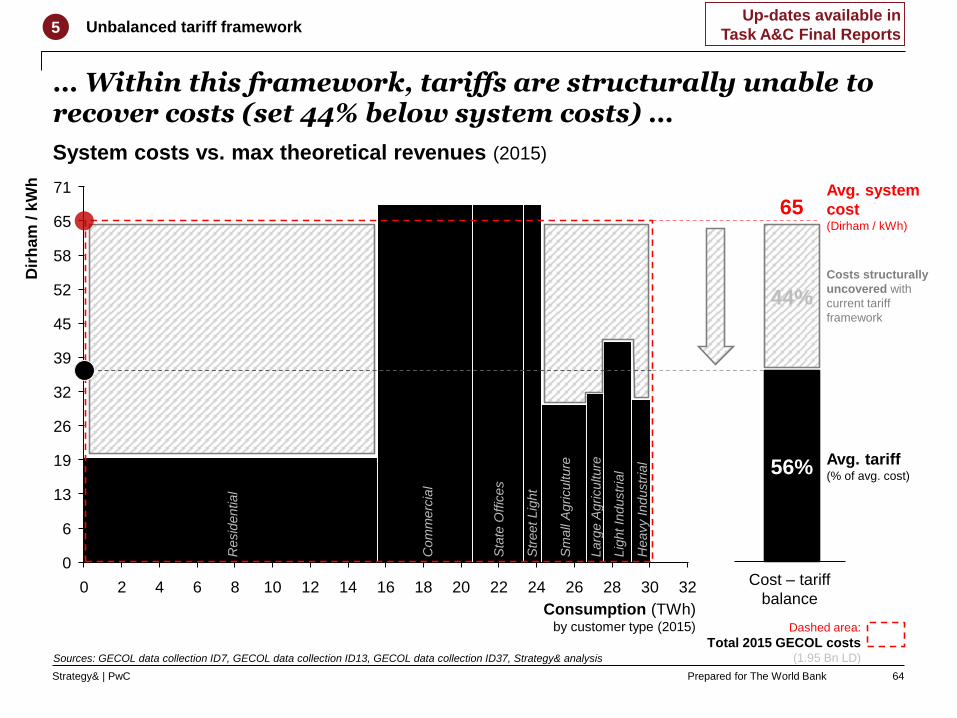
Prepared for The World BankStrategy& | PwC
Consumption (TWh)by customer type (2015)
206
6
0 22142 18108 16
39
0
32
32
71
65
58
52
26
30
19
13
45
12 2826244
Dir
ha
m / k
Wh
… Within this framework, tariffs are structurally unable to recover costs (set 44% below system costs) …
Dashed area:
Total 2015 GECOL costs(1.95 Bn LD)Sources: GECOL data collection ID7, GECOL data collection ID13, GECOL data collection ID37, Strategy& analysis
Resid
ential
Com
merc
ial
Sta
te O
ffic
es
Str
eet Lig
ht
Sm
all
Agriculture
Larg
e A
griculture
Heavy Industr
ial
Lig
ht In
dustr
ial 56%
44%
Costs structurally
uncovered with
current tariff
framework
65
Avg. tariff(% of avg. cost)
Cost – tariff
balance
44%
56%
Unbalanced tariff framework5
System costs vs. max theoretical revenues (2015)
Avg. system
cost(Dirham / kWh)
64
Up-dates available in
Task A&C Final Reports

Prepared for The World BankStrategy& | PwC
44%
Consumption (TWh)by customer type (2015)
26
32
65
52
58
45
39
71
13
19
6
32
0
300 4 8 10 14 18 2616 2212 206 28242
Dir
ha
m / k
Wh
… Furthermore, an additional 38% of total costs cannot be recovered due to commercial losses …
Note: Avg. revenues are estimated bottom-up by each segment (suffers light misalignment vs. FS)
Sources: GECOL data collection ID7, GECOL data collection ID13, GECOL data collection ID37, Strategy& analysis
18%
44%
Costs structurally
uncovered with
current tariff
framework
65
Cost – tariff
balance
38% 38%
Avg.
revenues(% of avg. cost)
Commercial
losses
(consumption
not invoiced)
18%
Resid
ential
Com
merc
ial
Sta
te O
ffic
es
Str
eet Lig
ht
Sm
all
Agriculture
Larg
e A
griculture
Heavy Industr
ial
Lig
ht In
dustr
ial
Dashed area:
Total 2015 GECOL costs(1.95 Bn LD)
Unbalanced tariff framework5
System costs vs. revenues (2015)
Avg. system
cost(Dirham / kWh)
65
Up-dates available in
Task A&C Final Reports

Prepared for The World BankStrategy& | PwC
9%
44%
Consumption (TWh)by customer type (2015)
8 1210 222018
71
65
24
32
52
13
45
32
39
30
26
2826
58
0
6
19
0 2 4 6 14 16
Dir
ha
m / k
Wh
… And when considering the poor collection effectiveness, system is only able to recover ~9% of its production costs …
1) Estimation based on revenues collected in ID21 (only partial breakdown by sector available)
2) ~10% previously indicated refers to volumes, while 9% are revenues (effective of different tariffs)
Sources: GECOL data collection ID7, GECOL data collection ID13, GECOL data collection ID21, GECOL data collection ID37, Strategy& analysis
9%
44%
Costs structurally
uncovered with
current tariff
framework
Avg. system
cost(Dirham / kWh)
65
Cost – tariff
balance
38% 38%
Avg. collection(% of avg. cost)
9%Non paid2(collection
ineffectiveness1)
Resid
ential
Com
merc
ial
Sta
te O
ffic
es
Str
eet Lig
ht
Sm
all
Agriculture
Larg
e A
griculture
Heavy Industr
ial
Lig
ht In
dustr
ial
Dashed area:
Total 2015 GECOL costs(1.95 Bn LD)
Unbalanced tariff framework5
System costs vs. actual collected revenues (2015)
Commercial
losses
(consumption
not invoiced)
66
Up-dates available in
Task A&C Final Reports
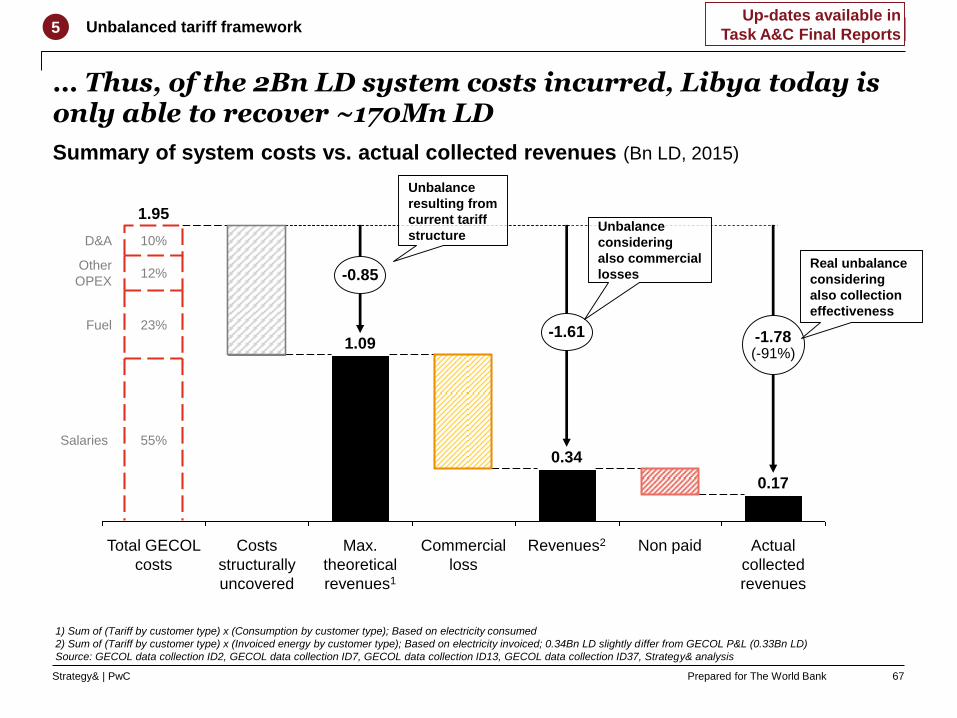
Prepared for The World BankStrategy& | PwC
… Thus, of the 2Bn LD system costs incurred, Libya today is only able to recover ~170Mn LD
1) Sum of (Tariff by customer type) x (Consumption by customer type); Based on electricity consumed
2) Sum of (Tariff by customer type) x (Invoiced energy by customer type); Based on electricity invoiced; 0.34Bn LD slightly differ from GECOL P&L (0.33Bn LD)
Source: GECOL data collection ID2, GECOL data collection ID7, GECOL data collection ID13, GECOL data collection ID37, Strategy& analysis
Unbalanced tariff framework5
Summary of system costs vs. actual collected revenues (Bn LD, 2015)
PRELIMINARY
10%
Non paid
-1.611.09
Total GECOL
costs
1.95
-0.85
Salaries
Max.
theoretical
revenues1
Commercial
loss
Actual
collected
revenues
-1.78(-91%)
0.34
Other
OPEX0.85
12%
Fuel
0.17
23%
55%
Costs
structurally
uncovered
D&A
Revenues2
Unbalance
resulting from
current tariff
structureUnbalance
considering
also commercial
lossesReal unbalance
considering
also collection
effectiveness
67
Up-dates available in
Task A&C Final Reports

Prepared for The World BankStrategy& | PwC
Demand
Generation
Transmission
Distribution and supply
Supply / demand balance
Governance and sector structure
References for analysis update
68

Prepared for The World BankStrategy& | PwC
Libya is increasingly unable to meet peak demand mostly because of the high capacity unavailability
1) (Available capacity – Peak demand) / (Peak demand); 2) Demand at generation level; 3) Annual consumption / 8760
Source: GECOL data collection ID1, GECOL data collection ID2, GECOL data collection ID4, GECOL data collection ID22 and ID23, Strategy& analysis
0
10
9
8
5
11
4
6
7
2
3
1
2016
10.39.9
2014
9.9
20122010
8.39.0
20092007
9.6
6.8
2013 2015
GW
6.2
Unvailable capacity due to suspended units
Demand (annual average demand)2,3
Installed capacity at risk - subject to availability
Available capacity
Demand (peak demand)2
Demand (lowest monthly peak)2
!
S/D evolution
Delta
peak
69
11% -9% -1% -7% -6% -12% -18% -21%Reservemargin1
Nameplate capacity
Up-dates available in
Task A&C Final Reports

Prepared for The World BankStrategy& | PwC
-40%
-30%
-20%
-10%
0%
10%
20%
-7%
-26%(delta)
-27%
-14%
Reserve margin1
(%)
20162014
-1%
2010 2012-40%
-20%
-10%
0%
10%
20%
Reserve margins are thus very low, especially in the Southern and Western macro-region
Reserve margin1 evolution – Breakdown by region and macro-region2
1) (Available capacity – Demand) / (Demand), with Demand at generation level; 2) Breakdown does not include small and rented gas / diesel plants capacity; 3) (Regional available
capacity – Regional demand) / (Regional demand); 4) (Regional reserve margin 2016) – (Regional reserve margin 2010)
Source: General Information Authority of Libya, GECOL data collection ID4, GECOL data collection ID22, Strategy& analysis
Algeria
Niger Chad
Tunisia
Sudan
Egypt
Tripoli Benghazi
West Middle Green Mountain
South
-2%
-39%
7%
-33%
-22%
-24%
-40%
+50%
-57%
+4%
-87%
-40%
Legend
x%
y%
Reserve margin by region (2016, %) 3
Reserve margin growthby region (2010-2016, abs. growth) 4
-25% -16%
-26%
Reserve margin by macro-region (2016)
Western macro-region Eastern macro-region
Central macro-region
70
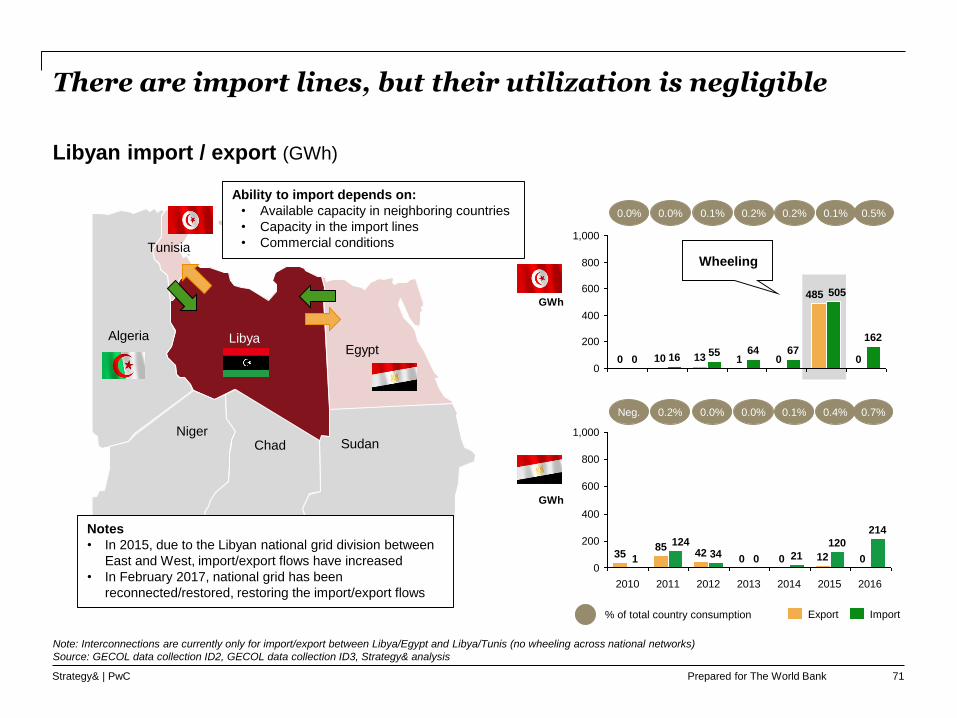
Prepared for The World BankStrategy& | PwC
There are import lines, but their utilization is negligible
600
800
0
1,000
200
400
0
485GWh
162
505
670
5510 01316
640 1
Export Import
800
200
600
400
1,000
0
GWh
214
120
2013 2014
0
2015
034420
2016
1221
20122011
085 124
2010
35 1
Note: Interconnections are currently only for import/export between Libya/Egypt and Libya/Tunis (no wheeling across national networks)
Source: GECOL data collection ID2, GECOL data collection ID3, Strategy& analysis
0.0% 0.0% 0.1% 0.2% 0.2% 0.1% 0.5%
Neg. 0.2% 0.0% 0.0% 0.1% 0.4% 0.7%
Libyan import / export (GWh)
Sudan
LibyaEgypt
Tunisia
NigerChad
Algeria
Notes
• In 2015, due to the Libyan national grid division between
East and West, import/export flows have increased
• In February 2017, national grid has been
reconnected/restored, restoring the import/export flows
% of total country consumption
Ability to import depends on:
• Available capacity in neighboring countries
• Capacity in the import lines
• Commercial conditions
71
Wheeling

Prepared for The World BankStrategy& | PwC
Going forward, maintaining the capacity status-quo, the gap in reserve margins will continue to worsen
1) (Available capacity – Peak demand) / (Peak demand); 2) Demand at generation level; 3) Annual consumption / 8760
Source: GECOL data collection ID1, GECOL data collection ID2, GECOL data collection ID4, GECOL data collection ID22 and ID23, Strategy& analysis
12
14
4
0
2
6
8
10
2028
10.310.3
2018
10.310.3
2030
GW
10.310.3 10.3
2020 2022 2024
10.3
2016 2026
Demand (annual average demand)2,3
Demand (peak demand)2
Installed capacity at risk - subject to availability
Available capacity
Unvailable capacity due to suspended units
-29% -38% -43% -48% -52% -55% -58%Reservemargin1
72
Do nothing scenario – Supply-Demand evolution
-21%
Nameplate capacity
Up-dates available in
Task A&C Final Reports

Prepared for The World BankStrategy& | PwC
Demand
Generation
Transmission
Distribution and supply
Supply / demand balance
Governance and sector structure
References for analysis update
73

Prepared for The World BankStrategy& | PwC
Within this context and perspectives, Libya shall focus upon four groups of initiatives and several options
Improvement options/ initiatives going forward
Source: GECOL, Strategy& analysis
74
Improve
operational
performance
Strengthen
T&D system(outages and
technical losses)
Increase
capacity
Increase plant availability
(capacity and time) and
utilization
Complete ongoing
capacity-additions(under construction
/contracted)
Launch new capacity-
expansion projects
Manage
demand
Introduce energy
efficiency measures
Apply demand-
optimization incentives (new tariff)
Explore import supply
potential
Increase plant efficiency
and switch to gas
Improve
commercial
performance
Reduce
commercial
losses
Improve credit collection
Control operating expenses (salaries)
Immediate priority Additional priorities
Up-dates available in
Task A&C Final Reports

Prepared for The World BankStrategy& | PwC
The geo-political situation in Libya is continuously evolving and today observes the presence of four predominant forces
Current Libya geopolitical situation (Q1 2017)
Note: Geopolitical map is non-exhaustive, based upon different publicly available sources
Source: Public available sources; Strategy& analysis
Beida /
Tobruk
Government
• Elected democratically in 2014
is also called Council of
Deputies and linked to the
House of Representatives
• Strongest in East Libya has
loyalty of LNA under command
of Khalifa Haftar
Government
of National
Accord
(GNA) and
Allies
• In 2015 the UN has led dialogue
endorsed and later installed the
interim government
• Suggested Gov’t has 17
ministries and is led by PM
Fayez al-Sarraj
National
Salvation
Government
• Also called General National
Congress (GNC) (Expired)
• Based in Tripoli and established
after operation “Libyan Dawn”
Other
forces
• Local forces and minorities (e.g.
Amazigh, Tuareg, Tebu, etc.)
• Federalist groups / movements
NON-EXHAUSTIVE
I
II
III
IV
IV
III
I II
Responding to both
I and II
III
75
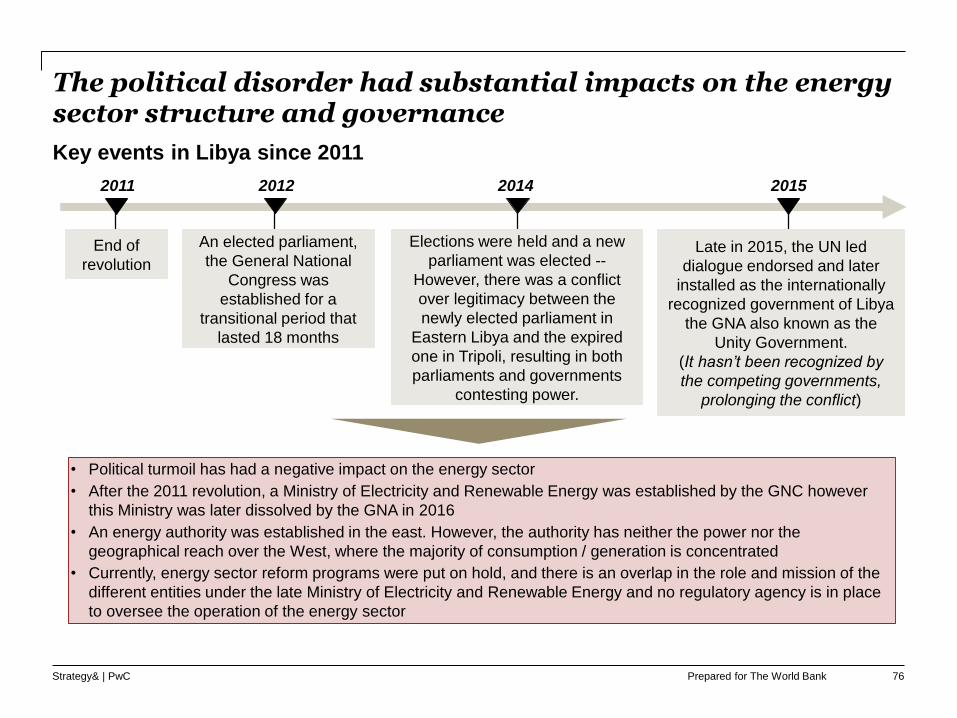
Prepared for The World BankStrategy& | PwC
The political disorder had substantial impacts on the energy sector structure and governance
• Political turmoil has had a negative impact on the energy sector
• After the 2011 revolution, a Ministry of Electricity and Renewable Energy was established by the GNC however
this Ministry was later dissolved by the GNA in 2016
• An energy authority was established in the east. However, the authority has neither the power nor the
geographical reach over the West, where the majority of consumption / generation is concentrated
• Currently, energy sector reform programs were put on hold, and there is an overlap in the role and mission of the
different entities under the late Ministry of Electricity and Renewable Energy and no regulatory agency is in place
to oversee the operation of the energy sector
2012 20142011 2015
Elections were held and a new
parliament was elected --
However, there was a conflict
over legitimacy between the
newly elected parliament in
Eastern Libya and the expired
one in Tripoli, resulting in both
parliaments and governments
contesting power.
An elected parliament,
the General National
Congress was
established for a
transitional period that
lasted 18 months
Late in 2015, the UN led
dialogue endorsed and later
installed as the internationally
recognized government of Libya
the GNA also known as the
Unity Government.
(It hasn’t been recognized by
the competing governments,
prolonging the conflict)
End of
revolution
Key events in Libya since 2011
76
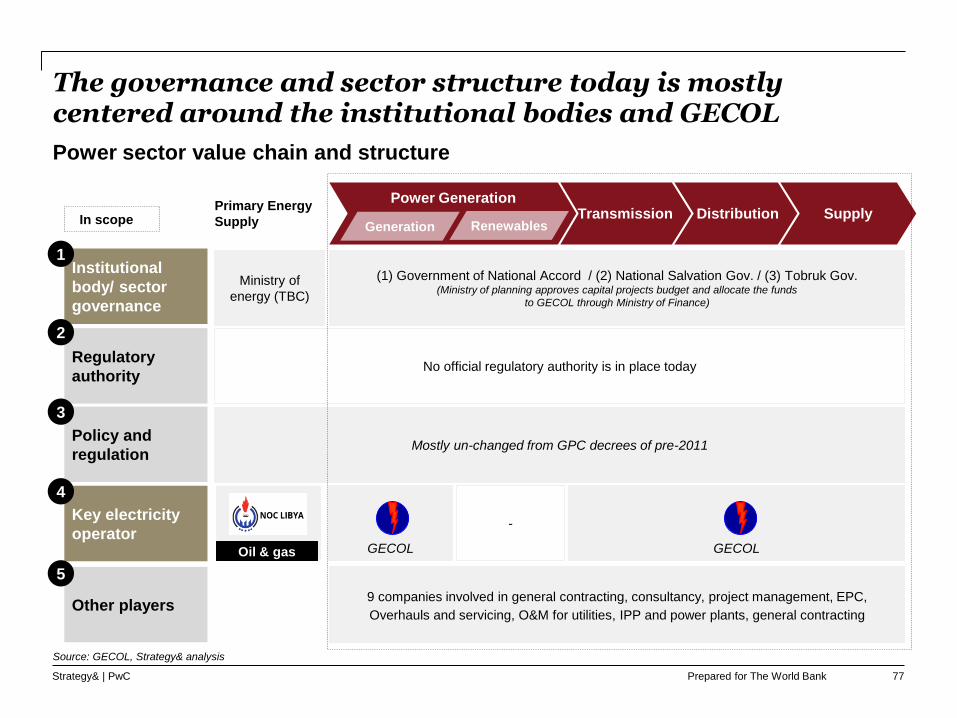
Prepared for The World BankStrategy& | PwC
Power Generation
The governance and sector structure today is mostly centered around the institutional bodies and GECOL
DistributionTransmissionPrimary Energy
SupplySupply
Source: GECOL, Strategy& analysis
Generation
Institutional
body/ sector
governance
(1) Government of National Accord / (2) National Salvation Gov. / (3) Tobruk Gov.(Ministry of planning approves capital projects budget and allocate the funds
to GECOL through Ministry of Finance)
Ministry of
energy (TBC)
Regulatory
authorityNo official regulatory authority is in place today
Key electricity
operatorGECOL
-
GECOL
Policy and
regulationMostly un-changed from GPC decrees of pre-2011
Other players
1
2
3
4
5
9 companies involved in general contracting, consultancy, project management, EPC,
Overhauls and servicing, O&M for utilities, IPP and power plants, general contracting
Power sector value chain and structure
Renewables
Oil & gas
In scope
77

Prepared for The World BankStrategy& | PwC
After 2011 events, the institutional bodies that control and lead GECOL have continuously changed
Focus in the next slideSource: GECOL, Strategy& analysis
• GPCoEWG was
dissolved, and
GECOL now reports
to the GPC directly
• Without ministerial
representation,
GECOL is subject to
more remote, less
technically
knowledgeable
oversight
• GPCoEWG was
established with
GECOL reporting to it
• Changes resulted in
confusion over roles of
GECOL and the GPC
of Electricity, Water, &
Gas in several key
functions
2007-2009 2009-2011
General People’s
Committee
GECOL
GPC of
Electricity, Water
& Gas
General People’s
Committee
GECOL
General People’s
Committee
GECOL
GPC of Energy
and Industry
Prior to 2007
• GECOL had
governance
oversight from the
GPC of Energy and
Industry
Current
Although continuously
evolving, GECOL today
is officially controlled by
three institutional
bodies:
• Government of
National Accord
• National Salvation
Government
• Transitional Gov’t
Institutional body / sector governance1
Evolution of the sector governance in Libya
Three
competing
gov’t forces
GECOL
• The PM included
Ministry of Electricity
and Renewable
energy in his cabinet
which was
subsequently ratified
by the GNC
• The Ministry has
undergone personnel
changes, but has
otherwise remained
stagnant
2012 - 2014
General National
Council
GECOL
Ministry of
Electricity and
Renewable Energy
78
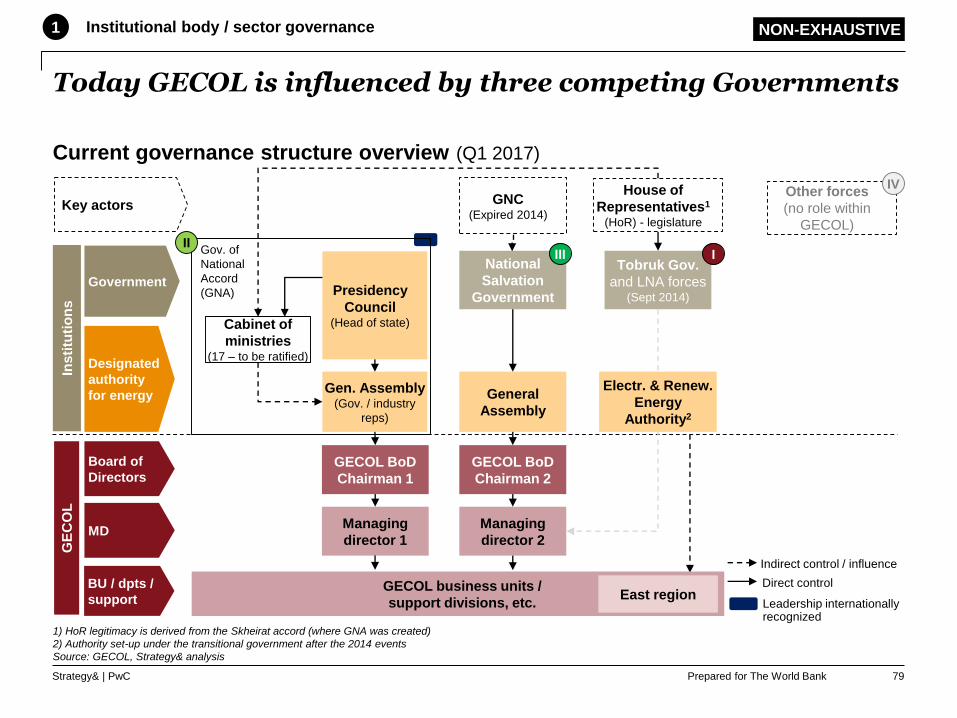
Prepared for The World BankStrategy& | PwC
Today GECOL is influenced by three competing Governments
Current governance structure overview (Q1 2017)
Government
Designated
authority
for energy
Board of
Directors
MD
Ins
titu
tio
ns
1) HoR legitimacy is derived from the Skheirat accord (where GNA was created)
2) Authority set-up under the transitional government after the 2014 events
Source: GECOL, Strategy& analysis
Key actors
Presidency
Council(Head of state)Cabinet of
ministries(17 – to be ratified)
Gen. Assembly(Gov. / industry
reps)
National
Salvation
Government
General
Assembly
GNC(Expired 2014)
GECOL BoD
Chairman 1
Managing
director 1
GECOL BoD
Chairman 2
Managing
director 2
Tobruk Gov.
and LNA forces(Sept 2014)
House of
Representatives1
(HoR) - legislature
Electr. & Renew.
Energy
Authority2
GE
CO
L
Other forces
(no role within
GECOL)
Leadership internationally recognized
Direct control
Indirect control / influence
IIII
IV
Gov. of
National
Accord
(GNA)
II
BU / dpts /
supportGECOL business units /
support divisions, etc.East region
79
Institutional body / sector governance1 NON-EXHAUSTIVE

Prepared for The World BankStrategy& | PwC
No regulatory authority (except for an on-purpose agency for renewables investments) is operational
REAoL
• REAoL is a governmental agency established in
2007 with no regulatory powers
• The main objective and position of REAOL is to
promote renewable energies in Libya, but has no
ability to instruct or enforce
• REAoL state objectives include:
– Implement of renewable energy in various
forms
– Raise the contribution of renewable energy in
the national energy mix
– Encourage and support the industries related to
renewable energy
– Propose the legislation needed to support
renewable energy
Source: GECOL, Strategy& analysis
Regulatory authority2
Board of Directors
CEO
Training and Capacity
building
Technical collaboration
and Agreements
Contracts and Legal
affairs
Planning and Studies
Department
Solar Energy planning
Wing Energy planning
Inventory
Budget and Finance
Affairs Department
Budget
Accounting
Projects Department
Solar Panels Projects
Wind Projects
Heat Transformation
Projects
Internal Audit
Marketing Studies and
Local projects
REAoL Overview
Supporting services
Energy Efficiency
80

Prepared for The World BankStrategy& | PwC
In terms of policy and regulation, the latest most important initiatives in the field of energy were taken in 2012 …
Evolution of Libya policy and regulation
1996 2007 2012
Decree 193 –
amendments of
GECOL Articles
of Association,
1997
Policy and regulation3
Decree 1 –
Reduce the
domestic
electricity use
tariff
1984 1986
Decree 17 –
GECOL
established, under
the supervision of
GPC of Electricity
Decree 15 –
Electricity
domestic use
exemption
for 2011
Law 5 –
Investment, GECOL
formed few JVs with
International
companies
Decree 82 – Policy
regulating the
electricity services
Decree 518 &
429 – Finance
Policy & Admin,
HR Policy
Decree 33 –
Ministry of Electricity
Organization structure
and Department
mandates
2004
Decree 76 –
Increase electric
tariff based on
domestic monthly
consumption
#
Decree 426 –
Establishment
Renewable
Energy Agency
of Libya
Key tariff regulation milestone
1
2
3
4
Source: GECOL, Strategy& analysis
81
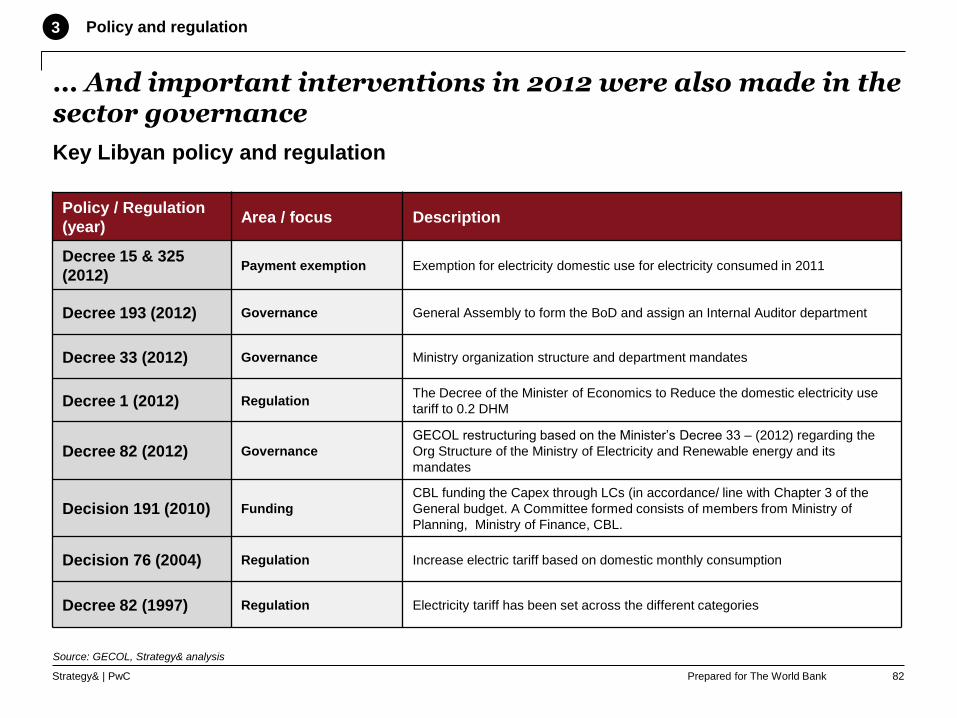
Prepared for The World BankStrategy& | PwC
… And important interventions in 2012 were also made in the sector governance
Key Libyan policy and regulation
Policy / Regulation
(year)Area / focus Description
Decree 15 & 325
(2012)Payment exemption Exemption for electricity domestic use for electricity consumed in 2011
Decree 193 (2012) Governance General Assembly to form the BoD and assign an Internal Auditor department
Decree 33 (2012) Governance Ministry organization structure and department mandates
Decree 1 (2012) RegulationThe Decree of the Minister of Economics to Reduce the domestic electricity use
tariff to 0.2 DHM
Decree 82 (2012) Governance
GECOL restructuring based on the Minister’s Decree 33 – (2012) regarding the
Org Structure of the Ministry of Electricity and Renewable energy and its
mandates
Decision 191 (2010) Funding
CBL funding the Capex through LCs (in accordance/ line with Chapter 3 of the
General budget. A Committee formed consists of members from Ministry of
Planning, Ministry of Finance, CBL.
Decision 76 (2004) Regulation Increase electric tariff based on domestic monthly consumption
Decree 82 (1997) Regulation Electricity tariff has been set across the different categories
Policy and regulation3
Source: GECOL, Strategy& analysis
82
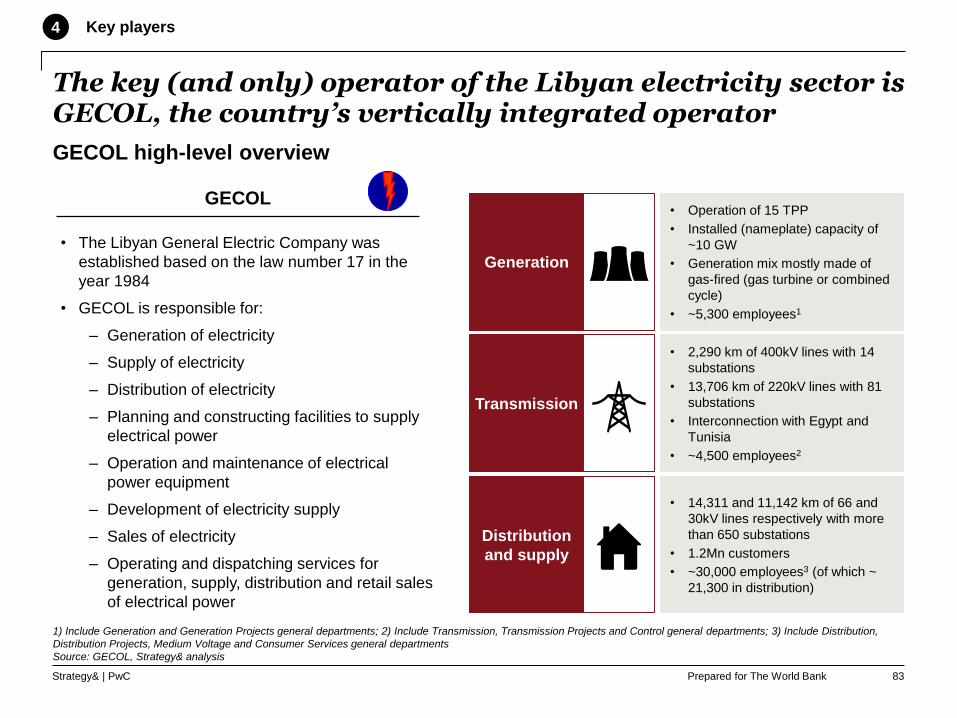
Prepared for The World BankStrategy& | PwC
Generation
• Operation of 15 TPP
• Installed (nameplate) capacity of
~10 GW
• Generation mix mostly made of
gas-fired (gas turbine or combined
cycle)
• ~5,300 employees1
The key (and only) operator of the Libyan electricity sector is GECOL, the country’s vertically integrated operator
GECOL high-level overview
• The Libyan General Electric Company was
established based on the law number 17 in the
year 1984
• GECOL is responsible for:
– Generation of electricity
– Supply of electricity
– Distribution of electricity
– Planning and constructing facilities to supply
electrical power
– Operation and maintenance of electrical
power equipment
– Development of electricity supply
– Sales of electricity
– Operating and dispatching services for
generation, supply, distribution and retail sales
of electrical power
Transmission
Distribution
and supply
• 2,290 km of 400kV lines with 14
substations
• 13,706 km of 220kV lines with 81
substations
• Interconnection with Egypt and
Tunisia
• ~4,500 employees2
• 14,311 and 11,142 km of 66 and
30kV lines respectively with more
than 650 substations
• 1.2Mn customers
• ~30,000 employees3 (of which ~
21,300 in distribution)
1) Include Generation and Generation Projects general departments; 2) Include Transmission, Transmission Projects and Control general departments; 3) Include Distribution,
Distribution Projects, Medium Voltage and Consumer Services general departments
Source: GECOL, Strategy& analysis
Key players4
GECOL
83
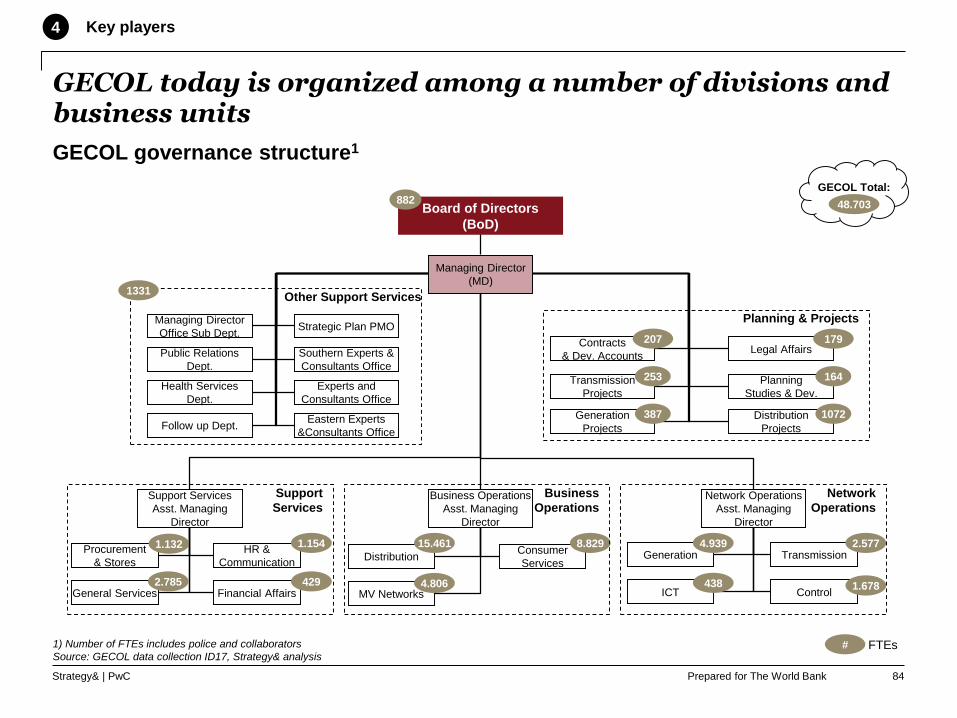
Prepared for The World BankStrategy& | PwC
GECOL today is organized among a number of divisions and business units
GECOL governance structure1
Support Services
Asst. Managing
Director
Business Operations
Asst. Managing
Director
Network Operations
Asst. Managing
Director
Contracts
& Dev. AccountsLegal Affairs
Transmission
Projects
Planning
Studies & Dev.
Procurement
& Stores
HR &
Communication
General Services Financial Affairs
DistributionConsumer
Services
MV Networks
Generation Transmission
ICT Control
Generation
Projects
Distribution
Projects
Board of Directors
(BoD)
Managing Director
(MD)
Managing Director
Office Sub Dept.
Public Relations
Dept.
Health Services
Dept.
Follow up Dept.
Strategic Plan PMO
Southern Experts &
Consultants Office
Experts and
Consultants Office
Eastern Experts
&Consultants Office
Planning & Projects
882
4.939 2.577
1.6784.806
15.461 8.829
4382.785
1.132 1.154
179
164
1072
207
253
387
429
Other Support Services1331
Network
Operations
Business
Operations
Support
Services
# FTEs
GECOL Total:
45.06848.703
Key players4
1) Number of FTEs includes police and collaborators
Source: GECOL data collection ID17, Strategy& analysis
84

Prepared for The World BankStrategy& | PwC
Further to GECOL, another 9 companies (mostly controlled by GECOL) are involved in the sector (as service providers)
List of companies operating under GECOL / LibyanElectricity Holding Company
NameGECOL
stakeForeign partner Field of activity
Public Electrical Works
Company (PEWCO)100% --
General contracting
Electrical Construction
Company (ECCO)51%
India: Bharat Heavy
Electricals Ltd (49%)
Company for Mechanical
and Electrical Engineering51%
Bulgaria Energoimpex
(49%)
Electrical Projects
Company (ELPCO)51%
Bosnia Energo-invest
(49%)
Arab Company for
Engineering Services and
Consulting (ACESCO)
51%
Egypt: Egyptian
Electric Holding
Company (49%)
Consultancy
services, project
management
Electrical Industrial
Company (EICO)51%
Malta: Medelec
Switchgear Ltd (49%)
Equipment assembly
and manufacturing
Algec GT Services
Company (Algec)51% GE (49%)
Overhauls and
servicing of gas
turbine units
Libyan Oasis Energy and
Water Company (LOEWC)55%
UAE: Oasis
International Power Ltd
(45%)
Operation and
management of
utilities, IPP
Global Electricity Services
Company (GESCO)30%
BVI: Award Group
Holding Ltd (49%),
LAICO1 21%
O&M services for PP,
overhauling, general
contracting
• Over the years, Libya has set up a
number of companies serving the
electricity sector
• In 1993, the General People’s Committee
decree no. 112 transferred the ownership
to GECOL
• In 2014, the Council of Ministers decree
no. 342 led to the establishment of the
Libyan Electricity Holding Company
• GECOL took action to transfer its shares
to the new Holding Company
• Due to several issues over the last period,
the Holding company still nominally
answers to the Board of GECOL
• GECOL, in this context, is thus in effective
control of the subsidiaries either directly or
through the Holding Company
Comments
Other players5
1) LAICO: Libyan African Investment Company
Source: GECOL, Strategy& analysis
85
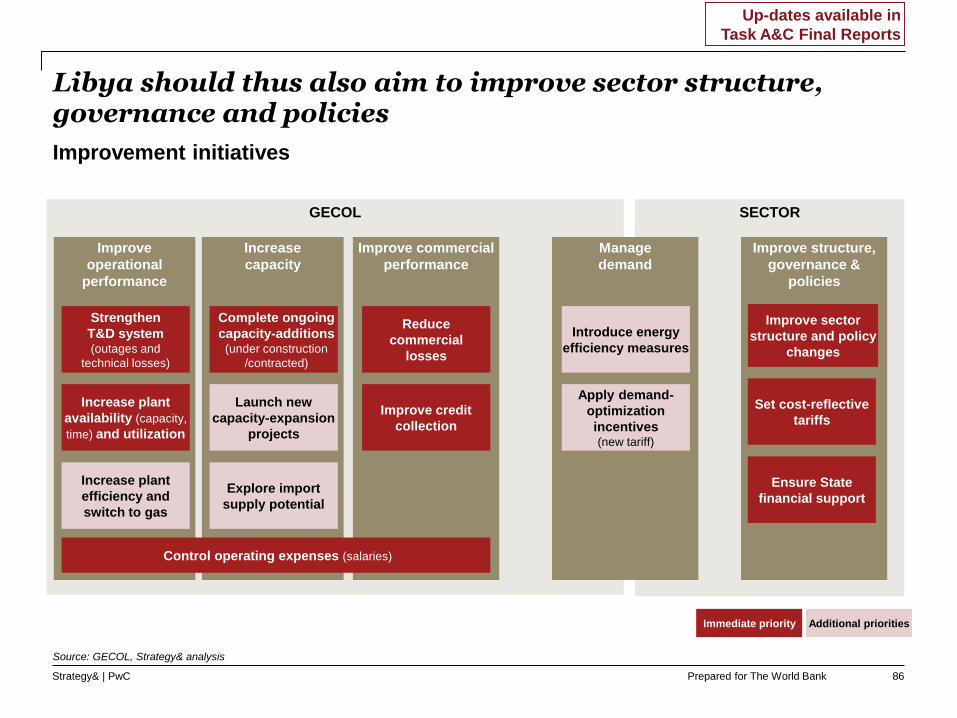
Prepared for The World BankStrategy& | PwC
SECTOR
Improve structure,
governance &
policies
Libya should thus also aim to improve sector structure, governance and policies
Improvement initiatives
GECOL
Improve
operational
performance
Strengthen
T&D system(outages and
technical losses)
Increase
capacity
Increase plant
availability (capacity,
time) and utilization
Complete ongoing
capacity-additions(under construction
/contracted)
Launch new
capacity-expansion
projects
Manage
demand
Introduce energy
efficiency measures
Apply demand-
optimization
incentives (new tariff)
Explore import
supply potential
Improve sector
structure and policy
changes
Increase plant
efficiency and
switch to gas
Source: GECOL, Strategy& analysis
Ensure State
financial support
Set cost-reflective
tariffs
86
Immediate priority Additional priorities
Improve commercial
performance
Reduce
commercial
losses
Improve credit
collection
Control operating expenses (salaries)
Up-dates available in
Task A&C Final Reports
Prepared for The World BankStrategy& | PwC
Demand
Generation
Transmission
Distribution and supply
Supply / demand balance
Governance and sector structure
References for analysis update
87
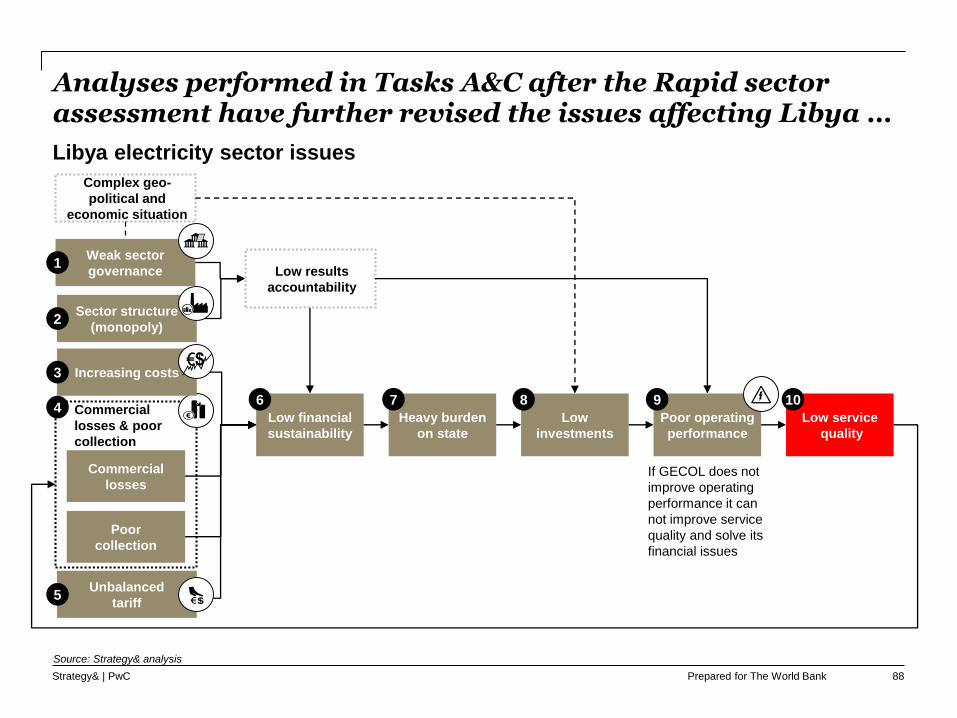
Prepared for The World BankStrategy& | PwC
Analyses performed in Tasks A&C after the Rapid sector assessment have further revised the issues affecting Libya …
Libya electricity sector issues
Low financial
sustainability
Commercial
losses
Low
investments
Unbalanced
tariff
Poor operating
performance
Low service
quality
Poor
collection
Commercial
losses & poor
collection
If GECOL does not
improve operating
performance it can
not improve service
quality and solve its
financial issues
Source: Strategy& analysis
Weak sector
governance
Sector structure
(monopoly)
Low results
accountability
Complex geo-
political and
economic situation
Heavy burden
on state
Increasing costs
1
2
3
4
5
6 7 8 9 10
88
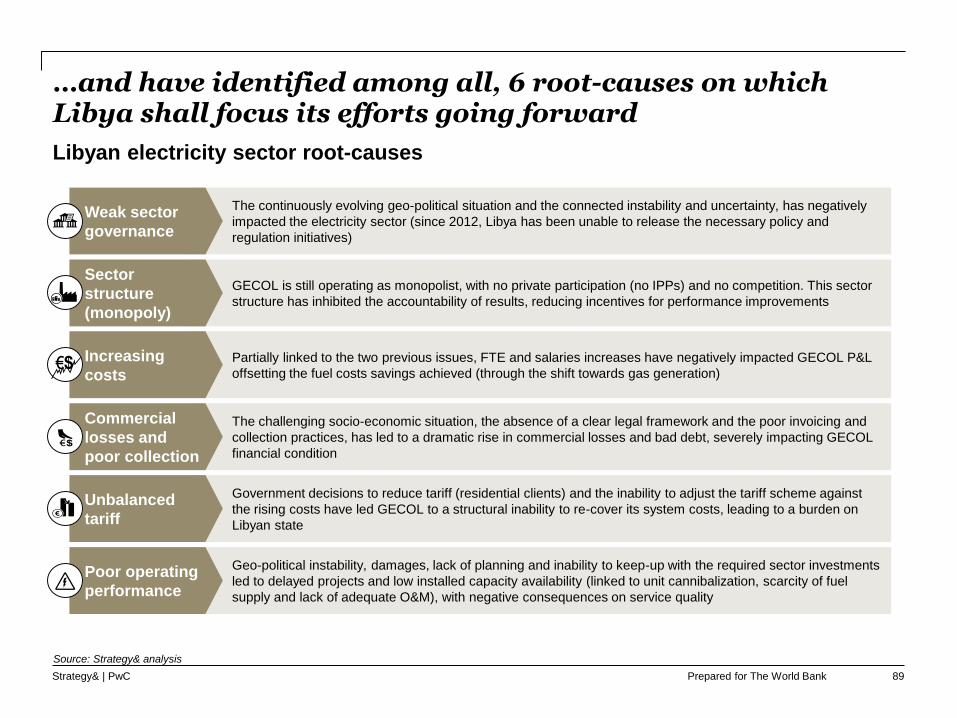
Prepared for The World BankStrategy& | PwC
…and have identified among all, 6 root-causes on which Libya shall focus its efforts going forward
Libyan electricity sector root-causes
Geo-political instability, damages, lack of planning and inability to keep-up with the required sector investments
led to delayed projects and low installed capacity availability (linked to unit cannibalization, scarcity of fuel
supply and lack of adequate O&M), with negative consequences on service quality
Poor operating
performance
Partially linked to the two previous issues, FTE and salaries increases have negatively impacted GECOL P&L
offsetting the fuel costs savings achieved (through the shift towards gas generation)
Increasing
costs
Government decisions to reduce tariff (residential clients) and the inability to adjust the tariff scheme against
the rising costs have led GECOL to a structural inability to re-cover its system costs, leading to a burden on
Libyan state
Unbalanced
tariff
GECOL is still operating as monopolist, with no private participation (no IPPs) and no competition. This sector
structure has inhibited the accountability of results, reducing incentives for performance improvements
Sector
structure
(monopoly)
The continuously evolving geo-political situation and the connected instability and uncertainty, has negatively
impacted the electricity sector (since 2012, Libya has been unable to release the necessary policy and
regulation initiatives)
Weak sector
governance
The challenging socio-economic situation, the absence of a clear legal framework and the poor invoicing and
collection practices, has led to a dramatic rise in commercial losses and bad debt, severely impacting GECOL
financial condition
Commercial
losses and
poor collection
Source: Strategy& analysis
89

Prepared for The World BankStrategy& | PwC
O&M
Further deep-dives on the generation, transmission and distribution issues can be found in Task C
1) For further detail, see “Task C – 4.2. Improving GECOL technical performance report; 2) Substations (S/S)
Source: Improving GECOL technical performance report, Strategy& analysis
Poor operating performance issues identified within Task C
Skills shortage
Generation Transmission ControlMV &
Distribution
#
Delayed
investments
Overdue
maintenance
Delayed capacity
expansion projects
Inadequate fuel
supply
Damaged substations
and overhead lines
Transformers failures
and 30kV network
earthing
Improve maintenance
of overhead lines &
S/S2 DC systems
Delayed substation
rehab. programs
Failure of
communication links
Delayed control
projects
Operational
deficiencies
Delayed investment
and replacement
projects
Deficient asset
installation and
maintenance
practices
Incorrect and unsafe
O&M practices
# ##
90
Poor sector operating performance
Sector
Issue /
concern
identified

Prepared for The World BankStrategy& | PwC
Contains findings
summaries of all
analyses performed
Contains preliminary
analysis on GECOL
Contains updated analysis on GECOL generation,
transmission, distribution (as well as financials)
Analyses up-dates are to be found in the various deliverables of Task A and C (i.e. Task C. 4.2 for GECOL technical issues)
91
Project approach
Rapid sector
performance assessment
High-level
options for sector reform
Sector reform &
electricity act
Option study for GECOL
restructuring
Roadmap for establishing
of LEMRA
Restructuring of
key actors
Regulatory
reform
Rapid assessment of
the sector
performance
Project set-up &
inception report
Findings review &
recommendations
Project review and
recommendations
Data collection
Approach, methodology
review and data
collection
Strategy for institutional
development
ERP System
review
Process mapping &
identification of gaps in
staff, skills, perform.
Manpower / org.
rationalization review
Tariff structure
set-up and reform
pathway
Tariff framework
review
Tools (excel model)
and trainings
Improving financial
performance of customer
service
Improving technical
performance
Customer service
performance
improvement
Financial performance
assessment &
financial models
Institutional
Development
Inception
report
Findings review &
recommendations
Project review and
recommendations
Data collection
Approach, methodology
review and data
collection
Rapid assessment of sector performance, structure, financials & structural reformTask A
Institutional development and performance improvement of GECOLTask C
1 2 3 4 5
1 2 3 4 5
2 3.1
3.2
4.1
4.2
51
2.1
2.2
4.1
4.2
51
2.3
2.4
3