SCA PROPERTY GROUP Investor Presentation... · SCA PROPERTY GROUP FY16 Results ... Reverse:...
42
SCA PROPERTY GROUP FY16 Results Presentation 15 August 2016 Greenbank Shopping Centre, Qld
Transcript of SCA PROPERTY GROUP Investor Presentation... · SCA PROPERTY GROUP FY16 Results ... Reverse:...

SCA PROPERTY GROUPFY16 Results Presentation
15 August 2016
Greenbank Shopping Centre, Qld

Overview of FY16 Results
Financial Performance
Operational Performance
Growth Initiatives
Key Priorities and Outlook
Questions
Appendices
2
AGENDA
1
4
5
2
3
6
7

OVERVIEW OF FY16 RESULTSAnthony MellowesChief Executive Officer
1

3.7% 5.7 yrsWeighted average Weighted Average
cost of debt5 debt maturity5
FY16 HIGHLIGHTS
4
Capital Management
Active Portfolio Management
$92.3m, up by 25.2%Adjusted Funds From Operations1
$1.92, up by 8.5%NTA per unit4
$145.3m $60.9mAcquisitions7 Divestments7
12.2 cpu, up by 7.0%Distribution paid to unitholders1,2
7.13%Portfolio weighted average cap rate6
$100.1m, up by 25.0%Funds from operations1
34.0%Gearing3, within 30 – 40% target range
98.6% 4.3%Portfolio occupancy6 Specialty vacancy6
1 FY 16 vs FY 152 Final distribution of 6.2 cpu in respect of the six months ended 30 June 2016 is expected to be paid on 31 August 2016. “cpu” stands for Cents Per Unit 3 As at 30 June 2016. Gearing is calculated as Finance debt (including NZ denominated debt) net of cash, with USD denominated debt recorded as the hedged AUD amount, divided by total tangible assets
(net of cash and derivatives)4 Compared to 30 June 20155 As at 30 June 20166 As at 30 June 2016. Includes acquisitions during 12 months ended 30 June 2016. Excludes New Zealand7 During the 12 month period we acquired 6 neighbourhood shopping centres for $145.3m (excluding transaction costs of $10.0 million), and we sold 5 assets to the “SURF 1” fund for $60.9m. We contracted to
sell the NZ properties in June 2016 however this sale will not complete until the FY17 financial year
Financial Performance

KEY ACHIEVEMENTS – DELIVERING ON STRATEGY
5
• Specialty tenants are performing strongly– Sales growth of over 5% pa continuing– 7.5% average rental increase across 69 renewals completed during FY16– Occupancy cost down to 9.3%
• Anchor tenant sales growth remains subdued• Comparable NOI growth of 3.4% above the same period last year
• Continued consolidation in fragmented market: we acquired 6 centres for $145.3m during the period– Wesfarmers-owned retailers now represent 20% of our anchor tenants (by number)
• Acquisitions primarily funded by capital recycling, with the divestment of five non-core assets to “SURF 1” for $60.9m, and agreed to divest 14 New Zealand assets for NZ$267.4m
• Refurbishment of Lismore and supermarket expansion at Chancellor Park completed. Development approvals received for Kwinana (Coles third anchor) and Bushland Beach (new Coles-anchored centre)
• Completed first unlisted retail fund “SURF 1” in October 2015, planning well advanced for “SURF 2”
• Balance sheet in a strong position– Gearing of 34.0% comfortably within our 30% to 40% target range– Weighted average cost of debt reduced to 3.7%, weighted average term to maturity of debt is
5.7 years, with 68% of drawn debt either fixed or hedged– First debt maturity extended to November 2018
• Distribution Reinvestment Plan raised $24.3m of new equity during FY16
• FY16 Funds From Operations continues to grow strongly, up 25.0% on the same period last year• FY16 FFO of 13.75 cpu represents growth of 7.3% on the same period last year• FY16 Distribution of 12.2 cpu represents growth of 7.0% on the same period last year
Earnings Growth Delivered
Optimising the Core Business
Growth Opportunities
Capital Management

FINANCIAL PERFORMANCEMark FlemingChief Financial Officer
2
7
$m FY16 FY15%
ChangeAnchor rental income 113.8 106.6 6.8%Specialty rental income 77.3 58.5 32.1%Straight lining & amortisation of incentives 1.3 4.4 (70.5%)Other income 7.1 6.3 12.7%Insurance income 5.0 - nmGross property income 204.5 175.8 16.3%Property expenses (58.1) (48.2) 20.5%Property expenses / Gross property income (%) 29.1% 27.4% 6.2%Net property income 146.4 127.6 14.7%Funds management income 1.2 - nmNet operating income 147.6 127.6 15.7%Corporate costs (11.9) (11.2) 6.3%Fair value of investment properties 54.9 67.9 (19.1%)Fair value of derivatives and financial assets 31.2 49.7 (37.2%)Unrealised foreign exchange losses (7.5) (34.7) (78.4%)Share of net profit from investments 0.6 - nmTransaction costs (0.1) (0.1) 0.0%EBIT 214.8 199.2 7.8%Net interest expense (27.6) (29.6) (6.8%)Refinancing transaction costs 0.0 (16.8) nmTax expense (2.5) (2.3) 8.7%Net profit after tax 184.7 150.5 22.7%
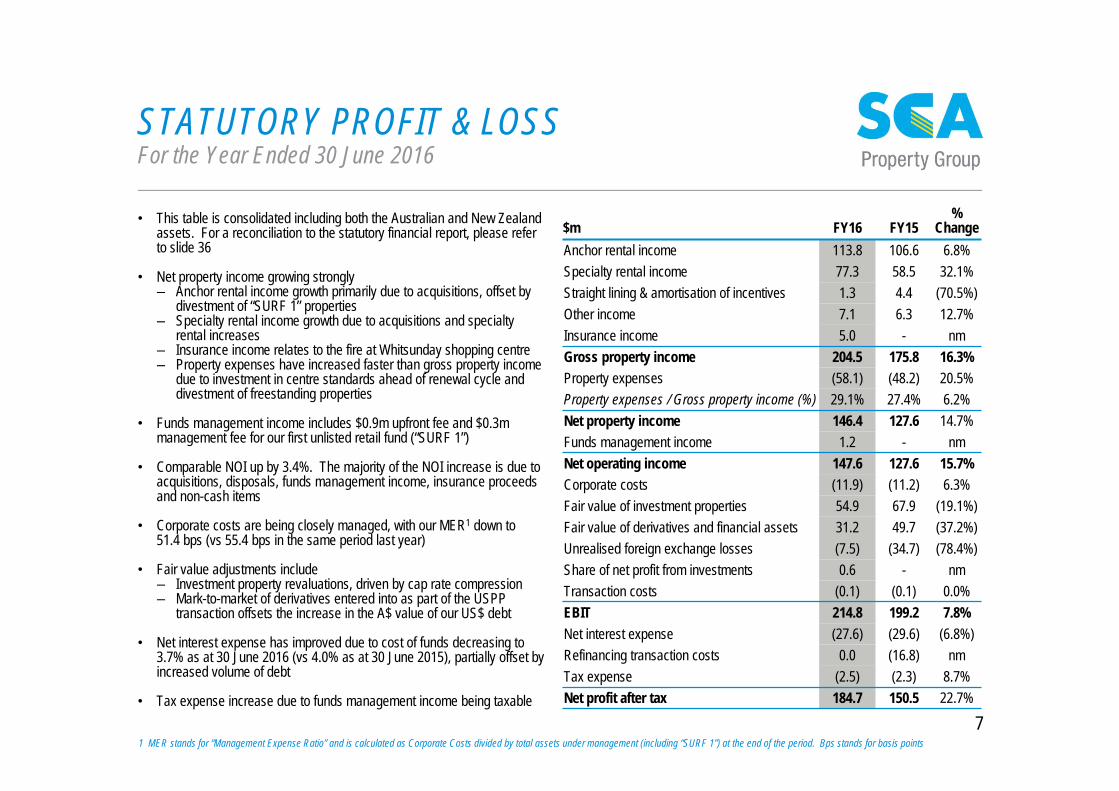
• This table is consolidated including both the Australian and New Zealand assets. For a reconciliation to the statutory financial report, please refer to slide 36
• Net property income growing strongly– Anchor rental income growth primarily due to acquisitions, offset by
divestment of “SURF 1” properties– Specialty rental income growth due to acquisitions and specialty
rental increases– Insurance income relates to the fire at Whitsunday shopping centre– Property expenses have increased faster than gross property income
due to investment in centre standards ahead of renewal cycle and divestment of freestanding properties
• Funds management income includes $0.9m upfront fee and $0.3m management fee for our first unlisted retail fund (“SURF 1”)
• Comparable NOI up by 3.4%. The majority of the NOI increase is due to acquisitions, disposals, funds management income, insurance proceeds and non-cash items
• Corporate costs are being closely managed, with our MER1 down to 51.4 bps (vs 55.4 bps in the same period last year)
• Fair value adjustments include– Investment property revaluations, driven by cap rate compression – Mark-to-market of derivatives entered into as part of the USPP
transaction offsets the increase in the A$ value of our US$ debt
• Net interest expense has improved due to cost of funds decreasing to 3.7% as at 30 June 2016 (vs 4.0% as at 30 June 2015), partially offset by increased volume of debt
• Tax expense increase due to funds management income being taxable
1 MER stands for “Management Expense Ratio” and is calculated as Corporate Costs divided by total assets under management (including “SURF 1”) at the end of the period. Bps stands for basis points
STATUTORY PROFIT & LOSSFor the Year Ended 30 June 2016

8
$m FY16 FY15%
ChangeNet profit after tax (statutory) 184.7 150.5 22.7%Reverse: Straight lining & amortisation (1.3) (4.4) (70.5%)Reverse: Fair value adjustments- Investment properties (54.9) (67.9) (19.1%)- Derivatives (31.2) (49.7) (37.2%)- Foreign exchange 7.5 34.7 (78.4%)- Net unrealised profit from “SURF 1” (0.1) - nm- Net Insurance proceeds (4.7) - nm
Reverse: Transaction costs / upfront fees 0.1 16.9 (99.4%)Funds From Operations (“FFO”) 100.1 80.1 25.0%Woolworths rental guarantee (net) - 4.2 nmDistributable Earnings (“DE”) 100.1 84.3 18.7%
Number of units (weighted average)(m) 727.9 658.0 10.6%DE per unit (cents) 13.75 12.81 7.3%Distribution per unit (cents) 12.20 11.40 7.0%Payout ratio (%)1 89% 89% nmDistribution ($m)1 89.0 78.1 14.0%Estimated tax deferred ratio (%) 14% 74% (81.1%)
Less: Maintenance capex (3.7) (1.0) 270.0%Less: Leasing costs and fitout incentives (4.1) (9.6) (57.3%)Adjusted FFO (“AFFO”) 92.3 73.7 25.2%
Distribution / AFFO (%) 96.4% 106.0% (9.0%)
1 Distribution was 6.0 cpu in respect of the first half (724.9m units on issue) and 6.2 cpu in respect of the second half (733.4m units on issue). Payout ratio is calculated as 12.20 cpu divided by weighted average DE per unit of 13.75 cpu
FUNDS FROM OPERATIONSFor the Year Ended 30 June 2016
• Funds From Operations of $100.1m is up by 25.0% on the same period last year– Whitsunday insurance proceeds received of $5.0m, but
only $0.3m relates to lost income– Woolworths rental guarantee has now ended
• AFFO of $92.3m is up by 25.2% on the same period last year– Maintenance capex of $3.7m includes $2.0m for 4
air-conditioning replacements in the second half– Leasing costs and fit-out incentives of $4.1m is lower due
to significant leasing up in the prior period
• Distributable Earnings of 13.75 cpu is up by 7.3% on the same period last year, with more units on issue due to equity raisings and DRP. DRP is currently suspended
• Distribution paid in respect of the year was 12.2 cpu (increase of 7.0% on the prior year)– Represents a payout ratio of 89% of Distributable Earnings
per unit which is within our target band of 85% - 95%– Less than 100% of AFFO– Tax deferred component of the distribution is 14%, lower
than usual due to capital gain on Tranche 1 of NZ sale

BALANCE SHEETAs at 30 June 2016
9
• New Zealand investment properties reclassified as “assets of disposal group”. Value of New Zealand investment properties increased from $208.0m as at 30 June 2015 to $253.1m as at 30 June 2016, reflecting the agreed sale price net of transaction costs (see slide 35 for further detail)
• Value of Australian investment properties increased from $1,687.4m to $1,888.0m, primarily due to acquisitions ($145.3m plus transaction costs of $10.0m) and positive revaluations ($26.9m) with average valuation cap rates for Australian properties firming from 7.48% to 7.13% (see slide 30 for further detail)
• Other assets includes derivative financial instruments with a mark-to-market valuation of $85.8m, SURF co-investment of $8.1m, receivables of $13.3m and other assets of $5.7m. 30 June 2015 included $60.9m for the assets sold to “SURF 1” in October 2015
• Reduction in debt is primarily due to the NZ debt being classified as “liabilities of disposal group”. Australian debt has increased primarily due to acquisitions, less proceeds from the sale of the “SURF 1” properties
• NTA per unit increased by 8.5% or 15 cents to $1.92 since 30 June 2015, primarily due to increase in property valuations (8 cpu), derivative mark-to-market (4 cpu), NZD appreciation (2 cpu) and undistributed profit (2 cpu), offset by increased value of US$ debt (-1 cpu)
• 11.8m units were issued during the year under the DRP
$m 30 June
201630 June
2015%
Change
Cash 3.8 3.7 2.7%
Investment properties 1,888.0 1,895.4 (0.4%)
Other assets 112.9 121.9 (7.4%)
Assets of disposal group 254.0 - nm
Total assets 2,258.7 2,021.0 11.8%
Debt 634.7 680.1 (6.7%)
Accrued distribution 45.5 41.8 8.9%
Other liabilities 29.4 22.3 31.8%
Liabilities of disposal group 140.2 - nm
Total liabilities 849.8 744.2 14.2%
Net tangible assets 1,408.9 1,276.8 10.3%
Number of stapled units (m) 733.4 721.5 1.6%
NTA per unit ($) 1.92 1.77 8.5%Corporate costs 11.9 11.2 6.3%External funds under management- “SURF 1” total assets 64.0 - nm- Less: "SURF 1" co-investment (8.1) - nm
Assets under management 2,314.6 2,021.0 14.5%MER (%) 0.514% 0.554% (7.2%)

0
190230
175 209.8
0
100
200
300
Bank facilities MTN USPP
• Gearing of 34.0%1 is within target range of 30% to 40%. New Zealand sale will reduce pro-forma gearing by around 8% to 26%, prior to redeployment of proceeds. Post balance date we acquired or agreed to acquire $118.8m of new centres which will increase gearing back up to approximately 30% on a pro-forma basis
• As a consequence of the NZ sale, NZ$87.5m of fixed interest rate swaps expired or were terminated during the year, and a further A$150m of fixed interest rate swaps were terminated after 30 June 2016 once Tranche 1 proceeds had been received. As at 30 June 2016, 68.4% of our drawn debt was fixed or hedged
• During the year we refinanced several of the bilateral bank debt facilities for lower margins, longer tenors and increased limits
• Weighted average cost of debt is currently around 3.7%, and weighted average term to maturity of our debt is 5.7 years, with no debt expiry until November 2018
• We are well within debt covenant limits of less than 50% gearing and interest cover ratio (ICR) greater than 2.0x
• In July 2016 we increased the A$ MTN notes on issue by $50m at a cost of 3.50% fixed until April 2021
DEBT AND CAPITAL MANAGEMENTAs at 30 June 2016
10
Debt Facilities Expiry Profile ($m)
1 Facility limit is the bilateral bank facilities limits of $445.0m plus the USPP A$ denominated facility $50.0m plus the USPP US$ denominated facility at A$159.8m (being the AUD amount received and hedged in AUD), plus the MTN $175m facility. The USPP facilities and the MTN facilities are fully drawn
2 Drawn debt of $736.6m is made up of: statutory debt of $634.7m plus $10.0m used for bank guarantees plus the NZ$ debt equiv to A$135.9m (the NZ debt is disclosed as part of the disposal group) less $42.2m being the revaluation of the USPP debt at $202.0 using the prevailing June 2016 spot exchange rate to restate the USPP at $159.8m (refer note 1 above) plus unamortised debt fees of $2.3m net of $4.1m cash (cash including the NZ denominated cash of A$0.3m)
3 Gearing calculated as drawn debt of $736.6m (refer note 2 above) divided by total tangible assets (net of cash and derivatives) being total assets of $2,258.7m less cash of $4.1m less derivative mark-to-market of $85.8m = $2,168.8m
4 Interest cover ratio is calculated as financial year Group (including NZ) EBIT $214.8m less unrealised gains and losses of $78.5m, divided by net interest expense of $27.6m
FY16 – FY18 FY19 FY20 FY21 FY28 – FY30
$m30 June
201630 June
2015Facility limit1 829.8 804.8Drawn debt (net of cash)2 736.6 654.4Gearing3 34.0% 33.3%% debt fixed or hedged 68.4% 65.0%Weighted average cost of debt 3.7% 4.0%Average debt facility maturity (yrs) 5.7 6.3Average fixed / hedged debt maturity (yrs) 4.2 3.8Interest cover ratio4 4.9x 3.9x

OPERATIONAL PERFORMANCEAnthony MellowesChief Executive Officer
3

12
PORTFOLIO OVERVIEW
Tenants by Category (by gross rent)2 Geographic Diversification (by value)2
1 Relates to Bushland Beach Plaza which is a development asset as at 30 June 20162 Annualised gross rent excluding vacancy. Excludes New Zealand and Bushland Beach Plaza
Specialty Tenants by Category (by gross rent)2
Assets As at 30 June 2016
Number of centres
Number of specialties
GLA (sqm)
Occupancy (% GLA)
Value (A$m)
WALE (yrs)
Weighted average cap rate (%)
Freestanding 1 - 9,387 100.0% 43.0 19.3 6.75
Neighbourhood 60 740 332,110 98.5% 1,357.4 10.4 7.08
Sub-regional 7 326 139,718 98.8% 480.5 11.6 7.30
Other1 1 n/a n/a n/a 7.1 n/a 6.75
Total Assets Australia 69 1,066 481,215 98.6% 1,888.0 10.9 7.13
New Zealand 14 32 60,824 99.0% 253.1 15.8 6.62
Total Assets Australia & NZ 83 1,098 542,039 98.7% 2,141.1 11.5 7.07
NSW23%
VIC23%
QLD22%
WA8%
SA9%
TAS15%
Woolworths 38%
Big W 6%Dan Murphy's 1%
Masters 1%Coles 7%Kmart 1%Target 1%
Specialties 45%
Fresh Food/Food Catering/Liquor 30%
Services 16%
Pharmacy & Medical 15%
Mini Major 13%
Apparel 9%
Petrol 2%
Other Retail 15%

13
PORTFOLIO OCCUPANCYAustralian portfolio occupancy is 98.6%
• Total Australian portfolio occupancy is at 98.6% of GLA– Specialty vacancy of 4.3% is within the normalised
target range of 3% - 5%
• Sale of NZ decreased portfolio occupancy by 0.1% (due to high NZ weighting towards anchor tenants)
• Acquisitions during the 12 months to 30 June 2016 had combined specialty vacancy of 8.0% at acquisition– We believe we can add value to acquisitions by
leveraging our leasing expertise
• Active management of lease expiry in advance leading to a reduction of FY17 expiry from 7.8% to 6.2%. FY18 – FY20 increases due to the sale of New Zealand (which had a higher weighting towards anchor tenants)
Portfolio Occupancy (% of GLA)1
1 Excludes New Zealand
6.2% 7.9% 8.6% 9.6% 8.2% 5.3% 3.8% 1.4% 2.9%
46.3%
FY17 FY18 FY19 FY20 FY21 FY22 FY23 FY24 FY25 FY26and
Beyond
Overall Lease Expiry (% of Gross Rent)1
98.6% 98.8% 98.7% 98.6%
December 2014 June 2015 December 2015 June 2016

14
• Moderating Australian supermarket sales growth, due to– Maturing of our original portfolio– Acquisitions of more mature centres– Woolworths supermarkets relative under-performance– Ongoing price reductions by our anchor tenants (volumes
continue to grow)
• Specialty tenants continue to trade strongly, despite the slowdown in supermarket sales growth
• Turnover rent continues to increase - we now have 13 anchors paying turnover rent as at 30 June 2016 (10 supermarkets, 2 Kmarts and 1 Dan Murphy’s), and another 10 Australian supermarkets are within 10% of their turnover thresholds. The movement from June 15 is due to one Dan Murphy’s reaching its threshold and a net reduction of 2 supermarkets, with 3 supermarkets having base rent reviews during the last 12 months
• Anchor tenant turnover rent represents only 0.6% of our gross property income– Our base rentals cannot reduce due to store turnover
performance during the lease term– Turnover rent may become a rental growth opportunity in the
future if Woolworths’ sales growth improves– Around 39% of our Australian anchor tenant leases have a
minimum 5% increase in base rentals in FY18 / FY19– No turnover rental was derived from New Zealand assets
SALES GROWTH & TURNOVER RENT
Comparable Store MAT sales growth by category (%)
As at 30 June 2016
As at 30 June 2015
Supermarkets (Aus) 0.2% 2.1%Supermarkets (NZ) (0.3%) 6.0%Discount Department Stores (DDS) (3.7%) (5.2%)Mini Majors (Aus) 5.1% 2.9%Specialties (Aus) 5.6% 5.6%Total 0.6% 2.5%
Turnover Rent ($m)
8 Anchors 14 Anchors 13 Anchors
0.9
1.11.2
FY14 FY15 FY16

Fixed 85%
CPI 13%
Other 2%
Local 35%
National / Regional
65%
SPECIALTY KEY METRICSPositive rent reversions are expected to continue
• Specialty sales continue to grow strongly, assisted by supermarket volume growth
• Average specialty occupancy cost continues to be sustainable at 9.3%
• Average specialty rent/sqm remains below that of our competitors
• 69 renewals concluded in FY16 with increases of 7.5% above passing rent (and no incentives paid). Excluding one outlier, increase would be 8.7%
• Average incentive levels on new leases of around 12 months (for five year leases)
• Most specialty leases have fixed annual increases of 3% to 4% pa
Australian specialty lease composition (as at 30/6/2016)
Annual Increase Mechanism
Tenant Type
FY16 FY15
Specialty sales MAT growth (%) 5.6% 5.6%
Average specialty occupancy cost (%) 9.3% 9.7%
Average gross rent per square metre $676 $651
Sales productivity ($ per sqm) 7,269 6,711
Renewals
Number 69 50
GLA (sqm) 7,208 4,305
Average uplift (%) 7.5% 7.3%
Incentive (months) 0 0
New Leases
Number 58 114
GLA (sqm) 7,131 10,107
Incentive (months) 11.9 13.3
Australian specialty tenant key metrics
15
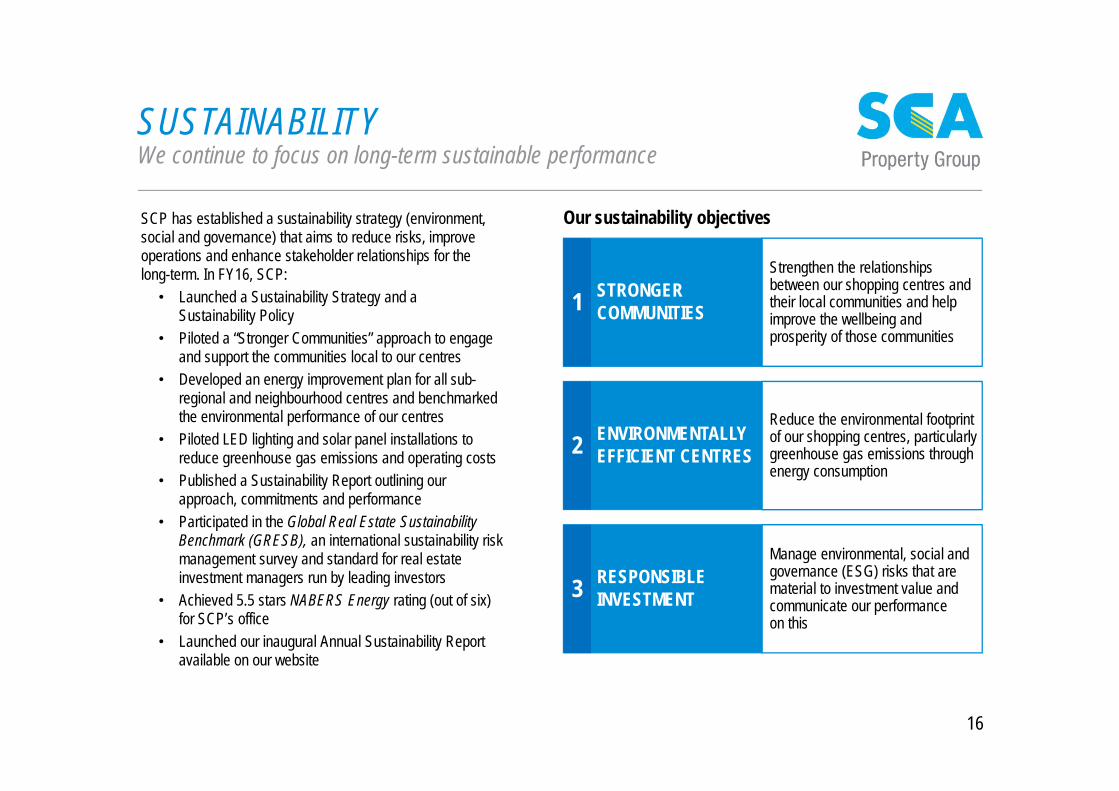
SCP has established a sustainability strategy (environment, social and governance) that aims to reduce risks, improve operations and enhance stakeholder relationships for the long-term. In FY16, SCP:• Launched a Sustainability Strategy and a
Sustainability Policy• Piloted a “Stronger Communities” approach to engage
and support the communities local to our centres• Developed an energy improvement plan for all sub-
regional and neighbourhood centres and benchmarked the environmental performance of our centres
• Piloted LED lighting and solar panel installations to reduce greenhouse gas emissions and operating costs
• Published a Sustainability Report outlining our approach, commitments and performance
• Participated in the Global Real Estate Sustainability Benchmark (GRESB), an international sustainability risk management survey and standard for real estate investment managers run by leading investors
• Achieved 5.5 stars NABERS Energy rating (out of six) for SCP’s office
• Launched our inaugural Annual Sustainability Report available on our website
16
SUSTAINABILITYWe continue to focus on long-term sustainable performance
Our sustainability objectives
ENVIRONMENTALLY EFFICIENT CENTRES
RESPONSIBLE INVESTMENT
STRONGER COMMUNITIES
Strengthen the relationships between our shopping centres and their local communities and help improve the wellbeing and prosperity of those communities
Reduce the environmental footprint of our shopping centres, particularly greenhouse gas emissions through energy consumption
Manage environmental, social and governance (ESG) risks that are material to investment value and communicate our performance on this
1
2
3

GROWTH INITIATIVESAnthony MellowesChief Executive Officer
4

18
ACTIVE PORTFOLIO MANAGEMENT (I) Six acquisitions and five divestments in the twelve months to 30 June 2016
Griffin Plaza (Griffith, NSW)• Acquisition completed in Sept 2015 for $23.0m
(7.45% implied cap rate)• % of income from Coles: 37%• Overall WALE: 7.0 years• Occupancy: 95.3%• Year Built: 1997 (refurbishment of Coles
in 2014)
Northgate Shopping Centre (Tamworth, NSW)• Acquisition completed in Dec 2015 for $14.8m
(7.40% implied cap rate)• % of income from Coles: 52%• Overall WALE: 5.4 years• Occupancy: 98.9%• Year built: 1993 (refurbishment of Coles
in 2014)
Wonthaggi Plaza (Wonthaggi, VIC)• Acquisition completed in Dec 2015 for $45.4m
(7.12% implied cap rate)• % of income from Coles/Target: 49%• Overall WALE: 9.2 years• Occupancy: 97.3%• Year Built: 1980 (refurbished in 2012)
Marian Town Centre (Mackay, QLD)• Acquisition completed in Nov 2015 for $32.0m
(7.10% implied cap rate)• % of income from Woolworths: 39%• Overall WALE: 11.5 years• Occupancy: 100.0%• Year Built: 2014
Acquisitions
Greenbank Shopping Centre (Greenbank, QLD)• Acquisition completed in Jan 2016 for $23.0m
(6.55% implied cap rate)• % of income from Woolworths: 43%• Overall WALE: 9.9 years• Occupancy: 100.0%• Year Built: 2008
Bushland Beach (Townsville, QLD)• Fund-through development. Land acquired in June 2016 for
$5.5m, plus $1.6m for work in progress. Final development total cost of $25.1m, (6.83% implied cap rate)
• % of income from Coles: 63%• Overall WALE: n/a• Occupancy: n/a• Expected completion date: May 2017
Fairfield Heights, Griffith North, Burwood Dan Murphy’s, Katoomba Dan Murphy’s, Inverell Big W : sold for $60.9m in October 2015 to our first unlisted retail fund “SURF 1” (7.17% implied cap rate)
Disposals

19
ACTIVE PORTFOLIO MANAGEMENT (II)NZ divestments and post balance date acquisitions
Since 30 June 2016, SCP has acquired or agreed to acquire four neighbourhood shopping centres in Australia for $118.8m, redeploying some of the proceeds from the New Zealand sale. Three centres have already settled with Annandale Central expected to settle by December 2016
Muswellbrook Fair Shopping Centre• In July 2016 we acquired Muswellbrook Fair (Coles-anchored
neighbourhood centre located in the Upper Hunter Valley region of NSW) for $29.3m representing an implied fully-let yield of 6.95%
Jimboomba Junction Shopping Centre• In July 2016 we acquired Jimboomba Junction (Coles-anchored
neighbourhood centre located on the southern fringe of Brisbane CBD, QLD) for $27.5m representing an implied fully let yield of 7.13%
Belmont Central Shopping Centre• In July 2016 we acquired Belmont Central (Woolworths-anchored
neighbourhood centre located on the Central Coast region of NSW) for $28.5m representing an implied fully let yield of 7.63%
Annandale Central Shopping Centre• In August 2016 we agreed to acquire Annandale Central (Coles-anchored
neighbourhood centre located 7km south of Townsville CBD, QLD) for $33.5m representing an implied fully let yield of 7.40%
Post Balance Date Acquisitions• On 10 June 2016 SCP
announced it had entered into agreement with Stride (NZX: STR) for the sale of all of SCP’s New Zealand properties to Investore for NZ$267.4 million, representing an after-tax cap rate of less than 6% and a 6.5% premium to 31 Dec 2015 book value. The sale became unconditional on 30 June 2016
• The sale is consistent with our strategy of divesting freestanding assets, as 9 of the 14 New Zealand centres are freestanding. In addition, our Australian centres generally have a higher growth outlook than the New Zealand portfolio
• Settlement of Tranche 1 for NZ$128.2m completed on 12 July 2016, and settlement of Tranche 2 for NZ$139.2m is expected to occur in late September 2016
NZ Disposal
Kerikeri
Warkworth
Newtown
Tawa
Kelvin Grove
Stoddard RoadTakaniniSt James
Bridge Street
Nelson South
Rangiora EastHornby
Dunedin South
Rolleston
Freestanding Neighbourhood

NEIGHBOURHOOD CENTRES IN AUSTRALIAFragmented ownership provides acquisition opportunities
ISPT: 1%
Private: 53%
SCP: 9%
ISPT: 9%
• There are over 850 Coles and Woolworths anchored neighbourhood centres in Australia
• SCP is the largest owner (by number) of neighbourhood centres in Australia. SCP has an opportunity to continue to consolidate this fragmented segment by utilising its funding capability, management capability and industry knowledge to source and execute acquisition opportunities from private and corporate owners. Since listing SCP has completed the acquisition of 31 neighbourhood centres for $769m in aggregate
Ownership of neighbourhood centres in Australia(Number of centres)
Indicative
Source: Management estimates
Neighbourhood centre landscape in Australia
Recent transactions
• During the twelve months ended 30 June 2016, 54 Woolworths / Coles anchored neighbourhood centres changed hands for aggregate consideration of $1,243m
• SCP and ISPT were the largest individual buyers of neighbourhood centres during that period
FY16 Buyers (by value)
Other Institutions: 1%
FY16 Sellers (by value)
Syndicates and Funds: 16%Private:
46%
Syndicates and Funds: 28%
Other Institutions:37%
SCPCQR
ISPTVCX
Private
Syndicates, Funds, Other Institutions
20

21
INDICATIVE DEVELOPMENT PIPELINEWe have identified around $150m of development opportunities at 20 of our centres over the next 5 years1
1 The exact timing of future developments is subject to prevailing market conditions and regulatory approvals
Estimated Capital Investment (A$m)Development Type Centre (s) FY17 FY18 FY19 FY20 FY21
Centre Improvement Burnie, Murray Bridge, The Markets 0.2 2.7 2.6 - -
Stage 3 (third anchor) Kwinana 17.5 2.0 - - -
Supermarket expansions Northgate, Riverside, Treendale, West Dubbo 0.1 0.2 5.1 4.2 8.0
Supermarket and centre expansions
Collingwood Park, Gladstone, Mackay, New Town Plaza, North Orange, Wyndham Vale 1.0 20.7 14.2 7.8 19.0
Major centre expansions Bushland Beach, Central Highlands, Epping North, Greenbank, Mt Gambier, Ocean Grove 18.5 0.3 1.3 17.2 8.5
Preliminary and defensive Various 0.3 0.3 0.3 0.3 0.3Total 37.6 26.2 23.5 29.5 35.8
• We invested $9.1m on developments during FY16, including $2.8m on the Lismore refurbishment, $3.9m on the Chancellor Park supermarket expansion, $0.5m on Kwinana preliminaries, and the balance on preliminaries for other projects
• In FY17, the major projects will be building a new Coles-anchored centre at Bushland Beach near Townsville (expected to open in May 2017), and adding Coles as a third anchor at Kwinana (expected to open in July 2017)

22
FUNDS MANAGEMENT BUSINESSPotential to deliver additional earnings growth in the future
• First fund “SURF 1” successfully completed– Five SCP non-core assets acquired for $60.9m, a 12%
premium to book value – Fund commenced on 1 October 2015– SCP retains a 24.4% equity interest in the fund
• We intend to launch “SURF 2” during 1H FY17– To comprise Katoomba Woolworths / Big W, another SCP
non-core asset with current book value of $43.0m
• SCP will continue to launch additional retail funds– Assets may include either other SCP non-core assets, or
acquired assets– Utilise SCP’s large unitholder base and retail expertise
• The funds management business will allow SCP to recycle non-core assets, and utilise its expertise and platform to earn capital-light management fees in the future

KEY PRIORITIES AND OUTLOOKAnthony Mellowes Chief Executive Officer
5
Mark FlemingChief Financial Officer

24
CORE STRATEGY UNCHANGEDDefensive, resilient cashflows to support secure distributions
Focus on convenience-based retail centres
Weighted to non-discretionary retail segments
Long leases to quality anchor tenants
Appropriate capital structure
Growth opportunities

POTENTIAL EARNINGS GROWTH TRENDSContinued solid earnings growth expected over time
Anchor Rental Growth
Specialty and Other Rental Growth
Expenses
Property Development
Acquisitions
Other Opportunities
Indicative Contribution to FFO Growth Rate (% pa)
(medium to longer term from FY18 onwards)Description and Assumptions
• Anchor rental income represents about 55% of overall gross property income• Once turnover thresholds are met, rent will grow in proportion to Anchors’ sales growth• Around 39% of Anchor tenancy leases have a minimum 5% increase in base rent in FY18/FY19
• Specialty rental income represents about 45% of overall gross property income• Specialty leases generally have contracted growth of 3-4% pa• Positive specialty rent reversions expected on expiry due to relatively low rent / sqm at present
• After investment in FY15 and FY16, Property Expenses and Corporate Costs expected to grow at same rate as rental income
• Interest expense is continuing to be actively managed
• Selective extensions and refurbishments of our existing centres are intended to be undertaken in the future
• We have identified around $150m of development opportunities so far
• Selective acquisitions will continue to be made in the fragmented neighbourhood shopping centre segment
• New Zealand divestment proceeds of $253.1m to be reinvested at a higher yield
• New funds management business, with "SURF 2" to be launched in 1H FY17
Core
Bus
ines
sGr
owth
Initi
ative
s
0 - 1%
1 - 2%
0%
1% +
2 - 4% +
Indicative Comparable NOI Growth (%) 1 – 3%
Indicative FFO Growth (%)
25

Optimising the CoreBusiness
• Increase specialty rent per sqm by optimising tenancy mix and achieving rental uplifts on renewals
• Manage potential sale or closure of Masters store at Mount Gambier
Growth Opportunities
• Redeploy NZ sale proceeds of $253.1m into value-accretive acquisition opportunities consistent with our strategy and investment criteria
• Progress our identified development pipeline
• Launch our second retail fund (“SURF 2”) in 1H FY17
Capital Management
• Continue to actively manage our balance sheet to maintain diversified funding sources with long weighted average debt expiry and a low cost of capital consistent with our risk profile
Earnings Guidance
• FY17 EPU guidance of 14.0 cpu and FY17 DPU guidance of 12.6 cpu (takes into account the sale of the New Zealand assets, and the four post-balance date acquisitions)
26
KEY PRIORITIES AND OUTLOOKContinue to deliver on strategy in FY17

QUESTIONS6

APPENDICES7

12.9%14.7%
17.9%19.3%
12.4%
7.6%6.1%
3.0% 2.5% 3.6%
FY17 FY18 FY19 FY20 FY21 FY22 FY23 FY24 FY25 FY26and Beyond
6.2% 7.9% 8.6% 9.6% 8.2%5.3% 3.8% 1.4% 2.9%
46.3%
FY17 FY18 FY19 FY20 FY21 FY22 FY23 FY24 FY25 FY26and Beyond
29
• 55% of gross rent generated by Woolworths (46%) and Wesfarmers Group (9%) (on a fully leased basis), with an Anchor WALE of 14.0 years
• Opportunity to realise positive rent reversions from specialty tenants as lease expiries increase over the next few years
• Overall, 10.9 year portfolio WALE combined with investment grade tenants and non-discretionary retail categories provides a high degree of income certainty
LONG TERM LEASES TO WOOLWORTHS AND WESFARMERS GROUP
Portfolio Lease Expiry Profile Specialty Lease Expiry (% of specialty gross rent)
Overall Lease Expiry (% of gross rent)
30 June 2016 WALE years
Portfolio WALE 10.9
Anchor WALE 14.0
INVESTMENT PROPERTIES VALUE
30
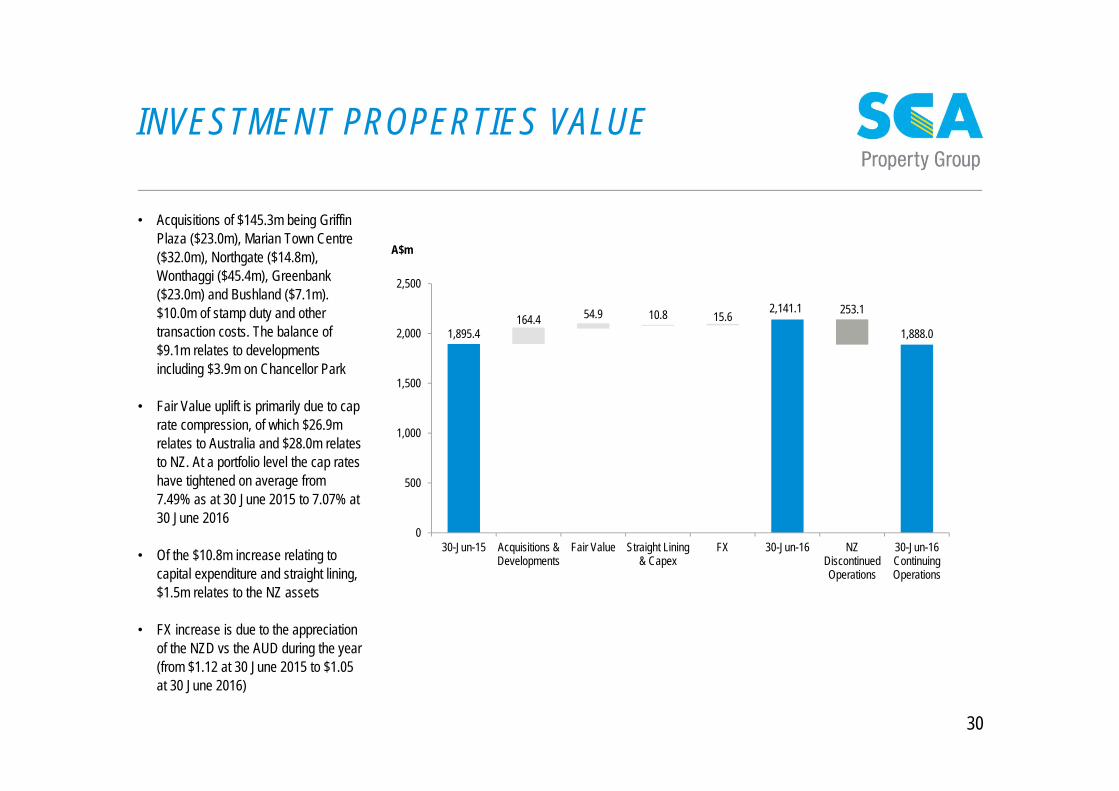
• Acquisitions of $145.3m being Griffin Plaza ($23.0m), Marian Town Centre ($32.0m), Northgate ($14.8m), Wonthaggi ($45.4m), Greenbank ($23.0m) and Bushland ($7.1m). $10.0m of stamp duty and other transaction costs. The balance of $9.1m relates to developments including $3.9m on Chancellor Park
• Fair Value uplift is primarily due to cap rate compression, of which $26.9m relates to Australia and $28.0m relates to NZ. At a portfolio level the cap rates have tightened on average from 7.49% as at 30 June 2015 to 7.07% at 30 June 2016
• Of the $10.8m increase relating to capital expenditure and straight lining, $1.5m relates to the NZ assets
• FX increase is due to the appreciation of the NZD vs the AUD during the year (from $1.12 at 30 June 2015 to $1.05 at 30 June 2016)
A$m
1,895.4164.4 54.9 10.8 15.6
2,141.1 253.1
1,888.0
0
500
1,000
1,500
2,000
2,500
30-Jun-15 Acquisitions &Developments
Fair Value Straight Lining& Capex
FX 30-Jun-16 NZDiscontinuedOperations
30-Jun-16ContinuingOperations

DEBT FACILITIES & INTEREST RATE HEDGING
31
$mFacility Limit
(A$m)Drawn Debt
(A$m)Undrawn
(A$m) MaturityBank FacilitiesBank bilateral 190.0 160.9 29.1 Nov – Dec 2018Bank bilateral 25.0 10.0 15.0 Feb 2019Bank bilateral1 230.0 185.0 45.0 Dec 2019
445.0 355.9 89.1
Medium Term Note4 175.0 175.0 0.0 Apr 2021
US Private PlacementUS$ denominated2 106.5 106.5 0.0 Aug 2027US$ denominated2 53.3 53.3 0.0 Aug 2029A$ denominated 50.0 50.0 0.0 Aug 2029
209.8 209.8 0.0Total unsecured financing facilities3 829.8 740.7 89.1
500 500 500450
2.50%3.00%3.50%4.00%
400450500550
Jun 16 Jun 17 Jun 18 Jun 19
$m
$m fixed or hedged Average hedge rate (excluding margin and line fees)
1 Includes $10.0m guarantee for the Responsible Entity’s compliance with its Australian Financial Services Licence2 US denominated repayment obligations have been fully hedged at a A$/US$ rate of 0.93873 Drawn debt of $740.7m, plus unrealised foreign exchange losses of $42.2m in relation to the hedged USPP US$ proceeds, less $10.0m bank guarantee, less $2.3m remaining unamortised establishment fees,
less NZ denominated debt of A$135.9m (disclosed as part of discontinued operations) equals $634.7m “interest bearing liabilities” in the consolidated balance sheet4 MTN facility was increased by $50m on the same terms as the existing MTN and drawn to $225m in July 2016
Debt Facilities as at
30 June 2016
Interest Rate Fixed /
Hedging Profile4
$500m represents 68.4% of drawn facilities (excl $10m bank guarantee)
fixed or hedged as at Jun 2016

RETAIL TRANSACTIONSOn average, over 30 neighbourhood shopping centres are sold in Australia each year
32Source: JLL ResearchNote: 2016 represents only the first half of the calendar year
• Even during the global financial crisis there was transaction activity in the neighbourhood shopping centre segment
• The volume and value of transactions has increased since 2008
• Yields are declining as investors competitively pursue properties with long WALEs, strong covenants, and a solid income growth outlook in a low interest rate environment
Neighbourhood shopping centre transactions in Australia
Value of centres transacted (A$m) Average Cap Rate (%)
45 26 34 37 57 41 43 71 77 14
Number of centres transacted
832
480588
744
984
728
1,209
1,8622,015
312
0
2
4
6
8
10
-
500
1,000
1,500
2,000
2,500
2007 2008 2009 2010 2011 2012 2013 2014 2015 2016

ACQUISITIONS DURING THE PERIODTwelve months to 30 June 2016
33
Centre typeAcquisition
date
Anchor GLA
(sqm)
Specialty GLA
(sqm)
Total GLA
(sqm)% GLA
committed
Total purchase price($m)
ImpliedAcquisition
Cap rate (fully-let)
Acquired Properties
Griffin Plaza, NSW Neighbourhood Sep 2015 3,679 3,554 7,233 95.3% 23.0 7.45%
Marian Town Centre, QLD Neighbourhood Nov 2015 3,208 3,496 6,704 100.0% 32.0 7.10%
Northgate Shopping Centre, NSW Neighbourhood Dec 2015 2,591 1,540 4,131 98.9% 14.8 7.40%
Wonthaggi Plaza, VIC Neighbourhood Dec 2015 7,848 4,024 11,872 97.3% 45.4 7.12%
Greenbank Shopping Centre, QLD Neighbourhood Jan 2016 3,970 1,720 5,690 100.0% 23.0 6.55%
Bushland Beach Plaza, QLD1 Neighbourhood June 2016 - - - - 7.1 6.83%
Total 21,296 14,334 35,630 98.3% 145.3 7.09%
Post Balance Date Acquisition Property
Muswellbrook Fair, NSW Neighbourhood July 2016 5,103 3,890 8,993 97.0% 29.3 6.95%
Jimboomba Junction, QLD Neighbourhood July 2016 3,045 2,887 5,932 96.7% 27.5 7.13%
Belmont Central, NSW Neighbourhood July 2016 3,784 2,788 6,572 93.0% 28.5 7.63%
Annandale Central, QLD2 Neighbourhood Aug 2016 3,627 3,058 6,685 91.1% 33.5 7.40%
Total 15,559 12,623 28,182 94.5% 118.8 7.28%
1 Bushland Beach is a fund-through development asset. As at 30 June 2016, the value recognised represent $5.5m for the land acquired plus $1.6m of work in progress. 2 A deposit of $1.7m was paid in Aug 16 for the acquisition of Annandale Central with the remaining balance of the purchase price of $31.8m to be paid on settlement

DIVESTMENTS DURING THE PERIODTwelve months to 30 June 2016
34
Centre typeDivestment
date
Anchor GLA
(sqm)
Specialty GLA
(sqm)
Total GLA
(sqm)% GLA
committed
Total sale price(A$m)
DivestmentCap rate
Divested Properties (“SURF 1”)
Woolworths Griffith North, NSW Freestanding Oct 2015 2,560 - 2,560 100.0% 9.2 6.50%
Woolworths Fairfield Heights, NSW Freestanding Oct 2015 3,361 342 3,703 100.0% 18.0 6.75%
Dan Murphy’s Burwood, NSW Freestanding Oct 2015 1,400 - 1,400 100.0% 8.6 6.25%
Dan Murphy’s Katoomba, NSW Freestanding Oct 2015 1,420 - 1,420 100.0% 6.7 6.75%
Big W Inverell, NSW Freestanding Oct 2015 7,559 130 7,689 100.0% 18.4 8.50%
Total 16,300 472 16,772 100.0% 60.9 7.17%
Centre type
Expected Divestment
date
Anchor GLA
(sqm)
Specialty GLA
(sqm)
Total GLA
(sqm)% GLA
committed
Total sale price
(NZ$m)Divestment
Cap rate
Pending Divestments (NZ)
Tranche 1 Neighbourhood / Freestanding July 2016 22,927 6,397 29,324 98.6% 128.2
Tranche 2 Freestanding Sept 2016 31,500 - 31,500 100.0% 139.2
Total 54,427 6,397 60,824 99.3% 267.4 6.62%

NZ DISPOSAL – BALANCE SHEET IMPACT (A$)As at 30 June 2016
35
• On 10 June 2016 the Group announced it entered into a sale contract with Stride (NZX: STR) for the sale of SCP’s New Zealand properties to Investore. Settlement of this transaction is scheduled to occur in two tranches– Tranche 1 settled on 12 July 2016 and comprising 6 properties for
NZ$128.2m– Tranche 2 comprising the remaining 8 properties for NZ$139.2m.
Tranche 2 is expected to settle late September 2016• Total NZ sale price is therefore NZ$267.4m. At the prevailing 30 June
2016 exchange rate of 1.04507 this translated to A$255.9m. The 30 June 2016 carrying value of the properties of A$253.1m is equal to the sale price net of expected NZ$ denominated sale costs. Other assets relates to prepaid insurance, and other liabilities relates to provision for income tax
• As at 30 June 2016 for financial reporting purposes the Group’s NZ$ denominated assets and liabilities (including these properties) are disclosed as “disposal group held for sale”
• Tranche 1 proceeds of NZ$128.2m were applied as follows:– NZ$120.0m converted and remitted to Australia at an effective
exchange rate of 1.041 resulting in AU$115.3m. – NZ$8.2m proceeds were used to reduce NZ$ denominated debt
• The majority of the proceeds of Tranche 2 are expected to reduce the remaining NZ denominated debt which at 30 June 2016 was NZ$142.0m. The remaining NZ$ proceeds will be remitted to Australia (after payment of NZ$ costs and liabilities)
• The NZ$ debt facility is available for use in AU$ in Australia
.
1 Adjustments relate to disposal group for financial reporting; financial reporting requires all the assets to be grouped into a single line and similar for liabilities
$mAustralian Operations
NZ Disposal Group Adjustments1 30-Jun-16
Cash 3.8 0.3 (0.3) 3.8 Investment properties 1,888.0 253.1 (253.1) 1,888.0 Other assets 112.9 0.6 (0.6) 112.9 Assets of disposal group - - 254.0 254.0
Total assets 2,004.7 254.0 - 2,258.7 Debt 634.7 135.9 (135.9) 634.7 Accrued distribution 45.5 0.0 0.0 45.5 Other liabilities 29.4 4.3 (4.3) 29.4 Liabilities of disposal group - - 140.2 140.2
Total liabilities 709.6 140.2 - 849.8 Net tangible assets 1,408.9 Number of stapled units (m) 733.4 NTA per unit ($) 1.92

NZ DISPOSAL – PROFIT & LOSS IMPACT (A$)For the year ended 30 June 2016
36
• The accounting standards require separate disclosure as a “discontinued operation” when a reported segment is to be sold. As such, our New Zealand assets and the earnings from them have been reclassified as “discontinued operation” and the prior year comparable has been restated accordingly
• In FY16, the net profit after tax contribution from the New Zealand operation was A$35.5m, including– Net operating income of A$16.7 million– Corporate costs allocation of A$2.0 million– Fair value gain of A$28.0 million, reflecting the agreed
sale price (net of transaction costs) and the appreciation of the NZ$
– Net interest expense of A$5.1 million, with gearing of the New Zealand operation at a higher level than the group as a whole
– Tax expense of A$2.1m is 28% of taxable income (less swap cancellation and other transaction costs), as our New Zealand trust is taxed as a company in NZ
• More detail can be found in Note 9 to the statutory financial statements
1 Adjustments relate to discontinued operations for financial reporting; financial reporting requires all the assets to be grouped into a single line and similarly for liabilities
$mFY16
ConsolidatedNZ Discontinued
OperationStatutory Accounts
Anchor rental income 113.8Specialty rental income 77.3Straight lining & amortisation of incentives 1.3Other income 7.1Total rental income 199.5 (18.8) 180.7Insurance income 5.0 - 5.0Gross property income 204.5 (18.8) 185.7Property expenses (58.1) 2.1 (56.0)Net property income 146.4 (16.7) 129.7Funds management income 1.2 - 1.2Net operating income 147.6 (16.7) 130.9Corporate costs (11.9) 2.0 (9.9)Fair value of investment properties 54.9 (28.0) 26.9Fair value of derivatives and financial assets 31.2 - 31.2
Unrealised foreign exchange losses (7.5) - (7.5)Share of net profit from investments 0.6 - 0.6Transaction costs (0.1) - (0.1)EBIT 214.8 (42.7) 172.1Net interest expense (27.6) 5.1 (22.5)Refinancing transaction costs 0.0 - 0.0Tax expense (2.5) 2.1 (0.4)Net profit after tax 184.7 (35.5) 149.2Net profit after tax from discontinued operations - 35.5 35.5
Adjusted Net profit after tax 184.7 - 184.7

37
ANCHOR TENANTSIncreasing exposure to Wesfarmers Limited
• All of our centres are anchored by either Woolworths Limited or Wesfarmers Limited retailers
• We are gradually increasing our relative exposure to Wesfarmers Limited via acquisitions and divestments. Wesfarmers now represents about 20% of our anchor tenants by number, and 18% by income
30 June 2013 30 June 2014 30 June 201530 June 2016 pre NZ sale
30 June 2016 post NZ sale
Woolworths LimitedWoolworths 50 51 53 53 53
Big W 8 9 9 8 8
Dan Murphy's 6 5 5 3 3
Masters 1 1 1 1 1
Countdown 13 14 14 14 0
Total Woolworths Limited 78 80 82 79 65
Wesfarmers LimitedColes 1 4 9 12 12
Target 1 1 2 3 3
Kmart 0 1 2 2 2
Total Wesfarmers Limited 2 6 13 17 17
Other Anchor TenantsAldi 0 1 1 1 1
Total Other Anchor Tenants 0 1 1 1 1
Total Anchor Tenants 80 87 96 97 83

38
PORTFOLIO LIST (I)
Property State Property Type Anchor Tenant(s)Completion
DateTotal GLA
(sqm) Occupancy(% by GLA)
Number of Specialties
WALE (Years by
GLA)Valuation Cap Rate
Valuation Jun-16(A$m)
AustraliaLilydale VIC Sub-Regional WOW; Big W; Aldi Jul-13 22,066 100% 55 13.1 6.75% 90.0 Pakenham VIC Sub-Regional WOW; Big W Dec-11 16,862 100% 45 8.7 7.00% 72.5 Central Highlands QLD Sub-Regional WOW; Big W Mar-12 18,699 100% 26 12.7 7.50% 61.7 Whitsunday 1 QLD Sub-Regional Coles Jun-86 7,818 99% 47 5.0 8.00% 33.6 Mt Gambier SA Sub-Regional WOW; Big W; Masters Aug-12 27,557 98% 34 15.4 7.34% 63.7 Murray Bridge SA Sub-Regional WOW; Big W Nov-11 18,679 97% 49 8.9 7.50% 61.0 Kwinana Marketplace WA Sub-Regional WOW; Big W; Dan Murphy's Dec-12 28,037 99% 80 10.4 7.50% 98.0 Berala NSW Neighbourhood WOW Aug-12 4,340 100% 5 14.9 6.50% 23.0 Cabarita NSW Neighbourhood WOW May-13 3,396 100% 11 14.0 6.75% 19.5 Cardiff NSW Neighbourhood WOW May-10 5,851 100% 14 15.3 7.00% 20.0 Goonellabah NSW Neighbourhood WOW Aug-12 5,040 98% 7 13.0 7.25% 19.3 Greystanes NSW Neighbourhood WOW Oct-14 5,871 100% 27 12.8 6.50% 48.0 Griffin Plaza NSW Neighbourhood Coles Mar-97 7,233 95% 26 7.4 7.50% 23.5 Lane Cove NSW Neighbourhood WOW Nov-09 6,721 100% 15 13.2 6.50% 48.5 Leura NSW Neighbourhood WOW Apr-11 2,547 100% 5 14.8 6.75% 15.1 Lismore NSW Neighbourhood WOW Jun-15 6,834 94% 21 13.7 7.50% 31.5 Macksville NSW Neighbourhood WOW Mar-10 3,623 100% 5 16.4 7.00% 11.8 Merimbula NSW Neighbourhood WOW Oct-10 4,960 95% 9 14.2 7.25% 15.7 Mittagong Village NSW Neighbourhood Dan Murphy's Dec-07 2,235 100% 5 12.3 7.00% 9.1 Moama Marketplace NSW Neighbourhood WOW Aug-07 4,519 97% 5 15.9 7.50% 11.6 Morisset NSW Neighbourhood WOW Nov-10 4,141 96% 9 10.8 7.50% 16.2 Northgate Shopping Centre NSW Neighbourhood Coles 1993 4,131 99% 12 5.6 7.25% 14.8 North Orange NSW Neighbourhood WOW Dec-11 4,975 99% 14 15.0 7.00% 27.0 Swansea NSW Neighbourhood WOW Oct-09 3,750 98% 4 17.7 7.00% 13.5 Ulladulla NSW Neighbourhood WOW May-12 5,281 97% 9 15.9 7.00% 19.0 West Dubbo NSW Neighbourhood WOW Dec-10 4,205 100% 9 12.1 7.25% 14.6 Albury VIC Neighbourhood WOW Dec-11 4,949 95% 12 14.2 7.25% 20.4 Ballarat VIC Neighbourhood Dan Murphy's; Big W Jan-00 8,964 99% 3 4.2 7.50% 18.0 Cowes VIC Neighbourhood WOW Nov-11 5,079 92% 12 13.7 7.50% 17.5 Drouin VIC Neighbourhood WOW Nov-08 3,798 97% 4 11.3 6.75% 13.4 Epping North VIC Neighbourhood WOW Sep-11 5,378 100% 13 12.9 6.25% 26.0 Highett VIC Neighbourhood WOW May-13 5,866 98% 13 14.8 6.75% 25.0 Langwarrin VIC Neighbourhood WOW Oct-04 5,088 100% 13 6.3 6.75% 21.0 Ocean Grove VIC Neighbourhood WOW Dec-04 6,910 100% 17 7.0 6.75% 33.5 Warrnambool East VIC Neighbourhood WOW Sep-11 4,318 99% 5 10.6 7.25% 12.5 Warrnambool Target VIC Neighbourhood Target Jan-90 6,984 100% 12 7.3 7.75% 18.6 Wonthaggi Plaza VIC Neighbourhood Coles; Target Dec-12 11,873 97% 20 9.2 7.00% 45.4 Wyndham Vale VIC Neighbourhood WOW Dec-09 6,914 100% 7 12.6 6.75% 21.0
1 A fire occurred at Whitsunday during FY16 which destroyed the Target precinct of the Centre. As a result, there is currently only one anchor tenant.

39
PORTFOLIO LIST (II)
Property State Property Type Anchor Tenant(s)Completion
DateTotal GLA
(sqm) Occupancy(% by GLA)
Number of Specialties
WALE (Years by
GLA)Valuation Cap Rate
Valuation Jun-16(A$m)
AustraliaAyr QLD Neighbourhood Coles Jan-00 5,513 98% 9 8.7 7.50% 18.0 Brookwater Village QLD Neighbourhood WOW Feb-13 6,761 100% 10 12.6 6.75% 32.0 Bushland Beach 2 QLD Neighbourhood Coles May-17 n/a n/a n/a n/a 6.75% 7.1 Carrara QLD Neighbourhood WOW Sep-11 3,719 100% 6 10.6 7.00% 17.0 Chancellor Park Marketplace QLD Neighbourhood WOW Oct-01 5,223 100% 18 13.9 6.75% 38.5 Collingwood Park QLD Neighbourhood WOW Nov-09 4,568 97% 8 15.2 7.25% 10.5 Coorparoo QLD Neighbourhood WOW May-12 4,870 100% 11 14.5 6.50% 24.5 Gladstone QLD Neighbourhood WOW Apr-12 5,218 100% 9 11.0 7.25% 25.5 Greenbank QLD Neighbourhood WOW 2008 5,690 100% 17 9.9 6.50% 23.0 Mackay QLD Neighbourhood WOW Jun-12 4,125 98% 7 14.1 7.00% 23.0 Marian Town Centre QLD Neighbourhood WOW Apr-14 6,704 100% 18 11.5 7.00% 32.0 Mission Beach QLD Neighbourhood WOW Jun-08 4,099 98% 10 10.7 7.25% 10.4 Mt Warren Park QLD Neighbourhood Coles 2005 3,841 99% 14 4.5 6.75% 14.7 The Markets QLD Neighbourhood Coles c. Oct-02 5,254 99% 22 3.7 6.75% 33.5 Woodford QLD Neighbourhood WOW Apr-10 3,671 96% 10 10.5 7.25% 10.8 Blakes Crossing SA Neighbourhood WOW Jul-11 5,078 98% 14 10.0 7.25% 20.0 Walkerville SA Neighbourhood WOW Apr-13 5,333 100% 12 14.6 7.00% 20.7 Busselton WA Neighbourhood WOW Sep-12 5,181 99% 5 16.4 6.75% 22.5 Treendale WA Neighbourhood WOW Feb-12 7,388 96% 18 8.1 7.00% 30.9 Burnie TAS Neighbourhood Coles; K Mart 2006 8,668 100% 9 3.1 8.50% 19.5 Claremont Plaza TAS Neighbourhood WOW Oct-14 8,003 97% 23 10.6 7.28% 31.2 Glenorchy Central TAS Neighbourhood WOW 2007 6,907 100% 12 6.9 7.75% 23.0 Greenpoint TAS Neighbourhood WOW Nov-07 5,958 99% 7 4.7 8.25% 13.5 Kingston TAS Neighbourhood Coles Dec-08 4,726 99% 14 9.0 7.29% 23.5 Meadow Mews TAS Neighbourhood Coles 2003 7,653 100% 28 7.8 7.50% 48.0 New Town Plaza TAS Neighbourhood Coles; K Mart Jun-73 11,384 100% 11 4.9 7.75% 30.0 Prospect Vale TAS Neighbourhood WOW Mar-96 6,012 100% 19 11.2 7.50% 26.4 Riverside TAS Neighbourhood WOW Jun-86 3,108 95% 7 4.5 8.50% 7.6 Shoreline TAS Neighbourhood WOW Jun-72 6,235 100% 21 4.8 7.25% 30.5 Sorell TAS Neighbourhood Coles Oct-10 5,446 100% 13 10.6 7.25% 22.7 Katoomba Marketplace NSW Freestanding WOW; Big W Apr-14 9,387 100% 0 19.3 6.75% 43.0
2 Bushland Beach is a fund-through development asset. As at 30 June 2016, the value recognised represent $5.5m for the land acquired plus $1.6m of work in progress.
40
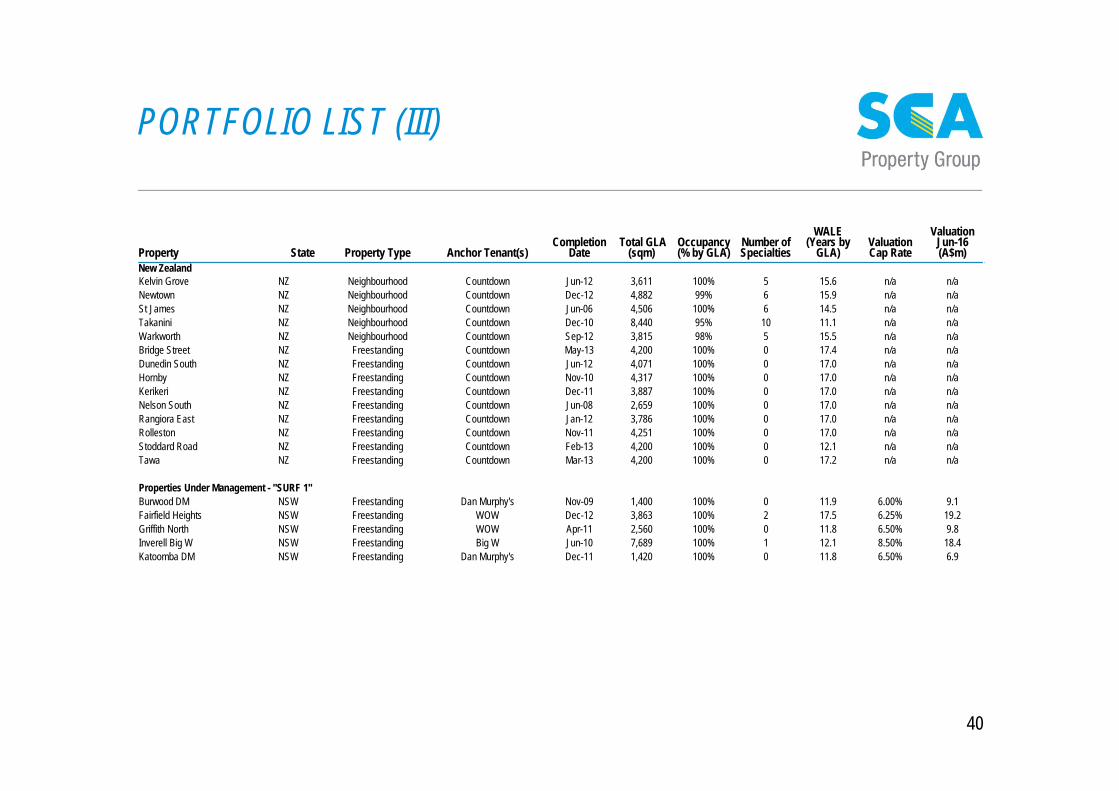
PORTFOLIO LIST (III)
Property State Property Type Anchor Tenant(s)Completion
DateTotal GLA
(sqm) Occupancy(% by GLA)
Number of Specialties
WALE (Years by
GLA)Valuation Cap Rate
Valuation Jun-16(A$m)
New ZealandKelvin Grove NZ Neighbourhood Countdown Jun-12 3,611 100% 5 15.6 n/a n/aNewtown NZ Neighbourhood Countdown Dec-12 4,882 99% 6 15.9 n/a n/aSt James NZ Neighbourhood Countdown Jun-06 4,506 100% 6 14.5 n/a n/aTakanini NZ Neighbourhood Countdown Dec-10 8,440 95% 10 11.1 n/a n/aWarkworth NZ Neighbourhood Countdown Sep-12 3,815 98% 5 15.5 n/a n/aBridge Street NZ Freestanding Countdown May-13 4,200 100% 0 17.4 n/a n/aDunedin South NZ Freestanding Countdown Jun-12 4,071 100% 0 17.0 n/a n/aHornby NZ Freestanding Countdown Nov-10 4,317 100% 0 17.0 n/a n/aKerikeri NZ Freestanding Countdown Dec-11 3,887 100% 0 17.0 n/a n/aNelson South NZ Freestanding Countdown Jun-08 2,659 100% 0 17.0 n/a n/aRangiora East NZ Freestanding Countdown Jan-12 3,786 100% 0 17.0 n/a n/aRolleston NZ Freestanding Countdown Nov-11 4,251 100% 0 17.0 n/a n/aStoddard Road NZ Freestanding Countdown Feb-13 4,200 100% 0 12.1 n/a n/aTawa NZ Freestanding Countdown Mar-13 4,200 100% 0 17.2 n/a n/a
Properties Under Management - "SURF 1"Burwood DM NSW Freestanding Dan Murphy's Nov-09 1,400 100% 0 11.9 6.00% 9.1 Fairfield Heights NSW Freestanding WOW Dec-12 3,863 100% 2 17.5 6.25% 19.2 Griffith North NSW Freestanding WOW Apr-11 2,560 100% 0 11.8 6.50% 9.8 Inverell Big W NSW Freestanding Big W Jun-10 7,689 100% 1 12.1 8.50% 18.4 Katoomba DM NSW Freestanding Dan Murphy's Dec-11 1,420 100% 0 11.8 6.50% 6.9

MANAGEMENT TEAM
Anthony Mellowes, Chief Executive Officer • Mr Mellowes is an experienced property executive. Prior to joining SCA
Property Group as an Executive Director, Mr Mellowes was employed by Woolworths Limited since 2002 and held a number of senior property related roles including Head of Asset Management and Group Property Operations Manager. Prior to Woolworths Limited, Mr Mellowes worked for Lend Lease Group and Westfield Limited
• Mr Mellowes was appointed Chief Executive Officer of SCA Property Group on 16 May 2013 after previously acting as interim Chief Executive Officer since the group’s listing on 26 November 2012. Mr Mellowes was a key member of the Woolworths Limited team which created SCA Property Group
Campbell Aitken, Chief Investment Officer• Mr Aitken has over 10 years experience working in the Property Funds
Management industry in a number of senior positions within the Australian Retail REIT sector, with Charter Hall Group, Macquarie Bank and Westfield. Mr Aitken is an active member of the Property Council of Australia, currently Chairman of the Retail Property Committee and is a committee member of the Property Investment and Finance Committee. Mr Aitken has experience in managing acquisitions, leasing, property management, and developments
• Mr Aitken joined SCA Property Group in May 2013, was appointed Chief Operating Officer in October 2013 and was appointed Chief Investment Officer in March 2015
Mark Lamb, General Counsel and Company Secretary• Mr Lamb is an experienced transactional lawyer with over 20 years’
experience in the private sector as a partner of Corrs Chambers Westgarth and subsequently Herbert Geer and in the listed sector as General Counsel of ING Real Estate. Mr Lamb has extensive experience in retail shopping centre developments, acquisitions, sales and major leasing transactions having acted for various REITs and public companies during his career
• Mr Lamb was appointed General Counsel and Company Secretary of SCA Property Group on 26 September 2012
Mark Fleming, Chief Financial Officer• Mr Fleming worked for 8 years at Woolworths Limited from 2003 to 2011,
firstly as General Manager Corporate Finance, and then as General Manager Supermarket Finance. After Woolworths Limited, Mark was CFO of Treasury Wine Estates from 2011 to 2013. Prior to Woolworths Limited, Mark worked in investment banking at UBS, Goldman Sachs and Bankers Trust
• Mr Fleming was appointed Chief Financial Officer of SCA Property Group on 20 August 2013, and as an Executive Director of SCA Property Group in May 2015
Sid Sharma, General Manager Operations• Mr Sharma has over 10 years property experience and has held executive
roles at DEXUS, Woolworths and Westpac across leasing, asset management and developments. Previously, Sid worked for Stockland and Deacons Lawyers. Sid holds a Bachelor of Laws and Bachelor of Commerce (Economics & Finance)
• Mr Sharma joined SCA Property Group in May 2014 as General Manager -Leasing and has been appointed General Manager – Operations in March 2015
41

Disclaimer
This presentation has been prepared by Shopping Centres Australasia Property Group RE Limited (ABN 47 158 809 851) (SCPRE) as responsible entity of Shopping Centres Australasia Property Management Trust (ARSN 160 612 626) (SCA Management Trust) and responsible entity of Shopping Centres Australasia Property Retail Trust (ARSN 160 612 788) (SCA Management Trust) (together, SCA Property Group or the Group). This presentation should be read in conjunction with the Financial Report published on the same date.
Information contained in this presentation is current as at the date of release. This presentation is provided for information purposes only and has been prepared without taking account of any particular reader's financial situation, objectives or needs. Nothing contained in this presentation constitutes investment, legal, tax or other advice. Accordingly, readers should, before acting on any information in this presentation, consider its appropriateness, having regard to their objectives, financial situation and needs, and seek the assistance of their financial or other licensed professional adviser before making any investment decision.
This presentation does not constitute an offer, invitation, solicitation or recommendation with respect to the subscription for, purchase or sale of any security, nor does it form the basis of any contract or commitment.
Except as required by law, no representation or warranty, express or implied, is made as to the fairness, accuracy or completeness of the information, opinions and conclusions, or as to the reasonableness of any assumption, contained in this presentation.
The forward looking statements included in this presentation involve subjective judgment and analysis and are subject to significant uncertainties, risks and contingencies, many of which are outside the control of, and are unknown to, the Group. In particular, they speak only as of the date of these materials, they assume the success of the Group’s business strategies, and they are subject to significant regulatory, business, competitive and economic uncertainties and risks. Actual future events may vary materially from forward looking statements and the assumptions on which those statements are based. Given these uncertainties, readers are cautioned not to place undue reliance on such forward looking statements.
By reading this presentation and to the extent permitted by law, the reader releases each entity in the Group and its affiliates, and any of their respective directors, officers, employees, representatives or advisers from any liability (including, without limitation, in respect of direct, indirect or consequential loss or damage or loss or damage arising by negligence) arising in relation to any reader relying on anything contained in or omitted from this presentation.
The Group, or persons associated with it, may have an interest in the securities mentioned in this presentation, and may earn fees as a result of transactions described in this presentation or transactions in securities in SCP.
All values are expressed in Australian dollars unless otherwise indicated. All references to “units” are to a stapled SCP security comprising one unit in the SCA Retail Trust and one unit in the SCA Management Trust.
SCA Property GroupLevel 5, 50 Pitt Street Sydney NSW 2000Tel: (02) 8243 4900Fax: (02) 8243 4999
www.scaproperty.com.au