Sarina State School Queensland State School Reporting 2013 ... · Sarina State School Queensland...
12
T DEPARTMENT OF EDUCATION, TRAINING AND EMPLOYMENT Sarina State School Queensland State School Reporting 2013 School Annual Report YPEOVER TO INSERT SCHOOL NAME Postal address PO Box 65 Sarina 4737 Phone (07) 4964 8888 Fax (07) 4964 8800 Email [email protected] Webpages Additional reporting information pertaining to Queensland state schools is located on the My School website and the Queensland Government data website. Contact Person Glenn Hankinson – Deputy Principal Principal’s foreword Introduction The purpose of this report is to gi ve a snapshot of our school’s 2013 performance in relation to student learning, our staff and our community. It is a pleasure for me to lead Sarina State School. We have active learners as students, experienced and professional staff and a supportive community. Our motto of ‘Aim High’ is noted in classrooms, on the sporting field, in the music and instrumental musical program and in our cultural program that works cooperatively with our indigenous community. Our school values every day at school and makes every day count. Our rich and aligned curriculum is enacted in well-resourced and modern classrooms by experienced and dedicated staff. Sarina State School is a member of the Sarina Links Cluster of schools and supports joint initiatives between our local schools. We have a good working relationship with Sarina High School and most of our students transition to Year 8 at Sarina High. Our transition program and Cluster Chaplain play a positive role in preparing our students for day one of Year 8. This report is a snapshot and we welcome any further questions or queries you may have. Please contact the school by phone or email. For those who are not able to access this report electronically, a paper copy is available on request from the school office.
Transcript of Sarina State School Queensland State School Reporting 2013 ... · Sarina State School Queensland...
T
DEPARTMENT OF EDUCATION, TRAINING AND EMPLOYMENT
Sarina State School
Queensland State School Reporting
2013 School Annual Report
YPEOVER TO INSERT SCHOOL NAME
Postal address
PO Box 65 Sarina 4737
Phone (07) 4964 8888
Fax (07) 4964 8800
Email [email protected]
Webpages Additional reporting information pertaining to Queensland state schools is located on the My School website and the Queensland Government data website.
Contact Person
Glenn Hankinson – Deputy Principal
Principal’s foreword
Introduction
The purpose of this report is to give a snapshot of our school’s 2013 performance in relation to student learning, our staff and our community. It is a pleasure for me to lead Sarina State School. We have active learners as students, experienced and professional staff and a supportive community. Our motto of ‘Aim High’ is noted in classrooms, on the sporting field, in the music and instrumental musical program and in our cultural program that works cooperatively with our indigenous community. Our school values every day at school and makes every day count. Our rich and aligned curriculum is enacted in well-resourced and modern classrooms by experienced and dedicated staff. Sarina State School is a member of the Sarina Links Cluster of schools and supports joint initiatives between our local schools. We have a good working relationship with Sarina High School and most of our students transition to Year 8 at Sarina High. Our transition program and Cluster Chaplain play a positive role in preparing our students for day one of Year 8.
This report is a snapshot and we welcome any further questions or queries you may have. Please contact the school by phone or email. For those who are not able to access this report electronically, a paper copy is available on request from the school office.

DEPARTMENT OF EDUCATION, TRAINING AND EMPLOYMENT
Queensland State School Reporting
2012 School Annual Report
School progress towards its goals in 2013
These 3 foucs areas are intended as a 2 year cycle. This is the first year of the cycle and the achievements in 2013 were:
Effective Teaching Practices – Linked closely to the Teaching and Learning Audit – ONGOING Differentioan continues to be an area requiring more strength in teacher capability and practice. Research based techniuques of Explicit Instruction and Drill & Skill (Short term toLong term memory) continue to be a strenght at Sarina SS, with the Lighthouse model enacted across the region twice.
Systemic Curriculum Delivery – Linkied closely to the Teaching and Learning Audit – ONGOING Curriculum planning now needs to focus on vertical alignment, consideration for multiage classes and resourcing for cycle A and B.
Becoming a High Perfomring School – Linked to our Fleming Consultancy Journey in cooperation with John Fleming and Haileybury College - ONGOING . Benchmarks set for reading acheivemetn in timely intervals for each year level with 80% students expected to reach them. Coaching and Feedback EMBEDDED in the areas of Explicit Instruction, Classroom Management and Drill and Skill. Lighthouse Regional model EMBEDDED with techers and other school leaders visiting our school to observe best practice.
Future outlook
Our 2014 school improvement agenda continues to focus on the three key areas of Effective Teaching Practices, Systemic Curriculum Delivery and Becoming a High Performing School.

Our school at a glance
School Profile
Sarina is a small, rural, coastal town supported by industries including sugar, coal, beef, fishing, railways and a small commercial sector. By and large our parent community works locally in semiskilled and skilled trades to support those industries and associated services. There appears to be a strong transience to the community, related to job and accommodation opportunities. Coeducational or single sex: Coeducational
Year levels offered in 2013: Prep Year - Year 7
Total student enrolments for this school:
Total Girls Boys
Enrolment Continuity
(Feb – Nov)
2011 455 225 230 91%
2012 511 255 256 90%
2013 485 224 261 87%
Student counts are based on the Census (August) enrolment collection.
Characteristics of the student body:
The student body has a high degree of transience with some students coming and going multiple times as dictated by economic, work and housing opportunities. Likewise, we have a very large population of students that are longstanding, Sarina family members, with parents and grandparents that also attended our school.
Our school has a 25% indigenous student enrolment and a special education program that caters for students with special needs in an open, inclusive and accepting environment as well as a small number of students that have English as a second language.
Average Class sizes
Phase
Average Class Size
2011 2012 2013
Prep – Year 3 24 24 23
Year 4 – Year 7 Primary 26 23 25
School Disciplinary Absences
Note that the SDA figures below count those students recommended for an SDA, and not just the actual SDA.
Disciplinary Absences
Count of Incidents
2011 2012 2013
Short Suspensions - 1 to 5 days 69 39 41
Long Suspensions - 6 to 20 days 9 9 9
Exclusions 3 3 4
Cancellations of Enrolment 0 0 0

Our school at a glance
Curriculum offerings
Our distinctive curriculum offerings
An inclusive and challenging curriculum is offered that aims to provide high quality educational outcomes for all students. The school has a Special Education unit which caters for the needs of students with disabilities. The curriculum at our school is organised around the essentials and we are preparing for 2013 implementation of Australian Curriculum. The integrated key learning areas are – Science, Technology, Health, The Arts and Studies of Society and the Environment. Excellence in the Arts through a Music program which encompasses music lessons provided by a music specialist teacher, an extension music program, an instrumental music program and recorder band. Physical activity is promoted through coordination of outside of school sports like AFL, Rugby, Tennis and Cricket. Physical Education lessons and LOTE lessons (Japanese) are taught by experienced specialist teachers.
Extra curricula activities
There is a plethora of extra curricula activities offered as part of the school curriculum or as an extension of activities offered in the school. These activities include the following:
Sport activities which include most major sports - Rugby League, Netball, AFL, Softball, Tennis, Athletics, Soccer, Basketball and Cricket.
Students participate as part of the Mackay District Sports Association.
Cultural activities include – school celebrations for NAIDOC week, Mabo Day, Harmony Day, Reconciliation week and National Sorry Day. Students play various roles in the organisation of these events at both a school and community level.
Music Enrichment includes - Concert Band as part of Instrumental Music performing at District Competitions and other public events and the Recorder Ensemble performing at ANZAC Day parades and other community events.
Academic Extension activities – District Mathematics Competitions, external competitions in Maths, Science and English, Chess club and OPTI minds
How Information and Communication Technologies are used to assist learning
One of the main focuses for integrating ICTs in learning has been the completion of the enhancement of the last four classrooms.
The integration of ICT devices such as Interactive Whiteboards and Image scanning devices (Elmos) has significantly improved engagement in lessons as we are able to utilise the Learning Place, online web quests and other teaching resources projected onto whiteboard using an Elmo for the entire class to see.
There has been a number of Professional Development sessions for staff to assist with the use of the above technologies and software associated with them. There is now significant connectivity via wireless from all rooms in the school.
The Computers for Teachers Program has continued to allow teachers access to online planning and teaching resources. Education Queensland’s C2C (Curriculum to Classroom) program is widely used and consists of many digital resources ranging from interactive activities for individuals and whole class, online video links and other digital resources.
All classes continue to have weekly access to the two computer labs (approx. 60 computers). The computer labs are used by classes to complete online tasks, save Microsoft Word, Publisher and PowerPoint projects onto the network. A class can effectively work with their teacher displaying their desktop via the data projector and this has significantly increased productivity and student learning.
Our eLearning agenda aims to facilitate learning in a manner that suits the learning needs of our students in this digital age.’
Social climate
A proactive Responsible Behaviour Plan contributed to the development of consistent social and
Our school at a glance
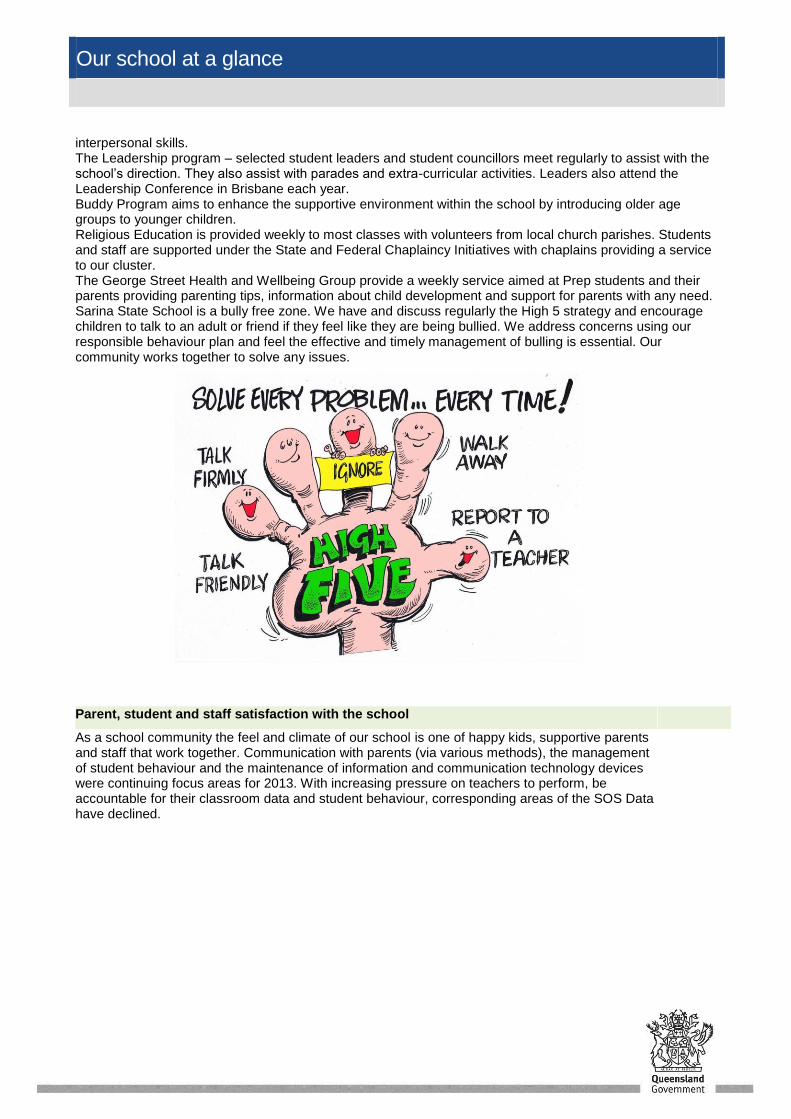
interpersonal skills. The Leadership program – selected student leaders and student councillors meet regularly to assist with the school’s direction. They also assist with parades and extra-curricular activities. Leaders also attend the Leadership Conference in Brisbane each year. Buddy Program aims to enhance the supportive environment within the school by introducing older age groups to younger children. Religious Education is provided weekly to most classes with volunteers from local church parishes. Students and staff are supported under the State and Federal Chaplaincy Initiatives with chaplains providing a service to our cluster. The George Street Health and Wellbeing Group provide a weekly service aimed at Prep students and their parents providing parenting tips, information about child development and support for parents with any need. Sarina State School is a bully free zone. We have and discuss regularly the High 5 strategy and encourage children to talk to an adult or friend if they feel like they are being bullied. We address concerns using our responsible behaviour plan and feel the effective and timely management of bulling is essential. Our community works together to solve any issues.
Parent, student and staff satisfaction with the school
As a school community the feel and climate of our school is one of happy kids, supportive parents and staff that work together. Communication with parents (via various methods), the management of student behaviour and the maintenance of information and communication technology devices were continuing focus areas for 2013. With increasing pressure on teachers to perform, be accountable for their classroom data and student behaviour, corresponding areas of the SOS Data have declined.

Our school at a glance
Performance measure (Nationally agreed items shown*)
Percentage of parents/caregivers who agree that: 2012
2013
their child is getting a good education at school (S2016) 77% 87%
this is a good school (S2035) 77% 93%
their child likes being at this school* (S2001) 91% 100%
their child feels safe at this school* (S2002) 91% 93%
their child's learning needs are being met at this school* (S2003) 77% 93%
their child is making good progress at this school* (S2004) 77% 100%
teachers at this school expect their child to do his or her best* (S2005) 90% 100%
teachers at this school provide their child with useful feedback about his or her school work* (S2006) 80% 93%
teachers at this school motivate their child to learn* (S2007) 77% 100%
teachers at this school treat students fairly* (S2008) 71% 93%
they can talk to their child's teachers about their concerns* (S2009) 86% 93%
this school works with them to support their child's learning* (S2010) 77% 93%
this school takes parents' opinions seriously* (S2011) 64% 93%
student behaviour is well managed at this school* (S2012) 80% 80%
this school looks for ways to improve* (S2013) 81% 100%
this school is well maintained* (S2014) 91% 100%
Performance measure (Nationally agreed items shown*)
Percentage of students who agree that: 2012 2013
they are getting a good education at school (S2048) 88% 94%
they like being at their school* (S2036) 83% 93%
they feel safe at their school* (S2037) 87% 97%
their teachers motivate them to learn* (S2038) 96% 99%
their teachers expect them to do their best* (S2039) 98% 99%
their teachers provide them with useful feedback about their school work* (S2040) 97% 98%
teachers treat students fairly at their school* (S2041) 77% 95%
they can talk to their teachers about their concerns* (S2042) 78% 93%
their school takes students' opinions seriously* (S2043) 79% 94%
student behaviour is well managed at their school* (S2044) 61% 74%
their school looks for ways to improve* (S2045) 93% 99%
their school is well maintained* (S2046) 87% 96%
their school gives them opportunities to do interesting things* (S2047) 88% 96%

Our school at a glance
Performance measure
Percentage of school staff who agree that: 2013
they enjoy working at their school (S2069) 85%
they feel that their school is a safe place in which to work (S2070) 82%
they receive useful feedback about their work at their school (S2071) 82%
students are encouraged to do their best at their school (S2072) 97%
students are treated fairly at their school (S2073) 85%
student behaviour is well managed at their school (S2074) 56%
staff are well supported at their school (S2075) 79%
their school takes staff opinions seriously (S2076) 79%
their school looks for ways to improve (S2077) 97%
their school is well maintained (S2078) 94%
their school gives them opportunities to do interesting things (S2079) 85%
* Nationally agreed student and parent/caregiver items were incorporated in the School Opinion Survey in 2012.
# Percentage of respondents who Somewhat Agree, Agree or Strongly Agree with the statement. Due to a major redevelopment of the
surveys (parent/caregiver and student in 2012; staff in 2013), comparisons with results from previous years are not recommended.
DW = Data withheld to ensure confidentiality.
Involving parents in their child’s education
Parents are openly welcomed to join our school P&C, help at school functions and events and assist in classrooms for resource preparation and organisation as well as student support. We have many dedicated and supportive families that offer their time and energy, but like every school are always looking for more! Our school uses a variety of formal and informal strategies to involve parents in their child’s education. Some of these are: *Enrolment Interviews with new parents and students. *Formal and informal parent/teacher interviews to discuss student progress. *Fortnightly School newsletter. *Parent In-service and Training opportunities especially in supporting reading and number. *Active, friendly and supportive P&C providing input and feedback into school operations. *Regular parent volunteers in classrooms *Information afternoons to discuss curriculum and general classroom procedures and how parents can support their child’s learning.
Reducing the school’s environmental footprint
Our school attempts to manage rubbish including green waste appropriately. We have water tanks that service our toilet blocks and also our bathrooms in the hall. We are air-con smart, turn off lights and fans when leaving rooms and watch out for printers and computers that are on unnecessarily. The increase in water consumption (2009-2010 to 2010-2011) could be due to the water leak underground that went unnoticed for a period of time. This has now been rectified and as you can see water consumption has continued to decrease.

Our school at a glance
Environmental footprint indicators
Electricity kWh
Water kL
2010-2011 207,846 2,987
2011-2012 64,539 2,029
2012-2013 261,929 1,975
The consumption data is sourced from the validated utilities expenditure return which the school submits at the end of each financial year. The data provides an indication of the consumption trend in each of the utility categories which impact on the schools environmental footprint.

Our staff profile
Staff composition, including Indigenous staff
2013 Workforce Composition
Teaching Staff *
Non-teaching Staff
Indigenous Staff
Headcounts 34 20 <5
Full-time equivalents 31 13 <5
Qualifications of all teachers
Highest level of
attainment
Number of
Teaching Staff *
Certificate 0
Diploma 2
Advanced Diploma 0
Bachelor Degree 30
Graduate Diploma etc. 0
Masters 2
Doctorate 0
Total 34
02
0
30
02
00
5
10
15
20
25
30
35
* Teaching Staff includes School Leaders
** Graduate Diploma etc. includes Graduate Diploma, Bachelor Honours Degree, and Graduate Certificate
Expenditure on and teacher participation in professional development
The total funds expended on teacher professional development in 2013 were $32 314.00.The major professional development initiatives are as follows:
The teaching of Reading (including coaching, planning sessions, resource preparation, teacher aide training, comprehension strategies, reading strategies and more)
Professional Readings for teachers (monthly reading provided and learning circle/feedback session followed each reading)
Australian Curriculum – English, Maths, Science, Geography and History
OneSchool – reporting, behaviour and contacts, student data and being able to access data from NAPLAN reports
Explicit Instruction
The proportion of the teaching staff involved in professional development activities during 2013 was 100%.
Average staff attendance 2011 2012 2013
Staff attendance for permanent and temporary staff and school leaders. 96% 96% 97%
Proportion of staff retained from the previous school year
From the end of the previous school year, 78% of staff was retained by the school for the entire 2013 school year.

Our staff profile
School income broken down by funding source
School income broken down by funding source is available via the My School website at http://www.myschool.edu.au/.
To access our income details, click on the My School link above. You will then be taken to the My School website with the following ‘Find a school’ text box.
Where it says ‘Search by school name’, type in the name of the school you wish to view, and select <GO>. Read and follow the instructions on the next screen; you will be asked to accept the Terms of Use and Privacy Policy before being given access to the school’s My School entry web page.
School financial information is available by selecting ‘School finances’ in the menu box in the top left corner of the school’s entry web page. If you are unable to access the internet, please contact the school for a paper copy of income by funding source.

Performance of our students
Key student outcomes
Student attendance 2011 2012 2013
The overall attendance rate for the students at this school (shown as a percentage). 91% 91% 92%
The overall attendance rate in 2013 for all Queensland state Primary schools was 92%.
Student attendance rate for each year level (shown as a percentage)
Year 1
Year 2
Year 3
Year 4
Year 5
Year 6
Year 7
Year 8
Year 9
Year 10
Year 11
Year 12
2011 88% 90% 92% 90% 93% 91% 91%
2012 90% 92% 92% 91% 93% 91% 92%
2013 90% 92% 92% 93% 92% 93% 91%
DW = Data withheld to ensure confidentiality.
Student Attendance Distribution
The proportions of students by attendance range.
17
18
17
21
14
14
28
31
27
33
37
42
0% 20% 40% 60% 80% 100%
2011
2012
* 2013
Proportion of Students
Attendance Rate: 0% to <85% 85% to <90% 90% to <95% 95% to 100%
* The method for calculating attendance changed in 2013 – care should be taken when comparing data from 2013 to that of previous years.
Description of how non-attendance is managed by the school
Non-attendance is managed in state schools in line with the DET policies, SMS-PR-029: Managing Student Absences and SMS-PR-036: Roll Marking in State Schools, which outline processes for managing and recording student attendance and absenteeism.
Teachers at Sarina State school mark rolls twice per day (9am and 1.30pm) and monitor absences carefully, following up with families regarding unexplained absences. Administration follows up with parents regarding unexplained absences for 3 consecutive school days and issues compulsory schooling letters if required. To promote attendance we stress that every day at school counts and this is regularly communicated in newsletters and on parades.

Performance of our students
National Assessment Program – Literacy and Numeracy (NAPLAN) results – our reading, writing, spelling, grammar and punctuation, and numeracy results for the Years 3, 5, 7 and 9.
Our reading, writing, spelling, grammar and punctuation, and numeracy results for the Years 3, 5, 7 and 9 are available via the My School website at http://www.myschool.edu.au/.
To access our NAPLAN results, click on the My School link above. You will then be taken to the My School website with the following ‘Find a school’ text box.
Where it says ‘Search by school name’, type in the name of the school whose NAPLAN results you wish to view, and select <GO>.
Read and follow the instructions on the next screen; you will be asked to accept the Terms of Use and Privacy Policy before being able to access NAPLAN data.
If you are unable to access the internet, please contact the school for a paper copy of our school’s NAPLAN results.
Achievement – Closing the Gap
At Sarina State School we work hard to reduce the gap between non-indigenous and indigenous students’ attendance and achievement. When comparing 2012 and 2013 achievements in NAPLAN;
the gap between the Mean Scale Score for Year 3 reading decreased from 32 to 6. This is a direct result of the intervention programs in place.
The gap between the Mean Scale Score for Year 5 reading is similar.
The gap between the Mean Scale Score for Year 5 writing has decreased significantly from 55 to 13. We are not yet closing the gap in attendance as the rate of improvement is similar between indigenous and non-indigenous students. Our EATSIPS team work closely with the school community to increase engagement, achievement and attendance and our school celebrates the many cultures that exist within our school.