
SALARY SURVEY - davenport.edu Survey 2016-spring.pdfis based upon results of NACE’s Class of ......
76
SPRING 2016 NATIONAL ASSOCIATION OF COLLEGES AND EMPLOYERS | www.naceweb.org SALARY SURVEY FEATURING ACTUAL STARTING SALARIES FOR ALL DEGREE LEVELS Associate Bachelor’s Master’s Doctoral FINAL STARTING SALARIES FOR CLASS OF 2015 NEW COLLEGE GRADUATES DATA REPORTED BY COLLEGES AND UNIVERSITIES SALARIES BY MAJOR 7 SALARIES BY REGION 28 SALARIES BY CARNEGIE CLASSIFICATION 61
Transcript of SALARY SURVEY - davenport.edu Survey 2016-spring.pdfis based upon results of NACE’s Class of ......
National Association of Colleges and Employers | 2016 Spring Salary Survey | 1
SPRING 2016
NATIONAL ASSOCIATION OF COLLEGES AND EMPLOYERS | www.naceweb.org
SALARY SURVEY
FEATURING ACTUAL STARTING SALARIES
FOR ALL DEGREE LEVELS
Associate Bachelor’s
Master’sDoctoral
FINAL STARTING SALARIES FOR CLASS OF 2015 NEW COLLEGE GRADUATES DATA REPORTED BY COLLEGES AND UNIVERSITIES
SALARIES BY MAJOR7 SALARIES
BY REGION28 SALARIES BY CARNEGIE CLASSIFICATION
61


National Association of Colleges and Employers | 2016 Spring Salary Survey | 1
About the Survey ................................................................................................................. 2
How to Read Salary Survey .............................................................................................. 3
Executive Summary ............................................................................................................. 4
Starting Salary by Academic Major ................................................................................. 5
Associate Degrees ................................................................................................................. 5
Bachelor’s Degrees ................................................................................................................ 7
Master’s Degrees ................................................................................................................. 18
Doctoral Degrees ................................................................................................................ 24
Starting Salary by Region and Major/Bachelor’s Degrees ........................................ 28
Starting Salary by Carnegie Classification and Major/Bachelor’s Degrees ........... 61
Appendix ............................................................................................................................. 70
©Copyright May 2016 by the National Association of Colleges and Employers
TABLE OF CONTENTS

2 | 2016 Spring Salary Survey | National Association of Colleges and Employers
The Spring 2016 Salary Survey report provides actual starting salaries (not projections) for the college Class of 2015, and serves as the final salary report for the Class of 2015.
This is the first Salary Survey report that contains comprehensive salary data on multiple degree levels—associate, bachelor’s, master’s, and doctoral. The figures reported are for base salaries only, and do not include bonuses, commissions, fringe benefits, or overtime rates. The report provides the detailed salaries by academic major at the associate, bachelor’s, master’s, and doctoral degree levels, along with breakouts by both geographic region and Carnegie Classification at the bachelor’s degree level based upon the participating institutions. Data were gathered from Class of 2015 graduates through December 30, 2015, and reported to NACE through March 31, 2016.
The salary data presented here were reported to NACE through its national Class of 2015 First-Destination Survey by 279 colleges and universities
nationwide, and represent data for almost 470,000 graduates across all degree levels. Most of the analysis provided here, however, focuses on the data provided for more than 243,000 bachelor’s degree graduates. Of those schools providing salary information, 168 provided salary data by specific program or major; this report contains average salaries for 23 majors at the associate degree level, 185 majors at the bachelor’s degree level, 130 majors at the master’s degree level, and 73 majors at the doctoral level. A list of those institutions providing salary data by program or major can be found in the appendix of this report.
Salary Survey (ISSN 1520-8648) is available to individuals holding membership in the National Association of Colleges and Employers; it is also available on a subscription basis. The Salary Survey report is published three times a year—winter, spring, and fall—by the National Association of Colleges and Employers, 62 Highland Ave., Bethlehem, PA 18017-9085. For more information, see www.naceweb.org/salary-resources/index.aspx or contact NACE at 610.868.1421.
• NACE RESEARCH STAFF •Edwin W. Koc, Director of Research, Public Policy, and Legislative Affairs
Andrea J. Koncz, Research ManagerKenneth C. Tsang, Research AssociateLouisa Eismann, Research Associate
Anna Longenberger, Research Assistant
ABOUT THE SURVEY

National Association of Colleges and Employers | 2016 Spring Salary Survey | 3
STARTING SALARY BY ACADEMIC MAJOR (Associate/Bachelor’s/Master’s/Doctoral)
In this section, you will find the average starting salary according to the major field of study. Only majors with five or more reported salaries are shown. Refer to this section when you want to know the starting salary for a graduate holding a particular degree in a specific discipline, such as a bachelor’s degree in accounting or a master’s degree in business administration.
STARTING SALARY BY REGION AND MAJOR (Bachelor’s)
In this section, you will find the average starting salary according to the major field of study within seven geographic regions (Northeast, Mid-East, Great Lakes, Plains, Southeast, Southwest, and Rocky Mountain/Far West). The regional data are based upon the locations of the participating institutions that supplied information for the reported majors within each region. Only majors with three or more reported salaries are shown. Refer to this section when you want to know the starting salary for a graduate holding a bachelor’s degree in a specific discipline in a regional location, such as mechanical engineering majors who attended schools in the Southwest.
STARTING SALARY BY CARNEGIE CLASSIFICATION AND MAJOR (Bachelor’s)
This section shows data according to the broad categories of majors (e.g. business or engineering) within eight different Carnegie Classifications. Note: The Carnegie Classification of Institutions of Higher Education is a framework for classifying colleges and universities in the United States. The framework primarily serves educational and research purposes, where it is often important to identify groups of roughly comparable institutions. Only broad categories where three or more reported salaries are shown. Refer to this section when you want to know the starting salary for a graduate holding a bachelor’s degree in a field of study at a particular type of institution, such as engineering graduates who attended doctoral/research universities.
HOW TO READ SALARY SURVEY
PAGES
5/7/18/24
PAGE
28
PAGE
61

4 | 2016 Spring Salary Survey | National Association of Colleges and Employers
Class of 2015 bachelor’s degree graduates earned an average starting salary of $50,219—up 4.3 percent from their Class of 2014 counterparts’ overall average salary of $48,127. This final figure for the Class of 2015 is based upon results of NACE’s Class of 2015 First-Destination Survey.
As expected, Class of 2015 bachelor’s degree graduates in the STEM disciplines received the top average starting salaries.
Graduates in the computer sciences fields were the highest paid, with an overall average of $69,214. These graduates held their position at the top as they were also the highest paid in the Fall 2015 Salary Survey report ($65,849). Within this group, those majoring specifically in computer science boasted the highest average starting salary—$75,191—in this report.
Following closely behind with an overall average starting salary of $63,764 were engineering graduates. Out of the nearly 30 specific engineering disciplines that reported at least 50 salaries for the Class of 2015, graduates earning petroleum engineering degrees were the highest paid with an average salary of almost $75,000.
Third on the list of top-paid majors was mathematics and statistics, another STEM discipline. The overall average salary for this group of graduates was $58,554.
While graduates earning bachelor’s degrees in the business fields did not crack the top three on the “highest paid” list, their overall average salary was a respectable $51,452. Business disciplines also had the largest number of reported salaries (18,810), including the top three individual majors—business administration/management, finance, and accounting.
Registered nursing majors were also high in terms of reported salaries. With almost 2,400 individual reports, these majors had an overall average starting salary of $53,683. However, the average salary for the entire category of health professions and related program majors was slightly lower at $49,851.
For graduates who did not major in the STEM, business, or healthcare disciplines, average starting salaries were significantly lower. Social sciences graduates had an overall average starting salary of $40,964, and the average for history majors was $38,936. Foreign languages ($38,537), visual and performing arts ($38,470), and English ($38,125) majors had very similar overall averages.
With more than 2,000 salaries reported for education majors, this group’s overall average starting salary was $35,686. Within the specific disciplines, teachers of specific subject areas averaged slightly higher starting salaries at $36,526, while salaries for teachers of specific levels and methods ($34,038), and special education majors ($33,947) were just below the overall average.
Among the majors that fell on the lower end of the scale, theology and religious vocations majors had the lowest reported average—$30,584. However, this average was higher than the overall average of $29,100 reported for these majors from the Class of 2014. Also on the modest side were parks, recreation, leisure, and fitness studies ($34,455), and family and consumer sciences ($32,140) majors.
The next issue of Salary Survey will be published in September 2016 and will provide actual preliminary salaries for Class of 2016 graduates. The Winter 2017 Salary Survey will include projected salaries for the Class of 2017.
EXECUTIVE SUMMARY

National Association of Colleges and Employers | 2016 Spring Salary Survey | 5
STARTING SALARY BY ACADEMIC MAJOR
AVERAGE SALARIES BY DISCIPLINE/ASSOCIATE DEGREES
Broad Category # of Salaries Mean 25th
Percentile Median 75th Percentile
Agriculture 7 $36,143 $31,600 $31,600 $45,000
Computer and Information Sciences and Support Services 41 $40,406 $38,935 $38,935 $41,500
Personal and Culinary Services 12 $24,017 $23,840 $24,000 $24,000
Education 7 $30,439 $18,000 $29,640 $46,000
Engineering Technologies 42 $41,881 $40,000 $44,667 $48,577
Liberal Arts and Sciences, General Studies, and Humanities 112 $34,580 $32,000 $32,000 $34,167
Multi/Interdisciplinary Studies 7 $39,272 $26,250 $26,250 $56,633
Homeland Security, Law Enforcement, Firefighting, and Related Protective Services 17 $36,249 $33,000 $39,436 $39,436
Mechanic and Repair Technologies/Technicians 12 $41,617 $39,400 $42,400 $42,400
Precision Production 11 $40,000 $40,000 $40,000 $40,000
Health Professions and Related Programs 193 $37,140 $33,625 $37,501 $40,700
Business, Management, Marketing, and Related Support Services 86 $41,259 $39,545 $39,545 $41,709

6 | 2016 Spring Salary Survey | National Association of Colleges and Employers
STARTING SALARY BY ACADEMIC MAJOR
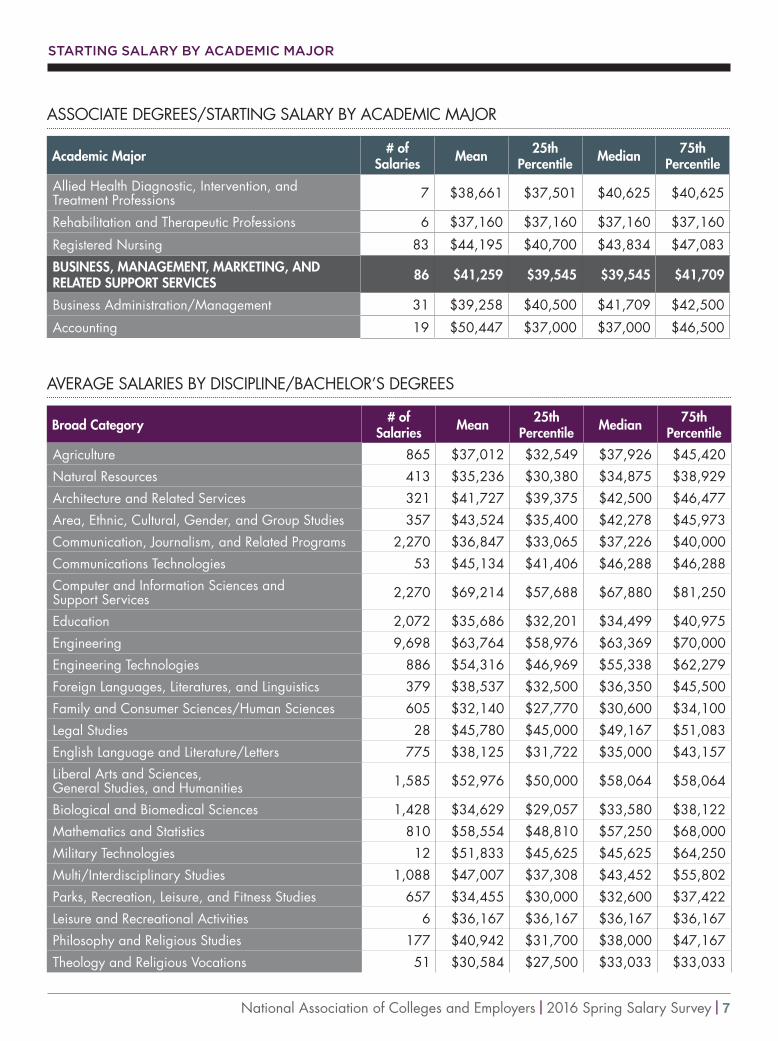
ASSOCIATE DEGREES/STARTING SALARY BY ACADEMIC MAJOR
Academic Major # of Salaries Mean 25th
Percentile Median 75th Percentile
AGRICULTURE 7 $36,143 $31,600 $31,600 $45,000
Applied Horticulture 5 $31,600 $31,600 $31,600 $31,600
COMPUTER AND INFORMATION SCIENCES AND SUPPORT SERVICES 41 $40,406 $38,935 $38,935 $41,500
Computer Systems Analysis 21 $38,935 $38,935 $38,935 $38,935
Computer Science 6 $46,667 $46,667 $46,667 $46,667
Computer Systems Networking and Telecommunications 12 $42,000 $39,000 $41,500 $41,500
PERSONAL AND CULINARY SERVICES 12 $24,017 $23,840 $24,000 $24,000
Cosmetology and Related Personal Grooming Services 6 $24,000 $24,000 $24,000 $24,000
Culinary Arts 6 $24,033 $23,840 $23,840 $23,840
EDUCATION 7 $30,439 $18,000 $29,640 $46,000
Teacher Education, Specific Levels and Methods 5 $24,214 $18,000 $29,640 $29,640
ENGINEERING TECHNOLOGIES 42 $41,881 $40,000 $44,667 $48,577
Electrical Engineering Technologies 5 $32,200 $36,250 $36,250 $36,250
Industrial Production Technologies 6 $45,417 $45,417 $45,417 $45,417
Mechanical Engineering Related Technologies 19 $45,026 $44,667 $48,577 $48,577
Construction Engineering Technologies 9 $40,111 $40,125 $40,125 $40,125
LIBERAL ARTS AND SCIENCES, GENERAL STUDIES, AND HUMANITIES 112 $34,580 $32,000 $32,000 $34,167
Liberal Arts and Sciences, General Studies, and Humanities 112 $34,580 $32,000 $32,000 $34,167
MULTI/INTERDISCIPLINARY STUDIES 7 $39,272 $26,250 $26,250 $56,633
*No individual major data reported.
HOMELAND SECURITY, LAW ENFORCEMENT, FIREFIGHTING, AND RELATED PROTECTIVE SERVICES 17 $36,249 $33,000 $39,436 $39,436
Criminal Justice and Corrections 13 $38,518 $39,436 $39,436 $39,436
MECHANIC AND REPAIR TECHNOLOGIES/ TECHNICIANS 12 $41,617 $39,400 $42,400 $42,400
Heavy/Industrial Equipment Maintenance Technologies 5 $39,400 $39,400 $39,400 $39,400
Vehicle Maintenance and Repair Technologies 7 $43,200 $42,400 $42,400 $42,400
PRECISION PRODUCTION 11 $40,000 $40,000 $40,000 $40,000
Precision Metal Working 11 $40,000 $40,000 $40,000 $40,000
HEALTH PROFESSIONS AND RELATED PROGRAMS 193 $37,140 $33,625 $37,501 $40,700
Health and Medical Administrative Services 31 $35,581 $35,000 $35,000 $35,000
Allied Health and Medical Assisting Services 59 $28,929 $22,857 $26,107 $33,625
National Association of Colleges and Employers | 2016 Spring Salary Survey | 7
STARTING SALARY BY ACADEMIC MAJOR
ASSOCIATE DEGREES/STARTING SALARY BY ACADEMIC MAJOR
Academic Major # of Salaries Mean 25th
Percentile Median 75th Percentile
Allied Health Diagnostic, Intervention, and Treatment Professions 7 $38,661 $37,501 $40,625 $40,625
Rehabilitation and Therapeutic Professions 6 $37,160 $37,160 $37,160 $37,160
Registered Nursing 83 $44,195 $40,700 $43,834 $47,083
BUSINESS, MANAGEMENT, MARKETING, AND RELATED SUPPORT SERVICES 86 $41,259 $39,545 $39,545 $41,709
Business Administration/Management 31 $39,258 $40,500 $41,709 $42,500
Accounting 19 $50,447 $37,000 $37,000 $46,500
AVERAGE SALARIES BY DISCIPLINE/BACHELOR’S DEGREES
Broad Category # of Salaries Mean 25th
Percentile Median 75th Percentile
Agriculture 865 $37,012 $32,549 $37,926 $45,420
Natural Resources 413 $35,236 $30,380 $34,875 $38,929
Architecture and Related Services 321 $41,727 $39,375 $42,500 $46,477
Area, Ethnic, Cultural, Gender, and Group Studies 357 $43,524 $35,400 $42,278 $45,973
Communication, Journalism, and Related Programs 2,270 $36,847 $33,065 $37,226 $40,000
Communications Technologies 53 $45,134 $41,406 $46,288 $46,288
Computer and Information Sciences and Support Services 2,270 $69,214 $57,688 $67,880 $81,250
Education 2,072 $35,686 $32,201 $34,499 $40,975
Engineering 9,698 $63,764 $58,976 $63,369 $70,000
Engineering Technologies 886 $54,316 $46,969 $55,338 $62,279
Foreign Languages, Literatures, and Linguistics 379 $38,537 $32,500 $36,350 $45,500
Family and Consumer Sciences/Human Sciences 605 $32,140 $27,770 $30,600 $34,100
Legal Studies 28 $45,780 $45,000 $49,167 $51,083
English Language and Literature/Letters 775 $38,125 $31,722 $35,000 $43,157
Liberal Arts and Sciences, General Studies, and Humanities 1,585 $52,976 $50,000 $58,064 $58,064
Biological and Biomedical Sciences 1,428 $34,629 $29,057 $33,580 $38,122
Mathematics and Statistics 810 $58,554 $48,810 $57,250 $68,000
Military Technologies 12 $51,833 $45,625 $45,625 $64,250
Multi/Interdisciplinary Studies 1,088 $47,007 $37,308 $43,452 $55,802
Parks, Recreation, Leisure, and Fitness Studies 657 $34,455 $30,000 $32,600 $37,422
Leisure and Recreational Activities 6 $36,167 $36,167 $36,167 $36,167
Philosophy and Religious Studies 177 $40,942 $31,700 $38,000 $47,167
Theology and Religious Vocations 51 $30,584 $27,500 $33,033 $33,033
8 | 2016 Spring Salary Survey | National Association of Colleges and Employers
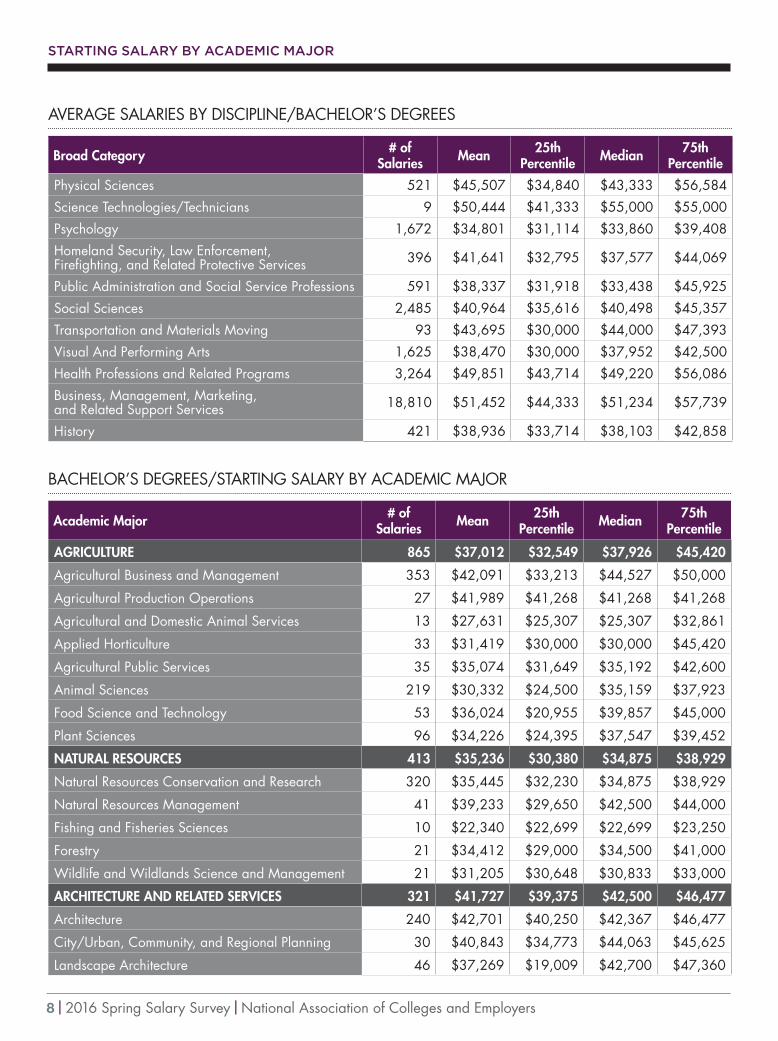
AVERAGE SALARIES BY DISCIPLINE/BACHELOR’S DEGREES
Broad Category # of Salaries Mean 25th
Percentile Median 75th Percentile
Physical Sciences 521 $45,507 $34,840 $43,333 $56,584
Science Technologies/Technicians 9 $50,444 $41,333 $55,000 $55,000
Psychology 1,672 $34,801 $31,114 $33,860 $39,408
Homeland Security, Law Enforcement, Firefighting, and Related Protective Services 396 $41,641 $32,795 $37,577 $44,069
Public Administration and Social Service Professions 591 $38,337 $31,918 $33,438 $45,925
Social Sciences 2,485 $40,964 $35,616 $40,498 $45,357
Transportation and Materials Moving 93 $43,695 $30,000 $44,000 $47,393
Visual And Performing Arts 1,625 $38,470 $30,000 $37,952 $42,500
Health Professions and Related Programs 3,264 $49,851 $43,714 $49,220 $56,086
Business, Management, Marketing, and Related Support Services 18,810 $51,452 $44,333 $51,234 $57,739
History 421 $38,936 $33,714 $38,103 $42,858
STARTING SALARY BY ACADEMIC MAJOR
BACHELOR’S DEGREES/STARTING SALARY BY ACADEMIC MAJOR
Academic Major # of Salaries Mean 25th
Percentile Median 75th Percentile
AGRICULTURE 865 $37,012 $32,549 $37,926 $45,420
Agricultural Business and Management 353 $42,091 $33,213 $44,527 $50,000
Agricultural Production Operations 27 $41,989 $41,268 $41,268 $41,268
Agricultural and Domestic Animal Services 13 $27,631 $25,307 $25,307 $32,861
Applied Horticulture 33 $31,419 $30,000 $30,000 $45,420
Agricultural Public Services 35 $35,074 $31,649 $35,192 $42,600
Animal Sciences 219 $30,332 $24,500 $35,159 $37,923
Food Science and Technology 53 $36,024 $20,955 $39,857 $45,000
Plant Sciences 96 $34,226 $24,395 $37,547 $39,452
NATURAL RESOURCES 413 $35,236 $30,380 $34,875 $38,929
Natural Resources Conservation and Research 320 $35,445 $32,230 $34,875 $38,929
Natural Resources Management 41 $39,233 $29,650 $42,500 $44,000
Fishing and Fisheries Sciences 10 $22,340 $22,699 $22,699 $23,250
Forestry 21 $34,412 $29,000 $34,500 $41,000
Wildlife and Wildlands Science and Management 21 $31,205 $30,648 $30,833 $33,000
ARCHITECTURE AND RELATED SERVICES 321 $41,727 $39,375 $42,500 $46,477
Architecture 240 $42,701 $40,250 $42,367 $46,477
City/Urban, Community, and Regional Planning 30 $40,843 $34,773 $44,063 $45,625
Landscape Architecture 46 $37,269 $19,009 $42,700 $47,360

National Association of Colleges and Employers | 2016 Spring Salary Survey | 9
STARTING SALARY BY ACADEMIC MAJOR
40%
30%
20%
0%
10%
COMPUTER SCIENCES MAJORS/SALARY RANGES
Computer andInformation Services
Information Science/Studies
Computer Science
25th PERCENTILE 50th PERCENTILE 75th PERCENTILE
$66,667
$56,803
$55,000
$61,000
$83,947
$74,248
$66,150
$55,172
$53,166
BACHELOR’S DEGREES/STARTING SALARY BY ACADEMIC MAJOR
Academic Major # of Salaries Mean 25th
Percentile Median 75th Percentile
AREA, ETHNIC, CULTURAL, GENDER, AND GROUP STUDIES 357 $43,524 $35,400 $42,278 $45,973
Area Studies 246 $44,910 $37,000 $42,278 $55,333
Ethnic, Cultural Minority, Gender, and Group Stud-ies 111 $40,453 $32,500 $41,000 $44,272
COMMUNICATION, JOURNALISM, AND RELATED PROGRAMS 2,270 $36,847 $33,065 $37,226 $40,000
Communication and Media Studies 1,187 $37,882 $34,667 $37,544 $40,588
Journalism 484 $34,867 $30,242 $33,065 $40,200
Radio, Television, and Digital Communication 47 $33,988 $31,000 $32,500 $32,929
Public Relations, Advertising, and Applied Communication 513 $36,644 $35,000 $37,404 $37,696
COMMUNICATIONS TECHNOLOGIES/ TECHNICIANS AND SUPPORT SERVICES 53 $45,134 $41,406 $46,288 $46,288
Communications Technology/Technician 14 $46,429 $40,000 $50,000 $50,000
Graphic Communications 37 $43,246 $41,406 $46,288 $46,288
COMPUTER AND INFORMATION SCIENCES AND SUPPORT SERVICES 2,270 $69,214 $57,688 $67,880 $81,250
Computer and Information Sciences 211 $58,503 $55,000 $56,803 $66,667
Computer Programming 20 $53,125 $52,000 $52,000 $56,389
Information Science 141 $56,818 $53,166 $55,172 $61,000

10 | 2016 Spring Salary Survey | National Association of Colleges and Employers
STARTING SALARY BY ACADEMIC MAJOR
BACHELOR’S DEGREES/STARTING SALARY BY ACADEMIC MAJOR
Academic Major # of Salaries Mean 25th
Percentile Median 75th Percentile
Computer Science 1,594 $75,191 $66,150 $74,248 $83,947
Computer Software and Media Applications 48 $33,465 $18,438 $18,438 $45,667
Computer Systems Networking and Telecommunications 66 $49,967 $46,510 $46,818 $46,818
Computer/Information Technology Administration and Management 175 $56,215 $50,167 $52,000 $62,038
EDUCATION 2,072 $35,686 $32,201 $34,499 $40,975
Curriculum and Instruction 7 $34,114 $33,933 $34,250 $34,250
Education Administration and Supervision 23 $46,369 $41,545 $41,545 $46,250
Special Education and Teaching 166 $33,947 $31,004 $33,788 $38,000
Teacher Education, Specific Levels and Methods 985 $34,038 $32,125 $33,545 $36,250
Teacher Education, Specific Subject Areas 523 $36,526 $32,501 $36,489 $42,800
ENGINEERING 9,698 $63,764 $58,976 $63,369 $70,000
Aerospace, Aeronautical, and Astronautical Engineering 876 $67,658 $68,843 $72,998 $72,998
Agricultural Engineering 35 $51,422 $40,000 $51,862 $59,349
Architectural Engineering 99 $61,050 $56,187 $58,059 $66,250
Biomedical/Medical Engineering 439 $57,257 $54,496 $60,000 $62,500
Ceramic Sciences and Engineering 5 $61,200 $61,200 $61,200 $61,200
Chemical Engineering 989 $65,782 $63,763 $67,104 $69,093
Civil Engineering 1,089 $57,368 $53,833 $55,468 $59,375
Computer Engineering 475 $68,820 $61,849 $69,986 $79,478
40%
30%
20%
0%
10%
ENGINEERING MAJORS/SALARY RANGES
25th PERCENTILE 50th PERCENTILE 75th PERCENTILE
Mechanical
$65,181
$62,925
$59,738
Petroleum
$70,818
$70,818
$70,818
Chemical
$69,093
$67,104
$63,763
Computer
$79,478
$69,986
$61,849
Electrical
$69,000
$65,950
$61,618
Civil
$59,375
$55,468
$53,833

National Association of Colleges and Employers | 2016 Spring Salary Survey | 11
STARTING SALARY BY ACADEMIC MAJOR
BACHELOR’S DEGREES/STARTING SALARY BY ACADEMIC MAJOR
Academic Major # of Salaries Mean 25th
Percentile Median 75th Percentile
Electrical, Electronics, and Communications Engineering 1,262 $67,593 $61,618 $65,950 $69,000
Engineering Mechanics 7 $57,994 $56,743 $56,743 $56,743
Engineering Physics 20 $52,482 $46,005 $58,000 $61,795
Engineering Science 20 $56,750 $57,917 $58,364 $58,364
Environmental/Environmental Health Engineering 97 $49,217 $48,500 $52,324 $55,484
Materials Engineering 144 $58,410 $54,333 $63,390 $66,159
Mechanical Engineering 2,534 $62,239 $59,738 $62,925 $65,181
Metallurgical Engineering 15 $65,924 $65,631 $65,631 $65,631
Mining and Mineral Engineering 10 $66,250 $64,333 $66,167 $67,750
Nuclear Engineering 27 $54,351 $55,605 $61,109 $61,109
Petroleum Engineering 177 $74,996 $70,818 $70,818 $70,818
Systems Engineering 26 $59,992 $59,399 $59,399 $62,500
Polymer/Plastics Engineering 14 $61,893 $59,000 $59,000 $59,000
Construction Engineering 20 $55,401 $53,547 $53,547 $58,843
Industrial Engineering 424 $56,364 $54,832 $60,676 $62,818
Manufacturing Engineering 32 $54,406 $54,125 $55,000 $55,000
Operations Research 28 $73,339 $67,885 $76,900 $76,900
Surveying Engineering 2 $51,280 $51,280 $51,280 $51,280
Geological/Geophysical Engineering 17 $56,309 $57,821 $57,821 $61,667
Mechatronics, Robotics, and Automation Engineering 33 $80,859 $82,714 $82,714 $82,714
Biological/Biosystems Engineering 59 $56,581 $54,527 $59,876 $62,410
ENGINEERING TECHNOLOGIES 886 $54,316 $46,969 $55,338 $62,279
Civil Engineering Technologies/Technicians 26 $47,799 $48,267 $48,267 $48,267
Electrical Engineering Technologies/Technicians 123 $52,767 $44,203 $45,536 $60,796
Environmental Control Technologies 42 $71,443 $71,490 $71,490 $71,490
Industrial Production Technologies 82 $53,526 $38,333 $55,083 $64,500
Quality Control and Safety Technologies 36 $63,575 $63,575 $63,575 $63,575
Mechanical Engineering Related Technologies 315 $52,722 $40,313 $56,980 $59,429
Construction Engineering Technologies 55 $51,338 $46,969 $54,814 $54,814
Computer Engineering Technologies 8 $49,500 $42,500 $45,000 $56,500
Engineering-Related Fields 110 $58,681 $57,213 $60,000 $62,768
FOREIGN LANGUAGES, LITERATURES, AND LINGUISTICS 379 $38,537 $32,500 $36,350 $45,500
Linguistic, Comparative, and Related Language Studies 99 $41,411 $34,167 $40,000 $49,250
East Asian Languages 33 $44,696 $37,500 $44,054 $48,333

12 | 2016 Spring Salary Survey | National Association of Colleges and Employers
STARTING SALARY BY ACADEMIC MAJOR
40%
30%
20%
0%
10%
LIBERAL ARTS AND HUMANITIES MAJORS/SALARY RANGES
25th PERCENTILE 50th PERCENTILE 75th PERCENTILE
Liberal Arts/General Sciences
$58,064
$58,064
$50,000
Visual &Performing Arts
$39,410
$39,410
$36,700
Philosophy
$31,700
$42,155
$48,333
Area &Gender Studies
$45,973
$42,278
$35,400
ForeignLanguages
$45,500
$36,350
$32,500
History
$42,858
$38,103
$33,714
English
$43,157
$35,833
$31,900
BACHELOR’S DEGREES/STARTING SALARY BY ACADEMIC MAJOR
Academic Major # of Salaries Mean 25th
Percentile Median 75th Percentile
Slavic, Baltic, and Albanian Languages 9 $40,815 $30,000 $42,667 $43,000
Germanic Languages 12 $39,443 $20,980 $49,000 $54,333
Romance Languages 175 $36,032 $32,081 $34,840 $42,500
Classics and Classical Languages 33 $37,627 $32,500 $33,040 $40,250
FAMILY AND CONSUMER SCIENCES/ HUMAN SCIENCES 605 $32,140 $27,770 $30,600 $34,100
Family and Consumer Sciences/Human Sciences 126 $29,278 $24,956 $29,200 $33,500
Family and Consumer Sciences/ Human Sciences Business Services 20 $40,275 $31,188 $36,000 $48,800
Foods, Nutrition, and Related Services 75 $36,468 $33,509 $34,018 $42,287
Housing and Human Environments 32 $37,363 $36,696 $36,696 $36,696
Human Development, Family Studies, and Related Services 289 $30,180 $27,770 $29,000 $31,724
Apparel and Textiles 63 $36,465 $30,600 $38,421 $38,421
ENGLISH LANGUAGE AND LITERATURE/LETTERS 775 $38,125 $31,722 $35,000 $43,157
English Language and Literature/Letters 692 $38,600 $31,900 $35,833 $43,157
Rhetoric and Composition/Writing Studies 56 $37,107 $27,500 $37,667 $42,134
Literature 27 $28,060 $26,667 $27,750 $30,219
LIBERAL ARTS AND SCIENCES, GENERAL STUDIES, AND HUMANITIES 1,585 $52,976 $50,000 $58,064 $58,064
Liberal Arts and Sciences, General Studies, and Humanities 1,584 $52,990 $50,000 $58,064 $58,064
National Association of Colleges and Employers | 2016 Spring Salary Survey | 13
STARTING SALARY BY ACADEMIC MAJOR
40%
30%
20%
0%
10%
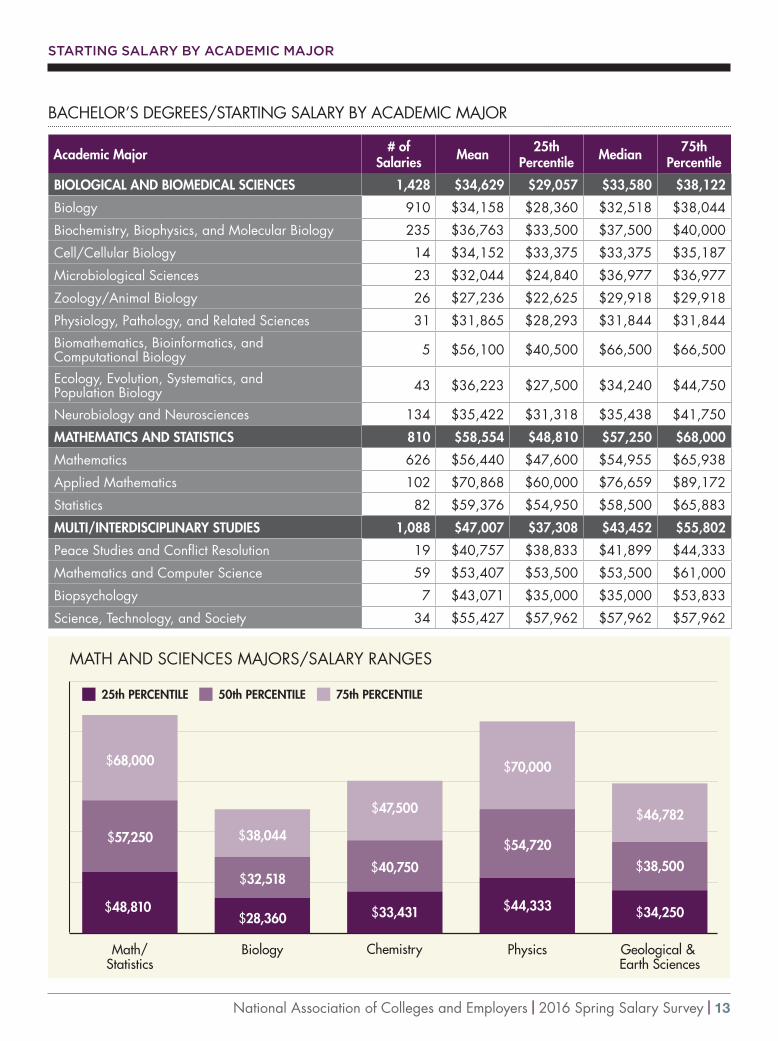
MATH AND SCIENCES MAJORS/SALARY RANGES
Math/Statistics
Biology Chemistry Physics Geological & Earth Sciences
25th PERCENTILE 50th PERCENTILE 75th PERCENTILE
$68,000
$38,044
$32,518
$47,500
$40,750
$33,431
$46,782
$38,500
$34,250$44,333
$54,720
$70,000
$57,250
$48,810$28,360
BACHELOR’S DEGREES/STARTING SALARY BY ACADEMIC MAJOR
Academic Major # of Salaries Mean 25th
Percentile Median 75th Percentile
BIOLOGICAL AND BIOMEDICAL SCIENCES 1,428 $34,629 $29,057 $33,580 $38,122
Biology 910 $34,158 $28,360 $32,518 $38,044
Biochemistry, Biophysics, and Molecular Biology 235 $36,763 $33,500 $37,500 $40,000
Cell/Cellular Biology 14 $34,152 $33,375 $33,375 $35,187
Microbiological Sciences 23 $32,044 $24,840 $36,977 $36,977
Zoology/Animal Biology 26 $27,236 $22,625 $29,918 $29,918
Physiology, Pathology, and Related Sciences 31 $31,865 $28,293 $31,844 $31,844
Biomathematics, Bioinformatics, and Computational Biology 5 $56,100 $40,500 $66,500 $66,500
Ecology, Evolution, Systematics, and Population Biology 43 $36,223 $27,500 $34,240 $44,750
Neurobiology and Neurosciences 134 $35,422 $31,318 $35,438 $41,750
MATHEMATICS AND STATISTICS 810 $58,554 $48,810 $57,250 $68,000
Mathematics 626 $56,440 $47,600 $54,955 $65,938
Applied Mathematics 102 $70,868 $60,000 $76,659 $89,172
Statistics 82 $59,376 $54,950 $58,500 $65,883
MULTI/INTERDISCIPLINARY STUDIES 1,088 $47,007 $37,308 $43,452 $55,802
Peace Studies and Conflict Resolution 19 $40,757 $38,833 $41,899 $44,333
Mathematics and Computer Science 59 $53,407 $53,500 $53,500 $61,000
Biopsychology 7 $43,071 $35,000 $35,000 $53,833
Science, Technology, and Society 34 $55,427 $57,962 $57,962 $57,962

14 | 2016 Spring Salary Survey | National Association of Colleges and Employers
STARTING SALARY BY ACADEMIC MAJOR
BACHELOR’S DEGREES/STARTING SALARY BY ACADEMIC MAJOR
Academic Major # of Salaries Mean 25th
Percentile Median 75th Percentile
Behavioral Sciences 12 $33,117 $30,000 $31,700 $38,500
Natural Sciences 46 $35,597 $31,000 $34,667 $42,075
International/Global Studies 203 $42,261 $35,505 $39,619 $55,802
Classical and Ancient Studies 7 $37,223 $24,960 $38,250 $49,100
Intercultural/Multicultural and Diversity Studies 12 $47,357 $44,711 $53,921 $53,921
Cognitive Science 47 $45,657 $40,000 $49,581 $53,511
Cultural Studies 10 $37,200 $31,333 $41,000 $41,000
Human Biology 5 $31,545 $28,750 $33,408 $33,408
Marine Sciences 10 $29,500 $28,750 $28,750 $28,750
Sustainability Studies 17 $51,541 $48,000 $58,525 $58,525
PARKS, RECREATION, LEISURE, AND FITNESS STUDIES 657 $34,455 $30,000 $32,600 $37,422
Parks, Recreation, and Leisure Studies 44 $31,567 $31,173 $31,300 $34,250
Parks, Recreation, and Leisure Facilities Management 96 $38,536 $31,949 $42,442 $42,442
Health and Physical Education/Fitness 492 $34,086 $29,912 $32,500 $35,900
PHILOSOPHY AND RELIGIOUS STUDIES 177 $40,942 $31,700 $38,000 $47,167
Philosophy 125 $43,427 $31,700 $42,155 $48,333
Religion/Religious Studies 51 $34,675 $28,355 $33,636 $38,000
THEOLOGY AND RELIGIOUS VOCATIONS 51 $30,584 $27,500 $33,033 $33,033
Theological and Ministerial Studies 27 $33,606 $33,033 $33,033 $33,033
Pastoral Counseling and Specialized Ministries 23 $27,824 $12,142 $30,117 $31,667
PHYSICAL SCIENCES 521 $45,507 $34,840 $43,333 $56,584
Astronomy and Astrophysics 13 $59,431 $45,600 $67,500 $69,000
Atmospheric Sciences and Meteorology 6 $42,833 $29,667 $32,833 $62,000
Chemistry 283 $41,832 $33,431 $40,750 $47,500
Geological and Earth Sciences 88 $41,676 $34,250 $38,500 $46,782
Physics 119 $56,403 $44,333 $54,720 $70,000
PSYCHOLOGY 1,672 $34,801 $31,114 $33,860 $39,408
Psychology 1,582 $34,643 $31,114 $33,681 $38,664
Clinical, Counseling, and Applied Psychology 86 $37,366 $31,518 $34,833 $41,946
HOMELAND SECURITY, LAW ENFORCEMENT, FIREFIGHTING, AND RELATED PROTECTIVE SERVICES 396 $41,641 $32,795 $37,577 $44,069
Criminal Justice and Corrections 350 $39,367 $32,500 $36,500 $44,069
Fire Protection 16 $37,688 $37,688 $37,688 $37,688
Homeland Security 30 $70,278 $75,070 $75,070 $75,070

National Association of Colleges and Employers | 2016 Spring Salary Survey | 15
STARTING SALARY BY ACADEMIC MAJOR
BACHELOR’S DEGREES/STARTING SALARY BY ACADEMIC MAJOR
Academic Major # of Salaries Mean 25th
Percentile Median 75th Percentile
PUBLIC ADMINISTRATION AND SOCIAL SERVICE PROFESSIONS 591 $38,337 $31,918 $33,438 $45,925
Public Administration 58 $50,808 $49,429 $54,212 $54,212
Public Policy Analysis 144 $48,463 $44,709 $46,763 $49,997
Social Work 341 $32,757 $29,667 $32,500 $33,500
SOCIAL SCIENCES 2,485 $40,964 $35,616 $40,498 $45,357
Anthropology 153 $34,085 $29,700 $33,396 $38,636
Criminology 207 $34,057 $28,527 $35,833 $37,117
Economics 150 $53,488 $53,670 $54,800 $56,850
Geography 76 $38,908 $33,750 $41,333 $42,500
International Relations and National Security Studies 269 $45,085 $45,226 $45,226 $46,700
Political Science and Government 1,002 $42,804 $37,475 $41,785 $49,911
Sociology 466 $35,459 $31,190 $35,000 $38,750
Urban Studies/Affairs 8 $40,850 $40,850 $40,850 $40,850
Sociology and Anthropology 5 $45,600 $45,750 $45,750 $45,750
TRANSPORTATION AND MATERIALS MOVING 93 $43,695 $30,000 $44,000 $47,393
Air Transportation 93 $43,695 $30,000 $44,000 $47,393
VISUAL AND PERFORMING ARTS 1,625 $38,470 $30,000 $37,952 $42,500
Visual and Performing Arts 46 $37,077 $36,700 $39,410 $39,410
Dance 24 $31,377 $21,467 $29,583 $36,000
Design and Applied Arts 503 $43,801 $32,052 $39,000 $55,646
40%
30%
20%
0%
10%
SOCIAL SCIENCE MAJORS/SALARY RANGES
Economics Political Science Psychology Sociology Social Work
25th PERCENTILE 50th PERCENTILE 75th PERCENTILE
$58,850
$49,911
$41,785
$38,664
$33,681
$31,114
$33,500
$32,500
$29,667$31,190
$35,000
$38,750$54,800
$53,670$37,475

16 | 2016 Spring Salary Survey | National Association of Colleges and Employers
STARTING SALARY BY ACADEMIC MAJOR
BACHELOR’S DEGREES/STARTING SALARY BY ACADEMIC MAJOR
Academic Major # of Salaries Mean 25th
Percentile Median 75th Percentile
Drama/Theatre Arts and Stagecraft 66 $34,710 $29,000 $39,137 $39,853
Film/Video and Photographic Arts 190 $35,238 $30,000 $37,952 $40,000
Fine and Studio Arts 387 $37,011 $30,875 $40,000 $40,951
Music 156 $38,729 $30,000 $36,794 $47,250
Arts, Entertainment, and Media Management 237 $33,964 $28,603 $30,000 $39,792
HEALTH PROFESSIONS AND RELATED PROGRAMS 3,264 $49,851 $43,714 $49,220 $56,086
Communication Disorders Sciences and Services 81 $32,809 $27,726 $32,500 $37,800
Dental Support Services and Allied Professions 6 $59,207 $58,240 $60,000 $65,000
Health and Medical Administrative Services 161 $42,556 $34,096 $43,000 $52,500
Allied Health and Medical Assisting Services 33 $48,200 $38,393 $38,393 $57,903
Allied Health Diagnostic, Intervention, and Treatment Professions 98 $40,294 $33,129 $37,448 $47,200
Clinical/Medical Laboratory Sciences 57 $47,822 $42,561 $46,804 $52,000
Health/Medical Preparatory Programs 18 $30,311 $27,900 $27,900 $33,700
Pharmacy, Pharmaceutical Sciences, and Administration 11 $31,792 $11,154 $11,154 $86,828
Public Health 198 $39,767 $36,475 $39,000 $46,333
Rehabilitation and Therapeutic Professions 55 $32,670 $30,610 $32,716 $34,000
Medical Illustration and Informatics 6 $53,700 $38,100 $61,500 $61,500
Dietetics and Clinical Nutrition Services 40 $32,380 $24,913 $30,100 $41,256
Registered Nursing 2,397 $53,683 $47,401 $51,250 $57,830
BUSINESS, MANAGEMENT, MARKETING, AND RELATED SUPPORT SERVICES 18,810 $51,452 $44,333 $51,234 $57,739
Business Administration/Management 5,063 $49,494 $42,104 $47,324 $55,455
Logistics, Materials, and Supply Chain Management 496 $52,951 $51,159 $51,724 $57,105
Accounting 2,929 $51,426 $47,750 $52,552 $56,397
Business/Corporate Communications 17 $44,118 $44,118 $44,118 $44,118
Business/Managerial Economics 1,879 $54,991 $48,500 $54,700 $62,131
Entrepreneurial and Small Business Operations 162 $48,030 $42,777 $45,227 $50,449
Finance 3,018 $56,094 $50,800 $54,959 $60,400
Hospitality Administration/Management 409 $36,926 $36,000 $36,875 $42,444
Human Resources Management 416 $45,038 $41,087 $44,413 $53,583
International Business 288 $49,989 $46,333 $50,818 $53,214
Management Information Systems 769 $58,526 $53,100 $57,500 $63,625

National Association of Colleges and Employers | 2016 Spring Salary Survey | 17
STARTING SALARY BY ACADEMIC MAJOR
40%
30%
20%
0%
10%
BUSINESS MAJORS/SALARY RANGES25th PERCENTILE 50th PERCENTILE 75th PERCENTILE
BusinessAdministration
Accounting Economics Finance HospitalityAdministration
ManagementInformation
Systems
Marketing
$55,455$56,397
$52,552
$47,750 $48,500
$60,400
$50,800$36,000
$53,100 $40,238
$43,472
$49,380
$57,500
$63,625
$36,875
$42,444
$54,700 $54,959
$62,131
$47,324
$42,104
BACHELOR’S DEGREES/STARTING SALARY BY ACADEMIC MAJOR
Academic Major # of Salaries Mean 25th
Percentile Median 75th Percentile
Management Sciences and Quantitative Methods (Actuarial) 127 $54,330 $45,000 $62,058 $62,251
Marketing 2,221 $43,678 $40,238 $43,472 $49,380
Real Estate 76 $55,827 $55,667 $58,653 $58,653
Insurance 109 $54,230 $52,500 $57,535 $57,535
General Sales and Merchandising 72 $33,901 $32,208 $32,208 $32,208
Specialized Sales and Merchandising 38 $38,829 $37,583 $41,429 $41,429
Construction Management 266 $54,787 $48,853 $56,172 $57,884
Telecommunications Management 8 $33,305 $33,305 $33,305 $33,305
HISTORY 421 $38,936 $33,714 $38,103 $42,858

18 | 2016 Spring Salary Survey | National Association of Colleges and Employers
STARTING SALARY BY ACADEMIC MAJOR
AVERAGE SALARIES BY DISCIPLINE/MASTER’S DEGREES
Broad Category # of Salaries Mean 25th
Percentile Median 75th Percentile
Agriculture 91 $46,949 $39,700 $43,750 $52,500
Natural Resources 41 $50,771 $43,125 $54,083 $56,600
Architecture and Related Services 88 $53,051 $46,111 $51,827 $59,370
Area, Ethnic, Cultural, Gender, and Group Studies 23 $53,935 $33,500 $59,250 $59,250
Communication, Journalism, and Related Programs 187 $50,565 $38,146 $43,500 $54,500
Computer and Information Sciences and Support Services 804 $89,184 $75,137 $88,799 $105,480
Education 1,585 $48,312 $42,092 $50,000 $53,800
Engineering 1,450 $75,038 $61,333 $76,982 $87,454
Engineering Technologies 110 $75,140 $60,750 $78,205 $93,396
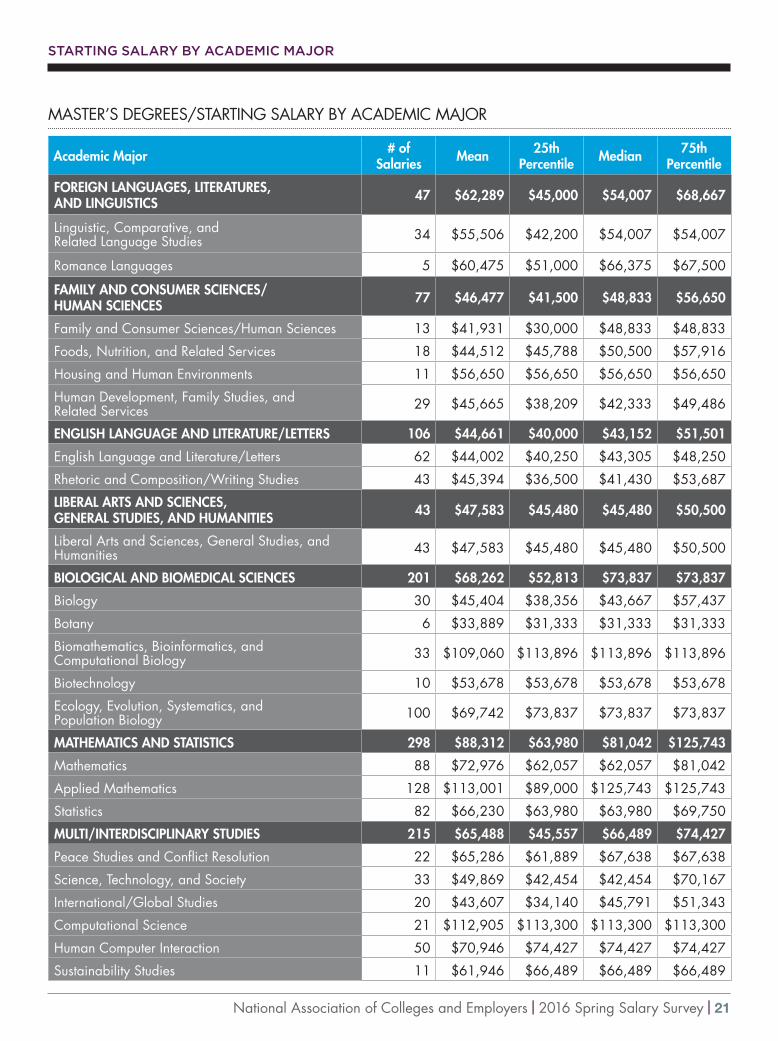
Foreign Languages, Literatures, and Linguistics 47 $62,289 $45,000 $54,007 $68,667
Family And Consumer Sciences/Human Sciences 77 $46,477 $41,500 $48,833 $56,650
English Language and Literature/Letters 106 $44,661 $40,000 $43,152 $51,501
Liberal Arts and Sciences, General Studies, and Humanities 43 $47,583 $45,480 $45,480 $50,500
Library Science 56 $43,238 $37,578 $43,570 $43,570
Biological and Biomedical Sciences 201 $68,262 $52,813 $73,837 $73,837
Mathematics and Statistics 298 $88,312 $63,980 $81,042 $125,743
Multi/Interdisciplinary Studies 215 $65,488 $45,557 $66,489 $74,427
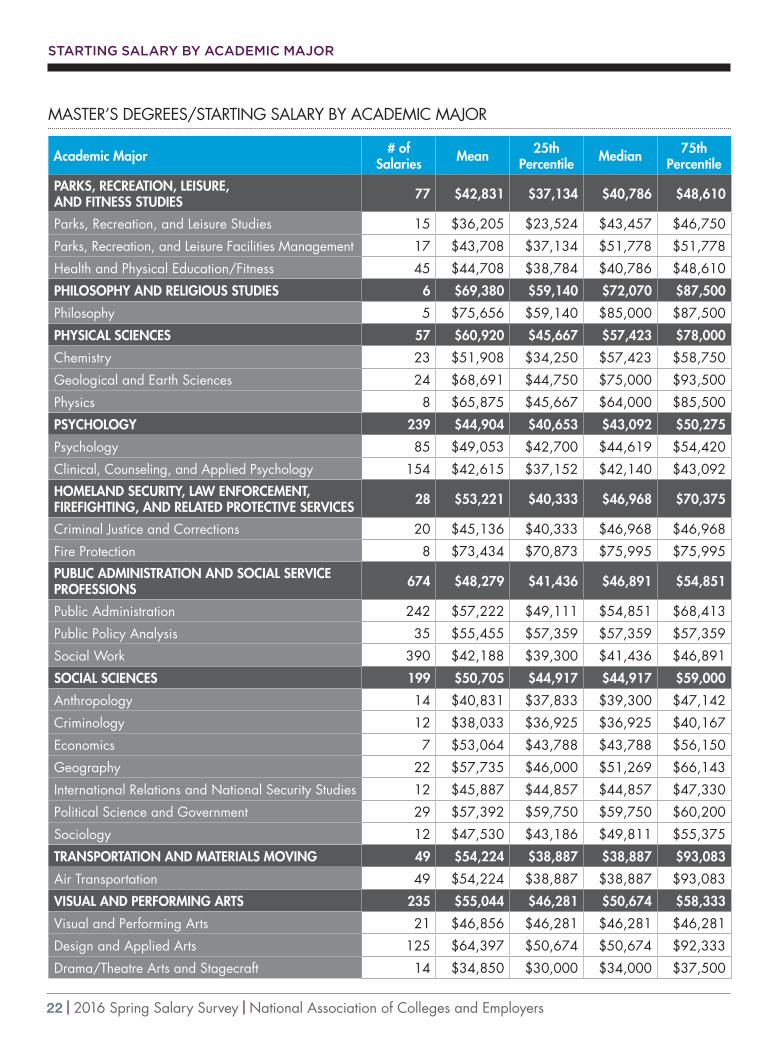
Parks, Recreation, Leisure, and Fitness Studies 77 $42,831 $37,134 $40,786 $48,610
Basic Skills and Developmental/Remedial Education 10 $43,052 $40,304 $40,304 $49,500
Philosophy and Religious Studies 6 $69,380 $59,140 $72,070 $87,500
Theology and Religious Vocations 6 $40,000 $30,000 $40,000 $50,000
Physical Sciences 57 $60,920 $45,667 $57,423 $78,000
Science Technologies/Technicians 13 $49,070 $50,733 $50,733 $50,733
Psychology 239 $44,904 $40,653 $43,092 $50,275
Homeland Security, Law Enforcement, Firefighting, and Related Protective Services 28 $53,221 $40,333 $46,968 $70,375
Public Administration and Social Service Professions 674 $48,279 $41,436 $46,891 $54,851
Social Sciences 199 $50,705 $44,917 $44,917 $59,000
Transportation and Materials Moving 49 $54,224 $38,887 $38,887 $93,083
Visual and Performing Arts 235 $55,044 $46,281 $50,674 $58,333
Health Professions and Related Programs 1,103 $74,388 $56,155 $70,000 $91,000
Business, Management, Marketing, and Related Support Services 3,296 $68,292 $52,875 $63,300 $76,033
History 27 $45,925 $39,250 $48,393 $48,393

National Association of Colleges and Employers | 2016 Spring Salary Survey | 19
STARTING SALARY BY ACADEMIC MAJOR
MASTER’S DEGREES/STARTING SALARY BY ACADEMIC MAJOR
Academic Major # of Salaries Mean 25th
Percentile Median 75th Percentile
AGRICULTURE 91 $46,949 $39,700 $43,750 $52,500
Agricultural Business and Management 25 $45,567 $35,308 $40,375 $61,320
Agricultural Public Services 5 $39,700 $39,700 $39,700 $39,700
Animal Sciences 9 $41,960 $33,356 $42,120 $56,000
Food Science and Technology 21 $44,420 $43,571 $43,750 $50,000
Plant Sciences 11 $44,352 $25,875 $47,667 $53,000
NATURAL RESOURCES 41 $50,771 $43,125 $54,083 $56,600
Natural Resources Conservation and Research 28 $52,016 $44,202 $54,792 $56,775
Natural Resources Management 7 $51,500 $43,125 $43,125 $55,000
Forestry 6 $44,111 $32,333 $46,750 $51,500
ARCHITECTURE AND RELATED SERVICES 88 $53,051 $46,111 $51,827 $59,370
Architecture 43 $53,033 $46,111 $49,444 $59,890
City/Urban, Community, and Regional Planning 30 $54,168 $51,827 $51,827 $58,850
Landscape Architecture 7 $35,143 $21,500 $35,000 $51,000
Real Estate Development 8 $64,625 $64,625 $64,625 $64,625
AREA, ETHNIC, CULTURAL, GENDER, AND GROUP STUDIES 23 $53,935 $33,500 $59,250 $59,250
Area Studies 12 $54,625 $33,500 $38,250 $86,500
Ethnic, Cultural Minority, Gender, and Group Studies 11 $53,182 $37,000 $59,250 $59,250
COMMUNICATION, JOURNALISM, AND RELATED PROGRAMS 187 $50,565 $38,146 $43,500 $54,500
Communication and Media Studies 64 $55,411 $41,200 $48,000 $85,005
Journalism 75 $40,466 $38,146 $38,146 $44,883
Public Relations, Advertising, and Applied Communication 35 $67,837 $42,778 $82,482 $82,482
Publishing 10 $35,300 $35,300 $35,300 $35,300
COMPUTER AND INFORMATION SCIENCES AND SUPPORT SERVICES 804 $89,184 $75,137 $88,799 $105,480
Computer and Information Sciences 166 $91,689 $74,917 $101,434 $105,059
Information Science 67 $65,503 $58,500 $71,583 $75,833
Computer Science 365 $90,934 $85,000 $92,778 $105,480
Computer Software and Media Applications 5 $53,550 $52,500 $54,250 $54,250
Computer Systems Networking and Telecommunications 108 $106,088 $109,566 $109,566 $109,566
Computer/Information Technology Administration and Management 93 $77,192 $73,110 $74,300 $80,148

20 | 2016 Spring Salary Survey | National Association of Colleges and Employers
STARTING SALARY BY ACADEMIC MAJOR
MASTER’S DEGREES/STARTING SALARY BY ACADEMIC MAJOR
Academic Major # of Salaries Mean 25th
Percentile Median 75th Percentile
EDUCATION 1,585 $48,312 $42,092 $50,000 $53,800
Curriculum and Instruction 217 $46,845 $43,983 $51,452 $51,452
Education Administration and Supervision 390 $51,006 $42,125 $49,703 $61,106
Educational/Instructional Media Design 23 $52,454 $51,500 $55,000 $55,000
Special Education and Teaching 166 $47,919 $43,700 $50,883 $51,767
Student Counseling and Personnel Services 87 $42,046 $37,284 $39,333 $45,746
Teacher Education, Specific Levels and Methods 200 $44,684 $42,092 $43,024 $51,000
Teacher Education, Specific Subject Areas 139 $46,145 $38,457 $44,992 $51,716
Teaching English as a Second Language 12 $45,504 $41,000 $41,333 $47,350
ENGINEERING 1,450 $75,038 $61,333 $76,982 $87,454
Aerospace, Aeronautical, and Astronautical Engineering 19 $78,811 $72,500 $80,212 $80,212
Agricultural Engineering 5 $41,066 $34,833 $34,833 $34,833
Biomedical/Medical Engineering 37 $60,777 $51,500 $66,000 $69,818
Chemical Engineering 67 $64,140 $56,831 $61,600 $71,260
Civil Engineering 206 $58,290 $54,540 $58,394 $64,680
Computer Engineering 55 $87,546 $76,500 $82,525 $104,200
Electrical, Electronics, and Communications Engineering 413 $86,218 $76,982 $87,536 $106,732
Environmental/Environmental Health Engineering 8 $61,870 $56,667 $58,333 $70,000
Materials Engineering 48 $91,863 $66,700 $114,025 $114,025
Mechanical Engineering 259 $66,786 $61,143 $69,784 $78,058
Nuclear Engineering 7 $56,643 $20,000 $71,833 $71,833
Systems Engineering 71 $102,840 $104,930 $104,930 $104,930
Construction Engineering 5 $65,000 $65,000 $65,000 $65,000
Industrial Engineering 49 $58,312 $49,115 $62,250 $70,625
Operations Research 82 $78,572 $77,941 $77,941 $77,941
Geological/Geophysical Engineering 6 $56,083 $52,900 $52,900 $52,900
Mechatronics, Robotics, and Automation Engineering 26 $82,846 $83,553 $83,553 $83,553
ENGINEERING TECHNOLOGIES 110 $75,140 $60,750 $78,205 $93,396
Electrical Engineering Technologies/Technicians 15 $63,067 $52,500 $52,500 $67,667
Electromechanical Technologies 10 $60,750 $60,750 $60,750 $60,750
Industrial Production Technologies 5 $56,600 $44,000 $60,000 $60,000
Engineering-Related Fields 63 $79,177 $73,750 $78,205 $87,070
National Association of Colleges and Employers | 2016 Spring Salary Survey | 21
STARTING SALARY BY ACADEMIC MAJOR
MASTER’S DEGREES/STARTING SALARY BY ACADEMIC MAJOR
Academic Major # of Salaries Mean 25th
Percentile Median 75th Percentile
FOREIGN LANGUAGES, LITERATURES, AND LINGUISTICS 47 $62,289 $45,000 $54,007 $68,667
Linguistic, Comparative, and Related Language Studies 34 $55,506 $42,200 $54,007 $54,007
Romance Languages 5 $60,475 $51,000 $66,375 $67,500
FAMILY AND CONSUMER SCIENCES/ HUMAN SCIENCES 77 $46,477 $41,500 $48,833 $56,650
Family and Consumer Sciences/Human Sciences 13 $41,931 $30,000 $48,833 $48,833
Foods, Nutrition, and Related Services 18 $44,512 $45,788 $50,500 $57,916
Housing and Human Environments 11 $56,650 $56,650 $56,650 $56,650
Human Development, Family Studies, and Related Services 29 $45,665 $38,209 $42,333 $49,486
ENGLISH LANGUAGE AND LITERATURE/LETTERS 106 $44,661 $40,000 $43,152 $51,501
English Language and Literature/Letters 62 $44,002 $40,250 $43,305 $48,250
Rhetoric and Composition/Writing Studies 43 $45,394 $36,500 $41,430 $53,687
LIBERAL ARTS AND SCIENCES, GENERAL STUDIES, AND HUMANITIES 43 $47,583 $45,480 $45,480 $50,500
Liberal Arts and Sciences, General Studies, and Humanities 43 $47,583 $45,480 $45,480 $50,500
BIOLOGICAL AND BIOMEDICAL SCIENCES 201 $68,262 $52,813 $73,837 $73,837
Biology 30 $45,404 $38,356 $43,667 $57,437
Botany 6 $33,889 $31,333 $31,333 $31,333
Biomathematics, Bioinformatics, and Computational Biology 33 $109,060 $113,896 $113,896 $113,896
Biotechnology 10 $53,678 $53,678 $53,678 $53,678
Ecology, Evolution, Systematics, and Population Biology 100 $69,742 $73,837 $73,837 $73,837
MATHEMATICS AND STATISTICS 298 $88,312 $63,980 $81,042 $125,743
Mathematics 88 $72,976 $62,057 $62,057 $81,042
Applied Mathematics 128 $113,001 $89,000 $125,743 $125,743
Statistics 82 $66,230 $63,980 $63,980 $69,750
MULTI/INTERDISCIPLINARY STUDIES 215 $65,488 $45,557 $66,489 $74,427
Peace Studies and Conflict Resolution 22 $65,286 $61,889 $67,638 $67,638
Science, Technology, and Society 33 $49,869 $42,454 $42,454 $70,167
International/Global Studies 20 $43,607 $34,140 $45,791 $51,343
Computational Science 21 $112,905 $113,300 $113,300 $113,300
Human Computer Interaction 50 $70,946 $74,427 $74,427 $74,427
Sustainability Studies 11 $61,946 $66,489 $66,489 $66,489
22 | 2016 Spring Salary Survey | National Association of Colleges and Employers
STARTING SALARY BY ACADEMIC MAJOR
MASTER’S DEGREES/STARTING SALARY BY ACADEMIC MAJOR
Academic Major # of Salaries Mean 25th
Percentile Median 75th Percentile
PARKS, RECREATION, LEISURE, AND FITNESS STUDIES 77 $42,831 $37,134 $40,786 $48,610
Parks, Recreation, and Leisure Studies 15 $36,205 $23,524 $43,457 $46,750
Parks, Recreation, and Leisure Facilities Management 17 $43,708 $37,134 $51,778 $51,778
Health and Physical Education/Fitness 45 $44,708 $38,784 $40,786 $48,610
PHILOSOPHY AND RELIGIOUS STUDIES 6 $69,380 $59,140 $72,070 $87,500
Philosophy 5 $75,656 $59,140 $85,000 $87,500
PHYSICAL SCIENCES 57 $60,920 $45,667 $57,423 $78,000
Chemistry 23 $51,908 $34,250 $57,423 $58,750
Geological and Earth Sciences 24 $68,691 $44,750 $75,000 $93,500
Physics 8 $65,875 $45,667 $64,000 $85,500
PSYCHOLOGY 239 $44,904 $40,653 $43,092 $50,275
Psychology 85 $49,053 $42,700 $44,619 $54,420
Clinical, Counseling, and Applied Psychology 154 $42,615 $37,152 $42,140 $43,092
HOMELAND SECURITY, LAW ENFORCEMENT, FIREFIGHTING, AND RELATED PROTECTIVE SERVICES 28 $53,221 $40,333 $46,968 $70,375
Criminal Justice and Corrections 20 $45,136 $40,333 $46,968 $46,968
Fire Protection 8 $73,434 $70,873 $75,995 $75,995
PUBLIC ADMINISTRATION AND SOCIAL SERVICE PROFESSIONS 674 $48,279 $41,436 $46,891 $54,851
Public Administration 242 $57,222 $49,111 $54,851 $68,413
Public Policy Analysis 35 $55,455 $57,359 $57,359 $57,359
Social Work 390 $42,188 $39,300 $41,436 $46,891
SOCIAL SCIENCES 199 $50,705 $44,917 $44,917 $59,000
Anthropology 14 $40,831 $37,833 $39,300 $47,142
Criminology 12 $38,033 $36,925 $36,925 $40,167
Economics 7 $53,064 $43,788 $43,788 $56,150
Geography 22 $57,735 $46,000 $51,269 $66,143
International Relations and National Security Studies 12 $45,887 $44,857 $44,857 $47,330
Political Science and Government 29 $57,392 $59,750 $59,750 $60,200
Sociology 12 $47,530 $43,186 $49,811 $55,375
TRANSPORTATION AND MATERIALS MOVING 49 $54,224 $38,887 $38,887 $93,083
Air Transportation 49 $54,224 $38,887 $38,887 $93,083
VISUAL AND PERFORMING ARTS 235 $55,044 $46,281 $50,674 $58,333
Visual and Performing Arts 21 $46,856 $46,281 $46,281 $46,281
Design and Applied Arts 125 $64,397 $50,674 $50,674 $92,333
Drama/Theatre Arts and Stagecraft 14 $34,850 $30,000 $34,000 $37,500

National Association of Colleges and Employers | 2016 Spring Salary Survey | 23
STARTING SALARY BY ACADEMIC MAJOR
MASTER’S DEGREES/STARTING SALARY BY ACADEMIC MAJOR
Academic Major # of Salaries Mean 25th
Percentile Median 75th Percentile
Film/Video and Photographic Arts 9 $56,359 $57,900 $58,500 $58,500
Fine and Studio Arts 24 $41,480 $31,750 $43,750 $48,875
Music 31 $42,167 $33,667 $38,400 $52,733
Arts, Entertainment, and Media Management 11 $54,909 $53,750 $58,333 $61,667
HEALTH PROFESSIONS AND RELATED PROGRAMS 1,103 $74,388 $56,155 $70,000 $91,000
Communication Disorders Sciences and Services 99 $58,688 $52,263 $56,155 $65,302
Health and Medical Administrative Services 192 $93,333 $72,163 $102,214 $107,359
Allied Health and Medical Assisting Services 28 $64,445 $62,250 $64,152 $72,892
Allied Health Diagnostic, Intervention, and Treat-ment Professions 80 $81,929 $87,500 $87,929 $90,700
Mental and Social Health Services 54 $43,696 $38,167 $39,400 $46,333
Public Health 193 $56,319 $54,092 $55,772 $61,913
Rehabilitation and Therapeutic Professions 21 $54,041 $45,966 $61,918 $61,918
Medical Illustration and Informatics 26 $125,769 $71,111 $91,750 $192,727
Dietetics and Clinical Nutrition Services 13 $49,185 $49,100 $49,100 $53,400
Bioethics/Medical Ethics 5 $117,199 $117,199 $117,199 $117,199
Registered Nursing 338 $82,508 $71,120 $76,495 $98,148
Practical Nursing 8 $75,625 $73,333 $77,000 $77,000
BUSINESS, MANAGEMENT, MARKETING, AND RELATED SUPPORT SERVICES 3,296 $68,292 $52,875 $63,300 $76,033
Business Administration/Management 1,642 $73,951 $58,119 $67,500 $80,780
Logistics, Materials, and Supply Chain Management 6 $81,833 $81,833 $81,833 $81,833
Accounting 694 $54,721 $50,941 $51,588 $56,891
Business/Managerial Economics 45 $69,284 $61,500 $72,453 $77,500
Entrepreneurial and Small Business Operations 10 $60,340 $60,378 $60,378 $60,378
Finance 267 $71,383 $58,330 $69,333 $79,655
Human Resources Management 113 $56,476 $44,000 $56,566 $68,812
International Business 28 $54,090 $49,055 $52,652 $52,652
Management Information Systems 235 $73,444 $65,000 $74,583 $78,868
Marketing 135 $66,537 $51,961 $72,986 $75,033
Real Estate 18 $63,466 $54,153 $57,077 $75,000
Taxation 48 $77,219 $70,833 $79,231 $81,500
Construction Management 7 $55,143 $52,667 $52,667 $52,667
Telecommunications Management 10 $97,700 $97,700 $97,700 $97,700
HISTORY 27 $45,925 $39,250 $48,393 $48,393

24 | 2016 Spring Salary Survey | National Association of Colleges and Employers
STARTING SALARY BY ACADEMIC MAJOR
AVERAGE SALARIES BY DISCIPLINE/DOCTORAL DEGREES
Broad Category # of Salaries Mean 25th
Percentile Median 75th Percentile
Agriculture 35 $52,075 $35,500 $57,667 $68,000
Natural Resources 12 $48,281 $41,066 $43,000 $56,925
Architecture and Related Services 6 $66,139 $72,500 $72,500 $72,500
Area, Ethnic, Cultural, Gender, and Group Studies 5 $52,820 $42,050 $56,000 $62,000
Communication, Journalism, and Related Programs 29 $53,310 $44,333 $50,000 $56,500
Computer and Information Sciences and Support Services 77 $101,879 $79,779 $106,272 $108,000
Education 200 $72,936 $57,743 $71,222 $89,790
Engineering 544 $81,028 $65,255 $79,907 $92,425
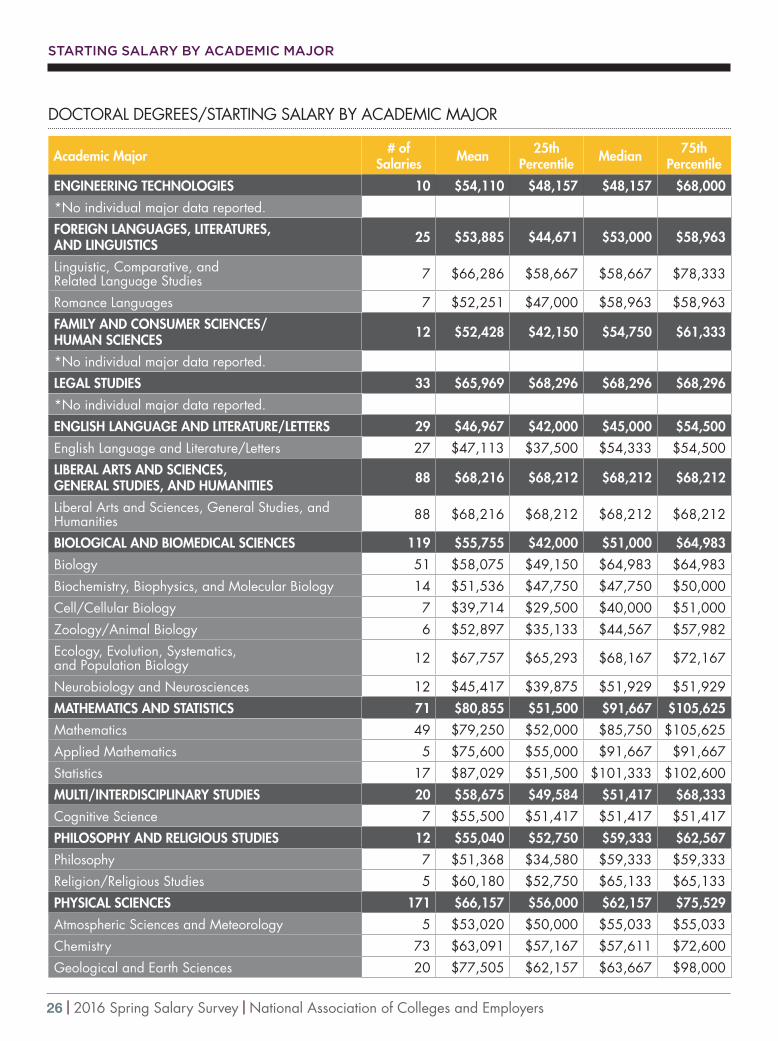
Engineering Technologies 10 $54,110 $48,157 $48,157 $68,000
Foreign Languages, Literatures, and Linguistics 25 $53,885 $44,671 $53,000 $58,963
Family and Consumer Sciences/Human Sciences 12 $52,428 $42,150 $54,750 $61,333
Legal Studies 33 $65,969 $68,296 $68,296 $68,296
English Language and Literature/Letters 29 $46,967 $42,000 $45,000 $54,500
Liberal Arts and Sciences, General Studies, and Humanities 88 $68,216 $68,212 $68,212 $68,212
Biological and Biomedical Sciences 119 $55,755 $42,000 $51,000 $64,983
Mathematics and Statistics 71 $80,855 $51,500 $91,667 $105,625
Multi/Interdisciplinary Studies 20 $58,675 $49,584 $51,417 $68,333
Philosophy and Religious Studies 12 $55,040 $52,750 $59,333 $62,567
Physical Sciences 171 $66,157 $56,000 $62,157 $75,529
Psychology 81 $56,772 $46,000 $56,888 $66,125
Public Administration and Social Service Professions 19 $78,826 $66,000 $70,625 $108,240
Social Sciences 70 $65,101 $55,500 $66,500 $73,333
Transportation and Materials Moving 22 $75,326 $56,166 $84,267 $84,267
Visual and Performing Arts 28 $59,675 $54,000 $57,333 $59,389
Health Professions and Related Programs 404 $70,563 $57,928 $65,633 $82,917
Business, Management, Marketing, and Related Support Services 92 $123,241 $78,667 $131,318 $154,125
History 23 $58,957 $47,000 $54,250 $68,750

National Association of Colleges and Employers | 2016 Spring Salary Survey | 25
STARTING SALARY BY ACADEMIC MAJOR
DOCTORAL DEGREES/STARTING SALARY BY ACADEMIC MAJOR
Academic Major # of Salaries Mean 25th
Percentile Median 75th Percentile
AGRICULTURE 35 $52,075 $35,500 $57,667 $68,000
Food Science and Technology 11 $56,000 $38,000 $71,167 $71,167
Plant Sciences 13 $43,013 $30,000 $38,000 $53,333
NATURAL RESOURCES 12 $48,281 $41,066 $43,000 $56,925
Natural Resources Conservation and Research 8 $50,046 $41,066 $48,033 $59,989
ARCHITECTURE AND RELATED SERVICES 6 $66,139 $72,500 $72,500 $72,500
Architecture 5 $73,000 $72,500 $72,500 $72,500
AREA, ETHNIC, CULTURAL, GENDER, AND GROUP STUDIES 5 $52,820 $42,050 $56,000 $62,000
*No individual major data reported.
COMMUNICATION, JOURNALISM, AND RELATED PROGRAMS 29 $53,310 $44,333 $50,000 $56,500
Communication and Media Studies 24 $52,729 $44,333 $47,167 $56,000
COMPUTER AND INFORMATION SCIENCES AND SUPPORT SERVICES 77 $101,879 $79,779 $106,272 $108,000
Computer and Information Sciences 12 $108,125 $85,229 $101,125 $135,000
Computer Science 65 $100,726 $79,779 $106,272 $108,000
EDUCATION 200 $72,936 $57,743 $71,222 $89,790
Curriculum and Instruction 15 $50,772 $37,062 $57,743 $57,743
Education Administration and Supervision 73 $79,900 $62,000 $75,833 $99,329
Student Counseling and Personnel Services 5 $51,160 $52,400 $52,400 $54,000
Teacher Education, Specific Subject Areas 25 $60,248 $38,000 $50,000 $72,000
ENGINEERING 544 $81,028 $65,255 $79,907 $92,425
Biomedical/Medical Engineering 25 $60,954 $46,000 $61,125 $70,000
Chemical Engineering 62 $75,743 $67,279 $82,643 $83,724
Civil Engineering 47 $60,464 $34,146 $65,051 $75,182
Computer Engineering 5 $105,400 $103,500 $103,500 $110,000
Electrical, Electronics, and Communications Engineering 132 $95,373 $75,333 $100,882 $116,040
Engineering Physics 8 $69,875 $48,250 $69,875 $91,500
Materials Engineering 59 $76,626 $68,039 $85,500 $87,333
Mechanical Engineering 98 $79,664 $77,063 $80,593 $80,593
Nuclear Engineering 18 $73,480 $78,450 $78,450 $80,560
Systems Engineering 6 $128,833 $112,000 $112,000 $162,500
Industrial Engineering 11 $82,455 $56,250 $72,500 $113,000
Operations Research 9 $133,445 $145,143 $145,143 $145,143
Biological/Biosystems Engineering 8 $49,813 $45,200 $45,200 $55,100
26 | 2016 Spring Salary Survey | National Association of Colleges and Employers
STARTING SALARY BY ACADEMIC MAJOR
DOCTORAL DEGREES/STARTING SALARY BY ACADEMIC MAJOR
Academic Major # of Salaries Mean 25th
Percentile Median 75th Percentile
ENGINEERING TECHNOLOGIES 10 $54,110 $48,157 $48,157 $68,000
*No individual major data reported.
FOREIGN LANGUAGES, LITERATURES, AND LINGUISTICS 25 $53,885 $44,671 $53,000 $58,963
Linguistic, Comparative, and Related Language Studies 7 $66,286 $58,667 $58,667 $78,333
Romance Languages 7 $52,251 $47,000 $58,963 $58,963
FAMILY AND CONSUMER SCIENCES/ HUMAN SCIENCES 12 $52,428 $42,150 $54,750 $61,333
*No individual major data reported.
LEGAL STUDIES 33 $65,969 $68,296 $68,296 $68,296
*No individual major data reported.
ENGLISH LANGUAGE AND LITERATURE/LETTERS 29 $46,967 $42,000 $45,000 $54,500
English Language and Literature/Letters 27 $47,113 $37,500 $54,333 $54,500
LIBERAL ARTS AND SCIENCES, GENERAL STUDIES, AND HUMANITIES 88 $68,216 $68,212 $68,212 $68,212
Liberal Arts and Sciences, General Studies, and Humanities 88 $68,216 $68,212 $68,212 $68,212
BIOLOGICAL AND BIOMEDICAL SCIENCES 119 $55,755 $42,000 $51,000 $64,983
Biology 51 $58,075 $49,150 $64,983 $64,983
Biochemistry, Biophysics, and Molecular Biology 14 $51,536 $47,750 $47,750 $50,000
Cell/Cellular Biology 7 $39,714 $29,500 $40,000 $51,000
Zoology/Animal Biology 6 $52,897 $35,133 $44,567 $57,982
Ecology, Evolution, Systematics, and Population Biology 12 $67,757 $65,293 $68,167 $72,167
Neurobiology and Neurosciences 12 $45,417 $39,875 $51,929 $51,929
MATHEMATICS AND STATISTICS 71 $80,855 $51,500 $91,667 $105,625
Mathematics 49 $79,250 $52,000 $85,750 $105,625
Applied Mathematics 5 $75,600 $55,000 $91,667 $91,667
Statistics 17 $87,029 $51,500 $101,333 $102,600
MULTI/INTERDISCIPLINARY STUDIES 20 $58,675 $49,584 $51,417 $68,333
Cognitive Science 7 $55,500 $51,417 $51,417 $51,417
PHILOSOPHY AND RELIGIOUS STUDIES 12 $55,040 $52,750 $59,333 $62,567
Philosophy 7 $51,368 $34,580 $59,333 $59,333
Religion/Religious Studies 5 $60,180 $52,750 $65,133 $65,133
PHYSICAL SCIENCES 171 $66,157 $56,000 $62,157 $75,529
Atmospheric Sciences and Meteorology 5 $53,020 $50,000 $55,033 $55,033
Chemistry 73 $63,091 $57,167 $57,611 $72,600
Geological and Earth Sciences 20 $77,505 $62,157 $63,667 $98,000

National Association of Colleges and Employers | 2016 Spring Salary Survey | 27
STARTING SALARY BY ACADEMIC MAJOR
DOCTORAL DEGREES/STARTING SALARY BY ACADEMIC MAJOR
Academic Major # of Salaries Mean 25th
Percentile Median 75th Percentile
Physics 64 $66,601 $52,566 $66,500 $75,529
Materials Science 5 $70,724 $70,724 $70,724 $70,724
PSYCHOLOGY 81 $56,772 $46,000 $56,888 $66,125
Psychology 50 $61,792 $55,667 $61,688 $71,050
Clinical, Counseling, and Applied Psychology 30 $48,298 $40,000 $47,920 $56,888
PUBLIC ADMINISTRATION AND SOCIAL SERVICE PROFESSIONS 19 $78,826 $66,000 $70,625 $108,240
Public Administration 9 $89,244 $60,000 $108,240 $108,240
Social Work 6 $68,667 $66,000 $66,000 $66,000
SOCIAL SCIENCES 70 $65,101 $55,500 $66,500 $73,333
Anthropology 9 $55,222 $48,333 $48,333 $66,500
Criminology 7 $60,428 $50,333 $68,000 $68,000
Economics 5 $90,000 $87,500 $87,500 $87,500
Political Science and Government 20 $64,550 $58,167 $63,300 $68,800
Sociology 13 $69,077 $55,500 $60,000 $70,000
TRANSPORTATION AND MATERIALS MOVING 22 $75,326 $56,166 $84,267 $84,267
Air Transportation 22 $75,326 $56,166 $84,267 $84,267
VISUAL AND PERFORMING ARTS 28 $59,675 $54,000 $57,333 $59,389
Design and Applied Arts 6 $58,000 $58,000 $58,000 $58,000
Fine and Studio Arts 7 $69,358 $57,258 $57,258 $100,738
Music 11 $55,400 $48,000 $53,000 $57,333
HEALTH PROFESSIONS AND RELATED PROGRAMS 404 $70,563 $57,928 $65,633 $82,917
Communication Disorders Sciences and Services 8 $61,925 $58,833 $61,000 $65,633
Dentistry 5 $56,461 $56,461 $56,461 $56,461
Allied Health and Medical Assisting Services 41 $62,429 $62,226 $62,226 $62,236
Health/Medical Preparatory Programs 52 $57,928 $57,928 $57,928 $57,928
Medicine 25 $56,458 $56,875 $56,875 $56,875
Optometry 10 $78,090 $78,090 $78,090 $78,090
Pharmacy, Pharmaceutical Sciences, and Administration 118 $80,110 $71,348 $71,348 $82,962
Rehabilitation and Therapeutic Professions 44 $63,135 $61,850 $64,103 $64,500
Veterinary Medicine 33 $55,626 $56,354 $56,354 $56,354
Registered Nursing 56 $87,871 $82,917 $83,111 $93,750
BUSINESS, MANAGEMENT, MARKETING, AND RELATED SUPPORT SERVICES 92 $123,241 $78,667 $131,318 $154,125
Business Administration/Management 34 $123,162 $78,688 $131,318 $131,318
Business/Managerial Economics 36 $104,153 $72,450 $74,286 $153,250
HISTORY 23 $58,957 $47,000 $54,250 $68,750

28 | 2016 Spring Salary Survey | National Association of Colleges and Employers
STARTING SALARY BY REGION AND MAJOR/BACHELOR’S DEGREES
AVERAGE SALARIES BY REGION/BACHELOR’S DEGREES
Region Average Starting Salary
New England $52,820
Mid-Atlantic $54,180
Southeast $44,825
Great Lakes $48,674
Plains $46,848
Southwest $50,927
Far West $53,298
Rocky Mountain $44,016
NEW ENGLAND
MID- ATLANTIC
SOUTHEAST
SOUTHWEST
PLAINS
GREAT LAKES
FAR WEST
National Association of Colleges and Employers | 2016 Spring Salary Survey | 29
STARTING SALARY BY REGION AND MAJOR/BACHELOR’S DEGREES
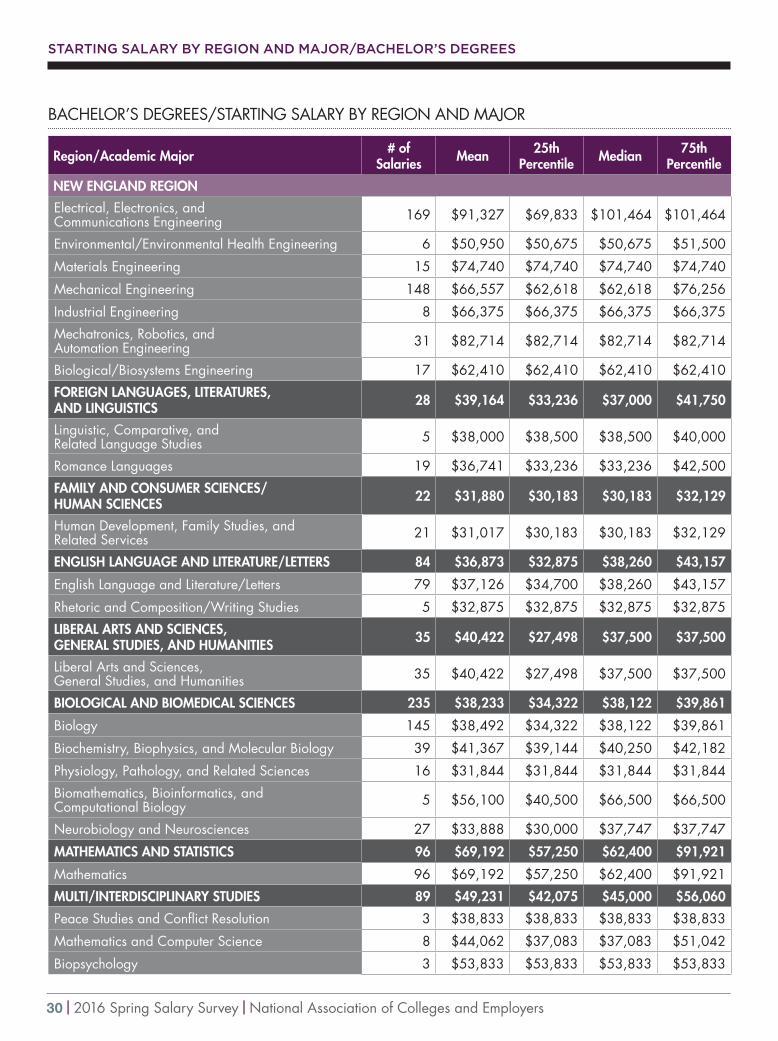
BACHELOR’S DEGREES/STARTING SALARY BY REGION AND MAJOR
Region/Academic Major # of Salaries Mean 25th
Percentile Median 75th Percentile
NEW ENGLAND REGION
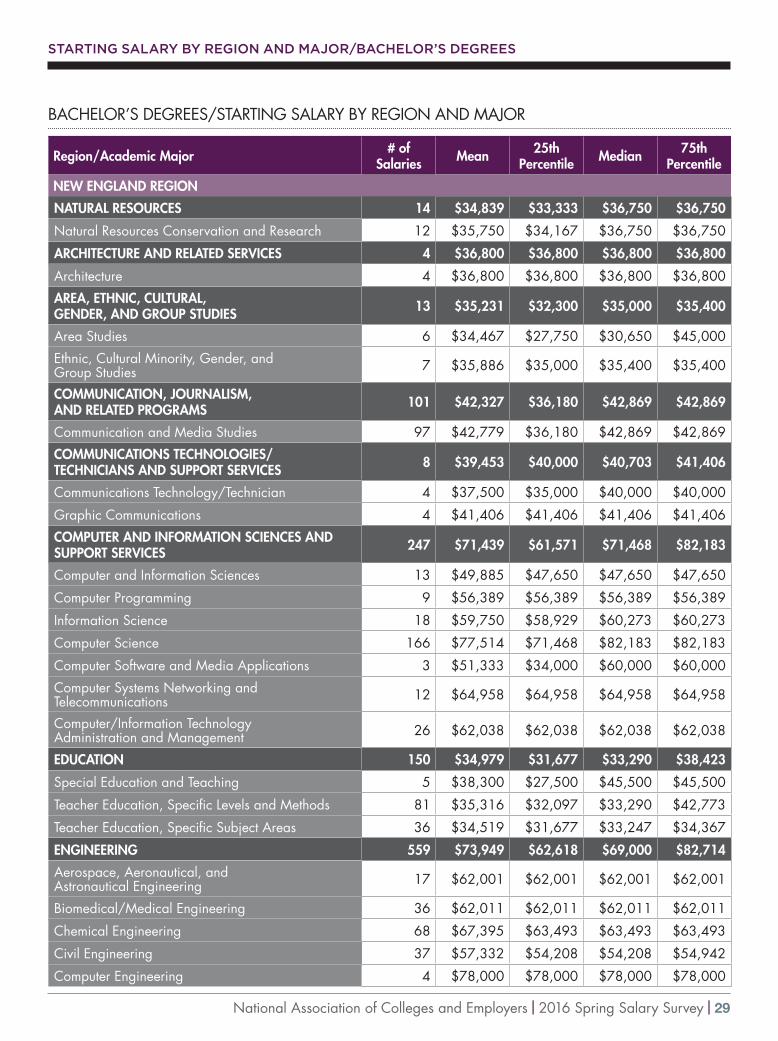
NATURAL RESOURCES 14 $34,839 $33,333 $36,750 $36,750
Natural Resources Conservation and Research 12 $35,750 $34,167 $36,750 $36,750
ARCHITECTURE AND RELATED SERVICES 4 $36,800 $36,800 $36,800 $36,800
Architecture 4 $36,800 $36,800 $36,800 $36,800
AREA, ETHNIC, CULTURAL, GENDER, AND GROUP STUDIES 13 $35,231 $32,300 $35,000 $35,400
Area Studies 6 $34,467 $27,750 $30,650 $45,000
Ethnic, Cultural Minority, Gender, and Group Studies 7 $35,886 $35,000 $35,400 $35,400
COMMUNICATION, JOURNALISM, AND RELATED PROGRAMS 101 $42,327 $36,180 $42,869 $42,869
Communication and Media Studies 97 $42,779 $36,180 $42,869 $42,869
COMMUNICATIONS TECHNOLOGIES/ TECHNICIANS AND SUPPORT SERVICES 8 $39,453 $40,000 $40,703 $41,406
Communications Technology/Technician 4 $37,500 $35,000 $40,000 $40,000
Graphic Communications 4 $41,406 $41,406 $41,406 $41,406
COMPUTER AND INFORMATION SCIENCES AND SUPPORT SERVICES 247 $71,439 $61,571 $71,468 $82,183
Computer and Information Sciences 13 $49,885 $47,650 $47,650 $47,650
Computer Programming 9 $56,389 $56,389 $56,389 $56,389
Information Science 18 $59,750 $58,929 $60,273 $60,273
Computer Science 166 $77,514 $71,468 $82,183 $82,183
Computer Software and Media Applications 3 $51,333 $34,000 $60,000 $60,000
Computer Systems Networking and Telecommunications 12 $64,958 $64,958 $64,958 $64,958
Computer/Information Technology Administration and Management 26 $62,038 $62,038 $62,038 $62,038
EDUCATION 150 $34,979 $31,677 $33,290 $38,423
Special Education and Teaching 5 $38,300 $27,500 $45,500 $45,500
Teacher Education, Specific Levels and Methods 81 $35,316 $32,097 $33,290 $42,773
Teacher Education, Specific Subject Areas 36 $34,519 $31,677 $33,247 $34,367
ENGINEERING 559 $73,949 $62,618 $69,000 $82,714
Aerospace, Aeronautical, and Astronautical Engineering 17 $62,001 $62,001 $62,001 $62,001
Biomedical/Medical Engineering 36 $62,011 $62,011 $62,011 $62,011
Chemical Engineering 68 $67,395 $63,493 $63,493 $63,493
Civil Engineering 37 $57,332 $54,208 $54,208 $54,942
Computer Engineering 4 $78,000 $78,000 $78,000 $78,000
30 | 2016 Spring Salary Survey | National Association of Colleges and Employers
STARTING SALARY BY REGION AND MAJOR/BACHELOR’S DEGREES
BACHELOR’S DEGREES/STARTING SALARY BY REGION AND MAJOR
Region/Academic Major # of Salaries Mean 25th
Percentile Median 75th Percentile
NEW ENGLAND REGION
Electrical, Electronics, and Communications Engineering 169 $91,327 $69,833 $101,464 $101,464
Environmental/Environmental Health Engineering 6 $50,950 $50,675 $50,675 $51,500
Materials Engineering 15 $74,740 $74,740 $74,740 $74,740
Mechanical Engineering 148 $66,557 $62,618 $62,618 $76,256
Industrial Engineering 8 $66,375 $66,375 $66,375 $66,375
Mechatronics, Robotics, and Automation Engineering 31 $82,714 $82,714 $82,714 $82,714
Biological/Biosystems Engineering 17 $62,410 $62,410 $62,410 $62,410
FOREIGN LANGUAGES, LITERATURES, AND LINGUISTICS 28 $39,164 $33,236 $37,000 $41,750
Linguistic, Comparative, and Related Language Studies 5 $38,000 $38,500 $38,500 $40,000
Romance Languages 19 $36,741 $33,236 $33,236 $42,500
FAMILY AND CONSUMER SCIENCES/ HUMAN SCIENCES 22 $31,880 $30,183 $30,183 $32,129
Human Development, Family Studies, and Related Services 21 $31,017 $30,183 $30,183 $32,129
ENGLISH LANGUAGE AND LITERATURE/LETTERS 84 $36,873 $32,875 $38,260 $43,157
English Language and Literature/Letters 79 $37,126 $34,700 $38,260 $43,157
Rhetoric and Composition/Writing Studies 5 $32,875 $32,875 $32,875 $32,875
LIBERAL ARTS AND SCIENCES, GENERAL STUDIES, AND HUMANITIES 35 $40,422 $27,498 $37,500 $37,500
Liberal Arts and Sciences, General Studies, and Humanities 35 $40,422 $27,498 $37,500 $37,500
BIOLOGICAL AND BIOMEDICAL SCIENCES 235 $38,233 $34,322 $38,122 $39,861
Biology 145 $38,492 $34,322 $38,122 $39,861
Biochemistry, Biophysics, and Molecular Biology 39 $41,367 $39,144 $40,250 $42,182
Physiology, Pathology, and Related Sciences 16 $31,844 $31,844 $31,844 $31,844
Biomathematics, Bioinformatics, and Computational Biology 5 $56,100 $40,500 $66,500 $66,500
Neurobiology and Neurosciences 27 $33,888 $30,000 $37,747 $37,747
MATHEMATICS AND STATISTICS 96 $69,192 $57,250 $62,400 $91,921
Mathematics 96 $69,192 $57,250 $62,400 $91,921
MULTI/INTERDISCIPLINARY STUDIES 89 $49,231 $42,075 $45,000 $56,060
Peace Studies and Conflict Resolution 3 $38,833 $38,833 $38,833 $38,833
Mathematics and Computer Science 8 $44,062 $37,083 $37,083 $51,042
Biopsychology 3 $53,833 $53,833 $53,833 $53,833

National Association of Colleges and Employers | 2016 Spring Salary Survey | 31
STARTING SALARY BY REGION AND MAJOR/BACHELOR’S DEGREES
BACHELOR’S DEGREES/STARTING SALARY BY REGION AND MAJOR
Region/Academic Major # of Salaries Mean 25th
Percentile Median 75th Percentile
NEW ENGLAND REGION
Natural Sciences 20 $42,075 $42,075 $42,075 $42,075
International/Global Studies 23 $52,748 $56,060 $56,060 $56,060
Cognitive Science 15 $45,479 $42,744 $42,744 $49,581
PARKS, RECREATION, LEISURE, AND FITNESS STUDIES 24 $33,283 $28,750 $29,000 $43,714
Parks, Recreation, and Leisure Studies 4 $28,750 $28,750 $28,750 $28,750
Parks, Recreation, and Leisure Facilities Management 3 $30,400 $25,600 $25,600 $40,000
Health and Physical Education/Fitness 17 $34,859 $29,000 $29,000 $43,714
PHILOSOPHY AND RELIGIOUS STUDIES 16 $39,967 $31,375 $36,823 $40,895
Philosophy 12 $42,373 $30,000 $40,895 $51,948
Religion/Religious Studies 4 $32,750 $32,750 $32,750 $32,750
PHYSICAL SCIENCES 48 $50,206 $39,515 $46,250 $60,000
Chemistry 25 $44,959 $39,515 $40,000 $47,500
Geological and Earth Sciences 4 $42,500 $38,500 $42,500 $46,500
Physics 17 $59,465 $46,250 $54,000 $80,027
PSYCHOLOGY 216 $36,607 $32,541 $36,414 $42,357
Psychology 161 $36,631 $33,563 $36,414 $42,357
Clinical, Counseling, and Applied Psychology 53 $36,407 $31,518 $34,667 $41,946
HOMELAND SECURITY, LAW ENFORCEMENT, FIREFIGHTING, AND RELATED PROTECTIVE SERVICES 30 $44,008 $36,533 $39,917 $56,850
Criminal Justice and Corrections 30 $44,008 $36,533 $39,917 $56,850
PUBLIC ADMINISTRATION AND SOCIAL SERVICE PROFESSIONS 10 $37,545 $34,000 $38,695 $43,390
Social Work 10 $37,545 $34,000 $38,695 $43,390
SOCIAL SCIENCES 233 $42,831 $38,700 $44,200 $46,700
Criminology 5 $33,440 $33,440 $33,440 $33,440
Economics 9 $43,556 $43,556 $43,556 $43,556
International Relations and National Security Studies 81 $44,418 $39,474 $46,700 $46,700
Political Science and Government 82 $44,480 $35,453 $49,911 $49,911
Sociology 42 $38,291 $35,033 $42,083 $44,200
Sociology and Anthropology 4 $45,750 $45,750 $45,750 $45,750
TRANSPORTATION AND MATERIALS MOVING 16 $77,081 $77,081 $77,081 $77,081
Air Transportation 16 $77,081 $77,081 $77,081 $77,081
VISUAL AND PERFORMING ARTS 78 $43,196 $35,404 $38,825 $50,000
Design and Applied Arts 43 $45,371 $35,404 $40,714 $65,542
Drama/Theatre Arts and Stagecraft 4 $39,625 $19,000 $39,625 $60,250
32 | 2016 Spring Salary Survey | National Association of Colleges and Employers
STARTING SALARY BY REGION AND MAJOR/BACHELOR’S DEGREES
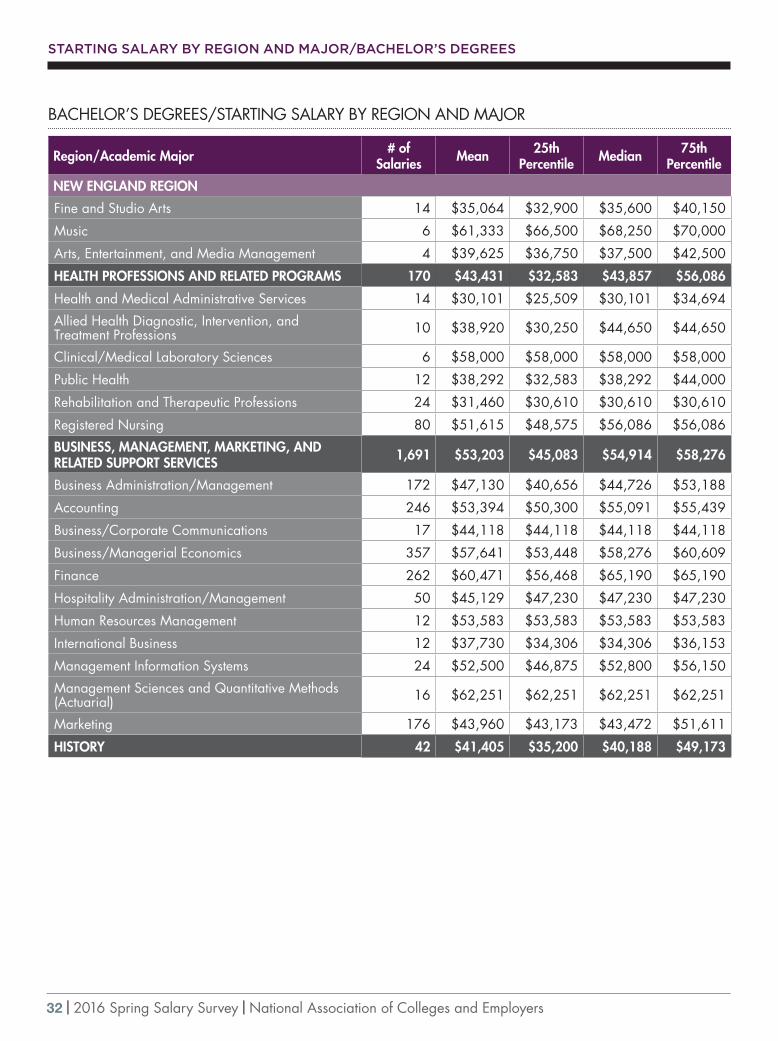
BACHELOR’S DEGREES/STARTING SALARY BY REGION AND MAJOR
Region/Academic Major # of Salaries Mean 25th
Percentile Median 75th Percentile
NEW ENGLAND REGION
Fine and Studio Arts 14 $35,064 $32,900 $35,600 $40,150
Music 6 $61,333 $66,500 $68,250 $70,000
Arts, Entertainment, and Media Management 4 $39,625 $36,750 $37,500 $42,500
HEALTH PROFESSIONS AND RELATED PROGRAMS 170 $43,431 $32,583 $43,857 $56,086
Health and Medical Administrative Services 14 $30,101 $25,509 $30,101 $34,694
Allied Health Diagnostic, Intervention, and Treatment Professions 10 $38,920 $30,250 $44,650 $44,650
Clinical/Medical Laboratory Sciences 6 $58,000 $58,000 $58,000 $58,000
Public Health 12 $38,292 $32,583 $38,292 $44,000
Rehabilitation and Therapeutic Professions 24 $31,460 $30,610 $30,610 $30,610
Registered Nursing 80 $51,615 $48,575 $56,086 $56,086
BUSINESS, MANAGEMENT, MARKETING, AND RELATED SUPPORT SERVICES 1,691 $53,203 $45,083 $54,914 $58,276
Business Administration/Management 172 $47,130 $40,656 $44,726 $53,188
Accounting 246 $53,394 $50,300 $55,091 $55,439
Business/Corporate Communications 17 $44,118 $44,118 $44,118 $44,118
Business/Managerial Economics 357 $57,641 $53,448 $58,276 $60,609
Finance 262 $60,471 $56,468 $65,190 $65,190
Hospitality Administration/Management 50 $45,129 $47,230 $47,230 $47,230
Human Resources Management 12 $53,583 $53,583 $53,583 $53,583
International Business 12 $37,730 $34,306 $34,306 $36,153
Management Information Systems 24 $52,500 $46,875 $52,800 $56,150
Management Sciences and Quantitative Methods (Actuarial) 16 $62,251 $62,251 $62,251 $62,251
Marketing 176 $43,960 $43,173 $43,472 $51,611
HISTORY 42 $41,405 $35,200 $40,188 $49,173

National Association of Colleges and Employers | 2016 Spring Salary Survey | 33
STARTING SALARY BY REGION AND MAJOR/BACHELOR’S DEGREES
BACHELOR’S DEGREES/STARTING SALARY BY REGION AND MAJOR
Region/Academic Major # of Salaries Mean 25th
Percentile Median 75th Percentile
MID-ATLANTIC REGION
AGRICULTURE 52 $34,511 $24,500 $32,500 $43,500
Agricultural Business and Management 3 $43,333 $40,000 $45,000 $45,000Animal Sciences 23 $23,694 $22,051 $24,500 $24,500Food Science and Technology 9 $46,097 $38,468 $52,200 $52,200Plant Sciences 9 $40,667 $32,500 $45,333 $45,333NATURAL RESOURCES 141 $37,923 $32,500 $38,571 $39,825
Natural Resources Conservation and Research 139 $37,713 $32,500 $38,000 $39,825ARCHITECTURE AND RELATED SERVICES 73 $42,127 $38,622 $42,500 $46,667
Architecture 60 $41,496 $38,622 $38,622 $49,057City/Urban, Community, and Regional Planning 8 $45,625 $44,583 $46,667 $46,667Landscape Architecture 5 $44,100 $42,500 $45,000 $46,000AREA, ETHNIC, CULTURAL, GENDER, AND GROUP STUDIES 151 $40,364 $34,960 $40,813 $44,955
Area Studies 119 $40,763 $37,000 $41,000 $44,955Ethnic, Cultural Minority, Gender, and Group Studies 32 $38,883 $28,000 $40,540 $43,250
COMMUNICATION, JOURNALISM, AND RELATED PROGRAMS 791 $38,166 $36,500 $38,432 $40,588
Communication and Media Studies 485 $39,561 $37,833 $40,295 $42,323Journalism 176 $34,201 $28,750 $35,000 $36,763Radio, Television, and Digital Communication 22 $36,060 $32,929 $32,929 $35,000Public Relations, Advertising, and Applied Communication 108 $38,792 $37,306 $37,500 $39,158
COMMUNICATIONS TECHNOLOGIES/ TECHNICIANS AND SUPPORT SERVICES 5 $50,400 $36,667 $36,667 $71,000
Graphic Communications 3 $36,667 $36,667 $36,667 $36,667COMPUTER AND INFORMATION SCIENCES AND SUPPORT SERVICES 700 $78,040 $65,000 $77,467 $94,932
Computer and Information Sciences 81 $63,706 $55,535 $58,331 $72,614Information Science 46 $61,819 $53,166 $60,000 $65,000Computer Science 539 $82,789 $72,375 $81,250 $103,608Computer Software and Media Applications 4 $25,757 $25,757 $25,757 $25,757Computer/Information Technology Administration and Management 30 $63,263 $60,000 $62,571 $70,390
EDUCATION 280 $41,078 $35,100 $42,500 $46,428
Education Administration and Supervision 5 $64,300 $61,625 $61,625 $61,625Special Education and Teaching 15 $43,685 $44,472 $44,472 $47,500Teacher Education, Specific Levels and Methods 155 $38,720 $34,397 $41,785 $43,797Teacher Education, Specific Subject Areas 95 $44,037 $40,402 $45,313 $47,500

34 | 2016 Spring Salary Survey | National Association of Colleges and Employers
STARTING SALARY BY REGION AND MAJOR/BACHELOR’S DEGREES
BACHELOR’S DEGREES/STARTING SALARY BY REGION AND MAJOR
Region/Academic Major # of Salaries Mean 25th
Percentile Median 75th Percentile
MID-ATLANTIC REGION
ENGINEERING 2,226 $67,533 $60,676 $64,687 $72,597
Aerospace, Aeronautical, and Astronautical Engineering 27 $64,687 $64,687 $64,687 $64,687
Biomedical/Medical Engineering 105 $61,096 $60,194 $63,580 $63,580
Chemical Engineering 253 $65,146 $63,763 $65,796 $66,543
Civil Engineering 279 $57,232 $54,721 $56,258 $57,650
Computer Engineering 147 $76,483 $72,597 $79,478 $79,478
Electrical, Electronics, and Communications Engineering 313 $71,544 $64,727 $66,623 $70,770
Engineering Mechanics 7 $57,994 $56,743 $56,743 $56,743
Engineering Physics 8 $54,938 $46,250 $54,875 $63,625
Engineering Science 17 $58,206 $57,917 $58,364 $58,364
Environmental/Environmental Health Engineering 29 $52,134 $52,324 $55,040 $55,196
Materials Engineering 42 $60,286 $51,559 $59,945 $67,500
Mechanical Engineering 489 $62,454 $61,933 $62,770 $64,524
Systems Engineering 6 $66,250 $68,500 $68,500 $68,500
Industrial Engineering 59 $62,117 $60,676 $62,676 $62,676
Operations Research 28 $73,339 $67,885 $76,900 $76,900
Geological/Geophysical Engineering 6 $61,667 $61,667 $61,667 $61,667
ENGINEERING TECHNOLOGIES 161 $57,238 $56,980 $56,980 $57,500
Civil Engineering Technologies 20 $48,714 $48,267 $48,267 $48,267
Electrical Engineering Technologies 21 $63,471 $61,363 $63,818 $63,818
Industrial Production Technologies 3 $57,967 $57,967 $57,967 $57,967
Mechanical Engineering Related Technologies 84 $57,531 $56,980 $56,980 $56,980
Engineering-Related Fields 24 $57,213 $57,213 $57,213 $57,213
FOREIGN LANGUAGES, LITERATURES, AND LINGUISTICS 130 $41,298 $32,500 $41,667 $46,000
Linguistic, Comparative, and Related Language Studies 38 $37,408 $32,500 $35,044 $41,667
East Asian Languages 17 $48,926 $37,500 $48,333 $56,250
Slavic, Baltic, and Albanian Languages 5 $44,200 $42,667 $42,667 $43,000
Romance Languages 61 $40,386 $32,500 $43,500 $45,600
Classics and Classical Languages 8 $46,625 $38,500 $52,875 $54,250
FAMILY AND CONSUMER SCIENCES/ HUMAN SCIENCES 96 $36,413 $33,500 $33,500 $38,421
Family and Consumer Sciences/Human Sciences 31 $33,500 $33,500 $33,500 $33,500

National Association of Colleges and Employers | 2016 Spring Salary Survey | 35
STARTING SALARY BY REGION AND MAJOR/BACHELOR’S DEGREES
BACHELOR’S DEGREES/STARTING SALARY BY REGION AND MAJOR
Region/Academic Major # of Salaries Mean 25th
Percentile Median 75th Percentile
MID-ATLANTIC REGION
Family and Consumer Sciences/ Human Sciences Business Services 5 $48,800 $48,800 $48,800 $48,800
Foods, Nutrition, and Related Services 21 $39,696 $35,000 $35,000 $44,268
Human Development, Family Studies, and Related Services 16 $31,315 $27,965 $27,965 $27,965
Apparel and Textiles 23 $38,196 $38,421 $38,421 $38,421
ENGLISH LANGUAGE AND LITERATURE/LETTERS 257 $38,411 $33,750 $37,917 $43,448
Rhetoric and Composition/Writing Studies 21 $43,107 $40,165 $40,165 $42,267
Literature 10 $27,100 $26,667 $26,667 $27,750
LIBERAL ARTS AND SCIENCES, GENERAL STUDIES, AND HUMANITIES 1,218 $56,599 $58,064 $58,064 $58,064
Liberal Arts and Sciences, General Studies, and Humanities 1,218 $56,599 $58,064 $58,064 $58,064
BIOLOGICAL AND BIOMEDICAL SCIENCES 461 $34,698 $29,057 $34,125 $37,500
Biology 273 $32,978 $27,692 $32,500 $35,000
Biochemistry, Biophysics, and Molecular Biology 78 $37,571 $33,685 $36,500 $40,000
Cell/Cellular Biology 8 $33,375 $33,375 $33,375 $33,375
Physiology, Pathology, and Related Sciences 4 $32,938 $32,938 $32,938 $32,938
Ecology 12 $35,345 $28,834 $33,584 $44,750
Neurobiology and Neurosciences 84 $37,574 $32,500 $37,500 $42,182
MATHEMATICS AND STATISTICS 273 $64,059 $54,950 $66,375 $70,833
Mathematics 173 $60,712 $51,750 $65,938 $70,833
Applied Mathematics 65 $72,888 $64,000 $70,333 $89,172
Statistics 35 $64,209 $55,667 $57,500 $76,000
MULTI/INTERDISCIPLINARY STUDIES 283 $48,187 $46,250 $46,722 $55,802
Science, Technology, and Society 33 $55,440 $57,962 $57,962 $57,962
Natural Sciences 4 $30,275 $28,700 $29,950 $31,850
International/Global Studies 64 $48,646 $43,653 $52,000 $55,802
Intercultural/Multicultural and Diversity Studies 9 $53,921 $53,921 $53,921 $53,921
Cognitive Science 3 $38,000 $32,000 $40,000 $42,000
Cultural Studies 10 $37,200 $31,333 $41,000 $41,000
Marine Sciences 10 $29,500 $28,750 $28,750 $28,750
Sustainability Studies 13 $53,285 $48,000 $58,525 $58,525
PARKS, RECREATION, LEISURE, AND FITNESS STUDIES 120 $36,083 $30,833 $35,000 $40,000
Parks, Recreation, and Leisure Studies 6 $35,000 $35,000 $35,000 $35,000
Parks, Recreation, and Leisure Facilities Management 17 $46,400 $40,000 $50,045 $50,045

36 | 2016 Spring Salary Survey | National Association of Colleges and Employers
STARTING SALARY BY REGION AND MAJOR/BACHELOR’S DEGREES
BACHELOR’S DEGREES/STARTING SALARY BY REGION AND MAJOR
Region/Academic Major # of Salaries Mean 25th
Percentile Median 75th Percentile
MID-ATLANTIC REGION
Health and Physical Education/Fitness 96 $34,575 $30,833 $32,500 $38,313
PHILOSOPHY AND RELIGIOUS STUDIES 57 $46,659 $32,500 $42,155 $53,333
Philosophy 47 $48,182 $32,500 $46,000 $66,429
Religion/Religious Studies 9 $38,333 $35,000 $38,000 $43,500
THEOLOGY AND RELIGIOUS VOCATIONS 5 $42,020 $43,025 $43,025 $43,025
Theological and Ministerial Studies 5 $42,020 $43,025 $43,025 $43,025
PHYSICAL SCIENCES 143 $49,553 $36,333 $46,000 $61,750
Physical Sciences 3 $31,960 $31,960 $31,960 $31,960
Astronomy and Astrophysics 7 $69,057 $67,500 $67,500 $69,000
Chemistry 65 $45,292 $36,333 $43,333 $52,120
Geological and Earth Sciences 23 $36,154 $24,750 $33,500 $45,750
Physics 36 $64,424 $52,833 $70,000 $78,654
PSYCHOLOGY 520 $38,709 $34,079 $36,625 $41,806
Psychology 488 $38,803 $34,079 $36,625 $44,795
Clinical, Counseling, and Applied Psychology 30 $36,759 $32,326 $41,267 $41,533
HOMELAND SECURITY, LAW ENFORCEMENT, FIREFIGHTING, AND RELATED PROTECTIVE SERVICES 114 $40,098 $32,500 $35,192 $40,271
Criminal Justice and Corrections 113 $40,099 $32,500 $35,192 $40,271
PUBLIC ADMINISTRATION AND SOCIAL SERVICE PROFESSIONS 158 $44,887 $33,500 $44,400 $49,997
Public Policy Analysis 92 $50,727 $45,300 $49,997 $49,997
Social Work 46 $37,337 $32,500 $33,125 $39,688
SOCIAL SCIENCES 1,142 $44,511 $38,050 $42,500 $50,875
Social Sciences 26 $65,462 $60,000 $68,353 $68,353
Anthropology 55 $35,185 $29,900 $37,268 $38,636
Criminology 65 $35,849 $35,833 $35,833 $35,833
Economics 124 $55,140 $53,670 $56,850 $56,850
Geography 29 $40,923 $39,752 $42,500 $42,500
International Relations and National Security Studies 158 $45,796 $45,226 $45,226 $45,226
Political Science and Government 504 $44,965 $41,250 $41,785 $50,875
Sociology 120 $38,343 $34,400 $38,064 $39,308
Urban Studies/Affairs 8 $40,850 $40,850 $40,850 $40,850
VISUAL AND PERFORMING ARTS 636 $42,350 $32,500 $39,638 $46,111
Visual and Performing Arts 31 $38,291 $39,410 $39,410 $39,410
Dance 17 $31,449 $25,000 $29,583 $33,000
Design and Applied Arts 196 $50,491 $36,287 $44,000 $65,972

National Association of Colleges and Employers | 2016 Spring Salary Survey | 37
STARTING SALARY BY REGION AND MAJOR/BACHELOR’S DEGREES
BACHELOR’S DEGREES/STARTING SALARY BY REGION AND MAJOR
Region/Academic Major # of Salaries Mean 25th
Percentile Median 75th Percentile
MID-ATLANTIC REGION
Drama/Theatre Arts 40 $37,726 $37,118 $39,137 $39,853
Film/Video and Photographic Arts 108 $36,451 $30,900 $37,952 $37,952
Fine and Studio Arts 92 $41,013 $29,438 $43,750 $46,111
Music 53 $42,034 $32,750 $48,000 $50,056
Arts, Entertainment, and Media Management 89 $38,905 $32,000 $40,250 $43,652
HEALTH PROFESSIONS AND RELATED PROGRAMS 1,100 $58,237 $46,500 $57,830 $65,072
Communication Disorders Sciences 12 $34,125 $31,250 $36,750 $40,200
Health and Medical Administrative Services 37 $50,516 $41,850 $52,500 $52,500
Allied Health and Medical Assisting Services 5 $87,971 $87,971 $87,971 $87,971
Allied Health Diagnostic, Intervention, and Treatment Professions 14 $53,500 $37,999 $66,000 $67,400
Clinical/Medical Laboratory Sciences 14 $56,079 $52,000 $52,000 $61,517
Public Health 129 $42,730 $39,000 $39,000 $46,529
Medical Illustration and Informatics 4 $61,500 $61,500 $61,500 $61,500
Dietetics and Clinical Nutrition Services 9 $27,933 $25,225 $30,100 $30,100
Registered Nursing 837 $62,516 $54,130 $60,982 $73,417
BUSINESS, MANAGEMENT, MARKETING, AND RELATED SUPPORT SERVICES 5,501 $58,259 $51,250 $57,739 $65,406
Business Administration/Management 1,112 $57,594 $48,086 $57,105 $71,091
Logistics, Materials, and Supply Chain Management 175 $56,898 $57,105 $57,105 $58,341
Accounting 957 $56,411 $52,750 $56,622 $57,739
Business/Managerial Economics 731 $58,031 $51,250 $59,968 $65,406
Entrepreneurial and Small Business Operations 31 $46,112 $42,777 $42,777 $47,500
Finance 1,045 $61,708 $57,541 $60,400 $64,728
Hospitality Administration/Management 105 $40,692 $36,875 $40,792 $43,810
Human Resources Management 105 $44,253 $42,236 $42,236 $47,500
International Business 126 $53,221 $50,000 $51,560 $64,484
Management Information Systems 217 $66,354 $61,042 $65,000 $65,000
Management Sciences and Quantitative Methods (Actuarial) 31 $60,774 $58,125 $62,500 $62,500
Marketing 463 $47,029 $42,400 $47,970 $51,146
Real Estate 13 $44,038 $39,166 $39,166 $50,000
Insurance 32 $52,500 $52,500 $52,500 $52,500
Specialized Sales and Merchandising 23 $41,739 $41,429 $41,429 $42,222
Construction Management 6 $56,667 $45,000 $56,667 $68,333
HISTORY 152 $40,553 $37,357 $40,945 $42,858

38 | 2016 Spring Salary Survey | National Association of Colleges and Employers
STARTING SALARY BY REGION AND MAJOR/BACHELOR’S DEGREES
BACHELOR’S DEGREES/STARTING SALARY BY REGION AND MAJOR
Region/Academic Major # of Salaries Mean 25th
Percentile Median 75th Percentile
SOUTHEAST REGION
AGRICULTURE 239 $26,083 $17,167 $29,833 $33,213
Agricultural Business and Management 120 $33,010 $32,549 $33,213 $33,213
Applied Horticulture 19 $22,927 $10,803 $30,000 $30,000
Agricultural Public Services 5 $17,167 $17,167 $17,167 $17,167
Animal Sciences 42 $11,218 $10,875 $10,875 $10,875
Food Science and Technology 25 $25,964 $20,955 $20,955 $20,955
Plant Science 27 $21,703 $15,167 $24,395 $24,395
NATURAL RESOURCES 57 $28,172 $22,699 $30,000 $33,450
Natural Resources Conservation and Research 49 $28,805 $26,240 $30,000 $33,450
Fishing and Fisheries Sciences 6 $21,733 $19,800 $22,699 $22,699
ARCHITECTURE AND RELATED SERVICES 44 $35,060 $19,009 $41,785 $41,785
Architecture 30 $41,685 $41,785 $41,785 $41,785
Landscape Architecture 14 $20,866 $19,009 $19,009 $19,009
AREA, ETHNIC, CULTURAL, GENDER, AND GROUP STUDIES 20 $45,062 $29,563 $38,250 $47,500
Area Studies 13 $37,288 $32,125 $38,500 $45,000
Ethnic, Cultural Minority, Gender, and Group Studies 7 $59,500 $18,000 $38,000 $103,333
COMMUNICATION, JOURNALISM, AND RELATED PROGRAMS 510 $35,969 $31,750 $37,404 $38,000
Communication and Media Studies 159 $35,416 $29,250 $34,667 $38,824
Journalism 86 $38,961 $29,556 $46,876 $46,876
Radio, Television, and Digital Communication 22 $31,456 $30,940 $31,000 $31,000
Public Relations, Advertising, and Applied Communication 219 $35,590 $36,000 $37,570 $37,696
COMMUNICATIONS TECHNOLOGIES/ TECHNICIANS AND SUPPORT SERVICES 13 $45,461 $50,000 $50,000 $50,000
Communications Technology/Technician 10 $50,000 $50,000 $50,000 $50,000
Graphic Communications 3 $30,333 $30,333 $30,333 $30,333
COMPUTER AND INFORMATION SCIENCES AND SUPPORT SERVICES 567 $56,125 $48,546 $53,700 $67,880
Computer and Information Sciences 61 $54,401 $49,636 $55,750 $63,317
Computer Programming 10 $52,000 $52,000 $52,000 $52,000
Information Science 7 $45,428 $35,750 $35,750 $58,333
Computer Science 283 $63,589 $54,664 $67,500 $67,880
Computer Software and Media Applications 34 $22,449 $18,438 $18,438 $18,438
Computer Systems Networking and Telecommunications 54 $46,635 $46,510 $46,510 $46,818

National Association of Colleges and Employers | 2016 Spring Salary Survey | 39
STARTING SALARY BY REGION AND MAJOR/BACHELOR’S DEGREES
BACHELOR’S DEGREES/STARTING SALARY BY REGION AND MAJOR
Region/Academic Major # of Salaries Mean 25th
Percentile Median 75th Percentile
SOUTHEAST REGION
Computer/Information Technology Administration and Management 103 $51,339 $50,167 $50,167 $52,000
EDUCATION 710 $34,311 $32,000 $34,258 $39,800
Education Administration and Supervision 15 $42,800 $41,545 $41,545 $46,250
Special Education and Teaching 73 $33,517 $31,004 $33,788 $38,000
Teacher Education, Specific Levels and Methods 282 $32,205 $32,000 $33,409 $35,637
Teacher Education, Specific Subject Areas 178 $32,159 $25,737 $34,240 $36,489
ENGINEERING 2,466 $54,783 $40,723 $59,349 $63,899
Aerospace Engineering 80 $33,777 $24,920 $24,920 $32,460
Agricultural Engineering 19 $49,165 $40,000 $40,000 $59,349
Architectural Engineering 4 $55,000 $55,000 $55,000 $55,000
Biomedical/Medical Engineering 145 $53,489 $51,685 $55,608 $60,000
Chemical Engineering 353 $62,476 $63,064 $67,500 $67,986
Civil Engineering 236 $50,197 $51,379 $53,798 $56,344
Computer Engineering 166 $59,315 $56,036 $61,000 $73,387
Electrical, Electronics, and Communications Engineering 279 $55,474 $57,500 $63,111 $66,231
Engineering Physcis 11 $51,307 $36,666 $60,000 $61,795
Environmental/Environmental Health Engineering 38 $40,351 $27,857 $50,374 $52,300
Materials Engineering 49 $47,935 $28,587 $57,500 $63,390
Mechanical Engineering 731 $56,703 $56,384 $59,497 $63,369
Nuclear Engineering 4 $26,500 $26,500 $26,500 $26,500
Systems Engineering 3 $62,500 $62,500 $62,500 $62,500
Polymer/Plastics Engineering 14 $61,893 $59,000 $59,000 $59,000
Construction Engineering 20 $55,401 $53,547 $53,547 $58,843
Industrial Engineering 192 $50,717 $37,048 $57,000 $62,818
Manufacturing Engineering 27 $54,741 $55,000 $55,000 $55,000
ENGINEERING TECHNOLOGIES 441 $49,162 $42,500 $51,963 $55,338
Electrical Engineering Technologies 90 $49,152 $44,203 $44,203 $55,338
Industrial Production Technologies 46 $49,615 $35,045 $52,200 $63,585
Mechanical Engineering Related Technologies 174 $46,714 $40,313 $50,815 $53,589
Construction Engineering Technologies 22 $46,108 $46,969 $46,969 $46,969
Computer Engineering Technologies 4 $42,500 $42,500 $42,500 $42,500

40 | 2016 Spring Salary Survey | National Association of Colleges and Employers
STARTING SALARY BY REGION AND MAJOR/BACHELOR’S DEGREES
BACHELOR’S DEGREES/STARTING SALARY BY REGION AND MAJOR
Region/Academic Major # of Salaries Mean 25th
Percentile Median 75th Percentile
SOUTHEAST REGION
Engineering-Related Fields 48 $57,182 $54,649 $60,000 $60,000
FOREIGN LANGUAGES, LITERATURES, AND LINGUISTICS 48 $31,247 $20,667 $34,500 $38,167
Germanic Languages 3 $17,773 $11,360 $11,360 $30,600
Romance Languages 30 $31,303 $17,250 $34,500 $34,840
FAMILY AND CONSUMER SCIENCES/ HUMAN SCIENCES 114 $30,018 $28,000 $29,000 $29,663
Family and Consumer Sciences/Human Sciences 14 $28,178 $26,545 $26,545 $26,545
Foods, Nutrition, and Related Services 10 $32,116 $34,018 $34,018 $34,018
Housing and Human Environments 4 $35,000 $35,000 $35,000 $35,000
Human Development, Family Studies, and Related Services 65 $29,961 $28,000 $29,000 $29,000
Apparel and Textiles 20 $29,848 $29,663 $29,663 $30,132
ENGLISH LANGUAGE AND LITERATURE/LETTERS 102 $34,076 $29,285 $34,720 $37,159
English Language and Literature/Letters 79 $35,102 $30,800 $34,720 $37,159
Rhetoric and Composition/Writing Studies 23 $30,551 $25,468 $27,500 $35,583
LIBERAL ARTS AND SCIENCES, GENERAL STUDIES, AND HUMANITIES 107 $35,823 $31,694 $36,747 $40,224
Liberal Arts and Sciences, General Studies, and Humanities 107 $35,823 $31,694 $36,747 $40,224
BIOLOGICAL AND BIOMEDICAL SCIENCES 147 $32,164 $27,290 $31,090 $37,500
Biology 123 $33,454 $27,500 $31,090 $40,750
Biochemistry, Biophysics, and Molecular Biology 17 $25,304 $24,167 $27,500 $27,500
Physiology, Pathology, and Related Sciences 3 $33,933 $20,800 $40,500 $40,500
MATHEMATICS AND STATISTICS 115 $48,201 $44,546 $50,267 $59,257
Mathematics 101 $48,338 $44,546 $50,267 $57,000
Applied Mathematics 6 $39,917 $23,000 $44,250 $52,500
Statistics 8 $52,688 $43,000 $62,000 $62,500
MULTI/INTERDISCIPLINARY STUDIES 292 $57,146 $39,653 $61,000 $75,281
Peace Studies and Conflict Resolution 4 $35,125 $35,125 $35,125 $35,125
Mathematics and Computer Science 45 $55,733 $53,500 $53,500 $61,000
Behavioral Sciences 3 $32,800 $31,700 $31,700 $35,000
Natural Sciences 4 $36,000 $34,667 $34,667 $37,333
International/Global Studies 23 $33,858 $32,543 $32,543 $35,000
Cognitive Science 17 $43,271 $30,000 $53,511 $53,511
PARKS, RECREATION, LEISURE, AND FITNESS STUDIES 108 $30,741 $28,579 $30,240 $34,281

National Association of Colleges and Employers | 2016 Spring Salary Survey | 41
STARTING SALARY BY REGION AND MAJOR/BACHELOR’S DEGREES
BACHELOR’S DEGREES/STARTING SALARY BY REGION AND MAJOR
Region/Academic Major # of Salaries Mean 25th
Percentile Median 75th Percentile
SOUTHEAST REGION
Parks, Recreation, and Leisure Studies 3 $19,667 $19,667 $19,667 $19,667
Parks, Recreation, and Leisure Facilities Management 18 $31,940 $30,000 $32,965 $35,689
Health and Physical Education/Fitness 86 $31,117 $28,579 $31,000 $34,281
PHILOSOPHY AND RELIGIOUS STUDIES 25 $33,593 $24,726 $36,716 $41,667
Philosophy 15 $35,606 $24,726 $40,500 $45,000
Religion/Religious Studies 10 $30,573 $20,800 $28,355 $38,000
THEOLOGY AND RELIGIOUS VOCATIONS 15 $25,942 $12,142 $12,142 $49,250
Pastoral Counseling and Specialized Ministries 13 $25,703 $12,142 $12,142 $49,250
PHYSICAL SCIENCES 76 $35,220 $28,333 $34,840 $43,180
Chemistry 52 $32,838 $28,333 $33,913 $43,180
Geological and Earth Sciences 13 $33,769 $35,000 $37,214 $37,214
Physics 10 $50,712 $36,000 $61,000 $70,000
PSYCHOLOGY 221 $31,304 $27,700 $29,151 $36,808
Psychology 220 $30,901 $27,700 $29,151 $36,808
HOMELAND SECURITY, LAW ENFORCEMENT, FIREFIGHTING, AND RELATED PROTECTIVE SERVICES 96 $32,805 $30,579 $35,542 $37,688
Criminal Justice and Corrections 80 $31,828 $30,579 $33,341 $35,542
Fire Protection 16 $37,688 $37,688 $37,688 $37,688
PUBLIC ADMINISTRATION AND SOCIAL SERVICE PROFESSIONS 145 $31,372 $28,760 $32,500 $32,639
Social Work 124 $31,651 $28,546 $32,500 $32,639
SOCIAL SCIENCES 315 $37,249 $30,833 $36,059 $40,747
Anthropology 24 $34,417 $29,700 $32,500 $32,500
Criminology 66 $33,348 $28,527 $28,527 $38,333
Economics 14 $50,029 $47,378 $47,378 $54,800
Geography 8 $36,938 $33,750 $33,750 $44,167
Political Science and Government 113 $40,747 $36,059 $40,464 $42,728
Sociology 68 $33,004 $29,583 $33,115 $35,750
VISUAL AND PERFORMING ARTS 401 $34,409 $28,000 $36,346 $40,951
Visual and Performing Arts 5 $32,831 $32,053 $36,700 $36,700
Design and Applied Arts 150 $33,598 $29,120 $36,346 $40,000
Drama/Theatre Arts 10 $24,474 $19,260 $25,760 $29,000
Film/Video and Photographic Arts 38 $30,322 $22,793 $35,333 $35,892
Fine and Studio Arts 147 $37,605 $35,000 $40,951 $40,951
Music 23 $41,573 $24,000 $39,000 $56,500
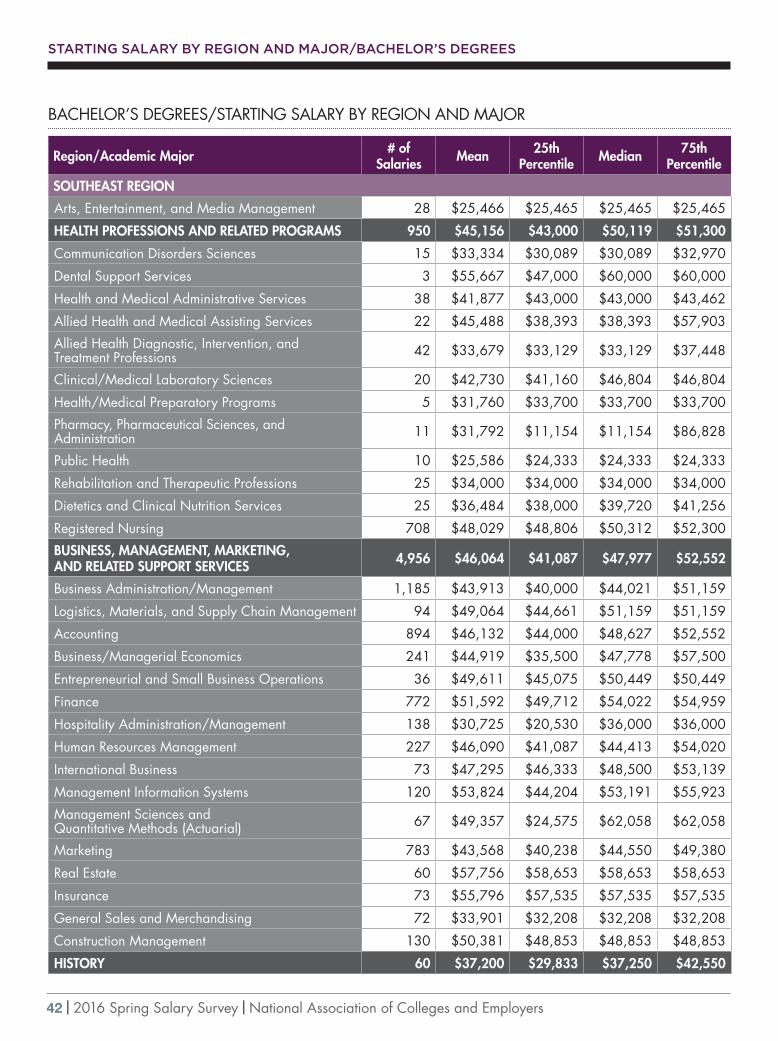
42 | 2016 Spring Salary Survey | National Association of Colleges and Employers
STARTING SALARY BY REGION AND MAJOR/BACHELOR’S DEGREES
BACHELOR’S DEGREES/STARTING SALARY BY REGION AND MAJOR
Region/Academic Major # of Salaries Mean 25th
Percentile Median 75th Percentile
SOUTHEAST REGION
Arts, Entertainment, and Media Management 28 $25,466 $25,465 $25,465 $25,465
HEALTH PROFESSIONS AND RELATED PROGRAMS 950 $45,156 $43,000 $50,119 $51,300
Communication Disorders Sciences 15 $33,334 $30,089 $30,089 $32,970
Dental Support Services 3 $55,667 $47,000 $60,000 $60,000
Health and Medical Administrative Services 38 $41,877 $43,000 $43,000 $43,462
Allied Health and Medical Assisting Services 22 $45,488 $38,393 $38,393 $57,903
Allied Health Diagnostic, Intervention, and Treatment Professions 42 $33,679 $33,129 $33,129 $37,448
Clinical/Medical Laboratory Sciences 20 $42,730 $41,160 $46,804 $46,804
Health/Medical Preparatory Programs 5 $31,760 $33,700 $33,700 $33,700
Pharmacy, Pharmaceutical Sciences, and Administration 11 $31,792 $11,154 $11,154 $86,828
Public Health 10 $25,586 $24,333 $24,333 $24,333
Rehabilitation and Therapeutic Professions 25 $34,000 $34,000 $34,000 $34,000
Dietetics and Clinical Nutrition Services 25 $36,484 $38,000 $39,720 $41,256
Registered Nursing 708 $48,029 $48,806 $50,312 $52,300
BUSINESS, MANAGEMENT, MARKETING, AND RELATED SUPPORT SERVICES 4,956 $46,064 $41,087 $47,977 $52,552
Business Administration/Management 1,185 $43,913 $40,000 $44,021 $51,159
Logistics, Materials, and Supply Chain Management 94 $49,064 $44,661 $51,159 $51,159
Accounting 894 $46,132 $44,000 $48,627 $52,552
Business/Managerial Economics 241 $44,919 $35,500 $47,778 $57,500
Entrepreneurial and Small Business Operations 36 $49,611 $45,075 $50,449 $50,449
Finance 772 $51,592 $49,712 $54,022 $54,959
Hospitality Administration/Management 138 $30,725 $20,530 $36,000 $36,000
Human Resources Management 227 $46,090 $41,087 $44,413 $54,020
International Business 73 $47,295 $46,333 $48,500 $53,139
Management Information Systems 120 $53,824 $44,204 $53,191 $55,923
Management Sciences and Quantitative Methods (Actuarial) 67 $49,357 $24,575 $62,058 $62,058
Marketing 783 $43,568 $40,238 $44,550 $49,380
Real Estate 60 $57,756 $58,653 $58,653 $58,653
Insurance 73 $55,796 $57,535 $57,535 $57,535
General Sales and Merchandising 72 $33,901 $32,208 $32,208 $32,208
Construction Management 130 $50,381 $48,853 $48,853 $48,853
HISTORY 60 $37,200 $29,833 $37,250 $42,550

National Association of Colleges and Employers | 2016 Spring Salary Survey | 43
STARTING SALARY BY REGION AND MAJOR/BACHELOR’S DEGREES
BACHELOR’S DEGREES/STARTING SALARY BY REGION AND MAJOR
Region/Academic Major # of Salaries Mean 25th
Percentile Median 75th Percentile
GREAT LAKES REGION
AGRICULTURE 79 $43,398 $37,923 $47,250 $47,250
Agricultural Business and Management 47 $45,851 $47,250 $47,250 $47,786
Agricultural Public Services 5 $42,600 $42,600 $42,600 $42,600
Animal Sciences 14 $37,923 $37,923 $37,923 $37,923
Plant Science 7 $38,571 $38,571 $38,571 $38,571
NATURAL RESOURCES 25 $32,052 $29,000 $31,155 $34,370
Natural Resources Conservation and Research 15 $35,553 $34,370 $34,370 $34,370
Fishing and Fisheries Sciences 4 $23,250 $23,250 $23,250 $23,250
Forestry 5 $29,000 $29,000 $29,000 $29,000
AREA, ETHNIC, CULTURAL, GENDER, AND GROUP STUDIES 12 $32,953 $28,500 $37,510 $37,580
Area Studies 8 $36,543 $37,510 $37,580 $37,580
Ethnic, Cultural Minority, Gender, and Group Studies 4 $25,775 $19,050 $28,000 $32,500
COMMUNICATION, JOURNALISM, AND RELATED PROGRAMS 183 $34,993 $32,500 $33,364 $37,544
Communication and Media Studies 142 $35,586 $32,500 $37,171 $37,544
Journalism 35 $32,774 $33,065 $33,065 $33,065
Public Relations, Advertising, and Applied Communication 6 $33,917 $28,800 $28,800 $28,800
COMPUTER AND INFORMATION SCIENCES AND SUPPORT SERVICES 217 $68,730 $57,688 $70,441 $76,582
Computer and Information Sciences 16 $57,287 $54,317 $58,636 $58,636
Information Science 21 $53,671 $55,172 $55,172 $55,172
Computer Science 170 $71,770 $70,441 $76,582 $76,582
Computer/Information Technology Administration and Management 10 $66,982 $57,353 $65,206 $70,000
EDUCATION 274 $34,168 $33,047 $34,047 $36,250
Special Education and Teaching 17 $36,931 $32,821 $32,821 $38,866
Teacher Education, Specific Levels and Methods 115 $33,356 $32,502 $34,448 $36,693
Teacher Education, Specific Subject Areas 74 $35,674 $32,837 $34,800 $40,723
ENGINEERING 1,059 $62,208 $59,600 $62,476 $65,500
Aerospace Engineering 38 $61,295 $60,967 $60,967 $61,798
Architectural Engineering 31 $56,187 $56,187 $56,187 $56,187
Biomedical/Medical Engineering 59 $58,343 $54,496 $61,173 $61,173
Ceramic Sciences and Engineering 5 $61,200 $61,200 $61,200 $61,200
Chemical Engineering 84 $66,386 $64,535 $64,535 $69,093

44 | 2016 Spring Salary Survey | National Association of Colleges and Employers
STARTING SALARY BY REGION AND MAJOR/BACHELOR’S DEGREES
BACHELOR’S DEGREES/STARTING SALARY BY REGION AND MAJOR
Region/Academic Major # of Salaries Mean 25th
Percentile Median 75th Percentile
GREAT LAKES REGION
Civil Engineering 115 $53,671 $51,791 $55,052 $55,052
Computer Engineering 62 $69,579 $68,252 $68,252 $72,170
Electrical, Electronics, and Communications Engineering 162 $63,076 $65,213 $65,950 $66,445
Environmental/Environmental Health Engineering 6 $55,484 $55,484 $55,484 $55,484
Materials Engineering 13 $66,159 $66,159 $66,159 $66,159
Mechanical Engineering 319 $62,826 $62,476 $63,448 $63,448
Metallurgical Engineering 14 $65,631 $65,631 $65,631 $65,631
Nuclear Engineering 15 $61,109 $61,109 $61,109 $61,109
Petroleum Engineering 20 $83,247 $85,369 $85,369 $85,369
Industrial Engineering 32 $58,400 $58,000 $59,740 $59,740
Geological/Geophysical Engineering 9 $54,416 $57,821 $57,821 $57,821
Biological/Biosystems Engineering 14 $59,876 $59,876 $59,876 $59,876
ENGINEERING TECHNOLOGIES 33 $62,925 $62,768 $62,768 $62,768
Industrial Production Technologies 3 $64,500 $64,500 $64,500 $64,500
Engineering-Related Fields 30 $62,768 $62,768 $62,768 $62,768
FOREIGN LANGUAGES, LITERATURES, AND LINGUISTICS 39 $33,076 $29,567 $31,413 $32,500
East Asian Languages 3 $41,000 $28,000 $47,500 $47,500
Romance Languages 21 $31,276 $29,567 $29,567 $29,567
Classics and Classical Languages 12 $32,165 $31,413 $31,957 $32,500
FAMILY AND CONSUMER SCIENCES/ HUMAN SCIENCES 75 $27,103 $27,770 $27,770 $27,770
Family and Consumer Sciences/Human Sciences 11 $23,614 $23,614 $23,614 $23,614
Human Development, Family Studies, and Related Services 63 $27,587 $27,770 $27,770 $27,770
ENGLISH LANGUAGE AND LITERATURE/LETTERS 61 $32,179 $25,063 $33,297 $33,989
English Language and Literature/Letters 60 $32,132 $25,063 $33,297 $33,989
LIBERAL ARTS AND SCIENCES, GENERAL STUDIES, AND HUMANITIES 35 $39,873 $33,750 $38,008 $46,285
Liberal Arts and Sciences, General Studies, and Humanities 34 $40,164 $33,750 $38,008 $46,285
BIOLOGICAL AND BIOMEDICAL SCIENCES 117 $32,031 $29,942 $31,957 $33,181
Biology 95 $30,984 $29,942 $30,881 $31,957
Biochemistry, Biophysics, and Molecular Biology 14 $35,380 $30,500 $33,580 $44,500
Microbiological Sciences 7 $36,977 $36,977 $36,977 $36,977
MATHEMATICS AND STATISTICS 101 $52,068 $51,183 $55,819 $59,400
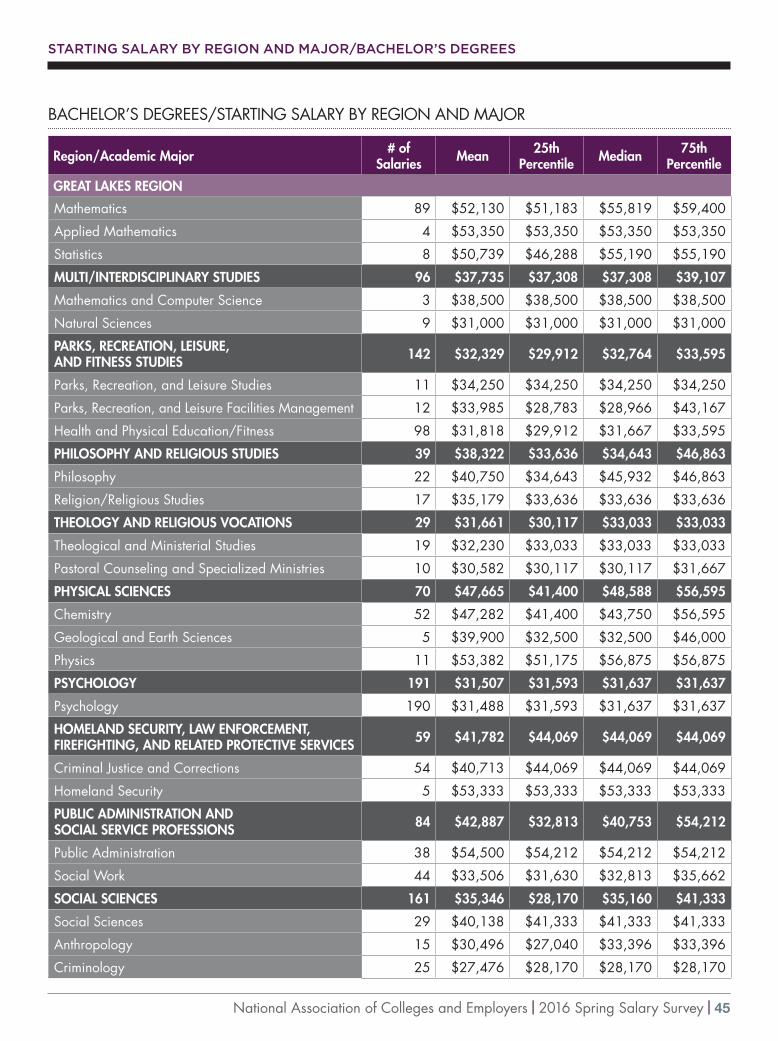
National Association of Colleges and Employers | 2016 Spring Salary Survey | 45
STARTING SALARY BY REGION AND MAJOR/BACHELOR’S DEGREES
BACHELOR’S DEGREES/STARTING SALARY BY REGION AND MAJOR
Region/Academic Major # of Salaries Mean 25th
Percentile Median 75th Percentile
GREAT LAKES REGION
Mathematics 89 $52,130 $51,183 $55,819 $59,400
Applied Mathematics 4 $53,350 $53,350 $53,350 $53,350
Statistics 8 $50,739 $46,288 $55,190 $55,190
MULTI/INTERDISCIPLINARY STUDIES 96 $37,735 $37,308 $37,308 $39,107
Mathematics and Computer Science 3 $38,500 $38,500 $38,500 $38,500
Natural Sciences 9 $31,000 $31,000 $31,000 $31,000
PARKS, RECREATION, LEISURE, AND FITNESS STUDIES 142 $32,329 $29,912 $32,764 $33,595
Parks, Recreation, and Leisure Studies 11 $34,250 $34,250 $34,250 $34,250
Parks, Recreation, and Leisure Facilities Management 12 $33,985 $28,783 $28,966 $43,167
Health and Physical Education/Fitness 98 $31,818 $29,912 $31,667 $33,595
PHILOSOPHY AND RELIGIOUS STUDIES 39 $38,322 $33,636 $34,643 $46,863
Philosophy 22 $40,750 $34,643 $45,932 $46,863
Religion/Religious Studies 17 $35,179 $33,636 $33,636 $33,636
THEOLOGY AND RELIGIOUS VOCATIONS 29 $31,661 $30,117 $33,033 $33,033
Theological and Ministerial Studies 19 $32,230 $33,033 $33,033 $33,033
Pastoral Counseling and Specialized Ministries 10 $30,582 $30,117 $30,117 $31,667
PHYSICAL SCIENCES 70 $47,665 $41,400 $48,588 $56,595
Chemistry 52 $47,282 $41,400 $43,750 $56,595
Geological and Earth Sciences 5 $39,900 $32,500 $32,500 $46,000
Physics 11 $53,382 $51,175 $56,875 $56,875
PSYCHOLOGY 191 $31,507 $31,593 $31,637 $31,637
Psychology 190 $31,488 $31,593 $31,637 $31,637
HOMELAND SECURITY, LAW ENFORCEMENT, FIREFIGHTING, AND RELATED PROTECTIVE SERVICES 59 $41,782 $44,069 $44,069 $44,069
Criminal Justice and Corrections 54 $40,713 $44,069 $44,069 $44,069
Homeland Security 5 $53,333 $53,333 $53,333 $53,333
PUBLIC ADMINISTRATION AND SOCIAL SERVICE PROFESSIONS 84 $42,887 $32,813 $40,753 $54,212
Public Administration 38 $54,500 $54,212 $54,212 $54,212
Social Work 44 $33,506 $31,630 $32,813 $35,662
SOCIAL SCIENCES 161 $35,346 $28,170 $35,160 $41,333
Social Sciences 29 $40,138 $41,333 $41,333 $41,333
Anthropology 15 $30,496 $27,040 $33,396 $33,396
Criminology 25 $27,476 $28,170 $28,170 $28,170
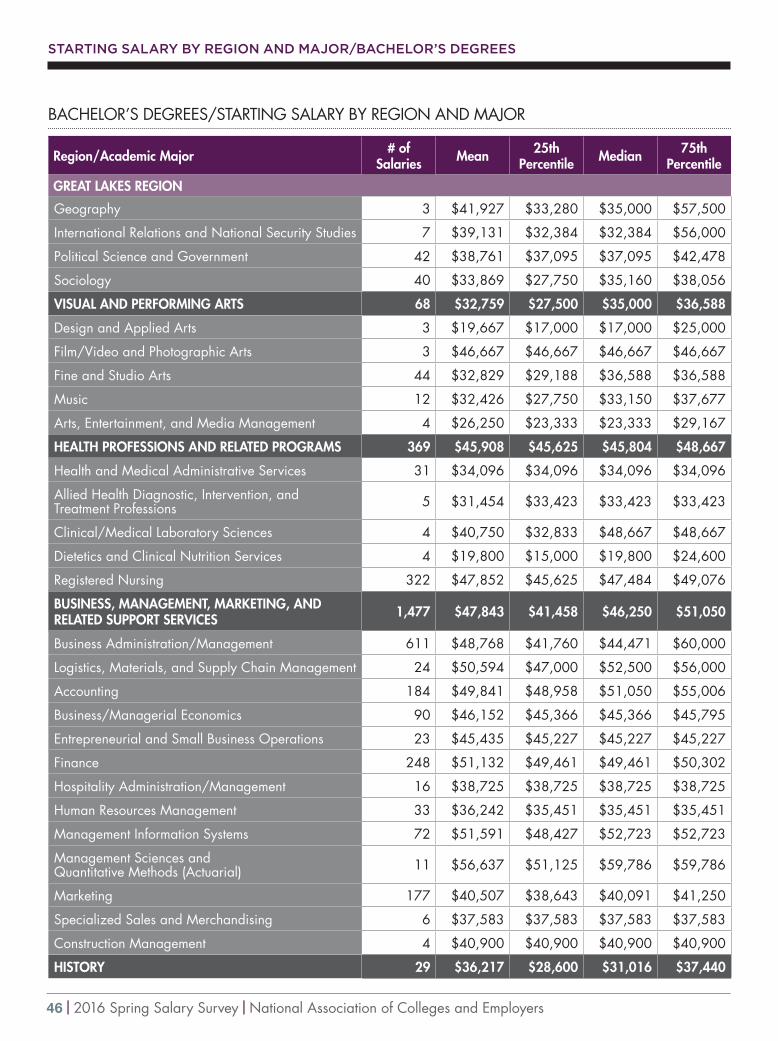
46 | 2016 Spring Salary Survey | National Association of Colleges and Employers
STARTING SALARY BY REGION AND MAJOR/BACHELOR’S DEGREES
BACHELOR’S DEGREES/STARTING SALARY BY REGION AND MAJOR
Region/Academic Major # of Salaries Mean 25th
Percentile Median 75th Percentile
GREAT LAKES REGION
Geography 3 $41,927 $33,280 $35,000 $57,500
International Relations and National Security Studies 7 $39,131 $32,384 $32,384 $56,000
Political Science and Government 42 $38,761 $37,095 $37,095 $42,478
Sociology 40 $33,869 $27,750 $35,160 $38,056
VISUAL AND PERFORMING ARTS 68 $32,759 $27,500 $35,000 $36,588
Design and Applied Arts 3 $19,667 $17,000 $17,000 $25,000
Film/Video and Photographic Arts 3 $46,667 $46,667 $46,667 $46,667
Fine and Studio Arts 44 $32,829 $29,188 $36,588 $36,588
Music 12 $32,426 $27,750 $33,150 $37,677
Arts, Entertainment, and Media Management 4 $26,250 $23,333 $23,333 $29,167
HEALTH PROFESSIONS AND RELATED PROGRAMS 369 $45,908 $45,625 $45,804 $48,667
Health and Medical Administrative Services 31 $34,096 $34,096 $34,096 $34,096
Allied Health Diagnostic, Intervention, and Treatment Professions 5 $31,454 $33,423 $33,423 $33,423
Clinical/Medical Laboratory Sciences 4 $40,750 $32,833 $48,667 $48,667
Dietetics and Clinical Nutrition Services 4 $19,800 $15,000 $19,800 $24,600
Registered Nursing 322 $47,852 $45,625 $47,484 $49,076
BUSINESS, MANAGEMENT, MARKETING, AND RELATED SUPPORT SERVICES 1,477 $47,843 $41,458 $46,250 $51,050
Business Administration/Management 611 $48,768 $41,760 $44,471 $60,000
Logistics, Materials, and Supply Chain Management 24 $50,594 $47,000 $52,500 $56,000
Accounting 184 $49,841 $48,958 $51,050 $55,006
Business/Managerial Economics 90 $46,152 $45,366 $45,366 $45,795
Entrepreneurial and Small Business Operations 23 $45,435 $45,227 $45,227 $45,227
Finance 248 $51,132 $49,461 $49,461 $50,302
Hospitality Administration/Management 16 $38,725 $38,725 $38,725 $38,725
Human Resources Management 33 $36,242 $35,451 $35,451 $35,451
Management Information Systems 72 $51,591 $48,427 $52,723 $52,723
Management Sciences and Quantitative Methods (Actuarial) 11 $56,637 $51,125 $59,786 $59,786
Marketing 177 $40,507 $38,643 $40,091 $41,250
Specialized Sales and Merchandising 6 $37,583 $37,583 $37,583 $37,583
Construction Management 4 $40,900 $40,900 $40,900 $40,900
HISTORY 29 $36,217 $28,600 $31,016 $37,440

National Association of Colleges and Employers | 2016 Spring Salary Survey | 47
STARTING SALARY BY REGION AND MAJOR/BACHELOR’S DEGREES
BACHELOR’S DEGREES/STARTING SALARY BY REGION AND MAJOR
Region/Academic Major # of Salaries Mean 25th
Percentile Median 75th Percentile
PLAINS REGION
AGRICULTURE 77 $39,317 $35,433 $37,500 $42,501
Agricultural Business and Management 23 $42,078 $39,788 $40,000 $45,000
Applied Horticulture 4 $36,750 $34,500 $36,250 $39,000
Animal Sciences 35 $37,332 $35,433 $35,433 $36,616
Food Science and Technology 6 $51,667 $43,750 $43,750 $67,500
Plant Science 6 $29,333 $27,000 $29,500 $31,500
NATURAL RESOURCES 48 $33,791 $30,360 $32,995 $36,295
National Resources Conservation and Research 34 $34,261 $30,360 $32,995 $40,000
Forestry 4 $31,750 $29,000 $32,250 $34,500
Wildlife and Wildlands Science and Management 9 $33,341 $30,648 $31,944 $36,295
ARCHITECTURE AND RELATED SERVICES 55 $41,100 $40,250 $40,250 $42,557
Architecture 52 $41,291 $40,250 $40,250 $42,557
Landscape Architecture 3 $37,787 $35,360 $39,000 $39,000
AREA, ETHNIC, CULTURAL, GENDER, AND GROUP STUDIES 104 $50,957 $44,272 $44,272 $66,833
Area Studies 63 $55,423 $45,277 $58,916 $66,833
Ethnic, Cultural Minority, Gender, and Group Studies 41 $44,095 $44,272 $44,272 $44,272
COMMUNICATION, JOURNALISM, AND RELATED PROGRAMS 319 $34,800 $30,600 $35,889 $37,372
Communication and Media Studies 117 $33,961 $31,336 $35,889 $36,064
Journalism 100 $35,797 $30,242 $40,200 $40,200
Radio, Television, and Digital Communication 5 $41,000 $32,500 $32,500 $60,000
Public Relations, Advertising, and Applied Communication 97 $34,465 $31,209 $36,722 $37,372
COMPUTER AND INFORMATION SCIENCES AND SUPPORT SERVICES 186 $62,354 $56,803 $59,315 $71,290
Computer and Information Sciences 28 $52,439 $56,803 $56,803 $56,803
Information Science 15 $62,938 $46,319 $66,880 $66,880
Computer Science 139 $64,514 $58,327 $66,655 $71,290
Computer/Information Technology Administration and Management 3 $61,000 $48,000 $67,501 $67,501
EDUCATION 237 $37,140 $32,125 $36,251 $44,212
Curriculum and Instruction 4 $34,250 $34,250 $34,250 $34,250
Special Education and Teaching 12 $28,392 $22,050 $28,000 $32,750
Teacher Education, Specific Levels and Methods 105 $32,204 $31,178 $32,125 $34,499
Teacher Education, Specific Subject Areas 35 $36,663 $33,990 $36,695 $42,800
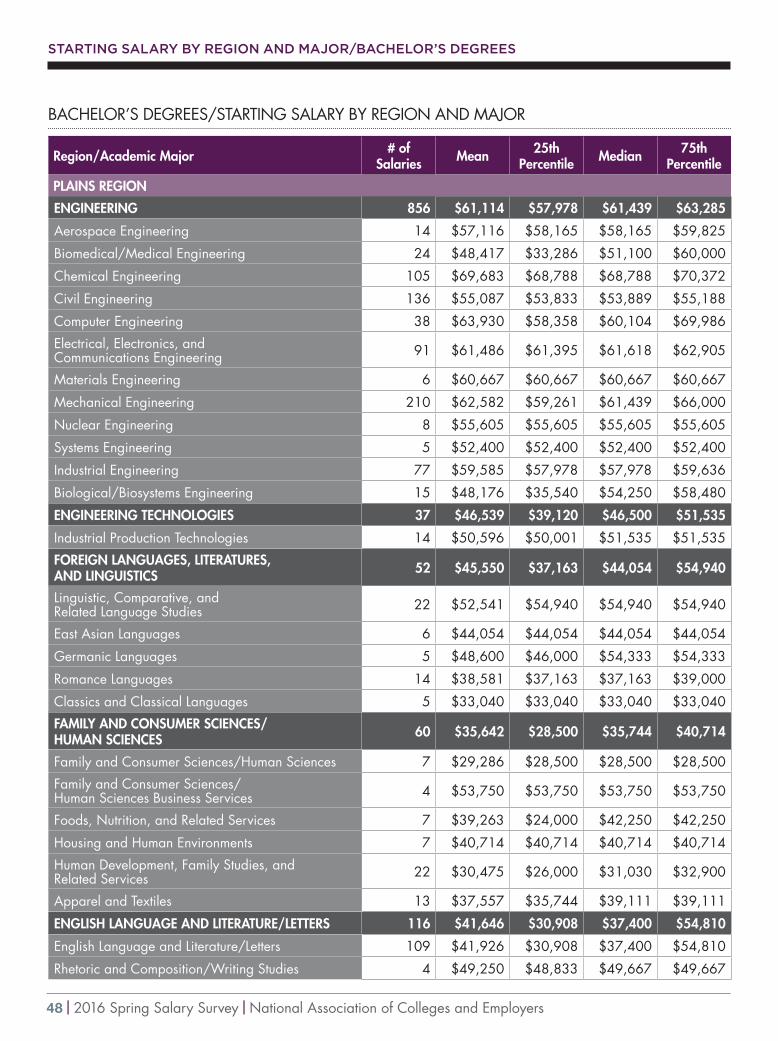
48 | 2016 Spring Salary Survey | National Association of Colleges and Employers
STARTING SALARY BY REGION AND MAJOR/BACHELOR’S DEGREES
BACHELOR’S DEGREES/STARTING SALARY BY REGION AND MAJOR
Region/Academic Major # of Salaries Mean 25th
Percentile Median 75th Percentile
PLAINS REGION
ENGINEERING 856 $61,114 $57,978 $61,439 $63,285
Aerospace Engineering 14 $57,116 $58,165 $58,165 $59,825
Biomedical/Medical Engineering 24 $48,417 $33,286 $51,100 $60,000
Chemical Engineering 105 $69,683 $68,788 $68,788 $70,372
Civil Engineering 136 $55,087 $53,833 $53,889 $55,188
Computer Engineering 38 $63,930 $58,358 $60,104 $69,986
Electrical, Electronics, and Communications Engineering 91 $61,486 $61,395 $61,618 $62,905
Materials Engineering 6 $60,667 $60,667 $60,667 $60,667
Mechanical Engineering 210 $62,582 $59,261 $61,439 $66,000
Nuclear Engineering 8 $55,605 $55,605 $55,605 $55,605
Systems Engineering 5 $52,400 $52,400 $52,400 $52,400
Industrial Engineering 77 $59,585 $57,978 $57,978 $59,636
Biological/Biosystems Engineering 15 $48,176 $35,540 $54,250 $58,480
ENGINEERING TECHNOLOGIES 37 $46,539 $39,120 $46,500 $51,535
Industrial Production Technologies 14 $50,596 $50,001 $51,535 $51,535
FOREIGN LANGUAGES, LITERATURES, AND LINGUISTICS 52 $45,550 $37,163 $44,054 $54,940
Linguistic, Comparative, and Related Language Studies 22 $52,541 $54,940 $54,940 $54,940
East Asian Languages 6 $44,054 $44,054 $44,054 $44,054
Germanic Languages 5 $48,600 $46,000 $54,333 $54,333
Romance Languages 14 $38,581 $37,163 $37,163 $39,000
Classics and Classical Languages 5 $33,040 $33,040 $33,040 $33,040
FAMILY AND CONSUMER SCIENCES/ HUMAN SCIENCES 60 $35,642 $28,500 $35,744 $40,714
Family and Consumer Sciences/Human Sciences 7 $29,286 $28,500 $28,500 $28,500
Family and Consumer Sciences/ Human Sciences Business Services 4 $53,750 $53,750 $53,750 $53,750
Foods, Nutrition, and Related Services 7 $39,263 $24,000 $42,250 $42,250
Housing and Human Environments 7 $40,714 $40,714 $40,714 $40,714
Human Development, Family Studies, and Related Services 22 $30,475 $26,000 $31,030 $32,900
Apparel and Textiles 13 $37,557 $35,744 $39,111 $39,111
ENGLISH LANGUAGE AND LITERATURE/LETTERS 116 $41,646 $30,908 $37,400 $54,810
English Language and Literature/Letters 109 $41,926 $30,908 $37,400 $54,810
Rhetoric and Composition/Writing Studies 4 $49,250 $48,833 $49,667 $49,667

National Association of Colleges and Employers | 2016 Spring Salary Survey | 49
STARTING SALARY BY REGION AND MAJOR/BACHELOR’S DEGREES
BACHELOR’S DEGREES/STARTING SALARY BY REGION AND MAJOR
Region/Academic Major # of Salaries Mean 25th
Percentile Median 75th Percentile
PLAINS REGION
Literature 3 $21,333 $21,333 $21,333 $21,333
LIBERAL ARTS AND SCIENCES, GENERAL STUDIES, AND HUMANITIES 67 $39,517 $37,676 $37,676 $40,000
Liberal Arts and Sciences, General Studies, and Humanities 67 $39,517 $37,676 $37,676 $40,000
BIOLOGICAL AND BIOMEDICAL SCIENCES 129 $32,568 $27,500 $32,119 $38,044
Biology 109 $33,031 $28,360 $32,119 $38,044
Biochemistry, Biophysics, and Molecular Biology 3 $21,667 $20,000 $20,000 $25,000
Microbiological Sciences 5 $24,840 $24,840 $24,840 $24,840
Ecology, Evolution, Systematics, and Population Biology 8 $32,083 $26,567 $34,240 $34,240
Neurobiology and Neurosciences 3 $31,667 $21,000 $26,000 $48,000
MATHEMATICS AND STATISTICS 60 $49,112 $43,124 $51,156 $53,543
Mathematics 56 $48,700 $43,248 $51,156 $53,543
Statistics 3 $48,167 $43,000 $43,000 $58,500
MULTI/INTERDISCIPLINARY STUDIES 131 $39,414 $33,898 $39,619 $41,899
Peace Studies and Conflict Resolution 12 $43,116 $41,899 $43,116 $44,333
International/Global Studies 35 $39,101 $35,505 $39,619 $39,619
PARKS, RECREATION, LEISURE, AND FITNESS STUDIES 96 $37,784 $26,142 $31,780 $52,023
Health and Physical Education/Fitness 94 $38,194 $26,142 $31,780 $52,023
PHILOSOPHY AND RELIGIOUS STUDIES 15 $35,802 $26,040 $30,793 $47,167
Philosophy 10 $36,740 $26,040 $30,793 $47,167
Religion/Religious Studies 5 $33,928 $30,500 $30,500 $32,640
PHYSICAL SCIENCES 71 $38,798 $30,000 $33,431 $44,000
Atmospheric Sciences and Meteorology 4 $31,250 $29,667 $29,667 $32,833
Chemistry 49 $34,664 $32,000 $33,431 $37,304
Geological and Earth Sciences 9 $50,555 $35,000 $40,000 $63,333
Physics 9 $52,906 $44,000 $57,000 $62,825
PSYCHOLOGY 176 $32,370 $27,584 $33,860 $37,644
Psychology 175 $32,405 $27,584 $33,860 $37,644
HOMELAND SECURITY, LAW ENFORCEMENT, FIREFIGHTING, AND RELATED PROTECTIVE SERVICES 22 $30,945 $27,143 $30,003 $30,881
Criminal Justice and Corrections 22 $30,945 $27,143 $30,003 $30,881
PUBLIC ADMINISTRATION AND SOCIAL SERVICE PROFESSIONS 80 $37,861 $31,089 $34,900 $46,763
Public Administration 16 $43,025 $34,900 $44,333 $49,429

50 | 2016 Spring Salary Survey | National Association of Colleges and Employers
STARTING SALARY BY REGION AND MAJOR/BACHELOR’S DEGREES
BACHELOR’S DEGREES/STARTING SALARY BY REGION AND MAJOR
Region/Academic Major # of Salaries Mean 25th
Percentile Median 75th Percentile
PLAINS REGION
Public Policy Analysis 27 $46,763 $46,763 $46,763 $46,763
Social Work 37 $29,131 $28,334 $30,250 $31,928
SOCIAL SCIENCES 246 $38,744 $36,779 $38,554 $43,121
Social Sciences 5 $38,106 $37,632 $37,632 $37,632
Anthropology 11 $28,662 $21,613 $27,987 $35,000
Criminology 42 $36,895 $36,779 $37,117 $37,117
Geography 11 $35,414 $21,000 $30,000 $48,200
International Relations and National Security Studies 21 $45,017 $48,680 $48,680 $48,680
Political Science and Government 101 $39,812 $37,475 $42,367 $43,121
Sociology 54 $38,211 $32,501 $38,554 $44,038
VISUAL AND PERFORMING ARTS 236 $33,269 $28,603 $31,160 $36,860
Visual and Performing Arts 3 $15,124 $13,686 $13,686 $18,000
Design and Applied Arts 39 $33,905 $30,000 $32,840 $37,500
Drama/Theatre Arts 4 $30,900 $23,400 $31,800 $38,400
Film/Video and Photographic Arts 25 $40,409 $42,201 $42,201 $42,201
Fine and Studio Arts 28 $31,856 $26,550 $33,975 $36,860
Music 38 $34,094 $28,000 $34,755 $37,000
Arts, Entertainment, and Media Management 98 $32,087 $28,603 $28,603 $28,603
HEALTH PROFESSIONS AND RELATED PROGRAMS 349 $46,832 $43,369 $45,473 $48,836
Health and Medical Administrative Services 25 $52,644 $57,068 $57,068 $57,068
Allied Health and Medical Assisting Services 6 $25,001 $25,001 $25,001 $25,001
Allied Health Diagnostic, Intervention, and Treatment Professions 3 $44,055 $31,000 $47,501 $53,664
Clinical/Medical Laboratory Sciences 4 $42,204 $41,469 $42,938 $42,938
Public Health 17 $38,159 $36,233 $36,233 $46,333
Registered Nursing 281 $47,739 $43,369 $45,473 $48,836
BUSINESS, MANAGEMENT, MARKETING, AND RELATED SUPPORT SERVICES 2,208 $50,063 $44,398 $49,867 $54,500
Business Administration/Management 1,033 $51,248 $44,398 $48,532 $51,724
Logistics, Materials, and Supply Chain Management 191 $51,259 $50,038 $51,724 $51,724
Accounting 239 $48,182 $45,443 $45,882 $51,126
Business/Managerial Economics 174 $57,701 $49,533 $56,359 $57,208
Entrepreneurial and Small Business Operations 21 $39,548 $31,563 $40,667 $40,667
Finance 252 $52,417 $50,118 $51,322 $57,886
Hospitality Administration/Management 38 $33,835 $29,990 $34,686 $37,295
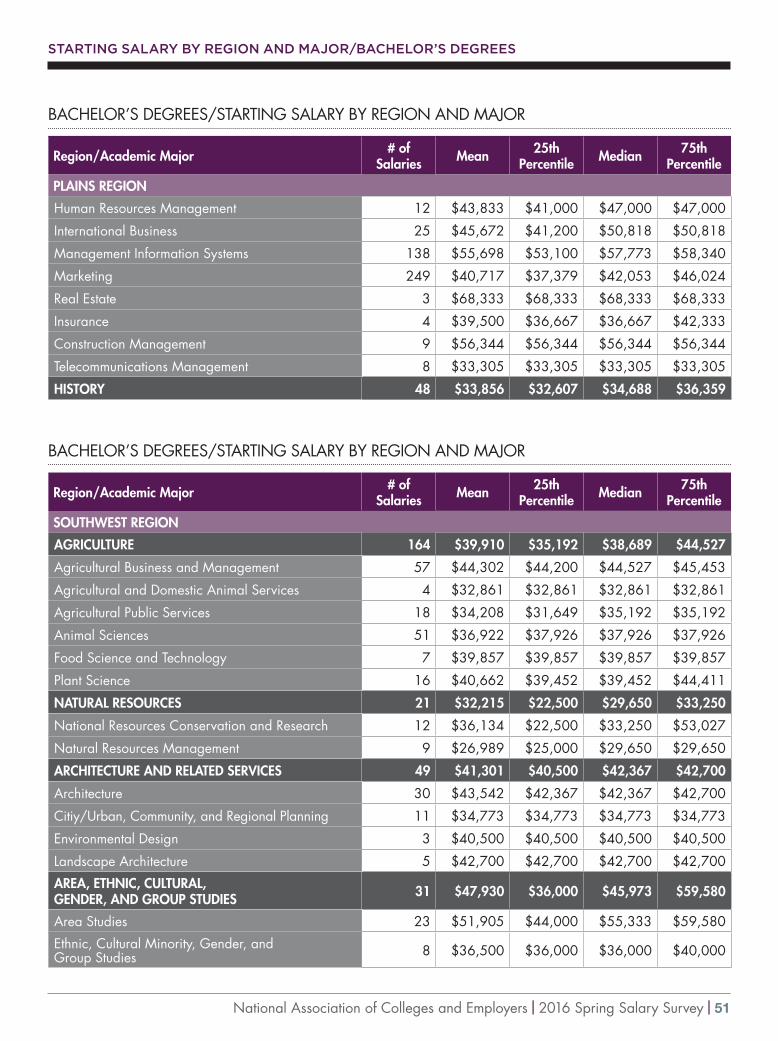
National Association of Colleges and Employers | 2016 Spring Salary Survey | 51
STARTING SALARY BY REGION AND MAJOR/BACHELOR’S DEGREES
BACHELOR’S DEGREES/STARTING SALARY BY REGION AND MAJOR
Region/Academic Major # of Salaries Mean 25th
Percentile Median 75th Percentile
PLAINS REGION
Human Resources Management 12 $43,833 $41,000 $47,000 $47,000
International Business 25 $45,672 $41,200 $50,818 $50,818
Management Information Systems 138 $55,698 $53,100 $57,773 $58,340
Marketing 249 $40,717 $37,379 $42,053 $46,024
Real Estate 3 $68,333 $68,333 $68,333 $68,333
Insurance 4 $39,500 $36,667 $36,667 $42,333
Construction Management 9 $56,344 $56,344 $56,344 $56,344
Telecommunications Management 8 $33,305 $33,305 $33,305 $33,305
HISTORY 48 $33,856 $32,607 $34,688 $36,359
BACHELOR’S DEGREES/STARTING SALARY BY REGION AND MAJOR
Region/Academic Major # of Salaries Mean 25th
Percentile Median 75th Percentile
SOUTHWEST REGION
AGRICULTURE 164 $39,910 $35,192 $38,689 $44,527
Agricultural Business and Management 57 $44,302 $44,200 $44,527 $45,453
Agricultural and Domestic Animal Services 4 $32,861 $32,861 $32,861 $32,861
Agricultural Public Services 18 $34,208 $31,649 $35,192 $35,192
Animal Sciences 51 $36,922 $37,926 $37,926 $37,926
Food Science and Technology 7 $39,857 $39,857 $39,857 $39,857
Plant Science 16 $40,662 $39,452 $39,452 $44,411
NATURAL RESOURCES 21 $32,215 $22,500 $29,650 $33,250
National Resources Conservation and Research 12 $36,134 $22,500 $33,250 $53,027
Natural Resources Management 9 $26,989 $25,000 $29,650 $29,650
ARCHITECTURE AND RELATED SERVICES 49 $41,301 $40,500 $42,367 $42,700
Architecture 30 $43,542 $42,367 $42,367 $42,700
Citiy/Urban, Community, and Regional Planning 11 $34,773 $34,773 $34,773 $34,773
Environmental Design 3 $40,500 $40,500 $40,500 $40,500
Landscape Architecture 5 $42,700 $42,700 $42,700 $42,700
AREA, ETHNIC, CULTURAL, GENDER, AND GROUP STUDIES 31 $47,930 $36,000 $45,973 $59,580
Area Studies 23 $51,905 $44,000 $55,333 $59,580
Ethnic, Cultural Minority, Gender, and Group Studies 8 $36,500 $36,000 $36,000 $40,000

52 | 2016 Spring Salary Survey | National Association of Colleges and Employers
STARTING SALARY BY REGION AND MAJOR/BACHELOR’S DEGREES
BACHELOR’S DEGREES/STARTING SALARY BY REGION AND MAJOR
Region/Academic Major # of Salaries Mean 25th
Percentile Median 75th Percentile
SOUTHWEST REGION
COMMUNICATION, JOURNALISM, AND RELATED PROGRAMS 167 $33,229 $30,250 $33,943 $34,676
Communication and Media Studies 84 $34,785 $33,943 $34,676 $34,676
Journalism 39 $29,960 $29,603 $30,250 $30,250
Radio, Television, and Digital Communication 3 $25,680 $25,680 $25,680 $25,680
Public Relations, Advertising, and Applied Communication 41 $33,703 $32,583 $33,007 $34,700
COMPUTER AND INFORMATION SCIENCES AND SUPPORT SERVICES 125 $68,647 $60,164 $67,210 $90,094
Information Science 24 $51,028 $41,998 $57,298 $57,298
Computer Science 101 $72,834 $64,875 $67,210 $90,094
EDUCATION 235 $34,901 $32,201 $33,933 $36,244
Curriculum and Instruction 3 $33,933 $33,933 $33,933 $33,933
Special Education and Teaching 13 $25,989 $25,989 $25,989 $25,989
Teacher Education, Specific Levels and Methods 144 $32,914 $30,887 $32,201 $35,818
Teacher Education, Specific Subject Areas 64 $40,001 $36,155 $39,995 $43,240
ENGINEERING 1,817 $70,210 $67,544 $72,998 $72,998
Aerospace Engineering 700 $72,338 $72,998 $72,998 $72,998
Agricultural Engineering 10 $51,862 $51,862 $51,862 $51,862
Architectural Engineering 45 $66,250 $66,250 $66,250 $66,250
Biomedical/Medical Engineering 49 $59,006 $56,800 $59,724 $59,724
Chemical Engineering 111 $73,463 $67,104 $74,930 $75,300
Civil Engineering 181 $70,069 $55,461 $76,846 $76,846
Computer Engineering 8 $61,039 $59,520 $61,950 $61,950
Electrical, Electronics, and Communications Engineering 133 $64,852 $60,698 $60,698 $68,251
Materials Engineering 6 $63,350 $60,050 $65,000 $65,000
Mechanical Engineering 368 $70,410 $67,544 $74,337 $74,337
Mining and Mineral Engineering 4 $67,750 $67,750 $67,750 $67,750
Petroleum Engineering 149 $72,807 $70,818 $70,818 $70,818
Systems Engineering 12 $59,399 $59,399 $59,399 $59,399
Industrial Engineering 25 $62,768 $60,726 $60,726 $65,993
Biological/Biosystems Engineering 13 $55,107 $54,527 $54,527 $54,527
ENGINEERING TECHNOLOGIES 158 $62,754 $60,796 $63,575 $71,490
Electrical Engineering Technologies 11 $60,796 $60,796 $60,796 $60,796
Envionmental Control Technologies 40 $71,490 $71,490 $71,490 $71,490

National Association of Colleges and Employers | 2016 Spring Salary Survey | 53
STARTING SALARY BY REGION AND MAJOR/BACHELOR’S DEGREES
BACHELOR’S DEGREES/STARTING SALARY BY REGION AND MAJOR
Region/Academic Major # of Salaries Mean 25th
Percentile Median 75th Percentile
SOUTHWEST REGION
Quality Control and Safety Technologies 36 $63,575 $63,575 $63,575 $63,575
Mechanical Engineering Related Technologies 29 $62,279 $62,279 $62,279 $62,279
Construction Engineering Technologies 31 $54,814 $54,814 $54,814 $54,814
Engineering-Related Fields 4 $67,250 $67,250 $67,250 $67,250
FOREIGN LANGUAGES, LITERATURES, AND LINGUISTICS 35 $36,580 $32,081 $32,081 $47,667
Linguistic, Comparative, and Related Language Studies 8 $47,750 $47,667 $47,800 $47,800
Romance Languages 23 $32,473 $32,081 $32,081 $32,081
FAMILY AND CONSUMER SCIENCES/ HUMAN SCIENCES 80 $31,392 $27,375 $33,537 $36,696
Family and Consumer Sciences/Human Sciences 18 $24,956 $24,956 $24,956 $24,956
Family and Consumer Sciences/ Human Sciences Business Services 4 $27,375 $27,375 $27,375 $27,375
Foods, Nutrition, and Related Services 11 $27,886 $29,175 $29,175 $29,175
Housing and Human Environments 21 $36,696 $36,696 $36,696 $36,696
Human Development, Family Studies, and Related Services 26 $33,665 $33,537 $33,537 $33,537
ENGLISH LANGUAGE AND LITERATURE/LETTERS 58 $47,530 $29,125 $31,722 $79,719
English Language and Literature/Letters 56 $48,268 $29,125 $34,604 $79,719
LIBERAL ARTS AND SCIENCES, GENERAL STUDIES, AND HUMANITIES 91 $47,614 $39,531 $39,531 $57,791
Liberal Arts and Sciences, General Studies, and Humanities 91 $47,614 $39,531 $39,531 $57,791
BIOLOGICAL AND BIOMEDICAL SCIENCES 113 $33,817 $28,293 $32,031 $37,318
Biology 27 $37,621 $32,031 $35,367 $45,485
Biochemistry, Biophysics, and Molecular Biology 37 $35,685 $28,753 $37,318 $37,318
Cell/Cellular Biology 6 $35,187 $35,187 $35,187 $35,187
Microbiological Sciences 3 $23,333 $23,333 $23,333 $23,333
Zoology/Animal Biology 19 $27,896 $22,625 $29,918 $29,918
Physiology, Pathology, and Related Sciences 7 $26,394 $28,293 $28,293 $28,293
Ecology, Evolution, Systematics, and Population Biology 6 $47,500 $51,000 $51,000 $51,000
Neurobiology and Neurosciences 7 $24,429 $24,429 $24,429 $24,429
MATHEMATICS AND STATISTICS 86 $65,059 $50,690 $65,883 $78,318
Mathematics 51 $59,715 $50,690 $50,690 $66,071
Applied Mathematics 22 $78,318 $78,318 $78,318 $78,318
Statistics 13 $63,585 $65,883 $65,883 $65,883
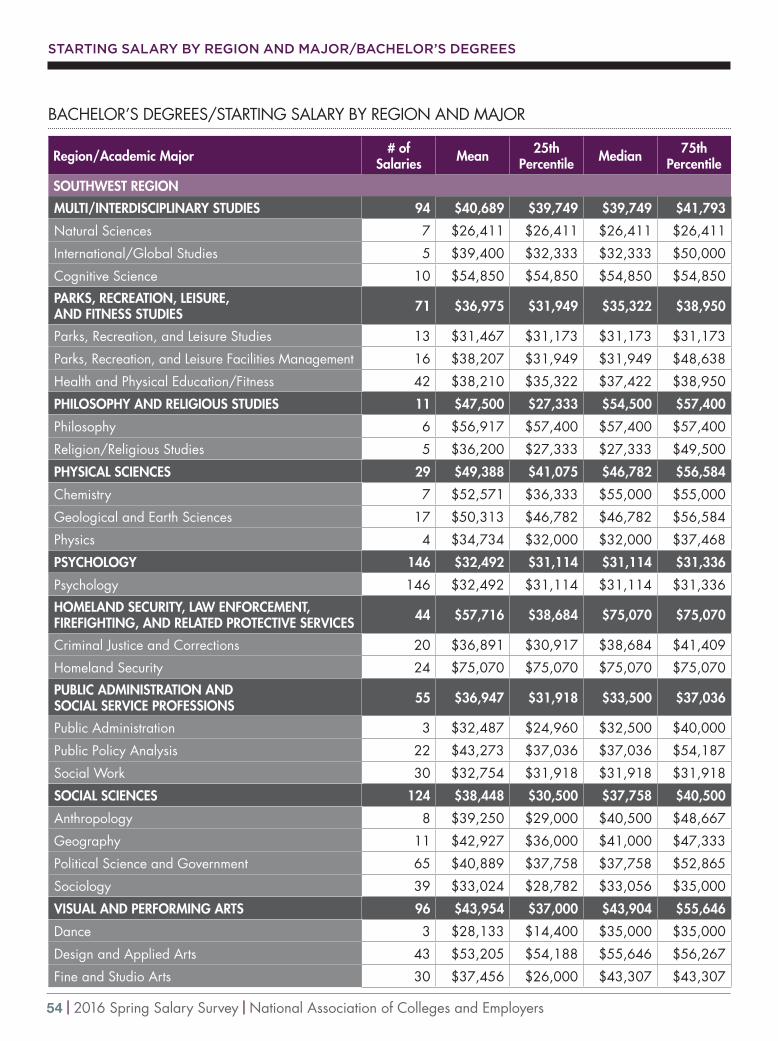
54 | 2016 Spring Salary Survey | National Association of Colleges and Employers
BACHELOR’S DEGREES/STARTING SALARY BY REGION AND MAJOR
Region/Academic Major # of Salaries Mean 25th
Percentile Median 75th Percentile
SOUTHWEST REGION
MULTI/INTERDISCIPLINARY STUDIES 94 $40,689 $39,749 $39,749 $41,793
Natural Sciences 7 $26,411 $26,411 $26,411 $26,411
International/Global Studies 5 $39,400 $32,333 $32,333 $50,000
Cognitive Science 10 $54,850 $54,850 $54,850 $54,850
PARKS, RECREATION, LEISURE, AND FITNESS STUDIES 71 $36,975 $31,949 $35,322 $38,950
Parks, Recreation, and Leisure Studies 13 $31,467 $31,173 $31,173 $31,173
Parks, Recreation, and Leisure Facilities Management 16 $38,207 $31,949 $31,949 $48,638
Health and Physical Education/Fitness 42 $38,210 $35,322 $37,422 $38,950
PHILOSOPHY AND RELIGIOUS STUDIES 11 $47,500 $27,333 $54,500 $57,400
Philosophy 6 $56,917 $57,400 $57,400 $57,400
Religion/Religious Studies 5 $36,200 $27,333 $27,333 $49,500
PHYSICAL SCIENCES 29 $49,388 $41,075 $46,782 $56,584
Chemistry 7 $52,571 $36,333 $55,000 $55,000
Geological and Earth Sciences 17 $50,313 $46,782 $46,782 $56,584
Physics 4 $34,734 $32,000 $32,000 $37,468
PSYCHOLOGY 146 $32,492 $31,114 $31,114 $31,336
Psychology 146 $32,492 $31,114 $31,114 $31,336
HOMELAND SECURITY, LAW ENFORCEMENT, FIREFIGHTING, AND RELATED PROTECTIVE SERVICES 44 $57,716 $38,684 $75,070 $75,070
Criminal Justice and Corrections 20 $36,891 $30,917 $38,684 $41,409
Homeland Security 24 $75,070 $75,070 $75,070 $75,070
PUBLIC ADMINISTRATION AND SOCIAL SERVICE PROFESSIONS 55 $36,947 $31,918 $33,500 $37,036
Public Administration 3 $32,487 $24,960 $32,500 $40,000
Public Policy Analysis 22 $43,273 $37,036 $37,036 $54,187
Social Work 30 $32,754 $31,918 $31,918 $31,918
SOCIAL SCIENCES 124 $38,448 $30,500 $37,758 $40,500
Anthropology 8 $39,250 $29,000 $40,500 $48,667
Geography 11 $42,927 $36,000 $41,000 $47,333
Political Science and Government 65 $40,889 $37,758 $37,758 $52,865
Sociology 39 $33,024 $28,782 $33,056 $35,000
VISUAL AND PERFORMING ARTS 96 $43,954 $37,000 $43,904 $55,646
Dance 3 $28,133 $14,400 $35,000 $35,000
Design and Applied Arts 43 $53,205 $54,188 $55,646 $56,267
Fine and Studio Arts 30 $37,456 $26,000 $43,307 $43,307
STARTING SALARY BY REGION AND MAJOR/BACHELOR’S DEGREES

National Association of Colleges and Employers | 2016 Spring Salary Survey | 55
BACHELOR’S DEGREES/STARTING SALARY BY REGION AND MAJOR
Region/Academic Major # of Salaries Mean 25th
Percentile Median 75th Percentile
SOUTHWEST REGION
Music 12 $36,329 $27,800 $40,087 $45,000
Arts, Entertainment, and Media Management 4 $30,200 $23,400 $30,200 $37,000
HEALTH PROFESSIONS AND RELATED PROGRAMS 169 $48,277 $37,261 $49,220 $69,328
Communication Disorders Sciences 17 $26,957 $27,726 $27,726 $27,726
Health and Medical Administrative Services 7 $32,956 $29,422 $29,422 $37,667
Allied Health Diagnostic, Intervention, and Treatment Professions 21 $46,681 $47,200 $50,000 $51,300
Public Health 13 $23,154 $23,154 $23,154 $23,154
Rehabilitation and Therapeutic Professions 3 $30,935 $27,374 $32,716 $32,716
Veterinary Biomedical and Clinical Sciences 3 $35,667 $35,667 $35,667 $35,667
Registered Nursing 96 $57,964 $49,220 $49,625 $69,328
BUSINESS, MANAGEMENT, MARKETING, AND RELATED SUPPORT SERVICES 1,083 $48,194 $42,104 $46,971 $53,271
Business Administration/Management 328 $45,259 $42,104 $42,104 $43,794
Logistics, Materials, and Supply Chain Management 11 $58,855 $58,855 $58,855 $58,855
Accounting 156 $51,070 $51,752 $53,107 $53,879
Business/Managerial Economics 68 $53,204 $45,354 $51,733 $66,858
Entrepreneurial and Small Business Operations 24 $62,810 $64,402 $64,402 $64,402
Finance 159 $52,053 $50,846 $51,598 $51,598
Hospitality Administration/Management 25 $36,089 $36,089 $36,089 $36,089
International Business 20 $53,850 $49,636 $49,636 $59,000
Management Information Systems 96 $53,584 $53,271 $53,603 $53,603
Marketing 188 $42,681 $40,482 $42,045 $43,595
Specialized Sales and Merchandising 5 $37,600 $37,600 $37,600 $37,600
Construction Management 5 $61,600 $62,750 $62,750 $62,750
HISTORY 34 $41,686 $33,949 $35,360 $60,220
STARTING SALARY BY REGION AND MAJOR/BACHELOR’S DEGREES

56 | 2016 Spring Salary Survey | National Association of Colleges and Employers
STARTING SALARY BY REGION AND MAJOR/BACHELOR’S DEGREES
BACHELOR’S DEGREES/STARTING SALARY BY REGION AND MAJOR
Region/Academic Major # of Salaries Mean 25th
Percentile Median 75th Percentile
FAR WEST/ROCKY MOUNTAIN REGION
AGRICULTURE 254 $43,251 $37,547 $45,420 $50,023
Agricultural Business and Management 103 $49,699 $50,023 $50,023 $50,023
Agricultural Production Operations 27 $41,989 $41,268 $41,268 $41,268
Agricultural and Domestic Animal Services 9 $25,307 $25,307 $25,307 $25,307
Applied Horticulture 10 $45,420 $45,420 $45,420 $45,420
Agricultural Public Services 7 $44,717 $45,920 $45,920 $45,920
Animal Sciences 54 $35,297 $35,159 $35,159 $37,325
Food Science and Technology 5 $42,260 $40,325 $40,325 $40,325
Plant Science 31 $39,909 $37,547 $38,116 $43,000
NATURAL RESOURCES 107 $37,494 $32,726 $37,143 $41,000
National Resources Conservation and Research 59 $36,069 $32,726 $36,966 $37,143
Natural Resources Management 26 $43,919 $37,350 $44,000 $44,000
Forestry 11 $37,480 $32,361 $41,000 $41,000
Wildlife and Wildlands Science and Management 11 $29,967 $30,380 $30,833 $33,000
ARCHITECTURE AND RELATED SERVICES 95 $45,231 $45,625 $46,477 $46,477
Architecture 63 $45,385 $46,477 $46,477 $46,477
Citiy/Urban, Community, and Regional Planning 11 $43,436 $45,625 $45,625 $45,625
Landscape Architecture 19 $46,047 $44,300 $47,360 $47,360
AREA, ETHNIC, CULTURAL, GENDER, AND GROUP STUDIES 26 $34,739 $31,540 $31,667 $39,464
Area Studies 14 $37,701 $38,000 $39,464 $41,667
Ethnic, Cultural Minority, Gender, and Group Studies 12 $31,283 $28,220 $31,540 $31,667
COMMUNICATION, JOURNALISM, AND RELATED PROGRAMS 199 $39,094 $33,157 $38,529 $42,125
Communication and Media Studies 111 $39,213 $33,400 $38,529 $42,125
Journalism 48 $33,555 $30,558 $31,714 $34,975
Public Relations, Advertising, and Applied Communication 40 $45,412 $38,964 $40,623 $40,623
COMMUNICATIONS TECHNOLOGIES 27 $45,685 $46,288 $46,288 $46,288
Graphic Communications 27 $45,685 $46,288 $46,288 $46,288
COMPUTER AND INFORMATION SCIENCES AND SUPPORT SERVICES 228 $78,621 $69,473 $78,497 $87,222
Computer and Information Science 12 $69,350 $67,556 $67,556 $71,145
Information Science 10 $47,831 $43,895 $43,895 $53,735
Computer Software and Media Applications 7 $83,719 $83,719 $83,719 $83,719

National Association of Colleges and Employers | 2016 Spring Salary Survey | 57
STARTING SALARY BY REGION AND MAJOR/BACHELOR’S DEGREES
BACHELOR’S DEGREES/STARTING SALARY BY REGION AND MAJOR
Region/Academic Major # of Salaries Mean 25th
Percentile Median 75th Percentile
FAR WEST/ROCKY MOUNTAIN REGION
Computer/Information Technology Administration and Management 3 $62,000 $62,000 $62,000 $62,000
EDUCATION 186 $34,759 $32,300 $34,170 $36,250
Special Education and Teaching 31 $33,398 $32,167 $34,170 $34,170
Teacher Education, Specific Levels and Methods 103 $35,215 $32,300 $32,300 $39,167
Teacher Education, Specific Subject Areas 41 $35,845 $33,300 $35,300 $41,716
ENGINEERING 715 $64,139 $58,821 $62,440 $68,758
Agricultural Engineering 6 $57,833 $57,833 $57,833 $57,833
Architectural Engineering 17 $57,699 $58,059 $58,059 $58,059
Biomedical/Medical Engineering 21 $58,912 $63,253 $63,253 $63,253
Chemical Engineering 15 $59,467 $50,000 $57,000 $66,250
Civil Engineering 105 $58,971 $59,057 $60,391 $60,391
Computer Engineering 50 $81,131 $83,026 $83,026 $83,026
Electrical, Electronics, and Communications Engineering 115 $65,724 $62,440 $68,461 $68,461
Environmental/Environmental Health Engineering 16 $59,110 $61,429 $61,429 $61,429
Materials Engineering 13 $61,923 $64,200 $64,200 $64,200
Mechanical Engineering 269 $62,377 $58,821 $60,513 $68,758
Mining and Mineral Engineering 6 $65,250 $64,333 $65,250 $66,167
Petroleum Engineering 8 $95,138 $95,138 $95,138 $95,138
Industrial Engineering 31 $62,545 $62,545 $62,545 $62,545
Manufacturing Engineering 3 $52,333 $52,333 $52,333 $52,333
ENGINEERING TECHNOLOGIES 56 $62,758 $65,607 $66,310 $66,310
Civil Engineering Technologies 5 $50,400 $51,750 $51,750 $51,750
Industrial Production Technologies 16 $64,444 $65,607 $65,607 $65,607
Mechanical Engineering Related Technologies 28 $65,728 $66,310 $66,310 $66,310
Engineering-Related Fields 4 $46,250 $46,250 $46,250 $46,250
FOREIGN LANGUAGES, LITERATURES, AND LINGUISTICS 47 $36,199 $32,500 $35,400 $40,000
Linguistic, Comparative, and Related Language Studies 23 $36,178 $32,500 $34,250 $42,275
Romance Languages 7 $37,286 $35,400 $35,768 $35,768
Classics and Classical Languages 6 $39,500 $38,333 $38,333 $49,000
FAMILY AND CONSUMER SCIENCES/ HUMAN SCIENCES 158 $32,551 $29,200 $31,724 $34,100
Family and Consumer Sciences/Human Sciences 45 $29,824 $29,200 $29,200 $32,200

58 | 2016 Spring Salary Survey | National Association of Colleges and Employers
STARTING SALARY BY REGION AND MAJOR/BACHELOR’S DEGREES
BACHELOR’S DEGREES/STARTING SALARY BY REGION AND MAJOR
Region/Academic Major # of Salaries Mean 25th
Percentile Median 75th Percentile
FAR WEST/ROCKY MOUNTAIN REGION
Family and Consumer Sciences/ Human Sciences Business Services 5 $36,000 $36,000 $36,000 $36,000
Foods, Nutrition, and Related Services 25 $37,949 $33,900 $33,900 $42,287
Human Development, Family Studies, and Related Services 76 $30,771 $27,824 $30,760 $31,724
Apparel and Textiles 7 $47,657 $47,657 $47,657 $47,657
ENGLISH LANGUAGE AND LITERATURE/LETTERS 97 $36,613 $31,900 $32,277 $35,333
English Language and Literature/Letters BC 83 $37,456 $31,900 $32,750 $43,333
Literature 13 $29,817 $30,219 $30,219 $30,219
LIBERAL ARTS AND SCIENCES, GENERAL STUDIES, AND HUMANITIES 32 $43,926 $34,250 $38,600 $43,814
Liberal Arts and Sciences, General Studies, and Humanities 32 $43,926 $34,250 $38,600 $43,814
BIOLOGICAL AND BIOMEDICAL SCIENCES 226 $35,273 $27,500 $35,000 $38,120
Biology 138 $34,965 $26,083 $31,709 $36,600
Biochemistry, Biophysics, and Molecular Biology 47 $37,970 $37,000 $38,333 $39,075
Microbiological Sciences 7 $34,854 $32,000 $38,120 $38,120
Zoology/Animal Biology 5 $31,056 $25,000 $27,500 $35,000
Ecology, Evolution, Systematics, and Population Biology 14 $34,520 $25,409 $34,283 $40,000
Neurobiology and Neurosciences 13 $31,490 $34,704 $35,438 $35,438
MATHEMATICS AND STATISTICS 79 $50,052 $45,000 $48,810 $58,000
Mathematics 60 $48,186 $36,688 $48,810 $52,182
Applied Mathematics 4 $60,000 $60,000 $60,000 $60,000
Statistics 15 $54,867 $50,000 $58,500 $58,500
MULTI/INTERDISCIPLINARY STUDIES 103 $37,165 $33,408 $36,905 $38,000
Biopsychology 4 $35,000 $35,000 $35,000 $35,000
Behavioral Sciences 7 $34,857 $30,000 $38,500 $38,500
International/Global Studies 52 $35,686 $29,625 $36,905 $37,413
Human Biology 3 $33,408 $33,408 $33,408 $33,408
PARKS, RECREATION, LEISURE, AND FITNESS STUDIES 96 $34,840 $31,300 $34,300 $42,442
Parks, Recreation, and Leisure Studies 7 $31,300 $31,300 $31,300 $31,300
Parks, Recreation, and Leisure Facilities Management 28 $42,442 $42,442 $42,442 $42,442
Health and Physical Education/Fitness 59 $31,680 $28,200 $31,568 $36,000
PHILOSOPHY AND RELIGIOUS STUDIES 14 $39,562 $29,684 $39,000 $48,333
Philosophy 13 $39,682 $29,684 $40,000 $48,333

National Association of Colleges and Employers | 2016 Spring Salary Survey | 59
STARTING SALARY BY REGION AND MAJOR/BACHELOR’S DEGREES
BACHELOR’S DEGREES/STARTING SALARY BY REGION AND MAJOR
Region/Academic Major # of Salaries Mean 25th
Percentile Median 75th Percentile
FAR WEST/ROCKY MOUNTAIN REGION
PHYSICAL SCIENCES 84 $47,776 $37,803 $45,190 $52,800
Chemistry 33 $46,596 $38,000 $43,600 $47,200
Geological and Earth Sciences 17 $42,183 $37,520 $37,803 $52,800
Physics 32 $52,263 $44,333 $51,086 $59,248
PSYCHOLOGY 202 $33,541 $29,476 $33,681 $35,750
Psychology 202 $33,541 $29,476 $33,681 $35,750
HOMELAND SECURITY, LAW ENFORCEMENT, FIREFIGHTING, AND RELATED PROTECTIVE SERVICES 31 $56,890 $42,476 $66,971 $71,450
Criminal Justice and Corrections 31 $56,890 $42,476 $66,971 $71,450
PUBLIC ADMINISTRATION AND SOCIAL SERVICE PROFESSIONS 59 $33,512 $28,800 $33,060 $37,769
Social Work 57 $32,407 $28,800 $33,060 $36,000
SOCIAL SCIENCES 264 $35,085 $32,001 $35,486 $37,875
Anthropology 32 $33,453 $26,333 $35,811 $35,811
Criminology 4 $28,754 $28,754 $28,754 $28,754
Geography 14 $34,800 $28,500 $34,840 $41,333
Political Science and Government 95 $38,617 $35,654 $37,667 $41,778
Sociology 103 $32,660 $31,190 $32,270 $33,875
VISUAL AND PERFORMING ARTS 110 $37,388 $30,094 $35,175 $45,000
Visual and Performing Arts 5 $44,000 $45,000 $45,000 $45,000
Dance 3 $38,667 $20,000 $44,000 $52,000
Design and Applied Arts 29 $50,895 $38,500 $59,163 $59,163
Drama/Theatre Arts 5 $23,000 $14,500 $25,000 $30,500
Film/Video and Photographic Arts 14 $28,614 $21,000 $28,760 $30,624
Fine and Studio Arts 32 $33,472 $30,094 $34,440 $35,800
Music 12 $30,761 $26,484 $35,350 $35,969
Arts, Entertainment, and Media Management 10 $34,494 $30,833 $31,180 $34,452
HEALTH PROFESSIONS AND RELATED PROGRAMS 157 $44,132 $37,800 $47,444 $53,200
Communication Disorders Sciences 31 $36,206 $35,000 $37,800 $37,800
Health and Medical Administrative Services 9 $40,660 $40,750 $40,750 $45,000
Allied Health Diagnostic, Intervention, and Treatment Professions 3 $42,133 $42,133 $42,133 $42,133
Clinical/Medical Laboratory Sciences 7 $42,624 $42,561 $42,561 $42,561
Health/Medical Preparatory Programs 12 $27,900 $27,900 $27,900 $27,900
Public Health 17 $40,975 $29,000 $40,796 $53,200
Registered Nursing 73 $52,481 $49,118 $54,651 $54,651

60 | 2016 Spring Salary Survey | National Association of Colleges and Employers
STARTING SALARY BY REGION AND MAJOR/BACHELOR’S DEGREES
BACHELOR’S DEGREES/STARTING SALARY BY REGION AND MAJOR
Region/Academic Major # of Salaries Mean 25th
Percentile Median 75th Percentile
FAR WEST/ROCKY MOUNTAIN REGION
BUSINESS, MANAGEMENT, MARKETING, AND RELATED SUPPORT SERVICES 1,894 $50,517 $45,494 $49,970 $55,924
Business Administration/Management 622 $46,330 $43,114 $45,494 $49,506
Accounting 253 $53,802 $49,600 $55,924 $55,924
Business/Managerial Economics 218 $53,634 $50,769 $54,700 $57,889
Entrepreneurial and Small Business Operations 27 $43,796 $37,133 $46,550 $47,848
Finance 280 $53,464 $52,778 $53,898 $55,200
Hospitality Administration/Management 37 $41,238 $38,750 $42,753 $42,753
Human Resources Management 26 $47,180 $47,653 $47,653 $47,653
International Business 30 $48,727 $50,663 $51,833 $51,833
Management Information Systems 102 $62,194 $61,000 $64,120 $64,120
Marketing 185 $43,524 $41,538 $44,375 $45,772
Construction Management 112 $59,868 $57,884 $57,884 $57,884
HISTORY 56 $38,651 $31,639 $33,714 $45,000

National Association of Colleges and Employers | 2016 Spring Salary Survey | 61
AVERAGE SALARIES BY CARNEGIE CLASSIFICATION/DEGREES
Class Average Starting Salary
Doctoral $52,081
Master's $46,271
Baccalaureate $42,142
STARTING SALARY BY CARNEGIE CLASSIFICATION AND MAJOR/BACHELOR’S DEGREES

62 | 2016 Spring Salary Survey | National Association of Colleges and Employers
STARTING SALARY BY CARNEGIE CLASSIFICATION AND MAJOR/BACHELOR’S DEGREES
BACHELOR’S DEGREES/STARTING SALARY BY CARNEGIE CLASSIFICATION AND MAJOR
Research Universities (very high research activity)
Broad Category # of Salaries Mean 25th
Percentile Median 75th Percentile
Agriculture 481 $33,045 $24,500 $33,213 $41,250
Natural Resources 228 $34,114 $30,360 $34,370 $38,800
Architecture and Related Services 142 $40,026 $38,929 $42,500 $44,436
Area, Ethnic, Cultural, Gender, and Group Studies 170 $42,137 $35,000 $40,813 $45,000
Communication, Journalism, and Related Programs 879 $36,967 $33,065 $37,544 $40,295
Computer and Information Sciences and Support Services 1,161 $74,048 $67,210 $74,248 $87,000
Education 513 $37,279 $32,125 $40,000 $44,212
Engineering 5,941 $64,445 $59,724 $64,687 $72,998
Engineering Technologies 254 $48,242 $40,313 $44,203 $57,500
Foreign Languages, Literatures, and Linguistics 207 $38,983 $32,500 $37,163 $46,000
Family and Consumer Sciences/Human Sciences 188 $34,329 $30,183 $33,500 $38,421
Legal Studies 13 $49,385 $49,167 $49,167 $50,400
English Language and Literature/Letters 316 $40,229 $32,381 $34,700 $44,731
Liberal Arts and Sciences, General Studies, and Humanities 1,232 $56,648 $58,064 $58,064 $58,064
Biological and Biomedical Sciences 677 $34,531 $28,760 $34,322 $38,044
Mathematics and Statistics 442 $64,449 $51,750 $65,025 $72,500
Military Technologies 12 $51,833 $45,625 $45,625 $64,250
Multi/Interdisciplinary Studies 464 $45,180 $36,905 $46,722 $53,921
Parks, Recreation, Leisure, and Fitness Studies 236 $35,019 $30,833 $32,764 $34,250
Philosophy and Religious Studies 85 $47,953 $32,750 $46,863 $57,400
Physical Sciences 263 $48,426 $37,304 $46,500 $56,595
Science Technologies/Technicians 3 $41,333 $41,333 $41,333 $41,333
Psychology 717 $36,522 $31,593 $35,750 $41,250
Homeland Security, Law Enforcement, Firefighting, and Related Protective Services 31 $45,780 $27,500 $32,057 $63,318
Public Administration and Social Service Professions 199 $43,228 $32,750 $45,925 $49,997
Social Sciences 1,362 $43,359 $37,667 $41,785 $48,845
Transportation and Materials Moving 30 $50,739 $15,775 $77,081 $77,081
Visual and Performing Arts 478 $40,521 $32,500 $37,952 $43,750
Health Professions and Related Programs 1,098 $53,542 $43,101 $54,152 $65,072
Business, Management, Marketing, and Related Support Services 8,454 $54,336 $48,180 $53,603 $62,058
History 189 $41,044 $35,875 $39,500 $47,000

National Association of Colleges and Employers | 2016 Spring Salary Survey | 63
STARTING SALARY BY CARNEGIE CLASSIFICATION AND MAJOR/BACHELOR’S DEGREES
BACHELOR’S DEGREES/STARTING SALARY BY CARNEGIE CLASSIFICATION AND MAJOR
Research Universities (high research activity)
Broad Category # of Salaries Mean 25th
Percentile Median 75th Percentile
Agriculture 135 $40,375 $37,926 $39,500 $44,527
Natural Resources 44 $36,402 $29,825 $33,000 $42,500
Architecture and Related Services 73 $41,524 $41,785 $41,785 $42,367
Area, Ethnic, Cultural, Gender, and Group Studies 118 $49,295 $44,272 $44,272 $58,916
Communication, Journalism, and Related Programs 453 $37,138 $33,943 $37,171 $42,323
Computer and Information Sciences and Support Services 334 $62,528 $56,803 $61,571 $70,111
Education 544 $35,099 $32,300 $34,258 $35,818
Engineering 1,824 $61,810 $57,407 $62,192 $65,631
Engineering Technologies 281 $57,747 $54,455 $59,429 $62,768
Foreign Languages, Literatures, and Linguistics 70 $42,885 $32,500 $44,054 $54,940
Family and Consumer Sciences/Human Sciences 162 $32,862 $29,200 $33,537 $35,000
English Language and Literature/Letters 162 $41,410 $31,900 $38,913 $54,810
Liberal Arts and Sciences, General Studies, and Humanities 47 $39,650 $33,000 $38,008 $46,285
Biological and Biomedical Sciences 232 $37,388 $31,090 $35,277 $39,861
Mathematics and Statistics 85 $52,058 $45,000 $53,350 $60,325
Multi/Interdisciplinary Studies 179 $47,144 $39,619 $46,250 $55,153
Parks, Recreation, Leisure, and Fitness Studies 171 $35,305 $31,173 $32,500 $35,689
Philosophy and Religious Studies 13 $40,293 $40,895 $40,895 $42,155
Theology and Religious Vocations 5 $40,400 $43,025 $43,025 $43,025
Physical Sciences 99 $40,768 $33,431 $39,500 $45,750
Science Technologies/Technicians 6 $55,000 $55,000 $55,000 $55,000
Psychology 266 $36,043 $28,729 $35,686 $41,946
Homeland Security, Law Enforcement, Firefighting, and Related Protective Services 88 $37,382 $32,500 $35,542 $37,688
Public Administration and Social Service Professions 132 $36,163 $32,570 $32,639 $37,828
Social Sciences 360 $37,575 $32,500 $37,117 $43,121
Transportation and Materials Moving 43 $41,032 $30,000 $45,684 $45,684
Visual and Performing Arts 174 $35,229 $27,500 $36,346 $42,201
Health Professions and Related Programs 513 $45,961 $44,697 $48,575 $50,312
Business, Management, Marketing, and Related Support Services 3,425 $50,977 $42,753 $50,667 $57,886
History 65 $37,823 $29,000 $34,688 $42,011

64 | 2016 Spring Salary Survey | National Association of Colleges and Employers
STARTING SALARY BY CARNEGIE CLASSIFICATION AND MAJOR/BACHELOR’S DEGREES
BACHELOR’S DEGREES/STARTING SALARY BY CARNEGIE CLASSIFICATION AND MAJOR
Master’s Colleges and Universities (larger programs)
Broad Category # of Salaries Mean 25th
Percentile Median 75th Percentile
Agriculture 242 $43,086 $35,159 $45,210 $50,023
Natural Resources 51 $39,371 $30,000 $41,000 $44,000
Architecture and Related Services 106 $44,146 $38,622 $46,477 $46,477
Area, Ethnic, Cultural, Gender, and Group Studies 17 $39,017 $24,900 $39,104 $47,500
Communication, Journalism, and Related Programs 364 $36,387 $31,083 $36,500 $38,630
Communications Technologies 42 $47,274 $46,288 $46,288 $50,000
Computer and Information Sciences and Support Services 299 $62,442 $53,166 $61,969 $70,390
Personal and Culinary Services 3 $33,333 $33,333 $33,333 $33,333
Education 395 $34,814 $32,000 $33,500 $38,000
Engineering 874 $64,369 $59,738 $63,763 $68,461
Engineering Technologies 300 $56,404 $54,000 $56,980 $60,000
Foreign Languages, Literatures, and Linguistics 12 $33,758 $34,500 $34,500 $38,500
Family and Consumer Sciences/Human Sciences 114 $31,364 $29,000 $29,000 $32,129
Legal Studies 6 $41,972 $30,000 $51,083 $51,083
English Language and Literature/Letters 83 $33,852 $28,500 $30,800 $40,281
Liberal Arts and Sciences, General Studies, and Humanities 153 $45,842 $37,500 $40,224 $57,791
Biological and Biomedical Sciences 157 $32,689 $26,083 $32,000 $38,000
Mathematics and Statistics 99 $53,977 $46,000 $52,182 $59,571
Multi/Interdisciplinary Studies 127 $42,134 $36,400 $39,749 $43,250
Parks, Recreation, Leisure, and Fitness Studies 146 $34,529 $26,903 $35,900 $42,442
Leisure and Recreational Activities 6 $36,167 $36,167 $36,167 $36,167
Philosophy and Religious Studies 13 $33,954 $25,000 $28,000 $41,667
Theology and Religious Vocations 10 $35,528 $25,400 $33,750 $49,250
Physical Sciences 52 $45,477 $35,500 $43,600 $51,086
Psychology 211 $32,083 $29,000 $31,692 $34,813
Homeland Security, Law Enforcement, Firefighting, and Related Protective Services 112 $44,411 $30,579 $38,684 $52,083
Public Administration and Social Service Professions 138 $31,438 $28,760 $31,918 $32,500
Social Sciences 222 $40,379 $33,115 $37,500 $44,333
Visual and Performing Arts 588 $39,946 $30,000 $40,000 $44,000
Health Professions and Related Programs 762 $50,457 $44,000 $52,300 $58,143
Business, Management, Marketing, and Related Support Services 3,286 $48,525 $41,518 $47,500 $55,200
History 46 $40,970 $30,167 $38,084 $49,500

National Association of Colleges and Employers | 2016 Spring Salary Survey | 65
STARTING SALARY BY CARNEGIE CLASSIFICATION AND MAJOR/BACHELOR’S DEGREES
BACHELOR’S DEGREES/STARTING SALARY BY CARNEGIE CLASSIFICATION AND MAJOR
Master’s Colleges and Universities (medium programs)
Broad Category # of Salaries Mean 25th
Percentile Median 75th Percentile
Natural Resources 22 $34,072 $30,000 $38,571 $38,571
Communication, Journalism, and Related Programs 35 $37,128 $36,000 $37,833 $37,833
Communications Technologies 4 $37,500 $35,000 $40,000 $40,000
Computer and Information Sciences and Support Services 66 $48,674 $46,818 $47,086 $47,353
Education 64 $36,823 $33,200 $36,428 $38,423
Engineering 7 $48,714 $46,250 $46,250 $52,000
Engineering Technologies 3 $48,333 $25,000 $60,000 $60,000
Foreign Languages, Literatures, and Linguistics 10 $39,310 $38,333 $38,333 $46,000
Family and Consumer Sciences/Human Sciences 63 $28,634 $27,770 $27,770 $27,770
English Language and Literature/Letters 40 $35,259 $29,285 $38,260 $38,260
Liberal Arts and Sciences, General Studies, and Humanities 11 $33,636 $28,750 $31,200 $31,200
Biological and Biomedical Sciences 31 $31,315 $27,000 $33,167 $33,167
Mathematics and Statistics 15 $45,093 $45,000 $45,000 $47,600
Multi/Interdisciplinary Studies 38 $37,668 $31,700 $42,075 $42,075
Parks, Recreation, Leisure, and Fitness Studies 14 $27,850 $31,000 $31,000 $31,000
Physical Sciences 5 $29,500 $29,167 $29,167 $30,000
Psychology 104 $32,172 $31,637 $31,637 $34,079
Homeland Security, Law Enforcement, Firefighting, and Related Protective Services 82 $41,356 $35,192 $44,069 $44,069
Public Administration and Social Service Professions 60 $48,044 $39,688 $54,212 $54,212
Social Sciences 63 $39,573 $41,250 $41,333 $41,333
Visual and Performing Arts 24 $29,651 $22,500 $30,000 $35,817
Health Professions and Related Programs 412 $44,069 $43,462 $45,625 $46,500
Business, Management, Marketing, and Related Support Services 652 $43,406 $41,000 $43,107 $46,250
History 14 $37,686 $35,200 $38,214 $38,214
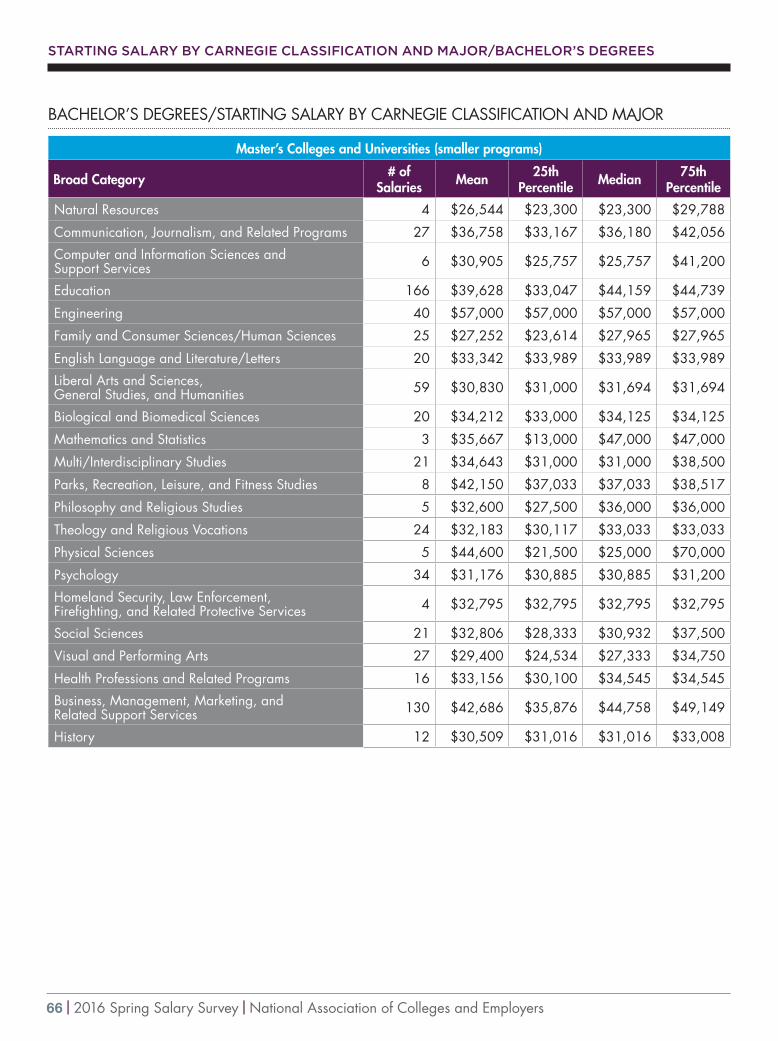
66 | 2016 Spring Salary Survey | National Association of Colleges and Employers
STARTING SALARY BY CARNEGIE CLASSIFICATION AND MAJOR/BACHELOR’S DEGREES
BACHELOR’S DEGREES/STARTING SALARY BY CARNEGIE CLASSIFICATION AND MAJOR
Master’s Colleges and Universities (smaller programs)
Broad Category # of Salaries Mean 25th
Percentile Median 75th Percentile
Natural Resources 4 $26,544 $23,300 $23,300 $29,788
Communication, Journalism, and Related Programs 27 $36,758 $33,167 $36,180 $42,056
Computer and Information Sciences and Support Services 6 $30,905 $25,757 $25,757 $41,200
Education 166 $39,628 $33,047 $44,159 $44,739
Engineering 40 $57,000 $57,000 $57,000 $57,000
Family and Consumer Sciences/Human Sciences 25 $27,252 $23,614 $27,965 $27,965
English Language and Literature/Letters 20 $33,342 $33,989 $33,989 $33,989
Liberal Arts and Sciences, General Studies, and Humanities 59 $30,830 $31,000 $31,694 $31,694
Biological and Biomedical Sciences 20 $34,212 $33,000 $34,125 $34,125
Mathematics and Statistics 3 $35,667 $13,000 $47,000 $47,000
Multi/Interdisciplinary Studies 21 $34,643 $31,000 $31,000 $38,500
Parks, Recreation, Leisure, and Fitness Studies 8 $42,150 $37,033 $37,033 $38,517
Philosophy and Religious Studies 5 $32,600 $27,500 $36,000 $36,000
Theology and Religious Vocations 24 $32,183 $30,117 $33,033 $33,033
Physical Sciences 5 $44,600 $21,500 $25,000 $70,000
Psychology 34 $31,176 $30,885 $30,885 $31,200
Homeland Security, Law Enforcement, Firefighting, and Related Protective Services 4 $32,795 $32,795 $32,795 $32,795
Social Sciences 21 $32,806 $28,333 $30,932 $37,500
Visual and Performing Arts 27 $29,400 $24,534 $27,333 $34,750
Health Professions and Related Programs 16 $33,156 $30,100 $34,545 $34,545
Business, Management, Marketing, and Related Support Services 130 $42,686 $35,876 $44,758 $49,149
History 12 $30,509 $31,016 $31,016 $33,008

National Association of Colleges and Employers | 2016 Spring Salary Survey | 67
STARTING SALARY BY CARNEGIE CLASSIFICATION AND MAJOR/BACHELOR’S DEGREES
BACHELOR’S DEGREES/STARTING SALARY BY CARNEGIE CLASSIFICATION AND MAJOR
Doctoral/Research Universities
Broad Category # of Salaries Mean 25th
Percentile Median 75th Percentile
Natural Resources 15 $34,872 $32,400 $32,726 $32,726
Area, Ethnic, Cultural, Gender, and Group Studies 5 $40,000 $38,000 $40,000 $47,500
Communication, Journalism, and Related Programs 361 $36,231 $33,845 $37,404 $38,000
Communications Technologies 3 $30,333 $30,333 $30,333 $30,333
Computer and Information Sciences and Support Services 211 $68,701 $58,636 $63,320 $82,183
Education 167 $35,656 $31,820 $34,397 $40,343
Engineering 525 $62,344 $58,807 $62,011 $63,493
Engineering Technologies 41 $53,904 $53,589 $53,589 $53,589
Foreign Languages, Literatures, and Linguistics 13 $34,508 $32,500 $32,500 $35,500
Family and Consumer Sciences/Human Sciences 14 $27,071 $28,000 $28,000 $29,333
Legal Studies 4 $51,250 $51,250 $51,250 $51,250
English Language and Literature/Letters 58 $36,259 $34,375 $37,159 $37,159
Liberal Arts and Sciences, General Studies, and Humanities 20 $39,175 $33,750 $33,750 $47,500
Biological and Biomedical Sciences 98 $37,172 $31,957 $36,019 $39,075
Mathematics and Statistics 57 $55,655 $54,955 $59,257 $59,432
Multi/Interdisciplinary Studies 198 $59,622 $39,653 $75,281 $75,281
Parks, Recreation, Leisure, and Fitness Studies 34 $31,562 $28,579 $31,667 $31,667
Philosophy and Religious Studies 26 $35,135 $33,636 $34,140 $34,643
Physical Sciences 34 $43,513 $34,840 $36,071 $56,875
Psychology 116 $35,593 $32,000 $36,808 $36,808
Homeland Security, Law Enforcement, Firefighting, and Related Protective Services 14 $37,404 $37,380 $37,380 $37,465
Public Administration and Social Service Professions 23 $30,678 $28,546 $28,546 $33,438
Social Sciences 193 $37,572 $30,200 $38,056 $41,778
Transportation and Materials Moving 10 $31,800 $30,000 $33,000 $33,000
Visual and Performing Arts 100 $39,636 $31,500 $35,333 $45,357
Health Professions and Related Programs 314 $52,684 $48,806 $48,806 $50,119
Business, Management, Marketing, and Related Support Services 1,748 $50,083 $44,926 $50,412 $54,483
History 25 $36,986 $33,750 $38,543 $40,015
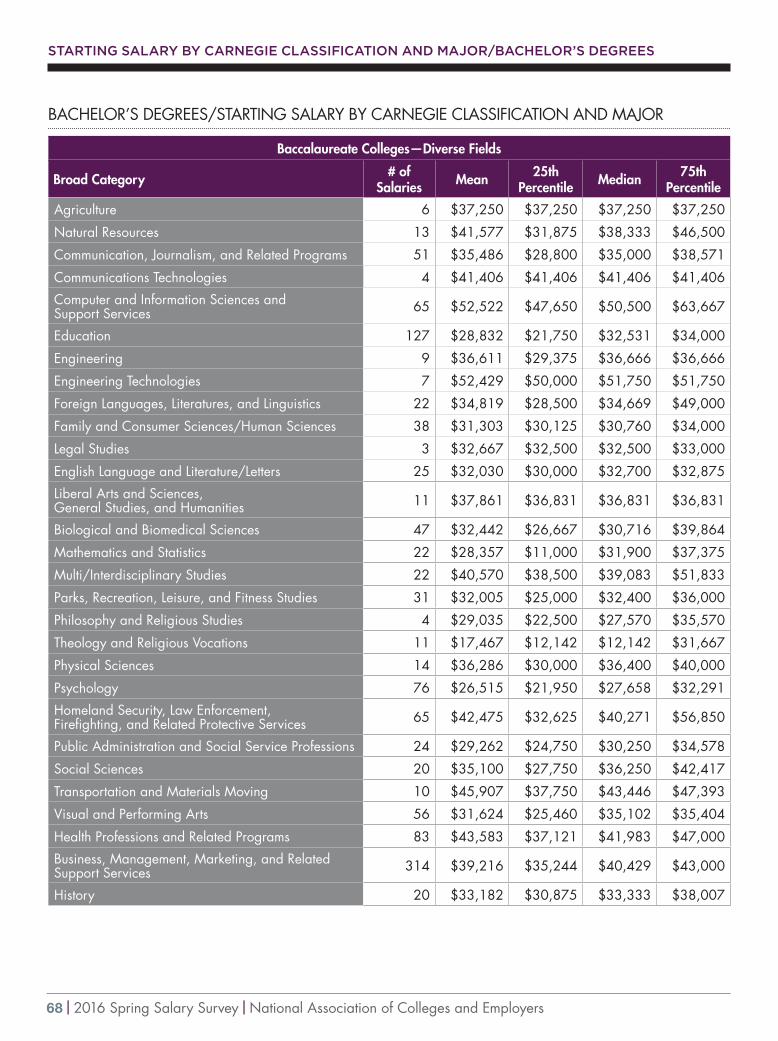
68 | 2016 Spring Salary Survey | National Association of Colleges and Employers
STARTING SALARY BY CARNEGIE CLASSIFICATION AND MAJOR/BACHELOR’S DEGREES
BACHELOR’S DEGREES/STARTING SALARY BY CARNEGIE CLASSIFICATION AND MAJOR
Baccalaureate Colleges—Diverse Fields
Broad Category # of Salaries Mean 25th
Percentile Median 75th Percentile
Agriculture 6 $37,250 $37,250 $37,250 $37,250
Natural Resources 13 $41,577 $31,875 $38,333 $46,500
Communication, Journalism, and Related Programs 51 $35,486 $28,800 $35,000 $38,571
Communications Technologies 4 $41,406 $41,406 $41,406 $41,406
Computer and Information Sciences and Support Services 65 $52,522 $47,650 $50,500 $63,667
Education 127 $28,832 $21,750 $32,531 $34,000
Engineering 9 $36,611 $29,375 $36,666 $36,666
Engineering Technologies 7 $52,429 $50,000 $51,750 $51,750
Foreign Languages, Literatures, and Linguistics 22 $34,819 $28,500 $34,669 $49,000
Family and Consumer Sciences/Human Sciences 38 $31,303 $30,125 $30,760 $34,000
Legal Studies 3 $32,667 $32,500 $32,500 $33,000
English Language and Literature/Letters 25 $32,030 $30,000 $32,700 $32,875
Liberal Arts and Sciences, General Studies, and Humanities 11 $37,861 $36,831 $36,831 $36,831
Biological and Biomedical Sciences 47 $32,442 $26,667 $30,716 $39,864
Mathematics and Statistics 22 $28,357 $11,000 $31,900 $37,375
Multi/Interdisciplinary Studies 22 $40,570 $38,500 $39,083 $51,833
Parks, Recreation, Leisure, and Fitness Studies 31 $32,005 $25,000 $32,400 $36,000
Philosophy and Religious Studies 4 $29,035 $22,500 $27,570 $35,570
Theology and Religious Vocations 11 $17,467 $12,142 $12,142 $31,667
Physical Sciences 14 $36,286 $30,000 $36,400 $40,000
Psychology 76 $26,515 $21,950 $27,658 $32,291
Homeland Security, Law Enforcement, Firefighting, and Related Protective Services 65 $42,475 $32,625 $40,271 $56,850
Public Administration and Social Service Professions 24 $29,262 $24,750 $30,250 $34,578
Social Sciences 20 $35,100 $27,750 $36,250 $42,417
Transportation and Materials Moving 10 $45,907 $37,750 $43,446 $47,393
Visual and Performing Arts 56 $31,624 $25,460 $35,102 $35,404
Health Professions and Related Programs 83 $43,583 $37,121 $41,983 $47,000
Business, Management, Marketing, and Related Support Services 314 $39,216 $35,244 $40,429 $43,000
History 20 $33,182 $30,875 $33,333 $38,007

National Association of Colleges and Employers | 2016 Spring Salary Survey | 69
STARTING SALARY BY CARNEGIE CLASSIFICATION AND MAJOR/BACHELOR’S DEGREES
BACHELOR’S DEGREES/STARTING SALARY BY CARNEGIE CLASSIFICATION AND MAJOR
Baccalaureate Colleges—Arts & Sciences
Broad Category # of Salaries Mean 25th
Percentile Median 75th Percentile
Natural Resources 36 $34,597 $33,450 $34,875 $34,875
Area, Ethnic, Cultural, Gender, and Group Studies 45 $36,417 $32,125 $37,000 $41,500
Communication, Journalism, and Related Programs 100 $38,989 $33,364 $35,000 $37,845
Computer and Information Sciences and Support Services 96 $80,742 $62,540 $93,833 $98,514
Education 87 $36,028 $32,837 $34,053 $37,100
Engineering 112 $63,779 $61,051 $62,770 $69,465
Foreign Languages, Literatures, and Linguistics 44 $34,232 $29,567 $34,167 $37,000
English Language and Literature/Letters 71 $32,892 $29,300 $33,200 $37,917
Liberal Arts and Sciences, General Studies, and Humanities 52 $36,735 $28,529 $43,628 $43,700
Biological and Biomedical Sciences 164 $32,952 $30,600 $31,669 $37,500
Mathematics and Statistics 81 $51,158 $42,688 $48,000 $60,000
Multi/Interdisciplinary Studies 38 $39,712 $34,667 $37,500 $47,500
Parks, Recreation, Leisure, and Fitness Studies 17 $29,495 $21,666 $31,970 $37,667
Philosophy and Religious Studies 30 $32,232 $28,355 $31,700 $38,000
Physical Sciences 45 $44,609 $28,397 $44,333 $49,883
Psychology 147 $34,402 $32,879 $33,563 $36,000
Public Administration and Social Service Professions 15 $43,481 $40,753 $45,300 $45,300
Social Sciences 244 $37,356 $33,667 $37,125 $40,334
Visual and Performing Arts 178 $35,314 $32,052 $37,427 $39,853
Health Professions and Related Programs 60 $46,550 $47,704 $49,076 $50,994
Business, Management, Marketing, and Related Support Services 504 $49,216 $42,750 $49,500 $56,425
History 50 $36,196 $33,000 $40,945 $40,945

70 | 2016 Spring Salary Survey | National Association of Colleges and Employers
APPENDIX
RESPONDENTS BY REGION
Region States Included # of Respondents
% of Respondents
New England CT, ME, MA, NH, RI, VT 16 9.5%
Mid-Atlantic DE, DC, MD, NJ, NY, PA 45 26.8%
Great Lakes IL, IN, MI, OH, WI 39 23.2%
Plains IA, KS, MN, MO, NE, ND, SD 18 10.7%
Southeast AL, AR, FL, GA, KY, LA, MS, NC, SC, TN, VA, WV 21 12.5%
Southwest AZ, NM, OK, TX 8 4.8%
Far West/Rocky Mountain AK, CA, HI, NV, OR, WA, CO, ID, MT, UT, WY 21 12.5%
TOTAL 168 100.0%
RESPONDENTS BY CARNEGIE CLASSIFICATION
Carnegie Classification # of Respondents
% of Respondents
Baccalaureate Colleges - Arts & Sciences 20 11.9%
Baccalaureate Colleges - Diverse Fields 14 8.3%
Doctoral/Research Universities 12 7.1%
Master’s Colleges and Universities (larger programs) 37 22.0%
Master’s Colleges and Universities (medium programs) 10 6.0%
Master’s Colleges and Universities (smaller programs) 6 3.6%
Research Universities (high research activity) 23 13.7%
Research Universities (very high research activity) 41 24.4%
Schools of Engineering 1 0.6%
Schools of Business and Management 1 0.6%
Associate - Public Rural - serving Medium 2 1.2%
Associate - Public Rural - serving Large 1 0.6%
TOTAL 168 100.0%
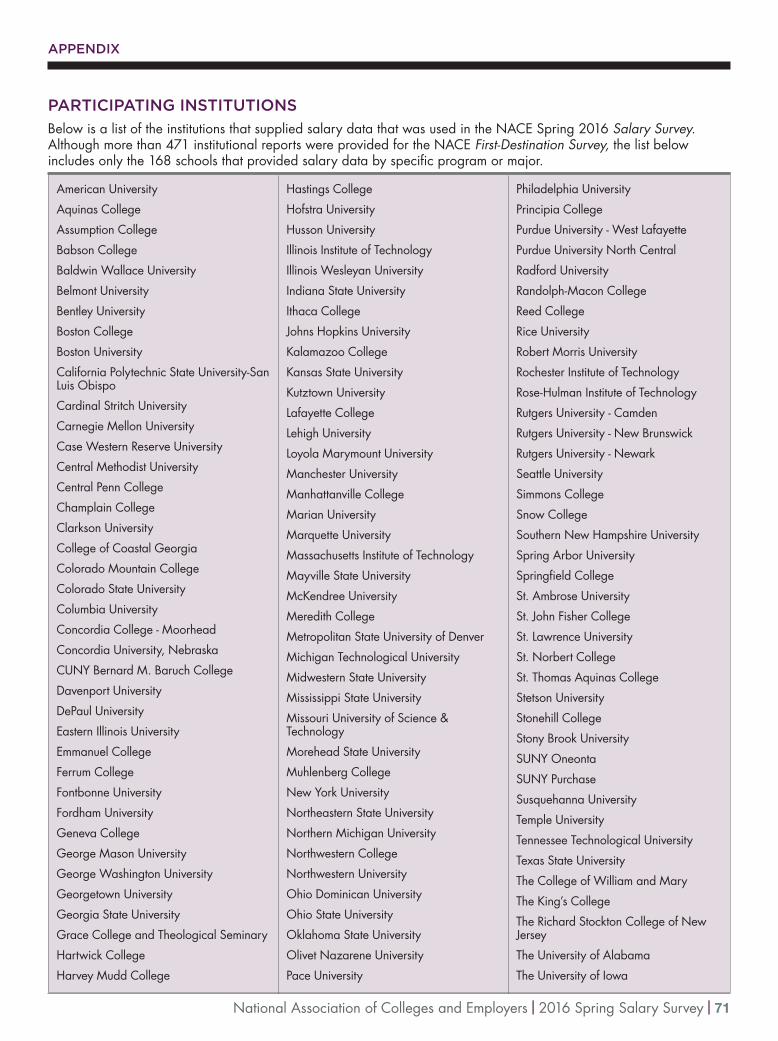
National Association of Colleges and Employers | 2016 Spring Salary Survey | 71
APPENDIX
American University
Aquinas College
Assumption College
Babson College
Baldwin Wallace University
Belmont University
Bentley University
Boston College
Boston University
California Polytechnic State University-San Luis Obispo
Cardinal Stritch University
Carnegie Mellon University
Case Western Reserve University
Central Methodist University
Central Penn College
Champlain College
Clarkson University
College of Coastal Georgia
Colorado Mountain College
Colorado State University
Columbia University
Concordia College - Moorhead
Concordia University, Nebraska
CUNY Bernard M. Baruch College
Davenport University
DePaul University
Eastern Illinois University
Emmanuel College
Ferrum College
Fontbonne University
Fordham University
Geneva College
George Mason University
George Washington University
Georgetown University
Georgia State University
Grace College and Theological Seminary
Hartwick College
Harvey Mudd College
Hastings College
Hofstra University
Husson University
Illinois Institute of Technology
Illinois Wesleyan University
Indiana State University
Ithaca College
Johns Hopkins University
Kalamazoo College
Kansas State University
Kutztown University
Lafayette College
Lehigh University
Loyola Marymount University
Manchester University
Manhattanville College
Marian University
Marquette University
Massachusetts Institute of Technology
Mayville State University
McKendree University
Meredith College
Metropolitan State University of Denver
Michigan Technological University
Midwestern State University
Mississippi State University
Missouri University of Science & Technology
Morehead State University
Muhlenberg College
New York University
Northeastern State University
Northern Michigan University
Northwestern College
Northwestern University
Ohio Dominican University
Ohio State University
Oklahoma State University
Olivet Nazarene University
Pace University
Philadelphia University
Principia College
Purdue University - West Lafayette
Purdue University North Central
Radford University
Randolph-Macon College
Reed College
Rice University
Robert Morris University
Rochester Institute of Technology
Rose-Hulman Institute of Technology
Rutgers University - Camden
Rutgers University - New Brunswick
Rutgers University - Newark
Seattle University
Simmons College
Snow College
Southern New Hampshire University
Spring Arbor University
Springfield College
St. Ambrose University
St. John Fisher College
St. Lawrence University
St. Norbert College
St. Thomas Aquinas College
Stetson University
Stonehill College
Stony Brook University
SUNY Oneonta
SUNY Purchase
Susquehanna University
Temple University
Tennessee Technological University
Texas State University
The College of William and Mary
The King’s College
The Richard Stockton College of New Jersey
The University of Alabama
The University of Iowa
PARTICIPATING INSTITUTIONS
Below is a list of the institutions that supplied salary data that was used in the NACE Spring 2016 Salary Survey. Although more than 471 institutional reports were provided for the NACE First-Destination Survey, the list below includes only the 168 schools that provided salary data by specific program or major.
RESPONDENTS BY REGION
Region States Included # of Respondents
% of Respondents
New England CT, ME, MA, NH, RI, VT 16 9.5%
Mid-Atlantic DE, DC, MD, NJ, NY, PA 45 26.8%
Great Lakes IL, IN, MI, OH, WI 39 23.2%
Plains IA, KS, MN, MO, NE, ND, SD 18 10.7%
Southeast AL, AR, FL, GA, KY, LA, MS, NC, SC, TN, VA, WV 21 12.5%
Southwest AZ, NM, OK, TX 8 4.8%
Far West/Rocky Mountain AK, CA, HI, NV, OR, WA, CO, ID, MT, UT, WY 21 12.5%
TOTAL 168 100.0%
RESPONDENTS BY CARNEGIE CLASSIFICATION
Carnegie Classification # of Respondents
% of Respondents
Baccalaureate Colleges - Arts & Sciences 20 11.9%
Baccalaureate Colleges - Diverse Fields 14 8.3%
Doctoral/Research Universities 12 7.1%
Master’s Colleges and Universities (larger programs) 37 22.0%
Master’s Colleges and Universities (medium programs) 10 6.0%
Master’s Colleges and Universities (smaller programs) 6 3.6%
Research Universities (high research activity) 23 13.7%
Research Universities (very high research activity) 41 24.4%
Schools of Engineering 1 0.6%
Schools of Business and Management 1 0.6%
Associate - Public Rural - serving Medium 2 1.2%
Associate - Public Rural - serving Large 1 0.6%
TOTAL 168 100.0%

72 | 2016 Spring Salary Survey | National Association of Colleges and Employers
The University of Texas at Austin - Engineering
Tufts University
Tusculum College
University of Akron
University of Arizona
University of Arkansas
University of California, Riverside
University of California, Santa Barbara
University of California, Santa Cruz
University of Cincinnati
University of Dayton
University of Delaware
University of Denver
University of Detroit Mercy
University of Evansville
University of Idaho
University of Kentucky
University of Maryland, College Park
University of Miami
University of Minnesota
University of Missouri-St. Louis
University of Missouri: College of Agriculture, Food & Natural Resources
University of Nevada, Reno
University of North Carolina - Asheville
University of North Carolina - Chapel Hill
University of North Dakota
University of Oklahoma
University of Oregon
University of Pennsylvania
University of San Diego
University of Scranton
University of St. Thomas
University of Tennessee
University of Utah
University of Wisconsin - Stout
University of Wisconsin - Oshkosh
University of Wyoming
Upper Iowa University
Ursinus College
Utah State University
Vassar College
Villanova University
Walsh University
Washington University in St. Louis
West Texas A & M
Westmont College
Widener University
Wisconsin School of Business
Worcester Polytechnic Institute
Xavier University
Youngstown State University
PARTICIPATING INSTITUTIONS cont.
APPENDIX

PARTICIPATING INSTITUTIONS cont.

SALARY SURVEY62 Highland AvenueBethlehem, PA 18017