Rural Challenges: A Telecommunications Sector Development Perspectives By Ananda Raj Khanal Director...
42
Rural Challenges: A Telecommunications Sector Development Perspectives By Ananda Raj Khanal Director Nepal Telecommunications Authority 6 February 2009 CAN ICT Conference, Makwanpur
-
Upload
maria-willis -
Category
Documents
-
view
221 -
download
2
Transcript of Rural Challenges: A Telecommunications Sector Development Perspectives By Ananda Raj Khanal Director...

Rural Challenges: A Telecommunications Sector Development Perspectives
By Ananda Raj KhanalDirector
Nepal Telecommunications Authority6 February 2009
CAN ICT Conference, Makwanpur

Nepal in Figures-1Geographic Features
• Land area: 0.03 and 0.3% of land areas of World and Asia respectively
• Altitude: 70m to 8848m ( highest in the world)
• East to west mean length: 885 km
• North to south mean breadth: 193 km
• Divided into three ecological zones: mountainous, hills and Terai

Administrative Divisions• 5 Development Regions• 14 Zones• 75 Districts • 58 Municipalities ( including metro and sub
metros)• 3915 Village Development
Committees( VDCs)• 9-35 Wards( 9 in each VDC and upto 35 in
municipalities)

Demographic figures-1• Population29,519,114 (2008 estimate)• 28,901,790 (July 2007 est.) • 25,151,423(2001 Census)• Population growth rate2.10 percent (2008 estimate)• 2.132% (2007 est.)• 2.25% ( Population Census 2001)• Urban/rural distribution• Urban 13.9%( 2001 Census)• Urban16 percent (2005 estimate)• Rural 84 percent (2005 estimate)

Demographic Figures-2
• Age structure: 0-14 years: 38.3% (male 5,721,720/female 5,360,391)
• 15-64 years: 57.9% (male 8,597,037/female 8,134,115)
• 65 years and over: 3.8% (male 528,113/female 560,414) (2007 est.)

Economic status at a glance • GDP per capita (U.S.$)$323.40 (2006)
( 2006/2007)-383 USDNRs 30738 at current prices ( USD 476)FY 2064/065
Poverty and Inequality:• % of population below absolute poverty= 30.85• Urban poverty=9.55%• Rural Poverty=34.62%• High Hills=42.5%( Gini Coefficient=0.386),
Hills=33.6%( 0.512) and Terai=29.5%( 0.478)• Average Gini coefficient=0.41• Economic growth: 4.7 %

Education:
• Literacy Rate=54.1%: Male=65.5%, Female=42.8%
• Out of 100 children admitted in class one(1) 22 appear for SLC exam and only 6 pass

Health• Life expectancy• Total 60.9 years (2008 estimate)• Female60.8 years (2008 estimate)• Male61.1 years (2008 estimate)• Infant mortality rate• 62 deaths per 1,000 live births (2008
estimate)• Child mortality rate=48 per 1000

Employment
• 74.3% employed above the age of 15 years
• 1.5 million youth unemployed
• 2.5 million of Nepalese in the international labour market (2008 estimate)

Infrastructure at a glance:Electricity-1
• Hydroelectricity potential=83000MW (estimated)• Economically feasible potential = 43000MW• Total peak system demand=721.73MW
( December 2007) 850 MW ( current 2009 January)
• Total installed capacity=398.39MW( Hydro)+53.41MW( Thermal)+ IPP
• =609 MW • Number of customers= 1524610;
domestic=95.66%, industrial=1.67%

Infrastructure at a glance:Electricity-2
• Rural Electrification and Distribution System Reinforcement Project:
• jointly funded by GoN,ADB and NEA• 22 Districts 277 VDCs• 28% Loss• 46% less than the demand in Winter• VDCs with electricity access=60%( ?)• 32% of the households have access to electricity

Infrastructure-Road
• Number of district headquarters having access to Road connectivity=69
• The total road length=17982 km
• Rural Road=7472km
• Blacktopped road length=30%

Government plans and programs: A decade in retrospect
• Two PCOs in each VDCs- target from the ninth plan
• By the end of the tenth plan the number of VDCs unserved by Telephones-1007
• By the end of the first year of TYIP this number reduced to -555 VDCs
• By the end of Mangsir 2065 this number reduced to 465 VDCs.

What went wrong?• Weak implementation • No ownership taken by the responsible
agencies • Unrealistic targets? Or Targets without
concrete programs and projects?• Monopoly operation in telecom sector• Lack of stakeholder consultation in
program formulation • 10+ years of insurgency ( internal conflict)

Comparison from Regional and World Perspectives
Country Afghanistan Banglaadesh Bhutan India Maldives Nepal Pakistan
Srilanka
Tele density
25% 16% 32% 31.5% 145% 18% 60% 61%

Internet Users by World Regions - 2008
RegionPopulation2008 Est.
InternetUsers
Penetration(%)
Africa 955,206,348 55,522,130 5.8 %
America, Caribbean 40,248,416 7,994,300 19.9 %
America, Central 151,239,059 28,639,500 18.9 %
America, North 337,167,248 250,329,477 74.2 %
America, South 384,604,198 112,925,884 29.4 %
Asia 3,776,181,949 638,783,827 16.9 %
Europe 800,401,065 394,557,882 49.3 %
Middle East 197,090,443 43,538,200 22.1 %
Oceania, Australia 33,981,562 20,594,751 60.6 %
Total World 6,676,120,288 1,552,885,951 23.3 %
Source: Internet World Stats Database, accessed on December 18, 2008. Population figures are 2008 mid-year from the U.S. Census Bureau. Please Note: Mexico is included in Central America, and Turkey is included in Europe, per United Nations Statistical Department guidelines. Copyright © 2008, Miniwatts Marketing Group.
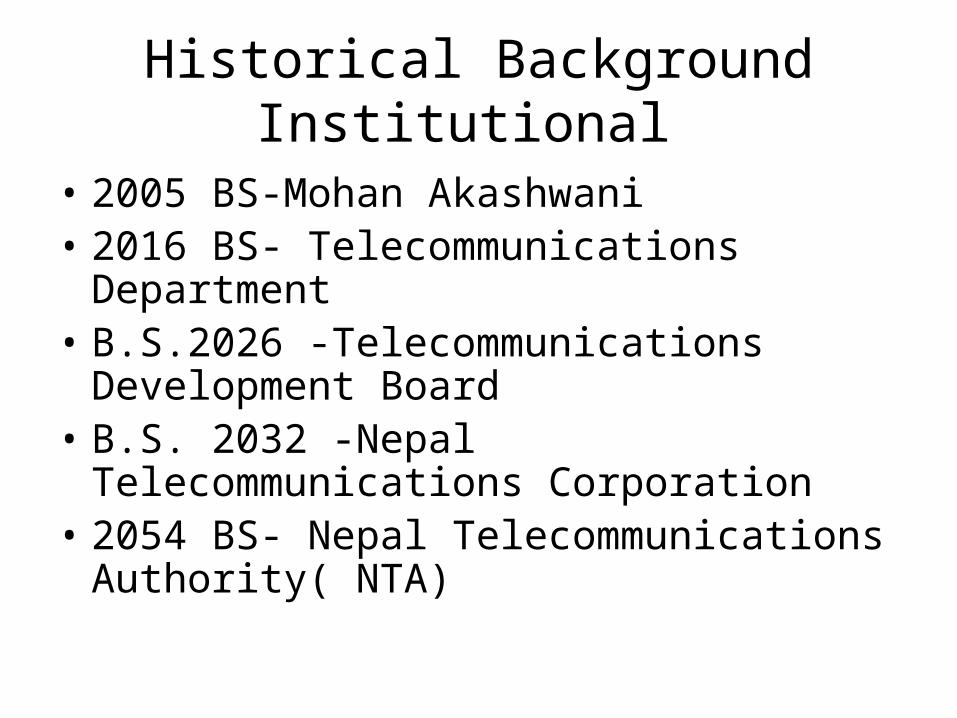
Historical BackgroundInstitutional
• 2005 BS-Mohan Akashwani• 2016 BS- Telecommunications
Department• B.S.2026 -Telecommunications
Development Board• B.S. 2032 -Nepal Telecommunications
Corporation • 2054 BS- Nepal Telecommunications
Authority( NTA)

Historical Background- Operational-1
• Year Milestone Details• 1913 Establishment of first telephone lines in
Kathmandu• 1914 Establishment of Open wire Trunk Link from
Kathmandu to Raxaul (India)• 1935 Installation of 25 lines automatic exchange in
Royal Palace• 1936 Installation of Open Wire Trunk line from
Kathmandu to Dhankuta• 1950 Establishment of Telegram Service• 1950 Introduction to High frequency Radio System (AM)• 1950 Establishment of CB telephone exchange (100
lines) in Kathmandu

Historical Background- Operational-2
• 1951 Installation of Open Wire Trunk line from Kathmandu to Palpa
• 1955 Distribution of telephone line to general public
• 1962 First Public Telephone Exchange in Kathmandu (300 lines CB)
• 1964 Beginning of International Telecommunications Service using HF Radio to India and Pakistan
• 1965 First Automatic exchange in Nepal (1000 lines in Kathmandu)

Historical Background- Operational-3
• 1971 Introduction of Telex Services• 1974 Microwave transmission links
establishment for internal trunk• 1982 Establishment of Standard "B" Type Earth
Station for international circuits• 1982 Establishment of SPC telex exchange• 1983 Establishment of digital Telephone
Exchange• 1984 Commencement of STD service

Historical Background- Operational-4
• 1984 Reliable Rural Telecom Service (JICA)
• 1987 Commencement of STD service
• 1994 Installation of Optical Fiber NetworkInternet started with e-mail services.
• 1996 Conversion of all Transmission link to Digital transmission link

Historical Background- Operational-5
• 1996 Automation of the entire Telephone Network• 1996 Independent Int. Gateway Exchange established• 1996 Introduction of VSAT services• 1997 Digital Link with D.O.T. India through Optical Fiber
in Birgunj – Raxual• License to operate Internet Services was issued to the
three ISPs Mercantile, World Link and Computer Land Communications by the Ministry of Information and Communications
• 1999 Launching of GSM Mobile service

Service NDCL SNPL UTL STMGMPCS
Operators Total
Mobile (GSM, CDMA and 3G) 2,512,153 1,725,9594,238,11
2
Fixed (PSTN, Fixed Wireless) 720,870 66,670 787,540
Limited Mobility 56,208 56208
RTS (VSAT, MARTS etc.) 2,980 2,,980
GMPCS 1,517 1,517
Total 3,233,023 1,725,959122,87
8 2,980 1,5175,086,35
7
Fixed Penetration (including LM) 3.13
Total Penetration 18.85Mobile Penetration (including GMPCS) 15.72
As of Mangsir, 2065 B.S.

Telecom sector before and after NTA is established
Before NTA was established
• 3 ISPs ( Internet and E-mail services)
• One telephone operator-NTC
• Teledensity-0.8 %

After NTA is established
S. No.
Services
Fiscal Year (B.S.)
ExistingTill
056/57
057/58
058/59
059/60
060/61
061/62
062/63
063/64
064/65
065/66
Total
LicenseCancelle
d
1. Basic Telecommunication 1 1 1 3 3
2. GSM Mobile 1 1 2 2
3. Network Service Provider 6 1 3 1 2 1 14 5 9
4. VSAT User 16 8 11
15 20 6 41 7 3 127 28 99
5. Internet (with e-mail) 13 2 3 2 6 6 7 3 3 7 52 13 39
6. Radio Paging 6 2 8 8 0
7. Fax Mail 4 2 6 6 0
8. Video Conferencing 1 1 1
9. GMPCS 2 1 3 3
10. Rural Telecom 1 1 2 2
11. Limited Mobility 2 4 4 2 12 12
12. Int. Trunk Telephone 2 2 2
13. Rural VSAT User 1 2 3 3
14. Rural ISP 1 1 1
Total 47 16 17
20 28 13 50 17 13 15 236 60 176

Challenges for Rural Telecom Development in Nepal
• No standard definition of Rural • The government of Nepal has categorized
remote areas depending on distance and geographical difficulties from accessibility and other facilities
• NTA has defined Rural Areas as VDCs which are NOT in the Kathmandu Valley,Do not have boundaries with the municipalities for the purpose of rural VSAT user license and Rural ISP license

Challenges for Rural Telecom Development in Nepal-2
Policy, Legal and Regulatory perspectives-RTDF fund established but not spent-Asymmetrical interconnection charge could not be
implemented favoring Rural operator -The provision of 15% of total investment in Rural
areas could not be enforced -Government could not give any special tax or
other rebate for rural telecom operators consistently
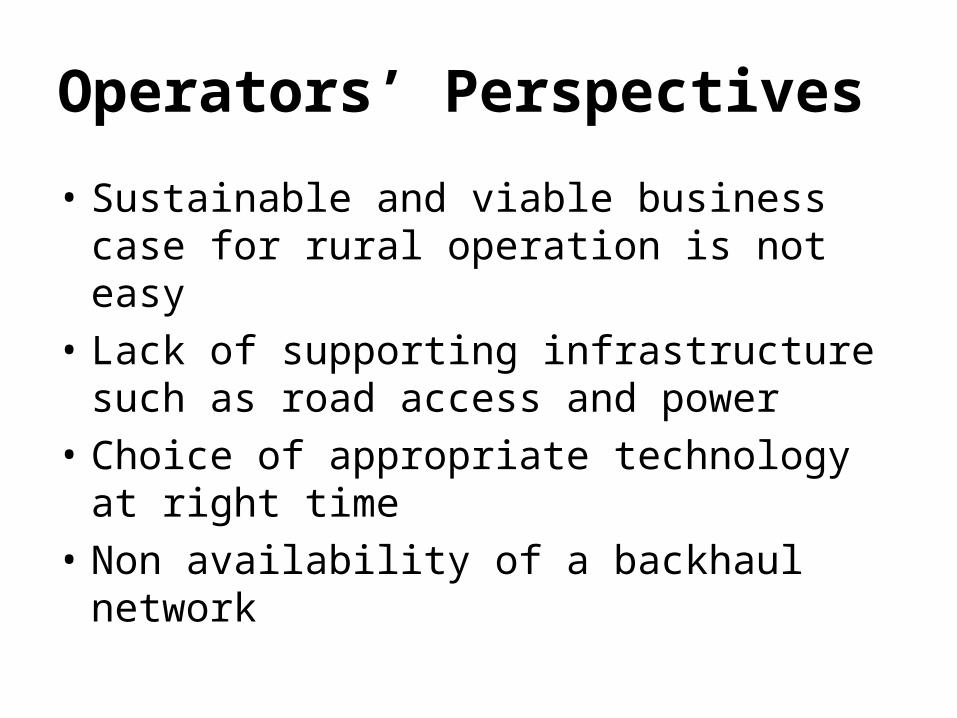
Operators’ Perspectives
• Sustainable and viable business case for rural operation is not easy
• Lack of supporting infrastructure such as road access and power
• Choice of appropriate technology at right time
• Non availability of a backhaul network

Operators’ Perspectives-2
• Scattered settlement
• Low economic power of the rural people and question of affordability even if the service is available
• Collecting bills
• Low level of literacy and lack of awareness in the use of ICT services
• Investment risk is higher

Operators’ Perspectives-3
• The delays and cumbersome procedure for accessing Right of Ways
• The delays and cumbersome procedure for connecting the telecom infrastructure to Power grid
• Delays in acquiring spectrum
• Delays in acquiring permission for import and foreign exchange
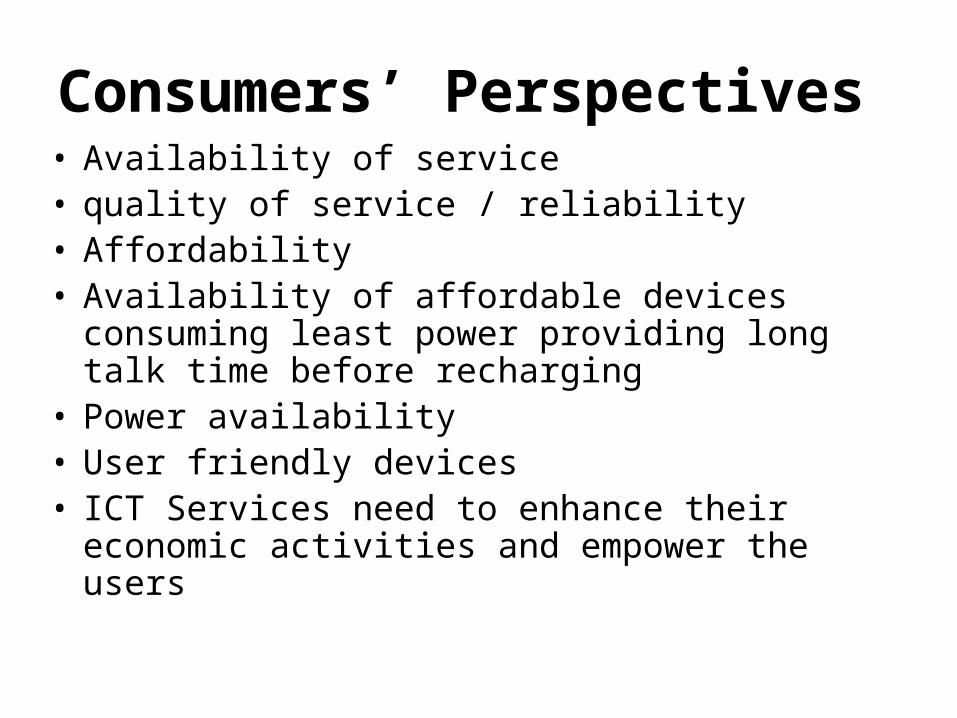
Consumers’ Perspectives • Availability of service• quality of service / reliability • Affordability• Availability of affordable devices consuming
least power providing long talk time before recharging
• Power availability• User friendly devices • ICT Services need to enhance their economic
activities and empower the users
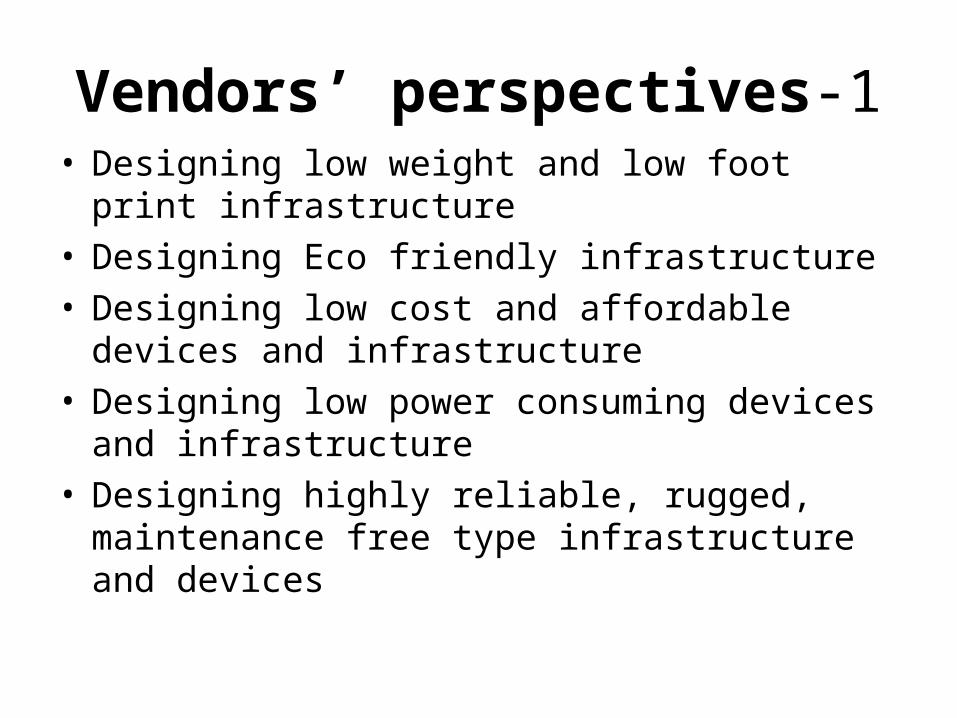
Vendors’ perspectives-1• Designing low weight and low foot print
infrastructure • Designing Eco friendly infrastructure • Designing low cost and affordable devices and
infrastructure• Designing low power consuming devices and
infrastructure • Designing highly reliable, rugged, maintenance
free type infrastructure and devices

Vendors’ perspectives-2
• Designing infrastructure and devices that is environment resistant and impact resistant
• Means huge investment in R&D
• Development and innovations of newer technologies for rural areas where backhaul is not available

CPE manufacturer’s Perspectives
• Designing low cost, low power, light weight customer premises equipment devices
• Designing user friendly devices preferably taking into consideration the literacy level of rural populace
• Supporting applications and solutions that is required by the rural people- e.g voice SMS, text to voice and voice to text conversion facility, local language ability,

Content Developer’s perspectives
• Developing killer applications
• Developing applications and services that can be linked to economic utility and social development values such as education, health and others
• Developing e-government services
• Developing e- and m-commerce services

International Organizations and Bilateral and Multilateral Donor
agencies’ perspectives• Donor harmonization• Harmonization between the supply and demand
of ICT services in rural areas• Focus on developing supporting infrastructure
such as renewable energy, transportation etc.• Should strongly lobby for emphasizing to put
ICT as an utmost priority for national development

Way Forward
• Are you discouraged by the enormous challenges?
• The opportunities are also high and encouraging
What can be done?
-capital subsidy
-operational subsidy

Way Forward-2
• Regulatory incentives
• Tax incentives
• Incentives through the provisioning of supporting infrastructure
• Providing e-gov services
• Development of appropriate applications and contents

Conclusion
• Access to ICT has been uneven-digital divide between the urban and rural
• Challenges are enormous and multi-faceted
• Prospects are equally high• Information and Communications
Technology drives the growth and provides the infrastructure for development

Conclusion-2
• Higher the awareness of the potential of ICTs and its capabilities, higher will be the demand for services
• Universal Service subsidies are needed to cover the higher cost of rural service rollout.
• A realistic growth model is to be developed

Conclusion-3
• Right applications need to be developed • Critical success factors for accelerating
ICT growth include -well articulated national sector policy for
market liberalization,- support by the government at the highest
level, - enactment of appropriate enabling laws,
regulations and guidelines