Running title: LMI for monitoring change in muscle massvuir.vu.edu.au/31985/1/Validation of...
21
1 Validation of a skinfold-based index for tracking proportional changes in lean mass Running title: LMI for monitoring change in muscle mass Keywords: anthropometry, elite athlete, LMI, rugby union, skinfolds, testing
Transcript of Running title: LMI for monitoring change in muscle massvuir.vu.edu.au/31985/1/Validation of...

1
Validation of a skinfold-based index for tracking proportional changes in lean mass
Running title: LMI for monitoring change in muscle mass
Keywords: anthropometry, elite athlete, LMI, rugby union, skinfolds, testing

2
Abstract
The lean mass index (LMI) is a new empirical measure that tracks within-subject
proportional changes in body mass adjusted for changes in skinfold thickness. Objective: To
compare the ability of the LMI and other skinfold-derived measures of lean mass to monitor
changes in lean mass. Methods: Twenty elite rugby union players undertook full
anthropometric profiles on two occasions 10 weeks apart to calculate the LMI and five
skinfold-based measures of lean mass. Hydrodensitometry, deuterium dilution and dual-
energy X-ray absorptiometry provided a criterion four-compartment (4C) measure of lean
mass for validation purposes. Regression-based measures of validity, derived for within-
subject proportional changes via log transformation, included correlation coefficients and
standard errors of the estimate. Results: The correlation between change scores for the LMI
and 4C lean mass was moderate (0.37, 90% confidence limits -0.01 to 0.66) and similar to the
correlations for the other practical measures of lean mass (range 0.26 – 0.42). Standard errors
of the estimate for the practical measures were in the range of 2.8 to 2.9%. The LMI correctly
identified the direction of change in 4C lean mass for 14 of the 20 athletes, compared with 11
to 13 for the other practical measures of lean mass. Conclusion: The LMI is probably as
good as other skinfold-based measures for tracking lean mass and is theoretically more
appropriate. Given the impracticality of the 4C criterion measure for routine field use, the
LMI may offer a convenient alternative for monitoring physique changes, provided its utility
is established under various conditions.

3
Introduction
Physique traits are known to influence competitive success in many individual and team
sports. Among adult athletic populations much of the focus on assessment of physique traits
has centred on routine monitoring of body fat levels on the basis of the negative implications
of excess body fat on frontal body surface area, power to weight ratio and thermoregulation 1.
However in sports demanding high strength and power, absolute levels of lean or muscle
mass may be more closely associated with competitive success than body fat. Data collected
during the 1999 Rugby Union World Cup revealed correlations between final ranking and
body size 2, with teams consisting of the larger forwards being more successful. In rowing,
performance is correlated with absolute levels of fat-free mass 3. While between-subject
experimental data is of interest, coaches and athletes at the elite level are more interested in
monitoring within-subject longitudinal changes as they prepare for major competitions.
Several techniques are available for measurement of fat free mass (FFM) and muscle mass,
including radiographic (computer tomography, magnetic resonance imaging, dual x-ray
absorptiometry), metabolic (creatinine, 3-methylhistidine), nuclear (total body potassium,
total body nitrogen) and bioelectrical impedance 4. Selection of the appropriate technique is
based on accuracy, reliability, expense, safety, portability, invasiveness and technical
expertise necessary to conduct the procedures. For reasons of timeliness and practicality the
routine monitoring of body composition among athletic populations is often undertaken using
anthropometric traits such as body mass and subcutaneous skinfold thicknesses. Estimates of
body density, fat mass and/or FFM are then derived using one of many regression equations.
However, these equations are based on a single-measurement between-subject cross-sectional
comparison of anthropometric parameters and laboratory-based techniques such as
hydrodensitometry 5. To our knowledge only one previous investigation 6 detailed the ability
of practical anthropometry measures to track changes in body composition when assessed

4
using a criterion measure. Furthermore most equations were derived from non-athletic
populations 7. A major issue is the ability of these equations to track changes in physique
traits of athletes in response to training and/or dietary interventions 5, 8. In particular, the
ability of skinfold-based prediction equations to track changes in the lean mass of elite
athletes needs to be established.
A novel approach of assessing lean mass changes in elite athletes using a simple field test of
basic anthropometric measures has been proposed (SEE COMPANION PAPER). The Lean
Mass Index (LMI) is an empirical measure that tracks within-subject proportional changes in
body mass adjusted for changes in skinfold thickness. As such, the LMI tracks changes in
body mass not associated with changes in skinfolds. The LMI could be a simple and practical
measure for estimating changes in lean mass of trained athletes. The primary objective of this
study was therefore to establish the reliability and validity of the LMI against the criterion
four compartment (4C) model and other skinfold-based measures of fat-free mass or muscle
mass.
Methods
Subjects
Twenty Super 12 rugby players (9 forwards, 11 backs) of Caucasian, Polynesian or
Melanesian ethnicity volunteered for this study. The players age (mean ± SD) was 23.2 ± 2.0
years, with a body mass of 96.0 ± 10.3 kg, a sum of seven skinfolds of 80.9 ± 23.2 mm, and a
LMI of 53.1 ± 5.3 mm.kg-0.14.
Experimental Design
Volunteers undertook assessment of physique traits, including both anthropometrically
derived indexes (including the LMI) and criterion two (2C), three (3C) and 4C measures,
before and after 10 weeks of intensive pre-season strength and conditioning training. To

5
assess the utility of the LMI and other anthropometrically derived indexes against the
criterion measures we established the mean change over the 10 weeks, the precision of the
estimate, and the degree of individual response around the mean change.
To minimize within-subject biological variability, all assessments, excluding the dual energy
x-ray absorptiometry (DXA) scan, were conducted on the same morning (0500 - 0900 h)
when volunteers were at least 8 h post-prandial and in a euhydrated state. DXA
measurements were undertaken within 6 h of the other tests (1200 - 1400 h). To standardize
hydration status, volunteers were provided with guidelines on maximizing hydration status in
the 24 h prior to each assessment. Volunteers were provided with 1.0 L of a commercially
available oral rehydration solution (Gastrolyte®) following their final training session on the
day prior to assessments. To confirm hydration status, the specific gravity of the first void
urine sample was assessed immediately using an automated refractometer (UG-1, Atago Ltd,
Tokyo, Japan).
Body Composition
Practical Measures - Anthropometry
Full anthropometric profiles, including body mass, stretch stature, sitting height, skinfolds at
nine sites, eleven girths, nine lengths and six breadths were landmarked and measured by an
International Society for the Advancement of Kinanthropometry (ISAK) accredited level III
anthropometrist with technical errors of measurement of 1.7% for skinfolds and <1% for all
other measures. Sitting height and stretch stature were measured using a Harpenden wall-
mounted stadiometer (Holtain Ltd, Crosswell, United Kingdom) with a precision of ± 1mm.
Skinfolds were assessed using Harpenden calipers (British Indicators Ltd, Hertfordshire,
United Kingdom). Girth measurements were made with a flexible steel tape (Lufkin W 606
PM, Cooper Industries, Lexington, SC). Lengths were assessed using a large sliding caliper

6
(British Indicators Ltd, Hertfordshire, United Kingdom). The majority of breadths were also
measured with the large sliding caliper; biepicondylar breadths were measured with vernier
calipers (Holtain Ltd, Crosswell, United Kingdom). All anthropometric equipment was
calibrated prior to each assessment period, with additional checks against National
Association of Testing Authorities (NATA) certified calibration weights and rods.
All measurements were made on the right side of the body using techniques previously
described 9. The full anthropometric profile was undertaken in duplicate to establish within-
day retest reliability. If the difference between duplicate measures exceeded 4% for skinfolds
or 1% for all other parameters, a third measurement was taken but only after the full profile
had been completed in duplicate. The mean of duplicate or median of triplicate
anthropometric measurements were used for all subsequent analysis.
Lean Mass Index
Detailed methods for the calculation of the LMI are provided elsewhere (SEE COMPANION
PAPER). Briefly, we analyzed the relationship between changes in log-transformed mass and
sum of skinfolds using repeated-measures multiple linear regression. Back-transformation
yielded a function of mass and sum of skinfolds. The function tracked changes in mass
controlled for changes in skinfolds. The LMI is a supplementary estimate of body
composition and allows the quantification of proportional changes in lean mass.
Prediction Equations
Anthropometric data were used to derive estimates of muscle mass via fractionation 10 or
body density 11-13. The Siri equation 14 was used to convert body density to body fat (%). Fat
free mass was then calculated according to the formula: FFM = Body mass – (body mass *
fat (%)/100). Specific anthropometric data used in each estimate are specified in Table 1.

7
Criterion Measures
The 4C body composition model involves the measurement of body density (BD), total body
water (TBW) and bone mineral content (BMC) by hydrodensitometry, isotopic (deuterium)
dilution and DXA respectively. Derivation of the 4C model is described elsewhere 13. The 4C
model served as the gold standard from which changes in anthropometrically derived data
were compared. The 2C model is derived from BD alone while the 3C model also
incorporates TBW in the calculation of FFM.
Total Body Water
Total body water was measured using the stable isotope of hydrogen, deuterium, in the form
of water (2H2O). Volunteers presented at the laboratory at 0500 h on the day of assessment,
voided their bladder and provided a small urine sample (~20-30 ml). Body mass was
measured on a calibrated digital scale with a precision of ± 0.02 kg (A & D Co., Tokyo,
Japan). Thereafter athletes drank a 10% solution of 2H2O (diluted with tap water) based on
their body mass (0.5 g.kg-1). The dose consumed was recorded to one-hundredth of a gram.
An equilibrium period of approximately 4 h without eating, drinking or exercising was
enforced between administration of the tracer and collection of the post-dose urine sample.
Enrichment of the pre-dose urine sample, the post-dose urine sample, local tap water and the
dose given were measured in duplicate via isotope ratio mass spectrometry (Hydra, Europa
Scientific, Crewe, UK) using procedures described previously 15. The mean of duplicate
measures was used in subsequent analysis. Total body water was calculated in accordance
with the recommendations of Schoeller et al. 16, who advocate a 3% correction factor for the
exchange of 2H2O with labile hydrogen of protein and other body constituents.

8
Hydrodensitometry
Body density was determined by underwater weighing at approximately functional residual
capacity, with measurement of associated respiratory gas volume by oxygen dilution
immediately following each trial (while the subject remained immersed to neck level) using
procedures described previously 17. A minimum of three and a maximum of eight trials were
performed, with the median of three trials showing the least variability used in all subsequent
calculations.
Dual-energy X-ray Absorptiometry
Total BMC was determined using a Norland XR-36 series DXA (Norland Corp., Fort
Atkinson, WI), with Norland Body Composition software (v. 2.5.0) in the medium mode 18.
As the BMC reported from DXA represents ashed bone, results were multiplied by a
correction factor (1.0426) to obtain bone mineral mass 19. Quality control calibration
procedures were undertaken according to the manufacturer’s specifications at the beginning
of each testing session using calibration standards provided with the scanner. Volunteers
were scanned while wearing minimal clothing, with all metallic objects removed prior to
assessment.
Statistical Analysis
The LMI is intended to track proportional or percent changes in lean mass 20. The LMI and
the other measures in this study were therefore log transformed for all analyses 21, because
this approach converts uniform proportionality into uniform additively (an implicit
assumption for the linear modelling in the validity analyses). The Pearson correlation
coefficient was calculated for the straight line fit between the criterion and each practical
measure of FFM in the pre-test, the post-test, and the 10-week post-pre change scores. For
change scores, the line was forced through the origin; the slope of the resulting line thereby

9
represented the scaling factor for predicting percent changes in the criterion measure from
percent changes in the practical measure, and the standard error of the estimate was the
prediction error. Magnitudes of correlations were interpreted qualitatively using Cohen's
scale: r < 0.1, trivial; 0.1–0.3, small; 0.3–0.5, moderate, >0.5, large. Confidence limits for
correlations and for the difference between correlations were derived by re-sampling 3000
times from the original data (bootstrapping). Measures of centrality and spread are shown as
mean ± between-subject standard deviation (SD). The magnitude of change is expressed as
percentage of the baseline score ± SD. Uncertainty in population values of statistics was
expressed as 90% confidence limits (90%CL). The typical (standard) error of measurement
was calculated as the measure of within-day retest reliability 21. Analyses were performed
using the Statistical Analysis System (Version 8.02, SAS Institute, Cary, NC).
Results
The baseline values in anthropometric measures and proportional changes in height, sum of
seven skinfolds, and anthropometric measures of muscle mass and FFM are provided in
Table 2. All mean changes in body composition over the 10 weeks were trivial, with the
exception of a small increase in FFM calculated using the Forsyth and Sinning 11 equation,
and a small decrease in the sum of seven skinfolds. Individual variation in the changes (the
SD of the change scores) was either trivial or small for all measures of lean mass, with the 4C
criterion measure showing the largest variation. Variation in the sum of skinfolds was of
similar small magnitude, but the variation in total body water was moderate-large.
Figure 1 shows graphically the relationships of the baseline, post and change scores of the 4C
criterion measure with those of the LMI, and Table 3 lists statistics for the relationships of the
4C model with all measures. The 3C measure and body water had very high correlations for
baseline, post and change scores. Correlations for baseline and post values of the practical
10
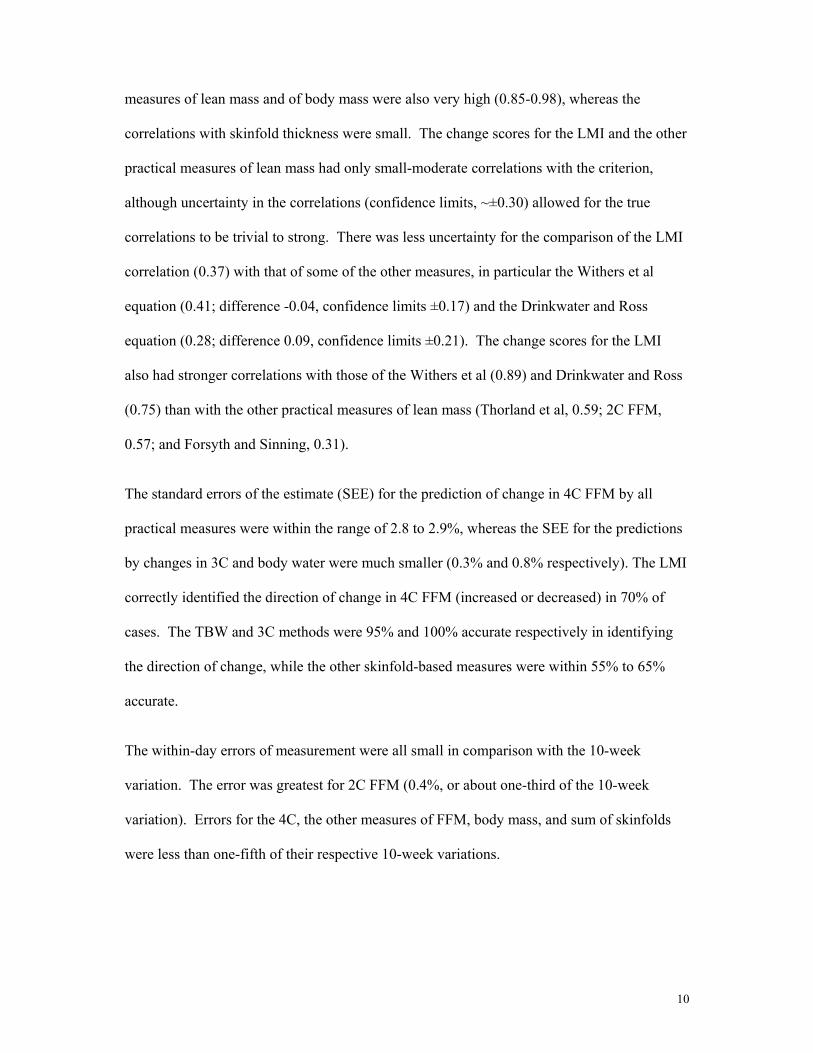
measures of lean mass and of body mass were also very high (0.85-0.98), whereas the
correlations with skinfold thickness were small. The change scores for the LMI and the other
practical measures of lean mass had only small-moderate correlations with the criterion,
although uncertainty in the correlations (confidence limits, ~±0.30) allowed for the true
correlations to be trivial to strong. There was less uncertainty for the comparison of the LMI
correlation (0.37) with that of some of the other measures, in particular the Withers et al
equation (0.41; difference -0.04, confidence limits ±0.17) and the Drinkwater and Ross
equation (0.28; difference 0.09, confidence limits ±0.21). The change scores for the LMI
also had stronger correlations with those of the Withers et al (0.89) and Drinkwater and Ross
(0.75) than with the other practical measures of lean mass (Thorland et al, 0.59; 2C FFM,
0.57; and Forsyth and Sinning, 0.31).
The standard errors of the estimate (SEE) for the prediction of change in 4C FFM by all
practical measures were within the range of 2.8 to 2.9%, whereas the SEE for the predictions
by changes in 3C and body water were much smaller (0.3% and 0.8% respectively). The LMI
correctly identified the direction of change in 4C FFM (increased or decreased) in 70% of
cases. The TBW and 3C methods were 95% and 100% accurate respectively in identifying
the direction of change, while the other skinfold-based measures were within 55% to 65%
accurate.
The within-day errors of measurement were all small in comparison with the 10-week
variation. The error was greatest for 2C FFM (0.4%, or about one-third of the 10-week
variation). Errors for the 4C, the other measures of FFM, body mass, and sum of skinfolds
were less than one-fifth of their respective 10-week variations.

11
Discussion
This investigation was prompted by the need to establish a fast, convenient, and valid
measure of changes in lean mass in highly trained athletes. For this purpose we compared
relationships between change scores for a criterion measure of lean mass with a new practical
measure of lean mass (the LMI), and an array of existing anthropometrically derived
estimates of lean mass. Professional rugby union athletes were monitored during 10 weeks of
pre-season training, a period in which both changes in fat mass and fat free mass were a
priority for the players. The primary finding of this investigation is that the LMI is probably
as good as other skinfold-derived measures for tracking within-subject lean mass changes.
Moreover, the practical measures evaluated in this study were as effective as the conventional
2C model of hydrodensitometry alone in tracking changes in lean mass. Thus, the LMI can be
used to routinely monitor changes in FFM.
A number of cross-sectional between-subject validation studies have been undertaken on
anthropometric methods of assessing physique traits primarily using the 2C
hydrodensitometry model as the gold standard, or more recently the 4C model. As has been
observed previously 6, cross-sectional validity assessments between criterion and
anthropometric measures often identify strong relationships in heterogeneous populations.
This was also the case in the present investigation; most likely because of the influence of
body mass, which itself showed a strong correlation with the criterion measure. However,
single time point assessments do not address the ability of a specific technique to track
changes in physique traits over time. As we were most interested in monitoring changes in
physique traits of the athletes during a period of pre-season training, we validated commonly
used physique assessment tools in tracking changes in lean mass. These correlations between
within-subject percent change scores can not be confounded by body mass.

12
Few studies have been undertaken to validate the ability of various techniques to track change
in physique traits. Van Marken Lichtenbelt and associates 6 observed a strong relationship (r
= 0.88) between the gold standard 4C model and skinfold derived estimates of FFM change.
Because of the relatively large method error, the authors suggested skinfold estimates be
employed to monitor group responses rather than that of individual athletes. Others have
reported that anthropometrically derived equations may not be accurate predictors of changes
in body composition 5, 8. Prediction equations currently available have not been formulated to
monitor within-subject changes in physique traits. Rather they were created to offer an
estimate of between-subject physique traits at a single time point. Consequently, it is not
surprising that estimates from these equations correlated only moderately with the criterion
measure when monitoring an individual longitudinally.
The short-term test-retest measurement error of the 4C criterion measure and the other
measures of FFM were all much less than the variation in the change scores over the 10
weeks of the present investigation. The change scores therefore represented real changes
within each subject rather than measurement error. Further, error of measurement arising
from physique assessment did not account for the relatively modest correlations between
change scores. We must conclude that there were substantial changes in criterion lean mass
that were not tracked by the practical measures of lean mass.
When changes in the LMI or other practical measures are calibrated to the criterion using the
slopes of the lines of best fit (Table 3), the error in the estimate is ~3%. It follows that the
calibrated practical measures are suitable only for tracking changes somewhat greater than
3%. It is important to recognize that the slopes of the change in criterion measure/change in
practical measure relationship have considerable uncertainty. Furthermore, the slopes may
also be different for moderate to large changes. With this in mind, it would be sensible to

13
regard this investigation as providing reasonable evidence that the LMI is comparable with
the other practical measures of lean mass, and that the LMI is theoretically at least more
appropriate for tracking changes in individuals. We acknowledge the LMI provides a
proportional rather than an absolute measure of change in FFM. Despite this, the LMI tracked
changes in FFM as well as other anthropometry derived measures and predicted the correct
direction of change better than other practical tools. The improved ability to predict the
direction of change may be attributable to greater specificity of the equation to the population
under investigation and/or that the LMI has been derived from the longitudinal assessment of
within-subject changes in mass and skinfolds.
In summary, given that the 4C criterion measure will never be an option for routine field use,
the LMI and other practical, anthropometrically derived tools may offer a convenient, fast
and economical option for monitoring physique changes. However, the LMI remains a
proportionality index that tracks changes in mass not accounted for by changes in skinfolds
and further investigation is required to establish its utility under all conditions.
Acknowledgements
The authors would like to acknowledge the Australian Sports Commission, NSW Rugby
Union, Royal North Shore Hospital (Sydney), and the University of Sydney.
Volunteers were fully informed of the nature and possible risks of the investigation before
giving their written informed consent. The investigation was approved by the Human
Research Ethics Committee of the Australian Institute of Sport (Approval Number
20031013).

14
References
1. Norton K, Olds T, Olive S, Craig N. Anthropometry and sports performance. In:
Norton K, Olds T, editors. Anthropometrica. Sydney: University of New South Wales
Press; 1996. p. 287-364.
2. Olds T. The evolution of physique in male rugby union players in the twentieth
century. Journal of Sports Sciences 2001;19:253-262.
3. Yoshiga C, Kawakami Y, Fukunaga T, Okamura K, Higuchi M. Anthropometric and
physiological factors predicting 2000 m rowing ergometer performance time.
Advances in Exercise and Sports Physiology 2000;6:51-57.
4. Lukaski HC. Estimation of muscle mass. In: Roche AF, Heymsfield SB, Lohman TG,
editors. Human Body Composition. Champaign, IL: Human Kinetics; 1996. p. 109-
128.
5. Cisar CJ, Housh TJ, Johnson GO, Thorland WG, Hughes RA. Validity of
anthropometric equations for determination of changes in body composition in adult
males during training. Journal of Sports Medicine and Physical Fitness
1989;29(2):141-148.
6. van Marken Lichtenbelt WD, Hartgens F, Vollaard NB, Ebbing S, Kuipers H. Body
composition changes in bodybuilders: a method comparison. Medicine and Science in
Sports and Exercise 2004;36(3):490-497.
7. Lee RC, Wang Z-M, Heo M, Ross R, Janssen I, Heymsfield SB. Total-body skeletal
muscle mass: development and cross-validation of anthropometric prediction models.
American Journal of Clinical Nutrition 2000;72:796-803.

15
8. Wilmore JH, Girandola RN, Moody DL. Validity of skinfold and girth assessment for
predicting alterations in body composition. Journal of Applied Physiology
1970;29(3):313-317.
9. Norton K, Whittingham N, Carter L, Kerr D, Gore C, Marfell-Jones M. Measurement
techniques in anthropometry. In: Norton K, Olds T, editors. Anthropometrica.
Marrickville, NSW: Southwood Press; 1996. p. 25-75.
10. Drinkwater DT, Ross WD. Anthropometric fractionation of body mass. In: Ostyn MD,
Beunen G, Simons J, editors. Kinanthropometry II. Baltimore: University Park Press;
1980. p. 178-189.
11. Forsyth HL, Sinning WE. The anthropometric estimation of body density and lean
body weight of male athletes. Medicine and Science in Sports and Exercise
1973;5(3):174-180.
12. Thorland WG, Johnson GO, Tharp GD, Housh TJ, Cisar CJ. Estimation of body
density in adolescent athletes. Human Biology 1984;56(3):439-448.
13. Withers B, Laforgia J, Heymsfield S, Wang Z, Pillans R. Two, three and four-
compartment models of body composition analysis. In: Norton K, Olds T, editors.
Anthropometrica. Sydney: University of New South Wales Press; 1996. p. 199-234.
14. Siri WE. Body volume measurement by gas dilution. In: Brozek J, Henschel A,
editors. Techniques for measuring body composition. Washington, DC: National
Academy of Sciences; 1961. p. 108-117.

16
15. Bell NA, McClure PD, Hill RJ, Davies PS. Assessment of foot-to-foot bioelectrical
impedance analysis for the prediction of total body water. European Journal of
Clinical Nutrition 1998;52(11):856-859.
16. Schoeller DA, Ravussin E, Schutz Y, Acheson KJ, Baertschi P, Jequier E. Energy
expenditure by doubly labeled water: validation in humans and proposed calculation.
American Journal of Physiology 1986;250(5):R823-R830.
17. Van Der Ploeg GE, Gunn SM, Withers RT, Modra AC, Crockett AJ. Comparison of
two hydrodensitometric methods for estimating percent body fat. Journal of Applied
Physiology 2000;88:1175-1180.
18. Gotfredsen A, Baeksgaard L, Hilsted J. Body composition analysis by DEXA by
using dynamically changing samarium filtration. Journal of Applied Physiology
1997;82(4):1200-1209.
19. Heymsfield SB, Lichtman S, Baumgartner RN, Wang J, Kamen Y, Aliprantis A, et al.
Body composition of humans: comparison of two improved four-compartment models
that differ in expense, technical complexity, and radiation exposure. American
Journal of Clinical Nutrition 1990;52(1):52-58.
20. Duthie GM, Pyne DB, Livingstone S, Hopkins WG, Hooper S. Anthropometry
profiles of elite super 12 rugby players: quantifying changes in lean mass. Medicine
and Science in Sports and Exercise 2005:Submitted for review.
21. Hopkins WG. Measures of reliability in sports medicine and science. Sports Medicine
2000;30(1):1-15.

17

18
Figures
Figure 1: The first panel is a two-dimension plot showing a nearly perfect relationship between the 4 compartment estimate of FFM and the LMI before and after 10 weeks of
pre-season training for 20 individual subjects. The second panel shows a moderate relationship between change scores for the 4 compartment estimate of FFM and the
LMI after 10 weeks of pre-season training for 20 individual subjects. Solid line represents the mean correlation for the change scores from baseline. The dashed line
represents the line of identity.

19
Tables
Table 1: Estimates of muscle mass and body density and the anthropometric measurements they are derived from.
Reference Estimate Anthropometric Measures
Drinkwater and Ross 1980 10 Muscle mass Skinfold correcteda relaxed arm, chest, mid thigh and calf
girths plus forearm girth
Forsyth and Sinning 1973 11 Body density Subscapula, abdominal, tricep and mid-axilla skinfolds
Thorland et al., 1984 12 Body density Tricep, subscapula, mid-axilla, iliac crest, abdominal,
thigh and calf skinfolds
Withers et al., 1996 13 Body density Tricep, subscapula, bicep, supraspinale, abdominal, thigh
and calf skinfolds
a Corrected girths are raw girths corrected for skinfolds by subtracting the appropriate
skinfold thickness (cm) multiplied by π

20
Table 2: Baseline values (mean ± SD) in anthropometric measures for 20 rugby union players and proportional changes (mean ± SD) after 10 weeks of intensive training.
Baseline Change (%)
Body Mass (kg) 96.0 ± 10.3 -1.0 ± 2.1
Height (cm) 184.1 ± 6.8 0.1 ± 0.3
Sum of seven skinfolds (mm) 80.9 ± 23.2 -9.2 ± 9.6
Lean Mass Index (mm.kg-0.14) 20 53.1 ± 5.3 0.3 ± 1.5
Drinkwater and Ross 1980 10 47.5 ± 4.7 -0.1 ± 1.2
FFM Prediction Equations (kg)
Forsyth and Sinning 1973 11 75.8 ± 7.6 2.8 ± 2.9
Thorland et al., 1984 12 81.0 ± 6.7 1.3 ± 2.1
Withers et al., 1996 13 82.1 ± 7.2 0.4 ± 1.5
Hydrodensitometry FFM (kg)
2C 83.6 ± 6.9 0.5 ± 1.4
3C 81.7 ± 7.6 -0.1 ± 3.1
4C 81.6 ± 7.5 -0.2 ± 3.0
Body Water 82.1 ± 8.6 -0.6 ± 5.3
21
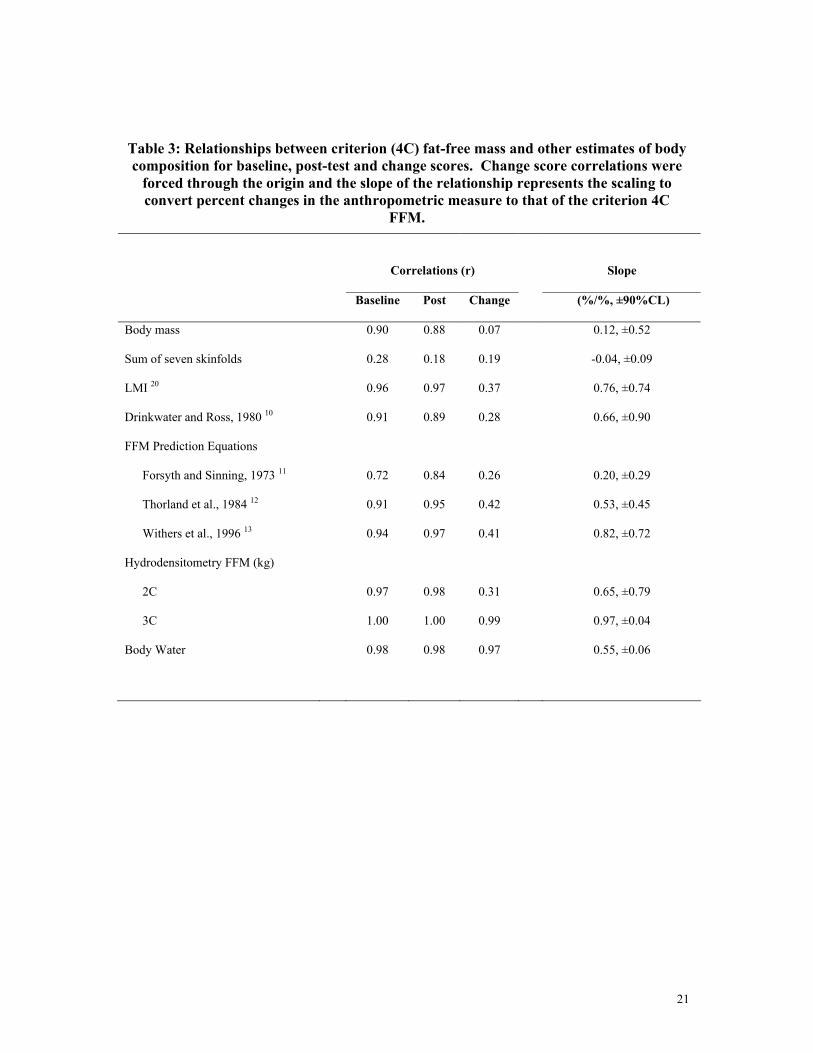
Table 3: Relationships between criterion (4C) fat-free mass and other estimates of body composition for baseline, post-test and change scores. Change score correlations were
forced through the origin and the slope of the relationship represents the scaling to convert percent changes in the anthropometric measure to that of the criterion 4C
FFM.
Correlations (r) Slope
Baseline Post Change (%/%, ±90%CL)
Body mass 0.90 0.88 0.07 0.12, ±0.52
Sum of seven skinfolds 0.28 0.18 0.19 -0.04, ±0.09
LMI 20 0.96 0.97 0.37 0.76, ±0.74
Drinkwater and Ross, 1980 10 0.91 0.89 0.28 0.66, ±0.90
FFM Prediction Equations
Forsyth and Sinning, 1973 11 0.72 0.84 0.26 0.20, ±0.29
Thorland et al., 1984 12 0.91 0.95 0.42 0.53, ±0.45
Withers et al., 1996 13 0.94 0.97 0.41 0.82, ±0.72
Hydrodensitometry FFM (kg)
2C 0.97 0.98 0.31 0.65, ±0.79
3C 1.00 1.00 0.99 0.97, ±0.04
Body Water 0.98 0.98 0.97 0.55, ±0.06