Roving Bandits? The Geographical Evolution ofkcb38/BGL_ISQ.pdfRoving Bandits? The Geographical...
49
Roving Bandits? The Geographical Evolution of African Armed Conflicts 1 Kyle Beardsley Kristian Skrede Gleditsch Nigel Lo 1 Previous versions of this article were presented at the 2013 Annual Meeting of the International Studies Association and seminars at the Universities of Essex, Leeds, and Virginia. We thank the participants, and in particular Graeme Davies, Edward Newman, Sara Polo, Andrea Ruggeri, Todd Sechser, Jonah Schulhofer-Wohl, and Nils Weidmann, for helpful comments and suggestions, as well as the editors of the journal and the anonymous reviewers. Gleditsch is grateful for support from the Research Council of Norway (213535/F10) and the European Research Council (313373).
Transcript of Roving Bandits? The Geographical Evolution ofkcb38/BGL_ISQ.pdfRoving Bandits? The Geographical...
Roving Bandits? The Geographical Evolution of
African Armed Conflicts1
Kyle Beardsley Kristian Skrede Gleditsch Nigel Lo
1Previous versions of this article were presented at the 2013 Annual Meeting of the
International Studies Association and seminars at the Universities of Essex, Leeds, and
Virginia. We thank the participants, and in particular Graeme Davies, Edward Newman, Sara
Polo, Andrea Ruggeri, Todd Sechser, Jonah Schulhofer-Wohl, and Nils Weidmann, for helpful
comments and suggestions, as well as the editors of the journal and the anonymous reviewers.
Gleditsch is grateful for support from the Research Council of Norway (213535/F10) and the
European Research Council (313373).
Abstract
The fighting in some civil wars primarily takes place in a few stable locations, while
the fighting in others moves substantially. We posit that rebel groups that do not
primarily fight for a specific ethnic group, that receive outside military assistance, or
that have relatively weak fighting capacity tend to fight in inconsistent locations. We
develop new measures of conflict zone movement to test our hypotheses, based on shifts
in the conflict polygons derived from the new Georeferenced Event Dataset (GED)
developed by the Uppsala Conflict Data Program (UCDP). Our empirical results
provide support for the suggested mechanisms, and we find that groups which have
neither strong ethnic ties nor sufficient military strength to compete with government
forces in conventional warfare fight in more varied locations. These findings improve
our understandings and expectations of variations in the humanitarian footprint of armed
conflicts, the interdependencies between rebel groups and local populations, and the
dilemmas faced by government counterinsurgency efforts.
3
Introduction
The size of civil wars varies not just in intensity of bloodshed but also in the geographic
scope of the conflict. The violence in some civil wars remains concentrated in isolated
regions, while in others the conflict zones move considerably, can expand to encompass
much of the state, and even frequently cross international boundaries. Understanding
this variation allows us to anticipate the humanitarian footprint of the devastation created
by armed struggle. Moreover, this variation can also tell us much about the relationship
between rebel groups and the local communities with which they interact, as well as the
strategic ways in which rebel groups respond to state counterinsurgency efforts.
Based on the incentives of rebels and governments, we develop a new theory to
distinguish between more roving and more stationary rebels in civil wars. We
emphasize the effects of whether rebels have a local constituency and incentives to
develop a social contract with it, and the relative strength of actors. These factors relate
to strong incentives for a geographically mobile conflict that can overcome the incentives
of the rebels to keep operations localized. To test the observable implications of our
theory, we analyze the observed patterns of conflict zone movement in African armed
conflicts, using the Georeferenced Event Dataset (GED) developed by the Uppsala
Conflict Data Program (UCDP). The results show that conflict zones remain more
confined and localized when rebels claim to represent a specific ethnic group and do not
receive outside military support, consistent with our claims that such groups have strong
inclinations to consolidate local control, support and cover while governments
confronting such groups find a strategy of displacement less attractive than containment.
We also find that conflict zones move more when the strength of government forces
4
dominates that of the rebels, consistent with our claim that stronger governments can
displace rebels—forcing them to stay mobile as a means of survival. Furthermore, the
results suggest an interactive effect, such that conflict zones see the greatest amount of
mobility when they involve rebel groups with neither strong local ties nor sufficient
relative strength.
Recent research on civil war has highlighted the importance of the specific locations
or zones where conflict takes place. Civil wars often take place in confined and atypical
parts of a country that may differ substantially from national average or aggregate
measures. Researchers have emphasized the need to look at the local characteristics in
conflict zones to evaluate claims about possible motives and opportunities for conflict
(Buhaug and Rød 2006; Buhaug, Cederman and Rød 2008; Cederman, Buhaug and Rød
2009; Cederman, Weidmann and Gleditsch 2011; Cunningham and Weidmann 2010;
Hegre, Østby and Raleigh 2009; Raleigh and Hegre 2009; Weidmann 2009, 2011;
Weidmann and Ward 2010; Zhukov 2012). This line of research has proven helpful and
productive. However, one important limitation of much existing research remains that the
conflict zone is treated as a fixed attribute, invariant over the conflict.
In reality, conflict zones can change considerably over the course of the hostilities.
A number of studies have considered the potential for intrastate conflict to spread
between countries (Beardsley 2011; Braithwaite 2010; Buhaug and Gleditsch 2008;
Salehyan 2009; Salehyan and Gleditsch 2006). A great deal of recent work has examined
the spread of conflict event locations using more geographically disaggregated
information (Schutte and Weidmann 2011; Zhukov 2012). However, as of yet, research
has not had much to say about the evolution or movement of overall conflict zones over
time, and we lack answers as to why the locations where rebel-government dyads fight in
5
some conflicts remain stable while in others they vary substantially. Research on the
temporal dynamics of conflict often argues that studying how events unfold after the initial
onset of a conflict can provide important information on the causes of a conflict and the
intentions of actors (Blainey 1988; Cunningham, Gleditsch and Salehyan 2009; Wagner
2000). Our investigation of the geographical evolution of conflict similarly helps shed
light on the varying incentive structures driving rebel behavior, allows for existing
explanations of intrastate conflict that emphasize local characteristics to become more
dynamic, and also enhances the ability to explain and predict the varying threats
rebellions raise for state stability as well as humanitarian concerns.
Theory: Why Rove?
We consider the dilemmas that rebels and states face in shaping their conflicts’ geographic
trajectories. Rebels and governments on the one hand face various incentives to keep
conflict localized, and they at the same time also have a different set of incentives to
force the conflict into multiple theaters. We start with the case for why rebels can benefit
from more enduring or stationary conflict zones. Mancur Olson’s (1993, 2000)
concept of roving and stationary warlords proves informative here. As a thought
experiment, Olson considers two different types of bandits under anarchy. Roving bandits
rely on brute force to move from place to place, extract rents, and then move onto the next
location after they have drained the available resources in one place. Stationary bandits,
in contrast, extract resources by taxing local production and hence develop an
encompassing interest in the welfare of the local economy. The stationary bandit does
not have an interest in destroying or in extracting all the currently available resources, for
6
fear that there will be fewer resources to extract in the future. As such, stationary bandits
extract resources not just by force but through some form of implicit social contract,
where the bandits provide public goods such as security and in return receive rents. In
this sense, stationary bandits set up hierarchical relationships with the population
resembling a proto-state. This gives an incentive for the stationary bandit to invest in the
conquered area rather than completely exploit it. Armed actors able to establish
consistent hierarchy can come to rule with consent, or legitimate authority, rather than
through expensive brute force against continued resistance. Applied to the intrastate
conflict context, rebel groups that stay localized— and, by implication, that fight in
more consistent locations—can better compete with the state as the side with legitimate
authority and win local support.
In further considering why rebels often would have strong incentives not to move,
recent research has emphasized how the specific locations where conflict takes place
reflect the characteristics of the rebel group or its objectives (Buhaug and Lujala 2005;
Buhaug and Gates 2002). In many cases, rebel groups claim to fight on behalf of an ethnic
group, and the independence or autonomy of a specific ethnic homeland. Rebels that
aspire to become a state are more likely try to cultivate a sustained relationship with
their target audience and area, hoping to eventually rule by consent or legitimacy, and
often invest considerably in governance functions (Mampilly 2011). Defending the
core area and denying government control becomes a key priority for such rebels.
Defending the home ground can enable groups to gain more local support or establish
stronger control. This makes roaming outside the core constituency area difficult to
defend for a rebel group, even if militarily expedient. Rebels rarely have complete
territorial control during an ongoing civil war, and we should see consistent fighting
7
between rebels and governments in specific contested areas. For example, the Liberation
Tigers of Tamil Elam in Sri Lanka fought in the claimed homeland in the North (and to a
lesser extent East) of the Island.
At the same time, rebels have many well-recognized competing preferences for
mobility, which in turn can make the geographical conflict zone change over time or
become more fluid. Although rebel groups benefit from staying local, they often become
mobile as a means to survive. Olson’s thought experiment considers warlords in a state
of anarchy, where the main threats come from other warlords. By contrast, most rebels
do not face a state of anarchy, but rather challenge the power and control of an existing
state, which normally has greater resources than the rebels. Comparatively weak groups
stand a high risk of defeat if they try to fight the state in the same location or consistent
theaters of combat. Staying mobile allows them to carry out typical guerrilla tactics meant
to hurt the state without as much risk of complete defeat. Conversely, government
counterinsurgency strategies typically advocate for attacks against rebel strongholds to
force rebels to flee or fight under less favorable circumstances not to their own choosing,
as well as target locations to increase territorial control (Galula 1964; Paul, Clarke, Grill
and Dunigan 2013; Valentino, Huth and Balch-Lindsay 2004).
Rebels thus frequently prefer mobility out of security concerns for the group’s
survival. Staying mobile can help the rebels evade attacks by the government, and it
gives them an opportunity to compete with the state’s armed forces by varying targets and
using the element of surprise to their advantage. A long line of research attests to how
mobility in asymmetric warfare can help small groups compete militarily against much
stronger opponents (Arreguin-Toft 2005; Mack 1975). Theories of guerrilla warfare place
a great deal of emphasis on how groups should find the optimal geographical locations
8
for operations and armed attacks. Ernesto ‘Che’ Guevara’s (1961) theory of foco
warfare, for example, argues in favor of operating in the periphery or parts of the
countryside with a weaker repressive apparatus of the state. Although such guerrilla
warfare in the periphery presents only a limited challenge to the state, by staying viable
with sustained fighting activity, the rebels might convert people to their cause, and in turn
grow the movement to a point where it presents a more substantial challenge.
Beyond the logistical advantages of mobility that create strong incentives for some
rebel groups to fight in geographically dispersed locations, tacit compliance of the local
population also matters, if not necessarily winning hearts and minds (Salehyan, Siroky
and Wood 2014). Again, unlike Olson’s state of complete anarchy, rebels in civil war by
definition face a state opponent, which normally maintains military superiority over the
rebels. If the government has substantial fighting capacity and entrenched hierarchical
relationships with the local populations, the rebels will find it difficult to undermine the
state’s monopoly on violence. In the face of robust competition from the state, rebels
cannot make much inroad on local support, and roving becomes their only option. In this
way, some rebel groups anticipate few benefits from establishing a consistent hierarchy
with the local population. Groups that do not have a long history of representing a
particular people group will have more difficulty establishing the tacit compliance
necessary to compete with the state’s authority. Moreover, groups without long-held ties
to the local communities remain less able to minimize local denunciations and thereby
less able to maximize the ability to blend in with the local community and maintain
informational advantages over the state while staying put.
Governments also face competing incentives. Displacing rebels and chasing them
from location to location expends limited resources. However, forcing rebels to be on their
9
feet crucially prevents the rebel groups from entrenching their positions and consolidating
local support that is difficult to eradicate. Kalyvas (2006) discuss at length the problems
that states face when they cannot penetrate strong pockets loyal to the rebellion. This
often leaves states to resort to indiscriminate violence or efforts to relocate the local
population. Although this may prove helpful from a military or logistical perspective, it is
often politically counterproductive in that it might increase sympathy for the rebels
(Kalyvas and Kocher 2009; Kocher, Pepinsky and Kalyvas 2011; Lyall, Blair and Imai 2013).
Thus, to prevent such pockets from becoming firmly established, governments might
strike at rebel strongholds at the earliest opportunity, even if it means having to
subsequently cover larger areas and displacing the conflict zones. Containment may cost
less in the short run, but it also ensures that the rebel groups remain viable with the
opportunity to compete with the state as the legitimate sovereign of a particular territory
or recruit enough support to fight for control of the state.
In these ways, conflicts have a higher potential for geographic fluidity when the rebels
lack strong local ties, when they must stay on the run to survive, and when the government
can bear the military and strategic costs to displace the rebels. The degree to which
conflicts move thus depends on the relationship between the rebels and local population
and the relative strength of the combatants.
Starting with the rebel-local relationship, a key factor influencing the likely
movement of a conflict arises from the preexisting ties of the rebel group to a specific
location or constituencies, which shape its value for establishing a legitimate hierarchal
authority. To a large extent, this relates to the aims of the rebels or their objectives. We
distinguish between groups that fight on behalf of a specific ethnic group, or that
otherwise aim for secession or autonomy for a specific group, versus other groups without
10
ties to a specific constituency and that typically aim to overthrow the government.
Rebels that have ties to a specific ethnic group play well the role of the stationary
bandit. Unless a rebel group with an ethnic base specifically aims to overthrow the
government it will usually need to conduct armed activities in a manner that makes
sense to the target audience rather than just to fight in a manner so as to impose the
maximum costs on the government. Establishing control over local territory takes
primacy over fighting far from the homeland.1 Stronger and more consistent links with
the local population, fostered by keeping activities local, will also provide the
movement better security, as members can rely on local knowledge to evade
government forces and blend with the local population so as to exploit informational
advantages. In that regard, government forces face more severe informational
disadvantages and higher costs of fighting the rebels at their core locations of support
when the rebels can blend in with co-ethnics. Governments that try to uproot
rebellions with strong local ties between the rebels and the local population will find
discriminate violence hard to implement, while indiscriminate violence carries the risk
of high political costs and the possibility of driving support to the rebels (Kalyvas 2006;
1 Ethnic groups sometime carry out terrorist attacks in strategic locations outside their claimed
homelands, notably capital cities or other states, with groups such as ETA in Spain and the Tamil Tigers
in Sri Lanka as prominent examples. The logic of terrorism in our view remains distinct from that of
clashes between opposing military assets, and we focus exclusively on the latter here. Terrorism typically
involves activity carried out by groups too weak to engage in conventional warfare, although examples
certainly exist where groups combine terrorism and conventional warfare, see e.g., Findley and Young
(2012) and Carter (forthcoming). Moreover, as we describe below, the methodology used for the
construction of the conflict zones excludes one-off outliers far from any other battles.
11
Kalyvas and Kocher 2009). A policy of containment then becomes more attractive than
displacement.
In contrast, groups without strong ethnic ties, in addition to having fewer incentives to
establish full control of a specific territory, often do not have the option to be stationary
because the local communities have less ability, or less willingness, to provide important
cover and support. Government forces can better target rebels without strong local ties
with discriminate violence. In order for such groups to succeed, they must become more
oriented toward conflict mobility.
Related to the importance of local ties, significant foreign military involvement that
does not, by definition, have local roots can drive conflict mobility. The military
involvement of outside entities brings into play the interests of those outside actors and
particularly pushes incentives away from the cultivation of local hierarchies and more
toward statewide or regional goals. Salehyan, Gleditsch, and Cunningham (2011)
emphasize how external support entails both military benefits as well as potential loss of
autonomy or goal displacement, as the movement may have to adjust its activities in line
with the preferences of the external supporter. Furthermore, existing scholarship has
found that external assistance can undermine the incentives of the non-state actors to
cultivate local support (Beardsley and McQuinn 2009; Salehyan, Siroky and Wood 2014;
Weinstein 2007). To the extent that external military support weakens the
interdependence and goal convergence between the rebels and the local population, it
should have an association with more mobile conflicts.
H1: When rebels have strong ties with the local population, the conflict space will
move less.
12
Turning to relative strength, governments with a high degree of military superiority
can more effectively displace rebels and can better afford to fight in multiple locations,
while very weak rebels must rely on guerrilla tactics to survive. That is, stronger
governments can better enforce their laws and keep a rebel group from establishing its
own hierarchical relationship in local communities (Kalyvas 2006; Skaperdas and
Syropoulos 1995). With the threat and use of force, such governments push rebel groups
to roam for survival, lest they face major losses and capture. Moreover, weaker rebel
groups less able to stand their ground and combat government forces in fixed locations
will have to use one of the only advantages that they have—the ease of moving
undetected and catching government forces by surprise—to maximum effect in order to
pose a viable challenge to the state.
A rather weak government, meanwhile, will find it more difficult to maintain its
authority and compete with rebels, especially in the periphery of a country (Buhaug
and Rød 2006; Buhaug, Cederman and Rød 2008; Cederman, Buhaug and Rød 2009;
Cunningham, Gleditsch and Salehyan 2009). Weaker governments also pose less of an
existential threat to stationary rebels. Cunningham, Gleditsch and Salehyan (2009) find
that relatively strong rebel groups tend to correlate with shorter wars because they can
impose enough costs on the government to force a settlement and possibly even make the
government vulnerable to defeat. Such strong rebel groups better stand their ground in
the areas they control. This leads to a testable implication that conflict zones will move
more when the relative strength clearly favors the government.2
2 A competing dynamic arises in the case of collapsing states. A failing government or a
government that suddenly finds itself very weak relative to the rebels will encourage attacks and prove
13
H2: When government forces have dominant strength over the rebels, the conflict
space will move more.
In sum, we posit that rebel ties to the local populations as well as relative strength
constitute two important factors that shape conflict zone mobility. Another way to
characterize these effects includes the mechanisms of opportunity and willingness for
fighting in geographically dispersed locations. The effect of relative weakness ties most
directly into the mechanism of opportunity, in that little opportunity exists for a rebel
group that prioritizes survival and that has inferior capabilities to stay stationary and set
up its own hierarchy. The effect of local ties incorporates both a mechanism of
opportunity—little opportunity exists for rebels to muster sufficient local support without
strong community affinities—and a mechanism of willingness—local territorial control
becomes less important and governments become more willing to uproot a rebellion
when the rebels do not have strong local ties.3 Before testing if the observable
unable to prevent the rebels from moving on the capital. For example, an early indication that the
Gaddafi government in Libya had lost control in 2011 was the relative ease with which the rebels
originating mainly from the east of the country expanded the theater of conflict toward Tripoli in the west.
Our analysis here pertains only to the year-on-year variation in conflict zones, and does not well capture
state collapses. Our main hypothesis here seeks to explain general movements in conflict rather than such
rare advances on the capital.
3 As we observe in the empirical analysis below, the willingness component might not carry
much weight, given that the relationship between local ties and conflict mobility does not carry
much meaning when rebels operate from relative strength. In this way, the evidence suggests that
relatively strong non-state actors do not necessarily have less willingness to operate as a
stationary bandit when they lack strong ethnic ties and yet have the opportunity to compete with
14
implications of these arguments well explain the data, we turn to examples that illustrate
the variation in mobility that we try to explain.
Illustrative Cases
We provide three selected examples to illustrate our propositions and the data sources,
highlighting variation in actor characteristics and the expected patterns of roaming attacks
versus more stable conflict zones. We first use the Sudan People’s Liberation Movement/
Sudan People’s Liberation Army (SPLM/A) as an example of a rebel movement with
aspirations to statehood and close ties to a specific territory. We then consider the
Lord’s Resistance Army (LRA) in Uganda as an example of a group with high mobility
in the mold of Olson’s roving bandits. Finally, we use the Tuareg rebels in Mali as an
example of an ethnic group in the periphery that historically has operated in a consistent
and delimited geographic space, but more recently faces changed incentives towards
becoming more mobile, particularly exemplifying the influence of outside support, in this
case following an influx of fighters and arms from Libya and the involvement of Islamist
allies. We discuss these examples not as tests of the proposed dynamics but as
illustrations of the underlying concepts in real-world contexts. We later turn to the
actual tests of our hypotheses across a larger number of conflict zones.
Sudan - Sudan People’s Liberation Movement/Army
the government in establishing local hierarchies.
15
The Sudan People’s Liberation Movement/Army (SPLM/A) formed in 1983, with a
program of greater autonomy for the largely non-Islamic people in the South of Sudan and
opposition to the dominant role of the Arab North of the country. Britain administered
South and North Sudan as separate colonial entities, with the South perceived as more
similar to other African colonies than the Arab North, and with English used as the
predominant administrative language, rather than Arabic. The SPLM/A did not initially
wage a separatist campaign, rather focusing on how the national government oppressed
large parts of the population and undermined national unity, but later came to aspire to
set up a separate state. The distribution of wealth from oil production also became a
contentious issue between the South and the North. The SPLM/A had as many as
30,000-50,000 troops (according to the Uppsala Armed Conflict Data project) and
operated as a hierarchical army, although factional infighting often hindered its efforts.
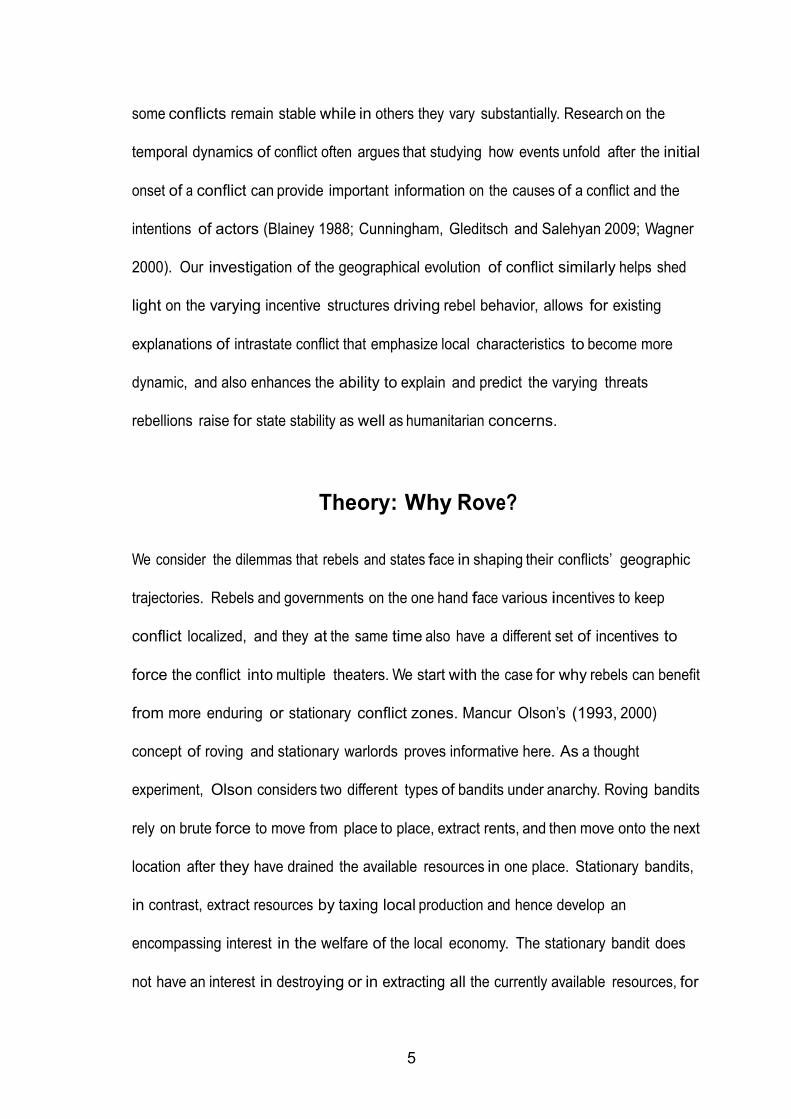
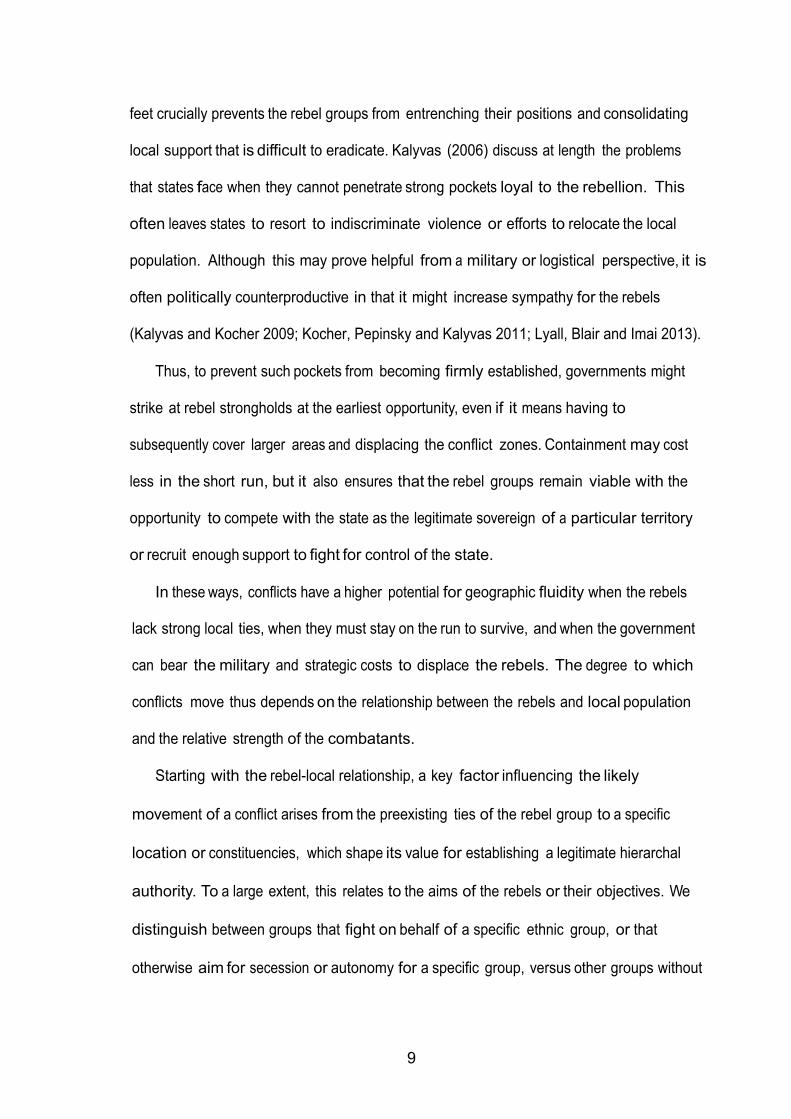
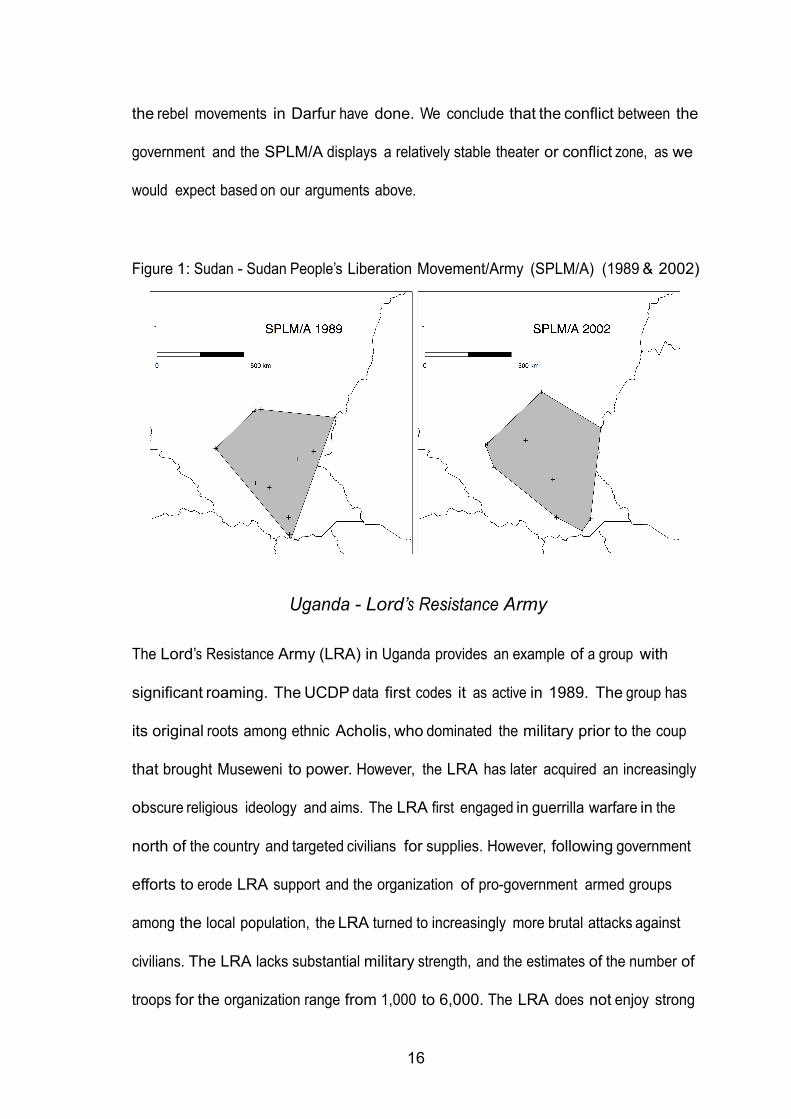
Given the clear tie to a territory and population, and the relatively strong military
resources, we would expect the SPLM/A to prefer a relatively fixed theatre, concentrating
on the core region. Figure 1 displays the actual geographical spread of the individual
conflict events (shown as dots) and the conflict polygons, drawn around the perimeter of
the events, in the UCDP Georeferenced Event Data (GED) for 1989, the first year for
which we have data, and 2002, the last year of major fighting. (We will explain the UCDP
GED data in greater detail later).4 Figure 1 makes evident that the theater of fighting in
both years remains confined to South Sudan, and the two polygons cover relatively similar
geographical areas. We find it instructive that the SPLM/A concentrated its activity in the
South and never tried to attack the Sudanese capital and areas in the North, as many of
4 Here and elsewhere, the country boundary polygons shown are taken from the Cshapes dataset
(Weidmann, Kuse and Gleditsch 2010).
16
the rebel movements in Darfur have done. We conclude that the conflict between the
government and the SPLM/A displays a relatively stable theater or conflict zone, as we
would expect based on our arguments above.
Figure 1: Sudan - Sudan People’s Liberation Movement/Army (SPLM/A) (1989 & 2002)
Uganda - Lord’s Resistance Army
The Lord’s Resistance Army (LRA) in Uganda provides an example of a group with
significant roaming. The UCDP data first codes it as active in 1989. The group has
its original roots among ethnic Acholis, who dominated the military prior to the coup
that brought Museweni to power. However, the LRA has later acquired an increasingly
obscure religious ideology and aims. The LRA first engaged in guerrilla warfare in the
north of the country and targeted civilians for supplies. However, following government
efforts to erode LRA support and the organization of pro-government armed groups
among the local population, the LRA turned to increasingly more brutal attacks against
civilians. The LRA lacks substantial military strength, and the estimates of the number of
troops for the organization range from 1,000 to 6,000. The LRA does not enjoy strong
17
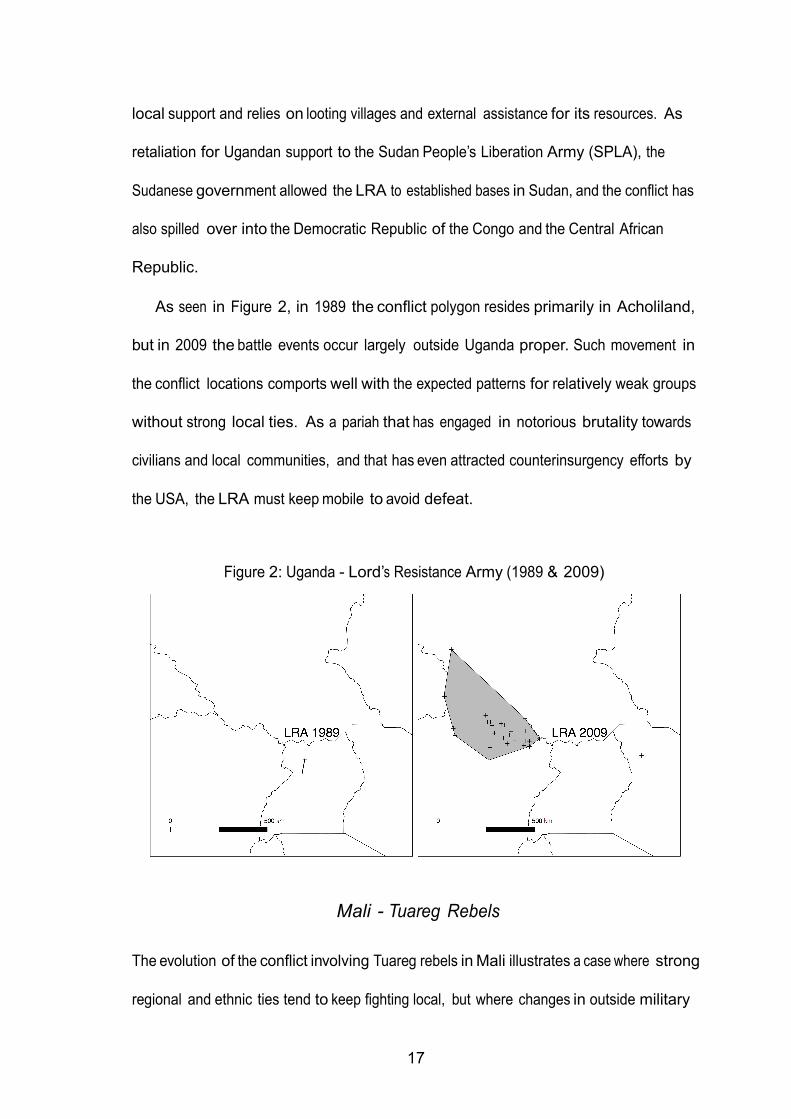
local support and relies on looting villages and external assistance for its resources. As
retaliation for Ugandan support to the Sudan People’s Liberation Army (SPLA), the
Sudanese government allowed the LRA to established bases in Sudan, and the conflict has
also spilled over into the Democratic Republic of the Congo and the Central African
Republic.
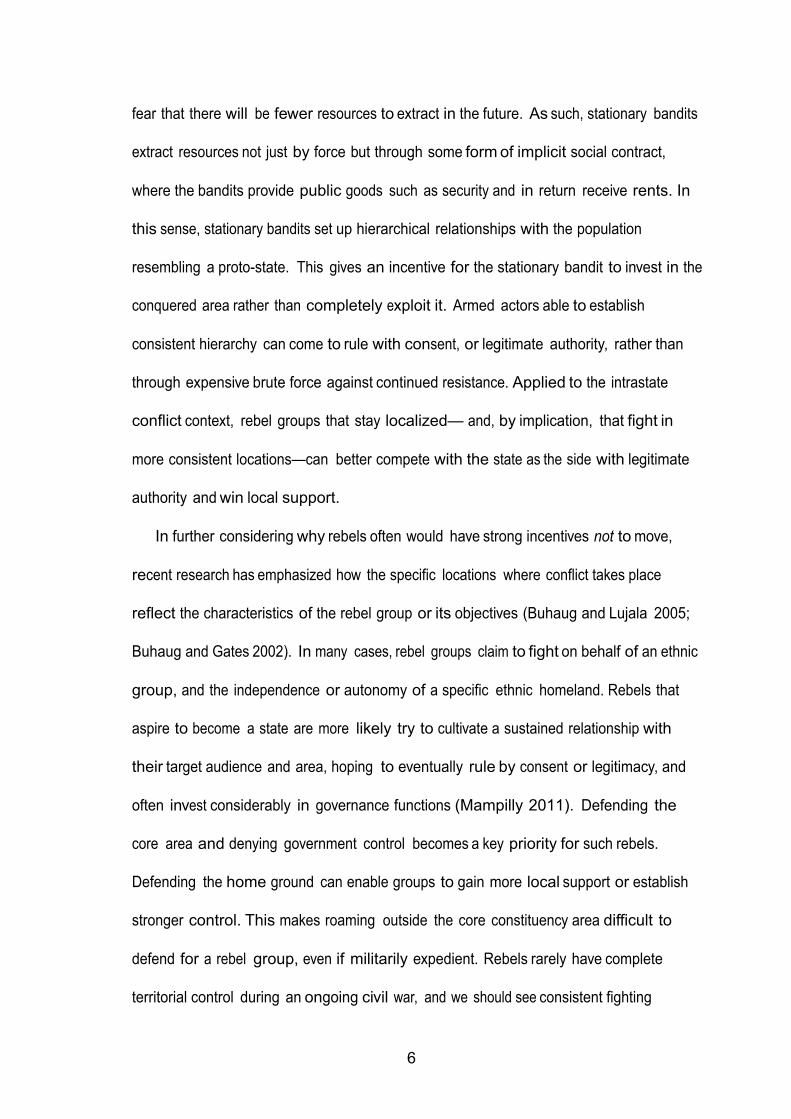
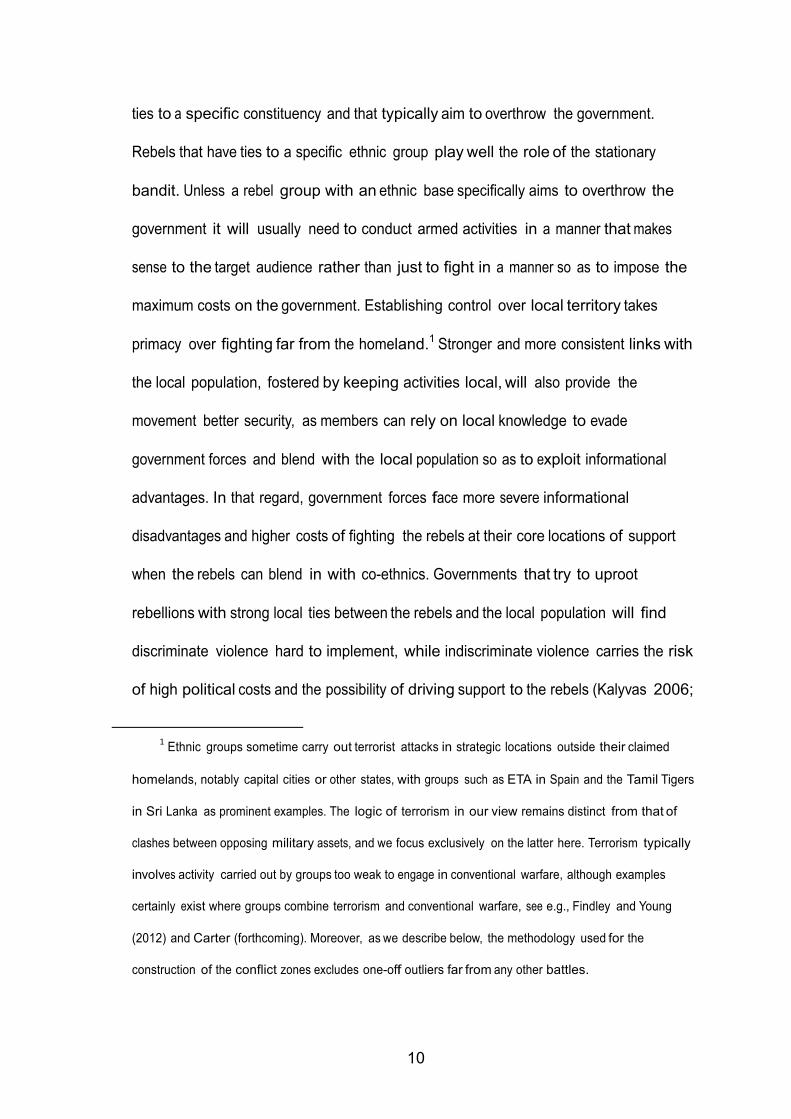
As seen in Figure 2, in 1989 the conflict polygon resides primarily in Acholiland,
but in 2009 the battle events occur largely outside Uganda proper. Such movement in
the conflict locations comports well with the expected patterns for relatively weak groups
without strong local ties. As a pariah that has engaged in notorious brutality towards
civilians and local communities, and that has even attracted counterinsurgency efforts by
the USA, the LRA must keep mobile to avoid defeat.
Figure 2: Uganda - Lord’s Resistance Army (1989 & 2009)
Mali - Tuareg Rebels
The evolution of the conflict involving Tuareg rebels in Mali illustrates a case where strong
regional and ethnic ties tend to keep fighting local, but where changes in outside military
18
support later expands the geographic scope of the conflict. The UCDP data first code the
Tuaregs as having active violent conflict arising from grievances over sovereignty to their
Azawad homeland in the mid-1970s. In the subsequent years, different factions,
occasionally at odds with each other, fought against the Malian government, often
below the UCDP annual intensity threshold of 25 battle-related fatalities. One of the
factions, the Alliance Tuareg Nord Mali pour le Changement (ATNMC, North Mali
Tuareg Alliance for Change), emerged under the leadership of Ibrahim ag-Bahanga in
2007 to fight government forces near the borders of Algeria and Niger. This relatively
small group fought in armed conflict in the region that exceeded the 25 annual battle-
death threshold until 2009. In early 2009, the group faced defeat, and ag-Bahanga
fled to Algeria and then Libya, where Tuareg kin had strong ties to Gaddafi and the
Libyan army. ag-Bahanga died in 2011.
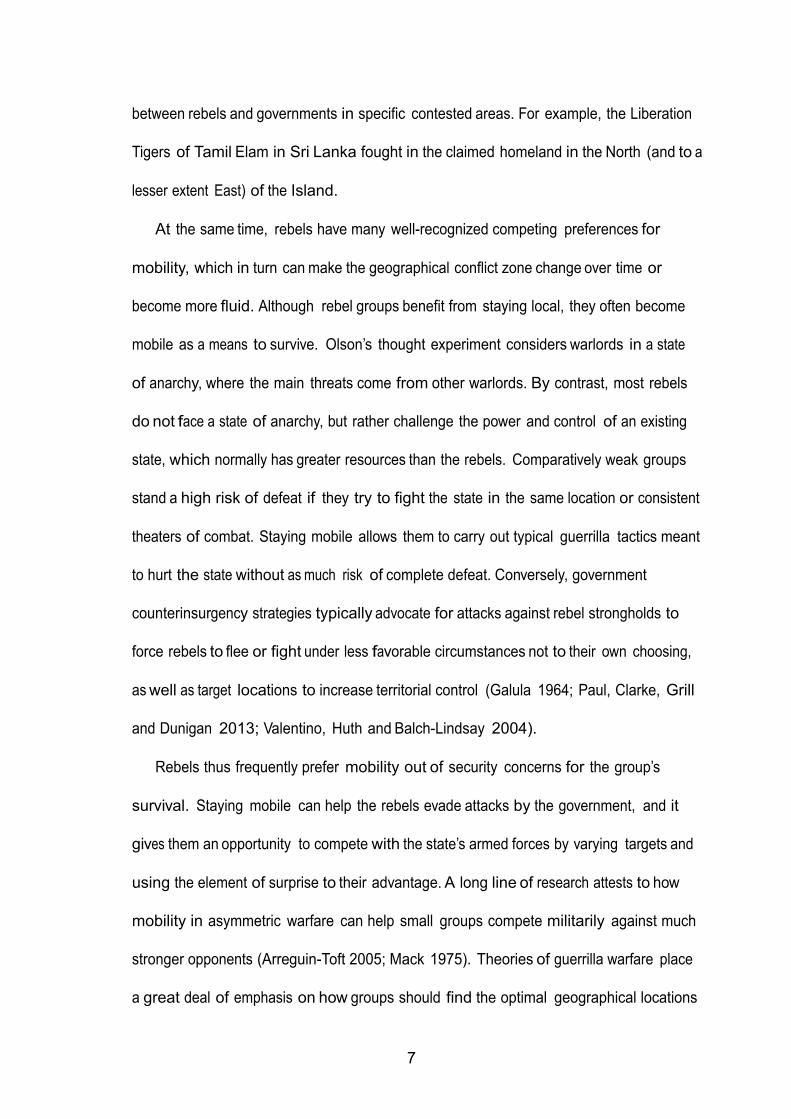
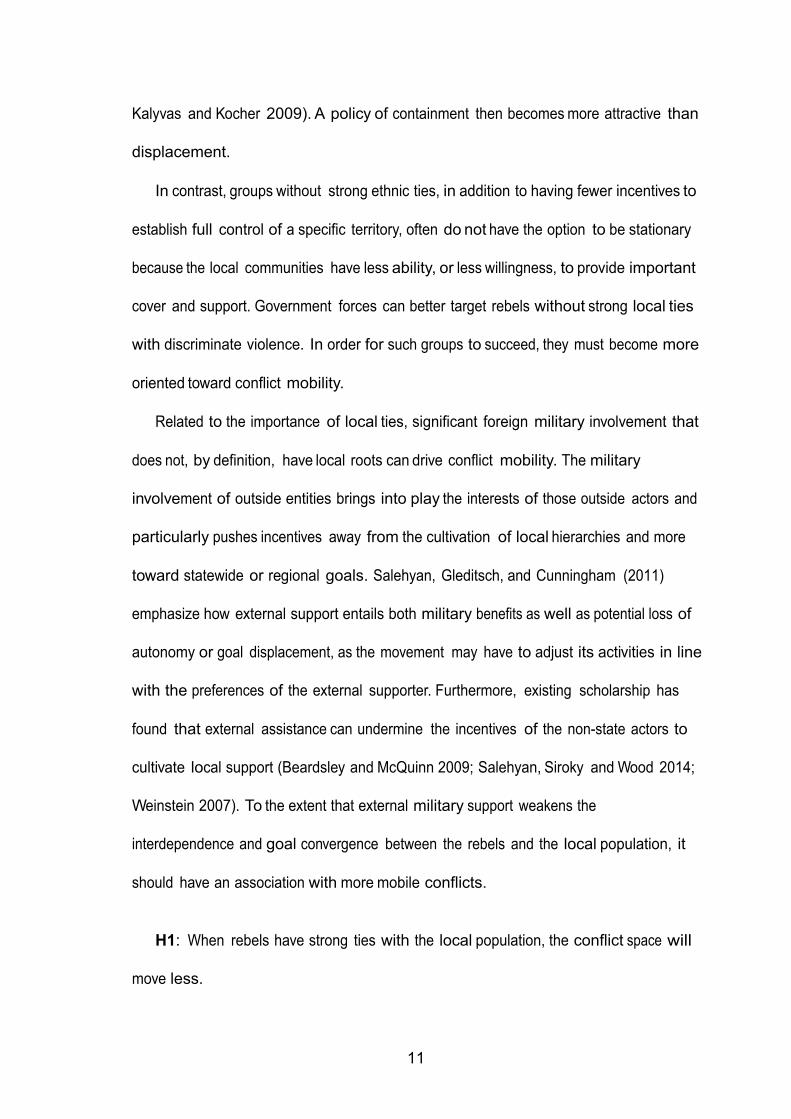
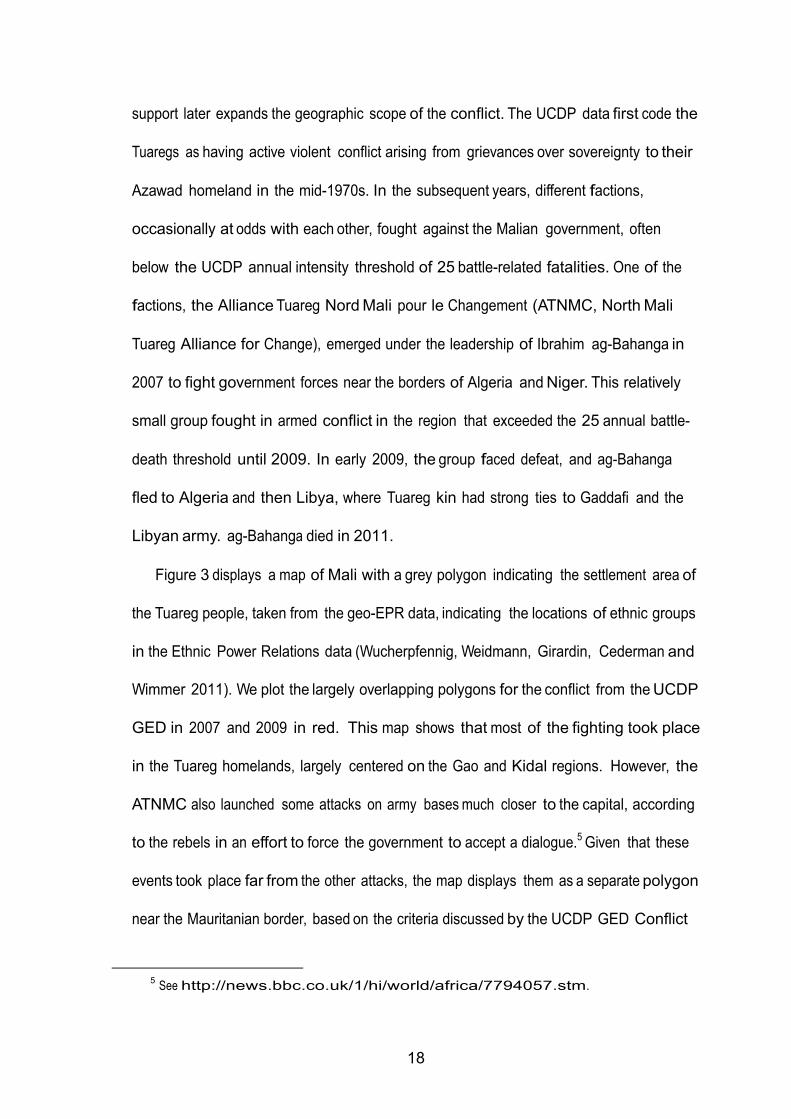
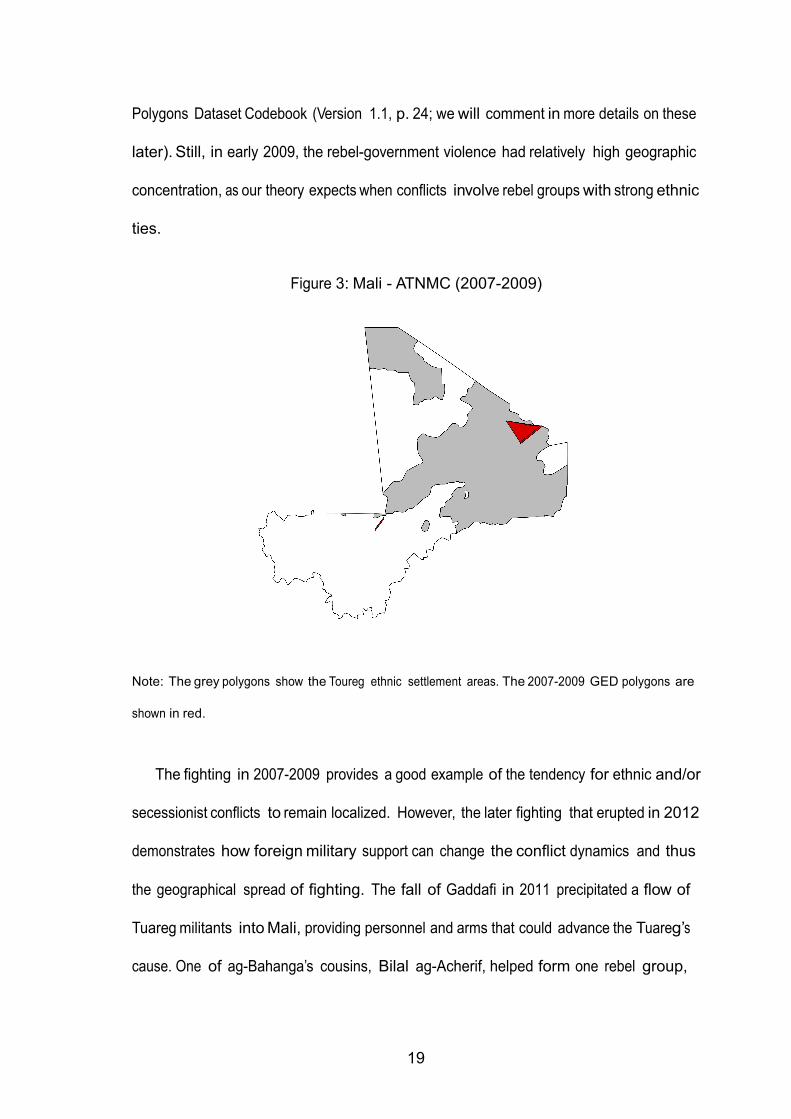
Figure 3 displays a map of Mali with a grey polygon indicating the settlement area of
the Tuareg people, taken from the geo-EPR data, indicating the locations of ethnic groups
in the Ethnic Power Relations data (Wucherpfennig, Weidmann, Girardin, Cederman and
Wimmer 2011). We plot the largely overlapping polygons for the conflict from the UCDP
GED in 2007 and 2009 in red. This map shows that most of the fighting took place
in the Tuareg homelands, largely centered on the Gao and Kidal regions. However, the
ATNMC also launched some attacks on army bases much closer to the capital, according
to the rebels in an effort to force the government to accept a dialogue.5 Given that these
events took place far from the other attacks, the map displays them as a separate polygon
near the Mauritanian border, based on the criteria discussed by the UCDP GED Conflict
5 See http://news.bbc.co.uk/1/hi/world/africa/7794057.stm.
19
Polygons Dataset Codebook (Version 1.1, p. 24; we will comment in more details on these
later). Still, in early 2009, the rebel-government violence had relatively high geographic
concentration, as our theory expects when conflicts involve rebel groups with strong ethnic
ties.
Figure 3: Mali - ATNMC (2007-2009)
Note: The grey polygons show the Toureg ethnic settlement areas. The 2007-2009 GED polygons are
shown in red.
The fighting in 2007-2009 provides a good example of the tendency for ethnic and/or
secessionist conflicts to remain localized. However, the later fighting that erupted in 2012
demonstrates how foreign military support can change the conflict dynamics and thus
the geographical spread of fighting. The fall of Gaddafi in 2011 precipitated a flow of
Tuareg militants into Mali, providing personnel and arms that could advance the Tuareg’s
cause. One of ag-Bahanga’s cousins, Bilal ag-Acherif, helped form one rebel group,
20
the Mouvement national de liberation de l’Azawad (MNLA, National Movement for the
Liberation of Azawad). A rival faction of Tuareg fighters also formed, called Ansar Dine,
a group with Islamist allies in the region, including AQIM and the Mouvement pour le
Tawhad et du Jihad en Afrique de l’Ouest (MUJAO, Movement for Oneness and Jihad in
West Africa).
The flow of the Libyan Tuaregs, as well the participation of the foreign Jihadist groups,
fundamentally changed the nature of the conflict and dramatically increased the
geographical spread. The movement of the conflict quickly spread from the periphery in
the North southward toward Bamako and the more populated areas in the South. The
fighting in 2012 covered a much larger part of the country than the limited secessionist
conflict in prior years, and the UCDP characterizes the 2012 war as a conflict over the
government instead of a territorial conflict. This precipitated a coup in March 2012, as
the Malian military elite became dissatisfied with the regime’s handling of the crisis.
The fighting continued in 2012, ultimately leading to French and West African military
involvement in 2013 seeking to stabilize the country and reduce the hold of the Islamist
groups. The geographical scope of violence in 2012 stands in stark contrast to the more
isolated nature of the regional struggle just a few years earlier, prior to the influx of
fighters from Libya and external support. This pattern of the greater spread of violence
corroborates our claim that foreign military support will tend to orient the rebellion away
from strong community ties and weaken the comparative advantage of keeping
operations local.6
6 We cannot represent the geographical extent and location of the 2012 conflict in Mali with the UCDP
GED data since these only extend to 2011. Although these data do not directly compare to the GED data
that we use in our quantitative analysis (Eck 2012), the 2012 Armed Conflict Event and Location Data
21
Research Design
We test the posited hypotheses on a data set of annual rebel-government dyadic civil war
observations. More specifically, we use measures of dyadic conflict movement based
on comparing the polygons from the UCDP GED data over time (Croicu and Sundberg
2012).7 The GED data comprise georeferenced event data of battles within armed
conflicts, where an armed conflict has at least 25 battle-related fatalities per year. The
current data only cover Africa. From the individual event data, the GED data estimate
georeferenced polygons, based on calculations of the convex hull of the individual
battles, to provide a definition of the battle areas in each year of active armed conflict.8
A few armed conflicts have multiple theaters of activity and thus yield multiple polygons,
which we treat as separate conflict zones. We also focus only on the state-rebel violence
(ACLED) (Raleigh, Linke, Hegre and Karlsen 2011) for Mali confirm that we see a more diffuse pattern of
violence in 2012 than in the preceding years.
7 We chose to use the GED data instead of the Armed Conflict Location and Event Data (ACLED) for
ease of integration of other features that pertain to UCDP armed conflicts. We also use annual polygons
rather than individual geographical grid cells within conflicts or shorter time periods, since we lack more
disaggregated information for our explanatory variables, which tend to pertain to the rebel group as a whole
(e.g., relative strength, outside support), and polygons measured over short time intervals may not have
sufficient observations to prove useful.
8 The GED data exclude certain isolated outliers that would lead to unreasonably defined or overly large
conflict polygons. Events become outliers for defining polygons if they alone would account for more than
20% of the area and decrease the density of the data points in the polygon by more than 20%,
and the events account for less than 5% of the total number of events and deaths in the conflict
(Croicu and Sundberg 2012:9).
22
in civil wars covered by the non-state actor data (Cunningham, Gleditsch and Salehyan
2009), since the scope of our theory applies to cases of rebellion against the state but not
necessarily to fighting between rebel groups or cases of one-sided violence by the state
against civilians. In sum, we choose each polygon of these government-rebel dyads in
each year to serve as our unit of analysis.9 This results in 371 initial observations for
analysis.
Measuring Conflict Zone Movement
We can measure our conceptual outcome of interest, the degree of consistency versus
movement in conflict zones, in a number of plausible ways. Our main operational measure
uses the degree of overlap in the UCDP GED conflict polygons from the prior year. The
UCDP GED data form polygons by drawing a line around the convex hull of the individual
attacks in each year in a dyadic conflict. The resulting geographical area reflects the
conflict zone or area where a rebel group takes on the government in armed conflict. We
then overlay the polygons for each subsequent year t in a conflict with the prior year t − 1.
We calculate the size of the overlapping area and then consider this as a percentage of the
previous year’s polygon as our measure of the degree to which a conflict has a consistent
theater, or displays roaming.
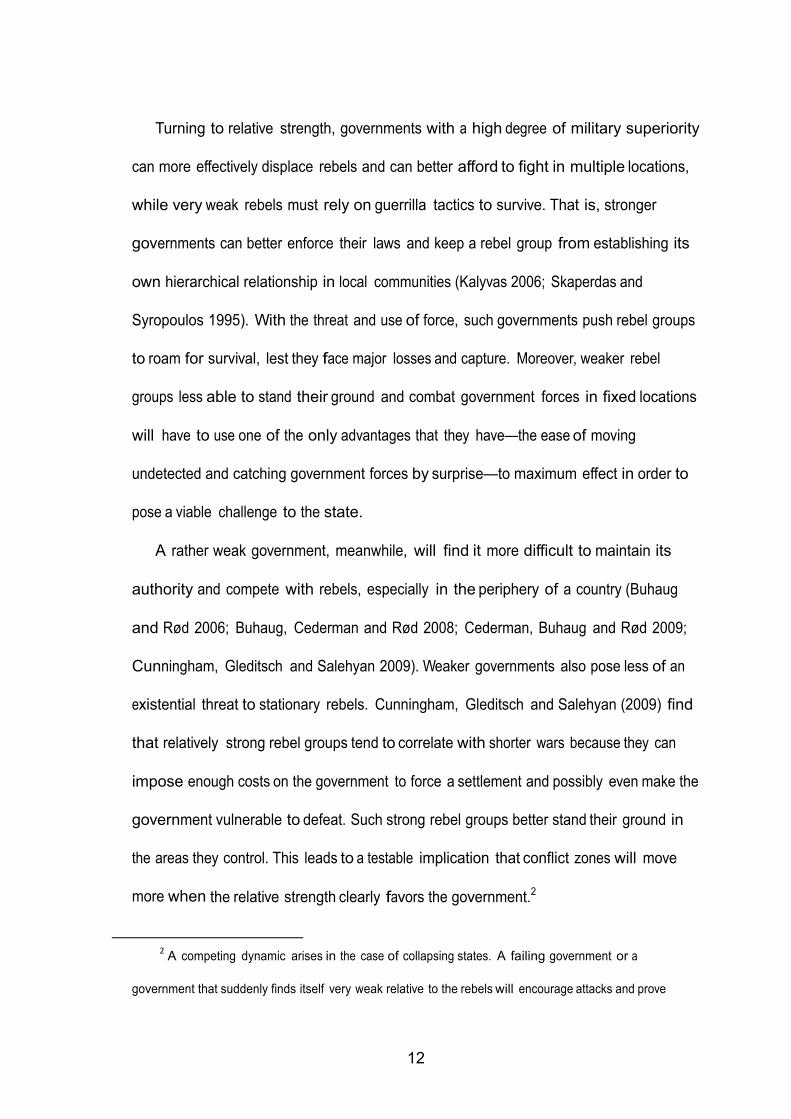
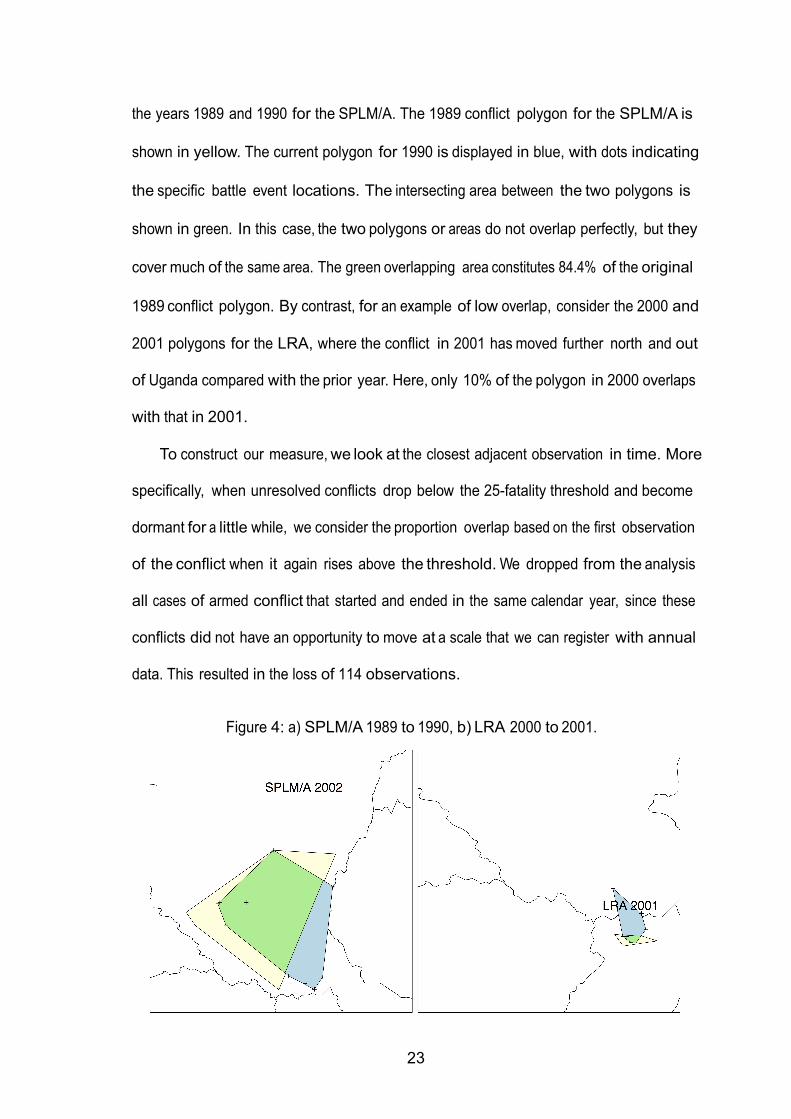
To illustrate the construction of our measure, we show a case of high and low overlap
in Figure 4. The left panel shows an example with high overlap, based on information for
9 The relevant battles include those that involve the core disputants as well as any secondary actors
involved. In this way, truly multilateral conflicts over the same core dispute do not constitute separate
conflicts or separate polygons based on the many different dyadic configurations.
23
the years 1989 and 1990 for the SPLM/A. The 1989 conflict polygon for the SPLM/A is
shown in yellow. The current polygon for 1990 is displayed in blue, with dots indicating
the specific battle event locations. The intersecting area between the two polygons is
shown in green. In this case, the two polygons or areas do not overlap perfectly, but they
cover much of the same area. The green overlapping area constitutes 84.4% of the original
1989 conflict polygon. By contrast, for an example of low overlap, consider the 2000 and
2001 polygons for the LRA, where the conflict in 2001 has moved further north and out
of Uganda compared with the prior year. Here, only 10% of the polygon in 2000 overlaps
with that in 2001.
To construct our measure, we look at the closest adjacent observation in time. More
specifically, when unresolved conflicts drop below the 25-fatality threshold and become
dormant for a little while, we consider the proportion overlap based on the first observation
of the conflict when it again rises above the threshold. We dropped from the analysis
all cases of armed conflict that started and ended in the same calendar year, since these
conflicts did not have an opportunity to move at a scale that we can register with annual
data. This resulted in the loss of 114 observations.
Figure 4: a) SPLM/A 1989 to 1990, b) LRA 2000 to 2001.
24
The distribution of our overlap measure in our data overall indicates extensive
movements in the conflict zones of civil war. More specifically, less than half (45% by
both mean and median) of the armed conflict areas in a given year have more than 50%
overlap with the conflict area in the previous year. Almost a quarter of the annual
conflict areas have an overlap of less than 1% with the polygons in the previous year.
With a variable that ranges from 0 to 1, we estimate the regression model for
proportions suggested by Papke and Wooldridge (1996), based on a generalized linear
model with a logistic link. To account for possible correlations in the tendencies for
conflict to move among observations within the same state, we generate standard errors
that are robust to clustering at the state level.10
We considered alternative ways of measuring change in conflict zones, including mea-
sures based on total size and centroid, or center of the conflict zone. Our measure of the
percentage overlap in polygon area works well because it uses information from the
entire polygon. Measures of size alone do not capture location, while measures based on
the centroid will capture relocation of an existing conflict but will not reflect changes in
the escalation of an existing conflict to additional sites (Schutte and Weidmann 2011).
However, to ensure that our results do not arise solely as an artifact of a specific and
possibly arbitrary measure we consider the distance change in the centroid in a
10 We also use a random effects GLM model as an alternative approach in a robustness check.
25
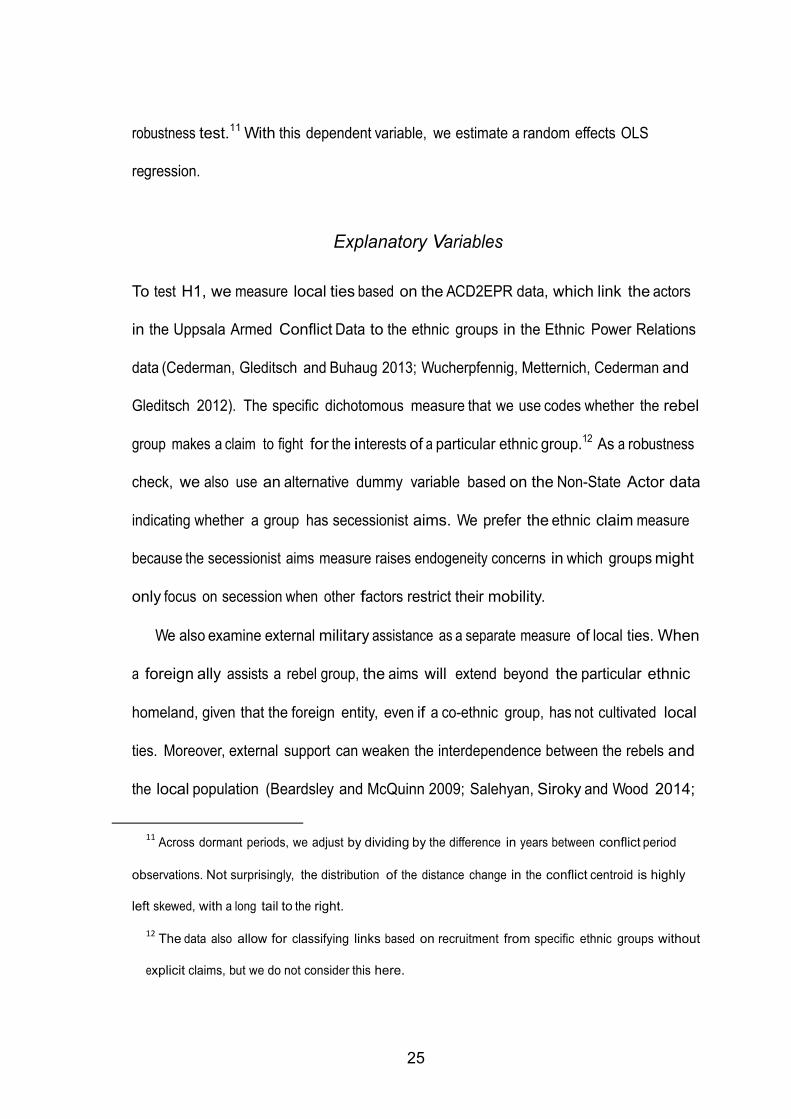
robustness test.11 With this dependent variable, we estimate a random effects OLS
regression.
Explanatory Variables
To test H1, we measure local ties based on the ACD2EPR data, which link the actors
in the Uppsala Armed Conflict Data to the ethnic groups in the Ethnic Power Relations
data (Cederman, Gleditsch and Buhaug 2013; Wucherpfennig, Metternich, Cederman and
Gleditsch 2012). The specific dichotomous measure that we use codes whether the rebel
group makes a claim to fight for the interests of a particular ethnic group.12 As a robustness
check, we also use an alternative dummy variable based on the Non-State Actor data
indicating whether a group has secessionist aims. We prefer the ethnic claim measure
because the secessionist aims measure raises endogeneity concerns in which groups might
only focus on secession when other factors restrict their mobility.
We also examine external military assistance as a separate measure of local ties. When
a foreign ally assists a rebel group, the aims will extend beyond the particular ethnic
homeland, given that the foreign entity, even if a co-ethnic group, has not cultivated local
ties. Moreover, external support can weaken the interdependence between the rebels and
the local population (Beardsley and McQuinn 2009; Salehyan, Siroky and Wood 2014;
11 Across dormant periods, we adjust by dividing by the difference in years between conflict period
observations. Not surprisingly, the distribution of the distance change in the conflict centroid is highly
left skewed, with a long tail to the right.
12 The data also allow for classifying links based on recruitment from specific ethnic groups without
explicit claims, but we do not consider this here.
26
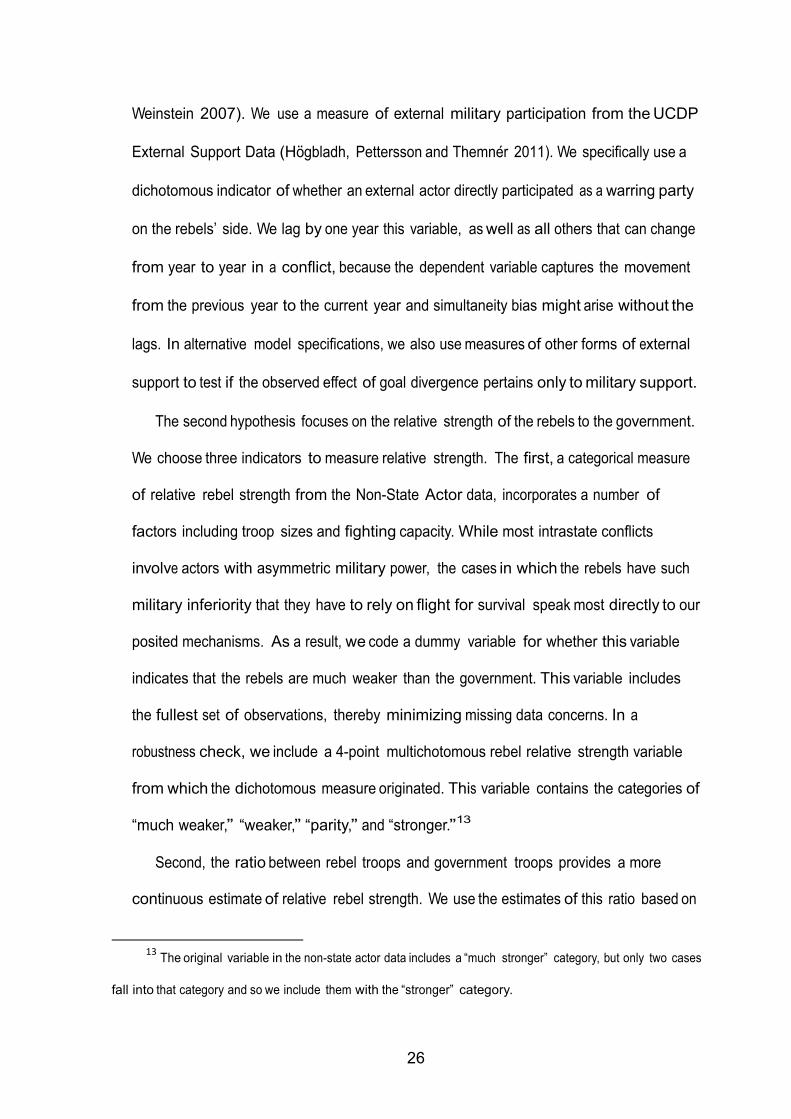
Weinstein 2007). We use a measure of external military participation from the UCDP
External Support Data (Ho gbladh, Pettersson and Themner 2011). We specifically use a
dichotomous indicator of whether an external actor directly participated as a warring party
on the rebels’ side. We lag by one year this variable, as well as all others that can change
from year to year in a conflict, because the dependent variable captures the movement
from the previous year to the current year and simultaneity bias might arise without the
lags. In alternative model specifications, we also use measures of other forms of external
support to test if the observed effect of goal divergence pertains only to military support.
The second hypothesis focuses on the relative strength of the rebels to the government.
We choose three indicators to measure relative strength. The first, a categorical measure
of relative rebel strength from the Non-State Actor data, incorporates a number of
factors including troop sizes and fighting capacity. While most intrastate conflicts
involve actors with asymmetric military power, the cases in which the rebels have such
military inferiority that they have to rely on flight for survival speak most directly to our
posited mechanisms. As a result, we code a dummy variable for whether this variable
indicates that the rebels are much weaker than the government. This variable includes
the fullest set of observations, thereby minimizing missing data concerns. In a
robustness check, we include a 4-point multichotomous rebel relative strength variable
from which the dichotomous measure originated. This variable contains the categories of
“much weaker,” “weaker,” “parity,” and “stronger.”13
Second, the ratio between rebel troops and government troops provides a more
continuous estimate of relative rebel strength. We use the estimates of this ratio based on
13 The original variable in the non-state actor data includes a “much stronger” category, but only two cases
fall into that category and so we include them with the “stronger” category.
27
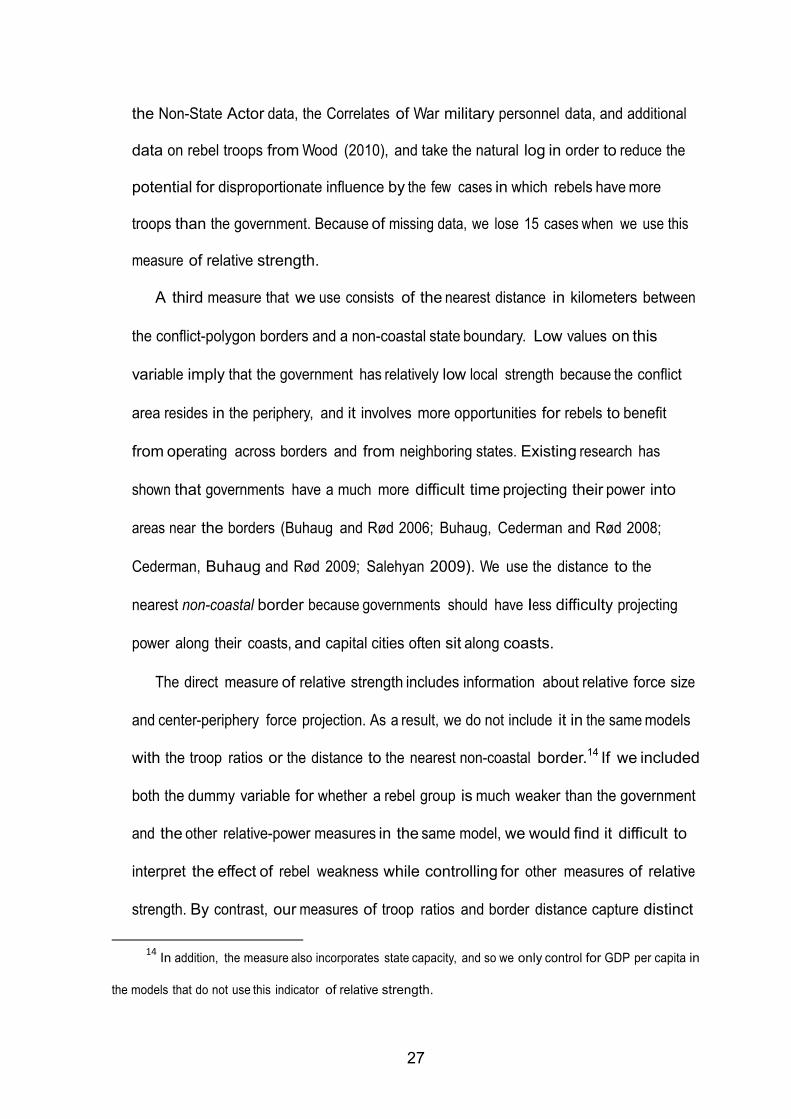
the Non-State Actor data, the Correlates of War military personnel data, and additional
data on rebel troops from Wood (2010), and take the natural log in order to reduce the
potential for disproportionate influence by the few cases in which rebels have more
troops than the government. Because of missing data, we lose 15 cases when we use this
measure of relative strength.
A third measure that we use consists of the nearest distance in kilometers between
the conflict-polygon borders and a non-coastal state boundary. Low values on this
variable imply that the government has relatively low local strength because the conflict
area resides in the periphery, and it involves more opportunities for rebels to benefit
from operating across borders and from neighboring states. Existing research has
shown that governments have a much more difficult time projecting their power into
areas near the borders (Buhaug and Rød 2006; Buhaug, Cederman and Rød 2008;
Cederman, Buhaug and Rød 2009; Salehyan 2009). We use the distance to the
nearest non-coastal border because governments should have less difficulty projecting
power along their coasts, and capital cities often sit along coasts.
The direct measure of relative strength includes information about relative force size
and center-periphery force projection. As a result, we do not include it in the same models
with the troop ratios or the distance to the nearest non-coastal border.14 If we included
both the dummy variable for whether a rebel group is much weaker than the government
and the other relative-power measures in the same model, we would find it difficult to
interpret the effect of rebel weakness while controlling for other measures of relative
strength. By contrast, our measures of troop ratios and border distance capture distinct
14 In addition, the measure also incorporates state capacity, and so we only control for GDP per capita in
the models that do not use this indicator of relative strength.
28
elements of relative power, and we thus include them in the same model.
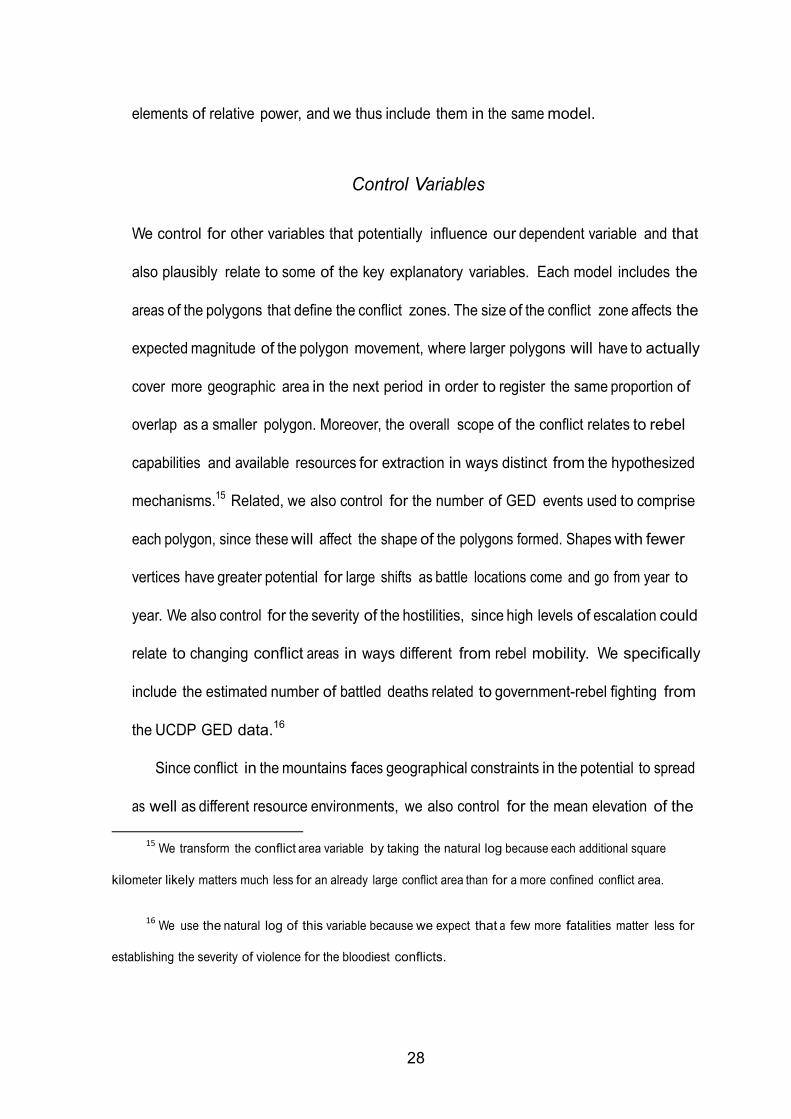
Control Variables
We control for other variables that potentially influence our dependent variable and that
also plausibly relate to some of the key explanatory variables. Each model includes the
areas of the polygons that define the conflict zones. The size of the conflict zone affects the
expected magnitude of the polygon movement, where larger polygons will have to actually
cover more geographic area in the next period in order to register the same proportion of
overlap as a smaller polygon. Moreover, the overall scope of the conflict relates to rebel
capabilities and available resources for extraction in ways distinct from the hypothesized
mechanisms.15 Related, we also control for the number of GED events used to comprise
each polygon, since these will affect the shape of the polygons formed. Shapes with fewer
vertices have greater potential for large shifts as battle locations come and go from year to
year. We also control for the severity of the hostilities, since high levels of escalation could
relate to changing conflict areas in ways different from rebel mobility. We specifically
include the estimated number of battled deaths related to government-rebel fighting from
the UCDP GED data.16
Since conflict in the mountains faces geographical constraints in the potential to spread
as well as different resource environments, we also control for the mean elevation of the
15 We transform the conflict area variable by taking the natural log because each additional square
kilometer likely matters much less for an already large conflict area than for a more confined conflict area.
16 We use the natural log of this variable because we expect that a few more fatalities matter less for
establishing the severity of violence for the bloodiest conflicts.
29
conflict polygons. Similarly, we control for the percent of the conflict-area polygons that
encompass urban space, from the Global Rural-Urban Mapping Project (GRUMP 2011)
data, because the spread of conflict likely plays out differently in urban and rural
environments, which can also shape rebel-local interdependencies. We also include the
number of distinct ethnic-group homelands encompassed by the polygons, using the ethnic
group settlement polygons from the GeoEPR data (Wucherpfennig, Weidman, Girardin,
Cederman and Wimmer 2011), because ethnic fractionalization likely shapes the aims
of the rebel groups while also impacting the ability for conflict to spread. In models that
do not include the direct measure of relative rebel weakness, we control for GDP per
capita to account for variation in state capacity and economic development.17
In a robustness check, we also include a lagged dependent variable as a way to account
for the possibility that an overarching strategic choice that favors mobility really shapes
the choices of the rebel group to have limited homeland aims or to maintain a certain
size. The previous period’s mobility should reflect that overarching tactical choice of
mobility. Including the lagged dependent variable thus allows us to pose questions like,
“among the groups with high mobility in the previous period, what explains their current
level of mobility?”18 In a separate robustness check, we also control for the state area
17 As noted above, we do not control for GDP per capita in the models with the direct measure of
relative rebel weakness because state capacity serves as an important component of what affects relative rebel
weakness. When we include GDP per capita, the coefficient on the rebel weakness variable does decrease
although not to the point of losing statistical significance. That being said, interpretation of the partial coefficient
on the rebel weakness variable becomes difficult in a model that controls for a key element of state capacity.
We also note that all models control for mean elevation and urban coverage of the polygons, which better capture
variations in the local resource environments than state-wide GDP per capita.
18 Note that we can establish exogeneity in our key explanatory variables on theoretical grounds as well.
30
of the country in the rebel-government dyad. Even though a number of the conflicts
span international borders—for example the LRA conflict illustrated above, as well as the
Rwanda-FDLR dyad which involves much activity in the eastern DRC—state boundaries
in some cases can constrain mobility such that the size of the state could reflect both how
much room exists to roam as well as the relative strength of the rebels.
Results
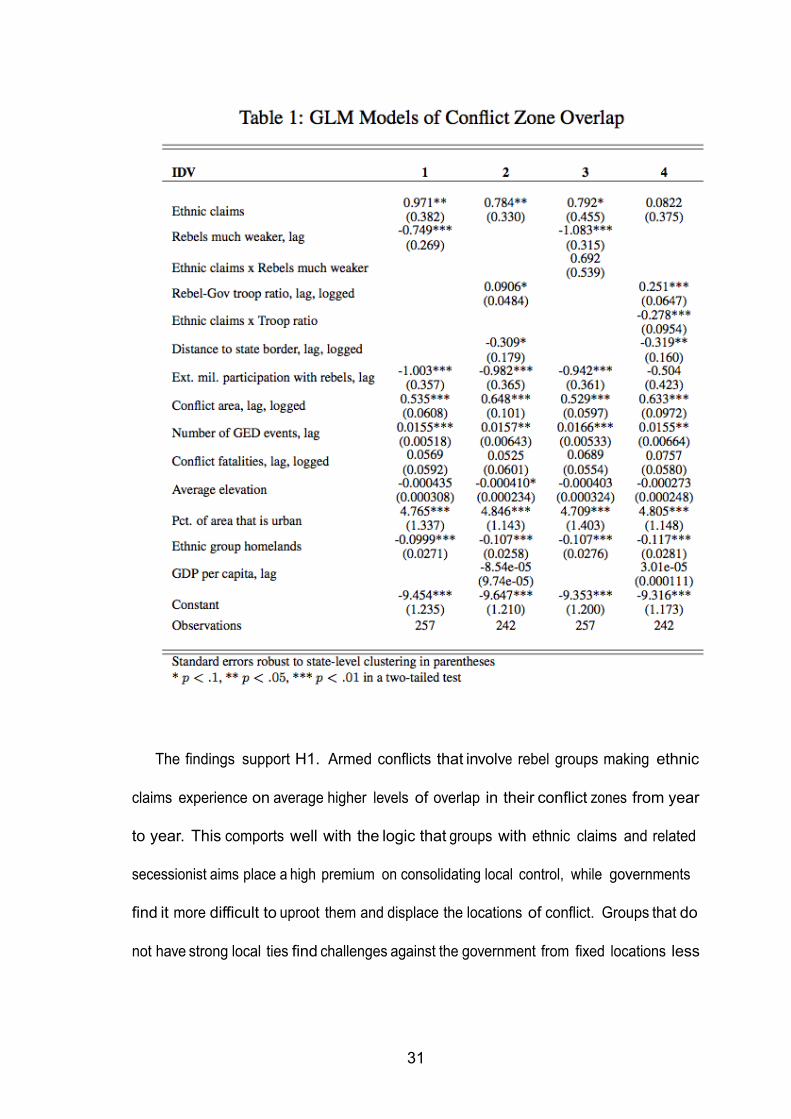
Table 1 presents the results of the models of the proportion of overlap in the conflict
polygons from the previous year. Model 1 uses the dichotomous measure of relative rebel
weakness, and Model 2 uses the troop ratio measure as well as the distance to the nearest
non-coastal international border as alternative measures of relative strength.
The measure of ethnic claims, more so than a measure of secessionist aims, stems from the origin of the
rebellion and is not something that rebel groups take or leave depending on the strategic opportunities for
mobility. Prior commitments to a more mobile strategy also do not well inform relative weakness, as if rebel
groups choose to remain weak so that they can maximize mobility. We doubt that many rebel groups would
forgo advancements in their relative capabilities just so that they could stay mobile. We also doubt that many
rebel groups would deny external military support, if even possible, when offered by a third party on the basis
that it preferred a fixed geographic theater of conflict.
31
The findings support H1. Armed conflicts that involve rebel groups making ethnic
claims experience on average higher levels of overlap in their conflict zones from year
to year. This comports well with the logic that groups with ethnic claims and related
secessionist aims place a high premium on consolidating local control, while governments
find it more difficult to uproot them and displace the locations of conflict. Groups that do
not have strong local ties find challenges against the government from fixed locations less
32
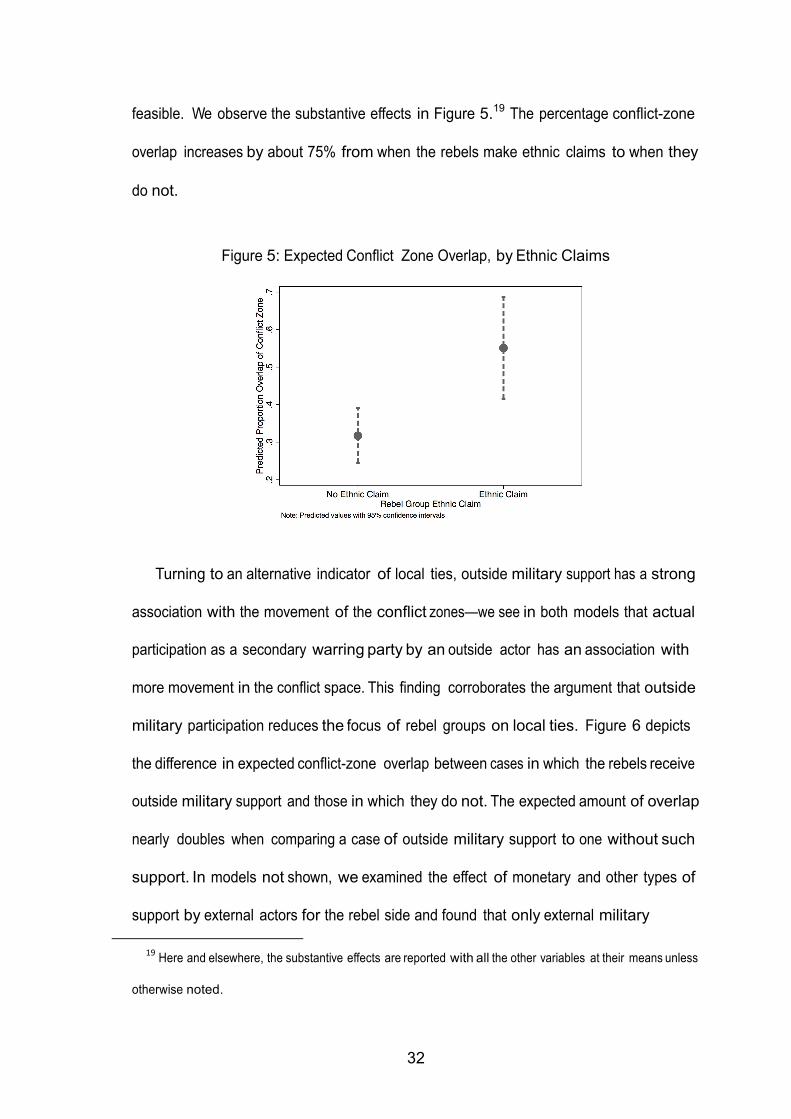
feasible. We observe the substantive effects in Figure 5.19 The percentage conflict-zone
overlap increases by about 75% from when the rebels make ethnic claims to when they
do not.
Figure 5: Expected Conflict Zone Overlap, by Ethnic Claims
Turning to an alternative indicator of local ties, outside military support has a strong
association with the movement of the conflict zones—we see in both models that actual
participation as a secondary warring party by an outside actor has an association with
more movement in the conflict space. This finding corroborates the argument that outside
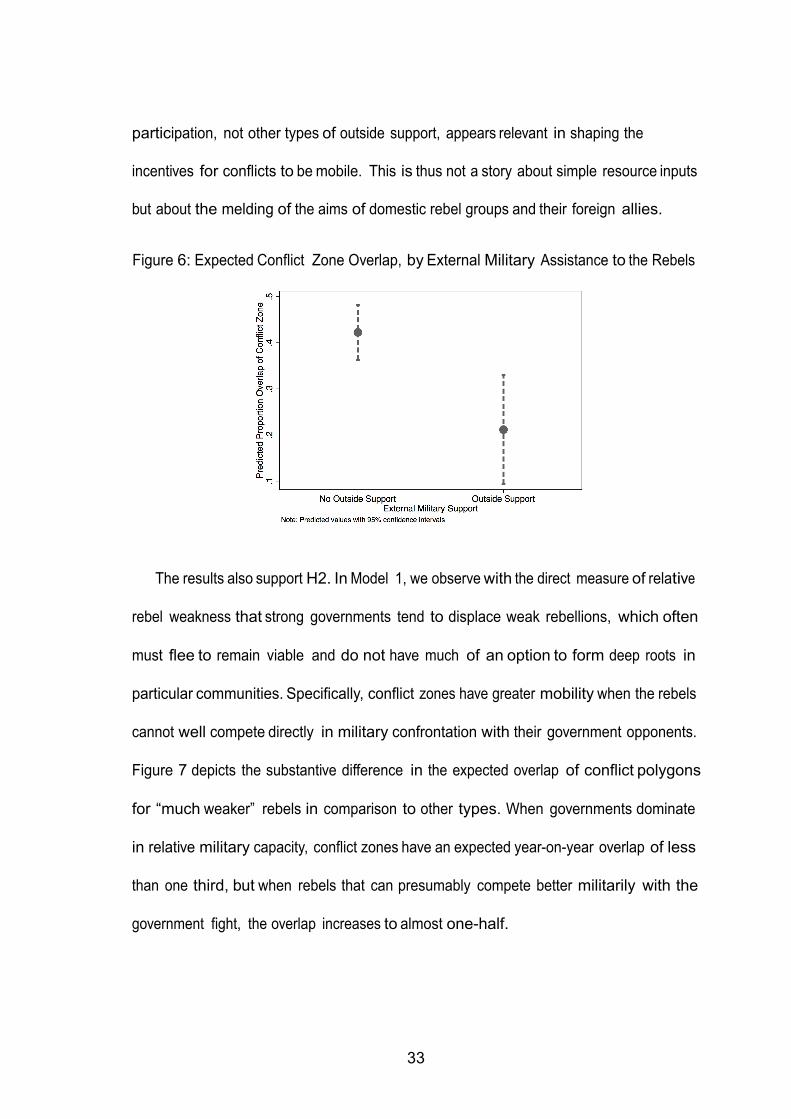
military participation reduces the focus of rebel groups on local ties. Figure 6 depicts
the difference in expected conflict-zone overlap between cases in which the rebels receive
outside military support and those in which they do not. The expected amount of overlap
nearly doubles when comparing a case of outside military support to one without such
support. In models not shown, we examined the effect of monetary and other types of
support by external actors for the rebel side and found that only external military
19 Here and elsewhere, the substantive effects are reported with all the other variables at their means unless
otherwise noted.
33
participation, not other types of outside support, appears relevant in shaping the
incentives for conflicts to be mobile. This is thus not a story about simple resource inputs
but about the melding of the aims of domestic rebel groups and their foreign allies.
Figure 6: Expected Conflict Zone Overlap, by External Military Assistance to the Rebels
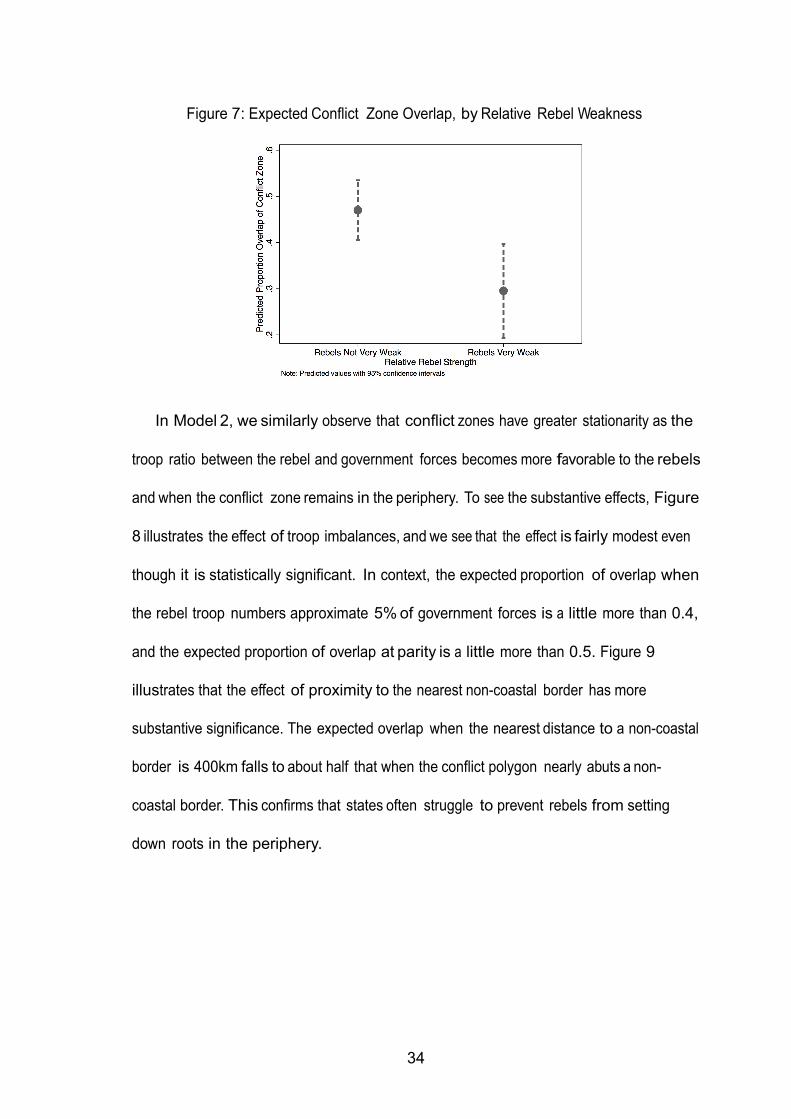
The results also support H2. In Model 1, we observe with the direct measure of relative
rebel weakness that strong governments tend to displace weak rebellions, which often
must flee to remain viable and do not have much of an option to form deep roots in
particular communities. Specifically, conflict zones have greater mobility when the rebels
cannot well compete directly in military confrontation with their government opponents.
Figure 7 depicts the substantive difference in the expected overlap of conflict polygons
for “much weaker” rebels in comparison to other types. When governments dominate
in relative military capacity, conflict zones have an expected year-on-year overlap of less
than one third, but when rebels that can presumably compete better militarily with the
government fight, the overlap increases to almost one-half.
34
Figure 7: Expected Conflict Zone Overlap, by Relative Rebel Weakness
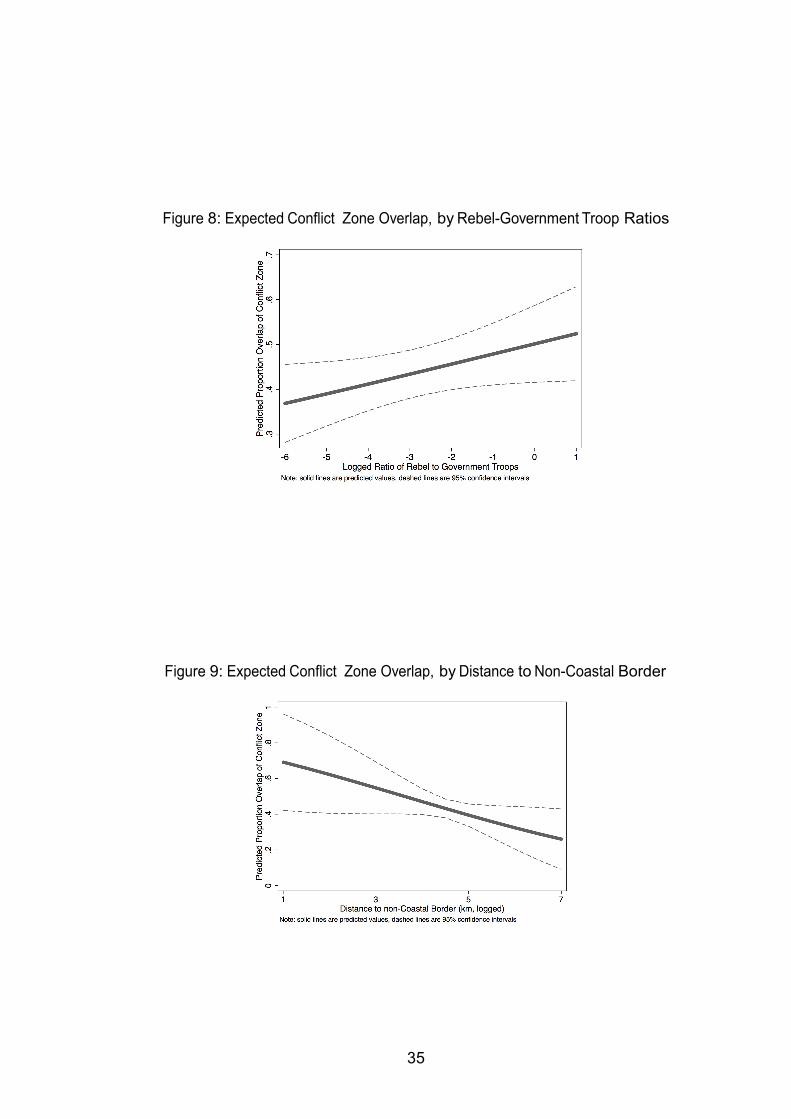
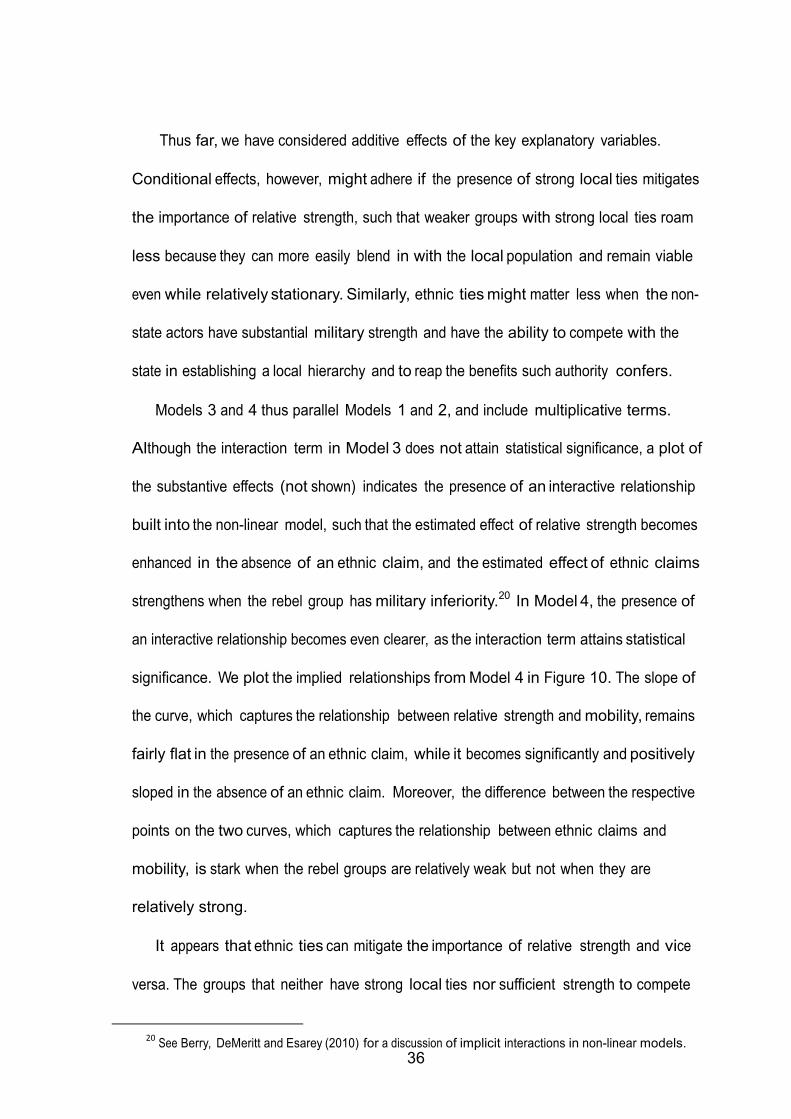
In Model 2, we similarly observe that conflict zones have greater stationarity as the
troop ratio between the rebel and government forces becomes more favorable to the rebels
and when the conflict zone remains in the periphery. To see the substantive effects, Figure
8 illustrates the effect of troop imbalances, and we see that the effect is fairly modest even
though it is statistically significant. In context, the expected proportion of overlap when
the rebel troop numbers approximate 5% of government forces is a little more than 0.4,
and the expected proportion of overlap at parity is a little more than 0.5. Figure 9
illustrates that the effect of proximity to the nearest non-coastal border has more
substantive significance. The expected overlap when the nearest distance to a non-coastal
border is 400km falls to about half that when the conflict polygon nearly abuts a non-
coastal border. This confirms that states often struggle to prevent rebels from setting
down roots in the periphery.
35
Figure 8: Expected Conflict Zone Overlap, by Rebel-Government Troop Ratios
Figure 9: Expected Conflict Zone Overlap, by Distance to Non-Coastal Border
36
Thus far, we have considered additive effects of the key explanatory variables.
Conditional effects, however, might adhere if the presence of strong local ties mitigates
the importance of relative strength, such that weaker groups with strong local ties roam
less because they can more easily blend in with the local population and remain viable
even while relatively stationary. Similarly, ethnic ties might matter less when the non-
state actors have substantial military strength and have the ability to compete with the
state in establishing a local hierarchy and to reap the benefits such authority confers.
Models 3 and 4 thus parallel Models 1 and 2, and include multiplicative terms.
Although the interaction term in Model 3 does not attain statistical significance, a plot of
the substantive effects (not shown) indicates the presence of an interactive relationship
built into the non-linear model, such that the estimated effect of relative strength becomes
enhanced in the absence of an ethnic claim, and the estimated effect of ethnic claims
strengthens when the rebel group has military inferiority.20 In Model 4, the presence of
an interactive relationship becomes even clearer, as the interaction term attains statistical
significance. We plot the implied relationships from Model 4 in Figure 10. The slope of
the curve, which captures the relationship between relative strength and mobility, remains
fairly flat in the presence of an ethnic claim, while it becomes significantly and positively
sloped in the absence of an ethnic claim. Moreover, the difference between the respective
points on the two curves, which captures the relationship between ethnic claims and
mobility, is stark when the rebel groups are relatively weak but not when they are
relatively strong.
It appears that ethnic ties can mitigate the importance of relative strength and vice
versa. The groups that neither have strong local ties nor sufficient strength to compete
20 See Berry, DeMeritt and Esarey (2010) for a discussion of implicit interactions in non-linear models.
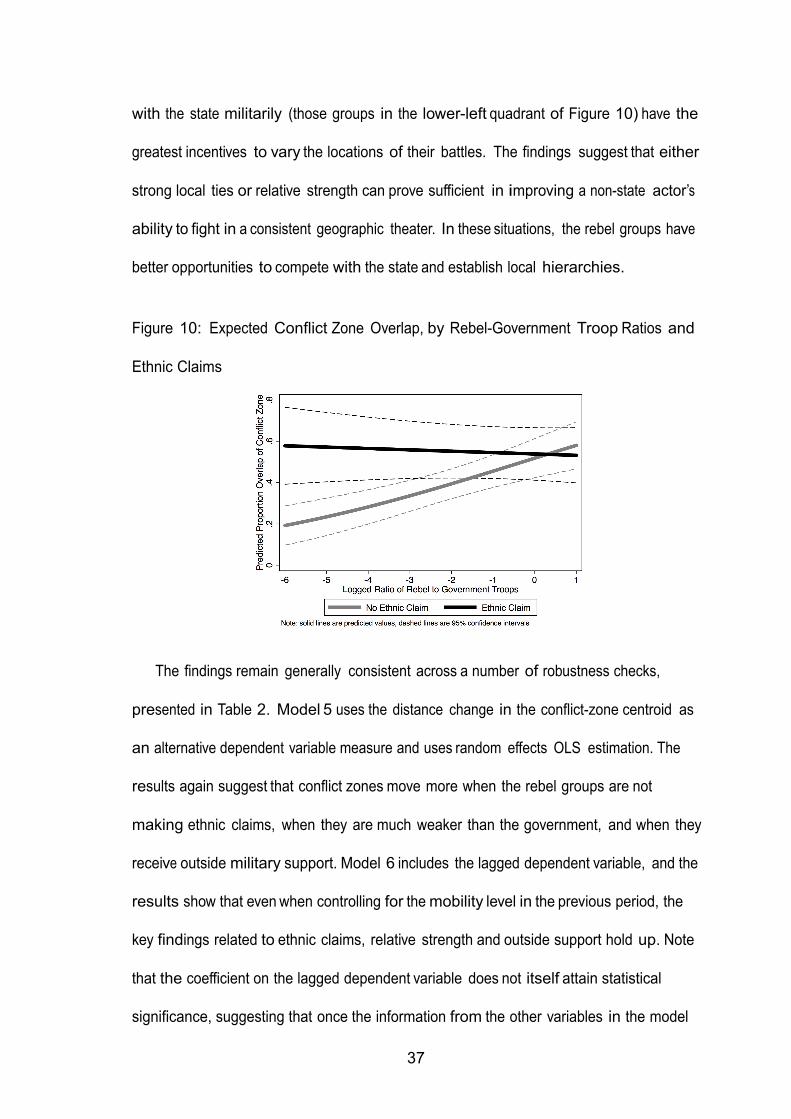
37
with the state militarily (those groups in the lower-left quadrant of Figure 10) have the
greatest incentives to vary the locations of their battles. The findings suggest that either
strong local ties or relative strength can prove sufficient in improving a non-state actor’s
ability to fight in a consistent geographic theater. In these situations, the rebel groups have
better opportunities to compete with the state and establish local hierarchies.
Figure 10: Expected Conflict Zone Overlap, by Rebel-Government Troop Ratios and
Ethnic Claims
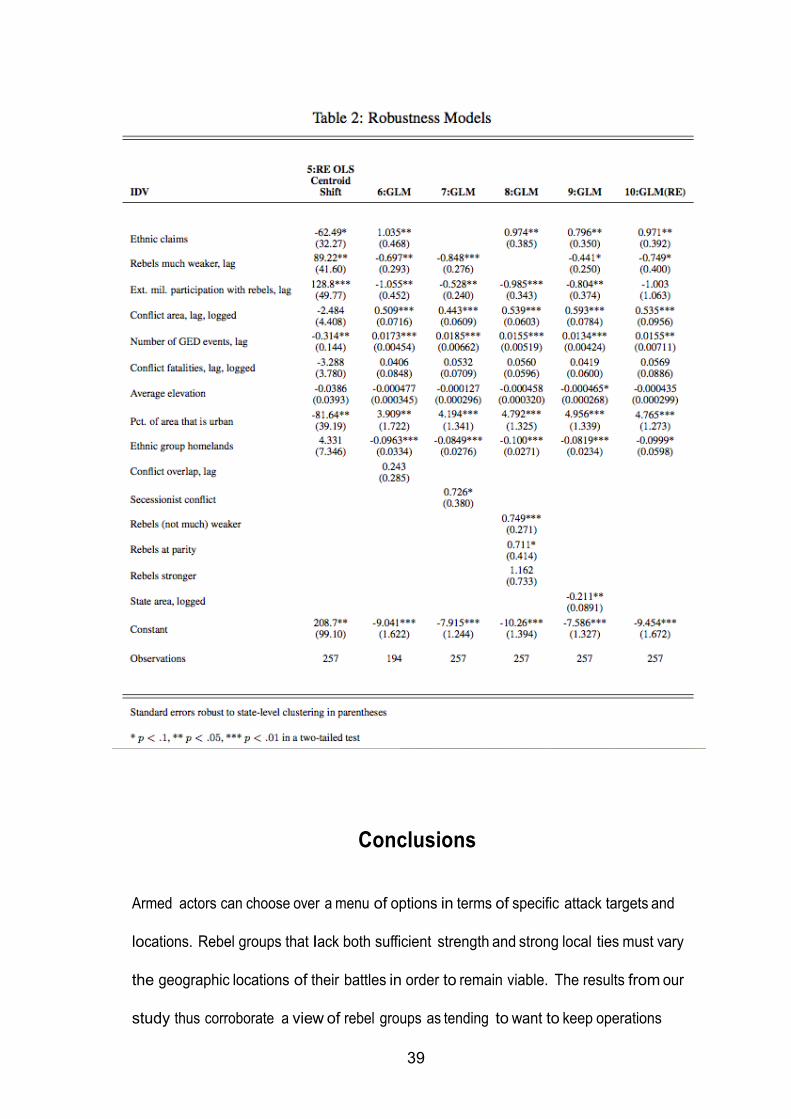
The findings remain generally consistent across a number of robustness checks,
presented in Table 2. Model 5 uses the distance change in the conflict-zone centroid as
an alternative dependent variable measure and uses random effects OLS estimation. The
results again suggest that conflict zones move more when the rebel groups are not
making ethnic claims, when they are much weaker than the government, and when they
receive outside military support. Model 6 includes the lagged dependent variable, and the
results show that even when controlling for the mobility level in the previous period, the
key findings related to ethnic claims, relative strength and outside support hold up. Note
that the coefficient on the lagged dependent variable does not itself attain statistical
significance, suggesting that once the information from the other variables in the model
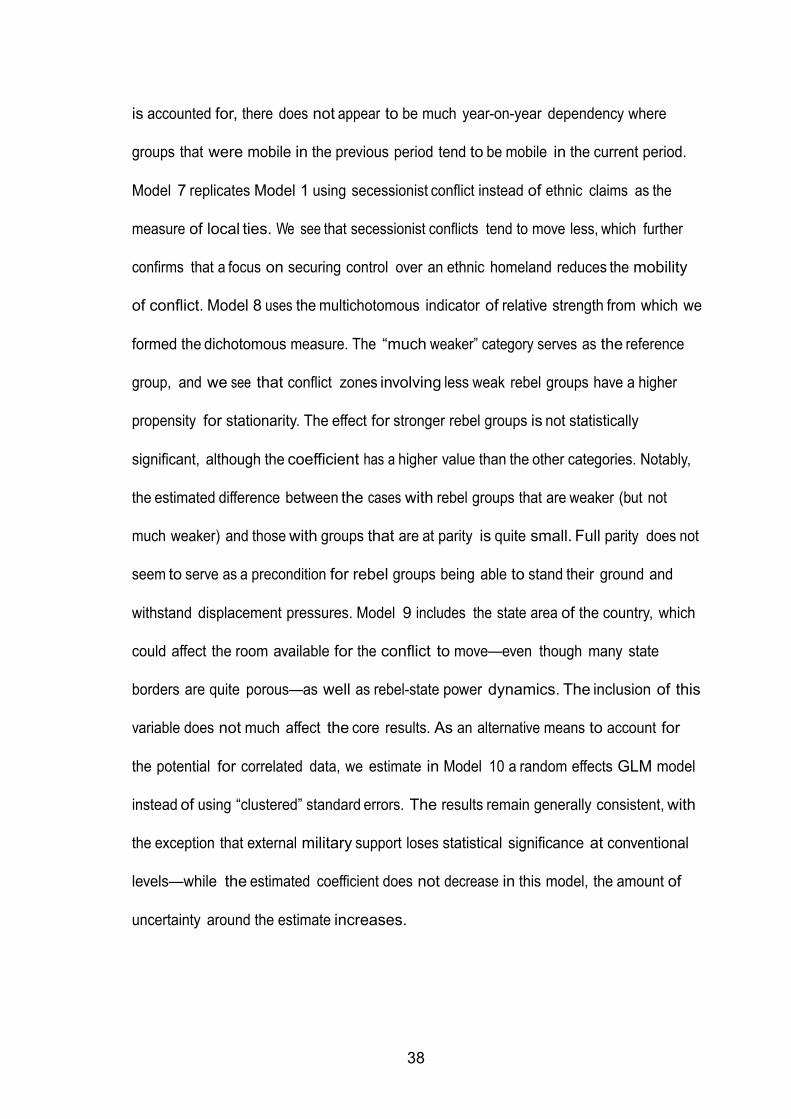
38
is accounted for, there does not appear to be much year-on-year dependency where
groups that were mobile in the previous period tend to be mobile in the current period.
Model 7 replicates Model 1 using secessionist conflict instead of ethnic claims as the
measure of local ties. We see that secessionist conflicts tend to move less, which further
confirms that a focus on securing control over an ethnic homeland reduces the mobility
of conflict. Model 8 uses the multichotomous indicator of relative strength from which we
formed the dichotomous measure. The “much weaker” category serves as the reference
group, and we see that conflict zones involving less weak rebel groups have a higher
propensity for stationarity. The effect for stronger rebel groups is not statistically
significant, although the coefficient has a higher value than the other categories. Notably,
the estimated difference between the cases with rebel groups that are weaker (but not
much weaker) and those with groups that are at parity is quite small. Full parity does not
seem to serve as a precondition for rebel groups being able to stand their ground and
withstand displacement pressures. Model 9 includes the state area of the country, which
could affect the room available for the conflict to move—even though many state
borders are quite porous—as well as rebel-state power dynamics. The inclusion of this
variable does not much affect the core results. As an alternative means to account for
the potential for correlated data, we estimate in Model 10 a random effects GLM model
instead of using “clustered” standard errors. The results remain generally consistent, with
the exception that external military support loses statistical significance at conventional
levels—while the estimated coefficient does not decrease in this model, the amount of
uncertainty around the estimate increases.
39
Conclusions
Armed actors can choose over a menu of options in terms of specific attack targets and
locations. Rebel groups that lack both sufficient strength and strong local ties must vary
the geographic locations of their battles in order to remain viable. The results from our
study thus corroborate a view of rebel groups as tending to want to keep operations

40
localized if they have the opportunity to do so—fighting in inconsistent locations only
becomes likely when they lack the ability to attain harbor from local communities and
lack the resources to compete militarily with state forces.
The findings bring into stark relief some of the dilemmas that state counterinsurgency
(COIN) efforts face when confronting rebellion. One dilemma relates to the ability for
militarily inferior groups to persist. Combined with the findings of Cunningham,
Gleditsch and Salehyan (2009)—that conflicts involving weaker rebel groups last
longer—it appears that relative strength does not well anticipate the ability of the
government’s COIN efforts to quell rebellion. Small rebel groups have asymmetric
information over their location, and our findings confirm that they can use that
informational advantage to fight in varied locations as a means of survival. Governments
likely face steep marginal costs to continue pursuing such rebel groups even though the
groups pose little immediate threat to the regime. And yet political costs likely increase
if governments do not continue to fight the rebels and instead pursue containment or
offering concessions; moreover, in the long-run unmolested groups have better
opportunities to consolidate sufficient support to pose a major threat to the regime, as
successful revolutions from Cuba to Libya have shown.
A related dilemma relates to how to approach conflicts involving rebels fighting for an
ethnic homeland, typically in the periphery. On the one hand a live-and-let-live approach
might seem enticing in the short run because such groups do not likely cause much of
a threat outside of a confined space. Our findings suggest that governments likely can
contain such conflicts relatively cheaply. On the other hand, allowing a rebel group to
consolidate authority will make it harder to deny greater autonomy or even secession in
the future and can also increase the need to rely on indiscriminate violence in the future
because the informational advantage has been allowed to grow (Kalyvas 2006; Kalyvas
41
and Kocher 2009). Moreover, simple containment likely will not ameliorate the horizontal
inequalities likely at the root of the armed rebellion in the first place (Cederman, Gleditsch
and Buhaug 2013).
Our findings also have implications to how future studies of civil war deal with
location-specific attributes. Our findings confirm that the zones of conflict often vary
quite a bit from year to year. Less than half of the conflict polygons in our analysis had at
least 50% overlap with the previous year, and about a quarter had virtually no overlap.
Analyses that fail to account for the mobility of conflict and have only treated the key
covariates as fixed descriptors of the conflict environment face the potential for
measurement error. Such approaches face an uphill challenge in detecting the effects of
attributes like relevant terrain and access to resources on conflict because imprecise
measurement at best adds uncertainty to statistical analyses. For example, rebel access to
“lootable” resources might have a strong effect on the duration of conflict (see, e.g.,
Lujala 2010; Ross 2004), but analyses would be prone to understate the effect if the
assigned values for the measure only applied some of the time to more mobile groups.
Buhaug, Cederman and Rød (2008), as another example, find little evidence of a clear
relationship between mountains and general civil war at the country level, but a much
stronger association between mountains and ethnic civil war in their dyad specific
analysis.
Aside from measurement error, analyses that overlook the potential for conflict zones
to move miss the opportunity to gain important insight into the many conflict and
conflict resolution processes that depend on local dynamics. Most studies assessing the
consequences of conflict have considered only non-spatial measures of severity (see,
e.g., Doyle and Sambanis 2000), without considering geographical or temporal
variation in their scope or intensity. Greig (2014), however, shows that geographical
42
variation in the locations of violence provides needed information that shapes the
potential for diplomatic initiatives to gain traction. Without attention to such local
processes, we would lack the ability to examine a key insight into strategic bargaining
behavior. Moreover, future research can reassess, for example, the findings of Doyle and
Sambanis (2000) that connect severity with long-term outcomes in light of how the
geography of severity ties in with other factors relevant to long-term outcomes such as
the form of conflict resolution (Greig 2014) or rebel ties with the local population (this
study).
43
References
Arreguin-Toft, Ivan. (2005) How the Weak Win Wars: A Theory of Asymmetric Conflict.
Cambridge: Cambridge University Press.
Beardsley, Kyle. (2011) Peacekeeping and the Contagion of Armed Conflict. Journal of
Politics 73(4):1051–1064.
Beardsley, Kyle and Brian McQuinn. ( 2009) Rebel Groups as Predatory Organizations:
The Political Effects of the 2004 Tsunami in Indonesia and Sri Lanka. Journal of
Conflict Resolution 53(4):624–645.
Berry, William D, Jacqueline HR DeMeritt and Justin Esarey. (2010) Testing for
Interaction in Binary Logit and Probit Models: Is a Product Term Essential?
American Journal of Political Science 54(1):248–266.
Blainey, Geoffrey. (1988) The Causes of War. Melbourne: Sun/Macmillan.
Braithwaite, Alex. (2010) Resisting Infection: How State Capacity Conditions Conflict
Contagion. Journal of Peace Research 47(3):311–319.
Buhaug, Halvard and Jan Ketil Rød. (2006) Local Determinants of African Civil Wars,
1970-2001. Political Geography 25(3):315–335.
Buhaug, Halvard and Kristian Skrede Gleditsch. (2008) Contagion or Confusion? Why
Conflicts Cluster in Space. International Studies Quarterly 52(2):215–233.
Buhaug, Halvard, Lars-Erik Cederman and Jan Ketil Rød. (2008) Disaggregating Ethno-
Nationalist Civil Wars: A Dyadic Test of Exclusion Theory. International
Organization 62(3):531–551.
Buhaug, Halvard and Paivi Lujala. (2005) Accounting for Scale: Measuring Geography
in Quantitative Studies of Civil War. Political Geography 24(4):399–418.
44
Buhaug, Halvard and Scott Gates. (2002) The Geography of Civil War. Journal of Peace
Research 39(4):417–433.
Carter, David B. (forthcoming) Provocation and the Strategy of Terrorist and Guerrilla
Attacks. International Organization .
Cederman, Lars-Erik, Halvard Buhaug and Jan Ketil Rød. ( 2009) Ethno-Nationalist
Dyads and Civil War: A GIS-Based Analysis. Journal of Conflict Resolution
53(4):496–525.
Cederman, Lars-Erik, Kristian Skrede Gleditsch and Halvard Buhaug. (2013) Inequality,
Grievances, and Civil War. New York: Cambridge University Press.
Cederman, Lars-Erik, Nils B. Weidmann and Kristian Skrede Gleditsch. ( 2011)
Horizontal Inequalities and Ethno-Nationalist Civil War: A Global Comparison.
American Political Science Review 105(3):478–495.
Croicu, Mihai Catalin and Ralph Sundberg. (2012) UCDP GED Conflict Polygons
Dataset Codebook version 1.1-2011. Department of Peace and Conflict Research,
Uppsala University.
Cunningham, David, Kristian Skrede Gleditsch and Idean Salehyan. (2009) It Takes Two:
A Dyadic Analysis of Civil War Duration and Outcome. Journal of Conflict Resolution
53(4):570–597.
Cunningham, Kathleen Gallagher and Nils B. Weidmann. (2010) Shared Space: Ethnic
Groups, State Accommodation, and Localized Conflict. International Studies Quarterly
54(4):1035–1054.
Doyle, Michael W. and Nicholas Sambanis. (2000) International Peacebuilding: A
Theoretical and Quantitative Analysis. American Political Science Review 94(4):779–
801.
45
Eck, Kristine. (2012) In Data We Trust? A Comparison of UCDP GED and ACLED
Conflict Events Datasets. Cooperation and Conflict 47(1):124–141.
Findley, Michael G. and Joseph K. Young. (2012) Terrorism and Civil War: A Spatial and
Temporal Approach to a Conceptual Problem. Perspectives on Politics 10(2):285–305.
Galula, David. (1964) Counterinsurgency Warfare: Theory and Practice. Westport,
CT: Praeger.
Greig, Michael J. (2014) Rebels at the Gates: Civil War Battle Locations, Movement,
and Openings for Diplomacy. International Studies Quarterly pp. early view, doi:
10.1111/isqu.12130.
GRUMP. ( 2011) Global Rural-Urban Mapping Project, Version 1 (GRUMPv1):
Urban Extents Grid. Palisades, NY: NASA Socioeconomic Data and Applications
Center (SEDAC), Center for International Earth Science Information Network
(CIESIN), Columbia University; International Food Policy Research Institute
(IFPRI), the World Bank, and the Centro Internacional de Agricultura Tropical
(CIAT). http://sedac.ciesin.columbia.edu/data/set/grump-v1-urban-extents. Accessed 4
July 2012.
Guevara, Ernesto (Che). (1961) Guerrilla Warfare. New York: Monthly Review Press.
Hegre, Havard, Gudrun Østby and Clionadh Raleigh. ( 2009) Poverty and Civil War
Events: A Disaggregated Study of Liberia. Journal of Conflict Resolution 53(4):598–
623.
Ho gbladh, Stina, Therese Pettersson and Lotta Themner. ( 2011) External Support in
Armed Conflict 1975-2009: Presenting New Data. Presented at the 52nd Annual
International Studies Association Convention, Montreal, Canada.
46
Kalyvas, Stathis. (2006) The Logic of Violence in Civil War. New York: Cambridge
University Press.
Kalyvas, Stathis N and Matthew Adam Kocher. (2009) The Dynamics of Violence in
Vietnam: An Analysis of the Hamlet Evaluation System (HES). Journal of Peace
Research 46(3):335–355.
Kocher, Matthew Adam, Thomas B Pepinsky and Stathis N Kalyvas. (2011)
Aerial Bomb- ing and Counterinsurgency in the Vietnam War. American
Journal of Political Science 55(2):201–218.
Lujala, Päivi. (2010) The spoils of nature: Armed civil conflict and rebel access to
natural resources. Journal of Peace Research 47(1): 15-28.
Lyall, Jason, Graeme Blair and Kosuke Imai. (2013) Explaining Support for
Combatants during Wartime: A Survey Experiment in Afghanistan. American
Political Science Review 107(04):679–705.
Mack, Andrew. (1975) Why Big Nations Lose Small Wars: The Politics of Asymmetric
Conflict. World Politics 27(2):175–200.
Mampilly, Zachariah Cherian. (2011) Rebel Rulers: Insurgent Governance and Civilian
Life during War. Ithaca, NY: Cornell.
Olson, Mancur. (1993) Democracy, Dictatorship, and Development. American Political
Science Review 87(3):567–576.
Olson, Mancur. (2000) Power and Prosperity. New York: Basic Books.
Papke, Leslie E. and Jeffrey M. Wooldridge. (1996) ”Econometric Methods for Fractional
Response Variables with an Application to 401(K) Plan Participation Rates. Journal
of Applied Econometrics 11(6):619–632.
47
Paul, Christopher, Colin P. Clarke, Beth Grill and Molly Dunigan. (2013) Paths to
Victory: Lessons from Modern Insurgencies. Santa Monica, CA: Rand.
Raleigh, Clionadh, Andrew Linke, Hvard Hegre and Joakim Karlsen. (2011) Introducing
Acled: An Armed Conflict Location and Event Dataset. Journal of Peace Research
47(5):651–660.
Raleigh, Clionadh and Havard Hegre. (2009) Population Size, Concentration, and Civil
War: A Geographically Disaggregated Analysis. Political Geography 28(4):224–238.
Ross, Michael. 2004. What Do We Know About Natural Resources and Civil War?
Journal of Peace Research 41(2):337–356.
Salehyan, Idean. (2009) Rebels Without Borders: State Boundaries, Transnational
Opposition, and Civil Conflict. Ithaca, NY: Cornell University Press.
Salehyan, Idean, David Siroky and Reed M. Wood. (2014) External Rebel Sponsorship
and Civilian Abuse: A Principal-Agent Analysis of Wartime Atrocities. International
Organization 68(3):633-661.
Salehyan, Idean and Kristian Skrede Gleditsch. ( 2006) Refugees and the Spread of Civil
War. International Organization 60(2):335–366.
Salehyan, Idean, Kristian Skrede Gleditsch and David Cunningham. (2011) Explaining
External Support for Insurgent Groups. International Organization 65(4):709–744.
Schutte, Sebastian and Nils B. Weidmann. (2011) Diffusion Patterns of Violence in Civil
Wars. Political Geography 30(3):143–152.
Skaperdas, Stergios and Constantinos Syropoulos. (1995) Gangs as Primitive States. In
The Economics of Organised Crime, ed. G. Fiorentini and S. Peltzman. Cambridge:
Cambridge University Press.
Valentino, Benjamin, Paul Huth and Dylan Balch-Lindsay. (2004) Draining the Sea: Mass
48
Killing and Guerrilla Warfare. International Organization 58(2):375–407.
Wagner, R. Harrison. (2000) Bargaining and War. American Journal of Political Science
44(4):469–484.
Weidmann, Nils B. (2009) Geography as Motivation and Opportunity. Journal of Conflict
Resolution 53(4):526–543.
Weidmann, Nils B. (2011) Violence ‘from ’Above’ or ‘from Below’? The Role of
Ethnicity in Bosnia’s Civil War. Journal of Politics 73(4):1178–1190.
Weidmann, Nils B., Doreen Kuse and Kristian Skrede Gleditsch. (2010) The Geography
of the International System: The Cshapes Dataset. International Interactions 36(1):86–
106.
Weidmann, Nils B. and Michael D. Ward. (2010) Predicting Conflict in Space and Time.
Journal of Conflict Resolution 54(6):883–901.
Weinstein, Jeremy. (2007) Inside Rebellion. New York: Cambridge University Press.
Wood, Reed M. (2010) Rebel Capability and Strategic Violence against Civilians.
Journal of Peace Research 47(5):601–614.
Wucherpfennig, Julian, Nils B. Weidman, Luc Girardin, Lars-Erik Cederman and Andreas
Wimmer. (2011) Politically Relevant Ethnic Groups across Space and Time:
Introducing the GeoEPR Dataset. Conflict Management and Peace Science
28(5):423–437.
Wucherpfennig, Julian, Nils B. Weidmann, Luc Girardin, Lars-Erik Cederman and
Andreas Wimmer. (2011) Politically Relevant Ethnic Groups Across Space and
Time: Introducing the GeoEPR Dataset. Conflict Management and Peace Science
28(5):423–437.
49
Wucherpfennig, Julian, Nils Metternich, Lars-Erik Cederman and Kristian Skrede
Gleditsch. (2012) Ethnicity, the State, and the Duration of Civil Wars. World
Politics 64(1):79–115.
Zhukov, Yuri M. (2012) Roads and the Diffusion of Insurgent Violence: The Logistics of
Conflict in Russia’s North Caucasus. Political Geography 31(3):144–156.