BANDITS: Bayesiandifferentialsplicingaccountingfor sample...
11
European Bioconductor Meeting 2019 BANDITS: Bayesian differential splicing accounting for sample-to-sample variability and mapping uncertainty Simone Tiberi and Mark D Robinson Institute of Molecular Life Sciences, University of Zurich SIB Swiss Instute of Bioinformatics, University of Zurich December 10, 2019 Simone Tiberi and Mark D Robinson 1/ 11
Transcript of BANDITS: Bayesiandifferentialsplicingaccountingfor sample...
European Bioconductor Meeting 2019
BANDITS:Bayesian differential splicing accounting for
sample-to-sample variabilityand mapping uncertainty
Simone Tiberi and Mark D Robinson
Institute of Molecular Life Sciences, University of ZurichSIB Swiss Instute of Bioinformatics, University of Zurich
December 10, 2019
Simone Tiberi and Mark D Robinson 1/ 11
European Bioconductor Meeting 2019
Differential splicing
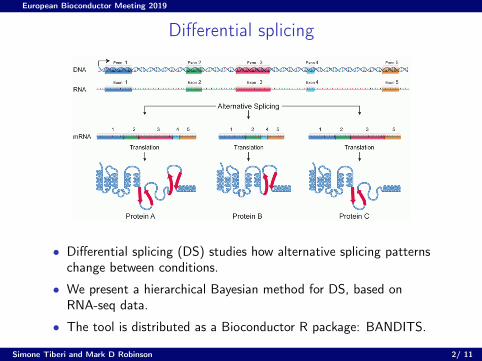
• Differential splicing (DS) studies how alternative splicing patternschange between conditions.
• We present a hierarchical Bayesian method for DS, based onRNA-seq data.
• The tool is distributed as a Bioconductor R package: BANDITS.
Simone Tiberi and Mark D Robinson 2/ 11
European Bioconductor Meeting 2019
Mapping uncertainty
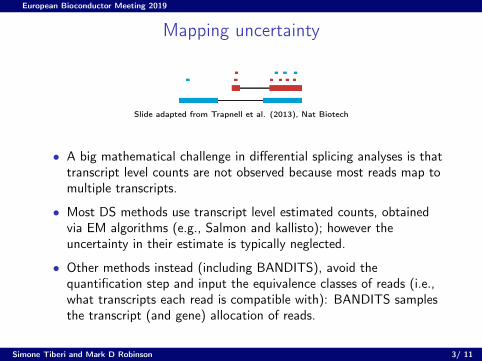
Slide adapted from Trapnell et al. (2013), Nat Biotech
• A big mathematical challenge in differential splicing analyses is thattranscript level counts are not observed because most reads map tomultiple transcripts.
• Most DS methods use transcript level estimated counts, obtainedvia EM algorithms (e.g., Salmon and kallisto); however theuncertainty in their estimate is typically neglected.
• Other methods instead (including BANDITS), avoid thequantification step and input the equivalence classes of reads (i.e.,what transcripts each read is compatible with): BANDITS samplesthe transcript (and gene) allocation of reads.
Simone Tiberi and Mark D Robinson 3/ 11
European Bioconductor Meeting 2019
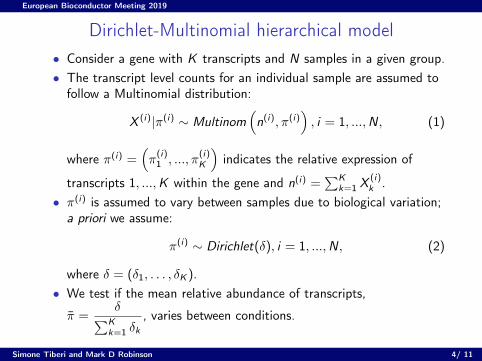
Dirichlet-Multinomial hierarchical model• Consider a gene with K transcripts and N samples in a given group.• The transcript level counts for an individual sample are assumed to
follow a Multinomial distribution:
X (i)|π(i) ∼ Multinom(n(i), π(i)
), i = 1, ...,N, (1)
where π(i) =(π(i)1 , ..., π
(i)K
)indicates the relative expression of
transcripts 1, ...,K within the gene and n(i) =∑K
k=1 X(i)k .
• π(i) is assumed to vary between samples due to biological variation;a priori we assume:
π(i) ∼ Dirichlet(δ), i = 1, ...,N, (2)
where δ = (δ1, . . . , δK ).• We test if the mean relative abundance of transcripts,
π̄ =δ∑K
k=1 δk, varies between conditions.
Simone Tiberi and Mark D Robinson 4/ 11
European Bioconductor Meeting 2019
In a nutshell
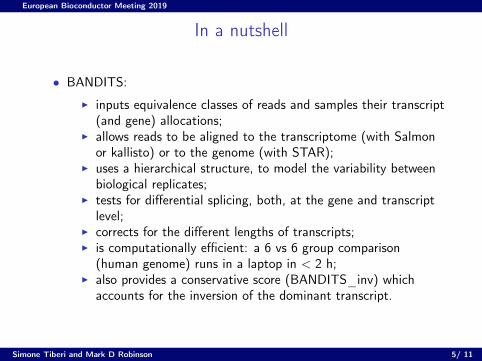
• BANDITS:
I inputs equivalence classes of reads and samples their transcript(and gene) allocations;
I allows reads to be aligned to the transcriptome (with Salmonor kallisto) or to the genome (with STAR);
I uses a hierarchical structure, to model the variability betweenbiological replicates;
I tests for differential splicing, both, at the gene and transcriptlevel;
I corrects for the different lengths of transcripts;I is computationally efficient: a 6 vs 6 group comparison
(human genome) runs in a laptop in < 2 h;I also provides a conservative score (BANDITS_inv) which
accounts for the inversion of the dominant transcript.
Simone Tiberi and Mark D Robinson 5/ 11
European Bioconductor Meeting 2019
Benchmarking
• We benchmarked our method against several competitors in threesimulated and two experimental datasets (all human genome).
• Simulation studies:
I a 3 vs 3 two-group comparison (not shown);I a 6 vs 6 two-group comparison (not shown);I a 6 vs 6 two-group comparison (with transcript pre-filtering);
• Experimental data:
I “Best et al. data” (Best et al., 2014), with a 3 vs 3 two-groupcomparison, with 82 validated genes (via PCR);
I a “null” experimental dataset (Kim et al., 2013), with a 3 vs 3two-group comparison, where all samples belong to the samegroup of healthy patients.
Simone Tiberi and Mark D Robinson 6/ 11
European Bioconductor Meeting 2019
Simulation study
0.25 0.50 0.75 1.000.5
0.6
0.7
0.8
0.9
FDR
TP
R
method
BANDITS
BANDITS_inv
BayesDRIMSeq
BayesDRIMSeq_inv
cjBitSeq
cjBitSeq_inv
DEXSeq
DEXSeq_ECCs
DEXSeq_TECs
DRIMSeq
limma
rats
SUPPA2
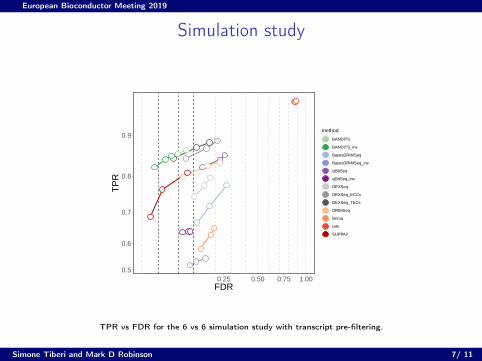
TPR vs FDR for the 6 vs 6 simulation study with transcript pre-filtering.
Simone Tiberi and Mark D Robinson 7/ 11
European Bioconductor Meeting 2019
Best et al. data
0.01 0.05 0.10 0.25 0.50 0.75 1.00
0.00
0.25
0.50
0.75
1.00
FPR
TP
R
method
BANDITSBANDITS_invBayesDRIMSeqBayesDRIMSeq_invcjBitSeq
cjBitSeq_invDEXSeqDEXSeq_ECCsDEXSeq_TECsDRIMSeq
limmaratsSUPPA2
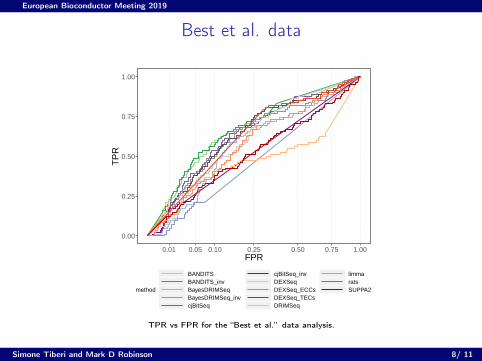
TPR vs FPR for the “Best et al.” data analysis.
Simone Tiberi and Mark D Robinson 8/ 11
European Bioconductor Meeting 2019
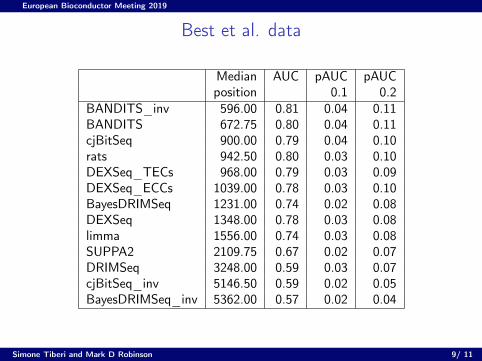
Best et al. data
Median AUC pAUC pAUCposition 0.1 0.2
BANDITS_inv 596.00 0.81 0.04 0.11BANDITS 672.75 0.80 0.04 0.11cjBitSeq 900.00 0.79 0.04 0.10rats 942.50 0.80 0.03 0.10DEXSeq_TECs 968.00 0.79 0.03 0.09DEXSeq_ECCs 1039.00 0.78 0.03 0.10BayesDRIMSeq 1231.00 0.74 0.02 0.08DEXSeq 1348.00 0.78 0.03 0.08limma 1556.00 0.74 0.03 0.08SUPPA2 2109.75 0.67 0.02 0.07DRIMSeq 3248.00 0.59 0.03 0.07cjBitSeq_inv 5146.50 0.59 0.02 0.05BayesDRIMSeq_inv 5362.00 0.57 0.02 0.04
Simone Tiberi and Mark D Robinson 9/ 11
European Bioconductor Meeting 2019
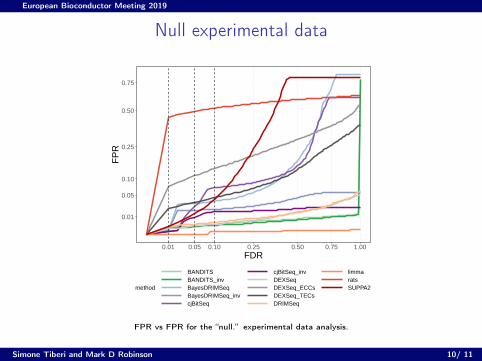
Null experimental data
0.01
0.05
0.10
0.25
0.50
0.75
0.01 0.05 0.10 0.25 0.50 0.75 1.00FDR
FP
R
method
BANDITSBANDITS_invBayesDRIMSeqBayesDRIMSeq_invcjBitSeq
cjBitSeq_invDEXSeqDEXSeq_ECCsDEXSeq_TECsDRIMSeq
limmaratsSUPPA2
FPR vs FPR for the “null.” experimental data analysis.
Simone Tiberi and Mark D Robinson 10/ 11
European Bioconductor Meeting 2019
Availability and Acknowledgements
• Bioconductor R package:
I https://bioconductor.org/packages/BANDITSI https://github.com/SimoneTiberi/BANDITS
• Pre-print
I Tiberi and Robinson, biorxiv (2019). BANDITS: Bayesiandifferential splicing accounting for sample-to-sample variabilityand mapping uncertainty.https://www.biorxiv.org/content/10.1101/750018v1
• Acknowledgements:
I Mark D Robinson;I Charlotte Soneson and the Robinson lab;I Panagiotis Papastamoulis, Magnus Rattray and David Rossell.
Simone Tiberi and Mark D Robinson 11/ 11