Rong Viet Securities - Investment Strategy Report August 2017
Upload
thomas-farthoferCategory
view
117download
2
After successfully passed the 732.9 milestone in the middle of May, VNIndex fluctuated around 740 over the last two weeks of May. Mid and small-cap stocks outperformed large-cap stocks last month in terms of index growth and liquidity. Liquidity surprised us with total trading value of VND5,042 bil for both stock exchanges, 37% higher than the average of the first 5 month in 2017 and doubled the average amount of 2016. During that period, foreign investors continuously accumulated with the total net buying value of VND 7,000 bil, the highest level since 2008.
For the remaining months of 2017, we believe that stock market sentiment will be positive and demand remains still high from not only the domestic but also foreign investors. The arguments are as followed:
o The international investors continue to highly rate Vietnam’s business environment following the Government commitments to stabilize the economy. Regarding of recent review, Fitch made upward adjustment to Vietnam’s credit rating from “stable” to “positive”. In addition, the CDS 5-year index of Vietnam has been on the downward trend to the lowest level set in 2017. The lower index is considered as the less risky of Vietnam’s economy.
o The Government released the Instruction no. 24/CT-TTg, which requires the related ministries to have specific solutions for 2017’s GDP growth target of 6.7%. In addition to this, the credit growth for 2017 is also required to achieve more than 18% YoY threshold to support this target.
o Low inflation in May 2017 will support the Government in an effort to keep macro indicators such as lending rate and FX variation to as stable as they committed. In fact, after a temporary increase in the first months, interest rate has been cool down in recent weeks, proving through the decrease of average overnight lending rate in the interbank market to 1.8%.
o Although VNIndex has climbed to the highest level for years, the PE has actually been stable around 16x. It might indicate that relative valuation of Vietnam stock exchanges is still more attractive than other markets such as Arab Saudi, Malaysia, Indonesia and Philippines. Moreover, as our observation, VNIndex has a negative correlation with CDS Index in past years. Assuming that the relationship will be true in upcoming period, the probability that VNIndex can reach the higher peak by the end 2017 is quite high.
VNIndex fluctuated quite narrowly around 740 points after successfully surpassing 732. The pressure to reduce margin on some “hot” stocks may be a reason for investors to be cautious again. Notwithstanding, the gap in frontier basket, couple with Government’s commitment to stabilize macro factors will keep the money in the markets. For June 2017, we expect VNIndex to hover between 730 – 760 with the total trading volume to be around VND4,000 bil.
Analysis and Investment Advisory
Truc Doan – Head of Research
Ha My Tran
Lam Nguyen
Thien Bui
Hieu Nguyen
Quang Vo
Huong Pham
Please see penultimate page for additional important disclosure
Viet Dragon Securities Corp. (“VDSC”) is a foreign broker-dealer unregistered in the USA. VDSC research is prepared by research analysts who are not registered in the USA. VDSC research is distributed in the USA pursuant to Rule 15a-6 of the Securities Exchange Act of 1934 solely by Rosenblatt Securities Inc, an SEC registered and FINRA-member broker-dealer.
690
710
730
750
0
50
100
150
200
250
300
27/02 13/03 27/03 11/04 25/04 11/05 25/05
Trading Volume (mil. shares) VNINdex (right axis)
06/06/2017
Investment Strategy June 2017
Scanning Stocks for Long-term Goals

Rong Viet Securities Corporation – Investment Strategy Report June 2017 2
CONTENTS
WORLD ECONOMY ................................................................................................................................................................................ 3 US: The Fed is Likely to Raise Interest Rates In June ........................................................................................................................................................ 3 EU: Recovery Continues ............................................................................................................................................................................................................ 3 China: Growth Momentum Has Softened .......................................................................................................................................................................... 4
GLOBAL STOCK MARKETS ................................................................................................................................................................... 5 VIETNAM ECONOMY ............................................................................................................................................................................ 7
Policy Makers Put Their Focuses on Growth - The Degree of Loosening Monetary Policy Has Increased ................................................... 7 Credit Growth Trend is Not Sustainable .............................................................................................................................................................................. 9 Reflation Turned into Disinflation ....................................................................................................................................................................................... 10 The New Resolution in Handling Bad Debts: The Next Chapter ............................................................................................................................... 11
VIETNAM STOCK MARKET MAY: NEW MILESTONES ACHIEVED ..................................................................................................... 12 JUNE STOCK MARKET OUTLOOKS .................................................................................................................................................... 16
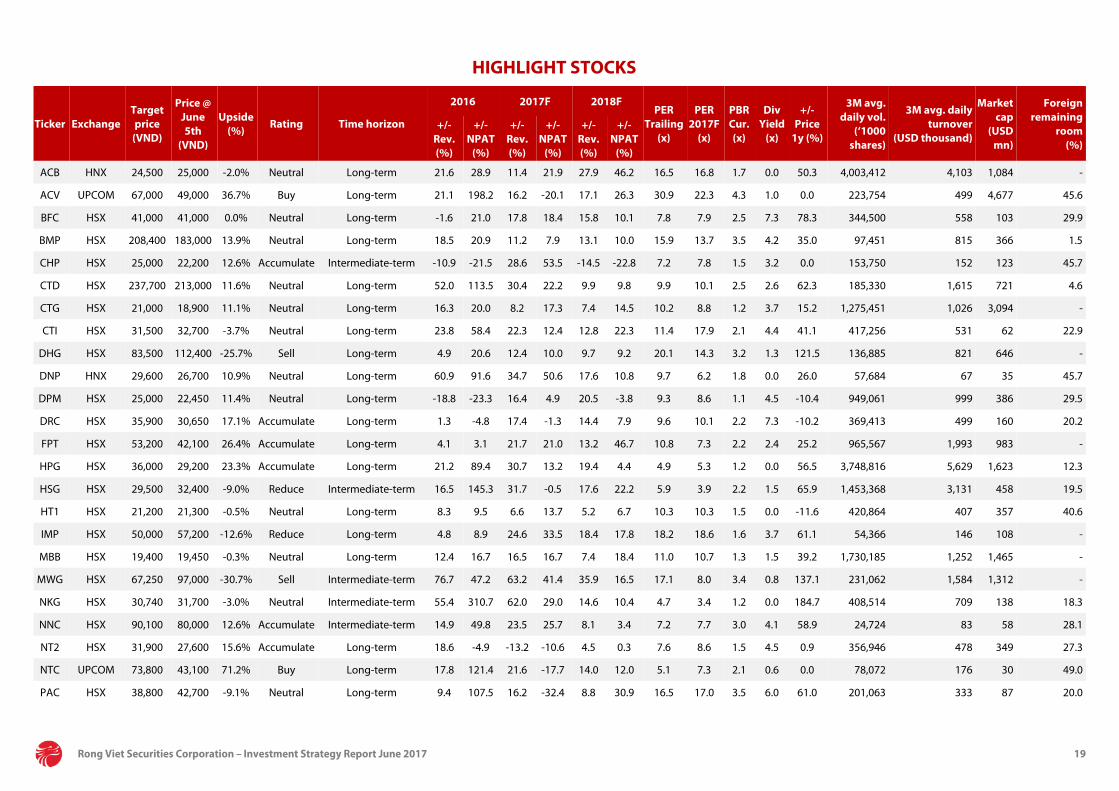
We think it’s time for investors to restructure their portfolio: Considering to take profit from groups which significantly increased in stock prices since the beginning of the year, especially stocks whose price rally is mostly driven by one-off earnings expectation. Moreover, given positive prospects of Vietnam’s macroeconomics, it is the ideal period that investors can scan for tickers with good fundamental aspects and positive long-term prospects. Those industries could be candidates which will be benefit from the Government’s effort to push GDP growth.
Business performance of the steel industry overall has been in line with our expectation in the first five months of 2017. Because global steel prices were at high-levels during early-2017, the strong earnings growth of steel industry mostly came from capacity expansion while only a small proportion came from input price movements. As we discussed about construction steel in the previous strategy reports, color coated steel is another story that we would like to introduce to investors at this time. Two large color coated steel makers, HSG and NKG are going to directly benefit from the decision. Another coated steel candidate, Ton Dong A, is expected to be listed in late-2017. Briefly, Ton Dong A is the third-largest domestic coated steel producer and expanding capacity aggressively as their new plant is under construction. Their product mix focuses on high-quality coated steel and the targeted markets are different to the traditional steel sheet users. Therefore, we think Ton Dong A is another name that is also worth paying attention to.
We recognize several catalysts for the rally of the banking industry stocks. Particular, in the first five months of 2017, credit growth reached 6.53% (YTD on May 25th), the fastest growth rate for years. Moreover, following the recent issued Instructions for the economy in the next six months, 2017 credit growth will be much higher than the target of 18% during early 2017. It is valuable to notice that credit growth in some listed banks such as ACB or VCB fulfilled 30-50% their room for credit growth in 2017. Therefore, we expect that these banks will be approved to lift the room for their credit growth. Regarding the progress of bad debt solving, corridor of laws has been completed step by step. In May 2017, the National Assembly discussed on the Draft Decision on Bad Debt Solution. We expect that this Decision will be approved quickly to be effective on July 1st 2017. Moreover, early June, Circular 53/2017/TT-BTC to instruct the implementation of Decree 69/2016/NĐ-CP on debt trading servicing business conditions was also issued. Although we do not think that the bad debt recovery rate will have a huge pace before 2018, the progress of improving laws has been sending a positive signal for this issue outlooks.
Hydropower sector in Q2 2017 still possess strong outlook thanks to the favorable hydrological condition in the Central, Central Highlands and the South. It brings 10 – 30% higher in rainfall than the average of years. Meanwhile, since the North and the Central regions also have several phases of extremely hot weather condition in May and June 2017, the selling price in Competitive Generated Market remains high in Q2 2017. Therefore the profit of hydropower companies have been enhanced. Moreover, with new policy of the Government to purchase solar electricity at 9.35 US cent/kWh (even higher than average electricity-retail price) and the downtrend in investment costs of solar projects, we expect that solar powers have become very profitable. In solar power development, we highly rank SHP and CHP for their strong prospects in the expansion of production capacity with specific projects that are deployed smoothly.
Last but not least, given high demand in infrastructure investment and development, as well as their high proportion of Gen Y population with growing income which is more and more attractive to FDI inflows, we maintain our positive perspective on construction, consumers, and infrastructure-related sectors.
HIGHLIGHT STOCKS ............................................................................................................................................................................ 19
46 stocks of RongViet Research (analyzing, discussing with companies) and have analysis and specific evaluation in “Company report” or “Analyst pinboard”.

Rong Viet Securities Corporation – Investment Strategy Report May 2017 3
WORLD ECONOMY • US: The Fed is Likely to Raise Interest Rates in June • EU: Recovery Continues • China: Growth Momentum Has Softened
The U.S. growth was not so bad after revisions in Q12017, the economy is expected to have a moderate in the next quarter thanks to the resilience in manufacturing and private consumption. In addition, strong labor market also supports the ability that the Fed will raise interest rates in the next meeting on 13-14 June. For now, the Eurozone economic recovery continues and investors expected that ECB policy makers could take a more benign view of the economy and become less dovish. In Asia, China’s economic growth started showing some signs of slowdown at the onset of Q2, 1Q17 may also mark the peak of the ongoing cyclical recovery in this country.
US: The Fed is Likely to Raise Interest Rates In June
Revised data showed that the economy grew faster than initially reported, with upward revisions to private consumption and business fixed investment. GDP rose at 1.2% annualized rate, revised from 0.7%. Consumer spending, the biggest part of the economy, rose 0.6%, revised from 0.3%. However, GDP growth was nowhere near the 2.1% expansion recorded in the last quarter of 2016, confirming the signs that the U.S. economy had experienced a bumpy ride at the beginning of the year.
Heading into Q2, manufacturing and private consumption are expected to show more resilience, providing further round for the Fed to increase rates at its upcoming 13-14 June meeting. The ISM manufacturing index rose slightly from 54.8 in April to 54.9 in May, after having declined for two consecutive months. The details of May’s report are very encouraging. Specifically, output growth slipped marginally while demand for manufacturing production was reportedly stronger in the month, with new orders growth accelerating markedly. Regarding the labor market, the unemployment rate dropped to 4.3% in May, the lowest level in 16 years. According to the May report, the U.S. job market is near full employment despite weak payroll growth.
Figure 1: ISM Manufacturing Index Figure 2: The U.S. Unemployment Rate
Source: Bloomberg Source: Bloomberg
EU: Recovery Continues
Leading indicators for the second quarter remain positive as both the composite PMI and economic sentiment were at multi-year highs. In May, the Eurozone Composite PMI increased slightly to 57, the best result since April 2011. May’s data reflected the strongest job growth in over a decade as widespread optimism prevails among firms. Output expanded at the best pace in six years, although new order growth moderated slightly. Regarding the two largest Eurozone economies, economic conditions improved in France and Germany, and the PMIs rested at multi-
46
48
50
52
54
56
58
01/1
6
02/1
6
03/1
6
04/1
6
05/1
6
06/1
6
07/1
6
08/1
6
09/1
6
10/1
6
11/1
6
12/1
6
01/1
7
02/1
7
03/1
7
04/1
7
05/1
7
3.6%
4.0%
4.4%
4.8%
5.2%
01/1
602
/16
03/1
604
/16
05/1
606
/16
07/1
608
/16
09/1
610
/16
11/1
612
/16
01/1
702
/17
03/1
704
/17
05/1
7

Rong Viet Securities Corporation – Investment Strategy Report June 2017 4
year highs. In addition, the ZEW Economic Sentiment Index* in the bloc continuously improved in May (35.1 points), the best result since August 2015.
Investors are awaiting for an upcoming monetary meeting from the ECB at the outset of June 2017. There are concerns that ECB policy makers could take a more benign view of the economy and become less dovish. This expectation and bright economic data led the euro to hit a six-month high against the USD at the end of May.
* the ZEW Economic Sentiment Index measures the level of optimism that analysts have about current economic situation and expected economic developments for the next 6 months.
Figure 3: Eurozone PMI Figure 4: Economic Sentiment in EU
Source: Bloomberg Source: Bloomberg
China: Growth Momentum Has Softened
Weaker external demand and manufacturing activity weighed on growth in April, while investments in the real estate sector and infrastructure remained resilient. In April, industrial production in China expanded 6.5% YoY, down from March’s 7.6% rise. The slowdown in April reflected weaker growth in manufacturing output and in electricity, gas and water supply activities. In the first 4 months of the year, urban fixed-asset investment (FAI), excluding rural households, expanded 8.9% annually, which was below the 9.2% increase in the Q1 period. Despite the moderation in investment growth, the real estate development indicator expanded at the fastest pace in over two years, suggesting that dynamics in the property sector remain strong. Based on above data, growth momentum has softened at the beginning of Q2.
In May, China has two diplomatic events. The country hosted the first Belt and Road Forum on 14-15 May, this program is the cornerstone of China’s internationalization strategy and earmarks more than USD 1 trillion for investments over the coming years in more than 60 countries. Moreover, China and the U.S. unveiled a set of trade deals on 11 May, which are expected to ease tensions between the two countries.
Figure 5: China Manufacturing PMI Figure 6: FAI Investment Growth
Source: Bloomberg Source: Bloomberg
50
52
54
56
58
01/1
6
02/1
6
03/1
6
04/1
6
05/1
6
06/1
6
07/1
6
08/1
6
09/1
6
10/1
6
11/1
6
12/1
6
01/1
7
02/1
7
03/1
7
04/1
7
05/1
7
-20
-10
0
10
20
30
40
01/1
6
02/1
6
03/1
6
04/1
6
05/1
6
06/1
6
07/1
6
08/1
6
09/1
6
10/1
6
11/1
6
12/1
6
01/1
7
02/1
7
03/1
7
04/1
7
05/1
7
47
48
49
50
51
52
53
01/1
5
03/1
5
05/1
5
07/1
5
09/1
5
11/1
5
01/1
6
03/1
6
05/1
6
07/1
6
09/1
6
11/1
6
01/1
7
03/1
7
05/1
7
Manufacturing PMI (Caixin)
Official manufacturing PMI
89
1011121314151617
01/1
5
03/1
5
05/1
5
07/1
5
09/1
5
11/1
5
01/1
6
03/1
6
05/1
6
07/1
6
09/1
6
11/1
6
01/1
7
03/1
7
Rong Viet Securities Corporation – Investment Strategy Report June 2017 5
GLOBAL STOCK MARKETS
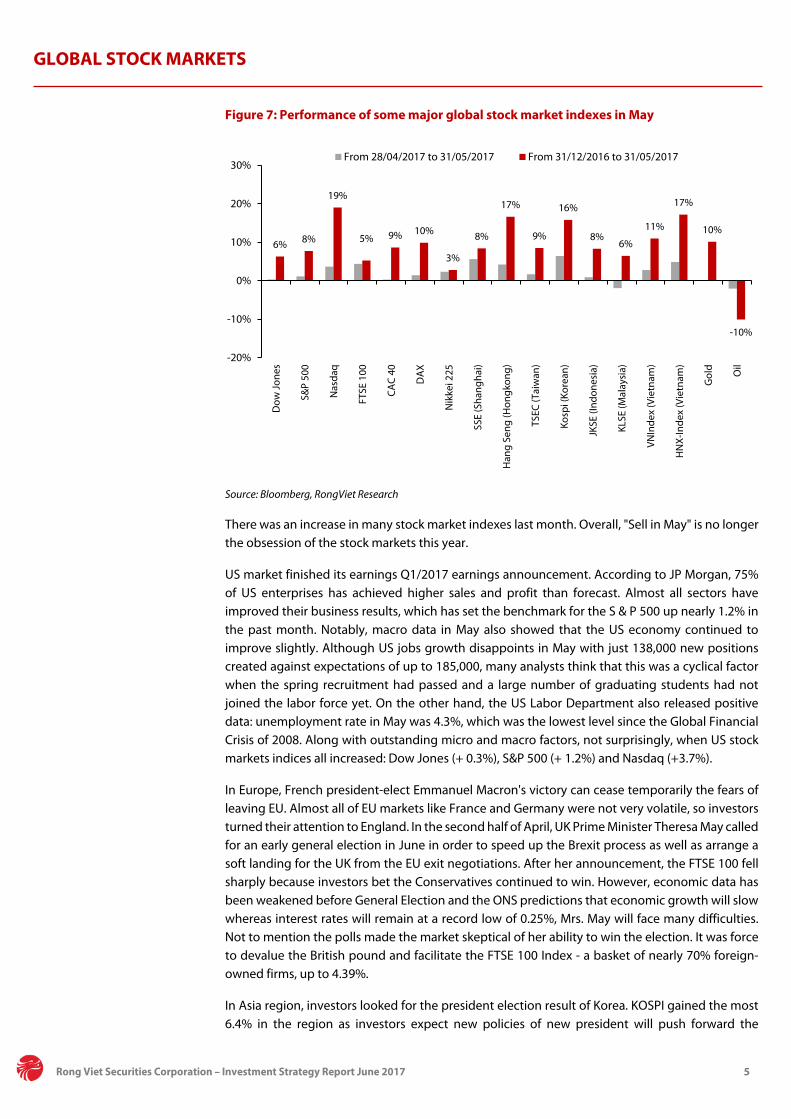
Figure 7: Performance of some major global stock market indexes in May
Source: Bloomberg, RongViet Research
There was an increase in many stock market indexes last month. Overall, "Sell in May" is no longer the obsession of the stock markets this year.
US market finished its earnings Q1/2017 earnings announcement. According to JP Morgan, 75% of US enterprises has achieved higher sales and profit than forecast. Almost all sectors have improved their business results, which has set the benchmark for the S & P 500 up nearly 1.2% in the past month. Notably, macro data in May also showed that the US economy continued to improve slightly. Although US jobs growth disappoints in May with just 138,000 new positions created against expectations of up to 185,000, many analysts think that this was a cyclical factor when the spring recruitment had passed and a large number of graduating students had not joined the labor force yet. On the other hand, the US Labor Department also released positive data: unemployment rate in May was 4.3%, which was the lowest level since the Global Financial Crisis of 2008. Along with outstanding micro and macro factors, not surprisingly, when US stock markets indices all increased: Dow Jones (+ 0.3%), S&P 500 (+ 1.2%) and Nasdaq (+3.7%).
In Europe, French president-elect Emmanuel Macron's victory can cease temporarily the fears of leaving EU. Almost all of EU markets like France and Germany were not very volatile, so investors turned their attention to England. In the second half of April, UK Prime Minister Theresa May called for an early general election in June in order to speed up the Brexit process as well as arrange a soft landing for the UK from the EU exit negotiations. After her announcement, the FTSE 100 fell sharply because investors bet the Conservatives continued to win. However, economic data has been weakened before General Election and the ONS predictions that economic growth will slow whereas interest rates will remain at a record low of 0.25%, Mrs. May will face many difficulties. Not to mention the polls made the market skeptical of her ability to win the election. It was force to devalue the British pound and facilitate the FTSE 100 Index - a basket of nearly 70% foreign-owned firms, up to 4.39%.
In Asia region, investors looked for the president election result of Korea. KOSPI gained the most 6.4% in the region as investors expect new policies of new president will push forward the
6% 8%
19%
5% 9% 10%
3%
8%
17%
9%
16%
8%6%
11%
17%
10%
-10%
-20%
-10%
0%
10%
20%
30%
Dow
Jone
s
S&P
500
Nas
daq
FTSE
100
CAC
40
DA
X
Nik
kei 2
25
SSE
(Sha
ngha
i)
Han
g Se
ng (H
ongk
ong)
TSEC
(Tai
wan
)
Kosp
i (Ko
rean
)
JKSE
(Ind
ones
ia)
KLSE
(Mal
aysi
a)
VNIn
dex
(Vie
tnam
)
HN
X-In
dex
(Vie
tnam
)
Gol
d Oil
From 28/04/2017 to 31/05/2017 From 31/12/2016 to 31/05/2017

Rong Viet Securities Corporation – Investment Strategy Report June 2017 6
economy of Korea and can improve the diplomatic relation between North and South Korea, which has gone to the worst since 1950.
Oil price saw strong volatility in May. Oil price surged prior to OPEC meeting then strongly decreased and moved sideways after. Traders showed their disappointment on the extension 9 months because they believed that OPEC could do better by expanding to another 12 months instead. Besides, Libyan output was recovering from a technical issue at an oilfield. The production can increase from 784,000 barrels/day to 800,000 barrels/day, above the highest output since Feb 2017. In conclusion, the OPEC meeting did not support oil price in May so it dropped more than 2%, adding to the YTD decline of 10%.
Rong Viet Securities Corporation – Investment Strategy Report June 2017 7
VIETNAM ECONOMY • Policy Makers Put Their Focuses on Growth - The Degree of Loosening Monetary Policy Has Increased • Credit Growth Trend is Not Sustainable • Reflation Turned into Disinflation • The New Resolution in Handling Bad Debts: The Next Chapter
At the onset of June, the Government has come up with a set of measures to promote economic growth, including both short-term and long-term solutions. In the short run, the resumption of the Formosa plant and the recovery of the agricultural sector are the two basis for better economic growth for the rest of the year. However, we think that there are lacks of reasons for growth in the industrial and construction sectors to achieve the Government’s target. From the view of RongViet Research, the new point in the credit growth target does not bring much optimism to promote economic growth because we think that credit growth in the recent time is not sustainable and preferential credits are going to sectors with unclear growth potential. In the long run, the Decree on handling of bad debts accompanying with a series of Law’s amendments will come into effect in early of July 2017 are expected to promote the process of dealing with bad debts, thereby promoting economic growth.
Finally, the sharp decline in the food price index has led us to change our view on inflation rate for the whole year. With overall inflation at 4%, especially core inflation at 2%, the Government may be more aggressive in loosening monetary policy. However, the easing monetary policy and the effective capital inflows are two completely different things.
Policy Makers Put Their Focuses on Growth - The Degree of Loosening Monetary Policy Has Increased
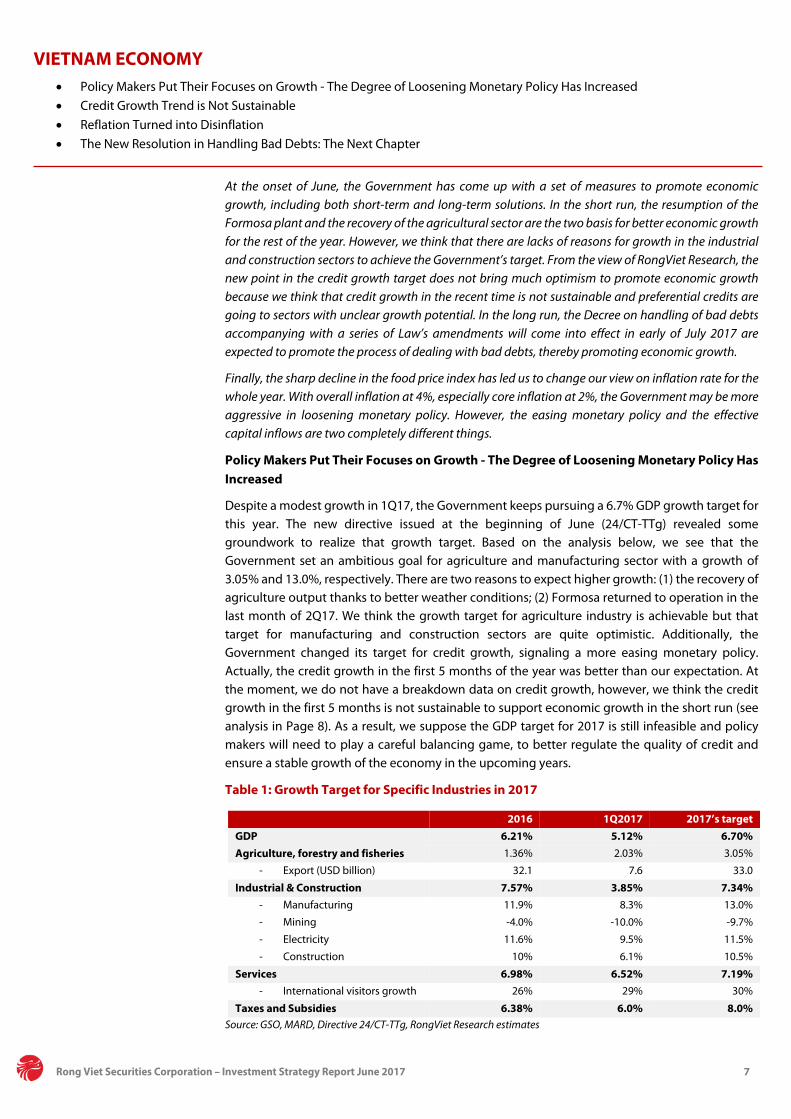
Despite a modest growth in 1Q17, the Government keeps pursuing a 6.7% GDP growth target for this year. The new directive issued at the beginning of June (24/CT-TTg) revealed some groundwork to realize that growth target. Based on the analysis below, we see that the Government set an ambitious goal for agriculture and manufacturing sector with a growth of 3.05% and 13.0%, respectively. There are two reasons to expect higher growth: (1) the recovery of agriculture output thanks to better weather conditions; (2) Formosa returned to operation in the last month of 2Q17. We think the growth target for agriculture industry is achievable but that target for manufacturing and construction sectors are quite optimistic. Additionally, the Government changed its target for credit growth, signaling a more easing monetary policy. Actually, the credit growth in the first 5 months of the year was better than our expectation. At the moment, we do not have a breakdown data on credit growth, however, we think the credit growth in the first 5 months is not sustainable to support economic growth in the short run (see analysis in Page 8). As a result, we suppose the GDP target for 2017 is still infeasible and policy makers will need to play a careful balancing game, to better regulate the quality of credit and ensure a stable growth of the economy in the upcoming years.
Table 1: Growth Target for Specific Industries in 2017
2016 1Q2017 2017’s target GDP 6.21% 5.12% 6.70% Agriculture, forestry and fisheries 1.36% 2.03% 3.05%
- Export (USD billion) 32.1 7.6 33.0
Industrial & Construction 7.57% 3.85% 7.34% - Manufacturing 11.9% 8.3% 13.0%
- Mining -4.0% -10.0% -9.7%
- Electricity 11.6% 9.5% 11.5%
- Construction 10% 6.1% 10.5%
Services 6.98% 6.52% 7.19% - International visitors growth 26% 29% 30%
Taxes and Subsidies 6.38% 6.0% 8.0% Source: GSO, MARD, Directive 24/CT-TTg, RongViet Research estimates

Rong Viet Securities Corporation – Investment Strategy Report June 2017 8
Table 2: RongViet Analysis on The Feasibility of GDP Growth’s Target
Situation in the first 5 months of 2017 Solutions RongViet’s comments
Agriculture
- Winter-spring paddy: unchanged compared to the same period of last year, rice yield declined slightly.
- Summer-autumn paddy: there was a strong recovery in planting at Mekong River Delta.
- There was a decline in pig breeding industry.
- Encourage hi-tech agriculture, complete supply chain.
- Apply many measures to curb the pig oversupply.
- Provide low-interest rates credit package for farmers.
- Push the export of agriculture products to China.
There was a slight recovery in agriculture sector in the first quarter of 2017, we also expect output in summer-autumn paddy will support the continuous recovery.
There was also better growth in the forestry and fisheries industry in the first 5 months of the year.
Based on the latest data, we think a 3.05% growth for agriculture sector is achievable.
Forestry
- The area of concentrated forestation was up 5.8% YoY.
Fisheries
- Aquaculture output increased by 3.7% YoY, better than the same period last year.
- Focus on the US market in exporting fishery.
Manufacturing
- Manufacturing sector grew by 9.7% YoY in May, improved from a 9.3% increase in April, 2017.
- PMI declined to 51.6 in May, the business sentiment was weaker.
- Implemented FDI reached USD6.15 bn, increased by 6% YoY.
- Provide favorable lending rates for manufacturing sector.
- Formosa is back into operation in June 2017.
We see there are lacks of conditions for manufacturing sector to achieve a 13% growth target because:
1. Industrial production improved in the second quarter but is still lower than the same period of last year.
2. Growth should be steadied due to weaker business confidence.
Such as, the return of Formosa is the main key to push growth of this sector. According to Ministry of Planning & Investment, the operation of Formosa will contribute 0.16% into GDP.
Mining
- In the first 4 months of the year, the crude oil volume achived 5.25 million tons, completed 37% of the yearly plan.
- Mining sector growth is -9.1% YoY in the first 5 months.
- Remove difficulties for minerals inventories.
- Adjust the plan for exploitating crude oil in 2017.
Even raising the volume of crude oil exploitation, 2017’s target for mining sector is still negative.
Based on the current stituation of oil market as well as oil operators in Vietnam, we think the Government will not put efforts to push growth in this sector.
Electricity
- Electricity production grew by 10.4% YoY in the first 5 months.
- Complete the solution for electricity prices in 2017.
We think the target for electricity production is feasible thanks to the positive growth in manufacturing sector and strong demand in residential area.
Construction

Rong Viet Securities Corporation – Investment Strategy Report June 2017 9
- Construction sector witnessed a sharp decline in growth in the first quarter of this year.
- Public investment increased slowly because of the delay in capital disbursement.
- Investment/GDP was only 32% in 1Q17.
- Push the pace of disbursing public investment capital in the second half of the year.
- Investment/GDP: 34-45%.
The real estate sector remains buoyant this year but we think it is challenging to gain higher growth.
The directive 24 is not supposed to solve the problems in public investment (high public debts and narrowed budget revenue).
Services
- Retail sector remains strong in the first quarter while there are better growth in real estate and banking sector.
- In the first 5 months, retail sales increased by 7.8% YoY (excluding price factors).
- New decree on bad debt resolutions.
- Revised the credit growth target to more than 18%.
Strong growth momentum in retail sector as well as financial sector are the key factors supporting a 7.2% growth target for services industry.
Source: GSO, RongViet Research
Credit Growth Trend is Not Sustainable
According to the SBV, credit growth of banking system reached 6.53% as of 25/05/2017, higher than the growth of 5% in the same period of last year. This growth is seen as the highest growth during 8 years period and many investors look at this data and hope for better GDP growth. However, in our opinion, there are a lot of concerns in credit growth in the first 5 months. Data on a breakdown of total credit growth are not available, so we can not provide a clear conclusion on credit growth trend. However, we think there are 3 main points that investors should pay attention to:
1. Taking HCMC market as an example, we see short-term credit increased significantly in the first 5 months of 2017. At the end of May 2017, total credit in HCMC increased by 8.3% compared to the end of 2016. Data showed that short-term credit grew 12.99% YTD, performing much better than medium and long-term credit growth (only 4.72% YTD). The concentration on providing short-term loans could be seen as a consequence of Circular 06’s impact (reducing the maximum ratio of short-term funds used for medium and long-term loans). In our view, the economy needs both short-term and long-term credit, however, we see long-term credit should be a key driver to support economic growth.
2. The return of liquidity surplus in banking system. In May, the SBV injected VND21,459 billion via OMO channel. Meanwhile, the matured amount was VND51,145 billion. As a result, the SBV made a net cash withdrawal of VND29,000 billion via OMO channel in the last month. Compared to April 2017, the open market operations were less active, in addition, the continuous withdrawal indicated the return of liquidity surplus in banking system. This movement was paralleled by a sharp fall in intebank interest rates. Interbank interest rates for short terms period (overnight, 1-week and 2-week) have tumbled since early of May 2017. Specifically, the overnight, 1-week and 2 week rates respectively fell 2.58%, 2.41% and 1.89% to 1.8%/year, 2.3%/year and 2.88%/year. In conjunction with the high winning ratio in primary bond market, we see these movements as a leading indicator for a slowdown in credit growth in the upcoming months.
3. A strong motivation of the Government to provide favorable credits in order to support sectors with unclear growth potentials. At the beginning of April 2017, the SBV issued detailed instructions for borrowing the VND100,000 billion low-interest credit package for hi-tech agriculture investment. Currently, there is an increasing wave of investment into hi-tech agriculture in Vietnam. However, besides caring about this sector is going to enjoy cheaper capital and preferential policies, we think the regulation on lending process plus the efficiency of hi-tech agriculture products’ projects are questionable. In a recent crisis of pig farmers, the Government has asked the central bank to extend loan repayments and provide low-interest rate loans for farmers and companies involved in the pork trade. Based on this

Rong Viet Securities Corporation – Investment Strategy Report June 2017 10
example, we think the Government has not approached policies to solve the root of the problems in agriculture industry. Lacking of long-term vision to support economic growth, we are afraid that short-term gains might trigger long-term pains in banking system.
Figure 8: Overnight Interest Rate (%) Figure 9: Open Market Operation (VND billion)
Source: Bloomberg Source: Bloomberg
Reflation Turned into Disinflation
May inflation data showed that CPI inflation dropped into negative territory for the first time in 20 months. Headline CPI in May 2017 decreased by 0.53% compared to previous month. This drop is due to the decline in pork and chicken prices, causing a decrease of 2.27% MoM in foodstuff prices index. Indeed, foodstuff prices index has declined in a 6-month row, the longest string since 2012. On a year over year basis, food prices index had a negative growth of 2.34%, completely contrary to our expectation in the beginning of the year. For the second half of this year, healthcare service providers in 29 provinces and Hanoi will apply new hospital fees for more than 1,900 medical services to patients without health insurance in August, while 14 other provinces and HCMC in October, and the remaining 18 localities in December. At the end of May 2017, healthcare prices index increased 16.83% compared to December 2016. With the above roadmap of applying higher healthcare fees, the contribution of healthcare prices index into 2017 CPI is still in line with our expectation. Besides, it is worthy to note that in recent the permanent meeting, the Government has instructed not to raise electricity prices to control inflation as well as support economic growth. As a result, our projection for headline CPI is adjusted to 4% in 2017, meaning that the Government could achieve the target for CPI this year.
Figure 10: CPI breakdown by sector (compared to December 2016)
Source: GSO
0
1
2
3
4
5
6
01/1
7
01/1
7
01/1
7
02/1
7
02/1
7
03/1
7
03/1
7
04/1
7
04/1
7
05/1
7
05/1
7
-150,000
-100,000
-50,000
0
50,000
100,000
150,000
200,000
01/2017 02/2017 03/2017 04/2017 05/2017
Injection Withdrawal Net injection/withdrawal
16.8%
2.4% 1.6% 1.3% 0.9% 0.9% 0.6% 0.5% 0.1%
-0.3%-3.1%
Hea
lthca
re
Tran
spor
t
Cons
truc
tion
Educ
atio
n
Oth
er g
oods
& s
ervi
ces
Beve
rage
Cultu
ral a
nd R
ecre
atio
n
Hou
seho
ld a
pplia
ncie
s
Text
ile
Post
al s
ervi
ces
Food
& F
oods
tuff

Rong Viet Securities Corporation – Investment Strategy Report June 2017 11
The New Resolution in Handling Bad Debts: The Next Chapter
By the end of May 2017, the National Assembly passed a resolution on handling bad debts. There are 3 key points in this resolution, including:
1. Allowing VAMC to buy off-balance sheet bad debts and to sell bad debts that VAMC bought with special bonds at market prices (lower than book value is acceptable). This opened the next step for both banks and VAMC after making provision for bad debts and buying debts via special bonds. In addition, bad debt buyers may also include organizations who have no debt purchasing function.
2. Remove the knots in the land law regarding to the right to seize collateral assets. Specifically, the party who owns collateral assets must be obligated to hand over the property together with all necessary papers and legal documents of the bad debt to the credit institutions as agreed in the contract and the law relating collateral assets. This regulation helps banks to shorten their collecting time on collateral assets.
3. The resolution extends the record period for unrecognized interest of bad debts and unsettled assets to not more than 10 years. This will reduce the pressure on financial statements of banks suffering from irrecoverable debts in the short term.
The above resolution will come into effect from 01/07/2017 together with guidelines on appraising the value of bad debts and collateral assets added in the Property Auction Law passed by the National Assembly at the end 2016. This move is expected to be the next step in the bad debt handling process and the beginning of a real market for transacting bad debts. By the end of February 2017, the bad debt ratio in the banking system was 2.56%. If including the outstanding debts that VAMC has not handled yet, the bad debt ratio is estimated at 6.7%. According to the SBV, if including potential bad debts, the NPL ratio is quite high ~10.08%. Among the amount of VND284,000 billion that VAMC bought via special bonds, only VND53,236 billion was handled, accounting for 19% of the total purchased debts. In particular, the handled bad debts which are treated through selling collateral assets measures was VND17,100 billion, accounting for 2.8% of total handled bad debts. Thus, accelerating the process of handling bad debts has become a critical condition for lower lending rates. We also believe that the easing monetary will take full effects to promote economic growth when "blood clots" named bad debts is eliminated.
Figure 11: The Process of Handling Bad Debts (Unit: VND bn)
Source: SBV, RongViet Research
74,680
284,206
87,980
143,550
186,890
118,490
327,384
0
100
200
300
400
500
600
700
2012 2013 2014 2015 2016 Total Handled byVAMC
VAMC hasn'tsolved
NPL inbanking's BS
Handled by banks
VAMC purchased

Rong Viet Securities Corporation – Investment Strategy Report June 2017 12
VIETNAM STOCK MARKET MAY: NEW MILESTONES ACHIEVED
The market regained all points lost in April, and even achieved new milestones such as 2017’s new record gain in one session and session with record liquidity of nearly VND6,000 billion. The VN-Index hovered around 736-748 (highest level since 2009) and ended the month at 737.82 points (+2.8%), while the HNX-Index also had an impressive gain of 5%. Accordingly, the market had increased in May for the last three years, suggesting that the saying "Sell in May" seems does not apply for the Vietnam market.
Figure 12: VN-Index movement in May Figure 13: HNX-Index movement in May
Source: RongViet Research Source: RongViet Research
The breakthrough of the VN-Index is attributed to PLX, banking and brokerage stocks. PLX received great appreciation from the market and up nearly 30% in one month thanks to its leading position in petroleum transportation and distribution networks. Meanwhile, supporting information such as Decree 61 and the Draft on NPL solutions continue to be the driving force for the banking sector.
Other sectors also performed well in particular sessions, namely textile stocks with the expectation of the TPP’s revival, and fertilizer stocks supported by investigative measures. However, the increase rate of these stocks is no matched to that of penny stocks such as QCG, NVT or SGT. The reasons for their rally are quite diverse: from project transfer (QCG) to business restructuring (NVT) to earnings beating consensus (SGT). Due to the surge in prices, these stocks also experienced sharp declines in some sessions, and thus were not intended for risk averse investors.
Top 10 gainers on HSX in May Sector Gain
QCG Real Estate 161.7%
NVT Real Estate 107.8%
SGT Technology 98.0%
MCG Construction & Material 95.4%
DTA Real Estate 79.5%
QBS Chemical 54.1%
TNT Basic Resources 53.2%
CLG Real Estate 40.7%
IDI F&B 39.5%
ANV F&B 39.0%
The liquidity reached a new level. There was no large-scale reviews from the ETF funds this May, but the market liquidity still increased sharply with the average value of more than VND4,400 billion per session. Compared to April, the average trading value of large, mid and small caps
690
710
730
750
0
50
100
150
200
250
300
27/02 13/03 27/03 11/04 25/04 11/05 25/05
Trading Volume (mil. shares) VNINdex (right axis)
79
83
87
91
95
0
20
40
60
80
100
27/02 13/03 27/03 11/04 25/04 11/05 25/05
Trading Volume (mil. shares) HNXIndex (right axis)

Rong Viet Securities Corporation – Investment Strategy Report June 2017 13
increased by 28%, 40% and 60%, respectively. We believe that the ample liquidity from banking system along with capital from foreign investors are the main reasons for the strong inflows.
Figure 14: Total value in terms of marching-order on HSX Figure 15: Total value in terms of marching-order by small, mid and large-caps
Source: FiinPro Source: FiinPro
Prior to May, many investors missed the uptrend as it mainly came from the increase of banking sectors. After that, investors seemed to be afraid of the new peak of the market and, consequently, sought opportunities from mid and small caps. This behavior could explain the outperformance of the VN-Mid (+6%) and VN-Sml (+5%) compared to the VN-Index (+3%) this month. While stocks in the VN-Mid basket are supported by excellent Q1 business results, the VN-Sml's upward momentum comes from the rise of specific stocks like CTI, TCM, RAL, HAX and TDH.
Figure 16: Relative performance of main indices
Source: FiinPro
We find that there was also differentiation among mid and small-cap stocks. There was significant increase in liquidity of Chemical (+156%), Finance Services (+106%), Construction and Material (+71%), Utilities (+615) and Household (+59%) stocks. For these stocks, it seems easy to create “a game” to attract investors. Some typical examples include HCM, which raised foreign ownership room to 100% so that it could be added to ETFs’ portfolio, BHS and SBT with the story of M&A, and real estate stocks such as QCG with an extraordinary profit from asset liquidation or DIG with the story of state’s divestment, and so on. Overall, large-cap stocks like banking stocks, VNM and PLX led the market, but mid-cap and small-caps with their own story were main source of profits for investors this May.
0
1,000
2,000
3,000
4,000
5,000
6,000
7,000
01/03/2017 02/21/2017 04/04/2017 05/19/2017
January Average February AverageMarch Average April AverageMay Average
0
1,000
2,000
3,000
4,000
5,000
6,000
7,000
01/03/2017 02/21/2017 04/04/2017 05/19/2017
Large Caps Middle Caps Small Caps
95
100
105
110
115
03/31/2017
VN-Index VN-30 VNMid VN-Sml

Rong Viet Securities Corporation – Investment Strategy Report June 2017 14
Foreign Investors Trading
Figure 17: Net trading value of foreign investors
Source: RongViet Research Foreign investors net bought for the fifth month. Total value on both bourses was VND1,178 billion. The highest value fell in the week from 22-26/05 when foreigners net bought VND607 billion, accounting for more than 50% of the whole month amount. Oil & gas shocked the market players due to its second rank in the top buying list thanks to VND639 billion net buy from PLX. The company successfully sold 20 million treasury shares to increase its free-float to 5.7% As it is the 7th largest stock in term of market cap, PLX could be the next nominee for the Q3/2017 ETFs’ reconstitution because for this Q2 it still misses the requirement on liquidity. The real estate sector, as usual, was on the top of net selling list with VIC (-VND290 billion) and QCG (-VND267 billion) dominating. It seems like VinaCapital just cut loss after 7 years investing in QCG. 3 funds VOF Investment Limited, Asia Investment & Finance Limited and VOF PE Holdings 5 Limited sold 29.42 million shares of QCG on 03/05/2017.
To sum up, the 5-month accumulated foreign trading value officially breached VND7,000 billion, more precisely VND7,023 billion. This figure is very closed to the height VND7,266 billion after 7 months in 2014. We think the figure can be far higher and possibly break the record VND8,000 billion of 7 months in 2008. We think this is achievable because liquidity is still increasing gradually and the story of market upgraded to emerging market classification will definitely attract more off-shore investors.
In May, Db x-trackers FTSE Vietnam ETF and VanEck Vectors Vietnam ETF will reconstitute their portfolios. Db x-trackers FTSE Vietnam ETF officially announced the results, which showed that they would delete NT2, BVH, HAG and add NVL, STB. As our estimation, this ETF will sell 2.9 million shares of NT2, 1.6 million shares of BVH and 10.2 million shares of HAG. On the contrary, it will buy 15.7 million shares of STB and 8.7 million shares of NVL. VanEck Vectors Vietnam ETF will not change much as it won’t delete or add any stocks for this quarter.
0
1000
2000
3000
4000
5000
6000
7000
8000
-400
-300
-200
-100
0
100
200
300
400
500
600
03/01 21/03 02-Jun
Net bought/sold Accumulated Value

Rong Viet Securities Corporation – Investment Strategy Report June 2017 15
Table 3: Net buying/selling value of foreign investors classifying by sectors in May
Sectors HSX HNX
Net volume Net value (bn VND)
Net volume Net value (bn VND)
Oil & gas 7,822,620 609.46 -1,294,407 -25.70
Chemicals -5,107,540 -12.95 39,172 1.36
Basic resource 3,636,600 122.98 -393,690 -1.53 Construction & building materials 3,080,180 239.10 378,748 22.69
Industrial goods & services 3,259,850 52.97 -60,101 5.60
Automobiles & parts 219,410 -31.26 -174,923 -1.86
Food & beverage 4,282,290 558.55 221,859 0.19
Personal and household goods -1,743,030 -25.60 284,139 -3.39
Healthcare -271,470 -14.97 85,005 6.53
Retail -1,797,040 -62.74 50,200 0.69
Communication -680 -0.01 166,400 3.30
Travel & leisure 125,600 5.89 492,729 20.75
Utilities 493,450 48.00 -1,115,943 -20.51
Banks 5,436,426 132.70 1,290,418 7.96
Insurance -727,120 -40.26 -148,980 -3.93
Real estate -23,414,887 -501.18 822,625 20.63
Financial services -12,887,786 6.27 4,767,866 65.67
Technology -243,980 -0.75 -510,002 -6.66 Source: FiinPro, RongViet Research
HSX
Tickers Net buying value Tickers Net selling value
VIC 693.73 VIC -289.85
QCG 604.77 QCG -267.33
BMP 138.28 BMP -137.47
DCM 117.09 DCM -98.61
FIT 113.16 FIT -87.24
PVD 107.95 PVD -84.27
NT2 92.52 NT2 -80.42
HT1 83.45 HT1 -69.82
DRC 82.54 DRC -60.34
KDC 73.83 KDC -56.44
SBV 66.13 SBV -55.70
BVH 63.41 BVH -39.97
DHG 61.21 DHG -37.78
GTN 55.63 GTN -34.20
CTI 45.41 CTI -33.56
SSI 44.84 SSI -31.41
HSG 40.53 HSG -28.59
VIC 693.73 VIC -289.85
QCG 604.77 QCG -267.33
BMP 138.28 BMP -137.47
Source: RongViet Research
HNX
Tickers Net buying value Tickers Net selling value
SHS 23.68 PVS -29.08
VND 22.29 PGS -20.19
MAS 19.87 VNT -7.84
HUT 19.05 DBC -7.35
VGC 12.75 CKV -6.49
CEO 11.41 ICG -6.19
IVS 9.65 SIC -4.25
SHB 9.42 NET -4.25
BVS 7.96 VNR -2.63
INN 7.00 VGS -2.38
IDV 6.79 NDN -2.31
CAN 5.24 DNP -1.95
DHT 4.34 VKC -1.86
API 3.94 SDT -1.78
PVC 3.73 NDF -1.70
CVT 2.88 HOM -1.41
CTS 2.76 ACB -1.36
VSA 2.48 PVI -1.32
LHC 2.41 KHB -1.30
HKB 2.29 PLC -1.27
Source: RongViet Research

Rong Viet Securities Corporation – Investment Strategy Report June 2017 16
JUNE STOCK MARKET OUTLOOKS After a mild difficulty in April, VNIndex successfully surpassed 740 points in May. Liquidity surprised us with total trading value of VND5,042 bil for both stock exchanges, 37% higher than the average of the first 5 month in 2017 and doubled the average amount of 2016. During that period, foreign investors continuously accumulated with the total net buying value of VND 7,000 bil, the highest level since 2008.
For the remaining months of 2017, we believe that stock market sentiment will be positive and demand remains still high from not only the domestic but also foreign investors. The arguments are as followed:
o The international investors continue to highly rate Vietnam’s business environment following the Government commitments to stabilize the economy. Regarding of recent review, Fitch made upward adjustment to Vietnam’s credit rating from “stable” to “positive”. In addition, the CDS 5-year index of Vietnam has been on the downward trend to the lowest level set in 2017. The lower index is considered as the less risky of Vietnam’s economy.
o The Government released the Instruction no. 24/CT-TTg, which requires the related ministries to have specific solutions for 2017’s GDP growth target of 6.7%. In addition to this, the credit growth for 2017 is also required to achieve more than 18% YoY threshold to support this target.
o Low inflation in May 2017 will support the Government in an effort to keep macro indicators such as lending rate and FX variation to as stable as they committed. In fact, after a temporary increase in the first months, interest rate has been cool down in recent weeks, proving through the decrease of average overnight lending rate in the interbank market to 1.8%.
o Although VNIndex has climbed to the highest level for years, the PE has actually been stable around 16x. It might indicate that relative valuation of Vietnam stock exchanges is still more attractive than other markets such as Arab Saudi, Malaysia, Indonesia and Philippines. Moreover, as our observation, VNIndex has a negative correlation with CDS Index in past years. Assuming that the relationship will be true in upcoming period, the probability that VNIndex can reach the higher peak by the end 2017 is quite high.
Figure 18: Relative Valuation Compared to Other Regional and Frontier Markets
Source: Bloomberg
Indonesia
ThailandVietnamSingapore
Arab Saudi
Sri Lanka
Malaysia
Philippines
0
5
10
15
20
25
30
0.5 1 1.5 2 2.5 3
PE
PB

Rong Viet Securities Corporation – Investment Strategy Report June 2017 17
Figure 19: The Lower CDS the Higher VNIndex
Source: Bloomberg
VNIndex fluctuated quite narrowly around 740 points after successfully surpassing 732. The pressure to reduce margin on some “hot” stocks may be a reason for investors to be cautious again. Notwithstanding, the gap in frontier basket, couple with Government’s commitment to stabilize macro factors will keep the money in the markets. For June 2017, we expect VNIndex to hover between 730 – 760 with the total trading volume to be around VND4,000 bil.
Figure 20: VNIndex PE 2010 – 2017 YTD
Source: Bloomberg
8
9
10
11
12
13
14
15
16
17
2010 2011 2012 2013 2014 2015 2016 2017 YTD

Rong Viet Securities Corporation – Investment Strategy Report June 2017 18
Table 4: Key sectors performance
No Name % 1M Price Change
% 3M Price Change
Market Cap (VND Billion)
ROA (%) ROE (%) Basic P/E P/B
1 Retail 11.7% 10.6% 32,824 14.1% 29.1% 15.5 3.0
2 Insurance 0.0% 0.5% 59,913 3.4% 12.8% 21.8 2.4
3 Real Estate 1.7% 0.2% 233,131 2.5% 8.4% 20.7 3.0
4 Technology 8.2% 8.3% 29,408 9.9% 14.2% 11.7 2.0
5 Oil & Gas 23.0% 0.2% 85,261 4.6% 19.2% 14.3 2.9
6 Financial Services 15.9% 19.4% 33,490 2.7% 6.3% 12.2 1.3
7 Utilities 1.7% -4.8% 146,805 10.6% 25.0% 12.8 2.3
8 Travel & Leisure 0.9% 13.0% 8,014 3.1% 8.5% 11.7 2.3
9 Industrial Goods & Services 3.2% 2.9% 71,704 0.0% 0.0% 10.9 1.7
10 Personal & Household Goods 2.7% 7.6% 27,940 9.9% 27.9% 13.4 3.4
11 Chemicals 5.4% 4.2% 42,485 7.3% 14.3% 9.5 1.3
12 Banks 7.4% 5.5% 367,178 0.8% 13.2% 14.9 1.7
13 Automobiles & Parts 3.8% 8.8% 18,232 11.6% 16.3% 12.6 1.7
14 Basic Resources 5.8% 13.9% 73,117 12.9% 42.4% 6.2 1.5
15 Food & Beverage -0.3% 2.6% 352,716 10.1% 27.3% 19.1 5.9
16 Media 1.4% 11.1% 2,362 6.2% 11.2% 16.4 1.8
17 Construction & Materials -4.4% -1.1% 173,240 0.0% 0.0% 15.7 4.2
18 Health Care 10.7% 25.6% 31,012 8.1% 24.4% 18.4 3.0
Rong Viet Securities Corporation – Investment Strategy Report June 2017 19
Ticker Exchange Target price
(VND)
Price @ June 5th
(VND)
Upside (%)
Rating Time horizon
2016 2017F 2018F PER
Trailing (x)
PER 2017F
(x)
PBR Cur. (x)
Div Yield
(x)
+/- Price
1y (%)
3M avg. daily vol.
(‘1000 shares)
3M avg. daily turnover
(USD thousand)
Market cap
(USD mn)
Foreign remaining
room (%)
+/- Rev. (%)
+/- NPAT
(%)
+/- Rev. (%)
+/- NPAT
(%)
+/- Rev. (%)
+/- NPAT
(%)
ACB HNX 24,500 25,000 -2.0% Neutral Long-term 21.6 28.9 11.4 21.9 27.9 46.2 16.5 16.8 1.7 0.0 50.3 4,003,412 4,103 1,084 -
ACV UPCOM 67,000 49,000 36.7% Buy Long-term 21.1 198.2 16.2 -20.1 17.1 26.3 30.9 22.3 4.3 1.0 0.0 223,754 499 4,677 45.6
BFC HSX 41,000 41,000 0.0% Neutral Long-term -1.6 21.0 17.8 18.4 15.8 10.1 7.8 7.9 2.5 7.3 78.3 344,500 558 103 29.9
BMP HSX 208,400 183,000 13.9% Neutral Long-term 18.5 20.9 11.2 7.9 13.1 10.0 15.9 13.7 3.5 4.2 35.0 97,451 815 366 1.5
CHP HSX 25,000 22,200 12.6% Accumulate Intermediate-term -10.9 -21.5 28.6 53.5 -14.5 -22.8 7.2 7.8 1.5 3.2 0.0 153,750 152 123 45.7
CTD HSX 237,700 213,000 11.6% Neutral Long-term 52.0 113.5 30.4 22.2 9.9 9.8 9.9 10.1 2.5 2.6 62.3 185,330 1,615 721 4.6
CTG HSX 21,000 18,900 11.1% Neutral Long-term 16.3 20.0 8.2 17.3 7.4 14.5 10.2 8.8 1.2 3.7 15.2 1,275,451 1,026 3,094 -
CTI HSX 31,500 32,700 -3.7% Neutral Long-term 23.8 58.4 22.3 12.4 12.8 22.3 11.4 17.9 2.1 4.4 41.1 417,256 531 62 22.9
DHG HSX 83,500 112,400 -25.7% Sell Long-term 4.9 20.6 12.4 10.0 9.7 9.2 20.1 14.3 3.2 1.3 121.5 136,885 821 646 -
DNP HNX 29,600 26,700 10.9% Neutral Long-term 60.9 91.6 34.7 50.6 17.6 10.8 9.7 6.2 1.8 0.0 26.0 57,684 67 35 45.7
DPM HSX 25,000 22,450 11.4% Neutral Long-term -18.8 -23.3 16.4 4.9 20.5 -3.8 9.3 8.6 1.1 4.5 -10.4 949,061 999 386 29.5
DRC HSX 35,900 30,650 17.1% Accumulate Long-term 1.3 -4.8 17.4 -1.3 14.4 7.9 9.6 10.1 2.2 7.3 -10.2 369,413 499 160 20.2
FPT HSX 53,200 42,100 26.4% Accumulate Long-term 4.1 3.1 21.7 21.0 13.2 46.7 10.8 7.3 2.2 2.4 25.2 965,567 1,993 983 -
HPG HSX 36,000 29,200 23.3% Accumulate Long-term 21.2 89.4 30.7 13.2 19.4 4.4 4.9 5.3 1.2 0.0 56.5 3,748,816 5,629 1,623 12.3
HSG HSX 29,500 32,400 -9.0% Reduce Intermediate-term 16.5 145.3 31.7 -0.5 17.6 22.2 5.9 3.9 2.2 1.5 65.9 1,453,368 3,131 458 19.5
HT1 HSX 21,200 21,300 -0.5% Neutral Long-term 8.3 9.5 6.6 13.7 5.2 6.7 10.3 10.3 1.5 0.0 -11.6 420,864 407 357 40.6
IMP HSX 50,000 57,200 -12.6% Reduce Long-term 4.8 8.9 24.6 33.5 18.4 17.8 18.2 18.6 1.6 3.7 61.1 54,366 146 108 -
MBB HSX 19,400 19,450 -0.3% Neutral Long-term 12.4 16.7 16.5 16.7 7.4 18.4 11.0 10.7 1.3 1.5 39.2 1,730,185 1,252 1,465 -
MWG HSX 67,250 97,000 -30.7% Sell Intermediate-term 76.7 47.2 63.2 41.4 35.9 16.5 17.1 8.0 3.4 0.8 137.1 231,062 1,584 1,312 -
NKG HSX 30,740 31,700 -3.0% Neutral Intermediate-term 55.4 310.7 62.0 29.0 14.6 10.4 4.7 3.4 1.2 0.0 184.7 408,514 709 138 18.3
NNC HSX 90,100 80,000 12.6% Accumulate Intermediate-term 14.9 49.8 23.5 25.7 8.1 3.4 7.2 7.7 3.0 4.1 58.9 24,724 83 58 28.1
NT2 HSX 31,900 27,600 15.6% Accumulate Long-term 18.6 -4.9 -13.2 -10.6 4.5 0.3 7.6 8.6 1.5 4.5 0.9 356,946 478 349 27.3
NTC UPCOM 73,800 43,100 71.2% Buy Long-term 17.8 121.4 21.6 -17.7 14.0 12.0 5.1 7.3 2.1 0.6 0.0 78,072 176 30 49.0
PAC HSX 38,800 42,700 -9.1% Neutral Long-term 9.4 107.5 16.2 -32.4 8.8 30.9 16.5 17.0 3.5 6.0 61.0 201,063 333 87 20.0
HIGHLIGHT STOCKS

Rong Viet Securities Corporation – Investment Strategy Report June 2017 20
Ticker Exchange Target price
(VND)
Price @ June 5th
(VND)
Upside (%) Rating Time horizon
2016 2017F 2018F PER
Trailing (x)
PER 2017F
(x)
PBR Cur. (x)
Div Yield
(x)
+/- Price
1y (%)
3M avg. daily vol.
(‘1000 shares)
3M avg. daily turnover
(USD thousand)
Market cap
(USD mn)
Foreign remaining
room (%)
+/- Rev. (%)
+/- NPAT
(%)
+/- Rev. (%)
+/- NPAT
(%)
+/- Rev. (%)
+/- NPAT
(%)
PC1 HSX 37,000 33,000 12.1% Neutral Long-term -3.0 24.1 13.6 5.8 46.1 76.2 11.5 10.8 1.6 0.0 0.0 209,473 364 139 21.8
PGI HSX 24,900 21,800 14.2% Neutral Long-term 9.0 5.2 10.3 55.5 13.2 -13.5 13.5 9.8 1.8 1.8 32.7 185,554 185 68 47.9
PGS HNX 21,900 19,300 13.5% Accumulate Intermediate-term -16.5 206.7 36.4 -63.7 6.8 6.5 9.9 7.8 1.0 2.3 17.7 352,115 281 42 35.8
PHR HSX 30,600 31,900 -4.1% Neutral Intermediate-term -4.0 3.9 61.0 48.6 20.0 11.0 8.0 9.9 1.1 0.6 85.0 638,605 808 110 43.8
PNJ HSX 111,000 97,000 14.4% Neutral Long-term 11.1 496.3 33.1 56.7 21.8 26.3 16.6 14.8 5.5 0.2 66.7 260,398 1,030 419 -
PPC HSX 19,400 19,800 -2.0% Neutral Long-term -22.0 -2.2 17.7 33.0 1.8 -3.3 7.5 9.4 1.1 3.8 29.9 103,324 85 277 32.1
PTB HSX 128,700 136,000 -5.4% Reduce Intermediate-term 20.2 52.8 21.8 26.1 16.1 9.0 10.9 11.7 3.9 0.0 41.9 54,046 315 129 37.3
PVT HSX 15,400 13,700 12.4% Neutral Long-term 16.9 12.9 6.2 1.3 10.6 10.0 8.6 9.8 1.1 3.3 29.9 778,602 447 170 23.3
REE HSX 35,500 33,500 6.0% Neutral Long-term 38.4 28.2 23.1 19.0 6.4 13.7 7.7 8.8 1.5 1.5 71.3 1,485,968 1,888 457 -
SAB HSX 158,400 189,500 -16.4% Sell Long-term 12.6 31.3 11.2 4.2 12.9 4.2 26.1 27.7 9.7 1.1 0.0 74,408 648 5,343 39.2
SHP HSX 22,800 20,600 10.7% Accumulate Intermediate-term -13.7 -40.4 19.7 78.7 -0.3 1.0 13.8 11.1 1.7 7.8 17.2 13,015 11 85 45.1
SVC HSX 54,500 52,500 3.8% Neutral Long-term 38.0 18.4 11.2 20.4 -5.0 4.5 10.7 9.8 1.5 3.0 45.8 98,965 226 58 7.3
TCM HSX 25,300 32,800 -22.9% Sell Long-term 10.0 -25.6 6.2 55.6 1.9 7.4 11.5 10.7 1.7 1.5 26.9 812,351 895 71 -
TNG HNX 17,000 14,500 17.2% Accumulate Intermediate-term -1.9 13.9 17.0 16.5 10.5 11.1 6.0 6.0 0.9 0.0 -11.9 172,171 107 22 26.6
VCB HSX 41,700 36,700 13.6% Neutral Long-term 17.3 28.6 7.7 14.1 12.9 32.0 18.4 16.5 2.6 2.2 11.6 1,223,896 1,983 5,805 9.3
VFG HSX 90,700 71,100 27.6% Accumulate Long-term 13.4 5.2 9.6 16.2 6.1 7.6 9.3 8.5 1.6 1.4 12.2 8,818 29 57 27.7
VGC HNX 14,600 17,800 -18.0% Sell Long-term 4.1 56.4 7.9 17.3 13.6 9.1 9.0 9.5 1.3 3.9 0.0 378,006 259 240 39.9
VIT HNX 33,900 28,400 19.4% Accumulate Long-term 41.6 53.5 18.8 18.7 15.4 14.9 7.0 7.7 1.8 5.3 38.5 35,808 46 19 46.1
VJC HSX 121,000 131,000 -7.6% Neutral Long-term 38.6 113.3 41.7 24.9 22.0 25.2 15.2 13.6 8.0 1.1 0.0 492,510 2,787 1,797 5.6
VNM HSX 151,800 152,000 -0.1% Neutral Long-term 16.8 20.3 19.9 12.1 13.4 10.9 21.7 23.4 8.9 0.3 36.1 1,130,052 6,999 9,699 45.0
VNR HNX 27,300 25,000 9.2% Neutral Long-term -2.8 -1.2 18.2 9.7 4.3 6.8 13.1 12.5 1.2 3.4 49.3 82,949 92 144 19.3
VSC HSX 73,700 56,800 29.8% Accumulate Long-term 16.6 -10.0 18.2 23.8 6.0 9.6 10.4 9.2 1.9 6.2 6.8 119,587 306 114 -
ACB HNX 24,500 25,000 -2.0% Neutral Long-term 21.6 28.9 11.4 21.9 27.9 46.2 16.5 16.8 1.7 0.0 50.3 4,003,412 4,103 1,084 -
ACV UPCOM 67,000 49,000 36.7% Buy Long-term 21.1 198.2 16.2 -20.1 17.1 26.3 30.9 22.3 4.3 1.0 0.0 223,754 499 4,677 45.6
BFC HSX 41,000 41,000 0.0% Neutral Long-term -1.6 21.0 17.8 18.4 15.8 10.1 7.8 7.9 2.5 7.3 78.3 344,500 558 103 29.9

Rong Viet Securities Corporation – Investment Strategy Report June 2017 21
MACRO WATCH
Headline Inflation Turned to Negative Continuous Improving in Retail Sales
Source: GSO, RongViet Research Source: GSO, RongViet Research
PMI Declined Significantly Trade Growth Steadied
Source: GSO, RongViet Research Source: GSO, RongViet Research
Positive Improvement in Implemented Capital Wining Volume Increased
Source: FII, RongViet Research Source: VBMA, RongViet Research
0.0%
0.1%
0.2%
0.3%
0.4%
0.5%
0.6%
05/2
016
06/2
016
07/2
016
08/2
016
09/2
016
10/2
016
11/2
016
12/2
016
01/2
017
02/2
017
03/2
017
04/2
017
05/2
017
Headline inflation Core inflation
260000.0
280000.0
300000.0
320000.0
340000.0
0%
4%
8%
12%
05/2
016
06/2
016
07/2
016
08/2
016
09/2
016
10/2
016
11/2
016
12/2
016
01/2
017
02/2
017
03/2
017
04/2
017
05/2
017
Retail Sales (VND B) Growth (Ex inflation)
-2.0
.0
2.0
4.0
6.0
8.0
10.0
05/2
016
06/2
016
07/2
016
08/2
016
09/2
016
10/2
016
11/2
016
12/2
016
01/2
017
02/2
017
03/2
017
04/2
017
05/2
017
50
51
52
53
54
55
PMI IP (3m moving average)
-5%0%5%
10%15%20%25%30%35%
05/2
016
06/2
016
07/2
016
08/2
016
09/2
016
10/2
016
11/2
016
12/2
016
01/2
017
02/2
017
03/2
017
04/2
017
05/2
017
Export Import
0
1000
2000
3000
4000
05/2
016
06/2
016
07/2
016
08/2
016
09/2
016
10/2
016
11/2
016
12/2
016
01/2
017
02/2
017
03/2
017
04/2
017
05/2
017
Implemented capital Registered capital
0%
20%
40%
60%
80%
100%
0
10000
20000
30000
40000
50000
60000
02/2
016
03/2
016
04/2
016
05/2
016
06/2
016
07/2
016
08/2
016
09/2
016
10/2
016
11/2
016
12/2
016
01/2
017
02/2
017
03/2
017
04/2
007
05/2
007
Winning volume Offering volume
Winning/Offering Ratio

Rong Viet Securities Corporation – Investment Strategy Report June 2017 22
INDUSTRY INDEX
Level 1 industry movement Level 2 industry movement
Source: RongViet Research Source: RongViet Research
Industry PE comparison Industry PB comparison
Source: RongViet Research Source: RongViet Research
8%
-2%
23%
5%
11%
0%
7%6%
3% 2%
-5%
0%
5%
10%
15%
20%
25%
Tech
nolo
gy
Indu
stria
ls
Oil
& G
as
Cons
umer
Ser
vice
s
Hea
lth C
are
Cons
umer
Goo
ds
Bank
s
Basi
c M
ater
ials
Fina
ncia
ls
Util
ities
12%0%
2%8%
23%16%
2%1%
3%3%
5%7%
4%6%
0%1%
-4%11%
-10% 0% 10% 20% 30%
Retail
Insurance
Real Estate
Technology
Oil & Gas
Financial Services
Utilities
Travel & Leisure
Industrial Goods & Services
Personal & Household Goods
Chemicals
Banks
Automobiles & Parts
Basic Resources
Food & Beverage
Media
Construction & Materials
Health Care
11.7
14.3 14.3 14.9
18.4 18.2
14.9
7.4
20.1
12.8
16.9
11.9
Tech
nolo
gy
Indu
stria
ls
Oil
& G
as
Cons
umer
Serv
ices
Hea
lth C
are
Cons
umer
Goo
ds
Bank
s
Basi
c M
ater
ials
Fina
ncia
ls
Util
ities
HSX
HN
X
2.0
3.42.9 2.8 3.0
5.6
1.71.4
2.72.3
3.7
1.6
Tech
nolo
gy
Indu
stria
ls
Oil
& G
as
Cons
umer
Ser
vice
s
Hea
lth C
are
Cons
umer
Goo
ds
Bank
s
Basi
c M
ater
ials
Fina
ncia
ls
Util
ities
HSX
HN
X

Rong Viet Securities Corporation – Investment Strategy Report June 2017 23
DISCLAIMERS
This report is prepared in order to provide information and analysis to clients of Rong Viet Securities only. It is and should not be construed as an offer to sell or a solicitation of an offer to purchase any securities. No consideration has been given to the investment objectives, financial situation or particular needs of any specific. The readers should be aware that Rong Viet Securities may have a conflict of interest that can compromise the objectivity this research. This research is to be viewed by investors only as a source of reference when making investments. Investors are to take full responsibility of their own decisions. VDSC shall not be liable for any loss, damages, cost or expense incurring or arising from the use or reliance, either full or partial, of the information in this publication.
The opinions expressed in this research report reflect only the analyst's personal views of the subject securities or matters; and no part of the research analyst's compensation was, is, or will be, directly or indirectly, related to the specific recommendations or opinions expressed in the report.
The information herein is compiled by or arrived at Rong Viet Securities from sources believed to be reliable. We, however, do not guarantee its accuracy or completeness. Opinions, estimations and projections expressed in this report are deemed valid up to the date of publication of this report and can be subject to change without notice.
This research report is copyrighted by Rong Viet Securities. All rights reserved. Therefore, copy, reproduction, republish or redistribution by any person or party for any purpose is strictly prohibited without the written permission of VDSC.
IMPORTANT DISCLOSURES FOR U.S. PERSONS
This research report was prepared by Viet Dragon Securities Corp. (“VDSC”), a company authorized to engage in securities activities in Vietnam. VDSC is not a registered broker-dealer in the United States and, therefore, is not subject to U.S. rules regarding the preparation of research reports and the independence of research analysts. This research report is provided for distribution to “major U.S. institutional investors” in reliance on the exemption from registration provided by Rule 15a-6 of the U.S. Securities Exchange Act of 1934, as amended (the “Exchange Act”).
Any U.S. recipient of this research report wishing to effect any transaction to buy or sell securities or related financial instruments based on the information provided in this research report should do so only through Rosenblatt Securities Inc., 40 Wall Street 59th Floor, New York, NY 10005, a registered broker dealer in the United States. Under no circumstances should any recipient of this research report effect any transaction to buy or sell securities or related financial instruments through VDSC. Rosenblatt Securities Inc. accepts responsibility for the contents of this research report, subject to the terms set out below, to the extent that it is delivered to a U.S. person other than a major U.S. institutional investor.
The analyst whose name appears in this research report is not registered or qualified as a research analyst with the Financial Industry Regulatory Authority (“FINRA”) and may not be an associated person of Rosenblatt Securities Inc. and, therefore, may not be subject to applicable restrictions under FINRA Rules on communications with a subject company, public appearances and trading securities held by a research analyst account.
Ownership and Material Conflicts of Interest
Rosenblatt Securities Inc. or its affiliates does not ‘beneficially own,’ as determined in accordance with Section 13(d) of the Exchange Act, 1% or more of any of the equity securities mentioned in the report. Rosenblatt Securities Inc, its affiliates and/or their respective officers, directors or employees may have interests, or long or short positions, and may at any time make purchases or sales as a principal or agent of the securities referred to herein. Rosenblatt Securities Inc. is not aware of any material conflict of interest as of the date of this publication.
Compensation and Investment Banking Activities
Rosenblatt Securities Inc. or any affiliate has not managed or co-managed a public offering of securities for the subject company in the past 12 months, nor received compensation for investment banking services from the subject company in the past 12 months, neither does it or any affiliate expect to receive, or intends to seek compensation for investment banking services from the subject company in the next 3 months.
Additional Disclosures
This research report is for distribution only under such circumstances as may be permitted by applicable law. This research report has no regard to the specific investment objectives, financial situation or particular needs of any specific recipient, even if sent only to a single recipient. This research report is not guaranteed to be a complete statement or summary of any securities, markets, reports or developments referred to in this research report. Neither VDSC nor any of its directors, officers, employees or agents shall have any liability, however arising, for any error, inaccuracy or incompleteness of fact or opinion in this research report or lack of care in this research report’s preparation or publication, or any losses or damages which may arise from the use of this research report.

Rong Viet Securities Corporation – Investment Strategy Report June 2017 24
VDSC may rely on information barriers, such as “Chinese Walls” to control the flow of information within the areas, units, divisions, groups, or affiliates of VDSC.
Investing in any non-U.S. securities or related financial instruments (including ADRs) discussed in this research report may present certain risks. The securities of non-U.S. issuers may not be registered with, or be subject to the regulations of, the U.S. Securities and Exchange Commission. Information on such non-U.S. securities or related financial instruments may be limited. Foreign companies may not be subject to audit and reporting standards and regulatory requirements comparable to those in effect within the United States.
The value of any investment or income from any securities or related financial instruments discussed in this research report denominated in a currency other than U.S. dollars is subject to exchange rate fluctuations that may have a positive or adverse effect on the value of or income from such securities or related financial instruments.
Past performance is not necessarily a guide to future performance and no representation or warranty, express or implied, is made by VDSC with respect to future performance. Income from investments may fluctuate. The price or value of the investments to which this research report relates, either directly or indirectly, may fall or rise against the interest of investors. Any recommendation or opinion contained in this research report may become outdated as a consequence of changes in the environment in which the issuer of the securities under analysis operates, in addition to changes in the estimates and forecasts, assumptions and valuation methodology used herein.
No part of the content of this research report may be copied, forwarded or duplicated in any form or by any means without the prior.
Hanoi Branch
2C Thai Phien St., Hai Ba Trung Dist, Hanoi City
Tel: (84 4) 6288 2006
Fax: (84 4) 6288 2008
Can Tho Branch
95-97-99 Vo Van Tan – Ninh Kieu - Can Tho
Tel: (84 71) 381 7578
Fax: (84 71) 381 8387
Nha Trang Branch
50Bis Yersin St, Nha Trang
Tel: (84 58) 382 0006
Fax: (84 58) 382 0008
VIET DRAGON SECURITIES CORPORATION
Floor 1-2-3-4, Viet Dragon Tower,
141 Nguyen Du St. - Dist 1 – HCMC
Tel: (84 8) 6299 2006
Fax: (84 8) 6291 7986
Email: [email protected]
Website: www.vdsc.com.vn