Rong Viet Securities - Investment Strategy Report April 2017
31
Rong Viet Securities Corporation – Investment Strategy Report November 2016 Vietnam’s stock market experienced favorable performance during Q1 2017, with the majority of sectors delivering growth (except public utility and media). The excitement started with financial stocks, namely banks, followed by real estate and securities companies. In other sectors, agricultural and textile stocks, such as HNG, HAG, and TCM, also grew strongly due to commodity prices recovering from the bottom and export activity being positive for the most part. In April, we forecast that the market will have highs due to the interruption of the announcement of 2017 business plans and Q1 2017 business results. However, the profit taking pressure may become strong at the end of the month, when more official disclosure of information takes place. In fact, this trend has gradually been reflected in the beginning of this month. After the VN Index was able to successfully break 720, the consensus of large cap stocks was almost gone, as these stocks have been displaying mixed performance. The recent correction in oil prices will have a mixed impact on the macro picture of Vietnam. In particular, the mining sector may not be negative and affect GDP growth. In contrast, the fall in oil prices will partly curb inflation, easing the pressure on the monetary policy of the SBV. As noted in the investment strategy report in 2017, Rong Viet Research noted that exchange rate fluctuations and inflation may be the two most important risks for the overall picture of the stock market this year. Thus, once these two factors remain under control, we believe that monetary policy, a factor that has been shown to have an indirect impact on the performance of the stock market, will not be tightened in the present period. The information about 2016 audited financial statements, seasonal effects of the 2017 AGM and Q1 2017 business results of listed companies will continue to dominate the stock market in April. Given that the market may form a short-term peak after the rally experienced from the beginning of this month, we think that this will be a good time for investors to review and restructure their portfolio: profit-taking stocks that sharply grew and selectively accumulate stocks having bright prospect in the remaining time of 2017. Analysis and Investment Advisory Truc Doan – Head of Research [email protected] Tai Nguyen [email protected] Ha My Tran [email protected] Viet Dung Nguyen [email protected] Lam Nguyen [email protected] Thien Bui [email protected] Hieu Nguyen [email protected] Huong Pham [email protected] Please see penultimate page for additional important disclosure Viet Dragon Securities Corp. (“VDSC”) is a foreign broker-dealer unregistered in the USA. VDSC research is prepared by research analysts who are not registered in the USA. VDSC research is distributed in the USA pursuant to Rule 15a-6 of the Securities Exchange Act of 1934 solely by Rosenblatt Securities Inc, an SEC registered and FINRA- member broker-dealer. 620 650 680 710 740 0 100 200 300 26/12 10/01 24/01 14/02 28/02 14/03 28/03 Trading Volume (mil. shares) VNINdex (right axis) 71 75 79 83 87 91 95 0 20 40 60 80 26/12 10/01 24/01 14/02 28/02 14/03 28/03 Trading Volume (mil. shares) HNXIndex (right axis) 07/04/2017 Investment Strategy April 2017 Selectively Accumulate Stocks on the Dip
-
Upload
thomas-farthofer -
Category
Economy & Finance
-
view
31 -
download
0
Transcript of Rong Viet Securities - Investment Strategy Report April 2017
Rong Viet Securities Corporation – Investment Strategy Report November 2016
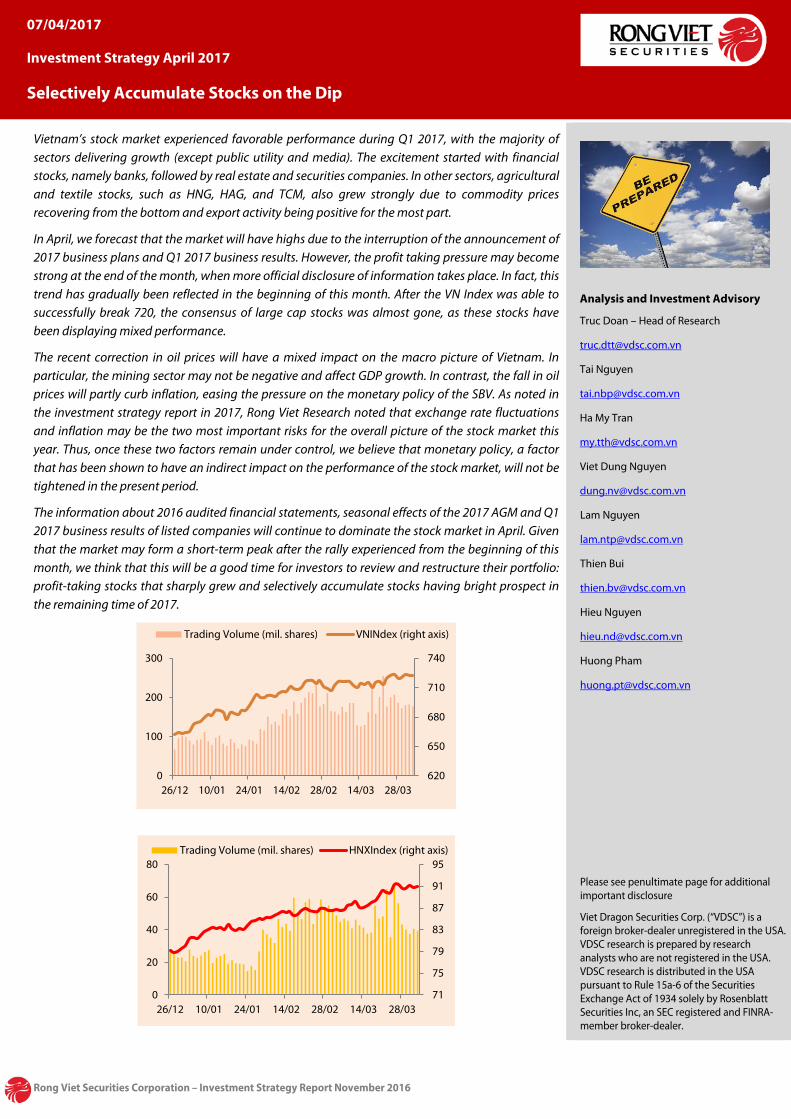
Vietnam’s stock market experienced favorable performance during Q1 2017, with the majority of sectors delivering growth (except public utility and media). The excitement started with financial stocks, namely banks, followed by real estate and securities companies. In other sectors, agricultural and textile stocks, such as HNG, HAG, and TCM, also grew strongly due to commodity prices recovering from the bottom and export activity being positive for the most part.
In April, we forecast that the market will have highs due to the interruption of the announcement of 2017 business plans and Q1 2017 business results. However, the profit taking pressure may become strong at the end of the month, when more official disclosure of information takes place. In fact, this trend has gradually been reflected in the beginning of this month. After the VN Index was able to successfully break 720, the consensus of large cap stocks was almost gone, as these stocks have been displaying mixed performance.
The recent correction in oil prices will have a mixed impact on the macro picture of Vietnam. In particular, the mining sector may not be negative and affect GDP growth. In contrast, the fall in oil prices will partly curb inflation, easing the pressure on the monetary policy of the SBV. As noted in the investment strategy report in 2017, Rong Viet Research noted that exchange rate fluctuations and inflation may be the two most important risks for the overall picture of the stock market this year. Thus, once these two factors remain under control, we believe that monetary policy, a factor that has been shown to have an indirect impact on the performance of the stock market, will not be tightened in the present period.
The information about 2016 audited financial statements, seasonal effects of the 2017 AGM and Q1 2017 business results of listed companies will continue to dominate the stock market in April. Given that the market may form a short-term peak after the rally experienced from the beginning of this month, we think that this will be a good time for investors to review and restructure their portfolio: profit-taking stocks that sharply grew and selectively accumulate stocks having bright prospect in the remaining time of 2017.
Analysis and Investment Advisory
Truc Doan – Head of Research
Tai Nguyen
Ha My Tran
Viet Dung Nguyen
Lam Nguyen
Thien Bui
Hieu Nguyen
Huong Pham
Please see penultimate page for additional important disclosure
Viet Dragon Securities Corp. (“VDSC”) is a foreign broker-dealer unregistered in the USA. VDSC research is prepared by research analysts who are not registered in the USA. VDSC research is distributed in the USA pursuant to Rule 15a-6 of the Securities Exchange Act of 1934 solely by Rosenblatt Securities Inc, an SEC registered and FINRA-member broker-dealer.
620
650
680
710
740
0
100
200
300
26/12 10/01 24/01 14/02 28/02 14/03 28/03
Trading Volume (mil. shares) VNINdex (right axis)
71
75
79
83
87
91
95
0
20
40
60
80
26/12 10/01 24/01 14/02 28/02 14/03 28/03
Trading Volume (mil. shares) HNXIndex (right axis)
07/04/2017
Investment Strategy April 2017
Selectively Accumulate Stocks on the Dip

Rong Viet Securities Corporation – Investment Strategy Report April 2017 2
CONTENTS WORLD ECONOMY: UNCERTAINTY IS THE MAIN THEME 3
China: Potential Bust Amid Strong Economic Data 3
USA: Risk of Asset Revaluation 3
Japan: First Sign of Recovery 4
GLOBAL STOCK MARKET REVIEW 6
VIETNAM’S ECONOMY IN Q1 2017: TAKING A DEEPER LOOK AT GROWTH DRIVERS 7
Growth Momentum Comes from industrial Production 10
Q1 2017 Business Outlook Considering Macroeconomic Factors 11
The Failure of TPP – Samsung Scandal and Prospects for FDI inflows 12
Policy Objectives Are Well Balanced 13
VIETNAM STOCK MARKET Q1: SURPRISELY ACTIVE 15
APRIL 2017 INVESTMENT STRATEGY 21
The country’s macroeconomic fundamentals remain stable, and production activity in the economy has maintained its upward momentum. One of the only main areas of concern includes the poor performance of the oil and gas sector. Therefore, we believe that the opportunity for investors to screen and accumulate stocks for the remainder of 2017 is still ahead.
Specifically, the Q1 2017 GDP growth rate was lower than the same period last year, mainly due to the negative impacts from mining (mainly oil and gas exploitation). Meanwhile, the industrial production sector continued its growing momentum and the processing industry also did well, according to data from PMI Index and the assessment of the performance of various sectors. In which, we expect that the business performances of the steel sector will be brighter and outperform the other sectors. Specifically, in 2016, leading companies such as HPG, HSG and NKG have increased designed capacity by more than 30% to serve consumption demand (capacity of NKG increased by 60%). At the same time, the support of anti-dumping duties has somewhat reduced the pressure on output price for businesses. These factors have laid the foundation for positive earnings growth in the first quarter of 2017 of steel firms.
After delivering strong growth in 2016, the production value of the construction sector has slowed down in Q1 2017, reaching 6.1% YoY (Q1 2016: 8.6% YoY, source: GSO). However, there will be a differentiation of business prospects among construction companies. Industry leaders such as CTD and PC1 can benefit from high backlogs value by the end of 2016, which will ensure a growth this year.
Following the recovery of real estate and construction sectors, we expect that demand on construction materials will witness a strong growth in the second half of the year when construction activities are accelerated. For mining companies, the prospects of extending the mine's working life or acquiring new mine will be the information that should be closely followed before making investment decision. For medium-term investment purposes, these are shares that RongViet Research thinks investors can screen.
Regarding to retail sector, PNJ can be seen as the strong growth story in Vietnam. For 2017, RongViet Research estimates that PNJ's NPAT will grow by 39% YoY, and correspondent EPS is VND 6,375 (higher than our previously estimation due to a change in bonus and welfare expenses). Moreover, PNJ is planning to issue a separate 10% of its shares to a strategic partner (domestic investor). As a result, foreign ownership in PNJ should increase by 4.8 million shares, which could be a supporting factor for PNJ's bid volume under foreign demand.
In addition, the correction of the market this month will also be an opportunity to accumulate stocks for long-term investment objectives. RongViet Research’s favorite stocks are leaders in their industries with ability to pay cash dividends for many consecutive years or stocks in sectors which are likely to see positive changes following the recovery of manufacturing operation of the adjustment of policies. They are stocks in utilities, port, technology, or banking sectors, such as FPT, ACV, REE, VSC, PPC, VCB.
HIGHLIGHT STOCKS 25
52 stocks of RongViet Research (analyzing, discussing with companies) and have analysis and specific evaluation in “Company report” or “Analyst pin board”.
INDUSTRY INDEX 29
Industries movement in April 2017 and P/E, P/B of industries at the end of the month.

Rong Viet Securities Corporation – Investment Strategy Report April 2017 3
WORLD ECONOMY: UNCERTAINTY IS THE MAIN THEME • China: Potential Bust Amid Strong Economic Data
• USA: Risk of Asset Revaluation
• Japan: First Signs of Recovery
China: Potential Bust Amid Strong Economic Data
China, the world's second largest economy, will likely expand by 6.8% during the first quarter of 2017, which is on par with the 6.8% growth experienced during the 4th quarter of last year. This number was better than market expectations due to higher government spending and record bank lending. The reason for such an expansion is due to the rebound of corporate profits, increasing imports, increasing production activities and improved investments. According to the National Bureau of Statistics of China, PMI continued to beat expectations, reaching 51.8 which is a 0.2 percentage point increase from February. This is a good indicator that the manufacturing industry is stabilizing.
According to the 2017 economic outlook of the Organization for Economic Co-operation and Development (OECD), China is facing increasingly larger financial risks, while its policies to stabilize the economy have not brought results as expected. Imminent risks include heavy industrial output oversupply, and potential real estate and other asset bubbles, which could increase the risk of default for this country. In the first two months of 2017, housing prices increased by 22.7% YoY, while it was 16.8% during December 2016. Unfortunately, these events are still present despite Beijing’s efforts to eliminate speculation in the real estate industry. Additionally, China is currently going through a sensitive time, as this country must both stimulate growth and avoid a financial crisis due to the increase in public debt. Overall, the OECD forecasts that GDP growth will be 6.5% in 2017 and 6.3% in 2018.
USA: Risk of Asset Revaluation
US GDP growth in the fourth quarter of 2016 was 2.2%, resulting in 1.6% GDP growth in 2016, as compared to 2.6% in 2015. The main factors that contributed to the overall growth of GDP include the spending on transportation, recreation, and insurance, which grew at 3.5% during the 4th quarter of 2016. However, the increase in consumption was met by a rise in the monthly trade deficit. These numbers seem rather pessimistic for the US economy, especially considering that Trump vowed to boost annual economic growth to 4% by slashing taxes, increasing infrastructure spending and cutting regulations. Another significant question is whether the FED raising interest rates occurred at the right time and if the president’ new policies will be passed. Currently, the FED has hiked rates two times since last year, which is
Figure 1: China Caixin Manufacturing PMI Figure 2: China Housing Price index
Source: Bloomberg Source: Bloomberg
47
48
49
50
51
52
53
1/4/
141/
6/14
1/8/
141/
10/1
41/
12/1
41/
2/15
1/4/
151/
6/15
1/8/
151/
10/1
51/
12/1
51/
2/16
1/4/
161/
6/16
1/8/
161/
10/1
61/
12/1
61/
2/17
-2
0
2
4
6
8
Jan-
14
Apr
-14
Jul-1
4
Oct
-14
Jan-
15
Apr
-15
Jul-1
5
Oct
-15
Jan-
16
Apr
-16
Jul-1
6
Oct
-16
Jan-
17

Rong Viet Securities Corporation – Investment Strategy Report April 2017 4
considered rather healthy for the US economy and the world economy as a whole. Our argument is that although the fourth quarter GDP growth of the US was not as expected, there are still capital inflows into the developed markets as well as increased capital following into emerging markets. This shows that investors are still confident in the global economy overall.
One of the current risks is the plausibility of Trump’s policies being passed. Although there was no apparent sign of a psychological shift from the overall market when his new healthcare policy was rejected, there are still concerns as to whether some of his other new policies may fail. Another risk is also present in the current monetary policy. The US has experienced a decade of excessively low interest rates, which have caused investors and lenders to seek higher yields by bidding up the prices of all types of assets and making risky loans. The danger is that the FED is planning to raise interest rates many times this year, which could drive the market to reevaluate asset prices. Overpriced assets and high-risk loans could lose value and cause an economic downturn. This situation will happen especially when the FED raises more interest in regulating the rising prices in the commodity market.
Figure 3: USA GDP growth Figure 4: USA Trade Balance
Source: Bloomberg Source: Bloomberg
Japan: First Sign of Recovery
Japan recorded a core CPI growth of 0.2% in February. This is the first time in 2 years that Japan’s inflation has increased for two consecutive months, although it is still far lower than the target rate of 2% of the BOJ. The unemployment rate in February declined to 2.8%, which is the lowest in 23 years. Additionally, in February, industrial production growth increased to 4.8%. This economic data is positive for Japan’s struggling economy. In February, exports expanded at a double-digit rate for the first time in over two years, pushing the trade surplus to levels last seen in 2010. Higher demand for Japanese goods is also boosting activity in the manufacturing sector. Apparently, the manufacturing PMI in March of 2017 reached 54.2, above the 50 level for the 7th consecutive time. Given these gradual and steady results, we hold the view that Japan’s economic growth during Q1 2017 will be positive. RongViet Research forecasts 0.5% GDP growth in the first quarter of 2017. This is because the search for yield mechanisms that investors are currently anticipating from the likelihood of the FED raising interest rates. This will stimulate investors to sell Yen and buy USD to benefit from the yield difference between these two countries. Overall, RongViet Research sees a positive picture for Japan’s economy this year.
-2
-1
0
1
2
3
4
5
Q4
2016
Q2
2016
Q4
2015
Q2
2015
Q4
2014
Q2
2014
Q4
2013
Q2
2013
Q4
2012
Q2
2012
Q4
2011
Q2
2011
Q4
2010
-650
-600
-550
-500
-450
-400
-350
Q4
2016
Q2
2016
Q4
2015
Q2
2015
Q4
2014
Q2
2014
Q4
2013
Q2
2013
Q4
2012
Q2
2012
Q4
2011
Q2
2011
Q4
2010

Rong Viet Securities Corporation – Investment Strategy Report April 2017 5
Figure 5: Japan GDP growth Figure 6: Japan Unemployment Rate
Source: Bloomberg Source: Bloomberg
-0.3
0
0.3
0.6
0.9
1.2
1.5
Q4
2016
Q3
2016
Q2
2016
Q1
2016
Q4
2015
Q3
2015
Q2
2015
Q1
2015
Q4
2014
Q3
2014
-14
-12
-10
-8
-6
-4
-2
1/2/
15
1/4/
15
1/6/
15
1/8/
15
1/10
/15
1/12
/15
1/2/
16
1/4/
16
1/6/
16
1/8/
16
1/10
/16
1/12
/16
1/2/
17

Rong Viet Securities Corporation – Investment Strategy Report April 2017 6
GLOBAL STOCK MARKET REVIEW
Figure 7: Some Major Global Stock Market Indices in Q1/2017
Source: Bloomberg, RongViet Research
The US stock indices constantly increased in the first quarter of 2017. The Nasdaq was the leader recording a gain of 12%, followed by the S&P 500 (6%) and the Dow Jones (5%). The Fed rate hike in March did not significantly impact the market because the Fed’s actions were projected by investors. The benefits expected from President Donald Trump’s tax plan stimulated investors’ sentiment. However, there were still concerns about the feasibility of Trump’s tax plan as the Obamacare replacement draft was not approved. As a result, the Dow Jones and the S&P 500 entered into an adjustment phase in March, but the loss was not significant.
In Europe, there were few changes in fiscal policies so markets were not significantly affected. The main areas of concern for investors will include the health of the UK and EU economies on the progress of “Brexit”, political changes in Holland, Italy and France, as well as the banking system of these geographical areas.
The price of oil resumed its downtrend in Q1 2017 due to negative information on the increase in supply. This was because of some non-OPEC countries grasping the chance to raise their volumes instead of simultaneously cutting supply to support the price.
The Hong Kong Hang Seng index, the VNIndex and the HNXIndex were the best performers in the Asia region. Japan’s economy has also shown early signals for a recovery and BoJ raised its growth forecasts. On the contrary, the second largest economy has been facing many risks including the abundance in heavy industry’s production, the bubble in the real estate market, and the risk of bankruptcy. As a result, the SSE Index fell by more than 5% in March, which made the gain in the first quarter reduce to only 3%.
Oil prices saw a negative trend in Q1/2017 on the verge of disagreement in production cut-off. Non-OPEC members even increased the production with the expectation to take market share from OPEC.
5% 6%
12%
3%5%
7%
-1%
3%
10%
6% 7%5%
6%
9%
13%
8%
-6%-10%
0%
10%
20%
Dow
Jone
s
S&P
500
Nas
daq
FTSE
100
CAC
40
DA
X
Nik
kei 2
25
SSE
(Sha
ngha
i)
Han
g Se
ng (H
ongk
ong)
TSEC
(Tai
wan
)
Kosp
i (Ko
rean
)
JKSE
(Ind
ones
ia)
KLSE
(Mal
aysi
a)
VNIn
dex
(Vie
tnam
)
HN
X-In
dex
(Vie
tnam
)
Gol
d Oil
From 28/02/2017 to 31/03/2017 From 31/12/2016 to 31/03/2017

Rong Viet Securities Corporation – Investment Strategy Report April 2017 7
VIETNAM’S ECONOMY IN Q1 2017: TAKING A DEEPER LOOK AT GROWTH DRIVERS
Economic Growth in Q1 2017 was Less Optimistic
In the first quarter of 2017, economic growth slowed down considerably, falling from 5.46% in Q1 2016 to 5.1%. The main reason for the decline in growth was the severe decline of the mining sector, which declined by around 10% over the same period last year.
Assessments: Although oil prices have rebounded to USD50/barrel, the recovery of oil and gas exploitation activities did not meet our expectations. This led to a sharp decline in the manufacturing industry’s growth, from 6.93% in Q1 2016 to 3.85% in Q1 2017. Meanwhile, the agricultural sector had a mild recovery, up 2.03% over the same period last year. Excluding the negative growth factor in GDP (mining), economic growth in the first quarter was around 6.37%.
Figure 8: Quarterly GDP Growth
Source: GSO
Inflation rate increased significantly, however core inflation remained stable
Average CPI for Q1 2017 increased by 4.96% YoY. Sectors that had the highest contribution to general inflation during Q1 were public goods and transportation. Specifically, the highest increases came from medicine and healthcare because there were 13 cities and provinces under the Central Government that made upward adjustments for service costs during March 2017. Moreover, transportation improved thanks to the 35% YoY increase in average gasoline prices in Q1.
Assessments: Even though the transportation sector strongly improved, we believe that oil prices were on a declining trend during the 2nd half of March. Therefore, the impacts from the increase in the price of gasoline products on CPI in the future will not experience a significant surge. In addition to this, the average basic inflation during the first 3 months of 2017 inclined by 1.66% YoY. As a result, the rebound of nflation is not a major concern.
Figure 9: Inflation rate and core inflation rate movements
Source: GSO
-2%
0%
2%
4%
6%
8%
10%
1Q2016 2Q2016 3Q2016 4Q2016 1Q2017
GDP Agriculture Manufacturing Services
4.96%
1.66%
-0.2%
0.0%
0.2%
0.4%
0.6%
04/2
015
06/2
015
08/2
015
10/2
015
12/2
015
02/2
016
04/2
016
06/2
016
08/2
016
10/2
016
12/2
016
2/20
17
Headline inflation Core inflation

Rong Viet Securities Corporation – Investment Strategy Report April 2017 8
Trade deficit came back, mainly for production
- Domestic sector: Two-way trade experienced a recovery, even though the growth rate of imports was much higher than exports. In Q1 2017, exports and imports grew by 11.2% and 22.8% respectively. The accumulated trade deficit was USD5.7 billion, 1.6 times more than the same period last year.
- FDI Sector: Accounts for 70% of the total trade turnover of Vietnam, and import-export activities of the FDI sector continued to recover. During Q1 2017, exports and imports grew at 14.4% and 22.0%, respectively.
Assessments: Imports increased sharply again, causing the trade balance to reverse from February 2017. Meanwhile, imports are mainly for materials and equipment, leading to the expectation for the restoration of exports during the next quarters of this year.
Figure 10: Monthly Export – Import growth
Source: GSO
SBV actively devaluates the dong
In Q1 2017, the average VND/USD exchange rate reached VND22,703, a 0.04% slight increase as compared with late-2016. Meanwhile, the SBV actively devalued the dong by adjusting the central exchange rate. As compared to early-2017, the central exchange rate increased by 0.48%, equivalent to a 0.5% devaluation rate. At the same time, the SBV also shows its willingness to intervene in the market with the exchange’s price being VND50 lower than the ceiling exchange rate.
Assessments: We appreciate SBV’s willingness in adjusting the exchange rate. In Q1, the market saw many waves in the exchange rate market, however, it was under control of SBV. Specially, Vietnam’s foreign exchange rate reserves have remained high and the USD movement after Trump and FED’s policy has supported SBV’s exchange rate operation in recent times.
Figure 11: Exchange rate movement
Source: GSO
-20%
0%
20%
40%
60%
01/1
6
02/1
6
03/1
6
04/1
6
05/1
6
06/1
6
07/1
6
08/1
6
09/1
6
10/1
6
11/1
6
12/1
6
01/1
7
02/1
7
03/1
7
Exports Imports
100.478
100.057
98.5
99.5
100.5
101.5
30/1
2/16
06/0
1/17
13/0
1/17
20/0
1/17
27/0
1/17
03/0
2/17
10/0
2/17
17/0
2/17
24/0
2/17
03/0
3/17
10/0
3/17
17/0
3/17
24/0
3/17
SBVNUSD USDVND

Rong Viet Securities Corporation – Investment Strategy Report April 2017 9
Credit accelerated in the first quarter of 2017
According to GSO, credit growth was 2.81% as of March 20, 2017, increasing by 1.54% compared to the same period last year, recording the highest growth in 6 years. The growth of total M2 – money supply and mobilization was 2.88% and 2.43% respectively, which is near the same growth as the same period last year.
Deposit interest rates increased slightly in Q1 2017, especially for certificates of deposit with terms longer than 12 months. According to the SBV, this phenomenon is influenced by circulars 06 and 36.
Assessments: We realize that the deposit interest rates in Q1 2017 with a term of 6-12 months fluctuated slightly while increasing sharply in terms over 12 months. The liquidity was not as strong as the same period. The orientation of the State Bank on monetary policy still remains. As mentioned in our Strategic Report for 2017, we expect that the SBV will run monetary policy based on signals from core inflation. The movement of deposit interest rates in the beginning of this year is not a reasonable factor for the SBV to tighten monetary policy.
Figure 12: Credit and Deposit Growth
Source: GSO
3.1%
2.3%
1.5%
2.9%
2.4%2.8%
M2 Huy động Tín dụng
Q12016 Q12017
Deposit Credit

Rong Viet Securities Corporation – Investment Strategy Report April 2017 10
MACRO OUTLOOK: DEPENDENCY ON PROCESSING, MANUFACTURING, AND FDI
• Growth Momentum Comes from industrial Production
• Q1 2017 Business Outlook Considering Macroeconomic Factors
• The Failure of TPP – Samsung Scandal and Prospects for FDI inflows
• Policy Objectives are Well Balanced
Growth Momentum Comes from industrial Production
Mining Industry: Long-term difficulties negatively impact economic growth
The average crude oil price reached USD54.6/barrel (Brent), increasing by ~55% YoY compared to Q1 2016. This price level is higher than the average during 4Q 2016 by 6.8%, although production in the mining sector has been relatively gloomy. In Q1 this year, total crude oil output in Vietnam was 3.95 million tons, declining by 12.2% YoY. This resulted in the slowdown of the mining industry, which led to a 0.76 percentage point decline in total GDP growth. Therefore, the prolonged price level of oil prices below USD60/barrel has increased the difficulties for oil contractors.
According to EIA, there will be excess demand of 900,000 barrels/day during the first 6 months of 2017 under the assumption that OPEC will completely follow the production agreement. For the case of 75% commitment, which occurred during 2008, the level of excess demand will only be around 630,000 barrels/day. Total crude output in Vietnam has been declining quarterly. The potential for oil prices to recover, to offset the negative impacts of the mining sector on GDP, could only be fulfilled during the last quarter of this year.
Figure 13: Quarterly Oil Volume and Oil Prices Movement
Source: MOIT, Bloomberg, RongViet Research
Processing and manufacturing industry: the main driving force for growth
In Q1 2017, the industrial production index improved by 4.1% YoY, significantly lower than the growth rates from the last few years. The main reason came from the decline in the mining sector (-11.4% YoY), while the processing and manufacturing industry improved by 8.3% YoY, contributing 5.9 percentage points to the overall growth.
PMI, which reflects the heath of production activities of an economy, recorded the highest average in history, reaching 53.4 points during Q1 2017. In addition to the positive data about output and orders, we recognize that the growth of production activity also occurred because of the recovery of exports. The growth of exports during the first three months of this year has
0
10
20
30
40
50
60
70
0
1
2
3
4
5
6
1Q2015 2Q2015 3Q2015 4Q2015 1Q2016 2Q2016 3Q2016 4Q2016 1Q2017
Oil volume Oil prices

Rong Viet Securities Corporation – Investment Strategy Report April 2017 11
improved significantly, achieving 13.4% YoY growth. RongViet Research believes that FDI activities will be a crucial factor in supporting the growth of industrial production, processing and manufacturing in Vietnam.
Figure 14: PMI and IIP Movements Figure 15: FDI Sector’s Export-Import Growth
Source: GSO, Nikkei, RongViet Research Source: Customs, RongViet Research
Q1 2017 Business Outlook Considering Macroeconomic Factors
In Q1 2017, the metallurgical industry (iron and steel) improved significantly. Total production and demand increased by 43.4% YoY and 17.3% YoY, respectively. The Industrial production index increased by 10.9% and 5.08% compared to the same period last year and the previous quarter, respectively. The metallurgical industry was the strongest growing area of this price index, and this change created an increase in selling prices. We believe that business results for steel and galvanized steel producers will continue to be positive during the first quarters of this year, which will be further supported by the anti-dumping measures for steel construction.
In addition to this, the textile industry also experienced decent growth in terms of production and demand. Specifically, apparels recorded growth of 11.6% and 7.6% in production and demand; textiles recorded growth of 11.4% and 13.7%, respectively, in these same areas. The production index increased for the apparel sector and declined for the textile sector. As a result, we are positive about the business results of textile companies during Q1 2017. Moreover, industries that could experience an improvement in earnings include the chemical (fertilizer) and natural rubber industries. We expect that the food and beverage industry will have stable growth. In contrast, there will be a slight decline in the business results of furniture producers over the first quarters of this year.
-10
-7
-4
-1
2
5
8
11
44
46
48
50
52
54
56
Jan-
15
Mar
-15
May
-15
Jul-1
5
Sep-
15
Nov
-15
Jan-
16
Mar
-16
May
-16
Jul-1
6
Sep-
16
16-N
ov
Jan-
17
Mar
-17
PMI IP (3m moving average)
-10%
0%
10%
20%
30%
01/1
6
02/1
6
03/1
6
04/1
6
05/1
6
06/1
6
07/1
6
08/1
6
09/1
6
10/1
6
11/1
6
12/1
6
01/1
7
02/1
7
03/1
7
XK TB động 3 tháng NK TB động 3 thángImport (3m moving avg) Export (3m moving avg)

Rong Viet Securities Corporation – Investment Strategy Report April 2017 12
Table 1: Production Situation of Some Products in Q1 2017
Production growth
Price Index (vs Q12016)
Price Index (vs Q42016)
Consumption growth
1 Metal 43.4 10.91 5.08 17.3
2 Costumes 11.6 -6.03 -0.62 7.6
3 Paper 11.6 -3.62 -1.4 11.4
4 Textile 11.4 0.14 -0.4 13.9
5 Motor vehicles 9.6 na na 14.6
6 Chemicals 8.7 0.05 0.57 15.7
7 Drinks 8.4 -1.32 -0.92 5.1
8 Rubber 7.9 1.26 1.28 5.3
9 Other means of transport 6.1 na na 14.2
10 Electrical equipment 5.6 na na 12.2
11 Food 4.4 1.74 0.84 2.8
12 Pharmaceutical 2.3 na na -0.1
13 Electronic products -1 -10.63 -8.85 8.9
14 Wooden -3.6 1.27 1.49 -7.5
Source: GSO, RongViet Research
The Failure of TPP – Samsung Scandal and Prospects for FDI inflows
The FDI disbursement rate declined during Q1 2017. According to Foreign Investment Agency, the total disbursed capital only reached USD3.62 billion, increasing by 3.4% YoY. However, registered investment capital demonstrated positive signals, with the biggest contribution coming from increased registered capital. Specifically, the total registered capital in Q1 was USD6.86 billion (excluding capital contribution and share purchase), +70% YoY. Accordingly, the increase in registered capital was USD3.94 billion, three times higher than the same period last year. The surge came from the Samsung Display projected license (USD 2.5 bil) and Plytex Far Eastern (USD489 mil). Several longtime investors are continuing to pour capital into Vietnam, including Coca-Cola and Vietnam – Singapore Industrial park.
The movement of newly registered capital proved that the failure of TPP and Samsung’s scandal have not made major impacts on FDI companies continuing to enter Vietnam. Sectors that have been attracting the most FDI include processing and manufacturing (account for 85% of total registered capital). Vietnam’s top 2 investors include Korea and Singapore, while China reached the 3rd position with total registered capital of USD823 million in Q1 2017.
In the short-term, we believe that the textile industry will experience a recovery in its exports thanks to the investment from 2014 – 2015, when the TPP strongly influenced industry sentiment. Meanwhile, the electronic component manufacturing industry experienced a slight decline in production as Samsung Bac Ninh plant reduced output to prepare for new products. We expect that the attraction of foreign capital will remain stable, which is a crucial factor for the growth of industrial production in Vietnam.

Rong Viet Securities Corporation – Investment Strategy Report April 2017 13
Figure 16: Registered and Disbursed FDI Growth rate Figure 17: Registered FDI by Country (Q12017)
Source: GSO, RongViet Research Source: FII, RongViet Research
Policy Objectives Are Well Balanced
Since earlier this year, we believe that policy makers have been careful in orienting monetary policy for 2017 due to concerns and the limited room for growth. Until now, we believe that the initial steps from regulatory authorities have been successful. Macroeconomic conditions have been under control and are relatively stable despite the national and global pressure.
As mentioned in our macroeconomic Q1 2017 part, the overall inflation increase is not seen as a signal for the State Bank to tighten the monetary policy in the future. The reasons are (1) the price of consumer goods remains relatively stable, especially for the food & beverages sector; (2) the decline in crude oil during the second half of March has a high possibility of moving sideways if OPEC does not keep its commitment to cut output; (3) general inflation increased due to the upward adjustment of public good prices, which is within the control of regulators.
One area of concern includes the risk of an upward adjustment of electricity prices on inflation. Recently, the Prime Minister has rejected the proposal to change the regular upward adjustment of electricity prices to once per 3 months. The Ministry of Industry and Trade and EVN will continue to monitor this and propose to increase electricity prices in the next quarter. Given the current sensitive circumstances, we project that the price of electricity will increase by less than 7%. Currently, we maintain our inflation projection of 6% and for core inflation to be 2-3%. The State Bank will observe the signals from core inflation to manage the monetary policy.
Regarding the exchange rate, we believe that the slow devaluation of the VND will be a predatory step for the State Bank for stronger fluctuation (if any) from major currencies during the remainder of this year. In Q1 2017, USD strength indicators dropped by 3.4% compared to the end of 2016. Among major currencies, the JPY and CNY appreciated slightly, while the EUR depreciated. The reversal trend of trade balance and foreign currency demand for imports have not made negative impacts on the exchange rate stability. Meanwhile, recorded high foreign reserves and foreign capital flows are the fulcrum for operators to control exchange rate movements.
Interest rates in the inter-bank market over the last quarter have been less than 5%/year (overnight). Given the fast credit growth during Q1, we believe that the liquidation of the banking system will not be as abundant as before. Moreover, the limitation on the short-term capital ratio for medium- and long-term loans makes banks more active in restructuring capital
7.0% 14.8% 3.4%
-40.6%
167.5%
6.5%
-51.8%
87.0%
206.4%
-100%
-50%
0%
50%
100%
150%
200%
250%
Q12015 Q12016 Q12017
Implemented Capital
New Registered Capital
Incremental registered capital
Korea48%
Singapore12%
China11%
Taiwan8%
Japan6%
Others15%

Rong Viet Securities Corporation – Investment Strategy Report April 2017 14
and improving the issuance of long-term deposit certificates with high interest rates (8-9%/year). However, policy makers have continuously been delivering messages about stabilizing the lending rates and directing capital into high priority sectors. Bond interest rates on the primary market are relatively stable without significant changes, as compared to earlier this year. This is a sign for the stability of the cost of capital in the economy.
We believe that the process of stabilizing macroeconomic factors will be bumpier than expected, but not too strenuous. Therefore, it will be under the control of regulators. Statistics about credit growth in Q1 need to be analyzed to have a clear understanding about the trend of investment channels and industries which are the main drivers of growth.
Figure 18: Interbank Interest Rate Movement (%) Figure 19: Government Bond Yield Movement (%)
Source: Bloomberg, RongViet Research Source: Bloomberg, RongViet Research
0
2
4
6
01/2
016
02/2
016
03/2
016
04/2
016
05/2
016
06/2
016
07/2
016
08/2
016
09/2
016
10/2
016
11/2
016
12/2
016
01/2
017
02/2
017
03/2
017
3
4
5
6
7
01/2
016
02/2
016
03/2
016
04/2
016
05/2
016
06/2
016
07/2
016
08/2
016
09/2
016
10/2
016
11/2
016
12/2
016
01/2
017
02/2
017
03/2
017
1N 3N 5N3Y 5Y1Y

Rong Viet Securities Corporation – Investment Strategy Report April 2017 15
VIETNAM STOCK MARKET Q1: SURPRISELY ACTIVE Fluctuating in a narrow range in the last months of 2016, the VN-Index surprised investors by
rising considerably in Q1/2017, from 664.87 to 722.31 (+8.6%). Specifically, the gains were 4.9% in January, 1.9% in February and 1.6% in March. Although the index has had trouble breaking 720 points, the index was eventually able to surpass the milestone in the 2nd half of March.
Extraordinary Liquidity
The strong increase of the indices in January attracted dramatic inflows to the market in the following 2 months. Many sessions witnessed trading volumes of over VND3,700 billion, similar to the amount of capital during special events such as “the East Sea Event”, Brexit or ETF portfolio re-structuring. Newly listed titans, namely VJC, SAB and NVL, merely contributed to around 2% of the trading volumes, which displays how capital has been flowing into the market in general. However, it is worth noting that FLC and ROS were also two of the main contributors of this liquidity; these stocks were occasionally able to contribute up to 20% of the market’s entire volume.
Figure 20: VN-Index movement in Q1 Figure 21: HNX-Index movement in Q1
Source: RongViet Research Source: RongViet Research
We observed that capital flew strongly to large-cap and mid-cap stocks. Notably, mid-cap stocks drew a great amount of capital from investors in February and, consequently, the VN-MID jumped by more than 6% that month (while the gains for the VN-Index and VN-30 were just 2%). However, the VN Index was not able to surpass the 720 level because mid-cap stocks received more attention from investors. Only until the last week of the first quarter, the VN-Index had a chance to overcome this level as large-caps drew much more attention from investors.
620
650
680
710
740
0
100
200
300
26/12 10/01 24/01 14/02 28/02 14/03 28/03
Trading Volume (mil. shares) VNINdex (right axis)
71
75
79
83
87
91
95
0
20
40
60
80
26/12 10/01 24/01 14/02 28/02 14/03 28/03
Trading Volume (mil. shares) HNXIndex (right axis)

Rong Viet Securities Corporation – Investment Strategy Report April 2017 16
Figure 22: Matching-order value of the market from Jan 2016 to March 2017 (VND bn)
Source: RongViet Research
Opportunities Come from Underperforming Sectors in 2016
In the first three months of 2017, we observed strong inflows in sectors that underperformed during 2016. This included the following sectors: Banking (January), Real Estate (February) and Finance Services (February and March). Banking stocks “triggered the first shot” at the very beginning sessions of 2017. VCB, CTG, CIB and especially ACB surged rapidly during a short period, causing many investors to miss this wave. This was followed by real estate stocks in the last sessions of February. Particularly, there were some sessions during which more than 10 stocks in the sector reached the ceiling price (DXG, TDH, NTL, KAC, FLC, etc.). Moreover, we also saw the strong rebound of stocks that fell deeply in 2016 such as HAG (+71%), HNG (+87%) and TCM (+49%).
The movement of these sectors in Q1/2017 displays that unfavorable stocks are able to rebound at times due to positive news, regardless of how true the news is. The news could be anything: LDR changing regulation, high credit growth, FOL in bank, or strong prospects of the real estate market. The market also continued to pay strong attention to sectors that outperformed during 2016. For example, DHG has triggered another rally for pharmaceutical sectors as the company announce its intention to lift its FOL.
Figure 23: Sectors Performance in Q1
Source: RongViet Research
-
1,000
2,000
3,000
4,000
1/2016
2/2016
3/2016
4/2016
5/2016
6/2016
7/2016
8/2016
9/2016
10/2016
11/2016
12/2016
1/2017
2/2017
3/2017
VNIndex HNIndex Large caps Mid Caps Small Caps
-20%
-10%
0%
10%
20%
30%
Retail
Insurance
Real Estate
Technology
Oil &
Gas
Financial Services
Utilities
Travel & Leisure
Industrial Goods & Services
Personal & H
ousehold Goods
Chemicals
Banks
Autom
obiles & Parts
Basic Resources
Food & Beverage
Media
Construction & M
aterials
Health Care
Jan Feb Mar Q1

Rong Viet Securities Corporation – Investment Strategy Report April 2017 17
Good News Continues to Support the Rally
The rise of the index has resulted in stronger profit taking pressure. This phenomenon was demonstrated clearly in the last week of Q1/2017, and could be the explanation for the small gain of the index in February and March despite the strong liquidity of the market. In general, good news and rumors regarding the business results and dividend payments of certain companies is still supporting the market. In April, there will be more companies announcing their business result and dividend payment plan.
Table 2: List of companies paying cash dividends in April
Ticker Cash dividend
Ex-dividend date
Payment date Dividend yield
P/E P/B Avr trading vol
NTR 700 04/04/2017 06/30/2017 13.2% 5.1 0.5 45
VTB 2,000 04/13/2017 04/27/2017 11.4% 12.1 0.9 5,395
ANV 900 04/13/2017 06/29/2017 11.2% 26.9 0.4 1,960
IME 1,700 04/11/2017 04/25/2017 8.9% 6.4 1.4 2,138
PCE 1,400 04/13/2017 04/25/2017 8.6% 6.5 1.0 109
DBM 1,200 04/20/2017 05/12/2017 6.7% 5.5 0.7 192
UDJ 500 04/14/2017 04/27/2017 6.3% 18.5 0.7 4,229
HU6 500 04/04/2017 04/28/2017 5.3% 7.7 0.8 414
MCC 700 04/04/2017 04/26/2017 5.0% 6.0 1.0 6,204
HOT 1,200 04/13/2017 05/10/2017 4.4% 20.4 2.0 251
VC7 1,000 04/13/2017 05/03/2017 4.4% 14.8 1.9 7,531
TIP 500 04/11/2017 04/27/2017 3.0% 6.9 1.1 6,444
DRL 1,100 04/04/2017 04/24/2017 2.9% 10.5 2.8 1,231
DQC 1,500 04/10/2017 05/05/2017 2.7% 8.6 1.5 8,860
CMF 2,000 04/04/2017 05/31/2017 2.6% 13.1 2.7 46
IDV 1,000 04/04/2017 04/18/2017 2.0% 5.8 3.6 4,757
RAL 2,000 04/04/2017 04/27/2017 1.9% 8.3 2.0 7,379
BIC 700 04/12/2017 04/24/2017 1.8% 36.9 2.3 5,695
SGR 996 04/05/2017 04/21/2017 1.6% 4.6 2.6 6,410
GAS 700 04/10/2017 04/28/2017 1.3% 14.8 2.7 86,754
VC3 500 04/11/2017 05/03/2017 1.3% 11.7 2.9 13,264
QNS 1,000 04/13/2017 04/28/2017 0.8% 16.2 5.9 79,323
Source: RongViet Research
Overall, the market has rallied strongly in Q1 as it has faced negligible bad news. In the two exchanges, over 250 stocks have gained at least 10%, of which 131 stocks rose higher than 20%. However, it seems that the index momentum has slowed down after it surpassed the 720 level, and that stocks in the VN-30 Index are less supportive than previously. The supportive news will most likely become scarcer as companies finish their AGM at the end of April. Therefore, there is a chance that the market has reached a short term peak and may enter a correction phase soon. Investors are therefore recommended to take profits in upcoming sessions.

Rong Viet Securities Corporation – Investment Strategy Report April 2017 18
Foreign trading activities: 3-month net buying
Figure 24: Foreign investors trading in Q1/2017
Source: FiinPro, RongViet Research
Foreigners actively net bought in Q1/2017. In both bourses, they net bought more than VND3,725 billion, primarily in the F&B sector, with VNM being the leader. Oil & Gas and Real Estate sectors continued to be on the top net selling list for the second year in a row.
Table 3: Foreign trading value in HSX and HNX in Q1/2017
Sector HSX HNX
Retail -29.3 0.2
Insurance -13.6 -30.1
Real estate -479.7 35.8
Technology -1.2 -0.3
Oil & gas -314.9 52.0
Financial services -33.3 18.6
Utilities 53.4 -29.7
Travel & leisure 242.2 -16.4
Industrial goods & services 12.3 -11.7
Personal and household goods 198.0 4.4
Chemicals -132.5 9.1
Banks 142.2 7.9
Automobiles & parts -26.3 21.6
Basic resource 147.0 -0.3
Food & beverage 2930.7 50.5
Communication 0.0 2.1
Construction & building materials 650.7 89.2
Healthcare 155.7 21.2
Total 3,501.4 224.0
Source: FiinPro, RongViet Research
0
500
1000
1500
2000
2500
3000
3500
-400
-300
-200
-100
0
100
200
300
400
500
03/01 21/03
YTD
acc
umul
ated
val
ue
Dai
ly v
alue
Net bought/sold Accumulated Value

Rong Viet Securities Corporation – Investment Strategy Report April 2017 19
ETFs announced reconstitution results in March. Two funds net sold many large-cap stocks on 17/03 to buy ROS (Db X-trackers FTSE Vietnam UCITS ETF) and NVL (VanEck Vectors Vietnam ETF). It was quite a surprise when NVL was added. Actually, the latest index methodology of MVIS in Feb 2017 has specific rules for IPO cases. Therefore, the remaining 3 reconstitutions in this year will be more interesting and challenging for those who are front-runners.
As we have commented in our 2017 Investment Strategy Report, local investors understand more foreign trading activities. It is no longer a one-way effect from foreign to local investors’ sentiment. In the short-term, we don’t see any significantly bad news that can change the direction of foreign capital movement, except for news on 2016 consolidated and Q1/2017 earnings results.

Rong Viet Securities Corporation – Investment Strategy Report April 2017 20
APRIL 2017 STOCK MARKET OUTLOOK
Vietnam’s stock market experienced favorable performance during Q1 2017, with the majority of sectors delivering growth (except public utility and media). The excitement started with financial stocks, namely banks, followed by real estate and securities companies. In other sectors, agricultural and textile stocks, such as HNG, HAG, and TCM, also grew strongly due to commodity prices recovering from the bottom and export activity being positive for the most part.
In April, we forecast that the market will have highs due to the interruption of the announcement of 2017 business plans and Q1 2017 business results. However, the profit taking pressure may become strong at the end of the month, when more official disclosure of information takes place. In fact, this trend has gradually been reflected in the beginning of this month. After the VN Index was able to successfully break 720, the consensus of large cap stocks was almost gone, as these stocks have been displaying mixed performance.
The recent correction in oil prices will have a mixed impact on the macro picture of Vietnam. In particular, the mining sector may not be negative and affect GDP growth. In contrast, the fall in oil prices will partly curb inflation, easing the pressure on the monetary policy of the SBV. As noted in our investment strategy report in 2017, exchange rate fluctuations and inflation may be the two most important risks for the overall picture of the stock market this year. Thus, once these two factors remain under control, we believe that monetary policy, a factor that has been shown to have an indirect impact on the performance of the stock market, will not be tightened in the present period.
The information about 2016 audited financial statements, seasonal effects of the 2017 AGM and Q1 2017 business results of listed companies will continue to dominate the stock market in April. Given that the market may form a short-term peak after the rally experienced from the beginning of this month, we think that this will be a good time for investors to review and restructure their portfolio: profit-taking stocks that sharply grew and selectively accumulate stocks having bright prospect in the remaining time of 2017.
Table 4: Key Sectors Performance
No Name % 1M Price
Change % 3M Price
Change % 12M Price
Change Market Cap
(VND billion) ROA (%)
ROE (%)
Basic P/E
P/B
1 Automobiles & Parts 3.3 3.5 1.2 17,295 10.3% 17.3% 10.8 1.6
2 Banks 2.6 10.8 19.1 364,809 0.8% 11.9% 13.9 1.8
3 Basic Resources -7.8 -7.5 8.6 111,038 11.3% 21.8% 9.5 2.1
4 Chemicals -3.1 3.4 -0.7 43,661 7.1% 12.4% 10.4 1.3
5 Construction & Materials 4.7 17.7 104.8 218,958 8.5% 17.3% 17.9 6.4
6 Financial Services 6.5 13.3 9.9 34,005 4.9% 8.8% 26.5 1.4
7 Food & Beverage 2.1 4.2 34.9 552,768 21.4% 30.9% 21.2 7.3
8 Health Care 9.5 18.6 55.2 32,307 14.3% 21.9% 24.7 3.3
9 Industrial Goods & Services -0.1 4.0 32.3 202,764 6.8% 15.0% 23.1 3.2
10 Insurance 1.6 1.5 28.8 62,228 2.5% 9.3% 22.5 2.5
11 Media 10.1 23.1 -3.2 13,399 3.1% 3.6% 55.7 4.6
12 Oil & Gas -7.0 -4.7 2.4 16,370 2.0% 4.5% 14.2 0.6
13 Personal & Household Goods 1.0 -2.7 15.0 38,945 9.9% 21.0% 12.1 2.6
14 Real Estate 0.7 11.2 22.2 250,312 3.3% 10.5% 23.8 3.1
15 Retail 0.5 5.6 87.4 30,175 13.4% 44.2% 15.0 5.9
16 Technology 2.3 3.8 18.9 28,139 6.6% 16.3% 11.2 2.0
17 Telecommunications -7.6 5.3 60.6 13,271 11.0% 29.7% 12.9 4.0
18 Travel & Leisure -8.7 -20.1 -19.9 90,597 9.9% 39.4% 17.2 4.7
19 Utilities -5.9 -8.8 27.6 163,610 10.3% 15.8% 12.9 2.2
Source: FiinPro
Rong Viet Securities Corporation – Investment Strategy Report April 2017 21
APRIL 2017 INVESTMENT STRATEGY
Vietnam’s stock market experienced a favorable Q1 2017, with the growth of most sectors (except utilities and media). The excitement started with financial stocks, mainly banks, followed by real estate and securities. In other sectors, agricultural and textile stocks, such as HNG, HAG, or TCM, also grew strongly after commodity prices have been through the bottom as well as export activity (especially for textile companies) is quite satisfactory.
The country’s macroeconomic fundamentals remain stable, and production activity in the economy has maintained its upward momentum. One of the only main areas of concern includes the poor performance of the oil and gas sector. Therefore, we believe that the opportunity for investors to screen and accumulate stocks for the remainder of 2017 is still ahead.
Specifically, the Q1 2017 GDP growth rate was lower than the same period last year, mainly due to the negative impacts from mining (mainly oil and gas exploitation). Meanwhile, the industrial production sector continued its growing momentum and the processing industry also did well, according to data from PMI Index and the assessment of the performance of various sectors. We expect that the business performances of the steel sector will be brighter and outperform the other sectors. Specifically, in 2016, leading companies such as HPG, HSG and NKG have increased designed capacity by more than 30% to serve consumption demand (capacity of NKG increased by 60%). At the same time, the support of anti-dumping duties has somewhat reduced the pressure on output price for businesses. These factors have laid the foundation for positive earnings growth for steel firms in the first quarter of 2017.
In 2016, leading companies in the steel sector such as HPG, HSG and NKG expanded capacity by 30% in order to meet the demand (NKG’s capacity increased by 60%). Moreover, anti-dumping duties relatively ease the pressure from the decline in selling price for these companies. These factors strongly supported the improvement in business results during Q1 2017. RongViet Research forecasts that HPG’s Q12017 NPAT will grow by 80% YoY, while this figure will be 100% YoY for NKG. Related to anti-dumping taxes, the Ministry of Industry and Trade issued Decision No. 1105/QD-BCT to officially impose anti-dumping duties on Chinese steel products for a five-year period starting from April 15th 2017. In Q2 2017, it is likely that another decision to impose anti-dumping on corlor coated steel will be issued. These two decisions will create a comprehensive defense for steel companies, especially producers of corlor coated products. Rongviet Reseach believes that HSG and NKG will benefit from those decisions.
HPG has strong resistance to the fluctuation of global steel prices thanks to the company’s leading position in the industry and long production cycle (from billets to final products). HSG, a galvanized producer, has had positive performance, and its stock price is approaching our expectations. Meanwhile, NKG will benefit the most from the decisions on the anti-dumping tax. Therefore, investors could accumulate this stock for short-term and intermediate timeframe.
After strong growth in 2016, the production value of the construction sector has slowed down in Q1 2017, reaching 6.1% YoY (Q1 2016: 8.6% YoY, source: GSO). However, there will be a differentiation of business prospects among construction companies. CTD has many advantages in selecting projects as well as ensuring the backlog for the next year. With the new contracted value of about VND 8,700 billion in Q1 2017, we estimate that CTD's current backlog grew by around18% YTD and up by 77% YoY. We project that their revenue will grow by 30% YoY, and 2017 NPAT will increase by more than 22% YoY and correspondent EPS is VND 21,176. CTD is trading at forward PER of 9.2x, which is quite low compared to other large-cap stocks. Our second favorite candidate working in power construction, namely Power Construction Jsc No1 (HSX: PC1). PC1 is seen as a dynamic enterprise in seeking expansion opportunities. In the last five years, PC1's charter capital has increased nearly six fold, with CARG of revenue and

Rong Viet Securities Corporation – Investment Strategy Report April 2017 22
profit reaching 21% and 47%, respectively. In 2017, with the contribution of the hydro power segment, we expect PC1's revenue and NPAT will rise 13.5% YoY and 3.2% YoY respectively. The correspondent EPS is 3,394 dong. This projection is higher than the projection in our 2017 strategy report due to good news on the progress of the completion of two new hydropower plants. The progress of these two plants has been faster than expected and total investment value would be lower than planned. In addition, the positive news from the export of steel products also helps to raise the outlook for 2017.
Following the recovery of real estate and construction sectors, we expect that demand on construction materials will witness a strong growth in the second half of the year when construction activities are accelerated. Viglacera Tien Son Joint Stock Company (HNX: VIT) with 11% market share of high quality granite tiles and Pacific Dinco Joint Stock Company (HNX: PDB) with the main product of fresh concrete are both companies that we are optimistic about. For mining companies, the prospects of extending the mine's working life or acquiring new mine will be the information that should be closely followed before making investment decision. For medium-term investment purposes, these are shares that RongViet Research thinks investors can screen.
Within the consumer goods segment, RongViet highly appreciates the growth potential of Phu Nhuan Jewelry Joint Stock Company (PNJ – HSX). Overall, the jewelry market has experienced stable growth in recent years. Meanwhile, branded jewelry has experienced a faster growth rate and gained the market share from small businesses (approximately 12,000 companies, account for ~80% of total jewelry market share). PNJ is proactively expanding its chains, laying the foundation to meet the increasing demand from high-income customers as well as the rising trend of jewelry consumption. Over the last 5 years, PNJ’s distribution network has covered 50 cities and provinces with 28% market share. The company’s profit also doubled during that period. In 2017, RongViet Research forecasts that PNJ’s NPAT will grow by 39% YoY, equivalent EPS is VND 6,375 (higher than our previous estimation due to the adjustment of welfare expenses). Furthermore, PNJ has plan to make a private placement (10%) for a domestic strategic partner. As a result, the room for foreign investors of PNJ is estimated to increase by 4.8 million shares. Because the room for foreign ownership in PNJ has reached the celling, it could be the catalyst for the increase in its stock price.
Global rubber prices returned to a declining trend in March, which has negatively impacted the price of natural rubber stocks, such as PHR. Particularly, the average rubber price reached USD2.73/kg in Q1 2017, doubling over the same period last year. We estimate that if there is no change in ANPRC’s cutting supply policy on rubber production and climate changes, the current price range of natural rubber will remain until the end of this year. Therefore, we assume that the average selling prices this year will up by 50% YoY. This would strongly support PHR’s earnings, especially when its output is stable. Moreover, aside from the core business which is latex exploitation, profit from other segments (tree liquidation and investment in industrial zones) will improve the overall picture of PHR. At the current stock price, PHR is trading at a forward PER of 8.3x, relatively low compared to the average PER of 9-10x of the rubber industry. Hence, PHR is another candidate that we should pay closely attention, especially during the declining trend of latex prices.
The information about 2016 audited financial statements, seasonal effects of the 2017 AGM and Q1 2017 business results of listed companies will continue to dominate the stock market in April. Given that the market may form a short-term peak after the rally experienced from the beginning of this month, we think that this will be a good time for investors to review and restructure their portfolio: profit-taking stocks that sharply grew and selectively accumulate stocks having bright prospect in the remaining time of 2017.
Rong Viet Securities Corporation – Investment Strategy Report April 2017 23
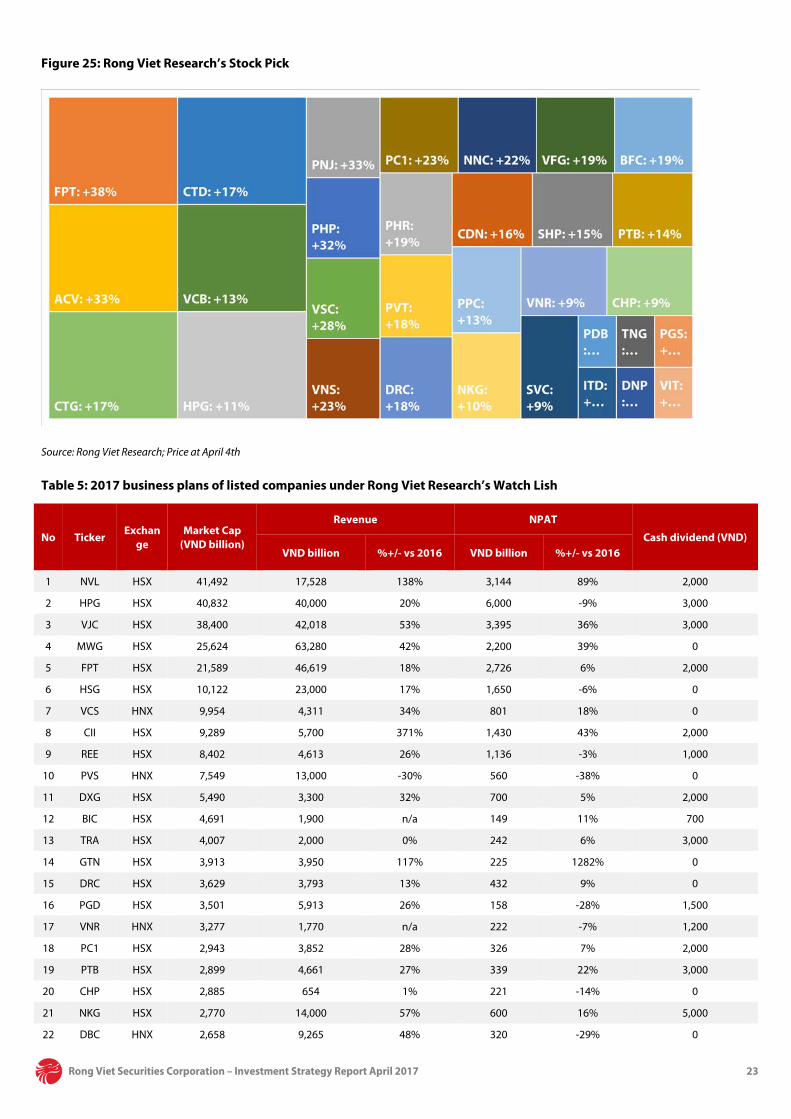
Figure 25: Rong Viet Research’s Stock Pick
Source: Rong Viet Research; Price at April 4th
Table 5: 2017 business plans of listed companies under Rong Viet Research’s Watch Lish
No Ticker Exchan
ge Market Cap
(VND billion)
Revenue NPAT
Cash dividend (VND) VND billion %+/- vs 2016 VND billion %+/- vs 2016
1 NVL HSX 41,492 17,528 138% 3,144 89% 2,000
2 HPG HSX 40,832 40,000 20% 6,000 -9% 3,000
3 VJC HSX 38,400 42,018 53% 3,395 36% 3,000
4 MWG HSX 25,624 63,280 42% 2,200 39% 0
5 FPT HSX 21,589 46,619 18% 2,726 6% 2,000
6 HSG HSX 10,122 23,000 17% 1,650 -6% 0
7 VCS HNX 9,954 4,311 34% 801 18% 0
8 CII HSX 9,289 5,700 371% 1,430 43% 2,000
9 REE HSX 8,402 4,613 26% 1,136 -3% 1,000
10 PVS HNX 7,549 13,000 -30% 560 -38% 0
11 DXG HSX 5,490 3,300 32% 700 5% 2,000
12 BIC HSX 4,691 1,900 n/a 149 11% 700
13 TRA HSX 4,007 2,000 0% 242 6% 3,000
14 GTN HSX 3,913 3,950 117% 225 1282% 0
15 DRC HSX 3,629 3,793 13% 432 9% 0
16 PGD HSX 3,501 5,913 26% 158 -28% 1,500
17 VNR HNX 3,277 1,770 n/a 222 -7% 1,200
18 PC1 HSX 2,943 3,852 28% 326 7% 2,000
19 PTB HSX 2,899 4,661 27% 339 22% 3,000
20 CHP HSX 2,885 654 1% 221 -14% 0
21 NKG HSX 2,770 14,000 57% 600 16% 5,000
22 DBC HNX 2,658 9,265 48% 320 -29% 0

Rong Viet Securities Corporation – Investment Strategy Report April 2017 24
No Ticker Exchan
ge Market Cap
(VND billion)
Revenue NPAT
Cash dividend (VND) VND billion %+/- vs 2016 VND billion %+/- vs 2016
23 VSC HSX 2,633 1,150 6% 216 -18% 2,500
24 IMP HSX 2,562 1,260 25% 128 27% 0
25 PTI HNX 2,130 3,466 n/a 117 8% 0
26 PHR HSX 2,025 1,328 13% 217 -3% 1,500
27 BFC HSX 1,967 6,850 15% 336 -4% 0
28 AAA HSX 1,413 2,900 35% 200 40% 3,000
29 NBB HSX 1,334 1,000 2326% 72 61% 0
30 SVC HSX 1,249 14,500 6% 200 15% 1,200
31 CTI HSX 1,247 1,426 35% 146 22% 1,700
32 TCM HSX 1,142 3,243 6% 178 55% 0
33 STK HSX 937 1,915 41% 87 205% 1,500
34 HAH HSX 891 622 28% 150 12% 2,000
35 PGS HNX 880 4,746 -5% 100 -71% 0
36 CNG HSX 877 981 10% 81 -33% 0
37 SMC HSX 761 10,550 12% 150 -59% 800
38 TCT HSX 729 147 7% 64 -7% 3,000
39 PMC HNX 708 415 0% 66 -10% 0
40 INN HNX 680 900 2% 72 1% 1,600
41 SRF HSX 680 1,700 29% 77 -20% 2,000
42 VPH HSX 583 873 103% 170 110% 1,000
43 SVI HSX 576 1,500 9% 76 2% 2,000
44 FMC HSX 576 3,375 10% 80 -22% 3,000
45 DHT HNX 549 1,020 -15% 36 -37% 2,000
46 C32 HSX 549 620 19% 90 -4% 2,400
47 HDC HSX 478 605 26% 64 8% 0
48 TIP HSX 429 141 -27% 49 -22% 1,500
49 PVC HNX 390 2,660 -13% 18 -153% 0
50 QBS HSX 381 3,900 -13% 85 309% 500
51 GSP HSX 368 1,252 10% 42 -10% 0
52 SFI HSX 353 600 7% 48 -14% 1,500
53 APC HSX 282 117 6% 34 -17% 0
54 LAF HSX 177 900 3% 22 -13% 0
55 DNM HNX 109 225 0% 16 8% 0
Source: FiinPro

Rong Viet Securities Corporation – Investment Strategy Report April 2017 25
HIGHLIGHT STOCKS
Financial Valuation Div
Yield (%)
Trading
2017F 2018F
Ticker Subsector Target
price (VND)
Price @ Apr 4th (VND)
Rating Time horizon +/-
Rev. (%)
+/- NPAT (%)
+/- Rev. (%)
+/- NPAT (%)
PER Trailing
(x)
PBR Cur. (x)
PER 2017F
(x)
+/- Price 1y
(%)
3-month avg. daily
vol. (shares)
3-month avg. daily turnover (VND mn)
Market cap (VND bn)
Foreign remaining
room (%)
PDB Building Materials 29,900 19,400 Buy Long-term 15.9 22.7 8.4 16.8 5.6 1.3 4.8 15.5 -9.9 22,457 445 157 37.5
FPT Software 64,800 47,000 Buy Intermediate-
term 15.9 24.0 12.9 17.6 10.8 2.3 8.7 4.3 20.8 1,070,763 49,406 21,589 0.0
PHP Transportation
Services 20,800 15,700 Buy
Intermediate-term
-0.6 6.5 8.0 9.6 11.1 1.5 11.9 5.1 -28.1 6,470 105 5,133 48.6
ACV Transportation
Services 67,000 50,400 Buy Long-term 16.2 37.9 17.1 26.3 50.0 4.3 22.9 1.0 0.0 323,717 16,417 108,989 45.6
VSC Transportation
Services 73,700 57,800 Accumulate Long-term 18.2 23.8 6.0 9.6 10.5 2.0 9.4 6.1 11.5 112,142 6,589 2,633 0.0
PC1 Heavy
Construction 48,000 39,100 Buy
Intermediate-term
9.9 -3.0 48.1 106.1 8.7 1.5 12.3 0.0 0.0 199,228 7,647 2,943 24.2
TNG Clothing & Accessories
17,000 13,800 Buy Intermediate-
term 17.0 16.5 10.5 11.1 5.6 0.9 5.8 0.0 -14.7 120,926 1,618 473 26.9
ITD Computer Services
33,900 26,900 Buy Intermediate-
term 19.9 19.0 -100.0 -100.0 6.3 1.7 6.3 2.2 67.9 121,457 3,229 513 33.0
VNS Travel & Tourism 34,500 28,000 Buy Intermediate-
term 2.3 4.5 11.6 9.8 6.1 1.2 5.9 12.5 15.9 74,273 2,274 1,900 3.5
NNC General Mining 90,100 73,600 Buy Intermediate-
term 23.5 25.7 8.1 3.4 6.6 3.0 7.1 4.4 50.7 27,159 2,022 1,210 28.5
PVT Marine
Transportation 15,400 13,050 Accumulate Long-term 6.2 1.3 10.6 10.0 8.8 1.0 9.3 6.1 49.5 611,987 7,843 3,673 25.1
PNJ Clothing & Accessories
90,900 74,100 Accumulate Long-term 15.3 39.3 11.9 19.2 16.2 4.9 12.5 1.3 59.1 96,339 7,175 7,282 0.0
DNP Building Materials 29,600 26,000 Neutral Long-term 35.1 43.6 17.6 10.8 6.2 1.8 6.0 0.0 33.0 37,367 894 780 45.6
BFC Specialty Chemicals
41,000 34,400 Accumulate Long-term 17.8 18.4 15.8 10.1 7.1 2.2 6.7 8.7 61.8 239,267 8,139 1,967 30.5
HPG Diversified Industrials
36,300 32,300 Neutral Long-term 30.7 13.2 19.4 4.4 6.2 1.4 3.6 0.0 96.8 3,810,567 158,222 40,832 12.7
PGS Gas Distribution 20,900 17,600 Accumulate Intermediate-
term 23.2 -65.5 9.7 9.3 2.6 0.9 7.5 7.1 14.0 362,022 6,345 880 31.3
VFG Specialty
Chemicals 90,700 76,000 Accumulate Long-term 9.6 16.2 6.1 7.6 9.4 1.8 9.1 4.6 29.3 12,602 957 1,390 27.6
TCM Clothing & Accessories
25,300 23,250 Neutral Long-term 6.2 55.6 1.9 7.4 10.0 1.3 7.6 2.2 -13.0 505,881 9,873 1,142 0.0

Rong Viet Securities Corporation – Investment Strategy Report April 2017 26
CTG Banks 21,000 17,950 Accumulate Long-term 8.2 17.8 7.4 14.5 9.8 1.1 8.3 3.9 13.4 1,852,970 33,900 66,835 0.0
SHP Alternative Electricity
22,800 19,800 Accumulate Intermediate-
term 17.3 67.3 1.8 7.8 18.9 1.6 11.8 8.1 16.3 22,995 457 1,856 45.2
DRC Tires 35,900 30,550 Accumulate Long-term 17.4 -1.3 14.4 7.9 9.2 2.3 10.1 7.4 -0.6 335,300 10,673 3,629 18.3
PHR Commodity Chemicals
30,600 25,800 Accumulate Intermediate-
term 61.0 48.6 20.0 11.0 9.3 0.9 8.0 3.9 60.6 860,282 25,396 2,025 45.4
CDN Transportation
Services 27,200 23,400 Accumulate
Intermediate-term
16.0 8.9 26.9 4.3 12.1 1.9 12.0 4.3 0.0 3,010 75 1,544 48.6
NKG Iron & Steel 46,110 41,950 Neutral Intermediate-
term 62.0 29.0 14.6 10.4 4.3 1.8 4.6 0.0 241.1 281,410 10,572 2,770 19.5
CTD Heavy
Construction 237,700 204,000 Accumulate Long-term 30.4 22.2 9.9 9.8 9.4 2.5 9.6 2.7 53.5 189,610 36,792 15,705 6.4
VCB Banks 41,700 36,800 Neutral Long-term 7.7 14.1 12.9 32.0 19.4 2.8 16.6 2.7 23.9 1,289,792 49,101 132,398 9.3
PPC Conventional
Electricity 19,400 17,150 Neutral Long-term 17.7 33.0 1.8 -3.3 9.9 1.1 8.1 14.9 13.9 122,863 2,087 5,456 32.4
VIT Building Materials 36,000 32,000 Neutral Long-term 17.8 18.2 33.4 25.7 8.4 2.1 7.5 4.7 46.0 31,525 914 480 46.6
PTB Furnishings 153,600 134,200 Accumulate Intermediate-
term 25.6 25.5 16.1 9.8 10.3 3.8 9.7 0.0 67.8 64,346 8,507 2,899 38.2
CHP Alternative Electricity
25,000 22,900 Neutral Intermediate-
term 16.6 31.6 -5.9 -6.4 11.2 1.7 8.5 7.0 0.0 120,162 2,648 2,885 45.6
CTI Heavy
Construction 31,500 29,000 Neutral Long-term 19.2 7.2 12.8 22.3 9.7 1.8 15.9 5.0 48.2 398,823 10,631 1,247 20.2
SVC Specialty Retailers 54,500 50,000 Neutral Long-term 11.2 20.4 -5.0 4.5 10.2 1.4 9.4 3.2 71.5 94,507 4,726 1,249 8.7
MBB Banks 16,500 15,450 Neutral Long-term -0.4 5.7 9.3 16.2 9.1 1.0 8.6 5.8 20.0 1,064,494 15,564 26,462 0.0
VNR Reinsurance 27,300 25,000 Neutral Long-term 18.2 9.7 4.3 6.8 13.7 1.2 12.5 6.0 42.8 240,102 5,935 3,277 19.2
VNM Food Products 151,800 144,000 Neutral Long-term 19.9 12.1 13.4 10.9 22.3 9.4 22.2 1.7 33.9 1,506,049 199,392 209,004 45.6
HSG Diversified Industrials
51,700 51,500 Neutral Intermediate-
term 31.7 -0.5 17.6 22.2 5.8 2.2 6.2 5.3 132.5 1,543,721 76,741 10,122 20.0
REE Diversified Industrials
28,300 27,100 Neutral Long-term 20.4 21.5 9.6 21.3 7.7 1.2 7.0 3.0 38.7 1,177,639 31,380 8,402 0.0
PGI Full Line
Insurance 24,900 23,600 Neutral Long-term 10.3 55.5 13.2 -13.5 16.3 1.8 10.6 2.1 52.3 236,067 5,456 1,675 47.8
DPM Specialty Chemicals 25,000 23,950 Neutral Long-term 16.4 4.9 20.5 -3.8 8.2 1.2 9.2 8.4 -5.8 970,087 23,673 9,373 28.7
PAC Auto Parts 36,800 38,200 Neutral Intermediate-
term 19.4 0.5 12.4 10.5 14.6 3.1 15.8 4.7 75.8 205,189 7,133 1,775 22.3
BMP Building Materials 208,400 196,000 Neutral Long-term 11.2 7.9 13.1 10.0 14.2 3.9 14.6 4.0 41.9 76,171 14,786 8,914 0.3
NT2 Conventional
Electricity 31,900 31,900 Neutral Long-term -13.2 -10.6 4.5 0.3 8.4 1.9 9.9 8.3 15.4 393,982 11,939 9,183 26.9
ACB Banks 24,500 25,300 Neutral Long-term 11.4 21.9 27.9 46.2 18.8 1.7 17.0 0.0 52.1 2,522,565 59,110 24,943 0.0

Rong Viet Securities Corporation – Investment Strategy Report April 2017 27
NLG Real Estate Holding &
Development 26,100 26,850 Neutral Long-term 29.0 39.3 -30.6 -33.3 11.0 1.5 9.0 1.9 22.9 408,801 9,865 3,816 4.6
GMD Transportation
Services 33,000 34,300 Neutral
Intermediate-term
11.0 26.3 22.3 26.8 15.8 1.2 21.0 5.8 42.4 954,608 31,449 6,155 0.0
HT1 Building Materials 21,200 22,400 Neutral Long-term 6.6 13.7 5.2 6.7 10.6 1.6 10.9 0.0 9.7 333,561 7,025 8,547 39.7
VGC Building Materials 14,600 16,400 Reduce Long-term 7.9 17.3 13.6 9.1 9.0 1.3 8.8 4.3 0.0 191,376 2,855 5,035 39.9
VJC Airlines 121,000 131,000 Neutral Long-term 41.5 36.0 22.0 25.2 15.2 8.1 13.6 -0.8 0.0 647,087 82,966 38,400 5.5
DHG Pharmaceuticals 125,400 135,900 Neutral Long-term 12.4 10.0 9.7 9.2 16.7 4.1 17.3 2.6 66.8 116,440 13,841 11,846 0.0
IMP Pharmaceuticals 54,900 65,600 Sell Long-term 24.6 33.5 18.4 17.8 19.4 1.9 21.3 3.0 53.0 59,543 3,566 2,563 1.7
MWG Electronic
Equipment 134,500 166,500 Sell
Intermediate-term
63.2 41.4 35.9 16.5 15.5 6.7 13.7 0.9 126.3 213,624 35,951 25,624 0.0
SAB Brewers 158,400 200,400 Sell Long-term 11.2 4.2 12.9 4.2 28.7 11.3 29.3 1.0 0.0 94,621 20,058 128,513 39.2

Rong Viet Securities Corporation – Investment Strategy Report April 2017 28
MACRO WATCH
Headline inflation increased sharply in October Retail sales maintained stable
Source: GSO, Rongviet Securities Source: GSO, Rongviet Securities
Manufacturing improved slightly Trade growth also improved
Source: GSO, Rongviet Securities Source: GSO, Rongviet Securities
Winning /offering ratio was the highest in October Vietnamese consumer confidence unchanged
Source : VBMA, Rongviet Securities Source: Nielsen, Rongviet Securities
-1%
0%
1%
2%
3%
4%
5%
04/2
015
05/2
015
06/2
015
07/2
015
08/2
015
09/2
015
10/2
015
11/2
015
12/2
015
01/2
016
02/2
016
03/2
016
04/2
016
05/2
016
06/2
016
07/2
016
08/2
016
09/2
016
10/2
016
Headline inflation Core inflation
230
240
250
260
270
280
290
300
310
0%
2%
4%
6%
8%
10%
12%
14%
01/2
015
02/2
015
03/2
015
04/2
015
05/2
015
06/2
015
07/2
015
08/2
015
09/2
015
10/2
015
11/2
015
12/2
015
01/2
016
02/2
016
03/2
016
04/2
016
05/2
016
06/2
016
07/2
016
08/2
016
Retail Sales Growth
-10.0
-5.0
.0
5.0
10.0
44
46
48
50
52
54
56
Jan-
15
Mar
-15
May
-15
Jul-1
5
Sep-
15
Nov
-15
Jan-
16
Mar
-16
May
-16
Jul-1
6
Sep-
16
PMI IP (3m moving average)
-10%
-5%
0%
5%
10%
15%
20%
25%
30%
01/1
5
03/1
5
05/1
5
07/1
5
09/1
5
11/1
5
01/1
6
03/1
6
05/1
6
07/1
6
09/1
6
Export Import
0%
20%
40%
60%
80%
100%
120%
0
10,000
20,000
30,000
40,000
50,000
60,000
01/2
016
02/2
016
03/2
016
04/2
016
05/2
016
06/2
016
07/2
016
08/2
016
09/2
016
10/2
016
Winning volume Offering volume
Winning/Offering Ratio
90
95
100
105
110
115
99 98 102 106 112 104 105 108 109 107 107
Q1/14Q2/14Q3/14Q4/14Q1/15Q2/15Q3/15Q4/15Q1/16Q2/16Q3/16

Rong Viet Securities Corporation – Investment Strategy Report April 2017 29
INDUSTRY INDEX
Level 1 industry movement Level 2 industry movement
Source: RongViet Research Source: RongViet Research
Industry PE comparison Industry PB comparison
Source: RongViet Research Source: RongViet Research
DISCLAIMERS
-5%
9%
-9%
2%
-8% 0% -3% -7% -4% -5%
-10%
-8%
-6%
-4%
-2%
0%
2%
4%
6%
8%
10%
Tech
nolo
gy
Indu
stria
ls
Oil
& G
as
Cons
umer
Ser
vice
s
Hea
lth C
are
Cons
umer
Goo
ds
Bank
s
Basi
c M
ater
ials
Fina
ncia
ls
Util
ities
3%-8%
-3%-5%
-9%-3%
-5%-3%
-4%-5%
-4%-3%
8%-8%
0%2%
17%-8%
-20% -10% 0% 10% 20%
Retail
Insurance
Real Estate
Technology
Oil & Gas
Financial Services
Utilities
Travel & Leisure
Industrial Goods & Services
Personal & Household Goods
Chemicals
Banks
Automobiles & Parts
Construction & Materials
Food & Beverage
Media
Basic Resources
Health Care
10.0
14.516.2
13.415.0
20.1
12.7
8.4
19.621.4
17.1
11.5
Tech
nolo
gy
Indu
stria
ls
Oil
& G
as
Cons
umer
Serv
ices
Hea
lth C
are
Cons
umer
Goo
ds
Bank
s
Basi
c M
ater
ials
Fina
ncia
ls
Util
ities
HSX
HN
X
2.1
3.2
0.7
5.0
3.1
5.6
1.7 1.6
2.8 2.8
3.4
1.6
Tech
nolo
gy
Indu
stria
ls
Oil
& G
as
Cons
umer
Ser
vice
s
Hea
lth C
are
Cons
umer
Goo
ds
Bank
s
Basi
c M
ater
ials
Fina
ncia
ls
Util
ities
HSX
HN
X
INDUSTRY INDICATOR

Rong Viet Securities Corporation – Investment Strategy Report April 2017 30
This report is prepared in order to provide information and analysis to clients of Rong Viet Securities only. It is and should not be construed as an offer to sell or a solicitation of an offer to purchase any securities. No consideration has been given to the investment objectives, financial situation or particular needs of any specific. The readers should be aware that Rong Viet Securities may have a conflict of interest that can compromise the objectivity this research. This research is to be viewed by investors only as a source of reference when making investments. Investors are to take full responsibility of their own decisions. VDSC shall not be liable for any loss, damages, cost or expense incurring or arising from the use or reliance, either full or partial, of the information in this publication.
The opinions expressed in this research report reflect only the analyst's personal views of the subject securities or matters; and no part of the research analyst's compensation was, is, or will be, directly or indirectly, related to the specific recommendations or opinions expressed in the report.
The information herein is compiled by or arrived at Rong Viet Securities from sources believed to be reliable. We, however, do not guarantee its accuracy or completeness. Opinions, estimations and projections expressed in this report are deemed valid up to the date of publication of this report and can be subject to change without notice.
This research report is copyrighted by Rong Viet Securities. All rights reserved. Therefore, copy, reproduction, republish or redistribution by any person or party for any purpose is strictly prohibited without the written permission of VDSC.
IMPORTANT DISCLOSURES FOR U.S. PERSONS
This research report was prepared by Viet Dragon Securities Corp. (“VDSC”), a company authorized to engage in securities activities in Vietnam. VDSC is not a registered broker-dealer in the United States and, therefore, is not subject to U.S. rules regarding the preparation of research reports and the independence of research analysts. This research report is provided for distribution to “major U.S. institutional investors” in reliance on the exemption from registration provided by Rule 15a-6 of the U.S. Securities Exchange Act of 1934, as amended (the “Exchange Act”).
Any U.S. recipient of this research report wishing to effect any transaction to buy or sell securities or related financial instruments based on the information provided in this research report should do so only through Rosenblatt Securities Inc., 40 Wall Street 59th Floor, New York, NY 10005, a registered broker dealer in the United States. Under no circumstances should any recipient of this research report effect any transaction to buy or sell securities or related financial instruments through VDSC. Rosenblatt Securities Inc. accepts responsibility for the contents of this research report, subject to the terms set out below, to the extent that it is delivered to a U.S. person other than a major U.S. institutional investor.
The analyst whose name appears in this research report is not registered or qualified as a research analyst with the Financial Industry Regulatory Authority (“FINRA”) and may not be an associated person of Rosenblatt Securities Inc. and, therefore, may not be subject to applicable restrictions under FINRA Rules on communications with a subject company, public appearances and trading securities held by a research analyst account.
Ownership and Material Conflicts of Interest
Rosenblatt Securities Inc. or its affiliates does not ‘beneficially own,’ as determined in accordance with Section 13(d) of the Exchange Act, 1% or more of any of the equity securities mentioned in the report. Rosenblatt Securities Inc, its affiliates and/or their respective officers, directors or employees may have interests, or long or short positions, and may at any time make purchases or sales as a principal or agent of the securities referred to herein. Rosenblatt Securities Inc. is not aware of any material conflict of interest as of the date of this publication.
Compensation and Investment Banking Activities
Rosenblatt Securities Inc. or any affiliate has not managed or co-managed a public offering of securities for the subject company in the past 12 months, nor received compensation for investment banking services from the subject company in the past 12 months, neither does it or any affiliate expect to receive, or intends to seek compensation for investment banking services from the subject company in the next 3 months.
Additional Disclosures
This research report is for distribution only under such circumstances as may be permitted by applicable law. This research report has no regard to the specific investment objectives, financial situation or particular needs of any specific recipient, even if sent only to a single recipient. This research report is not guaranteed to be a complete statement or summary of any securities, markets, reports or developments referred to in this research report. Neither VDSC nor any of its directors, officers, employees or agents shall have any liability, however arising, for any error, inaccuracy or incompleteness of fact or opinion in this research report or lack of care in this research report’s preparation or publication, or any losses or damages which may arise from the use of this research report.

Rong Viet Securities Corporation – Investment Strategy Report April 2017 31
VDSC may rely on information barriers, such as “Chinese Walls” to control the flow of information within the areas, units, divisions, groups, or affiliates of VDSC.
Investing in any non-U.S. securities or related financial instruments (including ADRs) discussed in this research report may present certain risks. The securities of non-U.S. issuers may not be registered with, or be subject to the regulations of, the U.S. Securities and Exchange Commission. Information on such non-U.S. securities or related financial instruments may be limited. Foreign companies may not be subject to audit and reporting standards and regulatory requirements comparable to those in effect within the United States.
The value of any investment or income from any securities or related financial instruments discussed in this research report denominated in a currency other than U.S. dollars is subject to exchange rate fluctuations that may have a positive or adverse effect on the value of or income from such securities or related financial instruments.
Past performance is not necessarily a guide to future performance and no representation or warranty, express or implied, is made by VDSC with respect to future performance. Income from investments may fluctuate. The price or value of the investments to which this research report relates, either directly or indirectly, may fall or rise against the interest of investors. Any recommendation or opinion contained in this research report may become outdated as a consequence of changes in the environment in which the issuer of the securities under analysis operates, in addition to changes in the estimates and forecasts, assumptions and valuation methodology used herein.
No part of the content of this research report may be copied, forwarded or duplicated in any form or by any means without the prior.
Hanoi Branch
2C Thai Phien St., Hai Ba Trung Dist, Hanoi City
Tel: (84 4) 6288 2006
Fax: (84 4) 6288 2008
Can Tho Branch
95-97-99 Vo Van Tan – Ninh Kieu - Can Tho
Tel: (84 71) 381 7578
Fax: (84 71) 381 8387
Nha Trang Branch
50Bis Yersin St, Nha Trang
Tel: (84 58) 382 0006
Fax: (84 58) 382 0008
VIET DRAGON SECURITIES CORPORATION
Floor 1-2-3-4, Viet Dragon Tower,
141 Nguyen Du St. - Dist 1 – HCMC
Tel: (84 8) 6299 2006
Fax: (84 8) 6291 7986
Email: [email protected]
Website: www.vdsc.com.vn