Road Network Upgrading and Overland Trade Expansion … docs/Trans-Africa Network (Color...
59
Road Network Upgrading and Overland Trade Expansion in Sub-Saharan Africa Piet Buys* Uwe Deichmann David Wheeler Development Research Group World Bank February, 2006 * Authors’ names in alphabetical order. The authors are respectively Consultant, Senior Environmental Specialist and Lead Economist, Development Research Group, World Bank. Our thanks to the following World Bank colleagues for valuable comments and suggestions: Alan Winters (DECRG), Zmarak Shalizi (DECRG), Benno Ndulu (AFRVP), Sanjivi Rajasingham (AFTTR), Anil Bhandari (AFTTR), Lawrence Hinkle (AFTPM), Elke Kreuzwieser (AFTPM), Vivien Foster (AFTPI) and Cecilia Briceno- Garmendia (AFTPI). The findings, interpretations, and conclusions expressed in this paper are entirely those of the authors. They do not necessarily represent the view of the World Bank, its Executive Directors, or the countries they represent.
Transcript of Road Network Upgrading and Overland Trade Expansion … docs/Trans-Africa Network (Color...

Road Network Upgrading and Overland Trade Expansion in Sub-Saharan Africa
Piet Buys* Uwe Deichmann David Wheeler
Development Research Group World Bank
February, 2006
* Authors’ names in alphabetical order. The authors are respectively Consultant, Senior Environmental Specialist and Lead Economist, Development Research Group, World Bank. Our thanks to the following World Bank colleagues for valuable comments and suggestions: Alan Winters (DECRG), Zmarak Shalizi (DECRG), Benno Ndulu (AFRVP), Sanjivi Rajasingham (AFTTR), Anil Bhandari (AFTTR), Lawrence Hinkle (AFTPM), Elke Kreuzwieser (AFTPM), Vivien Foster (AFTPI) and Cecilia Briceno-Garmendia (AFTPI). The findings, interpretations, and conclusions expressed in this paper are entirely those of the authors. They do not necessarily represent the view of the World Bank, its Executive Directors, or the countries they represent.
1
Abstract
Recent research suggests that isolation from regional and international markets has contributed significantly to poverty in many Sub-Saharan African countries. Numerous empirical studies identify poor transport infrastructure and border restrictions as significant deterrents to trade expansion. In response, the African Development Bank has proposed an integrated network of functional roads for the subcontinent. Drawing on new econometric results, this paper quantifies the trade-expansion potential and costs of such a network. We use spatial network analysis techniques to identify a network of primary roads connecting all Sub-Saharan capitals and other cities with populations over 500,000. We estimate current overland trade flows in the network, using econometrically-estimated gravity model parameters, road transport quality indicators, actual road distances, and estimates of economic scale for cities in the network. Then we simulate the effect of feasible continental upgrading by setting network transport quality at a level that is functional, but less highly-developed than existing roads in countries like South Africa and Botswana. We assess the costs of upgrading with econometric evidence from a large World Bank database of road project costs in Africa. Using a standard approach to forecast error estimation, we derive a range of potential benefits and costs. Our baseline results indicate that continental network upgrading would expand overland trade by about $250 billion over 15 years, with major direct and indirect benefits for the rural poor. Financing the program would require about $20 billion for initial upgrading and $1 billion annually for maintenance. We conclude with a discussion of supporting institutional arrangements and the potential cost of implementing them.
2
1. Introduction
This paper presents evidence on the trade-expansion potential of improvements in
Sub-Saharan Africa’s road network. The impetus for our work is well-summarized by
the following description of a trucker’s journey in Cameroon:
“The plan was to carry 1,600 crates of Guinness and other drinks from the factory in Douala where they were brewed to Bertoua, a small town in Cameroon's south-eastern rainforest. According to a rather optimistic schedule, it should have taken 20 hours, including an overnight rest. It took four days. When the truck arrived, it was carrying only two-thirds of its original load. …we were stopped at road-blocks 47 times. … Our road was rendered impassable by rain three times, causing delays of up to four hours. The Cameroonian government has tried to grapple with the problem of rain eroding roads by erecting a series of barriers … that stop heavy trucks from passing while it is pouring. … Early on the second evening … we met a [locked] rain barrier in the middle of the forest. It was dark, and the man with the key was not there. ,,, he returned shortly before midnight. The hold-up was irritating, but in the end made no difference. Early the next morning, a driver coming in the opposite direction told us that the bridge ahead had collapsed, so we had to turn back. (The Economist (2002))1
In this case, the driver did not even face a long wait at a border station. According
to the African Development Bank (ADB, 2003), roadblocks and border controls add four
to seven days to the three-day trip from Bangui, Central African Republic, to Douala,
Cameroon. The ADB also estimates that a loaded truck on the Bangui-Douala road pays
about $580 at local barricades en route.
Similar conditions prevail in much of the subcontinent, and overland transport is so
difficult and costly that Africa’s diverse regions remain largely isolated from one another.
Overland trade between the large urban centers of West Africa and South Africa is
basically nonexistent. Within many countries, abundant fertile soil lies fallow because
hauling produce to market is too expensive, time-consuming and dangerous for truckers.
1 According to one critique of this story, some roads traveled were particularly bad because the trucker avoided parts of the main road where roadblock costs were even higher. In any case, the critique reinforces the main point. Our thanks to our colleague Elke Kreuzwieser for drawing our attention to this.

3
Numerous empirical studies have examined the economic impact of poor roads.2 Amjadi
& Yeats (1995) find that the relatively low level of Sub-Saharan African exports is
essentially due to high transport costs. In a study of transport costs and trade, Limao &
Venables (2000) find that poor infrastructure accounts for 60% of transport costs for
landlocked countries, as opposed to 40% for coastal countries.
Simuyemba (2000) has responded to this problem by calling for a more integrated
approach to infrastructure planning in Africa:
… Africa needs a deliberate, systematic and concerted effort at the practical level to integrate, upgrade and modernize regional infrastructure so that it becomes the catalyst for Africa’s growth. The regionally integrated corridor approach offers prospects for speedier integration of infrastructure systems in Africa. The vision and ultimate objective for Africa should be to create a single market of 750 million people that is competitive within itself and within the global economy. A critical pre-requisite to this is regional infrastructure integration across Africa.
The World Bank and the African Development Bank (ADB) have both launched
initiatives to encourage more integrated infrastructure development. The Bank’s Sub-
Saharan Africa Transport Policy Program (SSATP) has focused on regional and national
programs for transport development (World Bank, 2003). The ADB has proposed
development of a transcontinental road network, with seven major road corridors in Sub-
Saharan Africa (ADB, 2003). Figure 1 depicts the ADB’s proposed road network.
How much difference would an integrated, functional road network make for
African development? This paper extends the previously-cited work by quantifying the
economics of continental road network upgrading. Specifically, we use econometric
evidence and spatial network analysis techniques to explore the relationship between road
transport quality and overland trade in Sub-Saharan Africa.
2 See Henderson, Shalizi & Venables (2001) for a review of the literature

4
Figure 1: The ADB’s Proposed Highway Corridors in Sub-Saharan Africa
We employ the conventional gravity model, which has provided a robust fit to the
data in many recent studies of trade flows between cities, countries and regions. In this
model, the volume of trade between two areas is directly proportional to their economic
activity levels, and inversely proportional to the cost of transporting goods between them.
In Africa, the cost of overland transport is greatly magnified by bad roads, difficult
border crossings, and harassment of truckers at road blocks. Our modeling exercise
estimates the trade growth that would result from removal of these difficulties, as well as
the associated costs.

5
The remainder of the paper is organized as follows. Section 2 reviews the
theoretical and empirical literature on gravity models, highlighting evidence on overland
trade flows in developing countries. In Section 3, we use computer mapping to identify a
network of primary roads connecting all 42 mainland Sub-Saharan capitals, along with 41
other cities with populations over 500,000.3 Section 4 estimates a gravity model for Sub-
Saharan Africa, using inter-country trade data, road transport quality indicators, actual
road distances, and estimates of economic scale for trading partners. We use the results
to estimate current trade flows in the inter-city network, and to simulate the impact of a
major improvement in road network quality. We explore the implications of our results
for trade expansion at the regional, country and city levels. In Section 5 we estimate the
costs of network improvement, using a World Bank database of upgrading and
maintenance costs for hundreds of African road projects. Section 6 considers the
environmental implications of network upgrading, and suggests ways in which new data
on African biodiversity could be integrated into network planning. Drawing on our
empirical results, Section 7 considers the establishment of a consortium to finance,
administer and maintain the network. The consortium would join participating states and
donor institutions in a long-term collaboration for road improvement, relaxation of trade
restrictions, and overland trade expansion in Sub-Saharan Africa. Section 7 also
estimates the cost of operating the network-wide consortium for 15 years. Section 8
concludes the paper by summarizing our benefit and cost estimates, as well as offering
some thoughts on the feasibility of continental-scale upgrading.
3 Our analysis excludes Madagascar, Sao Tome and Principe, the Comoros, and other island states that are considered part of Sub-Saharan African.
6
2. Gravity Models of Trade
Empirical studies of transportation costs and trade often rely on the traditional
gravity model, which relates the volume of trade between cities, countries or regions to
their economic scales and the distance between them. In addition, some developing-
country studies adjust for the quality of road transport infrastructure:
(1) γ
αα
ij
Bijji
ijij d
qMEXkT
ji
)(=
where Tij = Trade volume between areas i and j. Ei = Economic scale of the exporting area Mj = Economic scale of the importing area qij = Quality of road transport between areas i and j dij = Road distance between areas i and j Xij = A vector of other trade-cost-related variables.
Distance proxies travel cost in developed-country gravity models, because road
quality is assumed to be uniformly high. In developing countries, where road conditions
vary greatly, the element [dγ/qβ] provides a closer approximation to the cost factor. The
adjustment factor k, a constant multiplier in the core gravity model, can also be related to
a vector of other relevant variables, Xij, such as indicators of linguistic, political and
economic ties between trading partners.
Empirical studies of the core gravity model, originated by Tinbergen (1962) and
Pöyhönen (1963), have since been rationalized from several theoretical perspectives.
Anderson (1979), Helpman and Krugman (1985), Bergstrand (1985, 1989, 1990), and
Rossi-Hansberg (2005) have all derived equation (1) from models of trade that include
imperfect competition and/or increasing returns to scale. Deardorff (1998) has derived
the same equation from two Heckscher-Ohlin cases: frictionless trade and trade in

7
heterogeneous goods.4 Recent empirical studies have fitted a variety of augmented
gravity models to international trade data. Frankel (1997) tests for the effects of a
common border, per capita GDP, a common language, and membership in regional
trading arrangements, as well as economic scale and distance. Rose (2000) augments
Frankel’s model by introducing colonial ties, exchange rate volatility and a common
currency. Soloaga and Winters (2001) provide a further control for effective distance, by
introducing a measure of generalized remoteness from all potential trade partners.
Carillo and Li (2002) include the effects of a common border and trade association
membership in a gravity-model analysis of Latin American trade. In an econometric
analysis of trade links among seven of eight West African Economic and Monetary
Union (WAEMU) countries5 and other states, Coulibaly and Fontagné (2004) augment
distance with measures of transport infrastructure quality: percent of roads that are paved
and quality of border-station customs services.6
Most of the cited econometric studies employ a log-transformation of the gravity
model:
(2) ijijijjiiij dqMEkT εγβα +++++= logloglogloglog 0
Estimation techniques vary with the cross-sectional and time series properties of the data.
The econometric results of Carillo and Li for Latin America and Coulibaly and Fontagné
for West Africa are of particular interest for this paper, because both focus on developing
regions. In addition, Coulibaly and Fontagné control for West African road infrastructure
4 For summaries of the relevant literature, see Yamarik and Ghosh (2005) and Feenstra, Markusen and Rose (2001). 5 The WAEMU countries are Togo, Benin, Cote d’Ivoire, Guinea Bissau, Senegal, Mali, Burkina Faso and Niger. Guinea-Bissau was excluded from the Coulibaly- Fontagné study because its foreign trade data were not available. 6 For other recent empirical work on intra-African trade, see Kirkpatrick and Watanabe (2005), Chauvin and Gaulier (2002), Longo and Sekkat (2004) and Musila (2005).
8
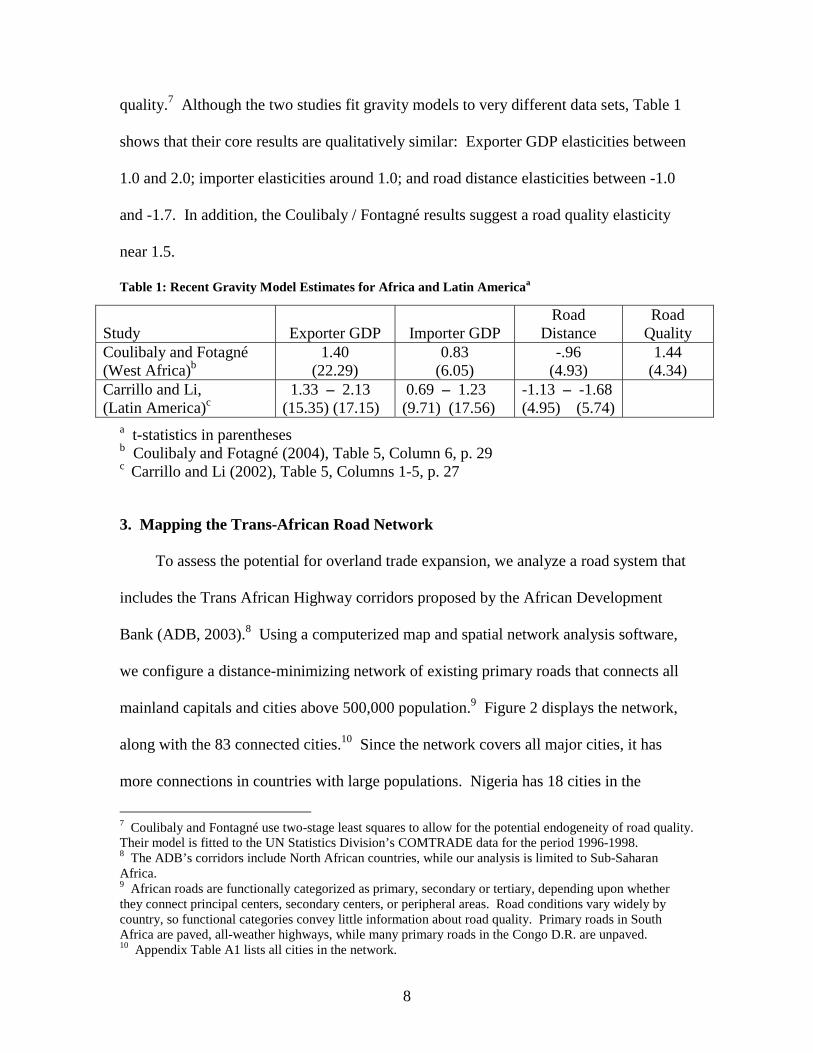
quality.7 Although the two studies fit gravity models to very different data sets, Table 1
shows that their core results are qualitatively similar: Exporter GDP elasticities between
1.0 and 2.0; importer elasticities around 1.0; and road distance elasticities between -1.0
and -1.7. In addition, the Coulibaly / Fontagné results suggest a road quality elasticity
near 1.5.
Table 1: Recent Gravity Model Estimates for Africa and Latin Americaa
a t-statistics in parentheses b Coulibaly and Fotagné (2004), Table 5, Column 6, p. 29 c Carrillo and Li (2002), Table 5, Columns 1-5, p. 27
3. Mapping the Trans-African Road Network
To assess the potential for overland trade expansion, we analyze a road system that
includes the Trans African Highway corridors proposed by the African Development
Bank (ADB, 2003).8 Using a computerized map and spatial network analysis software,
we configure a distance-minimizing network of existing primary roads that connects all
mainland capitals and cities above 500,000 population.9 Figure 2 displays the network,
along with the 83 connected cities.10 Since the network covers all major cities, it has
more connections in countries with large populations. Nigeria has 18 cities in the
7 Coulibaly and Fontagné use two-stage least squares to allow for the potential endogeneity of road quality. Their model is fitted to the UN Statistics Division’s COMTRADE data for the period 1996-1998. 8 The ADB’s corridors include North African countries, while our analysis is limited to Sub-Saharan Africa. 9 African roads are functionally categorized as primary, secondary or tertiary, depending upon whether they connect principal centers, secondary centers, or peripheral areas. Road conditions vary widely by country, so functional categories convey little information about road quality. Primary roads in South Africa are paved, all-weather highways, while many primary roads in the Congo D.R. are unpaved. 10 Appendix Table A1 lists all cities in the network.
Study
Exporter GDP
Importer GDP
Road Distance
Road Quality
Coulibaly and Fotagné (West Africa)b
1.40 (22.29)
0.83 (6.05)
-.96 (4.93)
1.44 (4.34)
Carrillo and Li, (Latin America)c
1.33 – 2.13 (15.35) (17.15)
0.69 – 1.23 (9.71) (17.56)
-1.13 – -1.68 (4.95) (5.74)

9
network, South Africa has 9, and Congo Democratic Republic has 6. The complete
network contains 885 road segments, joining 3,403 paired combinations of cities. Our
index of country road quality is determined by the following equation:
(3) 321 αααjjjj CGPQ =
where
Qj = Road quality index for country j Pj = Percent of roads that are paved in country j Gj = GDP per capita in country j (an index of capacity to maintain roads) Cj = The World Bank’s Country Policy and Institutional Capacity (CPIA) index for
transparency, accountability and corruption in country j (a proxy for delays and costs inflicted on truckers).11
Figure 2: Trans-African Network, Based on Existing Primary Roads
11 Data definitions are as follows: Pj: Paved roads (% of total roads), 1999 (World Bank, World Development Indicators 2004) Gj: GDP per capita 2001, PPP (constant 2000 international $) (World Development Indicators 2004) Cj: From the World Bank’s CPIA database, 2004

10
We believe that a mildly increasing-returns function (α1 = 0.8; α2 = 0.2; α3 = 0.2)
provides a reasonable approximation to road transport quality differentials in Sub-
Saharan Africa.12 Table 2 presents index values by country, normalized to 100 for the
highest-quality road transport (in South Africa). Estimated road quality for Botswana
(87.5) is over 20 times the quality for the Democratic Republic of the Congo (3.8). We
believe that this does not overstate the existing differential in average road speed, vehicle
depreciation on bad roads, harassment of truckers, payments at road blocks, and frontier
difficulties.13
4. Simulating Trade Flows in the Network
Our objective is to develop a gravity model for inter-city trade that can be used for
analysis of road improvement impacts at the country, regional and continental levels. We
begin by estimating a gravity model for Sub-Saharan Africa, using recent inter-country
trade data, road transport quality indicators, actual road distances, and estimates of
economic scale for trading partners.
12 The authors’ extensive experience with African roads suggests that “percent paved” alone is an inadequate proxy for road quality. Many stretches of “paved” road in Sub-Saharan Africa are in extremely poor condition, either because government revenues are insufficient to support proper maintenance, or corrupt officials have diverted the maintenance funds. We use per capita income and the CPIA corruption index to incorporate these factors, although we stay relatively close to the Coulibaly-Fontagné index by giving percent paved twice the combined weight of the other two factors in our road quality measure. We have made one adjustment to the published paved-road data, which assign South Africa a paved road percentage of 19.7 (in contrast to Botswana, with 54% and Zimbabwe, with 47.4%). We believe that this grossly misrepresents the relevant road conditions in South Africa, since its components of our primary network are all paved, first-class roads. To ensure a measure that is higher than those for Botswana and Zimbabwe, we have arbitrarily assigned South Africa a paved road percent of 60 for our index. This probably underestimates relative South African road quality. However, it has no effect on our results because we assume that South Africa’s roads (with a continental-maximum index score of 100) do not need improvement in the upgraded network. 13 Arbitrary rescaling of the road quality index in the log-log regression equation (2) does not affect the underlying marginal relationship between log (trade) and log (original road quality index). For example, substituting the square of the original road quality index (which doubles the original log value) will simply halve the regression coefficient. Using the square root of the index (which halves the original log value) will double the regression coefficient.

11
Table 2: Road Transport Quality Indices for Sub-Saharan Countries Country
Road Transport Quality Index
Country
Road Transport
Quality Index South Africa 100.0 Cameroon 18.4 Botswana 87.5 Mauritania 16.6 Zimbabwe 50.0 Mali 16.5 The Gambia 41.6 Kenya 16.3 Sudan 40.4 Angola 15.8 Togo 37.0 Ethiopia 15.1 Senegal 36.0 Cote d'Ivoire 14.4 Nigeria 32.3 Congo, Rep. 13.6 Swaziland 27.4 Guinea-Bissau 13.2 Ghana 27.0 Somalia 12.4 Namibia 25.9 Rwanda 12.4 Lesotho 25.7 Niger 11.0 Zambia 25.1 Burundi 10.9 Benin 25.1 Uganda 10.7 Eritrea 25.0 Sierra Leone 9.6 Guinea 23.1 Liberia 7.1 Mozambique 23.1 Equatorial Guinea 6.5 Burkina Faso 21.2 Tanzania 6.2 Malawi 20.4 Central African Republic 4.4 Gabon 19.2 Congo, Dem. Rep. 3.8 Djibouti 18.5 Chad 1.8
4.1 Gravity Model Estimation: Data
We estimate a standard gravity model for inter-country trade in Sub-Saharan Africa
using the IMF Direction of Trade (IMFDOT) data.14 For paired trading partners, we
calculate average trade flows for the period 2000-03.15 Our economic scale variables for
each trading pair are average exporter and importer GDP’s at purchasing power parity for
2000-03. The distance index is average road distance for all city pairs in the country
trading pair (e.g., Senegal/South Africa road distance is indexed by the average distance
14 The IMF direction of trade database includes total merchandise trade exports and total imports by partner, reported yearly, quarterly and monthly. This database provides more complete information on African trade flows than the UN COMTRADE data. 15 We estimate average flows to compensate for the frequency of missing values in the annual data series. We use the period 2000-03 to match the trade data with available data for the right hand variables in the model.

12
for Dakar/Johannesburg, Dakar/Cape Town, and all other relevant city pairs). Similarly,
our road quality index is the average index for all city pairs in the trading country pair.
We also test for the effect of six regional trading agreements, whose member countries
are listed in Appendix Table A7.
We have two basic options for indexing the quality of the road links between pairs
of cities: the distance-weighted average road quality index for transit countries, or the
minimum quality index for those countries. We believe that the latter index is more
appropriate. Consider, for example, the problem of a business manager in Johannesburg
who is considering overland shipment to a customer in Lagos. As Table 3 shows, the
minimum distance route passes through nine countries, whose road qualities vary from
100 (South Africa) to 3.8 (Congo D.R.).
Using the distance-weighted average road quality (24.0), the shipper would view
the trip as equivalent to a 7,923-km. journey at the 70th percentile of Sub-Saharan road
quality (see Table 2). However, over one-third of the trip (in Congo Democratic
Republic and Central African Republic) would confront some of the worst road
conditions on the continent. We believe that even moderately risk-averse managers
would choose ocean or air shipment from Nigeria to South Africa rather than risk the trip
through Central Africa, and the available evidence is consistent with this view.

13
Table 3: Overland Trip, Johannesburg – Lagos (Network Minimum Distance Route)
Country
Distance
(km.) Road
Quality South Africa 542 100.0 Zimbabwe 917 50.0 Zambia 1,176 25.1 Burundi 158 10.9 Tanzania 708 6.2 Congo Democratic Republic 2,058 3.8 Central African Republic 592 4.4 Cameroon 969 18.4 Nigeria 805 32.3 Total 7,923 24.0
Even though South Africa and Nigeria have the two largest economies in Sub-
Saharan Africa, overland shipments between them seem almost nonexistent.16 For this
reason, we believe that minimum road link quality (for Congo D.R., in this case),
provides a better index than average link quality. However, we also report econometric
results for average link quality.
Table 4 provides suggestive evidence on the effect of bad roads on overland
transport. Using 2004 IMFDOT data, we calculate total import and export flows between
Chad and Central African Republic, two landlocked north-central African states, and two
sets of countries: their neighboring states (each other, as well as Niger, Nigeria,
Cameroon, Congo Republic, Congo Democratic Republic and Sudan), and five central-
southern African landlocked (CSAL) states: Rwanda, Burundi, Malawi, Zambia and
Zimbabwe. These states are separated from Chad and Central African Republic by only
one country: Congo Democratic Republic, which has extremely low road quality. For
contrast, we also present total trade flows for the CSAL countries in Table 4. Together,
16 After an extensive search, we can find no evidence of regular overland trade between Nigeria (or, for that matter, West Africa) and South Africa.

14
trade flows between Chad and CAR and their neighboring states are $103.7 million for
imports and $10 .1 million for exports. Trade flows with the CSAL states, only one
country removed, are effectively nonexistent. By contrast, the CSAL states’ total trade
flows with other African states are $3.3 billion for imports and $1.6 billion for exports.
Table 4: Trade Flows Linking Chad and CAR with Neighboring and CSAL States ($US 2004)
4.2 Gravity Model Estimation: Results
Table 5 provides estimation results for alternative specifications of the log-log
regression model in equation (2). Columns (1) and (2) present results for the basic
gravity model, with two country-level measures of road quality. Road-quality results in
both columns are based on average values for city pairs in each pair of trading countries.
Column (1) presents results for average link quality between city pairs, while (2)
tabulates results for minimum link quality. As we explained above, we believe that the
latter is more realistic. In the econometric analysis, the city-level distinction between the
two measures is blurred by averaging in our country-level dataset. In any case, both
measures yield strong results, with elasticities around 2.0 (a 2% increase in trade for each
1% increase in road quality) and very high levels of significance. For both measures, the
elasticities are somewhat higher than those obtained by Coulibaly and Fontagné. We
present results for minimum link quality in the other columns of Table (5), but average
link quality retains a large elasticity and high significance in the same specifications.
Chad and CAR Imports Exports: Neighboring African States 103,692,188 10,079,443 CSAL States 356 0 CSAL States (Total African trade) 3,252,777,590 1,640,256,173

15
We obtain very strong results for exporter GDP, importer GDP and road network
distance. The GDP elasticities are both in the upper range for the previous studies
summarized in Table 1, and both have very high significance levels. Road distance is
also highly significant, with the expected sign and elasticities that are somewhat larger
than previous estimates for West Africa and Latin America.17
Columns (3) and (4) augment the gravity model with controls for six regional trade
agreements that are identified in Table 5 and Appendix Table A7. Three of these
agreements – WAEMU (West Africa), CEMAC (Central Africa) and EAC (East Africa)
– are among contiguous states with very long-standing monetary and trade
relationships.18 The other three – ECOWAS, COMESA and SADC – are broader and
looser aggregates that overlap somewhat with the first three agreements.19 Our results
suggest that the close-knit agreements have had a major impact on trade, ceteris paribus.
The highly-significant dummy-variable results for WAEMU and CEMAC, in the range
2.3 – 3.4, suggest trade volumes 10-30 times higher than expected volumes without the
agreements. The estimated parameter for EAC is equally large, although it is only
17 Although we have considered panel estimation, we have chosen cross-section estimation for several reasons. First, as we have previously noted, frequent missing values in the data force us to use a 4-year average, even for the cross-section work. At best, we could estimate a pseudo-panel regression with an equivalent average for a previous period in the 1990’s. Even if we adopted this approach, we would confront intractable problems with our road quality index. The cross-country index in Table 2 follows a sensible pattern but, as we have noted, World Development Indicator statistics on percent paved roads exhibit significant short-period fluctuations that seem very unlikely to reflect changes in actual road quality. In any case, we have no time-compatible measures for the CPIA index, which only exists for recent years. The objective of this exercise is to predict the effect of a hypothetical change in road quality which, given the measurement issues, could only enter a pseudo-panel regression as a fixed effect. The same is true for road distance. After considering all of these problems, we have decided against any attempt at panel estimation. 18 We cannot test the effect of the South African Customs Union (SACU – Botswana, Lesotho, Namibia, South Africa, Swaziland)) because the relevant inter-country observations are missing in the data. 19 Appendix Table A7 lists member countries of WAEMU, CEMAC, EAC, ECOWAS, COMESA and SADC.

16
Table 5: Gravity Model Regressions for Sub-Saharan Africa: Paired Trading Countries
Dependent Variable: Log Trade Value ($US) (1) (2) (3) (4) (5)
Log Exporter GDP 1.577 1.674 1.727 1.722 1.725 (12.56)** (13.71)** (14.08)** (14.12)** (14.19)**
Log Importer GDP 1.309 1.400 1.448 1.445 1.447 (10.42)** (11.37)** (11.75)** (11.76)** (11.81)**
Log Avg. Road Quality 2.315 (5.42)**
Log Min. Road Quality 1.865 2.062 1.979 1.923 (7.91)** (8.14)** (8.19)** (8.21)**
Log Road Distance -3.813 -2.529 -2.288 -2.051 -2.097 (18.63)** (9.62)** (7.44)** (7.28)** (7.56)**
Trade Agreement Member 2.694 [WAEMU,CEMAC,EAC] (4.55)**
WAEMU 2.483 2.310 (3.03)** (3.22)**
CEMAC 2.866 3.350 (2.81)** (3.37)**
EAC 3.239 3.379 (1.58) (1.66)
ECOWAS -0.740 (1.15)
SADC 0.183 (0.28)
COMESA -1.435 (2.91)**
Constant -34.014 -45.192 -49.811 -51.693 -51.325 (7.70)** (9.65)** (10.03)** (10.62)** (10.62)** Observations 1128 1128 1128 1128 1128 R-squared 0.36 0.38 0.40 0.39 0.39 Absolute value of t statistics in parentheses * significant at 5%; ** significant at 1% Regional Trade Agreements (Country Membership in Appendix Table A7) WAEMU = West African Economic and Monetary Union CEMAC = Economic and Monetary Community of Central Africa EAC = East African Community COMESA = Common Market for Eastern and Southern Africa ECOWAS = Economic Community of West African States SADC = Southern African Development Community

17
marginally significant.20 In contrast, none of the broader, more recent agreements has a
positive, significant elasticity, and one – for COMESA – has a perverse sign.21 For our
baseline impact simulations, we use the results in column (5), which control for
membership in the three strongest trade agreements.
4.3 Calibration of the Inter-City Gravity Model
For each city pair in the network, gravity model estimation of trade flows requires
four pieces of information: the economic scales of the two cities, the network distance
between them, and the quality of the connecting roads. To proxy economic scale, we
multiply the population of each city by national GDP per capita at purchasing power
parity for 2001 (the most recent year for which comprehensive Sub-Saharan income data
are available). We calculate inter-city distances in the network using our spatial network
analysis model (see Figure 2), and index inter-city road quality using the minimum
quality for transit countries. Then we use the parameter estimates from column (5), Table
5 to estimate trade volumes for 3,403 city pairs:22
(4) 10.2
92.145.173.169.2
ˆij
ijjiijij
d
qMEAKT =
where Tij = Trade volume between exporter i and importer j K = A valuation constant
Aij = Membership in WAEMU, CEMAC or EAC (1=exporter and importer both members of the same agreement) Ei = Exporter economic scale Mj = Importer economic scale qij = Quality index for the road joining cities i and j dij = Road distance between cities i and j
20 Formally, rejection of zero effect with only 90% confidence. 21 The negative, significant result for COMESA appears in the reported regression, which is based on minimum inter-city road quality. The result is still negative, but insignificant, in the corresponding regression that is based on average inter-city road quality. 22 This involves 6,806 calculations, since each city plays two roles (exporter, importer) in each pair. Two sets of calculations are necessary because parameter estimates for importers and exporters are not identical. We exclude 6 countries from the analysis because data for trade and other variables are missing: Botswana, Lesotho, Namibia, Swaziland, Somalia and Liberia.
18
Arbitrarily setting K=1, we use equation (4) to compute pre-upgrade trade flows as
index numbers. We add all index numbers for cities in different countries, and divide the
result into IMFDOT’s total inter-country trade value. This produces a K-value for
equation (4) that translates trade index numbers for city pairs into internally-consistent
trade values.
We recognize that this K-value provides only an approximation, because neither our
econometric results nor our inter-city trade simulations explicitly allow for modal
alternatives (e.g., rail, ocean freight). Railroad connections are probably not important
for the analysis, since they are sparse outside the Southern African Customs Union
countries (whose inter-country trade is not captured by the IMFDOT data). Within Sub-
Saharan Africa, intra-regional sea freight is potentially more significant, although its
importance is considered relatively minor by African transport experts whom we have
consulted.23
Exclusion of alternate modes has probably reduced the explanatory power of our
regressions (our R2’s are in the range .36 - .40). However, our estimated road quality and
distance parameters do incorporate potential diversion to alternate modes, because our
regressions are fitted to total trade data for partner countries. In summary, we believe
that index-number translation via our K-value can provide useful insights about the
potential value of road quality improvements between cities, countries and regions.
4.4 Road Network Upgrading and Trade Expansion
23 We have consulted with the following experts, who are unanimous in attributing little importance to ocean transport among Sub-Saharan countries unless they are widely separated: Jan Hoffmann, Trade Facilitation Section, UNCTAD; Marc Juhel, Acting Sector Manager, Transport Unit, and Brad Julian, Port and Maritime Transport Specialist, Transport and Urban Development Department, World Bank; Simon Pitout, Manager, APM Terminals Africa regional office, Cape Town, South Africa.

19
We simulate road network improvement by increasing all link quality indices to a
minimum level of 45, which lies between the current index values for Zimbabwe and The
Gambia (Table 2). While this would represent a great improvement for many links, we
believe that it is a feasible target (see the discussion of costs in Section 5).
Econometric Projection
For Sub-Saharan Africa as a whole, we can use our econometric results to estimate
the overall trade impact of road network upgrading. After estimating equation (5) in
Table 5, we re-set all road quality indices to the minimum value of 45,24 project the
resulting logarithmic values for inter-country trade, transform the projections to
exponentials, and calculate the sum of projections. Table 6 presents the results for
current trade and projected trade after the network upgrade. We also include alternative
projections, bounded by the projection standard error.
Total trade (as an annual average) in the IMFDOT data is $US 10.1 billion for the
period 2000-2003. After we upgrade all network links, projected trade increases by $20.3
billion, to $30.4 billion. Given the projection standard error, we compute low- and high-
range projections as $16.3 billion (an increase of $6.2 billion) and $57.1 billion (an
increase of $47 billion). In all cases, the projected impact of network upgrading is a large
increase in overland trade in Sub-Saharan Africa.
Table 6: Current and Projected Trade: Econometric Results ($US Million)
Avg. Trade,
2000-03
ProjectedTrade After Upgrade
(Baseline)
Change
Projected Trade After Upgrade (- 1 Std. Error.)
Projected Trade After Upgrade (+ 1 Std. Error)
Total 10,121 30,390 20,269 16,329 57,091
Gravity Model Simulation
24 We retain the higher values for South Africa (100), Botswana (87.5) and Zimbabwe (50.0).
20
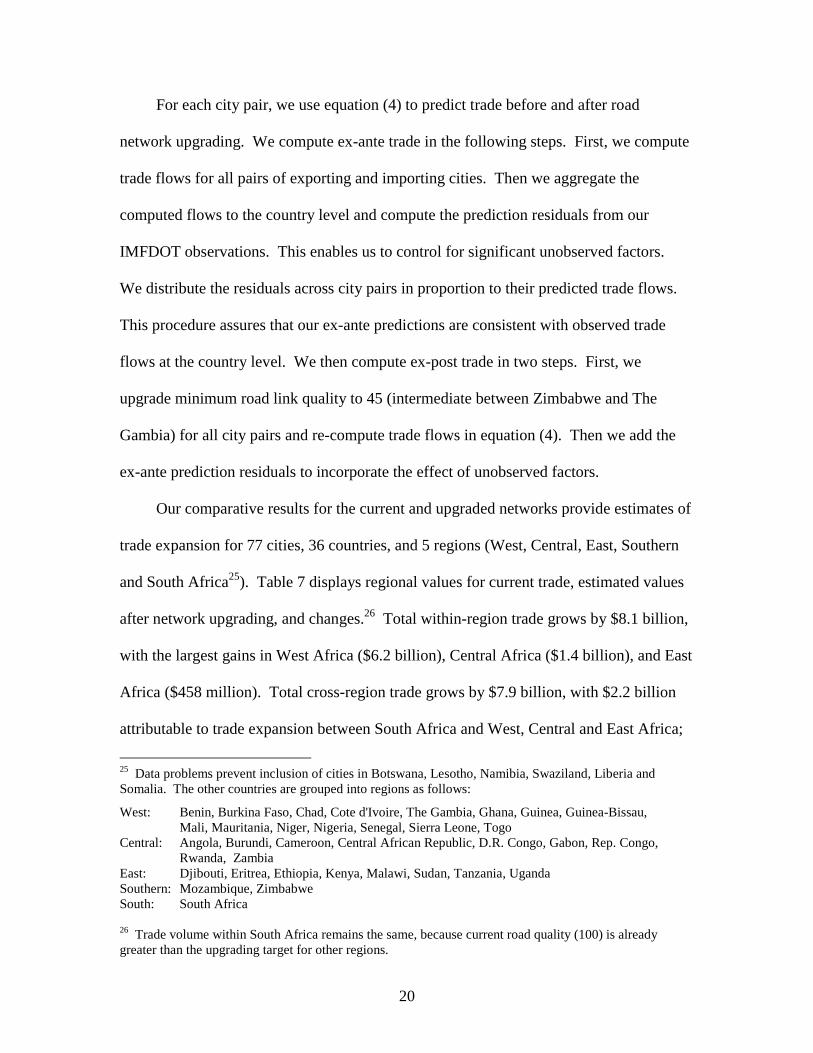
For each city pair, we use equation (4) to predict trade before and after road
network upgrading. We compute ex-ante trade in the following steps. First, we compute
trade flows for all pairs of exporting and importing cities. Then we aggregate the
computed flows to the country level and compute the prediction residuals from our
IMFDOT observations. This enables us to control for significant unobserved factors.
We distribute the residuals across city pairs in proportion to their predicted trade flows.
This procedure assures that our ex-ante predictions are consistent with observed trade
flows at the country level. We then compute ex-post trade in two steps. First, we
upgrade minimum road link quality to 45 (intermediate between Zimbabwe and The
Gambia) for all city pairs and re-compute trade flows in equation (4). Then we add the
ex-ante prediction residuals to incorporate the effect of unobserved factors.
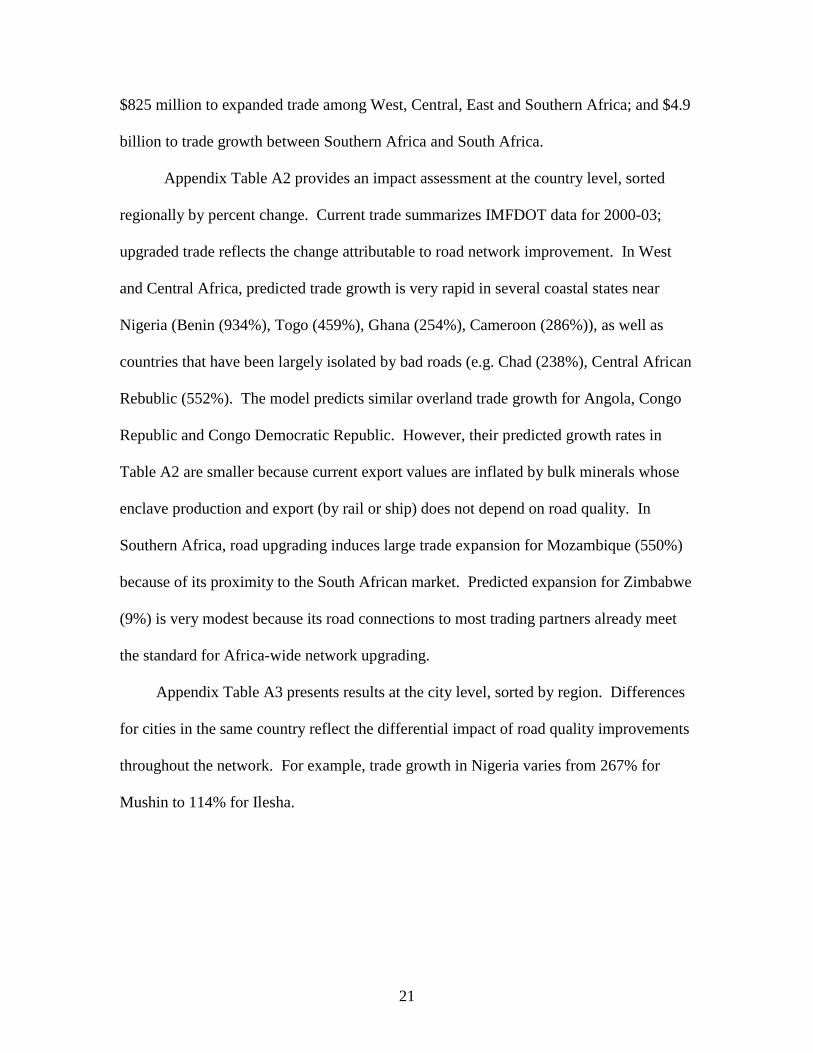
Our comparative results for the current and upgraded networks provide estimates of
trade expansion for 77 cities, 36 countries, and 5 regions (West, Central, East, Southern
and South Africa25). Table 7 displays regional values for current trade, estimated values
after network upgrading, and changes.26 Total within-region trade grows by $8.1 billion,
with the largest gains in West Africa ($6.2 billion), Central Africa ($1.4 billion), and East
Africa ($458 million). Total cross-region trade grows by $7.9 billion, with $2.2 billion
attributable to trade expansion between South Africa and West, Central and East Africa;
25 Data problems prevent inclusion of cities in Botswana, Lesotho, Namibia, Swaziland, Liberia and Somalia. The other countries are grouped into regions as follows:
West: Benin, Burkina Faso, Chad, Cote d'Ivoire, The Gambia, Ghana, Guinea, Guinea-Bissau, Mali, Mauritania, Niger, Nigeria, Senegal, Sierra Leone, Togo Central: Angola, Burundi, Cameroon, Central African Republic, D.R. Congo, Gabon, Rep. Congo, Rwanda, Zambia East: Djibouti, Eritrea, Ethiopia, Kenya, Malawi, Sudan, Tanzania, Uganda Southern: Mozambique, Zimbabwe South: South Africa 26 Trade volume within South Africa remains the same, because current road quality (100) is already greater than the upgrading target for other regions.
21
$825 million to expanded trade among West, Central, East and Southern Africa; and $4.9
billion to trade growth between Southern Africa and South Africa.
Appendix Table A2 provides an impact assessment at the country level, sorted
regionally by percent change. Current trade summarizes IMFDOT data for 2000-03;
upgraded trade reflects the change attributable to road network improvement. In West
and Central Africa, predicted trade growth is very rapid in several coastal states near
Nigeria (Benin (934%), Togo (459%), Ghana (254%), Cameroon (286%)), as well as
countries that have been largely isolated by bad roads (e.g. Chad (238%), Central African
Rebublic (552%). The model predicts similar overland trade growth for Angola, Congo
Republic and Congo Democratic Republic. However, their predicted growth rates in
Table A2 are smaller because current export values are inflated by bulk minerals whose
enclave production and export (by rail or ship) does not depend on road quality. In
Southern Africa, road upgrading induces large trade expansion for Mozambique (550%)
because of its proximity to the South African market. Predicted expansion for Zimbabwe
(9%) is very modest because its road connections to most trading partners already meet
the standard for Africa-wide network upgrading.
Appendix Table A3 presents results at the city level, sorted by region. Differences
for cities in the same country reflect the differential impact of road quality improvements
throughout the network. For example, trade growth in Nigeria varies from 267% for
Mushin to 114% for Ilesha.

22
Table 7: Estimated Interregional Trade Volume Effect of Road Network Upgrading ($US Million)27
Regional Pair
Current Network Trade
Upgraded Network Trade
Change
West West 2,838 9,062 6,224 West Central 647 1,252 605 West East 23 93 70 West Southern 4 24 20 West South 870 1,540 670 Central Central 200 1,551 1,351 Central East 308 348 40 Central Southern 127 194 67 Central South 1,390 2,374 984 East East 724 1,182 458 East Southern 101 124 23 East South 871 1,378 507 Southern Southern 72 99 27 Southern South 1,868 6,753 4,885 Totals Within Regions 3,834 11,894 8,060 Across Regions 6,209 14,080 7,871 West, Central, East Africa with South Africa 3,131 5,292 2,161 West, Central, East Africa with Southern Africa 1,210 2,035 825 Southern Africa with South Africa 1,868 6,753 4,885
4.5 Implications
Our results highlight the importance of a network perspective in evaluating road
investment opportunities in Sub-Saharan Africa. The overall implications are illustrated
by Figure 3, which presents two types of information: country road-quality indices and
network road links, size-graded to reflect frequency of use by the 3,403 minimum-
distance routes in our analysis. Figure 3 shows that most of the minimum-distance routes 27 By construction, as we have previously explained, total simulated trade prior to upgrading in Table 7 is the same as the calculated total for the IMFDOT data in Table 6. However, total simulated trade in Table 7 after upgrading ($26.0 billion) is 15% less than the econometric projection reported in Table 6 ($30.4 billion). This reflects an unavoidable consistency problem in aggregation. The econometric projection draws on inter-country trade data, which aggregate across all trading cities (including some not included in our network). Since the gravity model is non-linear, there is no guarantee that projection results from the two approaches would be identical, even if they covered exactly the same trading units. Both results are useful, but for different purposes in our exercise.

23
joining West Africa to East, Southern and South Africa pass through the four countries
with the lowest road quality indices in Africa: Chad (1.8), Congo D.R. (3.8), Central
African Republic (4.4) and Tanzania (6.2). The result is a low-level equilibrium trap.
Interregional traffic is negligible because the roads in these countries are so poor. At the
same time, poverty in the areas traversed by the roads is increased by their isolation.
Under these conditions, our results suggest that network upgrading, including
simultaneous improvement of road links in all four countries, would promote a very large
expansion of local and interregional trade. Local improvements in one or two countries
will not overcome the low-level trap, because risk-averse shippers will continue to judge
the weakest link in assessing the profitability of interregional shipments.
A useful illustration is provided by estimated traffic volume in the Congo
Democratic Republic and, more specifically, on the road from Kisangani, in the northeast
Congo, to Bangui, Central African Republic. At present, road conditions are so poor that
estimated traffic is very small; cost-benefit analysis based on local traffic counts would
probably not justify the use of scarce resources to upgrade this road.28 From a continental
perspective, however, the situation looks very different. Of the 3,403 city pairs in our
analysis, minimum-distance routes for 1,148 pairs include the road from Bangui to
Kisangani (see Figure 3). As the enlarged component of Figure 3 shows, this is part of
the main link between West and Southern Africa in our configuration of the network.
After upgrading, the baseline gravity model estimates that goods traded via this route
would expand from a current value of $US 6 million to $US 738 million: a 123-fold
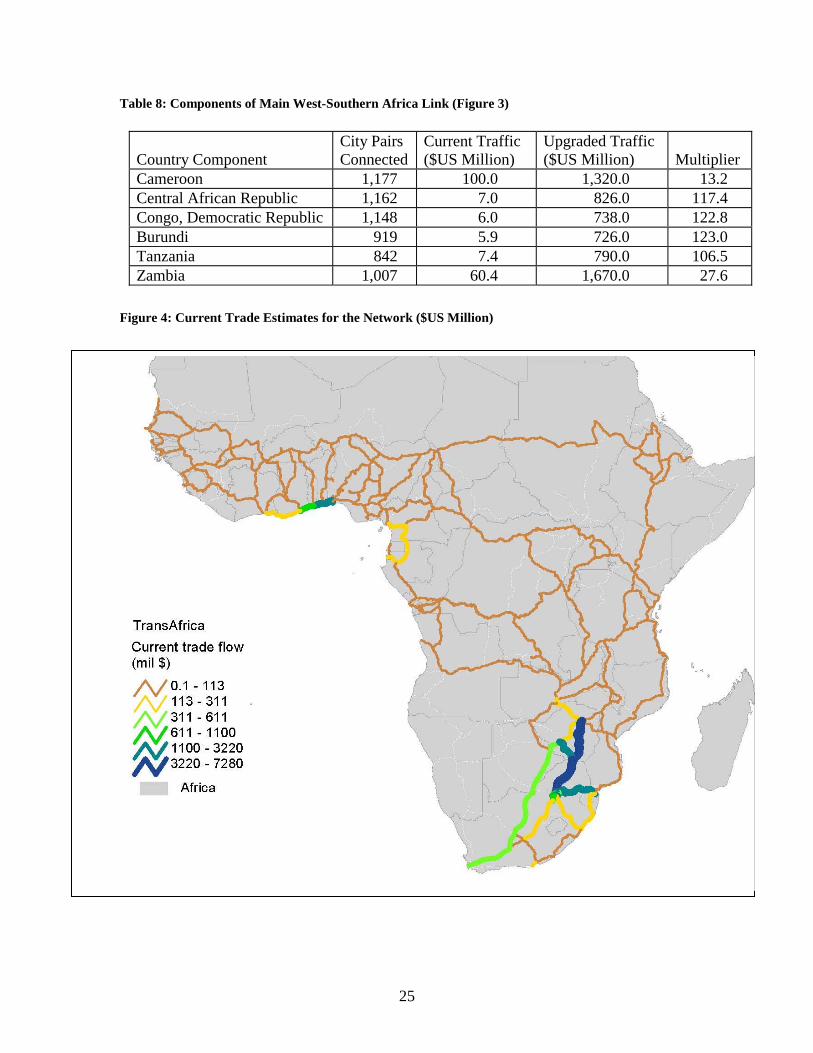
increase. Table 8 extends the analysis to the other components of this link in Cameroon,
28 Salopek (2005) characterizes the roads of the northeast Congo D.R. as follows: “What words can be uttered about these roads? Clogged with mud, strangled by bush, reduced in many cases to absurd footpaths … The roads are no longer roads.” (p. 84)
24
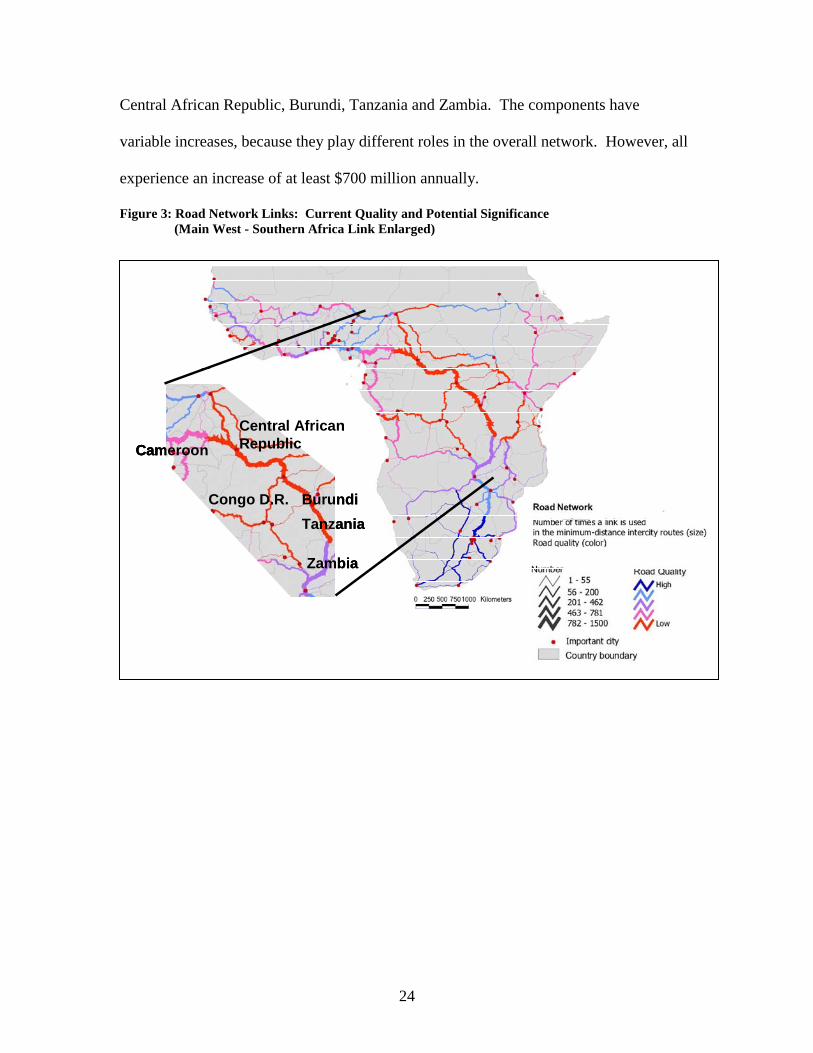
Central African Republic, Burundi, Tanzania and Zambia. The components have
variable increases, because they play different roles in the overall network. However, all
experience an increase of at least $700 million annually.
Figure 3: Road Network Links: Current Quality and Potential Significance (Main West - Southern Africa Link Enlarged)
Cameroon
Congo D.R. Burundi
Tanzania
Zambia
Central African RepublicCameroon
Congo D.R. Burundi
Tanzania
Zambia
Central African RepublicCameroon
Congo D.R. Burundi
Tanzania
Zambia
Central African Republic
25
Table 8: Components of Main West-Southern Africa Link (Figure 3)
Figure 4: Current Trade Estimates for the Network ($US Million)
Country Component
City Pairs Connected
Current Traffic ($US Million)
Upgraded Traffic ($US Million)
Multiplier
Cameroon 1,177 100.0 1,320.0 13.2 Central African Republic 1,162 7.0 826.0 117.4 Congo, Democratic Republic 1,148 6.0 738.0 122.8 Burundi 919 5.9 726.0 123.0 Tanzania 842 7.4 790.0 106.5 Zambia 1,007 60.4 1,670.0 27.6
26
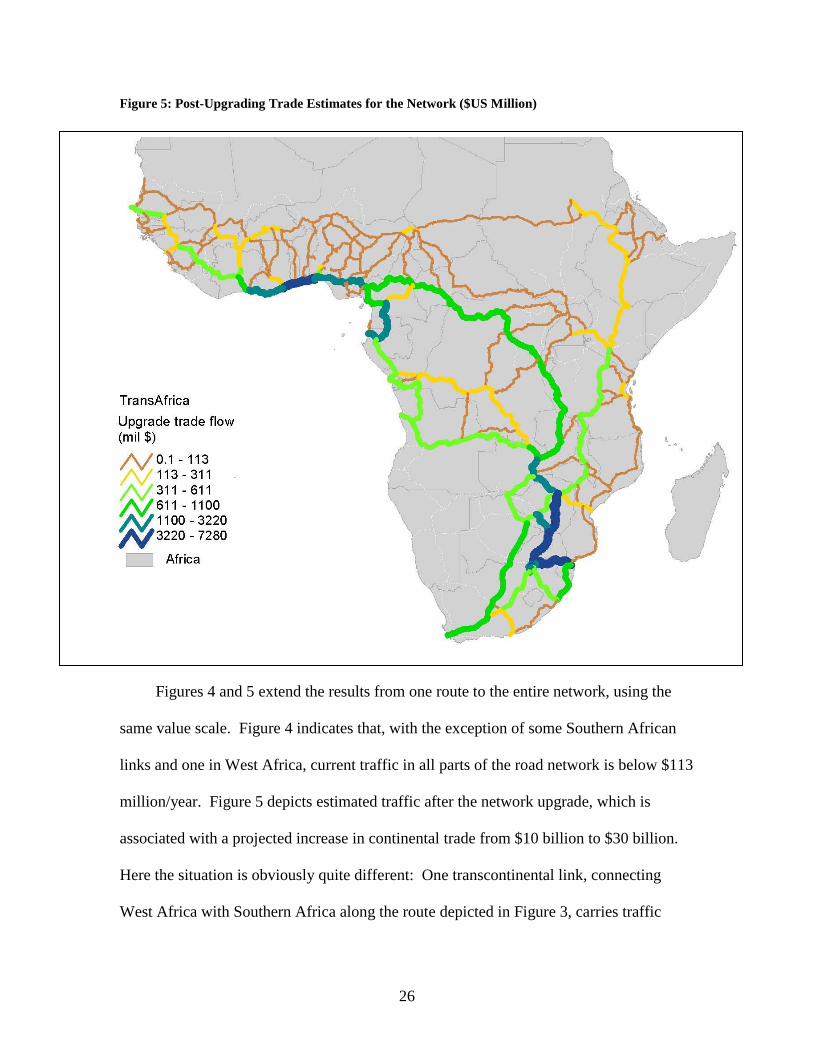
Figure 5: Post-Upgrading Trade Estimates for the Network ($US Million)
Figures 4 and 5 extend the results from one route to the entire network, using the
same value scale. Figure 4 indicates that, with the exception of some Southern African
links and one in West Africa, current traffic in all parts of the road network is below $113
million/year. Figure 5 depicts estimated traffic after the network upgrade, which is
associated with a projected increase in continental trade from $10 billion to $30 billion.
Here the situation is obviously quite different: One transcontinental link, connecting
West Africa with Southern Africa along the route depicted in Figure 3, carries traffic

27
whose value is in the range $611 million - $1.1 billion. Two others, one in the west and
one in the east, carry long-distance traffic in the $311 - $611 million range. All regions
also have many links carrying traffic in the $113 - $311 million range. Upgrading
generates strong increases in trade within regions but, perhaps more significantly, it
generates very large trade volumes among regions which have had little or no overland
trade.
5. Network Upgrading Cost
We have used the World Bank’s Road Cost Knowledge System (ROCKS) to
estimate the costs of upgrading and maintaining the 83-city road network described in
this paper.29 Table 9 provides detailed information from ROCKS for 470 upgrading and
maintenance projects in Sub-Saharan Africa.30 Estimated unit costs ($US/kilometer) vary
widely by type, both within and across categories. For 170 upgrading projects, the
median unit cost is approximately $127,800 per kilometer (Table 10), but median cost by
work type varies from $55,000/km. for asphalt mix resurfacing to over $1 million/km. for
new highway construction. For 300 maintenance projects, with median unit cost of
$5,600 per kilometer, work types vary from $500/km. for grading to over $20,000/km.
for surface treatment resurfacing. Table 11 provides information on the scale of the
network to be upgraded and maintained. Its total length is 108,820 kilometers, with well-
maintained, paved highways in South Africa accounting for 9,802 kilometers. West
29 The ROCKS website address is http://www.worldbank.org/transport/roads/rd_tools/rocks_main.htm 30 African countries in the ROCKS road project cost database include: West Africa: Chad, Ghana, Guinea, Mali, Nigeria, Sierra Leone Central Africa: Zambia East Africa: Madagascar, Malawi, Tanzania, Uganda Southern Africa: Botswana, Zimbabwe

28
Africa has 32,248 km. in the network, Central Africa 29,274, East Africa 24,146 and
Southern Africa 13,350.
Sub-Saharan countries exhibit wide variations in institutional, economic,
topographic and climatic factors that may have significant effects on the cost of road
upgrading and maintenance. To provide the best feasible estimate of network
improvement costs by area, we need to tailor our unit cost estimates to local conditions as
closely as possible. We focus at the country level in this paper, since the ROCKS data
and information on road cost determinants are currently available at that level.
Table 9: Unit Cost Statistics, World Bank Road Projects in Sub-Saharan Africa ($’000/km.)
Percentiles Work Type
Class
# 10 25 50 75 90
Grading Maintenance 3 0.2 0.2 0.5 0.9 0.9 Routine Maintenance Maintenance 22 0.6 1.7 2.0 3.0 3.5 Unsealed Preventive Maintenance Maintenance 98 2.8 3.3 4.3 5.1 5.7 Bituminous Pavement Preventive Treatment Maintenance 39 2.3 3.3 5.0 7.7 18.8 Gravel Resurfacing Maintenance 112 3.9 7.1 10.1 17.4 37.9 Surface Treatment Resurfacing Maintenance 26 13.0 18.4 20.3 32.2 38.5 Asphalt Mix Resurfacing Upgrading 27 22.7 39.2 54.7 70.4 95.1 Reconstruction Upgrading 88 22.8 78.6 128.9 218.1 333.8 Strengthening Upgrading 14 80.8 103.0 130.3 162.1 203.7 Partial Widening Upgrading 1 136.0 136.0 136.0 136.0 136.0 Upgrading Upgrading 35 53.0 109.1 262.5 331.1 473.3 New Two-Lane Highway Upgrading 2 660.2 660.2 1,023.4 1,386.5 1,386.5 Widening and Reconstruction Upgrading 3 989.1 989.1 1,331.1 1,568.4 1,568.4 Total 470
Table 10: Unit Cost Statistics by Activity Class ($’000/km.)
Percentiles Activity Class #
10 25 50 75 90 Maintenance 300 2.3 3.6 5.6 12.7 24.7 Upgrading 170 24.0 57.7 127.8 243.8 391.6

29
Table 11: Sub-Saharan Road Network Length by Region
5.1 Cost Function Estimation: Specification and Data
To assess inter-country variability in upgrading and maintenance costs, we fit the
following unit cost function to the ROCKS data for Sub-Saharan Africa:
(4) ijk
kkj
jjiiiiiij MUGYPRC εδθβββββ ∑∑ +++++++= 4320 logloglog
where Cij = Unit cost of project-type j in country i Ri = Rainfall intensity around the road network of country i Pi = Percent of roads in country i that are paved Yi = Income per capita in country i Gi = Governance quality in country i Uj = Upgrading Widening and Reconstruction Reconstruction New 2-Lane Highway Strengthening Partial Widening Asphalt Mix Resurfacing Mk = Gravel Resurfacing Surface Treatment Resurfacing Bituminous Pavement Preventive Treatment Unsealed Preventive Treatment Routine Maintenance Grading
Roads are more expensive to build and maintain in high-rainfall areas, ceteris
paribus. Many countries in Sub-Saharan Africa are large and climatically diverse, so
national average rainfall provides a very crude approximation to conditions in specific
areas. We believe that rainfall in the areas traversed by our network links provides a
Region
Network Length (km.)
West 32,248 Central 29,274 East 24,146 Southern 13,350 South 9,802 Total 108,820

30
closer approximation, since they are primary roads connecting the major cities of each
country with each other, and with the major cities of other countries. Not all World Bank
projects have focused on primary roads, but it seems reasonable to assume that most of
them have, in light of generally-poor road conditions and the scarcity of resources for
improvement. Accordingly, we use GIS to overlay the road network with an African
rainfall map and compute rainfall intensity (average mm. of rainfall on days that it
rains31) for the area surrounding each link in the network. Then we compute country
mean rainfall as the weighted mean of link-specific means, where the weights are
proportional to link distances.
We hypothesize that incremental upgrading and maintenance costs are lower for
countries where current road conditions are relatively good. We proxy this factor using
countries’ percent of roads that are paved from the World Bank’s World Development
Indicators. The available data are spotty and exhibit significant variability from year to
year, so we have chosen a conservative approach: From the WDI estimates of percent
paved for the period 1997-2002 (the latest year available), we use the minimum value as
our estimate. We use percent paved rather than log percent paved because the former is
already scale-invariant.
African road projects are labor-intensive, so local wages should be a significant
determinant of upgrading and maintenance costs. To proxy relative wages, we use mean
GDP per capita (in $US) at purchasing power parity for the period 2000-2003, from the
World Bank’s World Development Indicators. To control for possible effects of
governance quality (including corruption) on cost, we employ an index of transparency,
accountability and corruption from the World Bank’s 2004 database for Country Policy 31 This analysis is based on data from the Climatic Research Unit, University of East Anglia, UK.
31
and Institutional Assessments (CPIA). We employ the linear index in the reported
regressions (Table 13); the log index gives the same (insignificant) result. We also
introduce dummy variable controls for regions, to account for unobservable geographic
factors, and for project types.
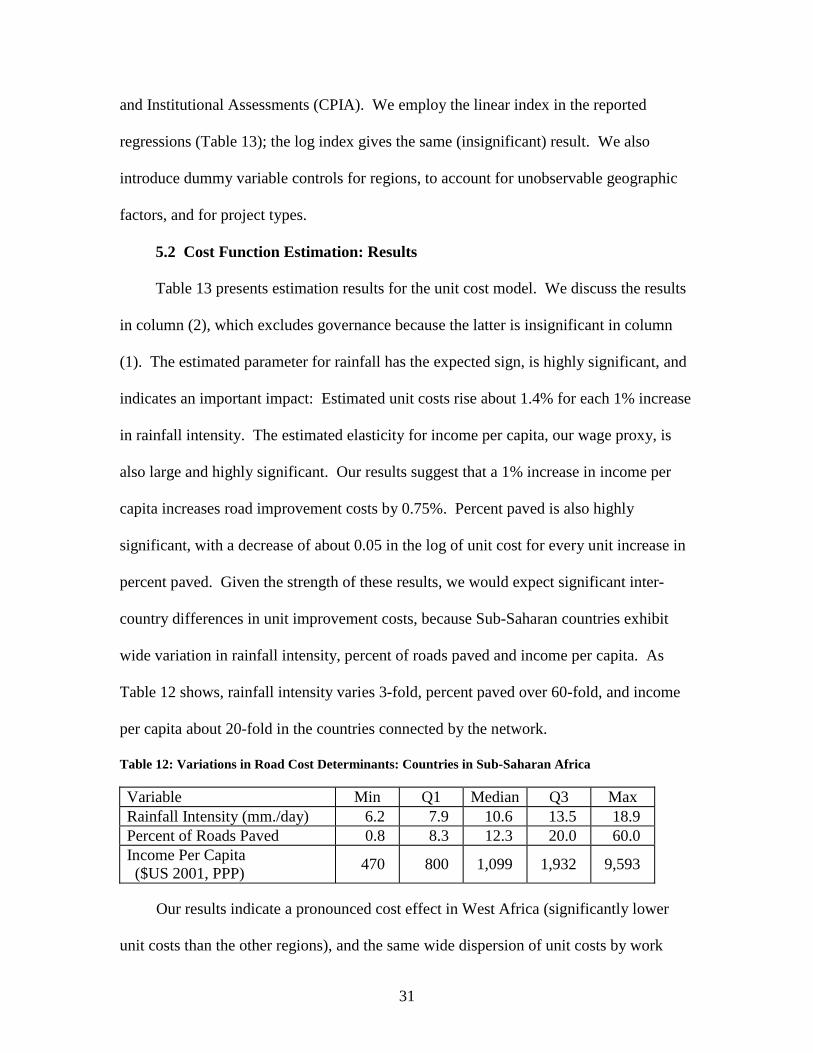
5.2 Cost Function Estimation: Results
Table 13 presents estimation results for the unit cost model. We discuss the results
in column (2), which excludes governance because the latter is insignificant in column
(1). The estimated parameter for rainfall has the expected sign, is highly significant, and
indicates an important impact: Estimated unit costs rise about 1.4% for each 1% increase
in rainfall intensity. The estimated elasticity for income per capita, our wage proxy, is
also large and highly significant. Our results suggest that a 1% increase in income per
capita increases road improvement costs by 0.75%. Percent paved is also highly
significant, with a decrease of about 0.05 in the log of unit cost for every unit increase in
percent paved. Given the strength of these results, we would expect significant inter-
country differences in unit improvement costs, because Sub-Saharan countries exhibit
wide variation in rainfall intensity, percent of roads paved and income per capita. As
Table 12 shows, rainfall intensity varies 3-fold, percent paved over 60-fold, and income
per capita about 20-fold in the countries connected by the network.
Table 12: Variations in Road Cost Determinants: Countries in Sub-Saharan Africa Variable Min Q1 Median Q3 Max Rainfall Intensity (mm./day) 6.2 7.9 10.6 13.5 18.9 Percent of Roads Paved 0.8 8.3 12.3 20.0 60.0 Income Per Capita ($US 2001, PPP)
470 800 1,099 1,932 9,593
Our results indicate a pronounced cost effect in West Africa (significantly lower
unit costs than the other regions), and the same wide dispersion of unit costs by work

32
type that we have already observed in Table 9. The results suggest that, once we control
for country characteristics, unit costs for upgrading projects are significantly different
only for two types: New two-lane highway construction and widening and
reconstruction. On the other hand, unit costs remain highly differentiated for
maintenance categories. As in Table 9, grading is lowest-cost in this category and
surface treatment resurfacing highest-cost, ceteris paribus.
Using the results in Table 13 and our country database, we project benchmark unit
cost estimates for each country in the network. We also subtract and add standard
projection errors to the benchmark projections to obtain low- and high-range projections.
We use country-specific measures for rainfall intensity, percent paved and income per
capita. For work types, we use the same mix that characterizes the projects in the
ROCKS database. We project unit costs for upgrading and maintenance separately. For
upgrading, we use each relevant work type’s share in 170 ROCKS upgrading projects as
the multiplicative weight for its estimated dummy variable parameter in Table 13. For
maintenance, we use each work type’s share in 300 ROCKS maintenance projects as the
multiplicative weight for its parameter.
Complete unit cost results are included in Appendix Tables A4 (upgrading) and A5
(maintenance). We summarize the results by work category and region in Table 14,
which indicates substantial regional variation in unit costs. For upgrading, the median
unit cost is $167,700/km; regional costs vary from $135,000 /km. to $418,000/km.
Within regions, there is also wide variation. The maintenance results replicate this

33
Table 13: Determinants of Unit Costs for Road Upgrading and Maintenance Dependent Variable: Log Road Project Unit Cost ($US/Km.) from ROCKS (1) (2)
Log Mean Rainfall 1.791 1.355 (2.44)* (2.32)*
Percent Paved -0.038 -0.046 (2.28)* (4.58)**
Log Income Per Capita 0.709 0.749 (2.42)* (2.67)**
Governance 0.309 (1.23)
West Africa -0.849 -0.730 (1.32) (6.24)**
Central Africa -0.339 (0.49)
East Africa 0.139 (0.19) Upgrading Categories
New 2-Lane Highway 2.057 2.111 (2.58)* (2.66)** Widening and Reconstruction 1.503 1.416 (1.99)* (1.88) Upgrading -0.154 -0.118 (0.23) (0.18) Strengthening -0.306 -0.329 (0.45) (0.49) Reconstruction -0.341 -0.337 (0.53) (0.52) Asphalt Resurfacing -1.042 -1.037 (1.58) (1.58) Maintenance Categories
Surface Treatment Resurfacing -1.892 -1.906 (2.87)** (2.89)** Gravel Resurfacing -2.785 -2.782 (4.29)** (4.28)** Bituminous Pavement Preventive Treatment -3.278 -3.281 (5.01)** (5.02)** Unsealed Preventive Treatment -4.389 -4.375 (6.71)** (6.69)** Routine Maintenance -4.876 -4.877 (7.35)** (7.35)** Grading -5.899 -5.893 (7.81)** (7.80)** Constant 3.306 4.989 (0.94) (1.63) Observations 465 465 R-squared 0.86 0.86 Absolute value of t statistics in parentheses significant at 5%; ** significant at 1%
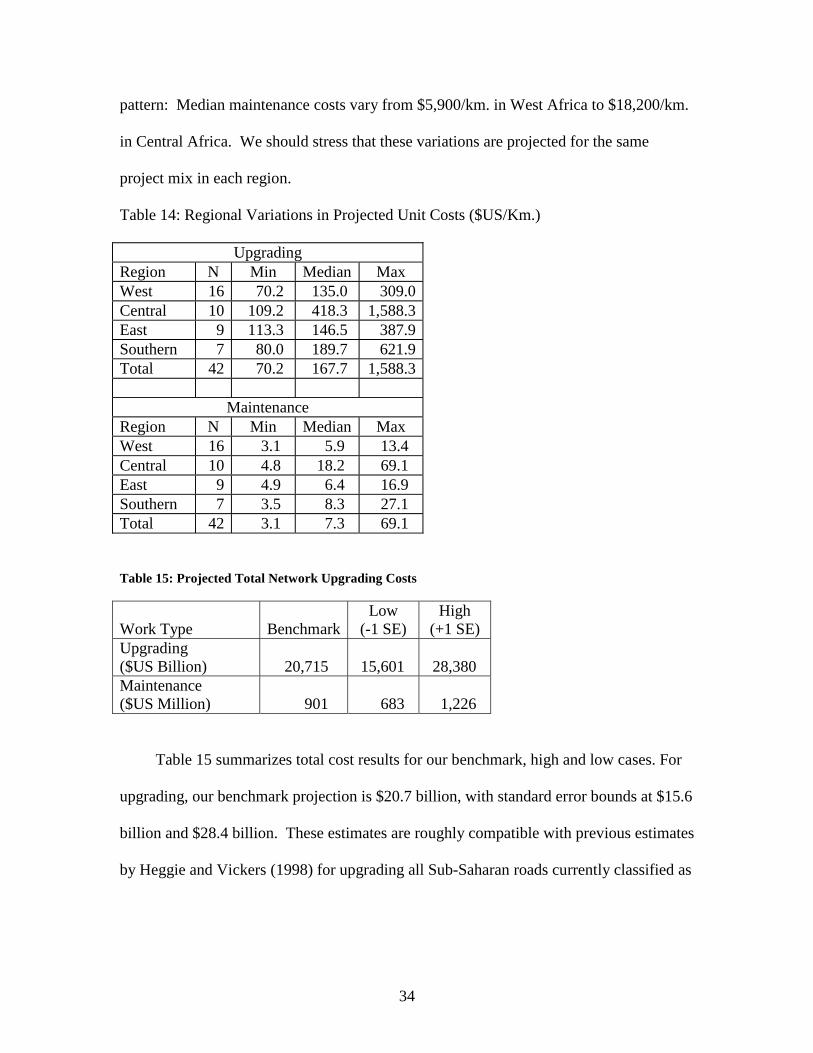
34
pattern: Median maintenance costs vary from $5,900/km. in West Africa to $18,200/km.
in Central Africa. We should stress that these variations are projected for the same
project mix in each region.
Table 14: Regional Variations in Projected Unit Costs ($US/Km.)
Upgrading Region N Min Median Max West 16 70.2 135.0 309.0 Central 10 109.2 418.3 1,588.3 East 9 113.3 146.5 387.9 Southern 7 80.0 189.7 621.9 Total 42 70.2 167.7 1,588.3
Maintenance Region N Min Median Max West 16 3.1 5.9 13.4 Central 10 4.8 18.2 69.1 East 9 4.9 6.4 16.9 Southern 7 3.5 8.3 27.1 Total 42 3.1 7.3 69.1
Table 15: Projected Total Network Upgrading Costs Work Type
Benchmark
Low (-1 SE)
High (+1 SE)
Upgrading ($US Billion) 20,715 15,601 28,380 Maintenance ($US Million) 901 683 1,226
Table 15 summarizes total cost results for our benchmark, high and low cases. For
upgrading, our benchmark projection is $20.7 billion, with standard error bounds at $15.6
billion and $28.4 billion. These estimates are roughly compatible with previous estimates
by Heggie and Vickers (1998) for upgrading all Sub-Saharan roads currently classified as
35
being in poor condition.32 For maintenance, our benchmark total annual cost estimate is
$901 million, with standard error bounds at $683 million and $1.2 billion.
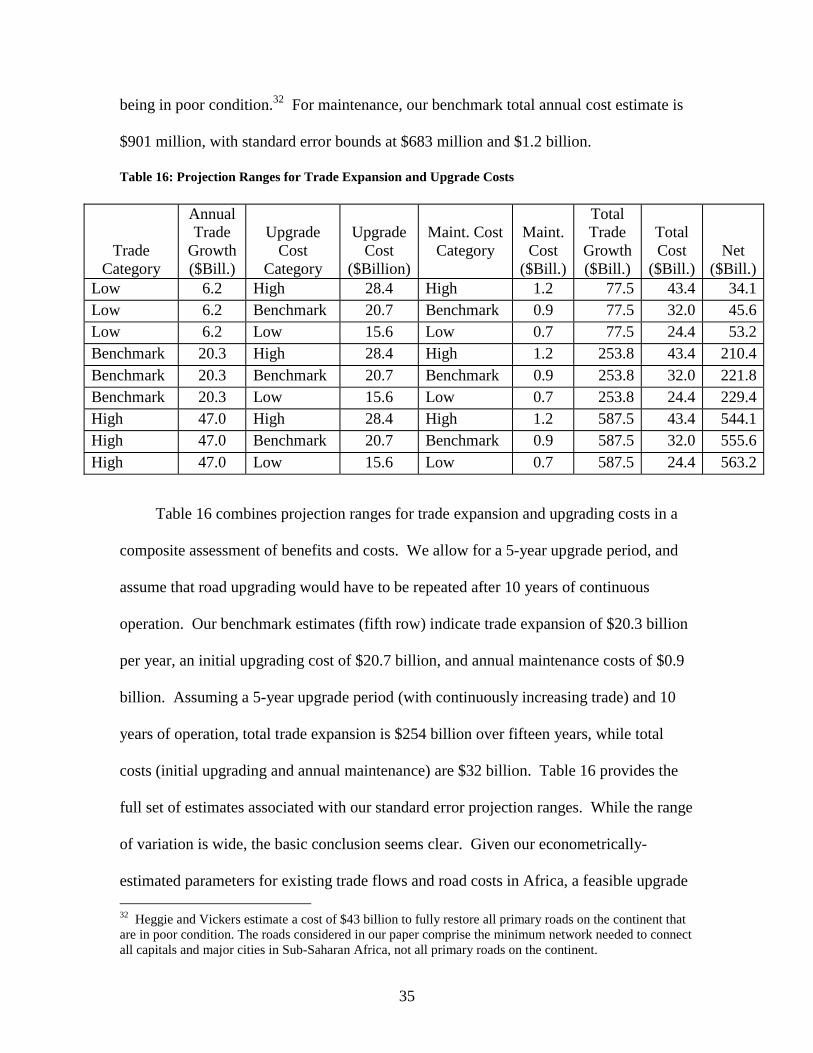
Table 16: Projection Ranges for Trade Expansion and Upgrade Costs
Table 16 combines projection ranges for trade expansion and upgrading costs in a
composite assessment of benefits and costs. We allow for a 5-year upgrade period, and
assume that road upgrading would have to be repeated after 10 years of continuous
operation. Our benchmark estimates (fifth row) indicate trade expansion of $20.3 billion
per year, an initial upgrading cost of $20.7 billion, and annual maintenance costs of $0.9
billion. Assuming a 5-year upgrade period (with continuously increasing trade) and 10
years of operation, total trade expansion is $254 billion over fifteen years, while total
costs (initial upgrading and annual maintenance) are $32 billion. Table 16 provides the
full set of estimates associated with our standard error projection ranges. While the range
of variation is wide, the basic conclusion seems clear. Given our econometrically-
estimated parameters for existing trade flows and road costs in Africa, a feasible upgrade 32 Heggie and Vickers estimate a cost of $43 billion to fully restore all primary roads on the continent that are in poor condition. The roads considered in our paper comprise the minimum network needed to connect all capitals and major cities in Sub-Saharan Africa, not all primary roads on the continent.
Trade Category
Annual Trade
Growth ($Bill.)
Upgrade
Cost Category
Upgrade
Cost ($Billion)
Maint. Cost
Category
Maint. Cost
($Bill.)
Total Trade
Growth ($Bill.)
Total Cost
($Bill.)
Net ($Bill.)
Low 6.2 High 28.4 High 1.2 77.5 43.4 34.1 Low 6.2 Benchmark 20.7 Benchmark 0.9 77.5 32.0 45.6 Low 6.2 Low 15.6 Low 0.7 77.5 24.4 53.2 Benchmark 20.3 High 28.4 High 1.2 253.8 43.4 210.4 Benchmark 20.3 Benchmark 20.7 Benchmark 0.9 253.8 32.0 221.8 Benchmark 20.3 Low 15.6 Low 0.7 253.8 24.4 229.4 High 47.0 High 28.4 High 1.2 587.5 43.4 544.1 High 47.0 Benchmark 20.7 Benchmark 0.9 587.5 32.0 555.6 High 47.0 Low 15.6 Low 0.7 587.5 24.4 563.2
36
of the trans-African network generates trade flows that are far greater than the associated
upgrade costs. We should stress that our benefit estimates are extremely conservative,
since they do not include any inter-city trade expansion within countries (Nigeria alone
has 18 cities in the network) or increased trade between Sub-Saharan countries and other
parts of the world. Nor do they account for any induced growth from the expansion of
inter-country trade. We conclude that the basic economics look very promising. In the
next two sections, we turn our attention to the environmental and institutional
implications of network upgrading.
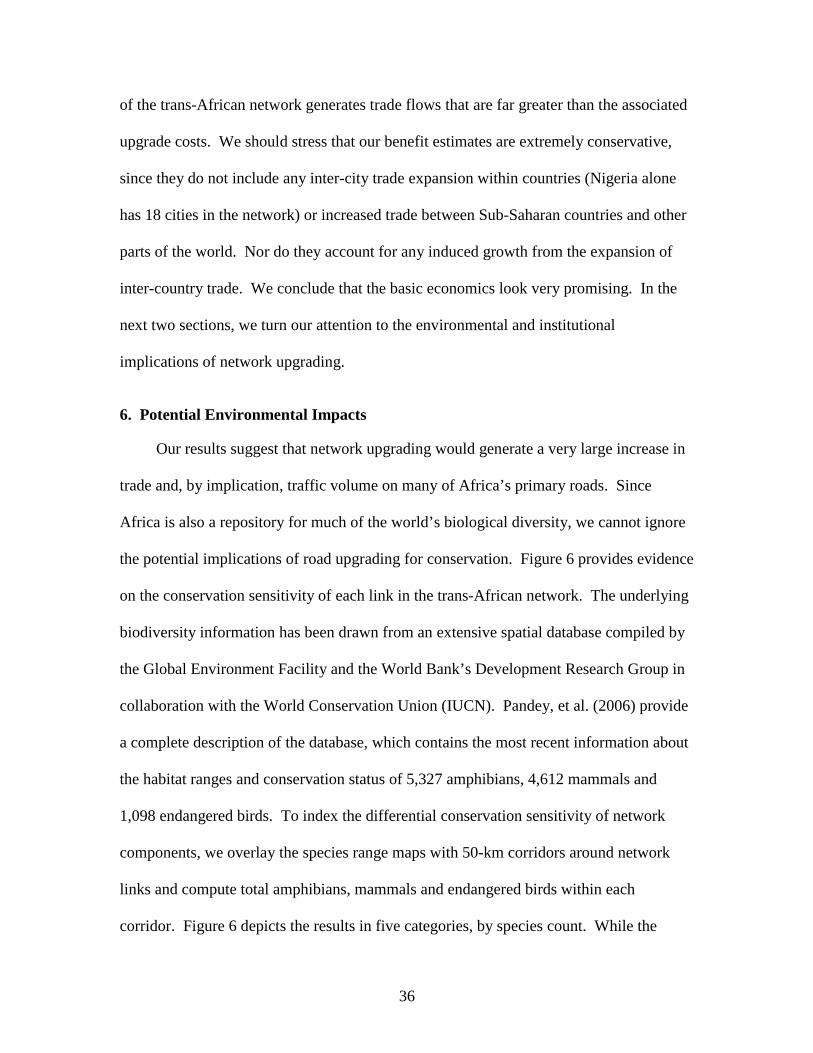
6. Potential Environmental Impacts
Our results suggest that network upgrading would generate a very large increase in
trade and, by implication, traffic volume on many of Africa’s primary roads. Since
Africa is also a repository for much of the world’s biological diversity, we cannot ignore
the potential implications of road upgrading for conservation. Figure 6 provides evidence
on the conservation sensitivity of each link in the trans-African network. The underlying
biodiversity information has been drawn from an extensive spatial database compiled by
the Global Environment Facility and the World Bank’s Development Research Group in
collaboration with the World Conservation Union (IUCN). Pandey, et al. (2006) provide
a complete description of the database, which contains the most recent information about
the habitat ranges and conservation status of 5,327 amphibians, 4,612 mammals and
1,098 endangered birds. To index the differential conservation sensitivity of network
components, we overlay the species range maps with 50-km corridors around network
links and compute total amphibians, mammals and endangered birds within each
corridor. Figure 6 depicts the results in five categories, by species count. While the
37
Figure 6: Biodiversity in Road Network Corridors
pattern of implied sensitivity is relatively complex, comparison of Figures 5 and 6 reveals
an issue of potential concern: Most of the West, Central and East African network
corridors with the greatest anticipated traffic volumes after upgrading are also corridors
in the highest category of conservation sensitivity. We conclude that any broad-scale
upgrading within or across regions will confront the biodiversity conservation problem.
This result points to the inescapable need for conservation planning and investment as
part of any road network upgrading strategy.
38
7. Implementation Issues, Costs and Local Employment Benefits
The results in Section 4 indicate that coordinated upgrading of the Sub-Saharan
road network is likely to generate a very large expansion of interregional trade.
Piecemeal, local improvements do not have the same potential, because the cost
calculations of interregional shippers will be dominated by conditions in the lowest-
quality network links. The success of upgrading would depend on smooth traffic flow
over the whole network, with minimal delays at national borders and open roads within
countries. We recognize that implementation of such a program would be difficult, but
our results suggest that the potential payoff is sufficiently high to warrant a serious
discussion.
In this section, we offer some preliminary thoughts about appropriate institutional
arrangements and administrative measures, along with the associated costs. We present
estimates of direct and indirect benefits for the rural poor generated by upgrading and
maintaining the road system. We also provide rough estimates of the costs associated
with administration of a trans-African network. We recognize the uncertainty in these
estimates, but for the present purposes we are interested in orders of magnitude, not
precise figures. We have already estimated maintenance costs from our econometric
analysis of projects in the ROCKS database.
7.1 Overall Organization and Financing.
Coordinated upgrading and maintenance of the network could be accomplished by
an all-Africa convention on overland trade, implemented in collaboration with
multilateral and bilateral donors, that would cover 5 years of upgrading and 10 years of
39
full operation.33 The agreement would ensure streamlined border procedures, finance and
monitor needed repairs and maintenance, and implement measures to stop harassment of
truckers for bribes at local road barriers. We should stress that donor support for this
program would be strictly limited to the trans-African network links, which account for a
modest part of primary and secondary road systems for most African countries. This
limitation is necessary to preserve countries’ incentive to use domestic resources for
upgrading and maintaining their other roads. Existing national road funds would be well-
spent on improving local access to the network on feeder roads, and the productivity of
local funds would be greatly enhanced by the existence of the trans-African network.
7.2 Monitoring Network Conditions
Traffic conditions in the network could be monitored relatively easily by mobile
inspection teams, supplemented by airborne surveillance. Strategically-located
equipment pools would be needed for rapid repair of damaged roads and bridges.
Network monitoring by an all-Africa inspection force would require financial support for
vehicles, personnel and supplies. To approximate the associated costs, we have
calculated annual support costs per person for six UN peacekeeping operations in
Africa.34 These vary from $US 44,000 to $US 66,000, with an average value of $54,000.
Although the UN costs include vehicle support, we estimate conservatively by
costing this separately. Under reasonable assumptions about vehicle monitoring range
33 See also Simuyemba (2000), who proposes a series of Infrastructure Protocols as a basis for African regional integration, 34 The UN operations are UMASIL (Sierra Leone); MUNOC (Congo D.R.); ONUB (Burundi); UNOCI (Cote d’Ivoire), UNMIL (Liberia); UNMEE (Ethiopia, Eritrea). Detailed calculations are available from the authors on request.
40
and team size in a 90,000 km. system,35 annual vehicle and personnel costs for road
monitoring (700 vehicles, 7,000 people) are approximately $US 400 million. Assuming
1,000 people for overhead support adds another $54 million. We estimate the annual cost
of complementary airborne surveillance at about $56 million.36 To summarize, the
approximate annual cost for the requisite road and airborne monitoring system is about
$500 million.
7.3 Working with Roadside Communities
A trans-African network cannot function properly if roadside communities
constantly harass truckers for bribes. Under current conditions, local barricades are
improvised “toll stations” for local police and other groups who have low wages (if any)
and/or the power to extract payments from passing vehicles. Undoubtedly, these
payments provide support for extended families in neighboring settlements, whose de
facto local control will not change in the foreseeable future. Realistically, abutting
settlements will only support barricade removal if they stand to gain from the change.
For the trans-African network, the critical operational question is how to make barricade
removal worth their while.
We believe that the requisite incentives would be provided by three factors. The
first is employment and income generated by initial upgrading and continuous
maintenance of the network, coupled with a clear prior understanding about barricade
35 150 km./day monitoring range and 10-person operational and support team per vehicle. Monitoring the whole system would require 700 vehicles, allowing for 100 spares. Associated monitoring personnel would number 7,000. We compute costs for a 90,000 km. system on the assumption that South Africa and its neighboring states (principally Botswana) would maintain current road quality, which is above our target quality for the rest of the network. 36 For airborne surveillance, we assume one helicopter pass per day over the entire network. This would require approximately 140 standard light utility helicopters with pilot and one crew member, carrying a unit cost of approximately $200,000, operating cost of $100/hour, a cruising speed of 150 km./hour, and operating range of 300 km.. We estimate the cost of this helicopter fleet at about $30 million, with annualized costs (operations and 30% replacement/year) of about $56 million.

41
removal for villages along the planned right-of-way. We estimate the potential
employment and income gains from the country-level upgrading and maintenance cost
estimates in Appendix Tables A4 and A5. Drawing on results from a recent UNDP study
of labor-intensive road construction in Mozambique (UNDP, 2002), we assume a 35%
labor share of total construction expenditure. Dividing the resulting wage bill by the
annual wage per road worker, we arrive at estimated annual employment per country for
initial upgrading and subsequent maintenance.37 To put the results in perspective, we
also calculate populations for areas contiguous to the network in each country.38 We
present the employment and population results for all network countries in Appendix
Table A6.
Our results indicate a variety of employment and income impacts, from modest to
extremely large. Congo Democratic Republic provides an illustration of large-scale
benefit generation, with total network length of 12,184 km., between 2,000 and 4,900
abutting settlements, and abutting population (within 5 km. of the road) between 1 and
7.3 million. At estimated Congolese wages ($500/year), network upgrading generates
37 We conservatively estimate the annual wage for rural road workers as 75% of per capita income. This is probably too high, so our estimated range of employment benefits is probably conservative. 38 First, we estimate the number of settlements abutting the network in each country. Using a Geographic Information System (GIS) and available spatial data, we develop relatively precise estimates of villages within 5 km. of network roads in Mozambique, Mali and Burkina Faso. We divide total network distance in each country by the estimated number of settlements to obtain the estimated road interval separating settlements. The estimated intervals for the three countries are 2.70 km. (Burkina Faso), 4.06 km. (Mozambique) and 5.04 km. (Mali). From these results, we set low- and high-range interval estimates for Africa at 2.5 and 6.0 km.. Then we multiply by network length in each country to obtain low and high numbers for settlements abutting network roads. Using the three-country spatial dataset, we also estimate the average populations per settlement in the network’s 5-km. buffer areas: 1,274 (Burkina Faso), 1,394 (Mozambique) and 700 (Mali). These averages are somewhat higher than for villages further than 5 km. from a main road. For our extrapolation to other countries, we set the low- and high-range estimates at 500 and 1,500 people per settlement. We (very) conservatively bound our population estimates as follows: For each country, we obtain the lower-bound network-abutting population estimate by multiplying the lower-bound estimate of network-abutting settlements by the lower-bound estimate of population per village. We obtain the upper-bound population estimate by multiplying the upper-bound estimate of settlements by the upper-bound estimate of population per village.
42
2.5 million person-years of employment and total labor income of $1.3 billion.
Subsequent maintenance generates about 110,000 rural jobs, with an annual income flow
of about $55 million. Comparison of employment generated with the abutting population
range indicates a large local labor deficit during the upgrade, with consequent overflow
benefits for more distant settlements. Assuming that 40% of the local population is
employable on road construction,39 annual maintenance demand can absorb between 4%
and 26% of available labor in abutting settlements. In the full network, 18 countries have
high-range absorption percentages of 10% or more.
For the whole trans-Africa network, we estimate that 8.4 million person-years of
rural construction employment would be generated by initial upgrading, with about
365,000 rural jobs generated by annual maintenance. This would have a significant
impact on employment and earnings in some of the poorest parts of rural Africa and,
coupled with a clear prior understanding about the link between road siting and jobs,
would probably be sufficient to motivate removal of barricades in most areas.
The second major source of income for local settlements would be growth in
income-earning opportunities from large increases in network traffic. Abutting
settlements would increase sales of goods and services to truckers and vehicle
passengers, as well as having greatly-expanded export markets for local produce. To
assess the potential scale of this effect, we have used GIS to define spatial corridors
extending 10 km. on either side of all network links. Overlaying these 20-km. corridors
on the most recent spatial population distribution map for rural Sub-Saharan Africa
39 Network countries have a mean population percentage of 53% in the age range 15-64.
43
(SSA), we find that approximately 67 million people, or 15% of SSA’s total rural
population, reside within the corridors.40
For abutting settlements, we believe that increased income and employment from
construction, maintenance, and sales of goods and services would easily compensate for
any loss of barricade-extracted payments. Since the network’s road monitoring teams
would circulate daily, villagers would be constantly reminded of the link between income
growth and barricade-free passage. As insurance, however, it is also worth thinking
about direct payment programs that are explicitly tied to the absence of barricades. As an
added incentive for local support, such programs could provide village development
funds, micro-credit, or cash transfers conditional on barricade-free road conditions.41
They would probably work best if organized around regular payments in small
increments, tied explicitly to monitored traffic flow.
We base our order-of-magnitude cost calculation for such a program on our
estimate of abutting settlement numbers for the network, which we have explained in
footnote 41. As we report in Appendix Table A6, the total number of settlements within
5 km. of the continental network probably lies within the range 19,000 – 42,000. If we
assume that 20% of settlement areas require additional compensation, at $20,000 per
settlement annually, the total outlay is between $76 million and $168 million. To be
conservative, we double the high-range estimate to $340 million. We believe that such
costs would plummet once the abutting settlements perceived the full benefits of the
40 This estimate is based on GIS analysis of the GRUMP spatial population map (Balk et al., 2004). In this analysis, the rural population is estimated by masking urban areas, and then computing total population in remaining areas within 20-km. corridors around network links. This approach assumes that the rural population is uniformly distributed in each administrative area, after urban areas are masked. More detailed analysis of available datasets (e.g., for Mozambique) suggests non-uniform rural distributions, with higher population concentrations near network roads. This implies that our analysis probably underestimates Africa’s rural population within the network’s 20 km. corridor. 41 For a discussion of conditional cash transfer programs, see Das, Do and Ozler (2004).

44
network and brought pressure to bear on recalcitrant barrier-erectors. However, we
include $340 million as a recurrent cost in our full accounting.
7.4 Network Benefits and Costs: A Summary Accounting.
We posit a 5-year period for network upgrading, followed by a 10-year period of
network operation before a new upgrade would be needed. Our benchmark estimate for
trade expansion is $20.3 billion annually, or $203 billion for the ten-year operational
period. We assume that trade growth to full volume phases in continuously during the 5-
year initial upgrade period, which adds $50 billion to total trade volume. The estimated
cost of upgrading is $20.7 billion, with an annual maintenance cost of $900 million that
would phase in during the first 5 years, and remain constant for the next 10 years. As we
have previously noted, a significant percentage of these expenditures would generate jobs
and income in high-poverty areas of rural Africa. Our estimate for the subcontinent is
8.4 million person-years of employment created by upgrading, and continuous
employment of 365,000 people for maintenance. Conservative, order-of magnitude
estimates for other cost categories include $500 million annually for administration and
network monitoring, and $350 million annually for programs in abutting settlements.
Table 17 summarizes the benefit and cost estimates. Among the imputed costs, we
roughly estimate that rural employment and income generation are directly tied to 35% of
upgrading and maintenance expenditure and 100% of abutting settlement programs. This
represents about $17 billion in direct payments to high-poverty rural areas. It is worth
repeating that our overall benefit estimate is extremely conservative, because it does not
include either trade expansion among network cities within countries, or induced growth
in rural and urban areas.
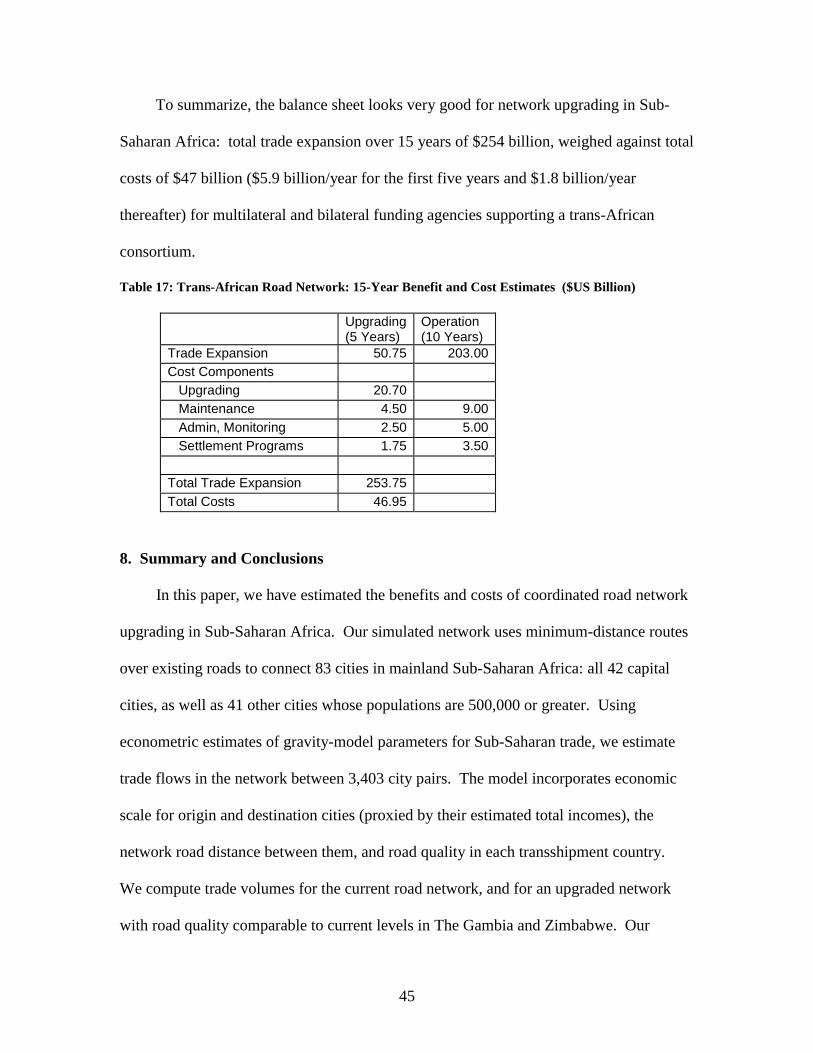
45
To summarize, the balance sheet looks very good for network upgrading in Sub-
Saharan Africa: total trade expansion over 15 years of $254 billion, weighed against total
costs of $47 billion ($5.9 billion/year for the first five years and $1.8 billion/year
thereafter) for multilateral and bilateral funding agencies supporting a trans-African
consortium.
Table 17: Trans-African Road Network: 15-Year Benefit and Cost Estimates ($US Billion)
Upgrading (5 Years)
Operation (10 Years)
Trade Expansion 50.75 203.00 Cost Components Upgrading 20.70 Maintenance 4.50 9.00 Admin, Monitoring 2.50 5.00 Settlement Programs 1.75 3.50 Total Trade Expansion 253.75 Total Costs 46.95
8. Summary and Conclusions
In this paper, we have estimated the benefits and costs of coordinated road network
upgrading in Sub-Saharan Africa. Our simulated network uses minimum-distance routes
over existing roads to connect 83 cities in mainland Sub-Saharan Africa: all 42 capital
cities, as well as 41 other cities whose populations are 500,000 or greater. Using
econometric estimates of gravity-model parameters for Sub-Saharan trade, we estimate
trade flows in the network between 3,403 city pairs. The model incorporates economic
scale for origin and destination cities (proxied by their estimated total incomes), the
network road distance between them, and road quality in each transshipment country.
We compute trade volumes for the current road network, and for an upgraded network
with road quality comparable to current levels in The Gambia and Zimbabwe. Our
46
results suggest that coordinated upgrading of the network would expand overland trade
by about $250 billion over 15 years.
Using the World Bank’s ROCKS database, we also estimate country-specific unit
costs for upgrading and maintaining the 83-city road network. Our results indicate total
expenditures of approximately $35 billion for upgrading and maintenance over 15 years,
of which about $12 billion would directly generate jobs and income for about 8.4 million
rural construction workers in the upgrade period, and 365,000 annual jobs for
maintenance workers. We estimate additional 15-year costs of $12 billion for
administration, monitoring of road conditions, and programs that compensate abutting
settlements for loss of revenue from barricades. Over 15 years, the implied annual
implementation cost is $5.9 billion for the first five years, and $1.8 billion thereafter.
This is well within the range of aid programs that are currently proposed for Sub-Saharan
Africa.
We acknowledge that our network perspective incorporates a broad vision, and in
closing we would like to address the question of feasibility. It is natural to ask whether
an integrated trans-African road network is feasible, given Africa’s many
disappointments during the past several decades. We believe that a coordinated road
upgrading program can succeed, for several reasons. First, the growing development gap
between Sub-Saharan Africa and other regions has focused world attention and assistance
on the region. Bilateral and multilateral development institutions have assigned Africa
the highest priority, and donors appear willing to provide major resources for promising
programs. Second, from a technical perspective, network upgrading can work because its
goals are realistic. It seeks only to maintain basic quality standards in a limited network,

47
rather than attempting improvement of all roads on the continent. Its operations and
authority would be confined to the basic network of connector roads. It would avoid
perverse financial incentives by leaving the greatest part of national road network
improvement to budgetary support by national authorities. Third, all mainland Sub-
Saharan countries should want to join the network, because their capitals and largest
cities would be connected to it, and all would reap large gains from the expansion of
trade. The potential gains should be sufficient for states to accept the desirability of
streamlined border procedures and barricade-free roads. Fourth, we believe that large
income increases from construction and service employment and expanded produce sales,
coupled with direct compensation payments where needed, would provide sufficient
incentives for road barricade removal. Fifth, and most important, we believe that
coordinated road network upgrading is possible because Africa is ready for it.
Governance is improving in many states, and a new, better-educated generation of leaders
is ready to embrace the network’s continental vision.
The final key to successful network upgrading would be willingness by donor
countries to accept an unprecedented level of strategic coordination, as well as a 15-year
commitment of approximately $47 billion. The donors would collectively provide long-
term financial, technical and institutional support for the network. In return, our results
suggest that network upgrading would offer an important economic opportunity for the
subcontinent. If Sub-Saharan countries are ready to collaborate on this scale, then the
donor countries should be prepared to follow their lead.

48
References ADB, 2003, “Review of the Implementation Status of the Trans African Highways and the Missing Links,” African Development Bank and UN Economic Commission for Africa, (consultants: SWECO International AB, Sweden; Nordic Consulting Group AB, Sweden, in association with BNETD, Ivory Coast and UNICONSULT, Kenya). Amjadi, Azita and Alexander Yeats, 1995, “Have transport costs contributed to the relative decline of African exports? Some preliminary evidence,” World Bank Working Papers on International Economics, Trade, and Capital Flows, No. 1559. Anderson, James E., 1979, “A Theoretical Foundation for the Gravity Equation,” American Economic Review 69, 106-116. Balk, D., F. Pozzi, G. Yetman, U. Deichmann and A. Nelson, 2004, “The Distribution of People and the Dimension of Place: Methodologies to Improve the Global Estimation of Urban Extents,” Center for International Earth Science Information Network, Columbia University, mimeo. Bergstrand, Jeffrey H., 1985, “The Gravity Equation in International Trade: Some Microeconomic Foundations and Empirical Evidence,” Review of Economics and Statistics 67, 471-481. Bergstrand, Jeffrey H., 1989, “The Generalized Gravity Equation, Monopolistic Competition, and the Factor-Proportions Theory in International Trade,” Review of Economics and Statistics 71, 143-153. Bergstrand, Jeffrey H., 1990, “The Heckscher-Ohlin-Samuelson Model, the Linder Hypothesis, and the Determinants of Bilateral Intra-Industry Trade,” Economic Journal 100, 1216-1229. Carrillo, Carlos and Carmen Li, 2002, “Trade Blocks and the Gravity Model: Evidence from Latin American Countries,” University of Essex, Discussion Paper. Chauvin, Sophie. and Gillaume Gaulier, 2002, “Regional Trade Integration in Southern Africa,” CEPII Research Center, Working Paper No. 2002-12. Coulibaly, Souleymane and Lionel Fontagné, 2004, "South – South Trade: Geography Matters," CEPII Working Paper No. 2004-08, CEPII Research Center (forthcoming, Journal of African Economies – access online: October, 2005). Das, Jishnu, Quy-Toan Do and Berk Őzler, 2004, “Conditional Cash Transfers and the Equity-Efficiency Debate,” World Bank Development Research Group Working Paper, No. 3280, April.
49
Deardorff, Alan V., 1998, “Determinants of Bilateral Trade: Does Gravity Work in a Classical World?” in Jeffrey A. Frankel (ed.), The Regionalization of the World Economy, Chicago: University of Chicago Press. Feenstra, Robert C., James R. Markusen and Andrew K. Rose, 2001, “Using the gravity model equation to differentiate among alternative theories of trade,” Canadian Journal of Economics 34, 430-447. Frankel, Jeffrey A., 1997, Regional Trading Blocs in the World Trading System, Institute for International Economics: Washington D.C.. Heggie, I. and P. Vickers, 1998, “Commercial Management and Financing of Roads,” World Bank Technical Paper No. 409, World Bank, Washington D.C.. Helpman, Elhanan and Paul Krugman, 1985, Market Structure and Foreign Trade, Cambridge, MA: MIT Press. Henderson J. V., Z. Shalizi and A. J. Venables, 2001, “Geography and development,” Journal of Economic Geography 1, 81-105. Kirkpatrick, C. and M. Watanabe, 2005, “Regional trade in sub-Saharan Africa: An analysis of East African trade cooperation, 1970-2001,” The Manchester School 73(2), 141-164. Limao, N. and A. J. Venables, 2000, “Infrastructure, geographical disadvantage, transport costs and trade,” World Bank Economic Review, 15(3), 451-79. Longo, Robert and Khalid Sekkat, 2004, “Economic Obstacles to Expanding Intra-African Trade,” World Development, 32(8), 1309–1321. Musila, Jacob, 2005, “The Intensity of Trade Creation and Trade Diversion in COMESA, ECCAS and ECOWAS: A Comparative Analysis,” Journal of African Economies 14(1), 117-141. Rossi-Hansberg, E., 2005, “A Spatial Theory of Trade,” American Economic Review, 95(5), 1464-1491. Pandey, K., P. Buys, K. Chomitz and D. Wheeler, 2006, “Biodiversity Conservation Indicators: New Tools for Priority-Setting at the Global Environment Facility,” World Bank Development Research Group Working Paper (forthcoming). Pöyhönen, Pentti, 1963, “A Tentative Model for the Volume of Trade between Countries,” Weltwirtschaftliches Archiv 90, 93-99. Rose, Andrew, 2000, “One Money, One Market: Estimating the Effect of Currency Unions on Trade,” Economic Policy 15, 7-46.

50
Salopek, P., 2005, “Who Rules the Forest?” National Geographic, September, 74-95. Simuyemba, S., 2000, “Linking Africa Through Regional Infrastructure,” African Development Bank, Economic Research Papers, No. 64. Soloaga, Isidro and L. Alan Winters, 2001, “Regionalism in the Nineties: What Effect on Trade?” North American Journal of Economics and Finance 12, 1-29. The Economist, 2002, “Trucking in Cameroon: The road to hell is unpaved,” 19th December. Tinbergen, Jan, 1962, “An Analysis of World Trade Flows,” in Jan Tinbergen (ed.), Shaping the World Economy, New York: The Twentieth Century Fund. UNDP, 2002, “Re-Opening Mozambique: Lessons Learned from the Feeder Road Programme,” UNDP: Maputo, Mozambique. World Bank and Economic Commission for Africa, 2003, “Sub-Saharan Africa Transport Policy Program: Long-Term Development Plan 2004-2007,” Africa Region, World Bank, April. Yamarik, Steven and Sucharita Ghosh, 2005, “A Sensitivity Analysis of the Gravity Model,” The International Trade Journal, 19(1), 83-126.

51
Table A1 Trans-African Road Network Cities (*’s denote capital cities)
Region Country City Region Country City West Benin Cotonou* South South Africa Soweto Benin Porto Novo South Africa West Rand Burkina Faso Ouagadougou* Central Angola Luanda* Chad N'Djamena* Burundi Bujumbura* Cote d'Ivoire Abidjan* Cameroon Douala Cote d'Ivoire Yamousoukro Cameroon Yaounde* Cote d'Ivoire Bouake Central African Republic Bangui* Gambia, The Banjul* Congo, Dem. Republic Kinshasa* Ghana Accra* Congo, Dem. Republic Kananga Ghana Kumasi Congo, Dem. Republic Kisangani Guinea Conakry* Congo, Dem. Republic Kolwezi Guinea-Bissau Bissau* Congo, Dem. Republic Lubumbashi Liberia Monrovia* Congo, Dem. Republic Mbuji-Mayi Mali Bamako* Congo, Republic of Brazzaville* Mauritania Nouakchott* Congo, Republic of Pointe-Noire Niger Niamey* Equatorial Guinea Bata Nigeria Abeokuta Gabon Libreville* Nigeria Abuja* Rwanda Kigali* Nigeria Ado-Ekiti Zambia Lusaka* Nigeria Enugu East Djibouti Djibouti* Nigeria Ibadan Eritrea Asmara* Nigeria Ilesha Ethiopia Addis Ababa* Nigeria Ilorin Kenya Mombasa Nigeria Iwo Kenya Nairobi* Nigeria Kaduna Malawi Blantyre-Limbe Nigeria Kano Malawi Lilongwe* Nigeria Lagos Somalia Mogadishu* Nigeria Maiduguri Sudan Khartoum* Nigeria Mushin Tanzania Dar es Salaam* Nigeria Ogbomosho Tanzania Dodoma Nigeria Onitsha Southern Uganda Kampala* Nigeria Oshogbo Botswana Gaborone* Nigeria Port Harcourt Lesotho Maseru* Nigeria Zaria Mozambique Beira Senegal Dakar* Mozambique Maputo* Sierra Leone Freetown* Namibia Windhoek* Togo Lome* Swaziland Mbabane* South South Africa Capetown Zimbabwe Bulawayo South Africa Durban Zimbabwe Harare* South Africa EastRand South Africa Johannesburg South Africa Pretoria* South Africa Port Elizabeth South Africa Sasolburg
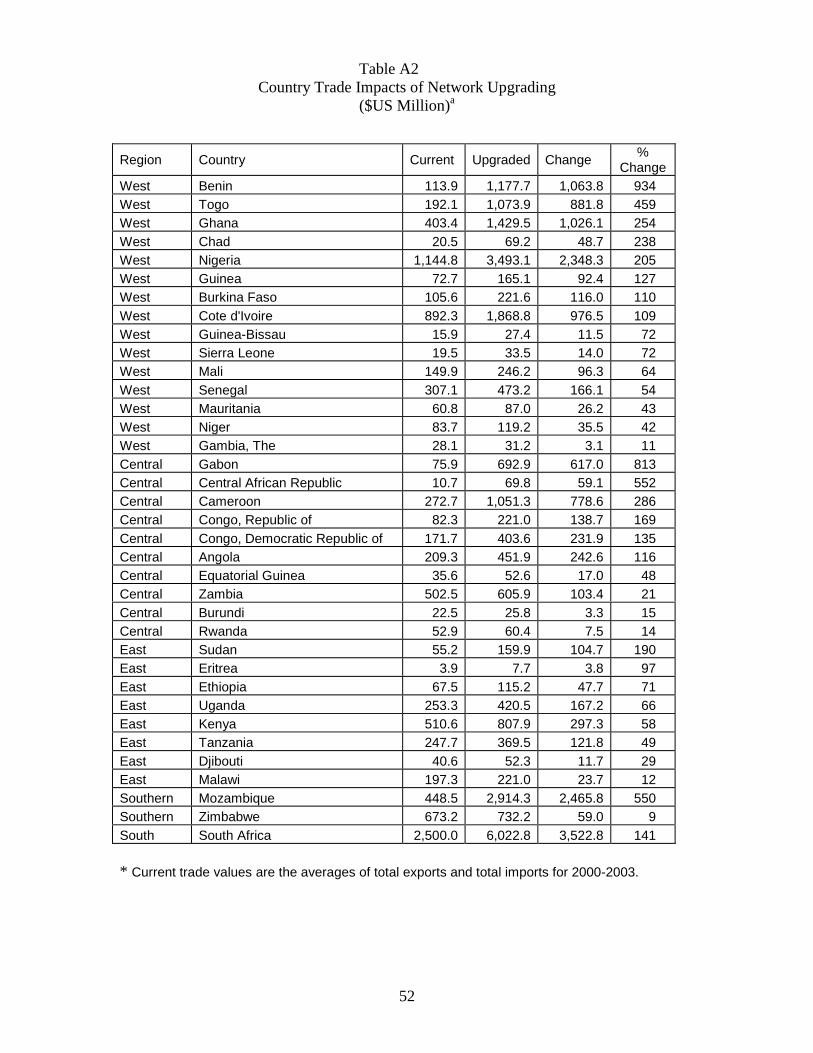
52
Table A2 Country Trade Impacts of Network Upgrading
($US Million)a
* Current trade values are the averages of total exports and total imports for 2000-2003.
Region Country Current Upgraded Change %
Change West Benin 113.9 1,177.7 1,063.8 934 West Togo 192.1 1,073.9 881.8 459 West Ghana 403.4 1,429.5 1,026.1 254 West Chad 20.5 69.2 48.7 238 West Nigeria 1,144.8 3,493.1 2,348.3 205 West Guinea 72.7 165.1 92.4 127 West Burkina Faso 105.6 221.6 116.0 110 West Cote d'Ivoire 892.3 1,868.8 976.5 109 West Guinea-Bissau 15.9 27.4 11.5 72 West Sierra Leone 19.5 33.5 14.0 72 West Mali 149.9 246.2 96.3 64 West Senegal 307.1 473.2 166.1 54 West Mauritania 60.8 87.0 26.2 43 West Niger 83.7 119.2 35.5 42 West Gambia, The 28.1 31.2 3.1 11 Central Gabon 75.9 692.9 617.0 813 Central Central African Republic 10.7 69.8 59.1 552 Central Cameroon 272.7 1,051.3 778.6 286 Central Congo, Republic of 82.3 221.0 138.7 169 Central Congo, Democratic Republic of 171.7 403.6 231.9 135 Central Angola 209.3 451.9 242.6 116 Central Equatorial Guinea 35.6 52.6 17.0 48 Central Zambia 502.5 605.9 103.4 21 Central Burundi 22.5 25.8 3.3 15 Central Rwanda 52.9 60.4 7.5 14 East Sudan 55.2 159.9 104.7 190 East Eritrea 3.9 7.7 3.8 97 East Ethiopia 67.5 115.2 47.7 71 East Uganda 253.3 420.5 167.2 66 East Kenya 510.6 807.9 297.3 58 East Tanzania 247.7 369.5 121.8 49 East Djibouti 40.6 52.3 11.7 29 East Malawi 197.3 221.0 23.7 12 Southern Mozambique 448.5 2,914.3 2,465.8 550 Southern Zimbabwe 673.2 732.2 59.0 9 South South Africa 2,500.0 6,022.8 3,522.8 141
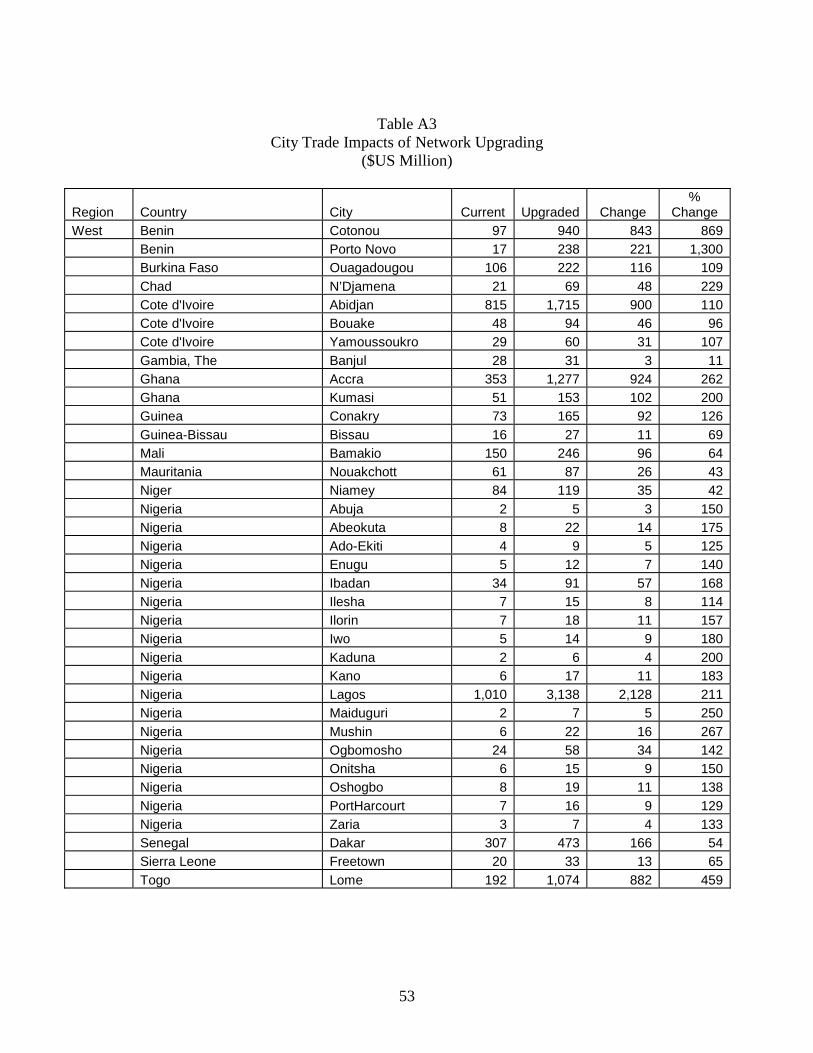
53
Table A3 City Trade Impacts of Network Upgrading
($US Million)
Region
Country
City
Current
Upgraded
Change
% Change
West Benin Cotonou 97 940 843 869 Benin Porto Novo 17 238 221 1,300 Burkina Faso Ouagadougou 106 222 116 109 Chad N’Djamena 21 69 48 229 Cote d'Ivoire Abidjan 815 1,715 900 110 Cote d'Ivoire Bouake 48 94 46 96 Cote d'Ivoire Yamoussoukro 29 60 31 107 Gambia, The Banjul 28 31 3 11 Ghana Accra 353 1,277 924 262 Ghana Kumasi 51 153 102 200 Guinea Conakry 73 165 92 126 Guinea-Bissau Bissau 16 27 11 69 Mali Bamakio 150 246 96 64 Mauritania Nouakchott 61 87 26 43 Niger Niamey 84 119 35 42 Nigeria Abuja 2 5 3 150 Nigeria Abeokuta 8 22 14 175 Nigeria Ado-Ekiti 4 9 5 125 Nigeria Enugu 5 12 7 140 Nigeria Ibadan 34 91 57 168 Nigeria Ilesha 7 15 8 114 Nigeria Ilorin 7 18 11 157 Nigeria Iwo 5 14 9 180 Nigeria Kaduna 2 6 4 200 Nigeria Kano 6 17 11 183 Nigeria Lagos 1,010 3,138 2,128 211 Nigeria Maiduguri 2 7 5 250 Nigeria Mushin 6 22 16 267 Nigeria Ogbomosho 24 58 34 142 Nigeria Onitsha 6 15 9 150 Nigeria Oshogbo 8 19 11 138 Nigeria PortHarcourt 7 16 9 129 Nigeria Zaria 3 7 4 133 Senegal Dakar 307 473 166 54 Sierra Leone Freetown 20 33 13 65 Togo Lome 192 1,074 882 459

54
Region
Country
City
Current
Upgraded
Change
% Change
Central Angola Luanda 209 452 243 116 Burundi Bujumbura 22 26 4 18 Cameroon Douala 163 552 389 239 Cameroon Yaounde 110 499 389 354 Central African Republic Bangui 11 70 59 536 Congo, Democratic Republic Kinshasa 95 257 162 171 Congo, Democratic Republic Kananga 6 11 5 83 Congo, Democratic Republic Kisangani 7 12 5 71 Congo, Democratic Republic Kolwezi 16 32 16 100 Congo, Democratic Republic Lubumbashi 35 66 31 89 Congo, Democratic Republic Mbuji-Mayi 13 26 13 100 Congo, Republic of Brazzaville 58 152 94 162 Congo, Republic of Pointe-Noire 24 69 45 188 Equatorial Guinea Bata 36 53 17 47 Gabon Libreville 76 693 617 812 Rwanda Kigali 53 60 7 13 Zambia Lusaka 502 606 104 21 East Djibouti Djibouti 41 52 11 27 Eritrea Asmara 4 8 4 100 Ethiopia Addis Ababa 68 115 47 69 Kenya Mombasa 73 126 53 73 Kenya Nairobi 438 682 244 56 Malawi Blantyre-Limbe 94 106 12 13 Malawi Lilongwe 103 115 12 12 Sudan Khartoum 55 160 105 191 Tanzania Dodoma 5 7 2 40 Tanzania Dar es Salaam 243 362 119 49 Uganda Kampala 253 421 168 66 Southern Mozambique Beira 25 68 43 172 Mozambique Maputo 424 2,846 2,422 571 Zimbabwe Bulawayo 226 236 10 4 Zimbabwe Harare 447 496 49 11 South South Africa Capetown 338 644 306 91 South Africa Durban 189 584 395 209 South Africa East Rand 445 1,104 659 148 South Africa Johannesburg 674 1,626 952 141 South Africa Pretoria 319 807 488 153 South Africa Port Elizabeth 78 160 82 105 South Africa Sasolburg 165 387 222 135 South Africa Soweto 87 212 125 144 South Africa West Rand 205 498 293 143

55
Table A4 Network Upgrade Costs by Country
Total Upgrade Cost ($US Million) Upgrade Cost Per Km ($US ‘000)
Region Country
Baseline Low
(-1 SE) High
(+1 SE)
Baseline Low
(-1 SE) High
(+1 SE)
Network Length (Km)
West Benin 90 80 101 97 86 109 931
West Burkina Faso 215 179 258 135 113 162 1,590
West Chad 372 310 447 180 150 216 2,071
West Cote d'Ivoire 327 261 409 194 155 243 1,686
West Gambia, The 14 10 20 135 94 193 105
West Ghana 205 194 217 97 91 102 2,120
West Guinea 669 460 972 245 168 356 2,733
West Guinea-Bissau 112 75 168 250 168 373 450
West Liberia 102 76 138 209 155 283 489
West Mali 240 212 272 116 102 131 2,077
West Mauritania 65 42 99 309 202 474 209
West Niger 126 109 146 126 109 146 999
West Nigeria 554 474 646 70 60 82 7,890
West Senegal 240 186 309 122 95 157 1,964
West Sierra Leone 96 73 125 157 120 205 609
West Togo 50 45 55 71 64 78 703
Central Angola 1,704 1,115 2,604 586 384 896 2,906
Central Burundi 30 23 39 109 83 144 272
Central Cameroon 1,497 1,079 2,079 441 318 612 3,398
Central Central African Republic 1,235 898 1,698 520 378 715 2,375
Central Congo, Democratic Republic of 3,498 2,856 4,283 343 280 421 10,185
Central Congo, Republic of 343 255 461 396 294 532 867
Central Equatorial Guinea 60 41 88 550 376 804 109
Central Gabon 1,709 781 3,740 1,588 726 3,477 1,076
Central Rwanda 37 33 42 178 158 200 208
Central Zambia 481 428 541 136 121 153 3,534
East Djibouti 92 69 121 388 294 512 236
East Eritrea 33 29 37 139 124 156 236
East Ethiopia 999 858 1,163 236 203 274 4,239
East Kenya 367 319 422 147 127 169 2,504
East Malawi 161 139 186 130 113 151 1,236
East Somalia 293 232 371 113 90 143 2,590
East Sudan 406 340 484 124 104 148 3,282
East Tanzania 644 537 773 158 132 189 4,080
East Uganda 415 381 451 243 223 264 1,708
Southern Botswana 255 180 359 99 70 139 2,580
Southern Lesotho 1 0 1 204 180 231 2
Southern Mozambique 742 660 834 190 169 213 3,910
Southern Namibia 1,201 846 1,706 472 332 670 2,547
Southern Swaziland 159 97 259 622 381 1,014 255
Southern Zimbabwe 189 149 239 82 65 104 2,288
South South Africa 693 471 1,017 80 55 118 8,655
Total 20,715 15,601 28,380

56
Table A5 Network Maintenance Costs by Country
Total Cost ($US Million) Cost Per Km ($US ‘000)
Region Country
Baseline Low
(-1 SE) High
(+1 SE)
Baseline Low
(-1 SE) High
(+1 SE)
Network Length (Km)
West Benin 3.9 3.4 4.4 4.2 3.7 4.8 931
West Burkina Faso 9.3 7.8 11.2 5.9 4.9 7.1 1,590
West Chad 16.2 13.5 19.5 7.8 6.5 9.4 2,071
West Cote d'Ivoire 14.2 11.4 17.7 8.4 6.8 10.5 1,686
West Gambia, The 0.6 0.4 0.9 5.9 4.1 8.4 105
West Ghana 8.9 8.4 9.4 4.2 4 4.5 2,120
West Guinea 29.1 20.1 42.1 10.6 7.4 15.4 2,733
West Guinea-Bissau 4.9 3.3 7.3 10.9 7.3 16.2 450
West Liberia 4.5 3.3 6 9.1 6.7 12.3 489
West Mali 10.4 9.2 11.9 5 4.4 5.7 2,077
West Mauritania 2.8 1.8 4.3 13.4 8.8 20.5 209
West Niger 5.5 4.7 6.4 5.5 4.7 6.4 999
West Nigeria 24.1 20.4 28.5 3.1 2.6 3.6 7,890
West Senegal 10.4 8.1 13.5 5.3 4.1 6.9 1,964
West Sierra Leone 4.2 3.2 5.5 6.8 5.2 9 609
West Togo 2.2 1.9 2.4 3.1 2.8 3.4 703
Central Angola 74.1 49 112.2 25.5 16.9 38.6 2,906
Central Burundi 1.3 1 1.7 4.8 3.6 6.3 272
Central Cameroon 65.2 47.5 89.4 19.2 14 26.3 3,398
Central Central African Republic 53.7 39.5 73.1 22.6 16.6 30.8 2,375
Central Congo, Democratic Republic of 152.2 125.3 184.8 14.9 12.3 18.1 10,185
Central Congo, Republic of 14.9 11.2 19.9 17.2 12.9 23 867
Central Equatorial Guinea 2.6 1.8 3.8 23.9 16.5 34.7 109
Central Gabon 74.3 34.3 161.1 69.1 31.9 149.8 1,076
Central Rwanda 1.6 1.4 1.8 7.7 6.9 8.6 208
Central Zambia 20.9 18.6 23.6 5.9 5.3 6.7 3,534
East Djibouti 4 3.1 5.2 16.9 12.9 22 236
East Eritrea 1.4 1.3 1.6 6.1 5.4 6.8 236
East Ethiopia 43.5 37.6 50.3 10.3 8.9 11.9 4,239
East Kenya 16 13.9 18.3 6.4 5.6 7.3 2,504
East Malawi 7 6 8.1 5.7 4.9 6.6 1,236
East Somalia 12.8 10.1 16.2 4.9 3.9 6.2 2,590
East Sudan 17.7 14.8 21 5.4 4.5 6.4 3,282
East Tanzania 28 23.3 33.7 6.9 5.7 8.2 4,080
East Uganda 18 17 19.1 10.6 10 11.2 1,708
Southern Botswana 11.1 7.9 15.5 4.3 3.1 6 2,580
Southern Lesotho 0 0 0 8.9 8 9.8 2
Southern Mozambique 32.3 28.9 36 8.3 7.4 9.2 3,910
Southern Namibia 52.3 37.4 73.1 20.5 14.7 28.7 2,547
Southern Swaziland 6.9 4.3 11.1 27.1 16.8 43.6 255
Southern Zimbabwe 8.2 6.5 10.4 3.6 2.8 4.5 2,288
South South Africa 30.1 20.6 44 3.5 2.4 5.1 8,655
Total 901.3 683.2 1226
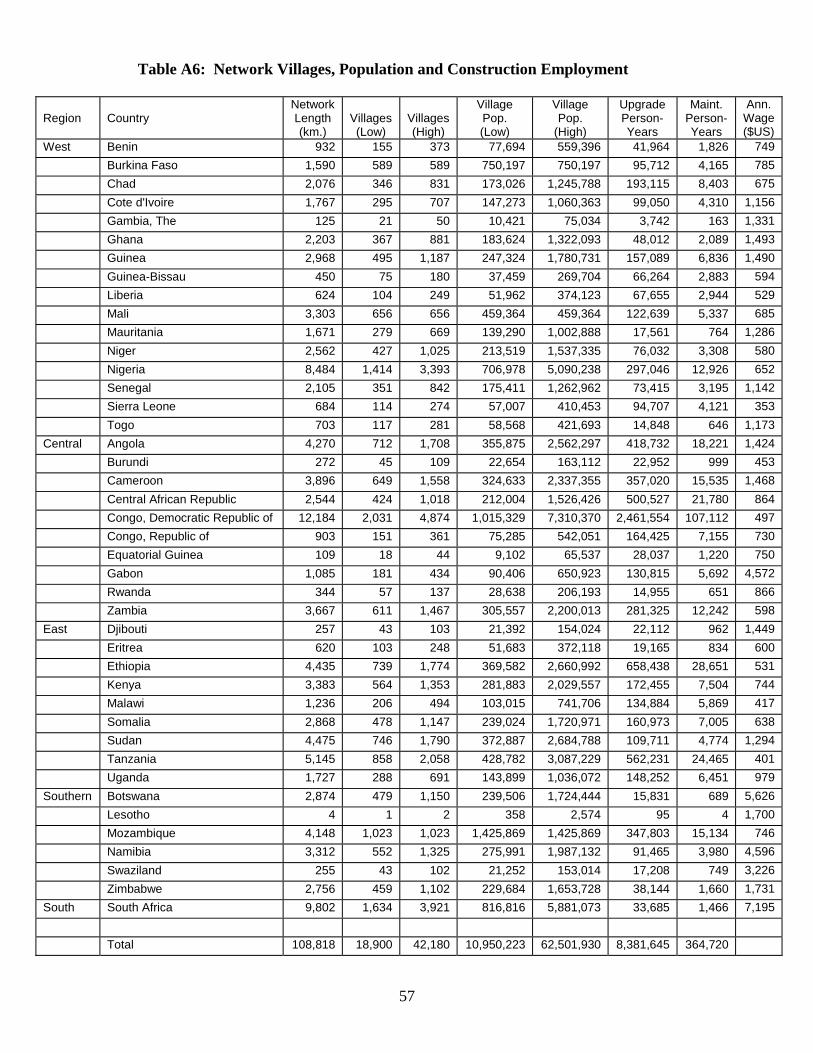
57
Table A6: Network Villages, Population and Construction Employment
Region
Country
Network Length (km.)
Villages (Low)
Villages (High)
Village Pop. (Low)
Village Pop.
(High)
Upgrade Person- Years
Maint. Person- Years
Ann. Wage ($US)
West Benin 932 155 373 77,694 559,396 41,964 1,826 749
Burkina Faso 1,590 589 589 750,197 750,197 95,712 4,165 785
Chad 2,076 346 831 173,026 1,245,788 193,115 8,403 675
Cote d'Ivoire 1,767 295 707 147,273 1,060,363 99,050 4,310 1,156
Gambia, The 125 21 50 10,421 75,034 3,742 163 1,331
Ghana 2,203 367 881 183,624 1,322,093 48,012 2,089 1,493
Guinea 2,968 495 1,187 247,324 1,780,731 157,089 6,836 1,490
Guinea-Bissau 450 75 180 37,459 269,704 66,264 2,883 594
Liberia 624 104 249 51,962 374,123 67,655 2,944 529
Mali 3,303 656 656 459,364 459,364 122,639 5,337 685
Mauritania 1,671 279 669 139,290 1,002,888 17,561 764 1,286
Niger 2,562 427 1,025 213,519 1,537,335 76,032 3,308 580
Nigeria 8,484 1,414 3,393 706,978 5,090,238 297,046 12,926 652
Senegal 2,105 351 842 175,411 1,262,962 73,415 3,195 1,142
Sierra Leone 684 114 274 57,007 410,453 94,707 4,121 353
Togo 703 117 281 58,568 421,693 14,848 646 1,173
Central Angola 4,270 712 1,708 355,875 2,562,297 418,732 18,221 1,424
Burundi 272 45 109 22,654 163,112 22,952 999 453
Cameroon 3,896 649 1,558 324,633 2,337,355 357,020 15,535 1,468
Central African Republic 2,544 424 1,018 212,004 1,526,426 500,527 21,780 864
Congo, Democratic Republic of 12,184 2,031 4,874 1,015,329 7,310,370 2,461,554 107,112 497
Congo, Republic of 903 151 361 75,285 542,051 164,425 7,155 730
Equatorial Guinea 109 18 44 9,102 65,537 28,037 1,220 750
Gabon 1,085 181 434 90,406 650,923 130,815 5,692 4,572
Rwanda 344 57 137 28,638 206,193 14,955 651 866
Zambia 3,667 611 1,467 305,557 2,200,013 281,325 12,242 598
East Djibouti 257 43 103 21,392 154,024 22,112 962 1,449
Eritrea 620 103 248 51,683 372,118 19,165 834 600
Ethiopia 4,435 739 1,774 369,582 2,660,992 658,438 28,651 531
Kenya 3,383 564 1,353 281,883 2,029,557 172,455 7,504 744
Malawi 1,236 206 494 103,015 741,706 134,884 5,869 417
Somalia 2,868 478 1,147 239,024 1,720,971 160,973 7,005 638
Sudan 4,475 746 1,790 372,887 2,684,788 109,711 4,774 1,294
Tanzania 5,145 858 2,058 428,782 3,087,229 562,231 24,465 401
Uganda 1,727 288 691 143,899 1,036,072 148,252 6,451 979
Southern Botswana 2,874 479 1,150 239,506 1,724,444 15,831 689 5,626
Lesotho 4 1 2 358 2,574 95 4 1,700
Mozambique 4,148 1,023 1,023 1,425,869 1,425,869 347,803 15,134 746
Namibia 3,312 552 1,325 275,991 1,987,132 91,465 3,980 4,596
Swaziland 255 43 102 21,252 153,014 17,208 749 3,226
Zimbabwe 2,756 459 1,102 229,684 1,653,728 38,144 1,660 1,731
South South Africa 9,802 1,634 3,921 816,816 5,881,073 33,685 1,466 7,195
Total 108,818 18,900 42,180 10,950,223 62,501,930 8,381,645 364,720

58
Table A7: Trade Agreements in Sub-Saharan Africa
Country WAEMU CEMAC EAC ECOWAS SADC COMESA
Benin X X Burkina Faso X X Cote d'Ivoire X X Guinea-Bissau X X Mali X X Niger X X Senegal X X Togo X X Cameroon X Central African Republic X Chad X Congo, Republic of X Equatorial Guinea X Gabon X Kenya X X Tanzania X X Uganda X X Gambia, The X Ghana X Guinea X Liberia X Nigeria X Sierra Leone X Angola X X Botswana X Congo, Democratic Republic X X Lesotho X Malawi X X Mozambique X Namibia X South Africa X Swaziland X X Zambia X X Zimbabwe X X Burundi X Djibouti X Eritrea X Ethiopia X Rwanda X Sudan X Mauritania Somalia