
Rising Food Prices: Causes, Consequences and Policy Dilemmas Nora Lustig Samuel Z. Stone Professor...
44
Rising Food Prices: Causes, Consequences and Policy Dilemmas Nora Lustig Samuel Z. Stone Professor of Latin American Economics Tulane University Nonresident Fellow Center for Global Development and Inter-American Dialogue AIDMI (All India Disaster Mitigation Inst.), Ahmedabad, India January 10, 2012
-
Upload
george-rich -
Category
Documents
-
view
221 -
download
1
Transcript of Rising Food Prices: Causes, Consequences and Policy Dilemmas Nora Lustig Samuel Z. Stone Professor...

Rising Food Prices: Causes, Consequences and
Policy DilemmasNora Lustig
Samuel Z. Stone Professor of Latin American EconomicsTulane University
Nonresident Fellow Center for Global Development and Inter-American Dialogue
AIDMI (All India Disaster Mitigation Inst.), Ahmedabad, India
January 10, 2012

“The world food system today is far too complex for common sense to understand. “
Ela R. Bhatt Food Must Not be Reduced to Security, December 2011

Food is special…
• Most basic of basic needs; for the poor, food has no substitutes; energy for human survival
• There are both net food producers and net food consumers among the poor
And, with biofuels,• Food commodities have turned into industrial
commodities; energy for machines
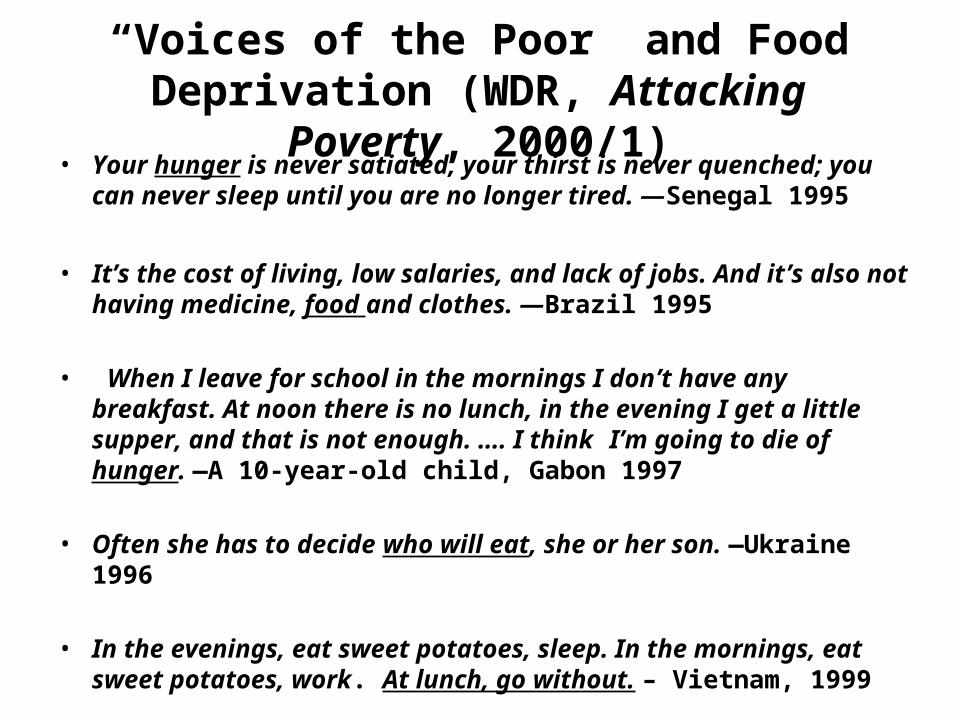
“Voices of the Poor” and Food Deprivation (WDR, Attacking Poverty, 2000/1)
• Your hunger is never satiated, your thirst is never quenched; you can never sleep until you are no longer tired. —Senegal 1995
• It’s the cost of living, low salaries, and lack of jobs. And it’s also not having medicine, food and clothes. —Brazil 1995
• When I leave for school in the mornings I don’t have any breakfast. At noon there is no lunch, in the evening I get a little supper, and that is not enough. …. I think I’m going to die of hunger. —A 10-year-old child, Gabon 1997
• Often she has to decide who will eat, she or her son. —Ukraine 1996 • In the evenings, eat sweet potatoes, sleep. In the mornings, eat sweet
potatoes, work. At lunch, go without. – Vietnam, 1999

Rising Food Prices
• Causes: what do think we know? What do we need to know? Will we ever know?
• Consequences: does the debate of whether the poor benefit or get hurt from higher food prices really matter?
• Policy responses: – Macro policies and market-specific interventions
to insulate domestic prices– Safety nets


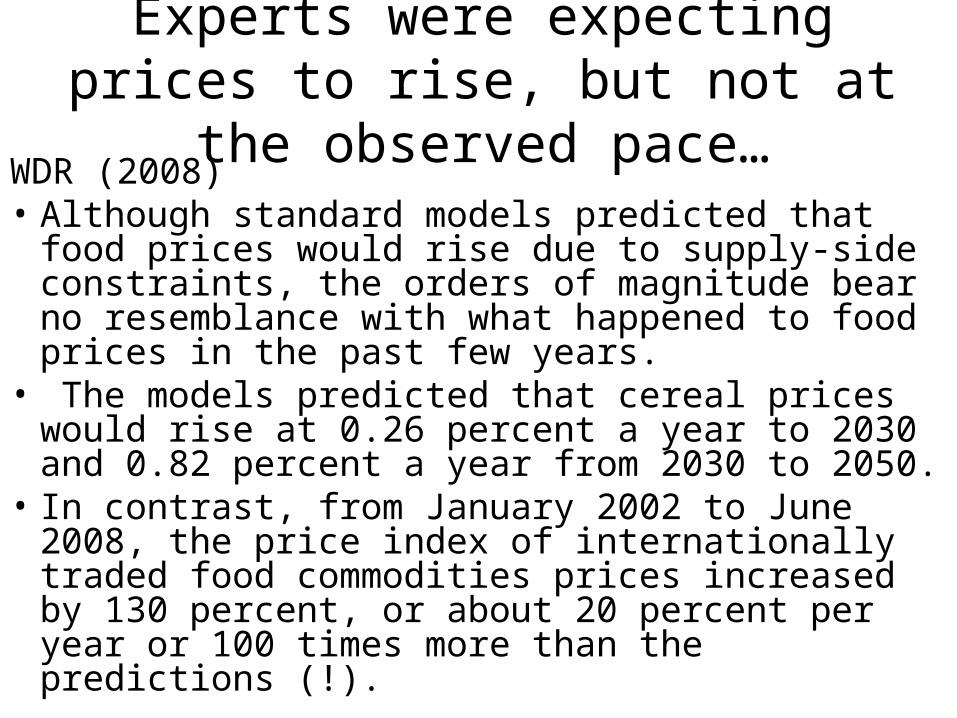
Experts were expecting prices to rise, but not at the observed pace…
WDR (2008)• Although standard models predicted that food
prices would rise due to supply-side constraints, the orders of magnitude bear no resemblance with what happened to food prices in the past few years.
• The models predicted that cereal prices would rise at 0.26 percent a year to 2030 and 0.82 percent a year from 2030 to 2050.
• In contrast, from January 2002 to June 2008, the price index of internationally traded food commodities prices increased by 130 percent, or about 20 percent per year or 100 times more than the predictions (!).

Volatility has become very difficult to predict…
IMF (WEO, 2011):
• Food prices are 80 percent higher than they were in 2000.
• In 2000, food prices were at their lowest in decades.
• Volatility high, which makes it hard to predict.


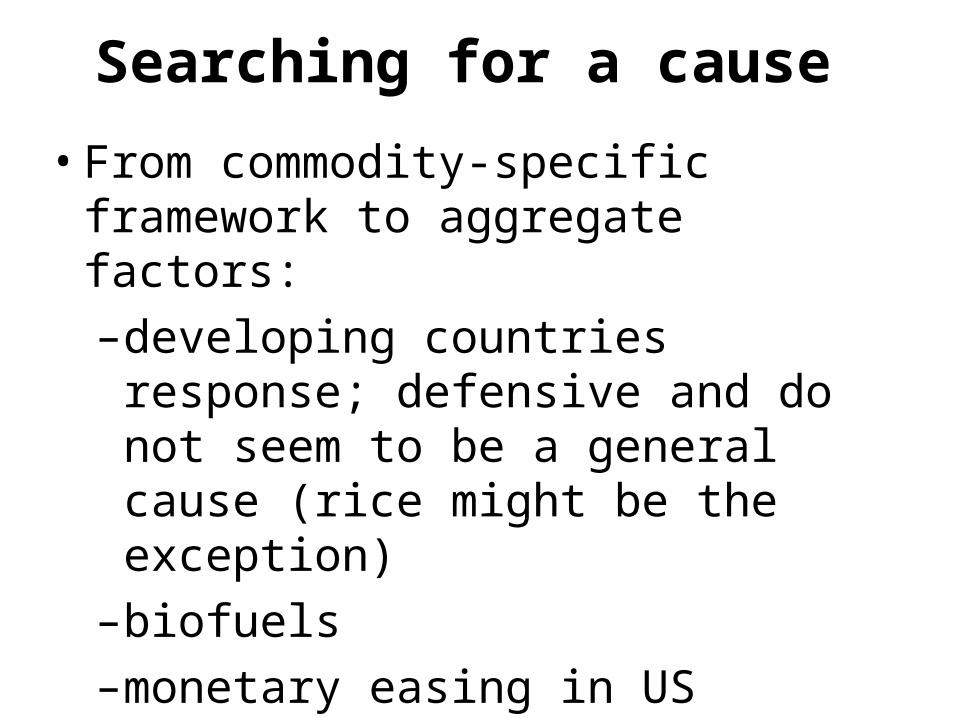
Searching for a cause • From commodity-specific framework to
aggregate factors: –the “China/India- effect”-- no evidence
of surge in demand; demand for food consumption and supply rose at the same pace (1.7%/yr)
–dollar depreciation-- prices rose in all major currencies
–higher energy costs – could account for less than 20 percent

Commodity Prices in Major Currencies, January 2000-June 2008 (cont.)
60
80
100
120
140
160
180
200
220
Jan-
00
May
-00
Sep-
00
Jan-
01
May
-01
Sep-
01
Jan-
02
May
-02
Sep-
02
Jan-
03
May
-03
Sep-
03
Jan-
04
May
-04
Sep-
04
Jan-
05
May
-05
Sep-
05
Jan-
06
May
-06
Sep-
06
Jan-
07
May
-07
Sep-
07
Jan-
08
May
-08
US dollars Euros Yen Canadian dollars
Non-Fuel Commodity Price Index (January 2000=100)
Source: Author’s construction with data from IFS, IMF for prices and OECD Stat for exchange rates. cont.
Searching for a cause
• From commodity-specific framework to aggregate factors: –developing countries response;
defensive and do not seem to be a general cause (rice might be the exception)
–biofuels –monetary easing in US

Export Restrictions and the Price of Rice, June 2007-July 2008
200
400
600
800
1000
Jun-
07
Jul-0
7
Aug
-07
Sep-
07
Oct
-07
Nov
-07
Dec
-07
Jan-
08
Feb-
08
Mar
-08
Apr
-08
May
-08
Jun-
08
Jul-0
8
US$
per
met
ric
tonn
e
India imposes export restrictions
Vietnam tightensexport restrictions
Philippines March tender>$700/ton
Philippines April tender>$1,100/ton
Japan announces release of rice
stocks
Source: IMF Primary Commodity Prices Database. Export policies from Slayton and Timmer (2008) and Timmer (2008). Based on a graph by Slayton and Timmer (2008).

Two Major Drivers • Biofuels: structural shift in demand since
2004; for maize, it grew at around 40 percent a year and accounted for 70-80 percent of increase in demand
• Macroeconomic Factors: monetary easing => inflationary expectations, depreciation of dollar and assets (Great Recession) and securitization of food commodities (price increase acceleration 2007-2008)

17
Surge in demand for industrial (biofuels) use of corn and oilseeds
• Between 2004 and 2007– Feed use of corn grew by 1.5 percent a year and
food use of oilseeds grew by 3 percent a year– Industrial use grew by 36 percent and 11 percent,
respectively=>Demand for corn- and oilseeds-based biofuels is a major driver of food commodities price increases. =>Estimates range from a third to 60 percent (Collins, 2008; Mitchell, 2008; Rosegrant, 2008).
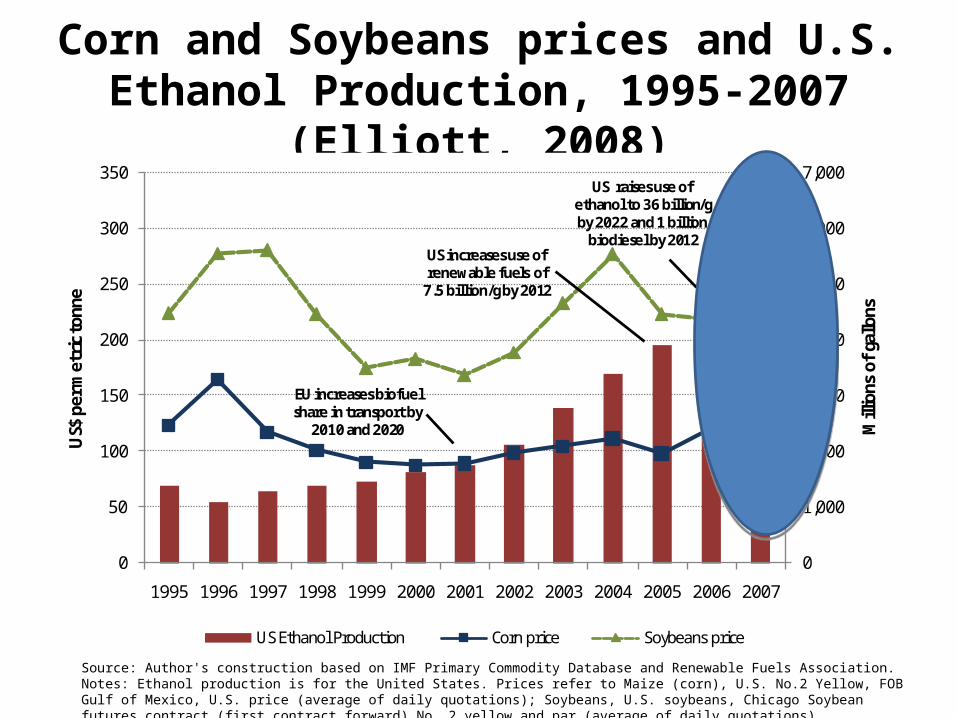
Corn and Soybeans prices and U.S. Ethanol Production, 1995-2007 (Elliott, 2008)
0
1,000
2,000
3,000
4,000
5,000
6,000
7,000
0
50
100
150
200
250
300
350
1995 1996 1997 1998 1999 2000 2001 2002 2003 2004 2005 2006 2007
Mill
ions
of
gallo
ns
US$
per
met
ric
tonn
e
US Ethanol Production Corn price Soybeans price
US raises use of ethanol to 36 billion/g by 2022 and 1 billion
biodiesel by 2012US increases use of renewable fuels of
7.5 billion/g by 2012
EU increases biofuelshare in transport by
2010 and 2020
Source: Author's construction based on IMF Primary Commodity Database and Renewable Fuels Association. Notes: Ethanol production is for the United States. Prices refer to Maize (corn), U.S. No.2 Yellow, FOB Gulf of Mexico, U.S. price (average of daily quotations); Soybeans, U.S. soybeans, Chicago Soybean futures contract (first contract forward) No. 2 yellow and par (average of daily quotations).

Biofuels
• “Discovery” of biofuels– => converted food crops into cash crops on a large scale;
structural shift– => from an income elasticity below unity to one above
unity; if energy prices remain high, demand pressure for raw materials used in biofuels will remain high
– =>existing estimates from 30 to 60% of the increase in food commodities prices due to biofuels
– => higher oil prices get transmitted to food commodities not because of higher costs (small contribution) but because now food crops and oil are “substitutes”

20
Implications
• The surge in demand for food commodities for industrial purposes (biofuels) represents a structural break with the past.
• Food commodities prices will be:– Secularly higher (income elasticity for energy is around
one while for food is below one): level effect.– More sensitive to the same forces that affect the prices of
nonrenewable energy sources such as oil: increased volatility.
• In contrast to the past, demand for food commodities will fluctuate with the business cycle and be affected by policy-related supply shocks in the oil market.
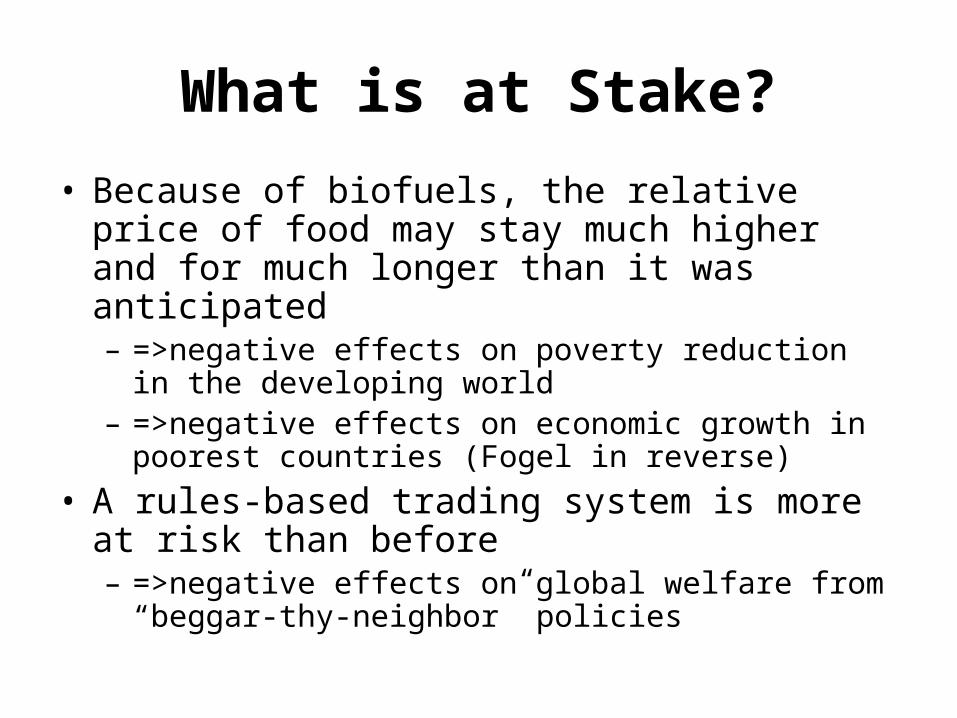
What is at Stake?
• Because of biofuels, the relative price of food may stay much higher and for much longer than it was anticipated – =>negative effects on poverty reduction in the developing
world – =>negative effects on economic growth in poorest
countries (Fogel in reverse)• A rules-based trading system is more at risk than
before– =>negative effects on global welfare from “beggar-thy-
neighbor” policies

Policy response in developing countries may exacerbate
pressure on international prices
• Developing countries will continue to go their own way (restricting exports, subsidizing home production) because biofuels subsidies create a huge negative externality on food prices
• How and on what grounds can this tendency be stopped? Moral imperative is low; leverage is low

23
Macroeconomic Factors: Monetary Easing in the US
• Curious fact: Since mid-2007 to mid-2008 commodity price rises accelerated while the global economy started to slow-down: – =>for food commodities a third of the increase occurred in
15 percent of the time.
• Explanation: as US Fed started to lower interest rates in the wake of subprime crisis, investors shifted resources away from dollar instruments into everything else: foreign currencies, foreign stocks and commodities.– => foreign currencies appreciated, foreign stock markets
boomed and commodity prices soared.
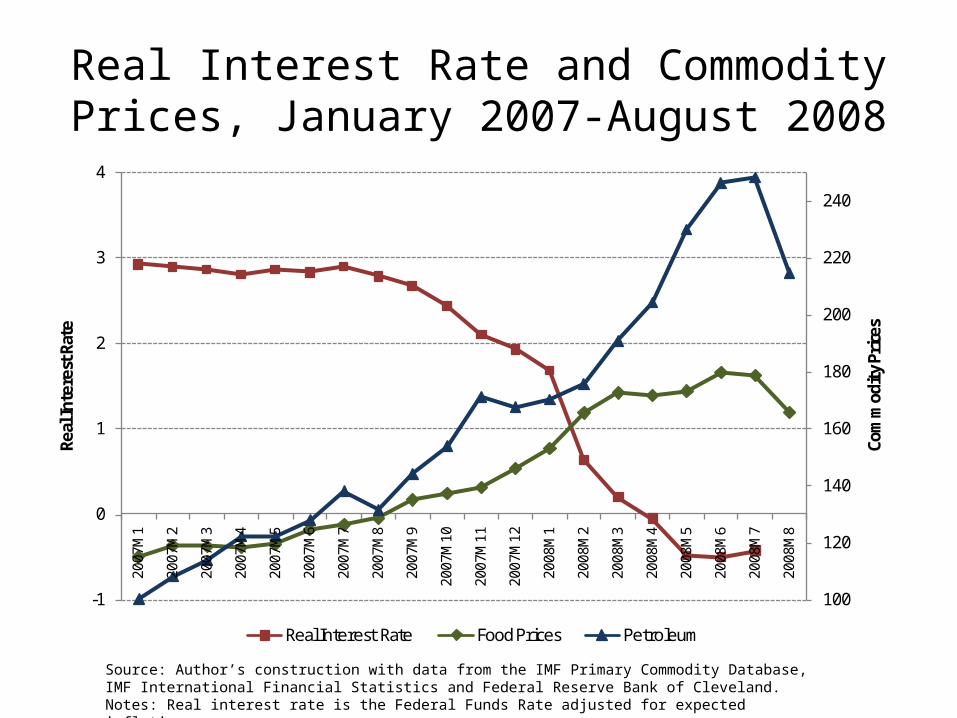
Real Interest Rate and Commodity Prices, January 2007-August 2008
100
120
140
160
180
200
220
240
-1
0
1
2
3
4
2007
M1
2007
M2
2007
M3
2007
M4
2007
M5
2007
M6
2007
M7
2007
M8
2007
M9
2007
M10
2007
M11
2007
M12
2008
M1
2008
M2
2008
M3
2008
M4
2008
M5
2008
M6
2008
M7
2008
M8
Com
mod
ity
Pric
es
Real
Inte
rest
Rat
e
Real Interest Rate Food Prices Petroleum
Source: Author’s construction with data from the IMF Primary Commodity Database, IMF International Financial Statistics and Federal Reserve Bank of Cleveland. Notes: Real interest rate is the Federal Funds Rate adjusted for expected inflation.

25
• Unclear whether this process was driven by:– Inflationary expectations. (Frankel, 2008;
Calvo, 2008)– Expectations based on what in retrospect
were misperceptions about global economy (i.e., belief in “decoupling”).
– Price bubble.• This process came to a halt with the
realization that crisis was global and the dollar became a safe-haven in the wake of Lehman’s collapse.

The Main Drivers of Rising Food Commodities Prices: A Summary of the Literature
Excessively low prices in the past; market- and agricultural support and R&D policy driven
Excessively low prices in the past; market- and agricultural support and R&D policy driven
Diversion of food to biofuels production; market and biofuels policy driven
Soaring energy prices; market and oil policy driven
Dollar depreciation; macroeconomic policySlowdown in output growth of agricultural
commodities; sectoral and R&D policy driven
Reduction in US interest rates; macroeconomic policyBad weather and crop disease; natural causes and
policy(climate-change and disease-prevention) driven
Expansive macroeconomic policies resulting in too high global economic growth; macroeconomic policy
Export bans and export taxes; defensive policy response which exacerbates pressure on tight
markets
Increase in food demand due to rising living standards; market-driven
Diversion of food to biofuels production; market and biofuels policy driven
Excessively low prices in the past; market- and agricultural support and R&D policy driven
Excessively low prices in the past; market- and agricultural support and R&D policy driven
Speculation; market-driven and regulatory policy Soaring energy prices; market and oil policy driven
Food hoarding and panic buying; defensive response which exacerbates pressure on tight markets
Policy Driven
Market Driven
Demand Supply
General subsidies, price controls, reduction of import barriers and out-of-the ordinary purchases on the part of
governments in developing countries; defensive policy response which exacerbates pressure on tight markets

27
Impact of rising food prices on poverty
• An “old” debate: are higher food prices good or bad for the poor?
• Answer: both– Net sellers (rural poor with land and agricultural workers)
benefit.– Net buyers (landless peasants and urban poor) get hurt.
• Majority of studies show that those who get hurt outnumber those who benefit:– Headcount ratio higher.– Severity of poverty (the squared poverty gap) higher.
[for example, Ackah and Appleton (2007); Barrett and Dorosh (1996); Deaton (1989); Lustig (1986); Mellor (1978); Pinstrup-Andersen (1987); Ravallion and van de Walle (1991); Ravallion (1990); Trairatvorakul (1984)]
28
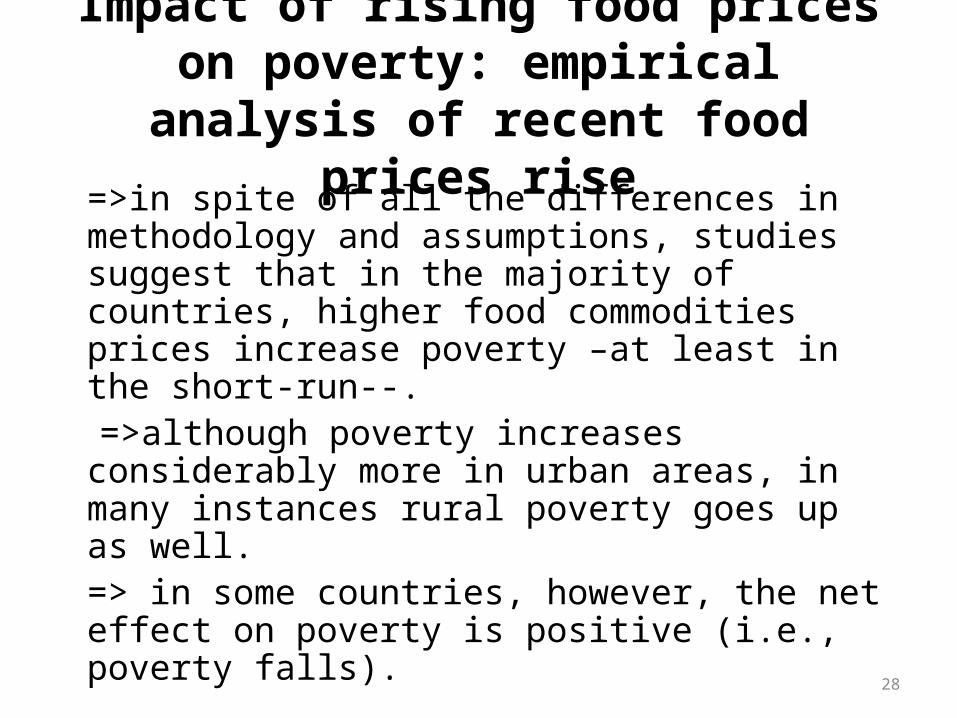
Impact of rising food prices on poverty: empirical analysis of recent food prices
rise=>in spite of all the differences in methodology and assumptions, studies suggest that in the majority of countries, higher food commodities prices increase poverty –at least in the short-run--.
=>although poverty increases considerably more in urban areas, in many instances rural poverty goes up as well.=> in some countries, however, the net effect on poverty is positive (i.e., poverty falls).

29
Percentage points change in poverty rates from 2005-7 price changes
Source: Ivanic and Martin (2008)
-4
-2
0
2
4
6
8
10
12
Rural
Urban
Total
Impact of rising food prices on poverty
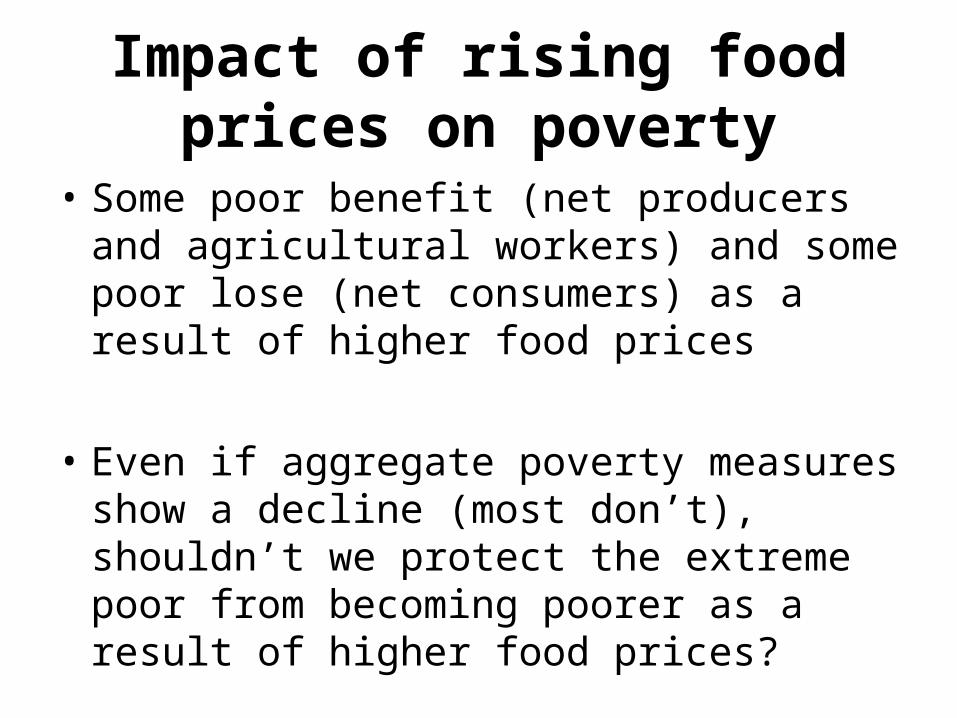
• Some poor benefit (net producers and agricultural workers) and some poor lose (net consumers) as a result of higher food prices
• Even if aggregate poverty measures show a decline (most don’t), shouldn’t we protect the extreme poor from becoming poorer as a result of higher food prices?

Poverty Impacts of Recent Increases in Food Prices: A Summary of Available Studies
Ivanic and Martin (2008) Wodon et al. (2008) ADB (2008) IADB (2008) CEPAL (2008)
RESULTS
Poverty increases in all countries with the exception of Peru. The 2005-2008Q1 price increase scenario increases national poverty rates by 4.5
percentage points on average (calculating estimates for all low income countries: additional 105
million people in poverty).
Poverty increases. A 50% increase in prices leads to an average increase
of the headcount poverty of 4.4 percentage points (or 2.5 with producer impacts). An average
increase of 3.5 percentage points at the national level in SSA would lead to to around 30 million people in poverty
Poverty and inequality increase in the short-term. In the medium-term it depends. A 20% food price increase in
Philippines and Pakistan increases the number of poor
by 5.65 and 14.67 million, respectively.
Poverty increases by 4.3 percentage points or 21 million additional poor
individuals (net effect)*. For example, total income poverty
increases by 8 percentage points in Guatemala (net
effect of intl. price increase), 6.9 in Mexico and 6.5 in El
Salvador
Indigence increases from 12.7 (68.5 million people) to
14.7 (79.1 million people) with income effects. Poverty increases from 35.1 (189.5 million people) to 37 (199.6 million) with income effects
COUNTRIESBolivia, Cambodia, Madagascar,
Malawi, Nicaragua, Pakistan, Peru, Vietnam and Zambia
Burkina Faso, DRC, Ghana, Gabon, Guinea, Liberia, Mali, Niger, Nigeria,
Senegal, Sierra Leone, Togo
Short-term Pakistan and Philippines; medium-term
China and IndonesiaNineteen countries in LAC
Estimates are for Latin America and the Caribbean
as a whole
METHODShort-term impact; Deaton's
framework and GTAP for wage effects
Short-term impact; Deaton's framework
Short-term/partial application of Deaton's framework with budget shares only and no
income shares; medium term impacts with CGE model
which incorporates supply response
Upper bound increase poverty line by 30%
(multiplication of increase in world prices of commodities (.68) times average share of six food commodities (.435)
while rest of prices are assumed unchanged). Lower bound assumes an increase
in agricultural workers' income equal to world price
increases
Not described in note (will be published shortly)

Poverty Impacts of Recent Increases in Food Prices: A Summary of Available Studies (cont.)
Ivanic and Martin (2008) Wodon et al. (2008) ADB (2008) IADB (2008) CEPAL (2008)
INCLUDES NET SELLERS
Yes
Upper bound estimates include net-buyers only; lower bound estimates
assume net-sellers receive price increase in full
Short-term estimates includes buyers only; medium-
term CGE should include effects on net sellers
No No
WAGE EFFECTS Yes No Medium-term CGE yesAssumes agricultural workers'
incomes riseAssumes everybody's
income rose 5%SUBSTITUTION
EFFECTNo No Medium-term CGE yes No No
PRICE INCREASE
Three simulations: 1. 10% uniform increase/pass through equal to 1; 2. 2005-07 actual
FAO/pass through .66; 3. 2005-2008Q1**
Simulate price increases of 25% and 50%; price increases are the same for
all countries and all food items
Simulate food price increases of 10%, 20% and 30%
Simulates the impact of the IFS estimate of price
increases for six commodities from Jan 06 to March 08
(68.1%); full pass through to domestic prices. Also,
simulates price increases estimated by central banks
Assumes a 15% increase in food prices
POVERTY LINE 1 dollar a day in PPP 1 dollar a day Country-specific poverty lines Country-specific poverty linesCountry-specific poverty lines for moderate and
extreme povertyPOVERTY MEASURE
Headcount ratio and poverty gap ratio
Headcount ratioChange in absolute number
of poor; Gini coefficientHeadcount ratio and poverty
gap ratioHeadcount ratio and number
of poor individuals
ROBUSTNESS CHECKS
Poverty line; price increases; labor market segmentation
Simulation of two levels of price increases and upper and lower
bounds
Simulation of three levels of price increases
None that are mentioned None that are mentioned
33
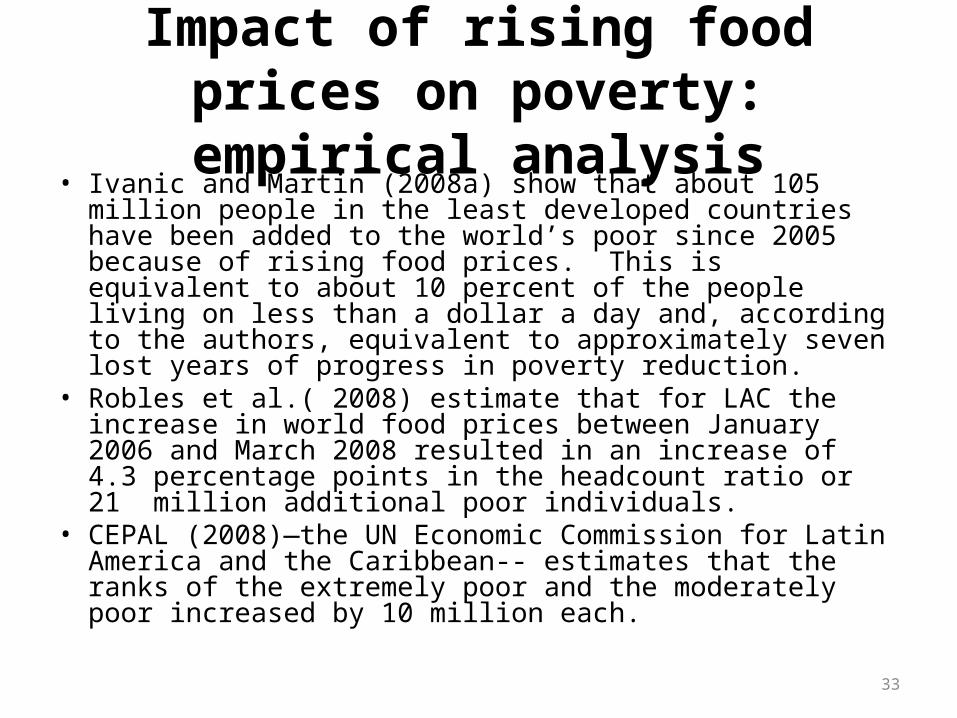
Impact of rising food prices on poverty: empirical analysis
• Ivanic and Martin (2008a) show that about 105 million people in the least developed countries have been added to the world’s poor since 2005 because of rising food prices. This is equivalent to about 10 percent of the people living on less than a dollar a day and, according to the authors, equivalent to approximately seven lost years of progress in poverty reduction.
• Robles et al.( 2008) estimate that for LAC the increase in world food prices between January 2006 and March 2008 resulted in an increase of 4.3 percentage points in the headcount ratio or 21 million additional poor individuals.
• CEPAL (2008)—the UN Economic Commission for Latin America and the Caribbean-- estimates that the ranks of the extremely poor and the moderately poor increased by 10 million each.

34
Impact of rising food prices on poverty: empirical
analysis• Asian Development Bank (2008) suggests that a 20%
increase in food prices would raise the number of poor individuals by 5.65 and 14.67 million in Philippines and Pakistan, respectively.
• Wodon et al. (2008) estimate that a 50% increase in food prices leads to an average increase of the headcount ratio of 4.4 percent. pts. In Sub-Saharan African countries (2.5 if producers are included)
• Haq et al. (2008) found that food price increases in Pakistan might have increased urban poverty by 44.6 percent and rural poverty by 32.5 percent.
• Valero-Gil and Valero (2008) find that moderate consumption poverty increased from 25 to 33.5 percent and extreme poverty from 10.58 to 15.95 percent with the spike in food prices during 2008 even after taking into account the positive effects of reduced taxes and tariffs and higher cash transfers to the poor.
• Warr (2008) finds that higher food prices, especially staple grains, worsen poverty incidence in Thailand despite the presence of large numbers of poor farmers, many of whom benefit from higher prices.


37
Standard policy recommendations• To contain inflationary pressures:
– If country has large international reserves, currency can be appreciated (e.g., Central Bank sells dollars).
– If reserves are not large or if exchange rate appreciation has already been too large, tighten fiscal policies
• To mitigate the impact on the poor:– Use targeted safety nets (cash transfers, food
stamps, school feeding programs, food-for-work, food distribution programs)

38
Policy dilemmas are significant
• An appreciation of the local currency creates disincentives to exporters and hurts import-competing sectors and, in more extreme cases, it can slow down growth.
• Tight monetary (i.e., raising domestic interest rates) and fiscal (i.e., cutting down on expenditures) policies have a dampening effect on economic activity.
39
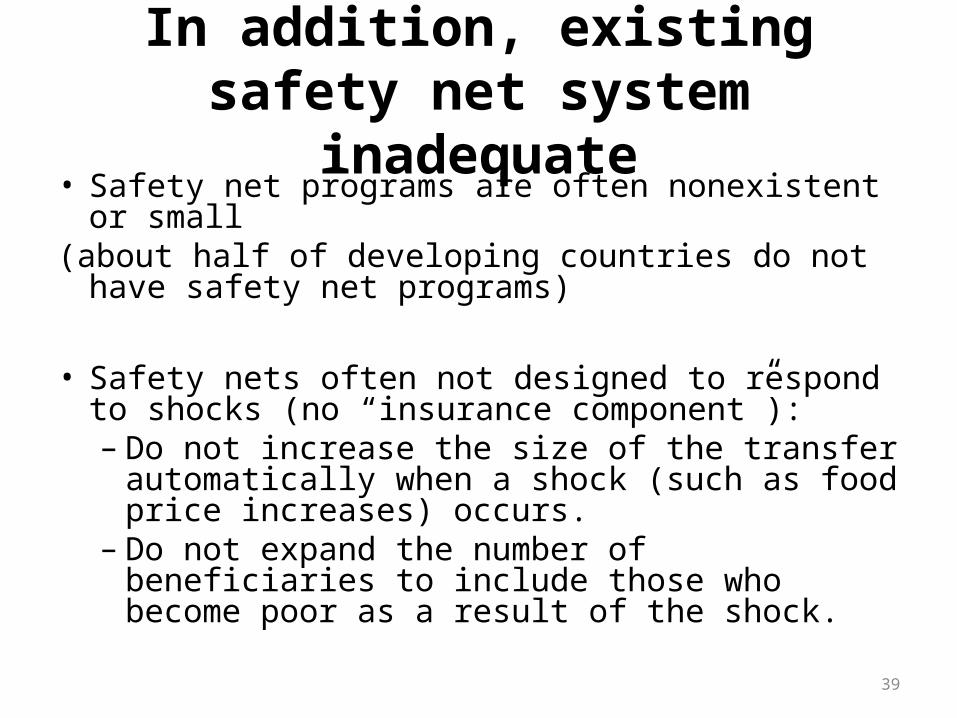
In addition, existing safety net system inadequate
• Safety net programs are often nonexistent or small(about half of developing countries do not have safety
net programs)
• Safety nets often not designed to respond to shocks (no “insurance component”):– Do not increase the size of the transfer
automatically when a shock (such as food price increases) occurs.
– Do not expand the number of beneficiaries to include those who become poor as a result of the shock.
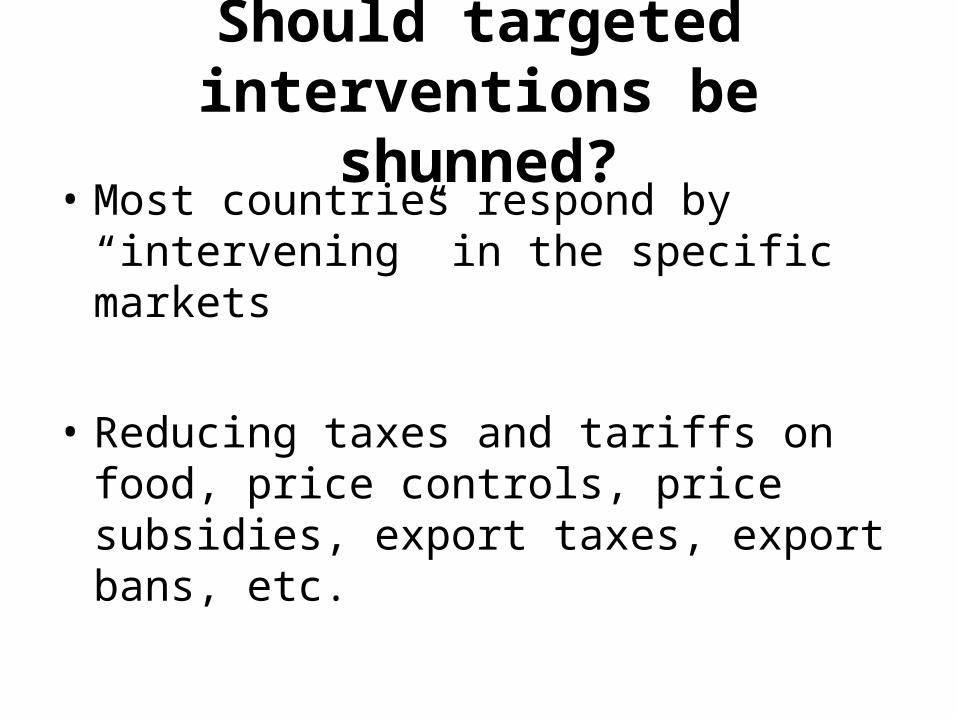
Should targeted interventions be shunned?
• Most countries respond by “intervening” in the specific markets
• Reducing taxes and tariffs on food, price controls, price subsidies, export taxes, export bans, etc.
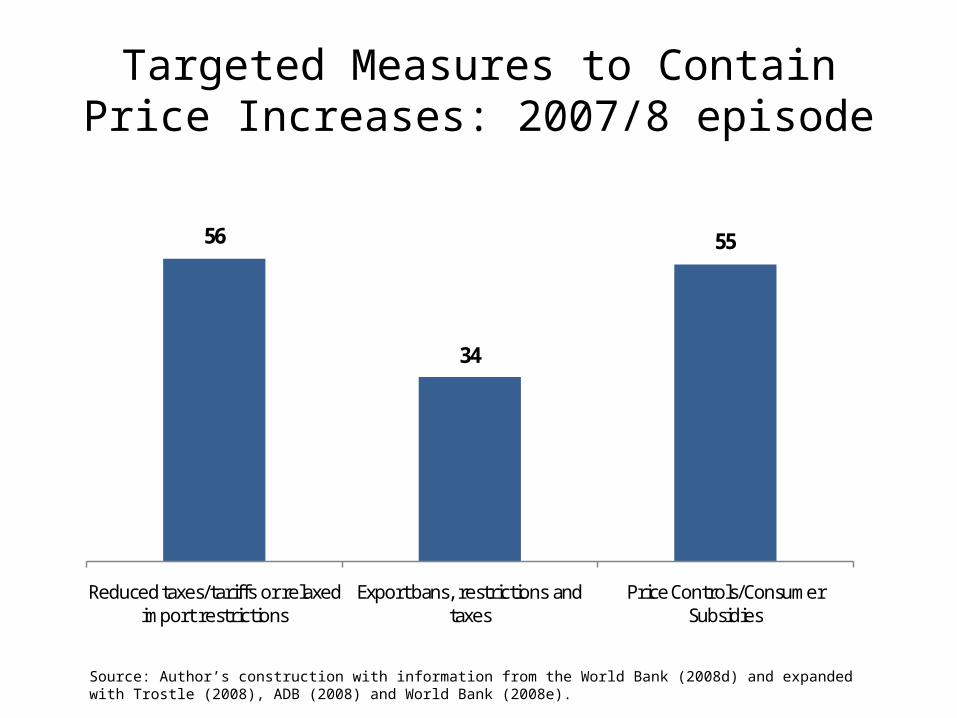
Targeted Measures to Contain Price Increases: 2007/8 episode
56
34
55
Reduced taxes/tariffs or relaxed import restrictions
Export bans, restrictions and taxes
Price Controls/Consumer Subsidies
Source: Author’s construction with information from the World Bank (2008d) and expanded with Trostle (2008), ADB (2008) and World Bank (2008e).

42
Policy response exacerbated upward pressure on prices
• Ivanic, Martin, Mattoo and Subramanian (2008) show that if developing countries try to offset a fifty percent increase in the world prices of rice, corn, wheat and soybeans applying policy responses aimed at restoring individual countries' domestic prices, world market prices will rise by 10 to 30 percentage points.
• But, developing countries are likely to succeed in not only lowering their market prices by a few percentage points but also in lowering their market price volatility.
• Safety nets to the poor may not avoid the former.• Are there some interventions less damaging than
others?

Sources
• Lustig, N. “Thought for Food: the Challenges of Coping with Soaring Food Prices,” Working Paper No. 155, Center for Global Development, Washington, D.C., November 2008.
http://www.cgdev.org/content/publications/detail/967250• Lustig, N.“Coping with Rising Food Prices: Policy Dilemmas in the Developing
World,” Working Paper No. 164, Center for Global Development, March 2009 and Tulane Economics Department Working Paper 0907, May 2009. http://www.cgdev.org/content/publications/detail/1421334 and http://ideas.repec.org/p/tul/wpaper/0907.html
• Lustig, N. “The Curse of Volatile Food Prices: Policy Dilemmas in the Developing World,” in Natural Resources and Development, Mavrotas, George, editor, Edward Elgar Publishers, Cheltenham: UK, forthcoming.