Commitment to Equity (CEQ): A Diagnostic Framework to Assess Governments’ Fiscal Policies Nora...
59
Commitment to Equity (CEQ): A Diagnostic Framework to Assess Governments’ Fiscal Policies Nora Lustig Dept. of Economics, Tulane University Non-resident Fellow, CGD & IAD Inter-American Development Bank Washington DC - March 2, 2011 1
-
Upload
madlyn-lynch -
Category
Documents
-
view
216 -
download
0
Transcript of Commitment to Equity (CEQ): A Diagnostic Framework to Assess Governments’ Fiscal Policies Nora...

1
Commitment to Equity (CEQ):A Diagnostic Framework to
Assess Governments’ Fiscal Policies
Nora LustigDept. of Economics, Tulane University
Non-resident Fellow, CGD & IADInter-American Development Bank
Washington DC - March 2, 2011

2
Background
• Joint project Inter-American Dialogue and Tulane University’s CIPR and Economics Dept.
• Develop diagnostic and ranking tools to quantify, compare, and publicize the extent to which Latin American governments use fiscal policies to reduce poverty and inequality
• Financial Support from the Canadian International Development Agency (primary funder), the Norwegian Ministry of Foreign Affairs, the United Nations Development Programme’s Regional Bureau for Latin America and the Caribbean, and the General Electric Foundation

Presentation Outline
• Motivation• CEQ Assessment
– methodological framework – questionnaire – indicatorsLustig (2011)“Commitment to Equity (CEQ): A Diagnostic Framework
to Assess Governments’ Fiscal Policies .” (distributed)
• Pilot studies: preliminary results– Argentina (Carola Pessino, Univ. Torcuato
di Tella, 2011)– Mexico (John Scott, CIDE & CONEVAL,
2011) 3

4
Inequality, Poverty and Fiscal Policy in LA
• Thanks to the expansion of education, macro stability and monetary transfers, inequality and poverty have been falling since approx. 2000
• However, – Latin America is still relatively very
unequal– extreme poverty is too high for its level of
per capita GDP– redistributive power of the state through
fiscal policy is grossly underutilized

Inequality has been declining: 2000-2009 (Annual Change in Gini; Lopez-Calva & Lustig, 2011)
Ecu
ador
Para
guay
Peru
El S
alva
dor
Arg
entin
a
Bra
zil
Dom
inic
an R
ep.
Pana
ma
Mex
ico
Chi
le
Bol
ivia
Ven
ezue
la
Hon
dura
s
Gua
tem
ala
Cos
ta R
ica
Uru
guay
Nic
arag
ua
Tot
al 1
3
Tot
al 1
7
Chi
na
Indi
a
Sout
h A
fric
a
OE
CD
-30
-2.00
-1.50
-1.00
-0.50
0.00
0.50
1.00
1.50
2.00
2.50
-1.71-1.49
-1.31-1.29-1.27-1.07-0.99-0.97
-0.77-0.66
-0.36-0.24
-0.05
0.05 0.080.28
1.02
-0.94
-0.63
2.02
1.43
0.30 0.25
Ann
ual P
erce
nt C
hang
e

Poverty has been declining: headcount ratio 1995-2009 (IDB,
2011)
6

Latin America’s Relatively High Inequality (IDB, 2011)
7

Latin America’s Excess Poverty (IDB, 2011)
8

Latin America and Europe: Disposable Income (After Taxes and Transfers) and Market Income (Pre-Taxes and Transfers) Inequality
(Gini Coefficients) Source: Lopez and Perry (2007), p. 18.
9
Europe after
taxes & transfer
s
Europe before taxes & transfer
s
10
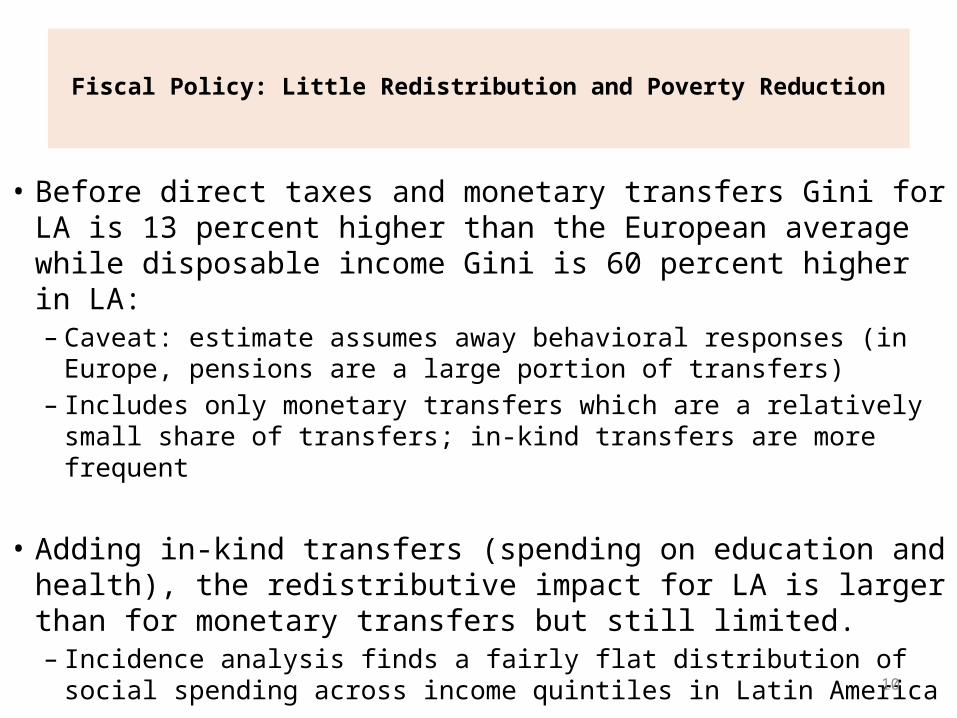
Fiscal Policy: Little Redistribution and Poverty Reduction
• Before direct taxes and monetary transfers Gini for LA is 13 percent higher than the European average while disposable income Gini is 60 percent higher in LA:– Caveat: estimate assumes away behavioral responses (in
Europe, pensions are a large portion of transfers)– Includes only monetary transfers which are a relatively
small share of transfers; in-kind transfers are more frequent
• Adding in-kind transfers (spending on education and health), the redistributive impact for LA is larger than for monetary transfers but still limited. – Incidence analysis finds a fairly flat distribution of social
spending across income quintiles in Latin America

11
Objectives of the welfare state as threefold
(Nicholas Barr,2004) :
1.support a minimum living standard
2.reduce income inequality3.enhance efficiency

12
Supporting a minimum living standard, in turn
poverty reduction: ensuring that everyone has a minimum level of consumption
insurance: preventing individuals from falling (or falling further) below the minimum level of consumption due to adverse shocks, both idiosyncratic (unemployment, illness, bad harvests, etc.) and systemic (economic crises, natural disasters, spikes in food prices, etc.)
income smoothing: ensuring that a minimum level of consumption is achieved throughout an individual’s life-cycle (maternity/paternity leave and retirement, in particular)
We added:building poor people’s human capital: ensuring that
everyone has a minimum level of education and health.
13
Governments can support a minimum living standard through four main
channels:
• taxes and transfers (fiscal policy) • non-budgetary/regulatory
interventions • redistribution of assets • interventions that change the
distribution of voice and power among different groups in society and alter cultural norms.
14
Supporting a minimum living standard
Government actions will affect living standards through growth and distribution, either by their effect on market (primary) incomes and/or post-fiscal (after net transfers) incomes
Develop an instrument that confines the assessment of government actions on post-fiscal incomes
15
What is the Commitment to Equity Assessment?
• A diagnostic framework to evaluate:
– how aligned fiscal policies are with supporting a minimum living standard
– in ways that reduce inequality and are broadly consistent with macroeconomic stability, microeconomic efficiency and growth

What is the Commitment to Equity Assessment?
• CEQ is an analytical exercise; has similarities to Hausmann, Rodrik and Velasco’s growth diagnostics. HRV (2006)
• Focuses on government efforts rather than outcomes
• Relies significantly on primary sources of information and research
• Based on “hard” data and not perceptions
• Ideal component of Country Programming exercises

CEQ evaluates efforts based on whether governments:
• collect and allocate enough resources to support a minimum living standard for all
• collect and distribute resources equitably
• ensure spending is fiscally sustainable and that programs are incentive compatible
• collect and publish relevant information as well as are subject to independent evaluations 17

18
What can CEQ Assessments be used for?
• To inform governments of how their public finances affect their equity goals
• Recommend practical measures • Enhance accountability and transparency
through better data collection and evaluation systems
• Participatory budgeting processes • Non-governmental social observatories • Construct performance indexes to rank
countries and monitor their performance over time

19
What can CEQ Assessments be used for?
• In the case of Heavily Indebted Poor Countries (HIPC) and very poor countries more broadly, CEQ can inform donors:– orders of magnitude of resource
shortfalls to achieve certain goals (for example, reducing poverty by half and universal coverage of primary education)
– actual use and ability of foreign aid to help achieve equity goals

20
Why CEQ would be useful for IDB?
• IDB through lending program affects the level and composition of public expenditure and revenue
• As an institution, one would like to know where you have the highest pay-off in terms of poverty and inequality reduction
• Evidence-based dialogue with the authorities in the country regarding the bank’s strategy in the country
• Mapping of a strategy onto specific operations

21
CEQ Assessments
• Tell you: –what the problems are–where the problems are–how big the problems are
• Not a substitute for impact evaluation of specific programs
• Help you identify priorities; which in turn helps you select interventions; but the interventions will still have to be evaluated
• You will still need ex-ante designed impact evaluation components in your projects

22
CEQ: Dianostic Framework
• Main question: Does a government make substantial efforts to support a minimum standard of living and build the human capital of the poor?
• Define “substantial effort:” when the after net transfers income and human capital poverty gaps are “close to” zero
• “Close to” zero is defined in comparison to the average after net transfers poverty gaps in the countries where the latter is the lowest.

23
Suppose, as in most developing countries, that the poverty gap is not
close to zero • In searching for the causes, we follow a logical
sequence that will help us to identify the contributing factors and binding constraints.
• In middle-income countries, insufficient total fiscal resources are not likely to be a cause for not bringing the poverty gaps close to zero.
• One possible cause is that within redistributive spending, fiscal resources devoted to the poor are not enough. There are at least three main reasons: – benefits to the non-poor are too high– coverage of the poor is not universal– average per capita transfers to the poor fall
short

24
Dianostic Framework• In turn, for example, insufficient coverage could
be caused either by design--that is, the range of existing programs leave some groups out intentionally (for example, undocumented immigrants are not eligible to receive any transfers)--or “true” errors of exclusion.
• The latter could be caused by failures in design or implementation, clientelistic politics, geographic isolation, high administrative costs, leakages, lack of accrediting documentation, self-selection, or other factors.

25
CEQ: Diagnostic Framework

26
Policy Instruments Considered
• Monetary transfers • Subsidies to consumption goods and
(some) inputs • In-kind transfers through the fully or
partially subsidized provision of goods and services particularly in the area of education and health
• Taxes on income, consumption and assets (including tax expenditures)
CEQ: What form does it take?
• A questionnaire whose underpinning can be found in:– Economics of the welfare state – Best practices in quality assurance and
accountability
• Indicators derived from standard poverty and inequality analysis, fiscal incidence analysis and public finance
• It uses ‘static’ incidence analysis; it does not include behavioral responses or general equilibrium effects (but they could be incorporated) 27

CEQ: Data requirements
• Household (Income/Expenditure)Surveys
• Detailed public sector accounts• “External” information on
macroeconomic sustainability, cost effectiveness, program evaluations, data accessibility and accountability mechanisms
28

CEQ: Indicators
• Calculate market, disposable, post-fiscal and final income (described below)– Imputation methods for in-kind income (health and
education services provided by government free or quasi free)
– Estimation of impact of indirect taxes (including tax expenditures) and subsidies requires consumption data at the household level
• Government Revenues and Redistributive Spending
• Calculate poverty gaps• Estimate/calculate incidence of public revenues
and spending29

30
Definitions of Income Concepts
Market Income = ym Earned + unearned market
incomes (monetary and non-monetary) before government taxes and transfers of any sort
TRANSFERS TAXES
Direct monetary transfers
Net Market Income= yn
Disposable Income = yd
Direct taxes and employee contributions to social security
−
+
Indirect subsidies + − Indirect taxes (including
indirect tax expenditures)
Post-fiscal Income = ypf In-kind transfers
+ − In-kind taxes, co-payments, user fees and
participation costs
Final Income = yf

Definition: Redistributive Spending
• Redistributive spending: all monetary transfers, direct and indirect subsidies, and in-kind transfers PLUS consumer subsidies, some producer subsidies and “social” tax expenditures MINUS non-subsidized portion of social security pensions
• In countries where spending at the provincial or state level is important, the total will include redistributive spending by governments at the subnational level
31

32
Figure 5 - Redistributive Spending versus Social Spending
Note: Social Security under social spending includes the contributory part only.
SOCIAL SPENDING
REDISTRIBUTIVE SPENDING
--Health --Education--Social Assistance
--Public Goods (couldbe included in Redist)--Social Security
--"Social" Producer Subsidies--Consumption Subsidies--Subsidized Portion of Social Security Pensions--"Social" Tax Expenditures

33
Definitions of Progressiveness & Regressiveness

Definition of Government Revenue
• Includes the total budgetary income of the federal government: – tax and non-tax revenue – plus income generated by direct
budgetary controlled entities or public enterprises
• In countries where revenue collected at the provincial or state level is “important,” the total will include the revenues obtained by governments at the subnational level
34

35
CEQ: Argentina (Pessino, 2010)

36
Decline in Non-labor Income Inequality: Cash Transfers
since 2002
• Emergency Employment Program (Jefes y jefas de hogar)– 2002
• Pension Moratorium (Moratoria previsional)– 2007
• Universal “Subsidy” per Child (Asignacion universal por hijo) – 2009

37
Pessino (2010)
2003 2004 2005 2006 2007 2008 2009
Number of pensioners
Argentina (millions)
38
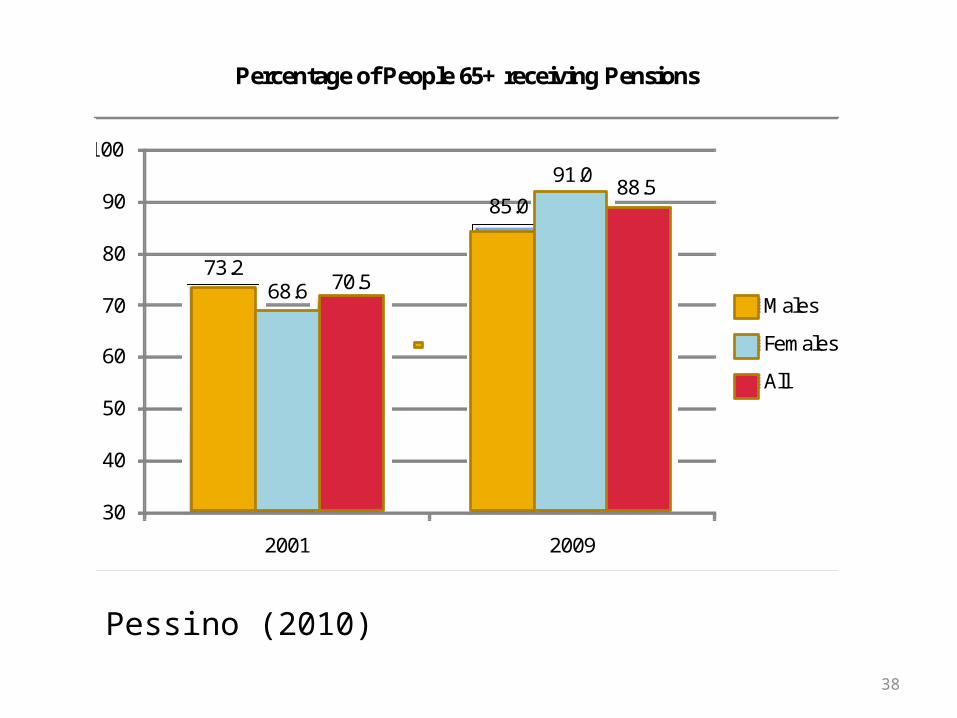
Pessino (2010)
Percentage of People 65+ receiving Pensions
73.2
85.0
68.6
91.0
70.5
88.5
30
40
50
60
70
80
90
100
2001 2009
Males
Females
All

39
Pessino (2010)

40
Cash Transfer Programs: Total Beneficiaries(Gasparini y Cruces, 2010)
0
500,000
1,000,000
1,500,000
2,000,000
2,500,000
2001 2002 2003 2004 2005 2006 2007 2008 2009 2010
AUHJefes
Familias

41
Monthly Benefits per Household (with 3 children) – In 2010 pesos
(Gasparini y Cruces, 2010)
0
100
200
300
400
500
600
2002 2003 2004 2005 2006 2007 2008 2009 2010
AUH
FamiliasJefes

42
Impact of Transfers on Poverty and Inequality - 2009
ARGENTINA: POVERTY AND INEQUALITY BEFORE AND AFTER TRANSFERS
2009
Before Transfers
After Moratorium Pensions
After Monetary Transfers*
After Subsidy per child
Poverty; 2.5 US$Headcount Ratio 14.7 10.2 8.9 5.4Poverty Gap Ratio 8.5 4.8 3.8 1.8Absolute Change in H -4.5 -5.8 -9.3Relative Change in PG -30.6% -39.5% -63.3%Poverty; 4 US$Headcount Ratio 24.9 20 18.9 15.7Poverty Gap Ratio 12.8 8.7 7.6 5Absolute Change in H -4.9 -6 -9.2Relative Change in PG -19.7% -24.1% -36.9%Gini coefficient 0.499 0.468 0.461 0.444Absolute Change in Gini -0.031 -0.039 -0.055Percentage Change in Gini -6.2% -7.7% -11.0%* Does not include subsidy per childSource: Pessino (2010); Lustig and Pessino (2010)

43
Value USD PPP 2.50 dollars a day 194.3 USD PPP 4.00 dollars a day 311.0Extreme Poverty Line Using FIEL CPI 236.2Moderate Poverty using FIEL CPI 494.3Extreme Poverty Line Using Official CPI 143.9Moderate Poverty using Official CPI 324.3Source: Own estimation based on INDEC, WDI, FIEL and Buenos Aires City (for private estimates of inflation rate)
Table 4. Selected Poverty Lines First Semester 2009, Argentina
Pessino (2010)
44
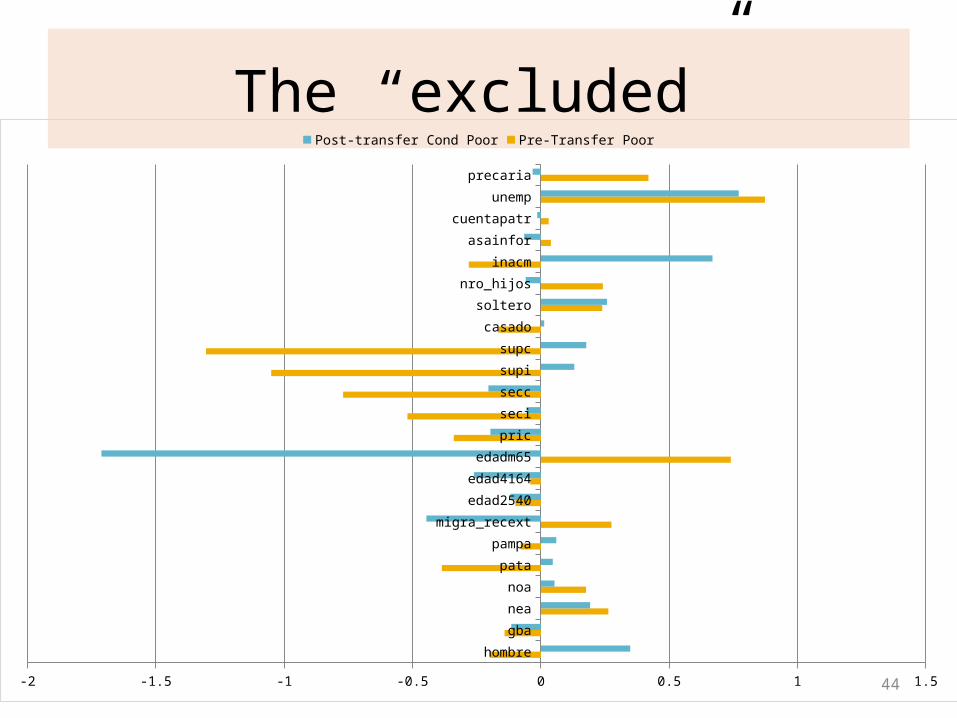
The “excluded”
hombre
gba
nea
noa
pata
pampa
migra_recext
edad2540
edad4164
edadm65
pric
seci
secc
supi
supc
casado
soltero
nro_hijos
inacm
asainfor
cuentapatr
unemp
precaria
-2 -1.5 -1 -0.5 0 0.5 1 1.5
Post-transfer Cond Poor Pre-Transfer Poor
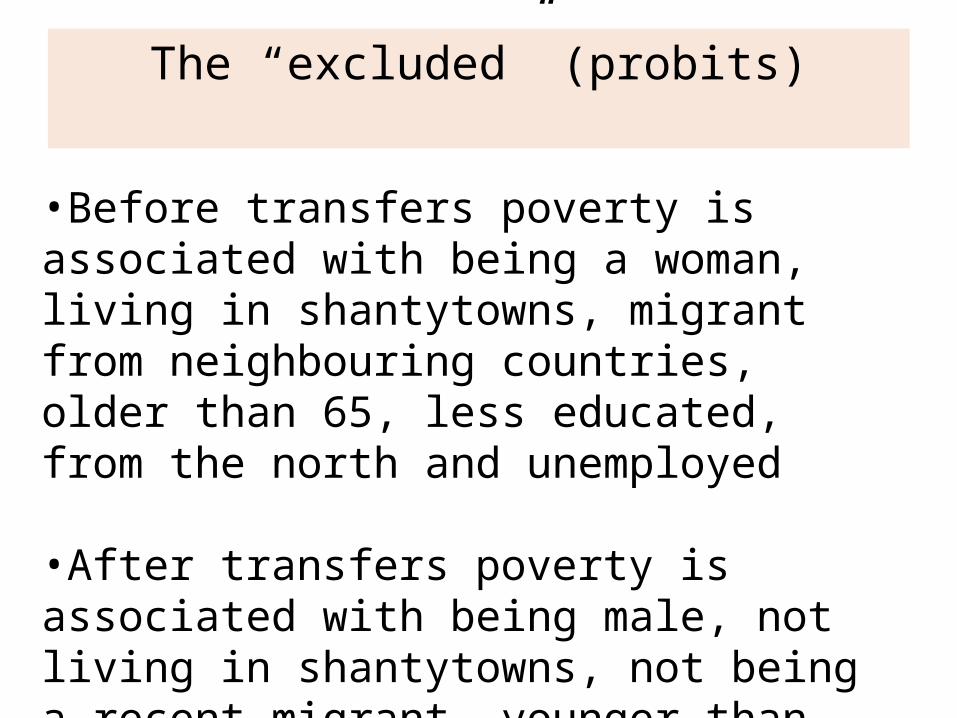
The “excluded” (probits)
•Before transfers poverty is associated with being a woman, living in shantytowns, migrant from neighbouring countries, older than 65, less educated, from the north and unemployed
•After transfers poverty is associated with being male, not living in shantytowns, not being a recent migrant, younger than 41, and more educated

46
ARGENTINA: REQUIRED RESOURCES TO CLOSE MONETARY POVERTY GAP (2009)( WITH AND WITHOUT MINIMUM PENSIONS)
(2009 billion pesos otherwise specified)
BEFORE TRANSFERS BUT AFTER PENSIONS
BEFORE ALL TRANSFERS
BEFORE TRANSFERS BUT AFTER PENSIONS
BEFORE ALL TRANSFERS
US$2.50 POVERTY LINE US$4 POVERTY LINETOTAL REQUIRED RESOURCES 4.5 8 13 19.2AS A % OF GOV EXP 0.98 1.74 2.83 4.17AS A % OF TAXES 1.25 2.22 3.61 5.33AS A % OF GDP 0.39 0.70 1.14 1.68AS A % OF REDIST SPENDING 1.82 3.24 5.27 7.78MEMO:GDP 1144.3 1144.3 1144.3 1144.3Consolidated Gov Exp 460 460 460 460as a % of GDP 40.2 40.2 40.2 40.2Taxes 360 360 360 360as a % of GDP 31.5 31.5 31.5 31.5Redistributive Spending 246.7 246.7 246.7 246.7as a % of GDP 21.6 21.6 21.6 21.6Source: Pessino (2010); Lustig and Pessino (2010)Note: Pensions refer to non-contributory and moratorium pensions (defined as any pension below 800 pesos per month; upper bound estimate)Redistributive Spending is equal to social spending plus economic subsidies minus contributory portions of health and pensions in social security system

47
Redistribution and Fiscal Sustainability
• Closing the extreme (pov line US$2.50) and total poverty (pov line US$4) gaps--with perfect targeting--would cost:
– 0.7 and 1.7 percent of GDP, respectively – 2.2 and 5.3 percent of tax revenues,
respectively– 3.2 and 7.8 percent of redistributive
spending, respectively
• Seems compatible with fiscal sustainability

48
ARGENTINA: CONSOLIDATED REDISTRIBUTIVE EXPENDITURE(2009 billions of pesos)
Billion of PesosComposition % % of GDPTOTAL 246.7 100 21.6Education 58.8 23.8 5.1Health 35.8 14.5 3.1Social Protection 56.6 22.9 4.9 Social Insurance 27 10.9 2.4 Social Assistance 29.6 12.0 2.6Economic Subsidies 60.7 24.6 5.3 Energy 19.8 8.0 1.7 Transport 27.6 11.2 2.4 Rest 13.3 5.4 1.2Other 34.8 14.1 3.0Source: Pessino (2010); Lustig and Pessino (2010)

CEQ Mexico (Scott, 2010)
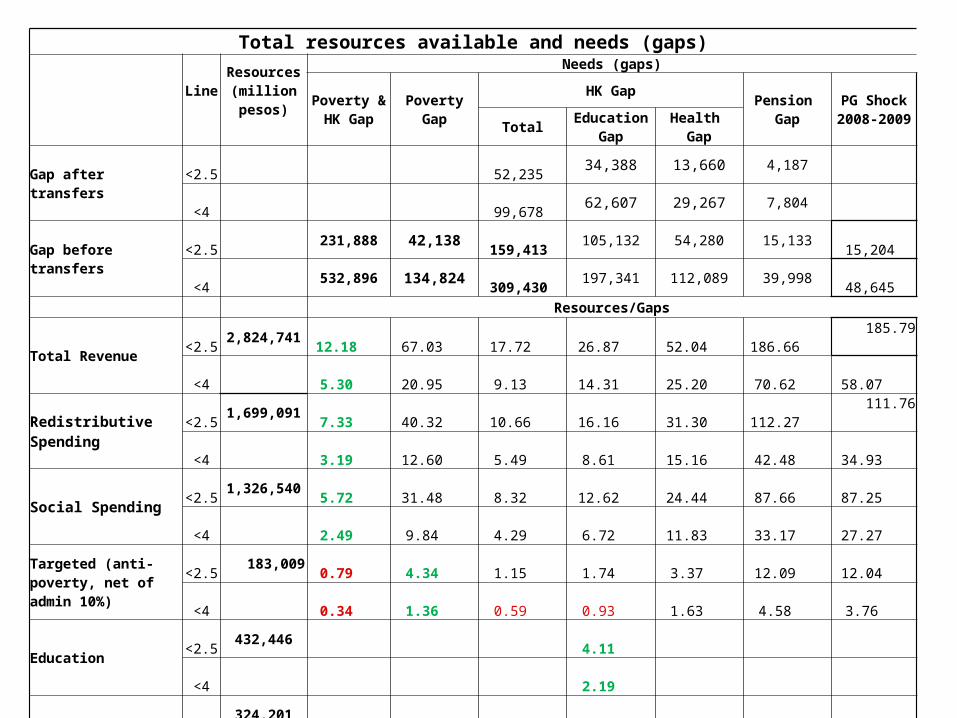
Total resources available and needs (gaps)
Line
Resources (million pesos)
Needs (gaps)
Poverty & HK Gap Poverty Gap
HK GapPension
GapPG Shock2008-2009
Total Education Gap
Health Gap
Gap after transfers <2.5 52,235 34,388 13,660 4,187
<4 99,678 62,607 29,267 7,804
Gap before transfers <2.5 231,888 42,138 159,413 105,132 54,280 15,133 15,204
<4 532,896 134,824 309,430 197,341 112,089 39,998 48,645
Resources/Gaps
Total Revenue <2.5 2,824,741 12.18 67.03 17.72 26.87 52.04 186.66 185.79
<4 5.30 20.95 9.13 14.31 25.20 70.62 58.07
Redistributive Spending <2.5 1,699,091 7.33 40.32 10.66 16.16 31.30 112.27 111.76
<4 3.19 12.60 5.49 8.61 15.16 42.48 34.93
Social Spending <2.5 1,326,540 5.72 31.48 8.32 12.62 24.44 87.66 87.25
<4 2.49 9.84 4.29 6.72 11.83 33.17 27.27
Targeted (anti-poverty, net of admin 10%)
<2.5 183,009 0.79 4.34 1.15 1.74 3.37 12.09 12.04
<4 0.34 1.36 0.59 0.93 1.63 4.58 3.76
Education <2.5 432,446 4.11
<4 2.19
Health<2.5 324,201 5.97
<4 2.89
Social Security: Old Age
<2.5 338,483 22.37
<4 8.46

Resources reaching the poor and needs (gaps)
Line
Resources reachingthe poor
Needs (gaps)
Poverty & HK Gap
Poverty Gap
HK GapPension
GapPG Shock2008-2009Share of
total spent (%)
Million pesos Total Education
GapHealth
Gap
Gap after transfers
<2.5 52,235 34,388 13,660 4,187
<4 99,678 62,607 29,267 7,804
Gap before transfers <2.5 231,888 42,138 159,413 105,132 54,280 15,133 15,204
<4 532,896 134,824 309,430 197,341 112,089 39,998 48,645
Resources/Gaps
Redistributive Spending
<2.5 10.5% 177,610 0.77 4.21 1.11 1.69 3.27 11.74 11.68
<4 21.1% 358,442 0.67 2.66 1.16 1.82 3.20 8.96 7.37
Social Spending <2.5 12.5% 165,508 0.71 3.93 1.04 1.57 3.05 10.94 10.89
<4 24.6% 326,229 0.61 2.42 1.05 1.65 2.91 8.16 6.71 Targeted (anti-poverty, net of admin 10%)
<2.5 37.2% 68,014 0.29 1.61 0.43 0.65 1.25 4.49 4.47
<4 59.4% 108,713 0.20 0.81 0.35 0.55 0.97 2.72 2.23
Education <2.5 16.4% 70,744 0.67
<4 31.2% 134,734 0.68
Health<2.5 12.5% 40,620 0.75
<4 25.5% 82,822 0.74
Social Security: Old Age
<2.5 3.2% 10,946 0.72
<4 9.5% 32,193 0.80

Most redistributive spending is not progressive in absolute terms (and some of it is regressive—shown in next slide--):
concentration indeces (vertical) and budgetary effort (size of bubbles) in principal redistributive programs (color)
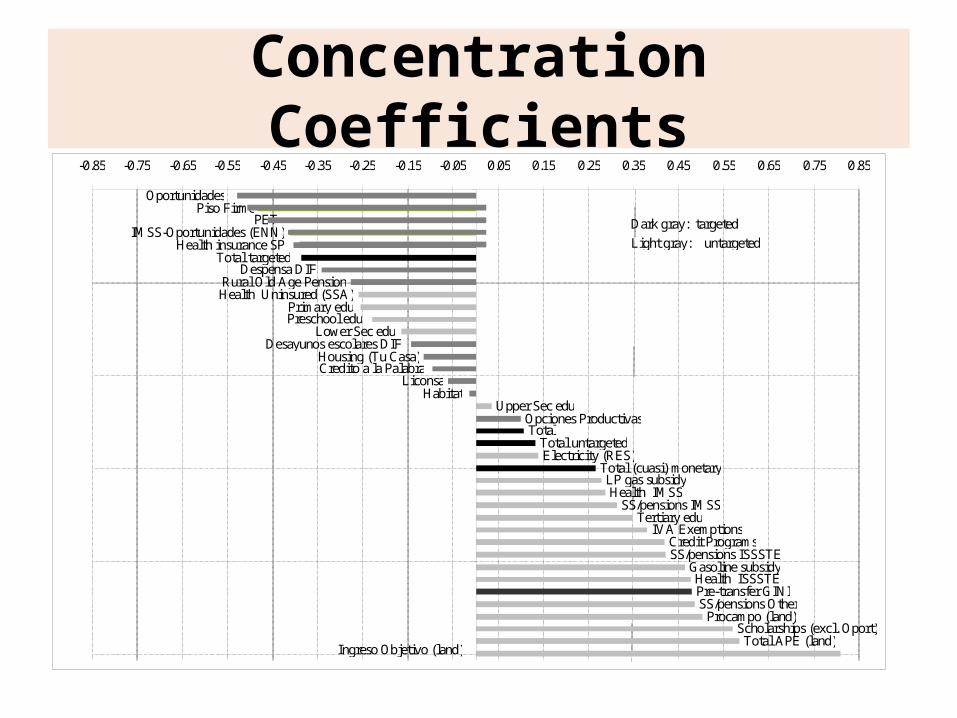
Concentration Coefficients
Oportunidades Piso Firme
PET IMSS-Oportunidades (ENN)
Health insurance SP Total targeted
Despensa DIF Rural Old Age Pension Health Uninsured (SSA)
Primary edu Preschool edu
Lower Sec edu Desayunos escolares DIF
Housing (Tu Casa) Credito a la Palabra
Liconsa Habitat
Upper Sec edu Opciones Productivas Total
Total untargeted Electricity (RES)
Total (cuasi) monetary LP gas subsidy Health IMSS
SS/pensions IMSS Tertiary edu
IVA Exemptions Credit Programs SS/pensions ISSSTE
Gasoline subsidy Health ISSSTE
SS/pensions Other Procampo (land)
Scholarships (excl. Oport) Total APE (land)
Pre-transfer GINI
-0.85 -0.75 -0.65 -0.55 -0.45 -0.35 -0.25 -0.15 -0.05 0.05 0.15 0.25 0.35 0.45 0.55 0.65 0.75 0.85
Ingreso Objetivo (land)
Dark gray: targeted
Light gray: untargeted

Effect of all (imputable) transfers on the distribution of income1
Indices Before Transfers2
After transfers
All Targeted transfers
Non-targeted
subsidies3
In Kind Transfers
Total Education Health
Decile shares 1 1.2% 2.3% 1.4% 1.2% 2.1% 1.9% 1.4% 2 2.4% 3.3% 2.5% 2.4% 3.2% 3.0% 2.6% 3 3.4% 4.2% 3.5% 3.5% 4.2% 4.0% 3.6% 4 4.4% 5.1% 4.4% 4.4% 5.0% 4.8% 4.6% 5 5.6% 6.1% 5.6% 5.6% 6.0% 5.9% 5.7% 6 6.9% 7.3% 6.9% 6.9% 7.2% 7.1% 7.0% 7 8.7% 8.9% 8.6% 8.7% 8.8% 8.7% 8.7% 8 11.2% 11.1% 11.1% 11.2% 11.1% 11.0% 11.2% 9 15.9% 15.2% 15.8% 15.9% 15.3% 15.4% 15.7%
10 40.5% 36.6% 40.2% 40.1% 37.0% 38.1% 39.3% Gini 0.501 0.439 0.494 0.497 0.446 0.461 0.484
Reduction Gini 12.4% 1.4% 1.0% 11.1% 8.1% 3.5% Transfer size (% GDP) 9.1% 0.5% 4.8% 7.2% 4.9% 2.7%
Reduction Gini/ % GDP 1.36 2.63 0.20 1.54 1.65 1.26
Transfer to poor/ Poverty Gap
2.5 line 263% 41% 28% 219% 162% 59% 4 line 164% 21% 22% 139% 101% 40%
1Distribution of household income and transfers as reported in the ENIGH survey. Household income adjusted to National Accounts. Value of public transfers as reported in public accounts. 2Market income net of payroll taxes (income taxes and social security contributions retained by employer). 3Non targeted subsidies to pensions and other non-health social security benefits, employment subsidy, non-Oportunidades scholarships, energy and agricultural subsidies.

Effect of principal targeted monetary transfers on poverty and inequality*
Indices Before
transfers**
After transfers
Total Oportunidades Adultos Mayores
Procampo Becas (excl.
Oportunidades)
Other social
programs
FGT < 2.5
p0 0.1350 0.1042 0.1186 0.1311 0.1323 0.1344 0.1273 p1 0.0539 0.0335 0.0399 0.0516 0.0519 0.0536 0.0502 p2 0.0305 0.0153 0.0194 0.0286 0.0289 0.0303 0.0280
Reduction
p0
22.8% 12.1% 2.9% 2.0% 0.4% 5.7% p1
38.0% 26.0% 4.4% 3.8% 0.6% 7.0%
p2
49.9% 36.6% 6.3% 5.3% 0.8% 8.4% FGT < 4
p0 0.2639 0.2352 0.2498 0.2611 0.2624 0.2628 0.2549 p1 0.1078 0.0842 0.0933 0.1053 0.1058 0.1073 0.1028 p2 0.0620 0.0424 0.0489 0.0597 0.0601 0.0616 0.0584
Reduction
p0
10.9% 5.3% 1.1% 0.6% 0.4% 3.4% p1
21.9% 13.5% 2.3% 1.9% 0.5% 4.6%
p2
31.6% 21.2% 3.6% 3.1% 0.6% 5.9% Gini 0.5235 0.5118 0.5150 0.5219 0.5224 0.5231 0.5231
Reduction
2.23% 1.61% 0.30% 0.20% 0.08% 0.07% * Transfers and household income as reported in ENIGH survey (not adjusted to National Accounts). **Market income net of payroll taxes (income taxes and social security contributions retained by employer).

Proportion of poor households not covered by transfers (in %)
Living below US$2.5/day ………….. 37.2
Living below US$4/day ………….. 49.3
Memo: Percentage of poor households not covered by Oportunidades, Procampo and Minimum Pension (non-contributory)

The “excluded” (probit)
jefe_h~e*
noroeste*
noreste*
occide~e*
centro~e*
oriente*
suroeste*
sureste*
eda~2540*
eda~4164*
edadj65m*
pric*
seci*
secc*
bachi*
bachc*
supi*
supcop*
jcasado*
hijos_j
jsaraf~e*
jlengind*
loc~100m*
loc2~15m*
loclt2q*
-2.00 -1.50 -1.00 -0.50 0.00 0.50 1.00 1.50
Post-transfer, cond poorPre-transfer

58
The “excluded” (probit)
• Before transfers poverty is associated with living in the south, rural and indigenous
• After transfers poverty is associated with living in urban areas, young, indigenous and more educated households

59
Thank you