Rising Environmental Concern in 47-Nation Survey … Pew Global Attitudes Report - June... ·...
133
1615 L Street, N.W., Suite 700 Washington, D.C. 20036 Tel (202) 419-4350 Fax (202) 419-4399 www.pewglobal.org WEDNESDAY, JUNE 27, 2007 Rising Environmental Concern in 47-Nation Survey GLOBAL UNEASE WITH MAJOR WORLD POWERS 47-Nation Pew Global Attitudes Survey FOR FURTHER INFORMATION CONTACT: Andrew Kohut, President Richard Wike, Senior Researcher Juliana Menasce Horowitz, Research Associate (202) 419-4350 www.pewglobal.org
Transcript of Rising Environmental Concern in 47-Nation Survey … Pew Global Attitudes Report - June... ·...
1615 L Street, N.W., Suite 700 Washington, D.C. 20036 Tel (202) 419-4350 Fax (202) 419-4399 www.pewglobal.org
WEDNESDAY, JUNE 27, 2007 Rising Environmental Concern in 47-Nation Survey
GLOBAL UNEASE WITH MAJOR WORLD POWERS 47-Nation Pew Global Attitudes Survey FOR FURTHER INFORMATION CONTACT: Andrew Kohut, President Richard Wike, Senior Researcher Juliana Menasce Horowitz, Research Associate (202) 419-4350 www.pewglobal.org

June 27, 2007
TABLE OF CONTENTS
Page
Overview: Global Unease with Major World Powers ..........................................................1
About the Project ..................................................................................................................9 World Map and Country List...............................................................................................10 Roadmap to the Report ........................................................................................................12
Chapter 1: Views of the U.S. and American Foreign Policy............................................13
Chapter 2: Global Threats: The World’s Shifting Agenda...............................................29
Chapter 3: Views of China and Its Increasing Influence..................................................39
Chapter 4: Views of Iran, Its Leader, and the Nuclear Question......................................47
Chapter 5: Views of the Middle East Conflict..................................................................55
Chapter 6: Views of World Leaders and Institutions .......................................................61
Chapter 7: Views of Russia ..............................................................................................73
Survey Methods ...................................................................................................................75
Survey Topline.....................................................................................................................83 Copyright © 2007 Pew Research Center www.pewresearch.org

Rising Environmental Concern in 47-Nation Survey GLOBAL UNEASE WITH MAJOR WORLD POWERS
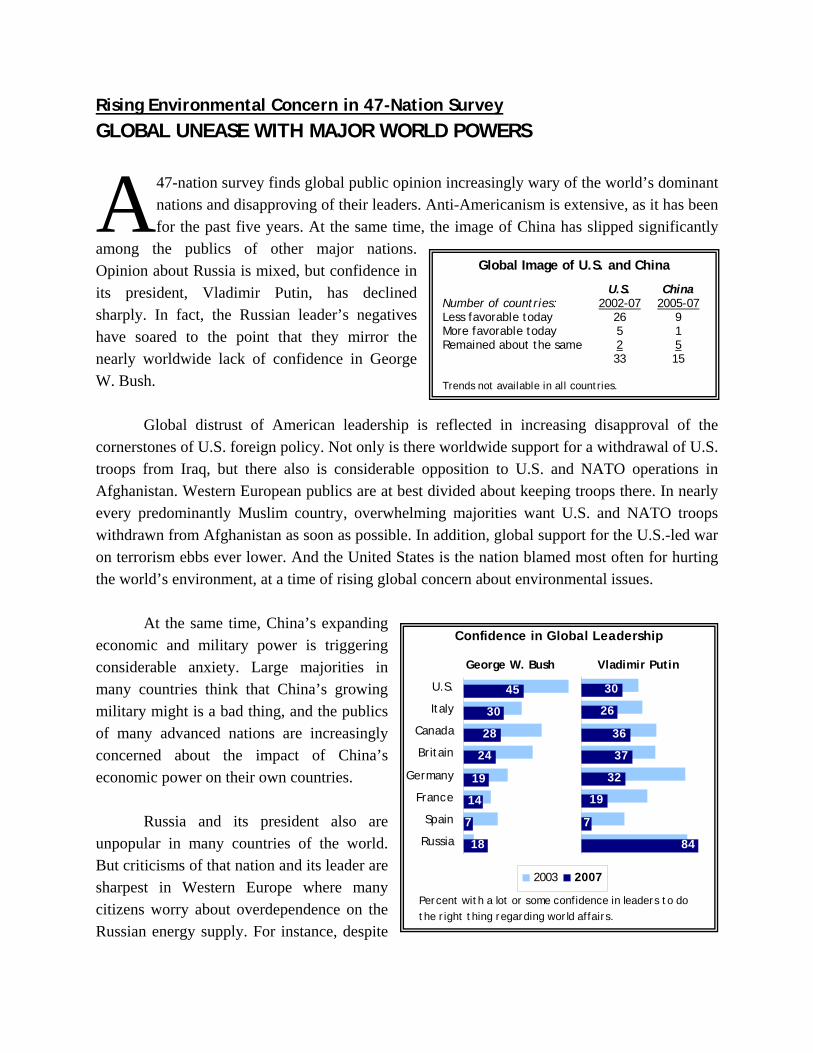
47-nation survey finds global public opinion increasingly wary of the world’s dominant nations and disapproving of their leaders. Anti-Americanism is extensive, as it has been for the past five years. At the same time, the image of China has slipped significantly
among the publics of other major nations. Opinion about Russia is mixed, but confidence in its president, Vladimir Putin, has declined sharply. In fact, the Russian leader’s negatives have soared to the point that they mirror the nearly worldwide lack of confidence in George W. Bush.
Global distrust of American leadership is reflected in increasing disapproval of the
cornerstones of U.S. foreign policy. Not only is there worldwide support for a withdrawal of U.S. troops from Iraq, but there also is considerable opposition to U.S. and NATO operations in Afghanistan. Western European publics are at best divided about keeping troops there. In nearly every predominantly Muslim country, overwhelming majorities want U.S. and NATO troops withdrawn from Afghanistan as soon as possible. In addition, global support for the U.S.-led war on terrorism ebbs ever lower. And the United States is the nation blamed most often for hurting the world’s environment, at a time of rising global concern about environmental issues.
At the same time, China’s expanding
economic and military power is triggering considerable anxiety. Large majorities in many countries think that China’s growing military might is a bad thing, and the publics of many advanced nations are increasingly concerned about the impact of China’s economic power on their own countries.
Russia and its president also are
unpopular in many countries of the world. But criticisms of that nation and its leader are sharpest in Western Europe where many citizens worry about overdependence on the Russian energy supply. For instance, despite
A Global Image of U.S. and China
U.S. China Number of countries: 2002-07 2005-07 Less favorable today 26 9 More favorable today 5 1 Remained about the same 2 5 33 15 Trends not available in all countries.
Vladimir Putin
19
32
37
36
26
30
84
7
George W. Bush
45
30
28
24
19
14
18
7
U.S.
Italy
Canada
Britain
Germany
France
Spain
Russia
Confidence in Global Leadership
2003 2007
Percent with a lot or some confidence in leaders to dothe right thing regarding world affairs.
2
sharp declines in favorable views of the U.S. in France and Germany since 2002, Russia’s image in those countries is no better.
There is little evidence that discontent with the major
nations of the world and their leaders is resulting in greater confidence in those who have challenged the global status quo. Venezuelan President Hugo Chavez inspires little public confidence, even in Latin America, and huge majorities in most countries also say they have little or no confidence in Iranian President Mahmoud Ahmadinejad to do the right thing regarding world affairs. There also is broad opposition to Iran’s acquisition of nuclear weapons. Citizens all around the world voice substantial concern about the threat posed by a nuclear-armed Iran. This includes the Muslim publics of neighboring nations such as Kuwait and Turkey.
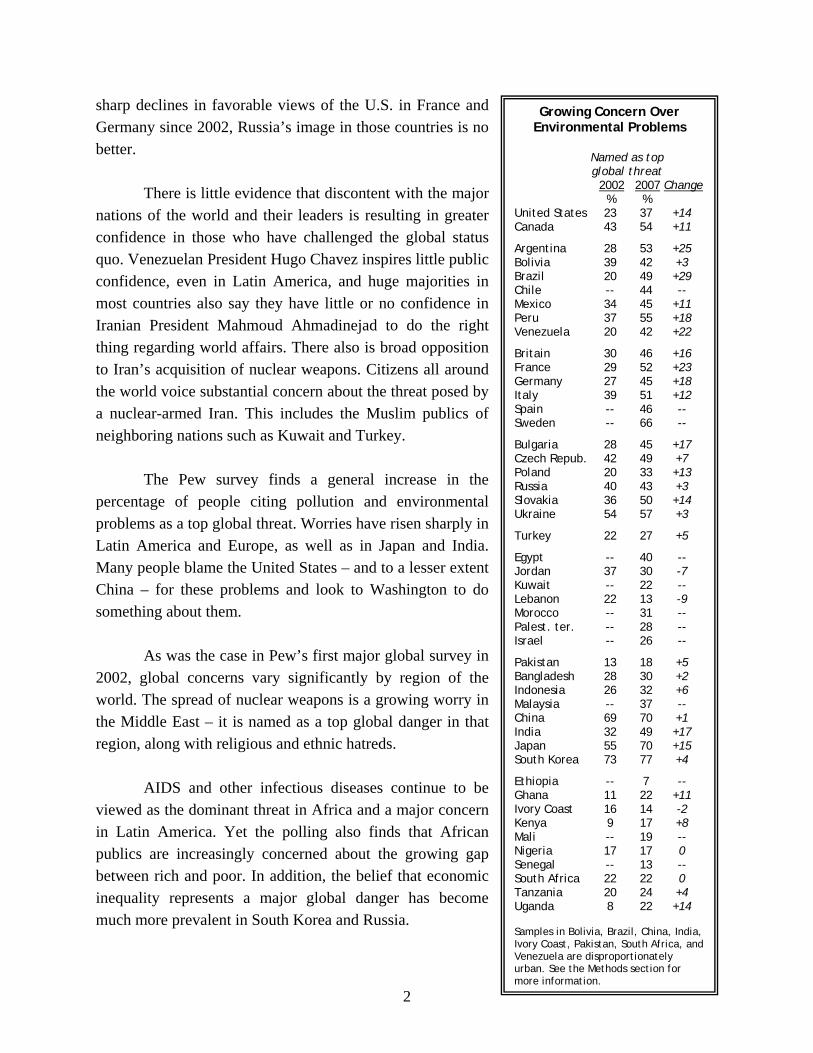
The Pew survey finds a general increase in the
percentage of people citing pollution and environmental problems as a top global threat. Worries have risen sharply in Latin America and Europe, as well as in Japan and India. Many people blame the United States – and to a lesser extent China – for these problems and look to Washington to do something about them.
As was the case in Pew’s first major global survey in
2002, global concerns vary significantly by region of the world. The spread of nuclear weapons is a growing worry in the Middle East – it is named as a top global danger in that region, along with religious and ethnic hatreds.
AIDS and other infectious diseases continue to be
viewed as the dominant threat in Africa and a major concern in Latin America. Yet the polling also finds that African publics are increasingly concerned about the growing gap between rich and poor. In addition, the belief that economic inequality represents a major global danger has become much more prevalent in South Korea and Russia.
Growing Concern Over Environmental Problems
Named as top global threat
2002 2007 Change % % United States 23 37 +14 Canada 43 54 +11
Argentina 28 53 +25 Bolivia 39 42 +3 Brazil 20 49 +29 Chile -- 44 -- Mexico 34 45 +11 Peru 37 55 +18 Venezuela 20 42 +22
Britain 30 46 +16 France 29 52 +23 Germany 27 45 +18 Italy 39 51 +12 Spain -- 46 -- Sweden -- 66 --
Bulgaria 28 45 +17 Czech Repub. 42 49 +7 Poland 20 33 +13 Russia 40 43 +3 Slovakia 36 50 +14 Ukraine 54 57 +3
Turkey 22 27 +5
Egypt -- 40 -- Jordan 37 30 -7 Kuwait -- 22 -- Lebanon 22 13 -9 Morocco -- 31 -- Palest. ter. -- 28 -- Israel -- 26 --
Pakistan 13 18 +5 Bangladesh 28 30 +2 Indonesia 26 32 +6 Malaysia -- 37 -- China 69 70 +1 India 32 49 +17 Japan 55 70 +15 South Korea 73 77 +4
Ethiopia -- 7 -- Ghana 11 22 +11 Ivory Coast 16 14 -2 Kenya 9 17 +8 Mali -- 19 -- Nigeria 17 17 0 Senegal -- 13 -- South Africa 22 22 0 Tanzania 20 24 +4 Uganda 8 22 +14 Samples in Bolivia, Brazil, China, India, Ivory Coast, Pakistan, South Africa, and Venezuela are disproportionately urban. See the Methods section for more information.
3
In the face of strong criticisms of its foreign policy, the U.S. is cited in many countries about as often as the U.N. as the entity that should be responsible for dealing with the problems that confront the world. This is particularly the case among people who are most concerned about the spread of nuclear weapons. But when it comes to AIDS and the gap between rich and poor, many who see these as important threats look to their own countries to provide solutions.
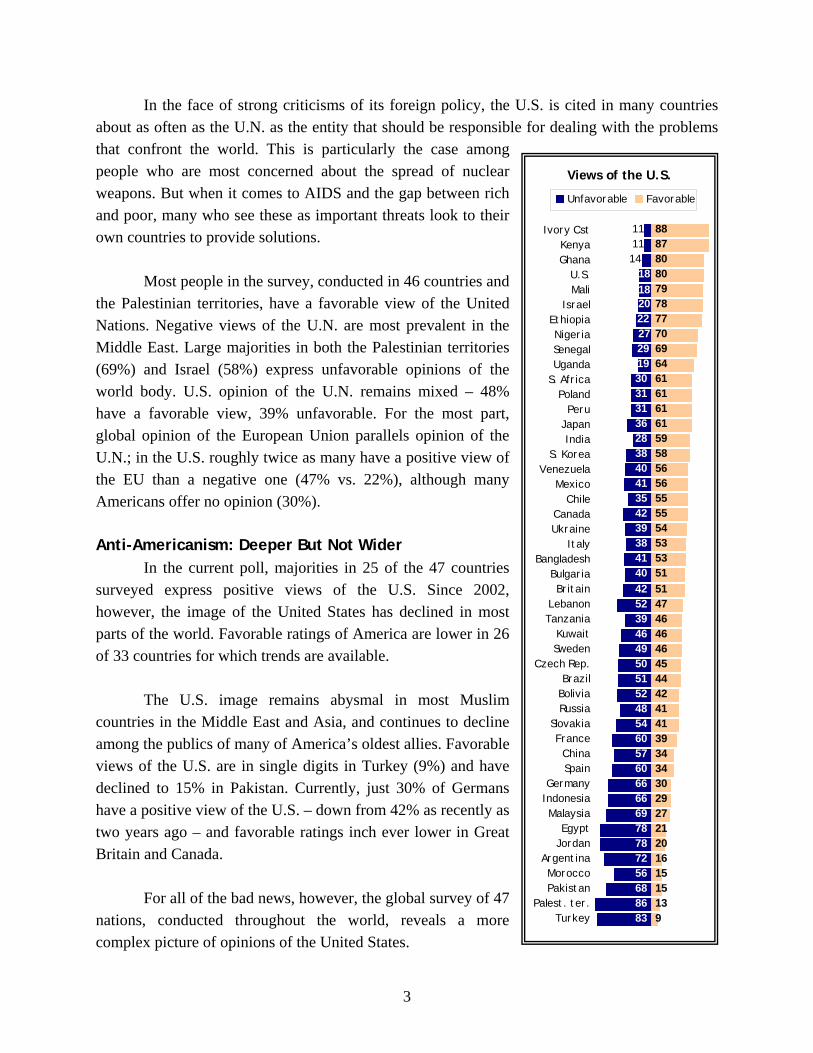
Most people in the survey, conducted in 46 countries and
the Palestinian territories, have a favorable view of the United Nations. Negative views of the U.N. are most prevalent in the Middle East. Large majorities in both the Palestinian territories (69%) and Israel (58%) express unfavorable opinions of the world body. U.S. opinion of the U.N. remains mixed – 48% have a favorable view, 39% unfavorable. For the most part, global opinion of the European Union parallels opinion of the U.N.; in the U.S. roughly twice as many have a positive view of the EU than a negative one (47% vs. 22%), although many Americans offer no opinion (30%).
Anti-Americanism: Deeper But Not Wider
In the current poll, majorities in 25 of the 47 countries surveyed express positive views of the U.S. Since 2002, however, the image of the United States has declined in most parts of the world. Favorable ratings of America are lower in 26 of 33 countries for which trends are available.
The U.S. image remains abysmal in most Muslim
countries in the Middle East and Asia, and continues to decline among the publics of many of America’s oldest allies. Favorable views of the U.S. are in single digits in Turkey (9%) and have declined to 15% in Pakistan. Currently, just 30% of Germans have a positive view of the U.S. – down from 42% as recently as two years ago – and favorable ratings inch ever lower in Great Britain and Canada.
For all of the bad news, however, the global survey of 47
nations, conducted throughout the world, reveals a more complex picture of opinions of the United States.
Views of the U.S.
30313136283840413542393841404252394649505152485460576066666978787256688683
87
78
69
616159585656555554535351514746464645444241413934343029272120161515139
1111
1814
18
27
2022
1929
616164
7077
798080
88Ivory CstKenyaGhana
U.S.Mali
IsraelEthiopiaNigeriaSenegalUganda
S. AfricaPoland
PeruJapanIndia
S. KoreaVenezuela
MexicoChile
CanadaUkraine
Italy Bangladesh
BulgariaBritain
LebanonTanzania
KuwaitSweden
Czech Rep.Brazil
BoliviaRussia
SlovakiaFrance
ChinaSpain
GermanyIndonesiaMalaysia
EgyptJordan
ArgentinaMoroccoPakistan
Palest. ter.Turkey
Unfavorable Favorable
4
First, the U.S. image remains positive in Africa. In several African countries, such as
Ethiopia and Kenya, it is overwhelmingly positive. In addition, majorities in two of America’s most important Asian trading partners – India and Japan – continue to express favorable opinions of the United States. And the U.S. image has improved dramatically in South Korea since 2003 (from 46% to 58% favorable).
While opinion of the U.S. has slipped in Latin America over the past five years,
majorities in such countries as Mexico, Peru and even Venezuela still say they have a positive opinion of their large neighbor to the north. Similarly, “new Europe” likes America better than “old Europe,” although the U.S. image is not nearly as strong in Eastern Europe as it was five years ago.
And while negative views of the U.S. continue to prevail in much of the Muslim world, anger is not as universal today as it was in the spring of 2003 after the start of the war in Iraq. At that time, just 1% of Jordanians – and less than 1% in the Palestinian territories – gave a favorable rating to the United States, compared with 20% and 13%, respectively, today. And while still far from positive, America’s image has recovered substantially in Lebanon as well.
However, opinions of the American people have declined over the past five years in 23 of
33 countries where trends are available. In Indonesia and Turkey, where favorable views of the U.S. have declined markedly over the past five years, opinions of Americans have fallen sharply as well. In Indonesia, positive opinions of Americans have fallen from 65% in 2002 to 42%; in Turkey, favorable opinions have declined 19 points.
While opinions of Americans have fallen in most Western European countries, they
remain generally positive. In every Western European country surveyed, far more people express positive opinions of Americans than they do of the U.S.; in Germany, for instance, 63% say they have a positive opinion of Americans compared with just 30% who rate the U.S. positively.
In fact, in many countries, the American people get better ratings than does the U.S.
generally. Latin America is a consistent exception to this rule. In this region, Americans get about the same ratings as their country; either both are mostly favorable, as in Venezuela and Peru, or both are quite low, as in Argentina.
5
Opinions that Influence America’s Image This is by far the largest global survey Pew has conducted since 2002. As such, it
provides a broad perspective on anti-Americanism, documenting the nature and breadth of negative perceptions of the U.S.
Among key U.S. allies in Western Europe, the view that the U.S. acts unilaterally is an
opinion that has tracked closely with America’s overall image over the past five years. Ironically, the belief that the United States does not take into account the interests of other countries in formulating its foreign policy is extensive among the publics of several close U.S. allies. No fewer than 89% of the French, 83% of Canadians and 74% of the British express this opinion.
U.S. policies also are widely viewed as increasing
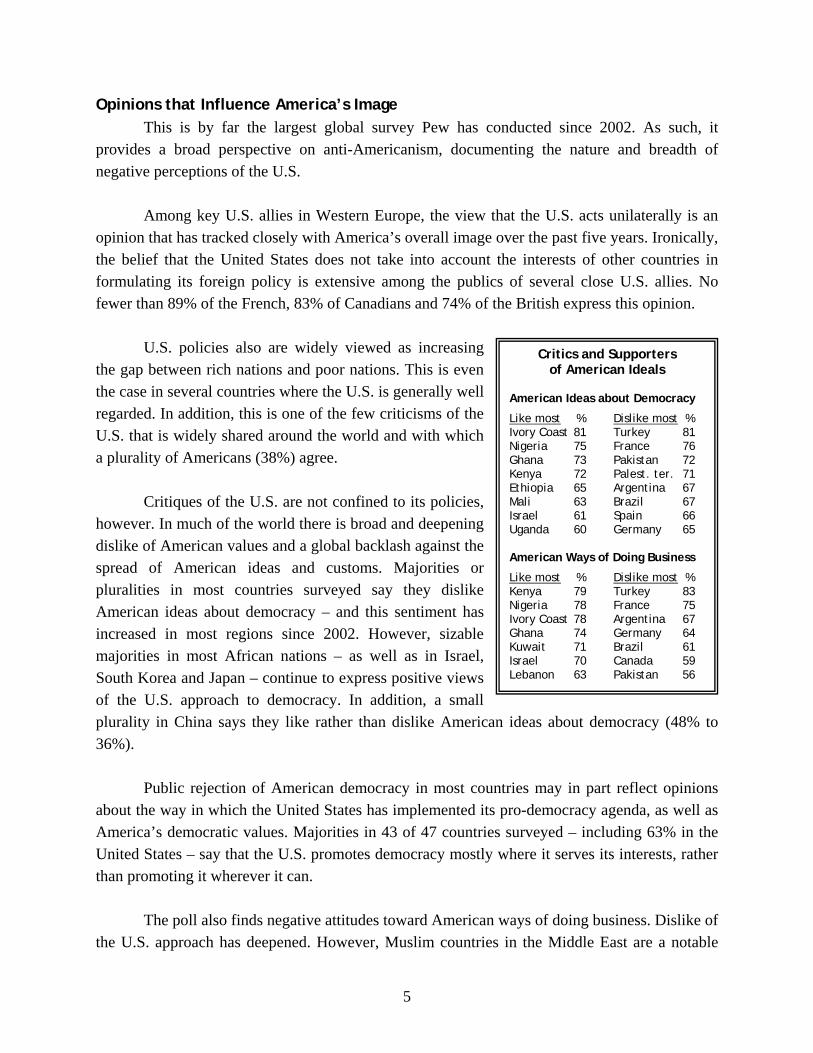
the gap between rich nations and poor nations. This is even the case in several countries where the U.S. is generally well regarded. In addition, this is one of the few criticisms of the U.S. that is widely shared around the world and with which a plurality of Americans (38%) agree. Critiques of the U.S. are not confined to its policies, however. In much of the world there is broad and deepening dislike of American values and a global backlash against the spread of American ideas and customs. Majorities or pluralities in most countries surveyed say they dislike American ideas about democracy – and this sentiment has increased in most regions since 2002. However, sizable majorities in most African nations – as well as in Israel, South Korea and Japan – continue to express positive views of the U.S. approach to democracy. In addition, a small plurality in China says they like rather than dislike American ideas about democracy (48% to 36%). Public rejection of American democracy in most countries may in part reflect opinions about the way in which the United States has implemented its pro-democracy agenda, as well as America’s democratic values. Majorities in 43 of 47 countries surveyed – including 63% in the United States – say that the U.S. promotes democracy mostly where it serves its interests, rather than promoting it wherever it can. The poll also finds negative attitudes toward American ways of doing business. Dislike of the U.S. approach has deepened. However, Muslim countries in the Middle East are a notable
Critics and Supporters of American Ideals
American Ideas about Democracy
Like most % Dislike most % Ivory Coast 81 Turkey 81 Nigeria 75 France 76 Ghana 73 Pakistan 72 Kenya 72 Palest. ter. 71 Ethiopia 65 Argentina 67 Mali 63 Brazil 67 Israel 61 Spain 66 Uganda 60 Germany 65 American Ways of Doing Business
Like most % Dislike most % Kenya 79 Turkey 83 Nigeria 78 France 75 Ivory Coast 78 Argentina 67 Ghana 74 Germany 64 Kuwait 71 Brazil 61 Israel 70 Canada 59 Lebanon 63 Pakistan 56
6
Views of American Exports Positive views of… US movies US Spread music science of US & TV & tech ideas* % % % Canada 73 74 22
Argentina 50 51 10 Bolivia 49 71 19 Brazil 69 74 23 Chile 58 67 24 Mexico 53 62 23 Peru 50 78 29 Venezuela 71 76 37
Britain 63 74 21 France 65 71 18 Germany 62 65 17 Italy 66 74 25 Spain 72 61 16 Sweden 77 73 28
Bulgaria 51 67 25 Czech Republic 58 56 20 Poland 65 71 23 Russia 38 32 14 Slovakia 61 58 23 Ukraine 47 46 20
Turkey 22 37 4
Egypt 39 69 13 Jordan 40 68 12 Kuwait 53 88 10 Lebanon 71 74 38 Morocco 42 55 12 Palestinian ter. 23 67 3 Israel 72 73 56
Pakistan 4 36 4 Bangladesh 14 81 25 Indonesia 50 84 11 Malaysia 54 83 16 China 42 80 38 India 23 64 29 Japan 70 81 42 South Korea 49 85 38
Ethiopia 58 92 54 Ghana 54 88 43 Ivory Coast 86 97 79 Kenya 51 87 45 Mali 68 88 45 Nigeria 59 86 51 Senegal 62 88 32 South Africa 70 80 41 Tanzania 29 63 12 Uganda 54 75 45 * “Good that American ideas and customs are spreading here.”
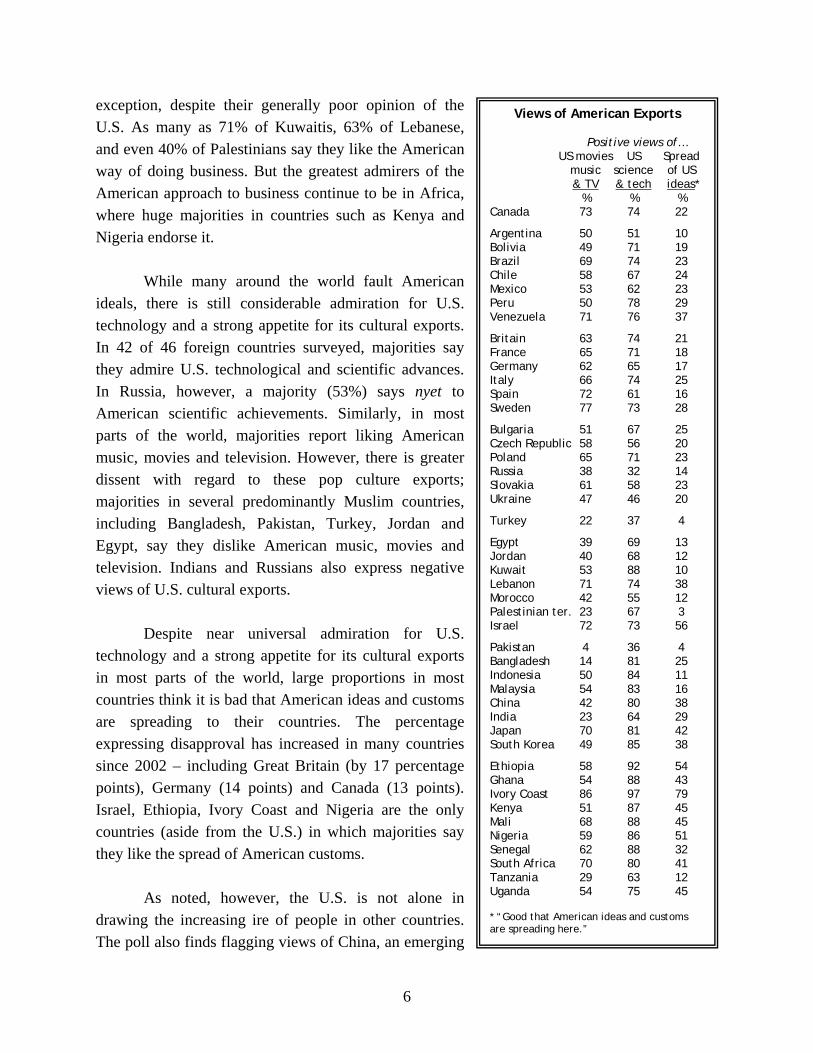
exception, despite their generally poor opinion of the U.S. As many as 71% of Kuwaitis, 63% of Lebanese, and even 40% of Palestinians say they like the American way of doing business. But the greatest admirers of the American approach to business continue to be in Africa, where huge majorities in countries such as Kenya and Nigeria endorse it. While many around the world fault American ideals, there is still considerable admiration for U.S. technology and a strong appetite for its cultural exports. In 42 of 46 foreign countries surveyed, majorities say they admire U.S. technological and scientific advances. In Russia, however, a majority (53%) says nyet to American scientific achievements. Similarly, in most parts of the world, majorities report liking American music, movies and television. However, there is greater dissent with regard to these pop culture exports; majorities in several predominantly Muslim countries, including Bangladesh, Pakistan, Turkey, Jordan and Egypt, say they dislike American music, movies and television. Indians and Russians also express negative views of U.S. cultural exports. Despite near universal admiration for U.S. technology and a strong appetite for its cultural exports in most parts of the world, large proportions in most countries think it is bad that American ideas and customs are spreading to their countries. The percentage expressing disapproval has increased in many countries since 2002 – including Great Britain (by 17 percentage points), Germany (14 points) and Canada (13 points). Israel, Ethiopia, Ivory Coast and Nigeria are the only countries (aside from the U.S.) in which majorities say they like the spread of American customs.
As noted, however, the U.S. is not alone in drawing the increasing ire of people in other countries. The poll also finds flagging views of China, an emerging
7
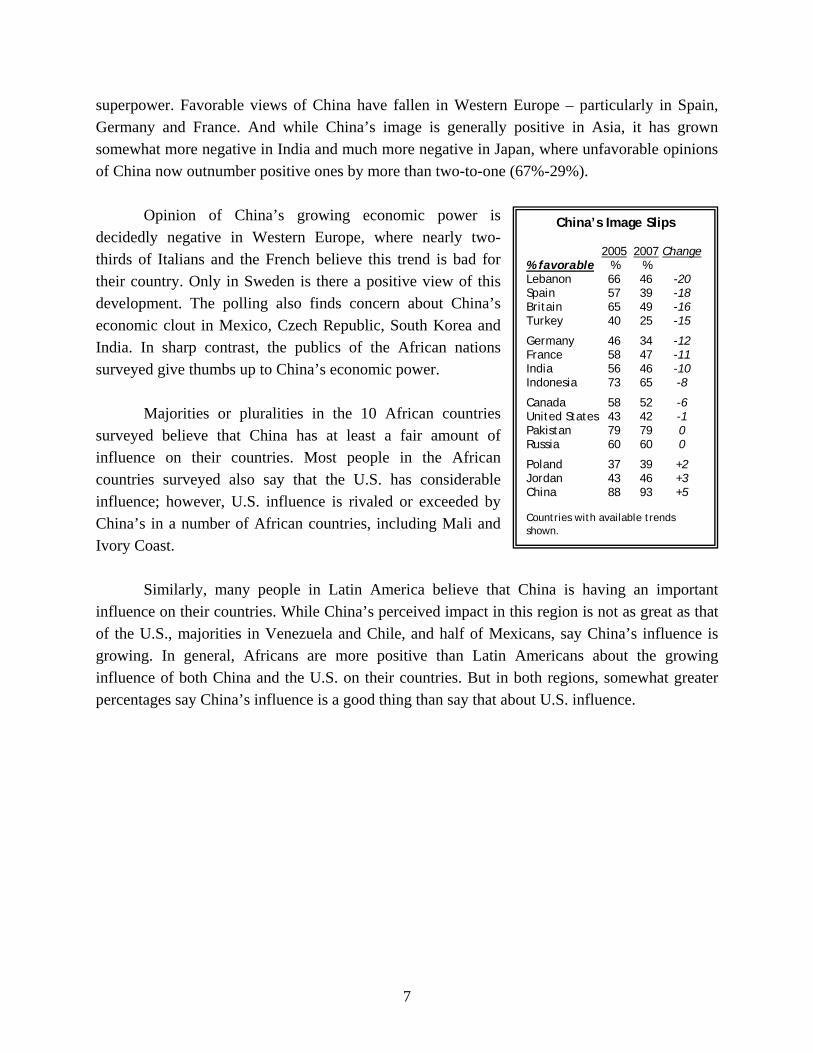
superpower. Favorable views of China have fallen in Western Europe – particularly in Spain, Germany and France. And while China’s image is generally positive in Asia, it has grown somewhat more negative in India and much more negative in Japan, where unfavorable opinions of China now outnumber positive ones by more than two-to-one (67%-29%).
Opinion of China’s growing economic power is
decidedly negative in Western Europe, where nearly two- thirds of Italians and the French believe this trend is bad for their country. Only in Sweden is there a positive view of this development. The polling also finds concern about China’s economic clout in Mexico, Czech Republic, South Korea and India. In sharp contrast, the publics of the African nations surveyed give thumbs up to China’s economic power.
Majorities or pluralities in the 10 African countries
surveyed believe that China has at least a fair amount of influence on their countries. Most people in the African countries surveyed also say that the U.S. has considerable influence; however, U.S. influence is rivaled or exceeded by China’s in a number of African countries, including Mali and Ivory Coast.
Similarly, many people in Latin America believe that China is having an important
influence on their countries. While China’s perceived impact in this region is not as great as that of the U.S., majorities in Venezuela and Chile, and half of Mexicans, say China’s influence is growing. In general, Africans are more positive than Latin Americans about the growing influence of both China and the U.S. on their countries. But in both regions, somewhat greater percentages say China’s influence is a good thing than say that about U.S. influence.
China’s Image Slips 2005 2007 Change % favorable % % Lebanon 66 46 -20 Spain 57 39 -18 Britain 65 49 -16 Turkey 40 25 -15
Germany 46 34 -12 France 58 47 -11 India 56 46 -10 Indonesia 73 65 -8
Canada 58 52 -6 United States 43 42 -1 Pakistan 79 79 0 Russia 60 60 0
Poland 37 39 +2 Jordan 43 46 +3 China 88 93 +5 Countries with available trends shown.
8
Additional Findings
• Many of the publics of NATO countries with significant numbers of troops in Afghanistan are divided over whether U.S. and NATO forces should be brought home immediately, or should remain until the country is stabilized. In the U.S., 50% favor keeping U.S. and NATO troops in Afghanistan, while 42% say they should be withdrawn as soon as possible.
• The Turkish public, which has soured on the U.S., also has become more critical of the
European Union. Just 27% of Turks have a favorable opinion of the European Union, down from 58% in 2004.
• Former Soviet bloc nations are deeply divided in their views of Russia. Fully 81% in
Ukraine have a positive opinion of Russia, but solid majorities in both Poland and the Czech Republic express negative views.
• America’s image in Venezuela has eroded considerably. Favorable opinions have
declined by nearly 30 percentage points since 2002, though a majority (56%) still has a positive impression of the U.S.
• People in Japan and Israel are deeply concerned over the spread of nuclear weapons.
Roughly two-thirds in both countries cite nuclear proliferation as top global threat – more than any other nation surveyed.
• Muslim publics in the Middle East express fairly negative views of Iran, with the
exception of the Palestinians. But in several Muslim countries outside of the Middle East, majorities have favorable opinions of Iran, including Bangladesh (77% favorable) and Pakistan (68%).
• Russian President Putin inspires much more confidence from his people than does
President Bush. More than eight-in-ten Russians (84%) say they have a lot or some confidence in Putin’s approach to world affairs; just 45% of Americans say the same abut Bush.
9
About the Pew Global Attitudes Project
The Pew Global Attitudes Project is a series of worldwide public opinion surveys encompassing a broad array of subjects ranging from people’s assessments of their own lives to their views about the current state of the world and important issues of the day. The Pew Global Attitudes Project is co-chaired by former U.S. Secretary of State Madeleine K. Albright, currently principal, the Albright Group LLC, and by former Senator John C. Danforth, currently partner, Bryan Cave LLP. The project is directed by Andrew Kohut, president of the Pew Research Center, a nonpartisan “fact tank” in Washington, DC that provides information on the issues, attitudes, and trends shaping America and the world. The Pew Global Attitudes Project is funded by The Pew Charitable Trusts, with a supplemental grant from the William and Flora Hewlett Foundation.
Since its inception in 2001, the Pew Global Attitudes Project has released 17 major reports, as well as numerous commentaries and other releases, on topics including attitudes toward the U.S. and American foreign policy, globalization, terrorism, and democratization.
Findings from the project are also analyzed in America Against the World: How We Are Different and Why We Are Disliked by Andrew Kohut and Bruce Stokes, international economics columnist at the National Journal. A paperback edition of the book was released in May 2007.
Pew Global Attitudes Project team members include Bruce Stokes; Mary McIntosh, president of Princeton Survey Research Associates International; and Wendy Sherman, principal at The Albright Group LLC. Contributors to the report and to the Pew Global Attitudes Project include Rich Morin, Richard Wike, Juliana Menasce Horowitz, Carroll Doherty, Michael Dimock, Elizabeth Mueller Gross, Paul Taylor, Jodie T. Allen, and others of the Pew Research Center. The International Herald Tribune is the project’s international newspaper partner. For this survey, the Pew Global Attitudes Project team consulted with survey and policy experts, regional and academic experts, journalists, and policymakers. Their expertise provided tremendous guidance in shaping the survey.
Following each release, the project also produces a series of in-depth analyses on specific topics covered in the survey, which will be found at www.pewglobal.org. The data are also made available on our website within two years of publication. For further information, please contact: Richard Wike Senior Researcher Pew Global Attitudes Project 202.419.4400 / [email protected]
Pew Global Attitudes Project Public Opinion Surveys
Survey Sample Interviews
Summer 2002 44 Nations 38,263
November 2002 6 Nations 6,056
March 2003 9 Nations 5,520
May 2003 21 Publics* 15,948
March 2004 9 Nations 7,765
May 2005 17 Nations 17,766
Spring 2006 15 Nations 16,710
Spring 2007 47 Publics* 45,239
* Includes the Palestinian territories.
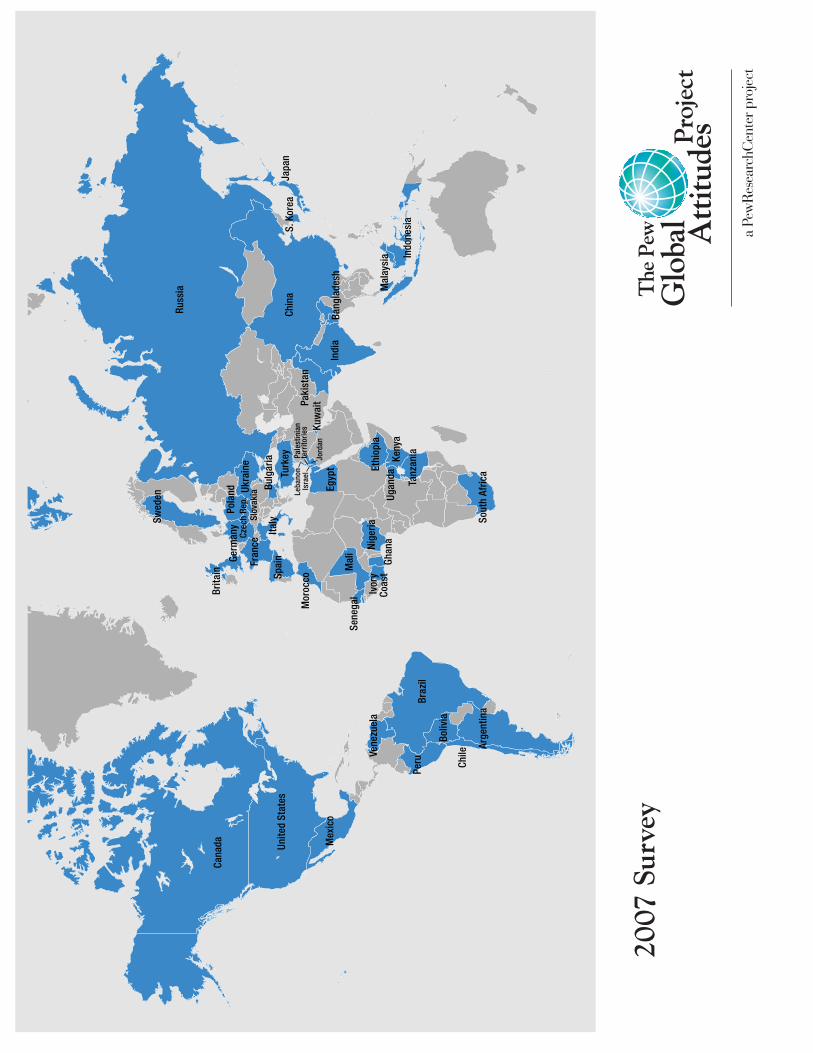
2007
Sur
vey
Arge
ntin
a
Boliv
ia
Braz
il
Cana
da Unite
d St
ates
Mex
ico
Chile
Peru
Vene
zuel
a
Brita
in
Fran
ce
Germ
any Ita
lySp
ain
Swed
en
Bulg
aria
Czec
h Re
p.Po
land
Russ
ia
Slov
akiaUk
rain
e
Egyp
t
Isra
elPa
lest
inia
nte
rrito
ries
Jord
anKu
wai
t
Leba
non
Mor
occo
Turk
ey
Bang
lade
sh
Chin
a
Indi
a
Indo
nesi
a
Japa
n
Mal
aysi
a
Paki
stan
S. K
orea
Ethi
opia
Ghan
aIv
ory
Coa
stKe
nya
Mal
i Nig
eria
Sene
gal
Sout
h Af
rica
Tanz
ania
Ugan
da
11
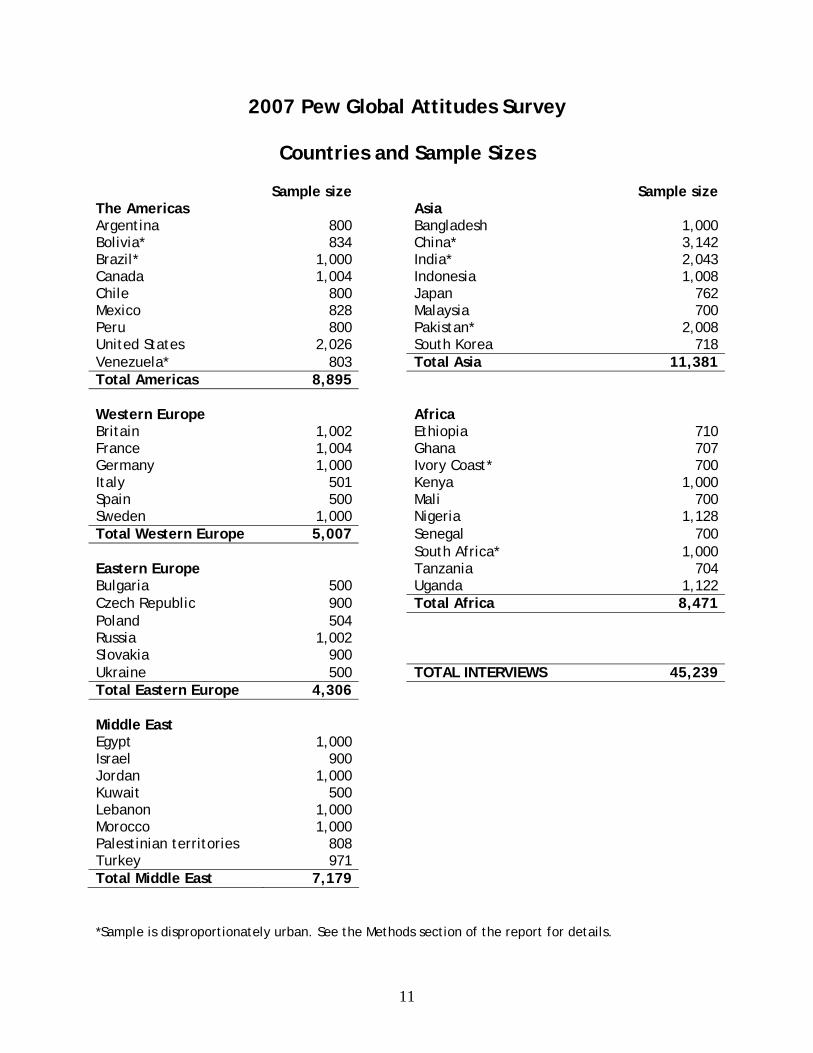
2007 Pew Global Attitudes Survey
Countries and Sample Sizes Sample size Sample size The Americas Asia Argentina 800 Bangladesh 1,000 Bolivia* 834 China* 3,142 Brazil* 1,000 India* 2,043 Canada 1,004 Indonesia 1,008 Chile 800 Japan 762 Mexico 828 Malaysia 700 Peru 800 Pakistan* 2,008 United States 2,026 South Korea 718 Venezuela* 803 Total Asia 11,381 Total Americas 8,895 Western Europe Africa Britain 1,002 Ethiopia 710 France 1,004 Ghana 707 Germany 1,000 Ivory Coast* 700 Italy 501 Kenya 1,000 Spain 500 Mali 700 Sweden 1,000 Nigeria 1,128 Total Western Europe 5,007 Senegal 700 South Africa* 1,000 Eastern Europe Tanzania 704 Bulgaria 500 Uganda 1,122 Czech Republic 900 Total Africa 8,471 Poland 504 Russia 1,002 Slovakia 900 Ukraine 500 TOTAL INTERVIEWS 45,239 Total Eastern Europe 4,306 Middle East Egypt 1,000 Israel 900 Jordan 1,000 Kuwait 500 Lebanon 1,000 Morocco 1,000 Palestinian territories 808 Turkey 971 Total Middle East 7,179 *Sample is disproportionately urban. See the Methods section of the report for details.
12
Roadmap to the Report The first chapter examines international opinions about the United States and American foreign policy, including views of the wars in Iraq and Afghanistan, and the U.S.-led war in terror. The second chapter focuses on public attitudes toward global threats, documenting a widespread increase in concern about pollution and environmental problems. Chapter 3 looks at reactions to China’s growing economic and military power. Chapter 4 examines international opinions about Iran, its president, and nuclear program. Chapter 5 focuses on attitudes toward the Israeli-Palestinian conflict and Middle Eastern leaders. Chapter 6 looks at views of major leaders and institutions. Chapter 7 provides a look at opinions about Russia.
A summary of the survey’s methodology, followed by complete 2007 topline results, can be found at the end of the report. Trend data from previous Pew Global Attitudes surveys can be found at www.pewglobal.org.
13
1. VIEWS OF THE U.S. AND AMERICAN FOREIGN POLICY
ver the last five years, America’s image has plummeted throughout much of the world, including sharp
drops in favorability among traditional allies in Western Europe, as well as substantial declines in Latin America, the Middle East, and elsewhere.
In the past year alone, positive views
of the U.S. have declined in Pakistan, China, Egypt, and Germany. However, opinions of the United States vary widely, and there continue to be regions where views of America are still decidedly positive. U.S. Remains Popular in Africa
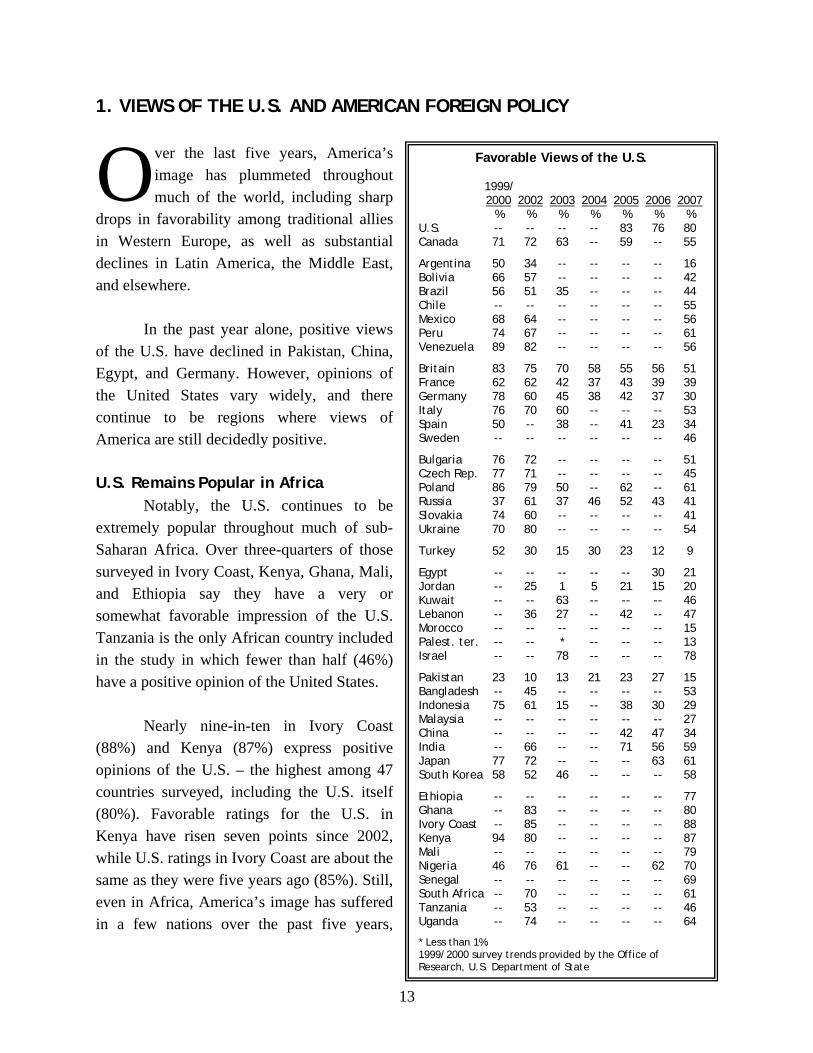
Notably, the U.S. continues to be extremely popular throughout much of sub-Saharan Africa. Over three-quarters of those surveyed in Ivory Coast, Kenya, Ghana, Mali, and Ethiopia say they have a very or somewhat favorable impression of the U.S. Tanzania is the only African country included in the study in which fewer than half (46%) have a positive opinion of the United States.
Nearly nine-in-ten in Ivory Coast
(88%) and Kenya (87%) express positive opinions of the U.S. – the highest among 47 countries surveyed, including the U.S. itself (80%). Favorable ratings for the U.S. in Kenya have risen seven points since 2002, while U.S. ratings in Ivory Coast are about the same as they were five years ago (85%). Still, even in Africa, America’s image has suffered in a few nations over the past five years,
O Favorable Views of the U.S. 1999/ 2000 2002 2003 2004 2005 2006 2007 % % % % % % % U.S. -- -- -- -- 83 76 80 Canada 71 72 63 -- 59 -- 55
Argentina 50 34 -- -- -- -- 16 Bolivia 66 57 -- -- -- -- 42 Brazil 56 51 35 -- -- -- 44 Chile -- -- -- -- -- -- 55 Mexico 68 64 -- -- -- -- 56 Peru 74 67 -- -- -- -- 61 Venezuela 89 82 -- -- -- -- 56
Britain 83 75 70 58 55 56 51 France 62 62 42 37 43 39 39 Germany 78 60 45 38 42 37 30 Italy 76 70 60 -- -- -- 53 Spain 50 -- 38 -- 41 23 34 Sweden -- -- -- -- -- -- 46
Bulgaria 76 72 -- -- -- -- 51 Czech Rep. 77 71 -- -- -- -- 45 Poland 86 79 50 -- 62 -- 61 Russia 37 61 37 46 52 43 41 Slovakia 74 60 -- -- -- -- 41 Ukraine 70 80 -- -- -- -- 54
Turkey 52 30 15 30 23 12 9
Egypt -- -- -- -- -- 30 21 Jordan -- 25 1 5 21 15 20 Kuwait -- -- 63 -- -- -- 46 Lebanon -- 36 27 -- 42 -- 47 Morocco -- -- -- -- -- -- 15 Palest. ter. -- -- * -- -- -- 13 Israel -- -- 78 -- -- -- 78
Pakistan 23 10 13 21 23 27 15 Bangladesh -- 45 -- -- -- -- 53 Indonesia 75 61 15 -- 38 30 29 Malaysia -- -- -- -- -- -- 27 China -- -- -- -- 42 47 34 India -- 66 -- -- 71 56 59 Japan 77 72 -- -- -- 63 61 South Korea 58 52 46 -- -- -- 58
Ethiopia -- -- -- -- -- -- 77 Ghana -- 83 -- -- -- -- 80 Ivory Coast -- 85 -- -- -- -- 88 Kenya 94 80 -- -- -- -- 87 Mali -- -- -- -- -- -- 79 Nigeria 46 76 61 -- -- 62 70 Senegal -- -- -- -- -- -- 69 South Africa -- 70 -- -- -- -- 61 Tanzania -- 53 -- -- -- -- 46 Uganda -- 74 -- -- -- -- 64
* Less than 1%. 1999/2000 survey trends provided by the Office of Research, U.S. Department of State
14
dropping 10 points in Uganda, nine points in South Africa, and seven points in Tanzania. In Africa’s two most populous countries, Nigeria and Ethiopia, attitudes toward the U.S.
are sharply divided along religious lines, with Christians much more likely than Muslims to take a positive view. In Ethiopia, Christians give the U.S. a nearly unanimous positive rating (93% favorable), while Muslims are evenly divided (48% favorable, 49% unfavorable). The pattern in Nigeria is almost identical – 94% of Nigeria’s Christians express a positive opinion of the United States, while Muslims are divided (49% favorable, 47% unfavorable).
However, divisions along religious lines are less pronounced in Tanzania, another African country with a sizable population of both Christians and Muslims. Tanzanian Christians (50%) are only slightly more likely than Muslims (42%) to have a favorable opinion of the U.S.
Less Support for the U.S. in Latin America
The image of the United States has eroded since 2002 in all six Latin American countries for which trends are available. The decline has been especially steep in Venezuela (26 points), Argentina (18 points), and Bolivia (15 points). Nonetheless, majorities in four of the seven Latin American nations included in the survey – including Venezuela (56%) – have a positive opinion of the U.S.
Both Brazilians (44% favorable, 51% unfavorable) and Bolivians (42% favorable, 52%
unfavorable) are somewhat more likely to have a negative opinion of the U.S. than a positive one. Five years ago, majorities in both nations felt favorably toward the U.S. Meanwhile, negative views of the U.S. in Argentina, which were clearly evident five years ago, have only intensified. Indeed, the balance of opinion toward the U.S. among Argentines (16% favorable, 72% unfavorable) is worse than in any country surveyed outside the Middle East.
Still Unpopular in the Middle East
The U.S. continues to be widely unpopular in the Middle East. More than three-in-four Palestinians, Turks, Egyptians, and Jordanians express unfavorable opinions of the U.S. In fact, the United States receives a lower favorable rating (9%) in Turkey – a NATO ally – than in any country surveyed. This is down from a 30% favorable rating in 2002, and down even more dramatically from a 1999/2000 State Department poll that found a slim majority of Turks (52%) with a positive view of the U.S.
America’s image has also suffered in Kuwait, although it is still less negative there than in some neighboring countries. In 2003 – when U.S. favorability dropped in countries throughout the Middle East and elsewhere – Kuwaitis maintained a strongly positive view of the U.S., with
15
63% holding a favorable opinion. Today, however, Kuwaitis are evenly divided: 46% express a favorable view of the U.S. and 46% an unfavorable one.
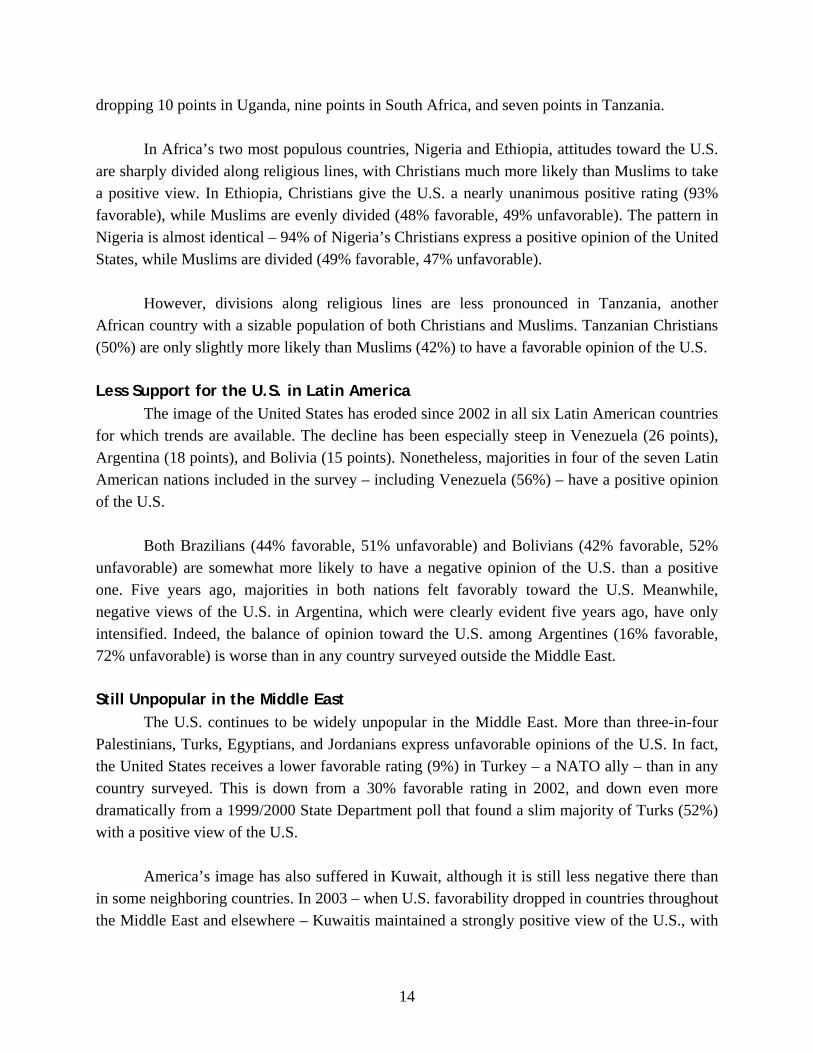
One country in the region where attitudes toward
the U.S. have actually improved is Lebanon. Five years ago, 36% of Lebanese had a positive view of the U.S., and this number fell to 27% in 2003. Since then it has risen to 42% in 2005, and to 47% this year. However, opinions vary considerably among Lebanon’s diverse religious communities.
Christians tend to be strongly pro-American (82%
favorable), and most of the improvement in America’s image over the last few years has taken place in the Christian community (44% favorable in 2002, 48% in 2003, 72% in 2005, and 82% this year). Meanwhile, there are sharp differences within the Muslim community, which is split between Shia and Sunni sects. Lebanese Shia hold strongly negative views of the U.S., with nine-in-ten (92%) saying they have an unfavorable opinion. Lebanese Sunnis, on the other hand, are divided, with 52% voicing a positive view of the U.S. and 47% giving a negative assessment. Sunnis in Lebanon are less likely to hold negative views of the U.S. than are Sunnis in Jordan and Egypt.
America’s closest ally in the region, Israel, continues to have overwhelmingly favorable
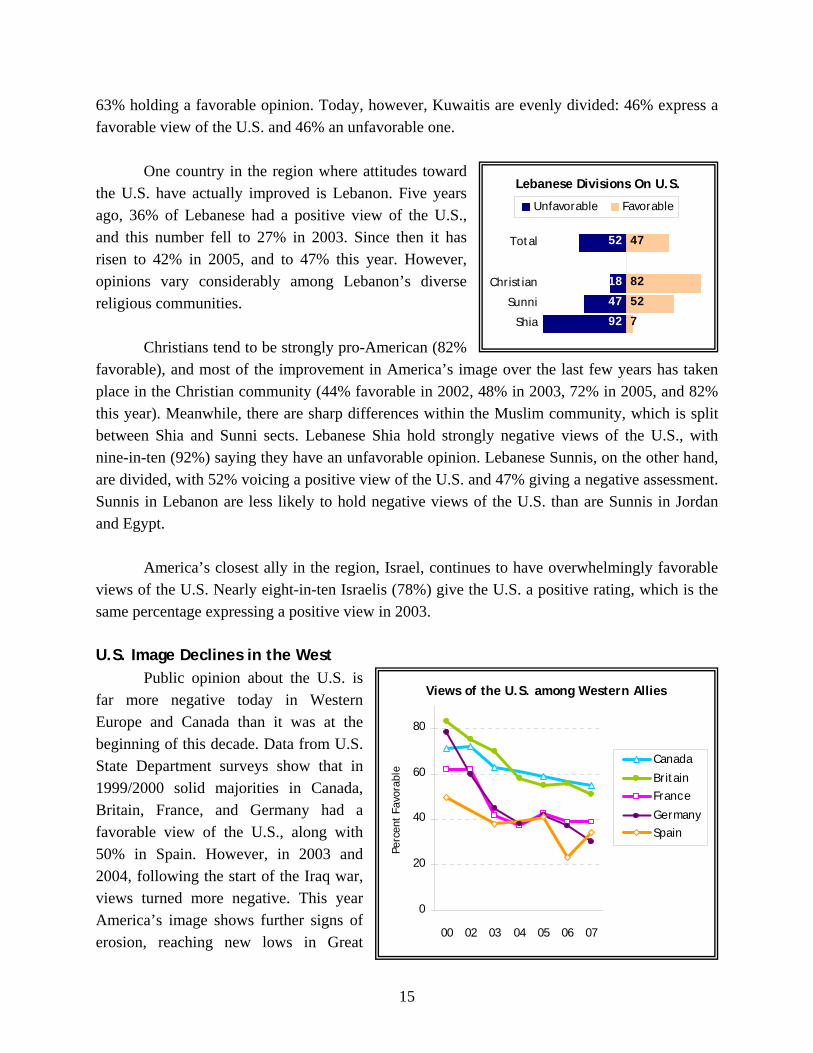
views of the U.S. Nearly eight-in-ten Israelis (78%) give the U.S. a positive rating, which is the same percentage expressing a positive view in 2003. U.S. Image Declines in the West Public opinion about the U.S. is far more negative today in Western Europe and Canada than it was at the beginning of this decade. Data from U.S. State Department surveys show that in 1999/2000 solid majorities in Canada, Britain, France, and Germany had a favorable view of the U.S., along with 50% in Spain. However, in 2003 and 2004, following the start of the Iraq war, views turned more negative. This year America’s image shows further signs of erosion, reaching new lows in Great
Lebanese Divisions On U.S.
18
47
92
47
52
7
52
82
Total
Christian
Sunni
Shia
Unfavorable Favorable
Views of the U.S. among Western Allies
0
20
40
60
80
00 02 03 04 05 06 07
Perc
ent
Favo
rabl
e
Canada
BritainFrance
GermanySpain
16
Britain (51%) and Germany (30%). Favorable views of the U.S. are up this year in Spain, although Spanish opinion remains quite negative; only 34% have a favorable view of the U.S., compared with 60% who have an unfavorable opinion. Less Enthusiasm for the U.S. in “New Europe” America’s image also has slipped in Eastern Europe, and to some extent attitudes toward the U.S. in New Europe are beginning to resemble those found in Old Europe. Five years ago, strong majorities in Poland, Bulgaria, the Czech Republic and Slovakia gave the U.S. favorable marks, but views have grown more negative in these four countries, all of which have joined the EU in the last five years. Favorable views of the U.S. also are down in Russia and Ukraine. In 2002, six-in-ten Russians (61%) had a positive opinion of the U.S., compared with only 41% today. In Ukraine, a slender majority (54%) retains a positive view of the U.S., but this is down considerably from 2002, when fully eight-in-ten Ukrainians had a favorable impression. Asia: U.S. Image Up in South Korea In just the last year, attitudes towards the U.S. have grown more negative in two large and strategically important Asian nations, China and Pakistan. In 2006, the Chinese were slightly more likely to have a favorable opinion of the U.S. (47%) than an unfavorable opinion (43%). This year the balance has shifted; just 34% of Chinese have a positive view of the U.S., while 57% give it a negative rating. Public sentiment toward the U.S. has long been quite negative in Pakistan, though it had edged upward from a low of 10% favorable in 2002 to 27% a year ago. But in the current survey, just 15% of Pakistanis express a favorable opinion of the U.S., while roughly two-thirds (68%) express an unfavorable opinion.
In addition to Pakistan, the U.S. is unpopular in two other largely Muslim nations in Asia, Indonesia and Malaysia. Views of the United States have fluctuated in Indonesia in recent years: Positive opinions fell dramatically between 2002 and 2003 (from 61% to 15%), before recovering to 38% in 2005 after the U.S. mounted a large-scale assistance effort for Indonesia following its December
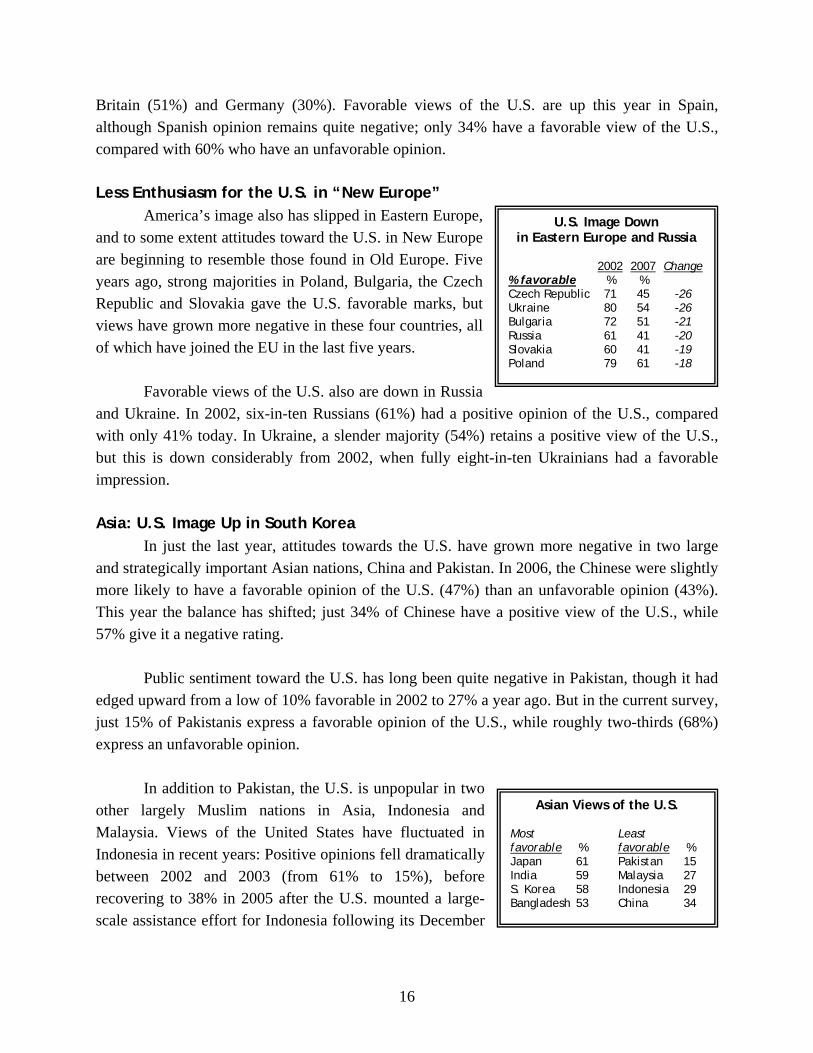
U.S. Image Down in Eastern Europe and Russia
2002 2007 Change % favorable % % Czech Republic 71 45 -26 Ukraine 80 54 -26 Bulgaria 72 51 -21 Russia 61 41 -20 Slovakia 60 41 -19 Poland 79 61 -18
Asian Views of the U.S. Most Least favorable % favorable % Japan 61 Pakistan 15 India 59 Malaysia 27 S. Korea 58 Indonesia 29 Bangladesh 53 China 34
17
2004 tsunami. Today, U.S. favorability in Indonesia stands at 29%, roughly double its 2003 low, but far below its pre-Iraq war level.
In neighboring Malaysia, only 27% have a favorable view of the U.S.; opinions differ
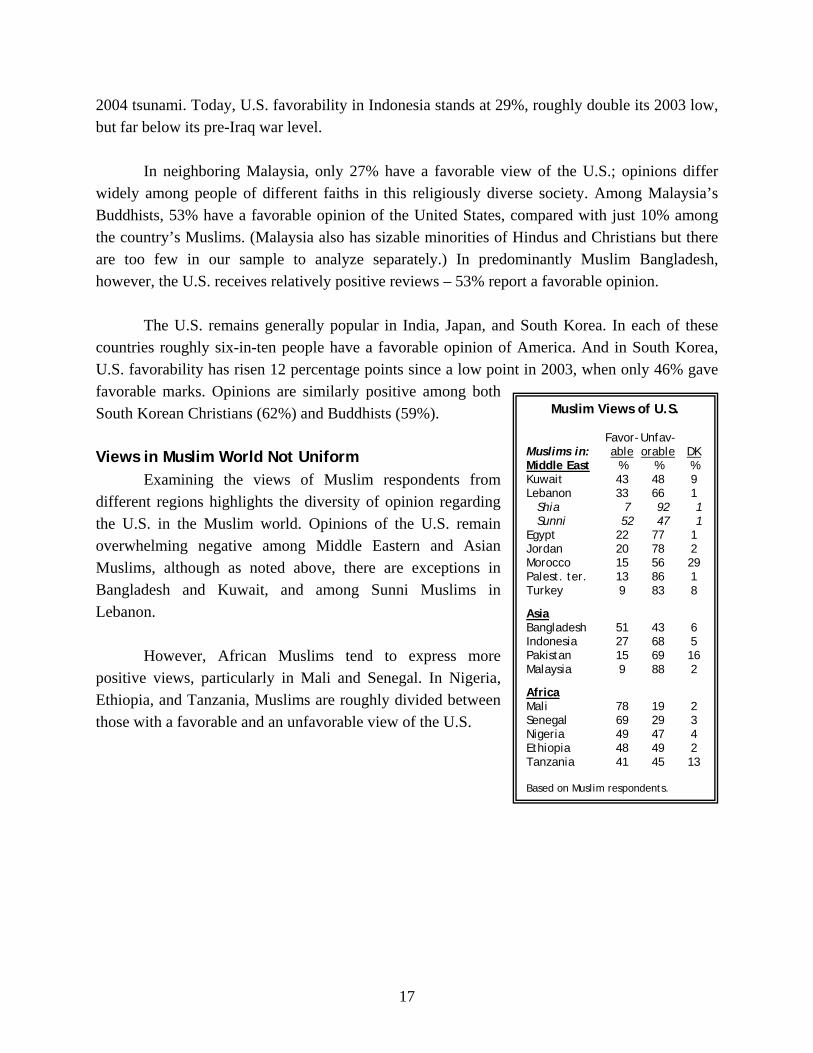
widely among people of different faiths in this religiously diverse society. Among Malaysia’s Buddhists, 53% have a favorable opinion of the United States, compared with just 10% among the country’s Muslims. (Malaysia also has sizable minorities of Hindus and Christians but there are too few in our sample to analyze separately.) In predominantly Muslim Bangladesh, however, the U.S. receives relatively positive reviews – 53% report a favorable opinion. The U.S. remains generally popular in India, Japan, and South Korea. In each of these countries roughly six-in-ten people have a favorable opinion of America. And in South Korea, U.S. favorability has risen 12 percentage points since a low point in 2003, when only 46% gave favorable marks. Opinions are similarly positive among both South Korean Christians (62%) and Buddhists (59%). Views in Muslim World Not Uniform Examining the views of Muslim respondents from different regions highlights the diversity of opinion regarding the U.S. in the Muslim world. Opinions of the U.S. remain overwhelming negative among Middle Eastern and Asian Muslims, although as noted above, there are exceptions in Bangladesh and Kuwait, and among Sunni Muslims in Lebanon.
However, African Muslims tend to express more positive views, particularly in Mali and Senegal. In Nigeria, Ethiopia, and Tanzania, Muslims are roughly divided between those with a favorable and an unfavorable view of the U.S.
Muslim Views of U.S. Favor- Unfav- Muslims in: able orable DK Middle East % % % Kuwait 43 48 9 Lebanon 33 66 1 Shia 7 92 1 Sunni 52 47 1 Egypt 22 77 1 Jordan 20 78 2 Morocco 15 56 29 Palest. ter. 13 86 1 Turkey 9 83 8
Asia Bangladesh 51 43 6 Indonesia 27 68 5 Pakistan 15 69 16 Malaysia 9 88 2
Africa Mali 78 19 2 Senegal 69 29 3 Nigeria 49 47 4 Ethiopia 48 49 2 Tanzania 41 45 13 Based on Muslim respondents.
18
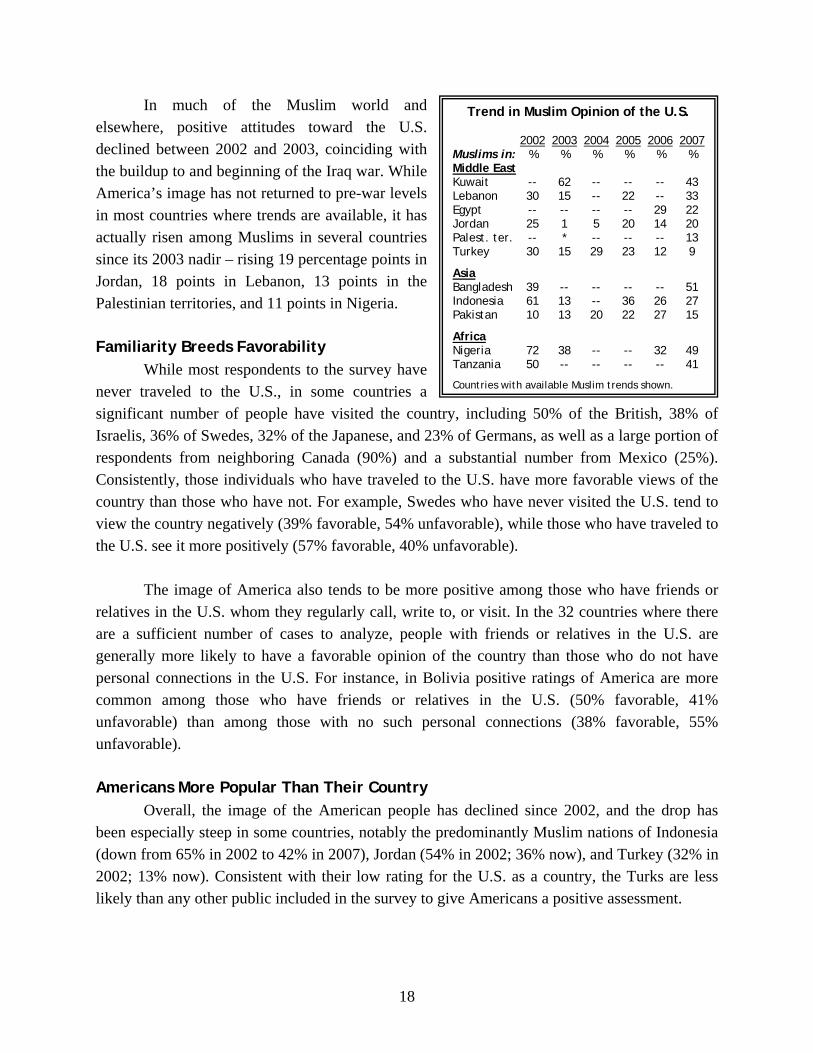
In much of the Muslim world and elsewhere, positive attitudes toward the U.S. declined between 2002 and 2003, coinciding with the buildup to and beginning of the Iraq war. While America’s image has not returned to pre-war levels in most countries where trends are available, it has actually risen among Muslims in several countries since its 2003 nadir – rising 19 percentage points in Jordan, 18 points in Lebanon, 13 points in the Palestinian territories, and 11 points in Nigeria. Familiarity Breeds Favorability While most respondents to the survey have never traveled to the U.S., in some countries a significant number of people have visited the country, including 50% of the British, 38% of Israelis, 36% of Swedes, 32% of the Japanese, and 23% of Germans, as well as a large portion of respondents from neighboring Canada (90%) and a substantial number from Mexico (25%). Consistently, those individuals who have traveled to the U.S. have more favorable views of the country than those who have not. For example, Swedes who have never visited the U.S. tend to view the country negatively (39% favorable, 54% unfavorable), while those who have traveled to the U.S. see it more positively (57% favorable, 40% unfavorable). The image of America also tends to be more positive among those who have friends or relatives in the U.S. whom they regularly call, write to, or visit. In the 32 countries where there are a sufficient number of cases to analyze, people with friends or relatives in the U.S. are generally more likely to have a favorable opinion of the country than those who do not have personal connections in the U.S. For instance, in Bolivia positive ratings of America are more common among those who have friends or relatives in the U.S. (50% favorable, 41% unfavorable) than among those with no such personal connections (38% favorable, 55% unfavorable). Americans More Popular Than Their Country Overall, the image of the American people has declined since 2002, and the drop has been especially steep in some countries, notably the predominantly Muslim nations of Indonesia (down from 65% in 2002 to 42% in 2007), Jordan (54% in 2002; 36% now), and Turkey (32% in 2002; 13% now). Consistent with their low rating for the U.S. as a country, the Turks are less likely than any other public included in the survey to give Americans a positive assessment.
Trend in Muslim Opinion of the U.S. 2002 2003 2004 2005 2006 2007 Muslims in: % % % % % % Middle East Kuwait -- 62 -- -- -- 43 Lebanon 30 15 -- 22 -- 33 Egypt -- -- -- -- 29 22 Jordan 25 1 5 20 14 20 Palest. ter. -- * -- -- -- 13 Turkey 30 15 29 23 12 9
Asia Bangladesh 39 -- -- -- -- 51 Indonesia 61 13 -- 36 26 27 Pakistan 10 13 20 22 27 15
Africa Nigeria 72 38 -- -- 32 49 Tanzania 50 -- -- -- -- 41
Countries with available Muslim trends shown.
19
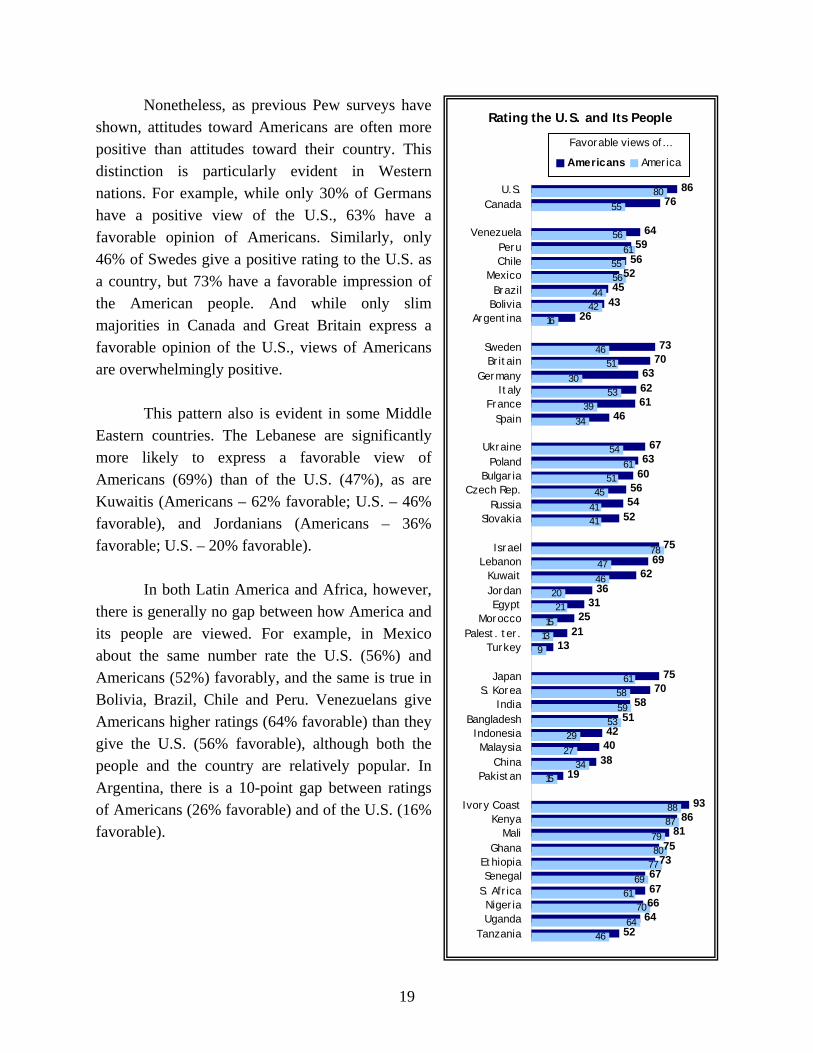
Nonetheless, as previous Pew surveys have shown, attitudes toward Americans are often more positive than attitudes toward their country. This distinction is particularly evident in Western nations. For example, while only 30% of Germans have a positive view of the U.S., 63% have a favorable opinion of Americans. Similarly, only 46% of Swedes give a positive rating to the U.S. as a country, but 73% have a favorable impression of the American people. And while only slim majorities in Canada and Great Britain express a favorable opinion of the U.S., views of Americans are overwhelmingly positive. This pattern also is evident in some Middle Eastern countries. The Lebanese are significantly more likely to express a favorable view of Americans (69%) than of the U.S. (47%), as are Kuwaitis (Americans – 62% favorable; U.S. – 46% favorable), and Jordanians (Americans – 36% favorable; U.S. – 20% favorable). In both Latin America and Africa, however, there is generally no gap between how America and its people are viewed. For example, in Mexico about the same number rate the U.S. (56%) and Americans (52%) favorably, and the same is true in Bolivia, Brazil, Chile and Peru. Venezuelans give Americans higher ratings (64% favorable) than they give the U.S. (56% favorable), although both the people and the country are relatively popular. In Argentina, there is a 10-point gap between ratings of Americans (26% favorable) and of the U.S. (16% favorable).
Rating the U.S. and Its People
8676
6459
56
4326
7370
636261
46
6763
605654
52
7569
6236
3125
2113
7570
5851
424038
19
9386
8175
7367676664
52
8055
5661
5556
4442
16
4651
3053
3934
5461
5145
4141
784746
2021
1513
9
615859
5329
2734
15
8887
7980
7769
6170
6446
4552
U.S.Canada
VenezuelaPeruChile
MexicoBrazil
BoliviaArgentina
SwedenBritain
GermanyItaly
FranceSpain
UkrainePoland
BulgariaCzech Rep.
RussiaSlovakia
IsraelLebanon
KuwaitJordanEgypt
MoroccoPalest. ter.
Turkey
JapanS. Korea
India Bangladesh Indonesia
MalaysiaChina
Pakistan
Ivory CoastKenya
MaliGhana
EthiopiaSenegal
S. AfricaNigeriaUganda
Tanzania
Americans America
Favorable views of…
20
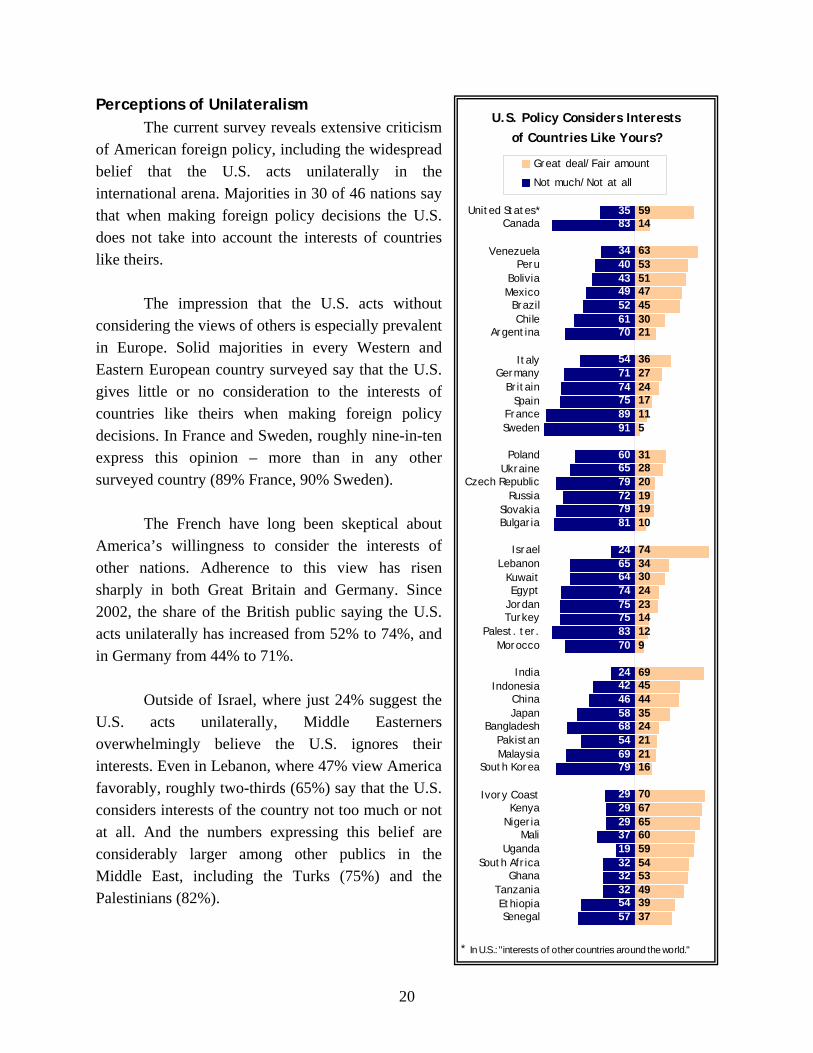
Perceptions of Unilateralism The current survey reveals extensive criticism of American foreign policy, including the widespread belief that the U.S. acts unilaterally in the international arena. Majorities in 30 of 46 nations say that when making foreign policy decisions the U.S. does not take into account the interests of countries like theirs. The impression that the U.S. acts without considering the views of others is especially prevalent in Europe. Solid majorities in every Western and Eastern European country surveyed say that the U.S. gives little or no consideration to the interests of countries like theirs when making foreign policy decisions. In France and Sweden, roughly nine-in-ten express this opinion – more than in any other surveyed country (89% France, 90% Sweden). The French have long been skeptical about America’s willingness to consider the interests of other nations. Adherence to this view has risen sharply in both Great Britain and Germany. Since 2002, the share of the British public saying the U.S. acts unilaterally has increased from 52% to 74%, and in Germany from 44% to 71%. Outside of Israel, where just 24% suggest the U.S. acts unilaterally, Middle Easterners overwhelmingly believe the U.S. ignores their interests. Even in Lebanon, where 47% view America favorably, roughly two-thirds (65%) say that the U.S. considers interests of the country not too much or not at all. And the numbers expressing this belief are considerably larger among other publics in the Middle East, including the Turks (75%) and the Palestinians (82%).
U.S. Policy Considers Interests of Countries Like Yours?
5914
63535147453021
3627241711
312820191910
743430242314129
6945443524212116
7067
60595453493937
3583
34404349526170
547174758991
606579727981
2465647475758370
2442465868546979
29292937193232325457
65
5
United States*Canada
VenezuelaPeru
BoliviaMexico
BrazilChile
Argentina
ItalyGermany
BritainSpain
FranceSweden
PolandUkraine
Czech RepublicRussia
SlovakiaBulgaria
IsraelLebanon
KuwaitEgypt
JordanTurkey
Palest. ter.Morocco
IndiaIndonesia
ChinaJapan
BangladeshPakistanMalaysia
South Korea
Ivory CoastKenya
NigeriaMali
UgandaSouth Africa
GhanaTanzaniaEthiopiaSenegal
Great deal/Fair amount
Not much/Not at all
* In U.S.: "interests of other countries around the world."
21
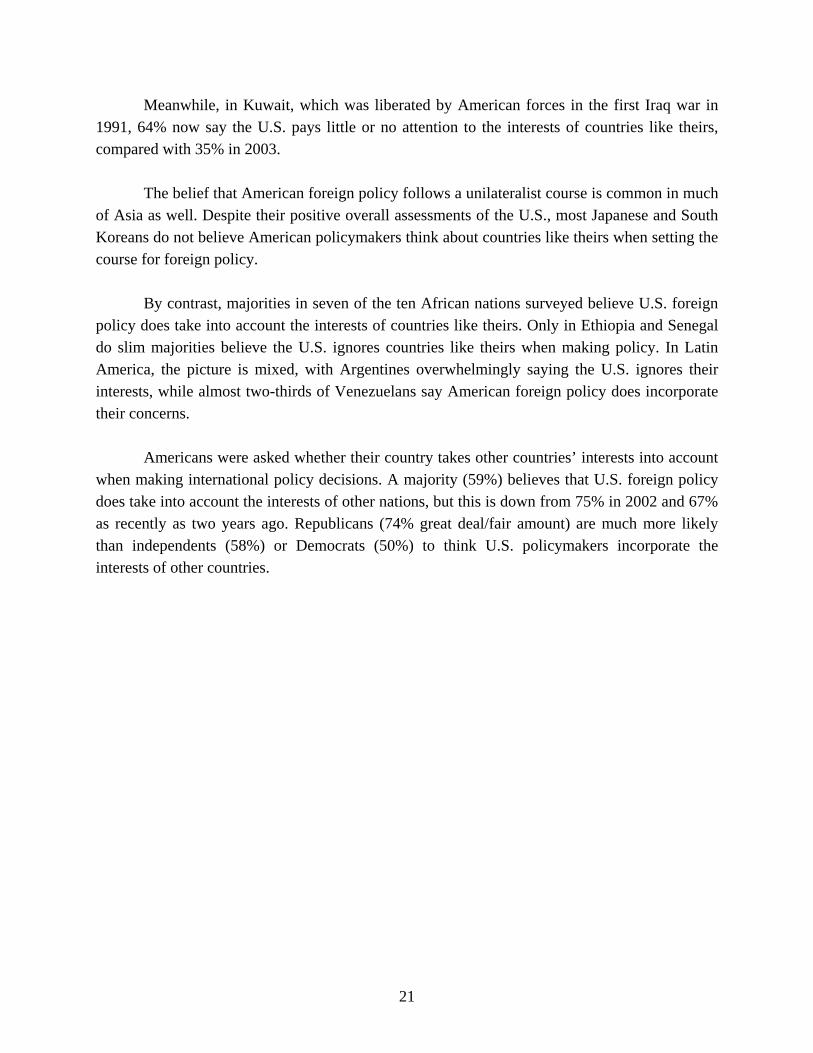
Meanwhile, in Kuwait, which was liberated by American forces in the first Iraq war in 1991, 64% now say the U.S. pays little or no attention to the interests of countries like theirs, compared with 35% in 2003. The belief that American foreign policy follows a unilateralist course is common in much of Asia as well. Despite their positive overall assessments of the U.S., most Japanese and South Koreans do not believe American policymakers think about countries like theirs when setting the course for foreign policy. By contrast, majorities in seven of the ten African nations surveyed believe U.S. foreign policy does take into account the interests of countries like theirs. Only in Ethiopia and Senegal do slim majorities believe the U.S. ignores countries like theirs when making policy. In Latin America, the picture is mixed, with Argentines overwhelmingly saying the U.S. ignores their interests, while almost two-thirds of Venezuelans say American foreign policy does incorporate their concerns. Americans were asked whether their country takes other countries’ interests into account when making international policy decisions. A majority (59%) believes that U.S. foreign policy does take into account the interests of other nations, but this is down from 75% in 2002 and 67% as recently as two years ago. Republicans (74% great deal/fair amount) are much more likely than independents (58%) or Democrats (50%) to think U.S. policymakers incorporate the interests of other countries.
22
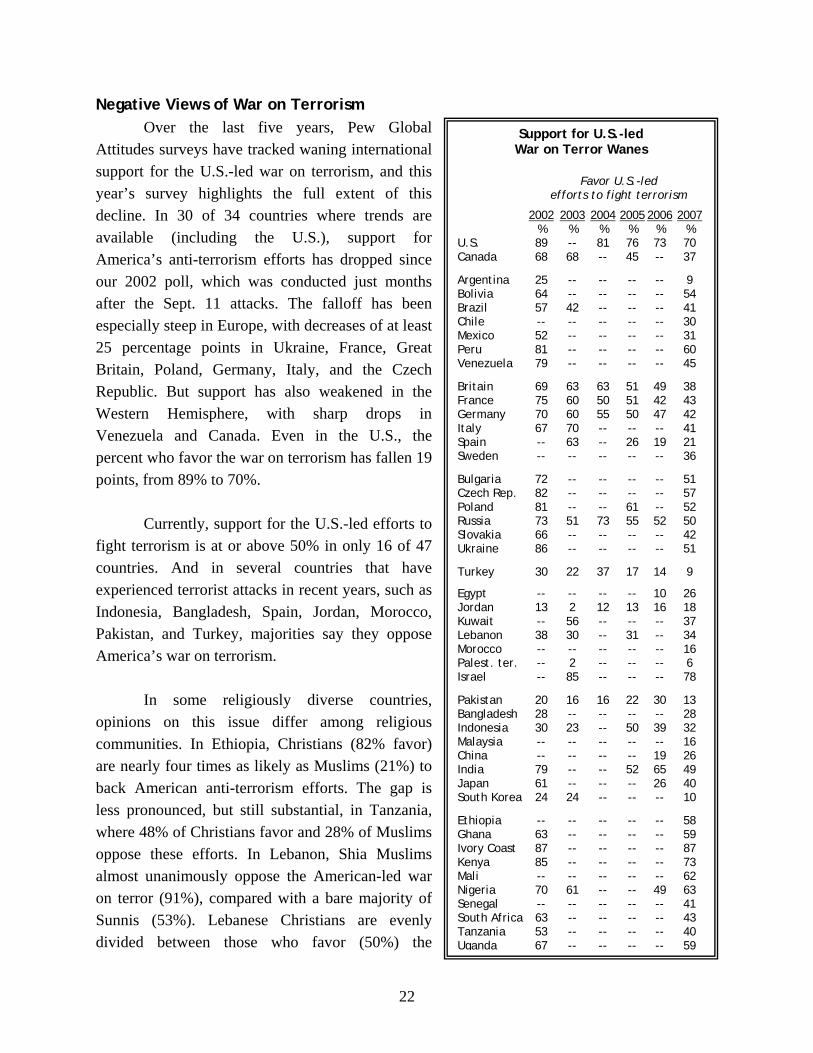
Negative Views of War on Terrorism Over the last five years, Pew Global Attitudes surveys have tracked waning international support for the U.S.-led war on terrorism, and this year’s survey highlights the full extent of this decline. In 30 of 34 countries where trends are available (including the U.S.), support for America’s anti-terrorism efforts has dropped since our 2002 poll, which was conducted just months after the Sept. 11 attacks. The falloff has been especially steep in Europe, with decreases of at least 25 percentage points in Ukraine, France, Great Britain, Poland, Germany, Italy, and the Czech Republic. But support has also weakened in the Western Hemisphere, with sharp drops in Venezuela and Canada. Even in the U.S., the percent who favor the war on terrorism has fallen 19 points, from 89% to 70%. Currently, support for the U.S.-led efforts to fight terrorism is at or above 50% in only 16 of 47 countries. And in several countries that have experienced terrorist attacks in recent years, such as Indonesia, Bangladesh, Spain, Jordan, Morocco, Pakistan, and Turkey, majorities say they oppose America’s war on terrorism. In some religiously diverse countries, opinions on this issue differ among religious communities. In Ethiopia, Christians (82% favor) are nearly four times as likely as Muslims (21%) to back American anti-terrorism efforts. The gap is less pronounced, but still substantial, in Tanzania, where 48% of Christians favor and 28% of Muslims oppose these efforts. In Lebanon, Shia Muslims almost unanimously oppose the American-led war on terror (91%), compared with a bare majority of Sunnis (53%). Lebanese Christians are evenly divided between those who favor (50%) the
Support for U.S.-led War on Terror Wanes
Favor U.S.-led efforts to fight terrorism
2002 2003 2004 2005 2006 2007 % % % % % % U.S. 89 -- 81 76 73 70 Canada 68 68 -- 45 -- 37
Argentina 25 -- -- -- -- 9 Bolivia 64 -- -- -- -- 54 Brazil 57 42 -- -- -- 41 Chile -- -- -- -- -- 30 Mexico 52 -- -- -- -- 31 Peru 81 -- -- -- -- 60 Venezuela 79 -- -- -- -- 45
Britain 69 63 63 51 49 38 France 75 60 50 51 42 43 Germany 70 60 55 50 47 42 Italy 67 70 -- -- -- 41 Spain -- 63 -- 26 19 21 Sweden -- -- -- -- -- 36
Bulgaria 72 -- -- -- -- 51 Czech Rep. 82 -- -- -- -- 57 Poland 81 -- -- 61 -- 52 Russia 73 51 73 55 52 50 Slovakia 66 -- -- -- -- 42 Ukraine 86 -- -- -- -- 51
Turkey 30 22 37 17 14 9
Egypt -- -- -- -- 10 26 Jordan 13 2 12 13 16 18 Kuwait -- 56 -- -- -- 37 Lebanon 38 30 -- 31 -- 34 Morocco -- -- -- -- -- 16 Palest. ter. -- 2 -- -- -- 6 Israel -- 85 -- -- -- 78
Pakistan 20 16 16 22 30 13 Bangladesh 28 -- -- -- -- 28 Indonesia 30 23 -- 50 39 32 Malaysia -- -- -- -- -- 16 China -- -- -- -- 19 26 India 79 -- -- 52 65 49 Japan 61 -- -- -- 26 40 South Korea 24 24 -- -- -- 10
Ethiopia -- -- -- -- -- 58 Ghana 63 -- -- -- -- 59 Ivory Coast 87 -- -- -- -- 87 Kenya 85 -- -- -- -- 73 Mali -- -- -- -- -- 62 Nigeria 70 61 -- -- 49 63 Senegal -- -- -- -- -- 41 South Africa 63 -- -- -- -- 43 Tanzania 53 -- -- -- -- 40 Uganda 67 -- -- -- -- 59
23
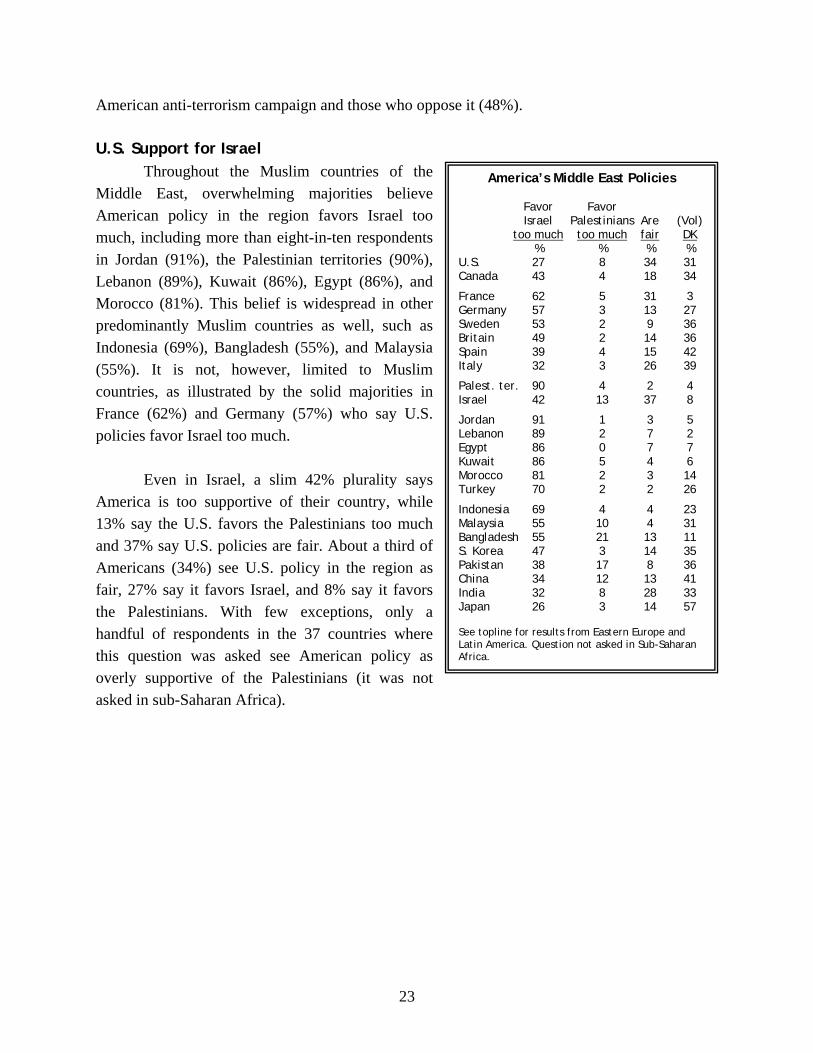
American anti-terrorism campaign and those who oppose it (48%). U.S. Support for Israel Throughout the Muslim countries of the Middle East, overwhelming majorities believe American policy in the region favors Israel too much, including more than eight-in-ten respondents in Jordan (91%), the Palestinian territories (90%), Lebanon (89%), Kuwait (86%), Egypt (86%), and Morocco (81%). This belief is widespread in other predominantly Muslim countries as well, such as Indonesia (69%), Bangladesh (55%), and Malaysia (55%). It is not, however, limited to Muslim countries, as illustrated by the solid majorities in France (62%) and Germany (57%) who say U.S. policies favor Israel too much. Even in Israel, a slim 42% plurality says America is too supportive of their country, while 13% say the U.S. favors the Palestinians too much and 37% say U.S. policies are fair. About a third of Americans (34%) see U.S. policy in the region as fair, 27% say it favors Israel, and 8% say it favors the Palestinians. With few exceptions, only a handful of respondents in the 37 countries where this question was asked see American policy as overly supportive of the Palestinians (it was not asked in sub-Saharan Africa).
America’s Middle East Policies Favor Favor Israel Palestinians Are (Vol) too much too much fair DK % % % % U.S. 27 8 34 31 Canada 43 4 18 34
France 62 5 31 3 Germany 57 3 13 27 Sweden 53 2 9 36 Britain 49 2 14 36 Spain 39 4 15 42 Italy 32 3 26 39
Palest. ter. 90 4 2 4 Israel 42 13 37 8
Jordan 91 1 3 5 Lebanon 89 2 7 2 Egypt 86 0 7 7 Kuwait 86 5 4 6 Morocco 81 2 3 14 Turkey 70 2 2 26
Indonesia 69 4 4 23 Malaysia 55 10 4 31 Bangladesh 55 21 13 11 S. Korea 47 3 14 35 Pakistan 38 17 8 36 China 34 12 13 41 India 32 8 28 33 Japan 26 3 14 57 See topline for results from Eastern Europe and Latin America. Question not asked in Sub-Saharan Africa.
24
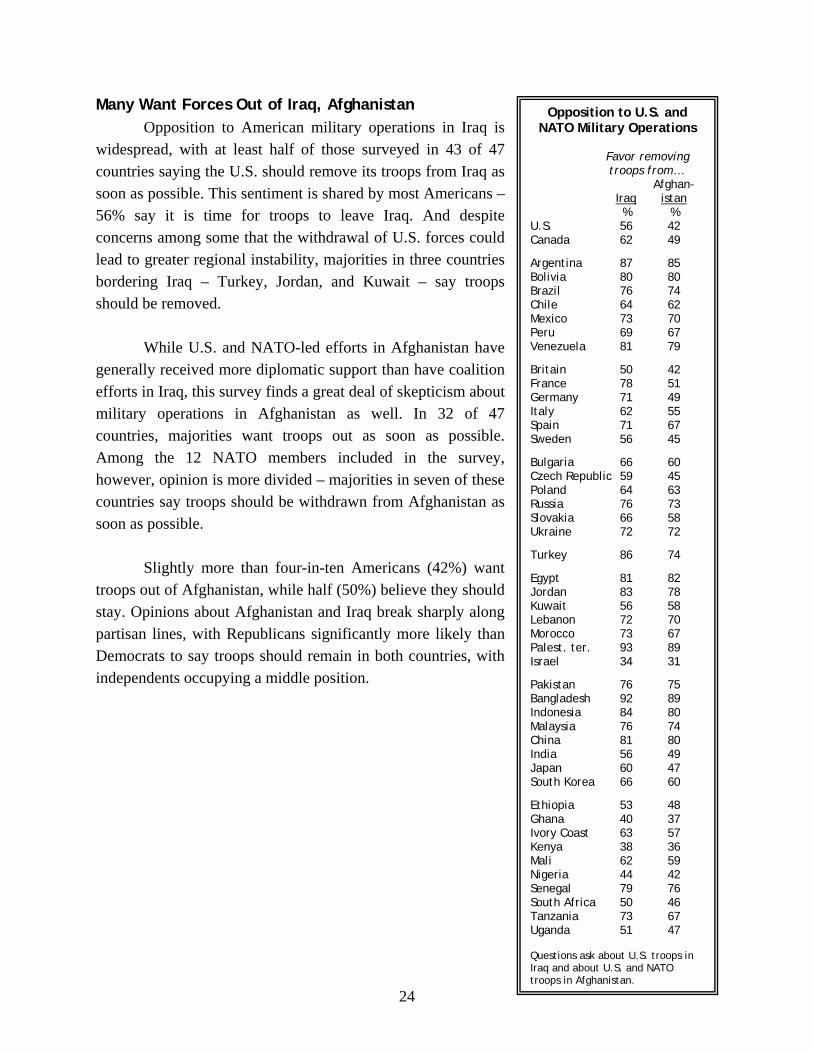
Many Want Forces Out of Iraq, Afghanistan Opposition to American military operations in Iraq is widespread, with at least half of those surveyed in 43 of 47 countries saying the U.S. should remove its troops from Iraq as soon as possible. This sentiment is shared by most Americans – 56% say it is time for troops to leave Iraq. And despite concerns among some that the withdrawal of U.S. forces could lead to greater regional instability, majorities in three countries bordering Iraq – Turkey, Jordan, and Kuwait – say troops should be removed. While U.S. and NATO-led efforts in Afghanistan have generally received more diplomatic support than have coalition efforts in Iraq, this survey finds a great deal of skepticism about military operations in Afghanistan as well. In 32 of 47 countries, majorities want troops out as soon as possible. Among the 12 NATO members included in the survey, however, opinion is more divided – majorities in seven of these countries say troops should be withdrawn from Afghanistan as soon as possible.
Slightly more than four-in-ten Americans (42%) want troops out of Afghanistan, while half (50%) believe they should stay. Opinions about Afghanistan and Iraq break sharply along partisan lines, with Republicans significantly more likely than Democrats to say troops should remain in both countries, with independents occupying a middle position.
Opposition to U.S. and NATO Military Operations
Favor removing troops from… Afghan- Iraq istan % % U.S. 56 42 Canada 62 49
Argentina 87 85 Bolivia 80 80 Brazil 76 74 Chile 64 62 Mexico 73 70 Peru 69 67 Venezuela 81 79
Britain 50 42 France 78 51 Germany 71 49 Italy 62 55 Spain 71 67 Sweden 56 45
Bulgaria 66 60 Czech Republic 59 45 Poland 64 63 Russia 76 73 Slovakia 66 58 Ukraine 72 72
Turkey 86 74
Egypt 81 82 Jordan 83 78 Kuwait 56 58 Lebanon 72 70 Morocco 73 67 Palest. ter. 93 89 Israel 34 31
Pakistan 76 75 Bangladesh 92 89 Indonesia 84 80 Malaysia 76 74 China 81 80 India 56 49 Japan 60 47 South Korea 66 60
Ethiopia 53 48 Ghana 40 37 Ivory Coast 63 57 Kenya 38 36 Mali 62 59 Nigeria 44 42 Senegal 79 76 South Africa 50 46 Tanzania 73 67 Uganda 51 47 Questions ask about U.S. troops in Iraq and about U.S. and NATO troops in Afghanistan.
25
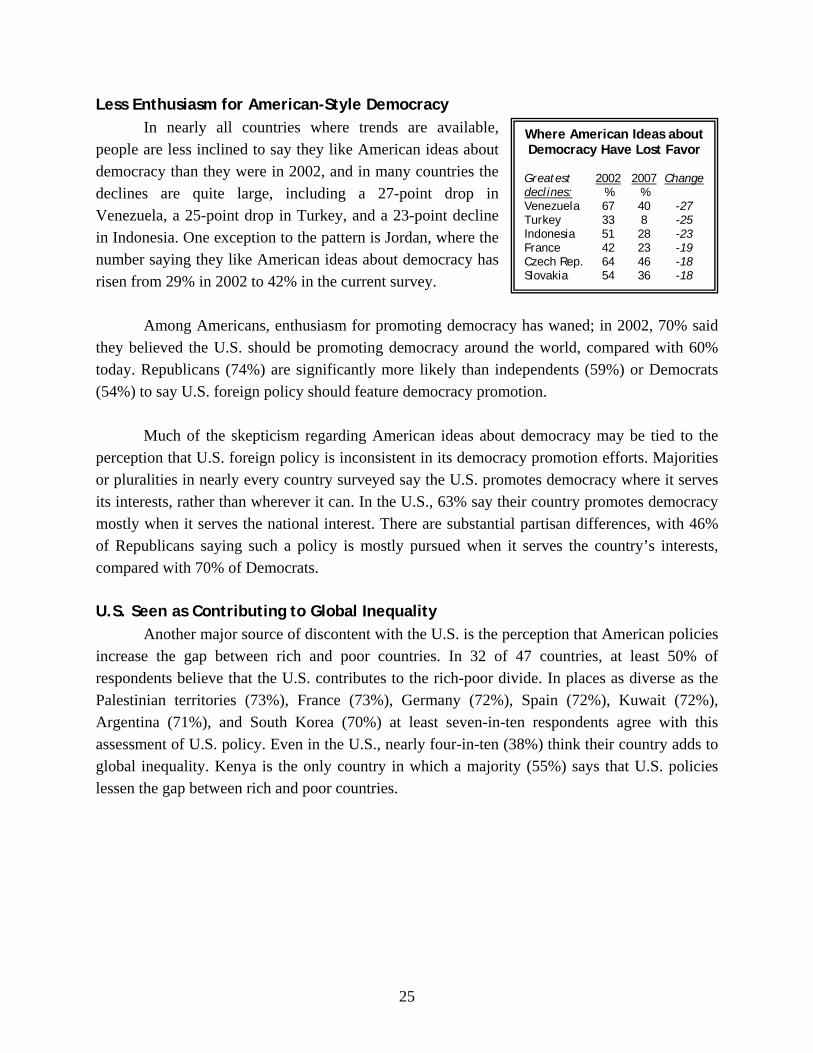
Less Enthusiasm for American-Style Democracy In nearly all countries where trends are available, people are less inclined to say they like American ideas about democracy than they were in 2002, and in many countries the declines are quite large, including a 27-point drop in Venezuela, a 25-point drop in Turkey, and a 23-point decline in Indonesia. One exception to the pattern is Jordan, where the number saying they like American ideas about democracy has risen from 29% in 2002 to 42% in the current survey.
Among Americans, enthusiasm for promoting democracy has waned; in 2002, 70% said they believed the U.S. should be promoting democracy around the world, compared with 60% today. Republicans (74%) are significantly more likely than independents (59%) or Democrats (54%) to say U.S. foreign policy should feature democracy promotion.
Much of the skepticism regarding American ideas about democracy may be tied to the
perception that U.S. foreign policy is inconsistent in its democracy promotion efforts. Majorities or pluralities in nearly every country surveyed say the U.S. promotes democracy where it serves its interests, rather than wherever it can. In the U.S., 63% say their country promotes democracy mostly when it serves the national interest. There are substantial partisan differences, with 46% of Republicans saying such a policy is mostly pursued when it serves the country’s interests, compared with 70% of Democrats. U.S. Seen as Contributing to Global Inequality
Another major source of discontent with the U.S. is the perception that American policies increase the gap between rich and poor countries. In 32 of 47 countries, at least 50% of respondents believe that the U.S. contributes to the rich-poor divide. In places as diverse as the Palestinian territories (73%), France (73%), Germany (72%), Spain (72%), Kuwait (72%), Argentina (71%), and South Korea (70%) at least seven-in-ten respondents agree with this assessment of U.S. policy. Even in the U.S., nearly four-in-ten (38%) think their country adds to global inequality. Kenya is the only country in which a majority (55%) says that U.S. policies lessen the gap between rich and poor countries.
Where American Ideas about Democracy Have Lost Favor
Greatest 2002 2007 Change declines: % % Venezuela 67 40 -27 Turkey 33 8 -25 Indonesia 51 28 -23 France 42 23 -19 Czech Rep. 64 46 -18 Slovakia 54 36 -18
26
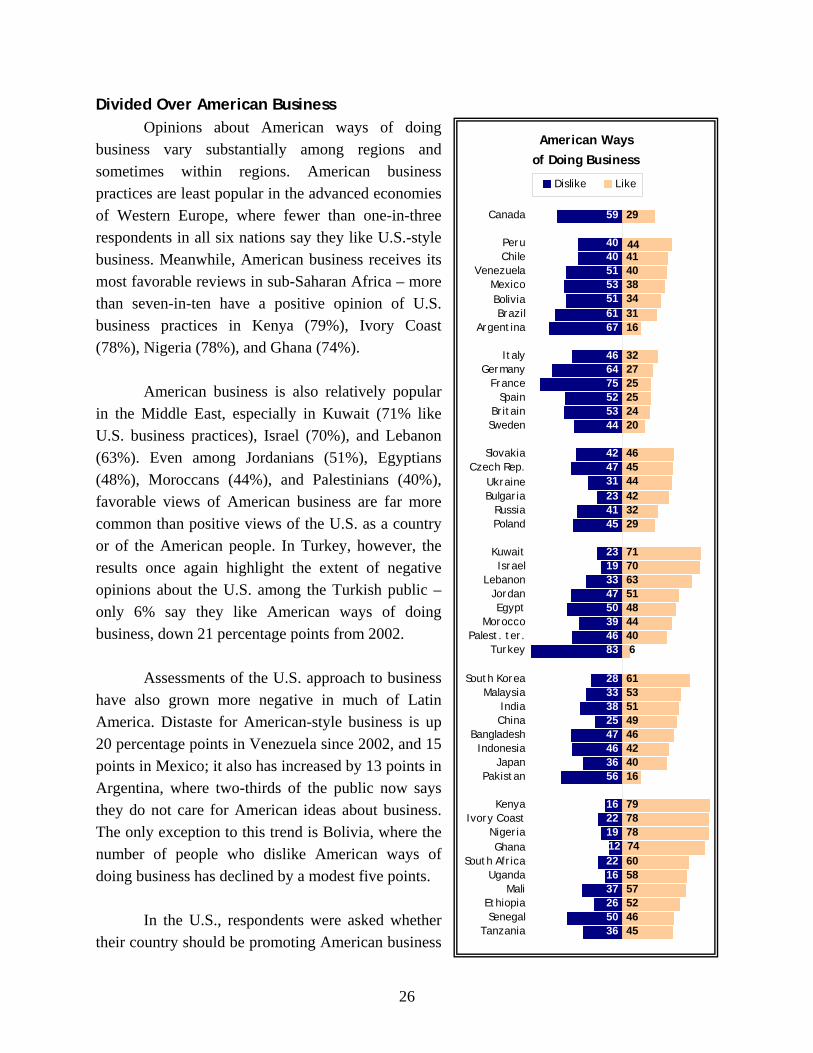
Divided Over American Business Opinions about American ways of doing
business vary substantially among regions and sometimes within regions. American business practices are least popular in the advanced economies of Western Europe, where fewer than one-in-three respondents in all six nations say they like U.S.-style business. Meanwhile, American business receives its most favorable reviews in sub-Saharan Africa – more than seven-in-ten have a positive opinion of U.S. business practices in Kenya (79%), Ivory Coast (78%), Nigeria (78%), and Ghana (74%).
American business is also relatively popular
in the Middle East, especially in Kuwait (71% like U.S. business practices), Israel (70%), and Lebanon (63%). Even among Jordanians (51%), Egyptians (48%), Moroccans (44%), and Palestinians (40%), favorable views of American business are far more common than positive views of the U.S. as a country or of the American people. In Turkey, however, the results once again highlight the extent of negative opinions about the U.S. among the Turkish public – only 6% say they like American ways of doing business, down 21 percentage points from 2002.
Assessments of the U.S. approach to business
have also grown more negative in much of Latin America. Distaste for American-style business is up 20 percentage points in Venezuela since 2002, and 15 points in Mexico; it also has increased by 13 points in Argentina, where two-thirds of the public now says they do not care for American ideas about business. The only exception to this trend is Bolivia, where the number of people who dislike American ways of doing business has declined by a modest five points.
In the U.S., respondents were asked whether their country should be promoting American business
American Waysof Doing Business
59
40405153516167
466475525344
424731234145
2319334750394683
2833382547463656
162219
221637265036
29
414038343116
322725252420
4544423229
71706351484440
6153514946424016
797878
605857524645
12
6
46
44
74
Canada
PeruChile
VenezuelaMexicoBoliviaBrazil
Argentina
ItalyGermany
FranceSpain
BritainSweden
SlovakiaCzech Rep.
UkraineBulgaria
RussiaPoland
KuwaitIsrael
LebanonJordanEgypt
MoroccoPalest. ter.
Turkey
South KoreaMalaysia
IndiaChina
BangladeshIndonesia
JapanPakistan
KenyaIvory Coast
NigeriaGhana
South AfricaUganda
MaliEthiopiaSenegal
Tanzania
Dislike Like
27
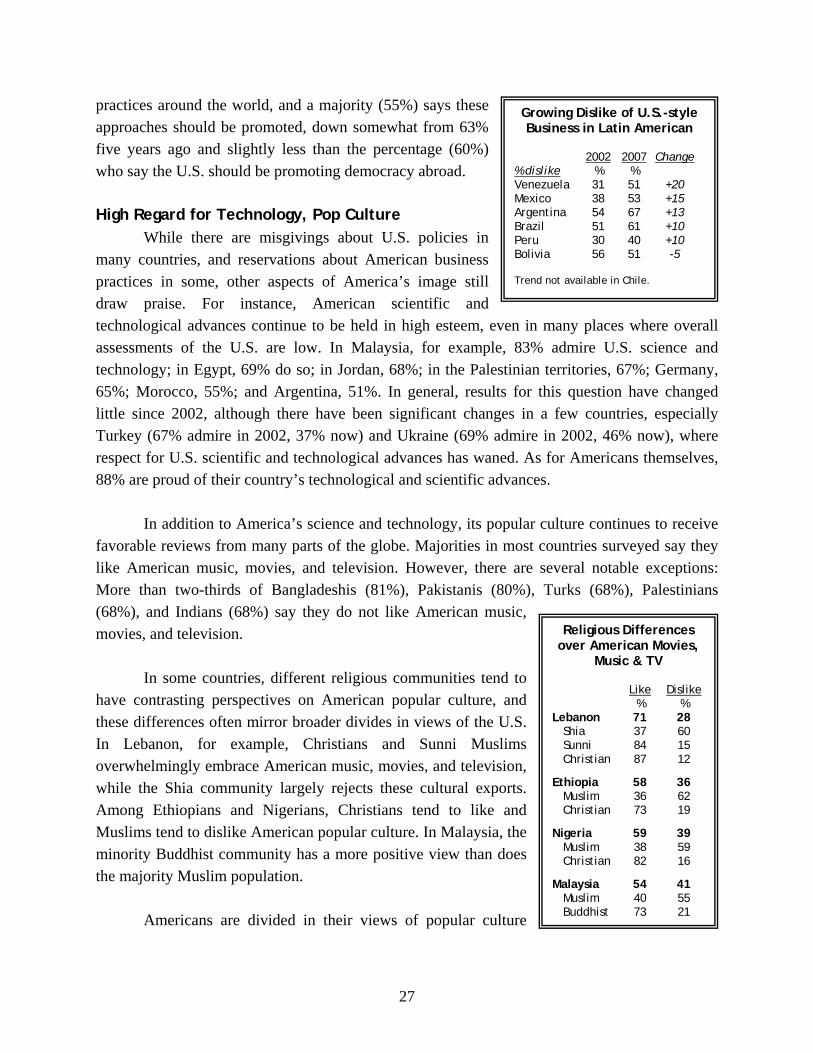
practices around the world, and a majority (55%) says these approaches should be promoted, down somewhat from 63% five years ago and slightly less than the percentage (60%) who say the U.S. should be promoting democracy abroad. High Regard for Technology, Pop Culture While there are misgivings about U.S. policies in many countries, and reservations about American business practices in some, other aspects of America’s image still draw praise. For instance, American scientific and technological advances continue to be held in high esteem, even in many places where overall assessments of the U.S. are low. In Malaysia, for example, 83% admire U.S. science and technology; in Egypt, 69% do so; in Jordan, 68%; in the Palestinian territories, 67%; Germany, 65%; Morocco, 55%; and Argentina, 51%. In general, results for this question have changed little since 2002, although there have been significant changes in a few countries, especially Turkey (67% admire in 2002, 37% now) and Ukraine (69% admire in 2002, 46% now), where respect for U.S. scientific and technological advances has waned. As for Americans themselves, 88% are proud of their country’s technological and scientific advances. In addition to America’s science and technology, its popular culture continues to receive favorable reviews from many parts of the globe. Majorities in most countries surveyed say they like American music, movies, and television. However, there are several notable exceptions: More than two-thirds of Bangladeshis (81%), Pakistanis (80%), Turks (68%), Palestinians (68%), and Indians (68%) say they do not like American music, movies, and television. In some countries, different religious communities tend to have contrasting perspectives on American popular culture, and these differences often mirror broader divides in views of the U.S. In Lebanon, for example, Christians and Sunni Muslims overwhelmingly embrace American music, movies, and television, while the Shia community largely rejects these cultural exports. Among Ethiopians and Nigerians, Christians tend to like and Muslims tend to dislike American popular culture. In Malaysia, the minority Buddhist community has a more positive view than does the majority Muslim population. Americans are divided in their views of popular culture
Religious Differences over American Movies,
Music & TV Like Dislike % % Lebanon 71 28 Shia 37 60 Sunni 84 15 Christian 87 12
Ethiopia 58 36 Muslim 36 62 Christian 73 19
Nigeria 59 39 Muslim 38 59 Christian 82 16
Malaysia 54 41 Muslim 40 55 Buddhist 73 21
Growing Dislike of U.S.-style Business in Latin American
2002 2007 Change % dislike % % Venezuela 31 51 +20 Mexico 38 53 +15 Argentina 54 67 +13 Brazil 51 61 +10 Peru 30 40 +10 Bolivia 56 51 -5 Trend not available in Chile.
28
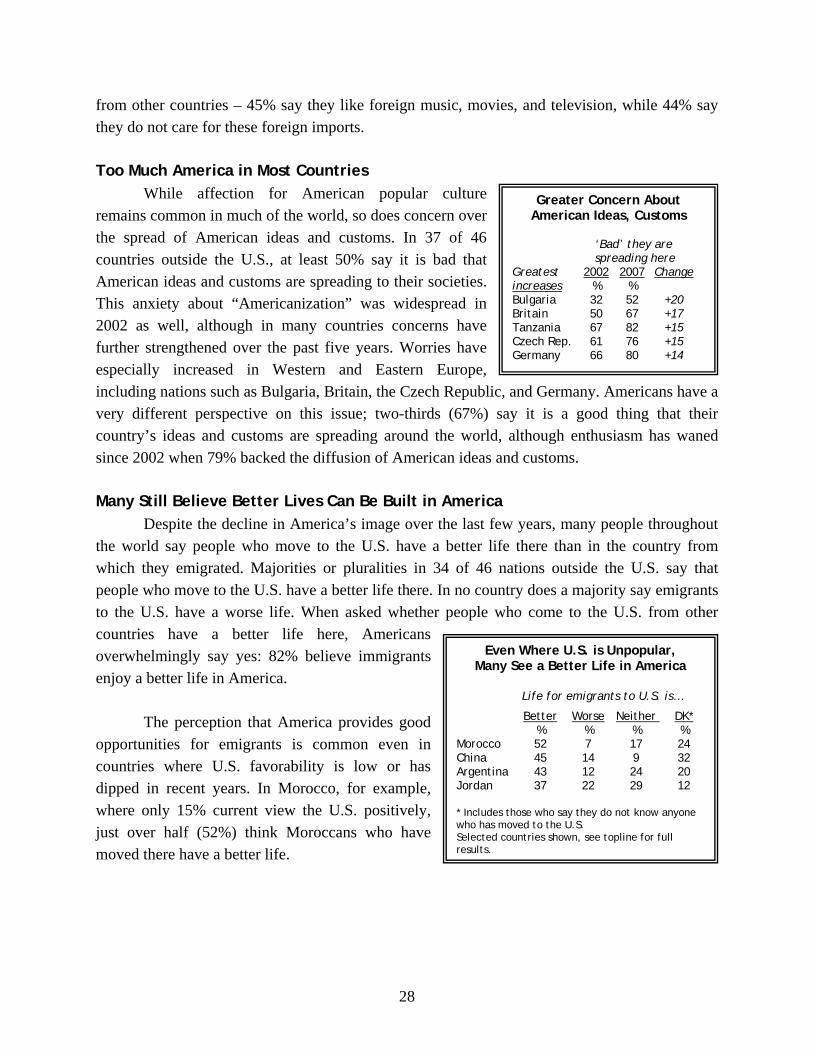
from other countries – 45% say they like foreign music, movies, and television, while 44% say they do not care for these foreign imports. Too Much America in Most Countries While affection for American popular culture remains common in much of the world, so does concern over the spread of American ideas and customs. In 37 of 46 countries outside the U.S., at least 50% say it is bad that American ideas and customs are spreading to their societies. This anxiety about “Americanization” was widespread in 2002 as well, although in many countries concerns have further strengthened over the past five years. Worries have especially increased in Western and Eastern Europe, including nations such as Bulgaria, Britain, the Czech Republic, and Germany. Americans have a very different perspective on this issue; two-thirds (67%) say it is a good thing that their country’s ideas and customs are spreading around the world, although enthusiasm has waned since 2002 when 79% backed the diffusion of American ideas and customs. Many Still Believe Better Lives Can Be Built in America
Despite the decline in America’s image over the last few years, many people throughout the world say people who move to the U.S. have a better life there than in the country from which they emigrated. Majorities or pluralities in 34 of 46 nations outside the U.S. say that people who move to the U.S. have a better life there. In no country does a majority say emigrants to the U.S. have a worse life. When asked whether people who come to the U.S. from other countries have a better life here, Americans overwhelmingly say yes: 82% believe immigrants enjoy a better life in America.
The perception that America provides good
opportunities for emigrants is common even in countries where U.S. favorability is low or has dipped in recent years. In Morocco, for example, where only 15% current view the U.S. positively, just over half (52%) think Moroccans who have moved there have a better life.
Greater Concern About American Ideas, Customs
‘Bad’ they are spreading here Greatest 2002 2007 Change increases % % Bulgaria 32 52 +20 Britain 50 67 +17 Tanzania 67 82 +15 Czech Rep. 61 76 +15 Germany 66 80 +14
Even Where U.S. is Unpopular, Many See a Better Life in America
Life for emigrants to U.S. is…
Better Worse Neither DK* % % % % Morocco 52 7 17 24 China 45 14 9 32 Argentina 43 12 24 20 Jordan 37 22 29 12 * Includes those who say they do not know anyone who has moved to the U.S. Selected countries shown, see topline for full results.
29
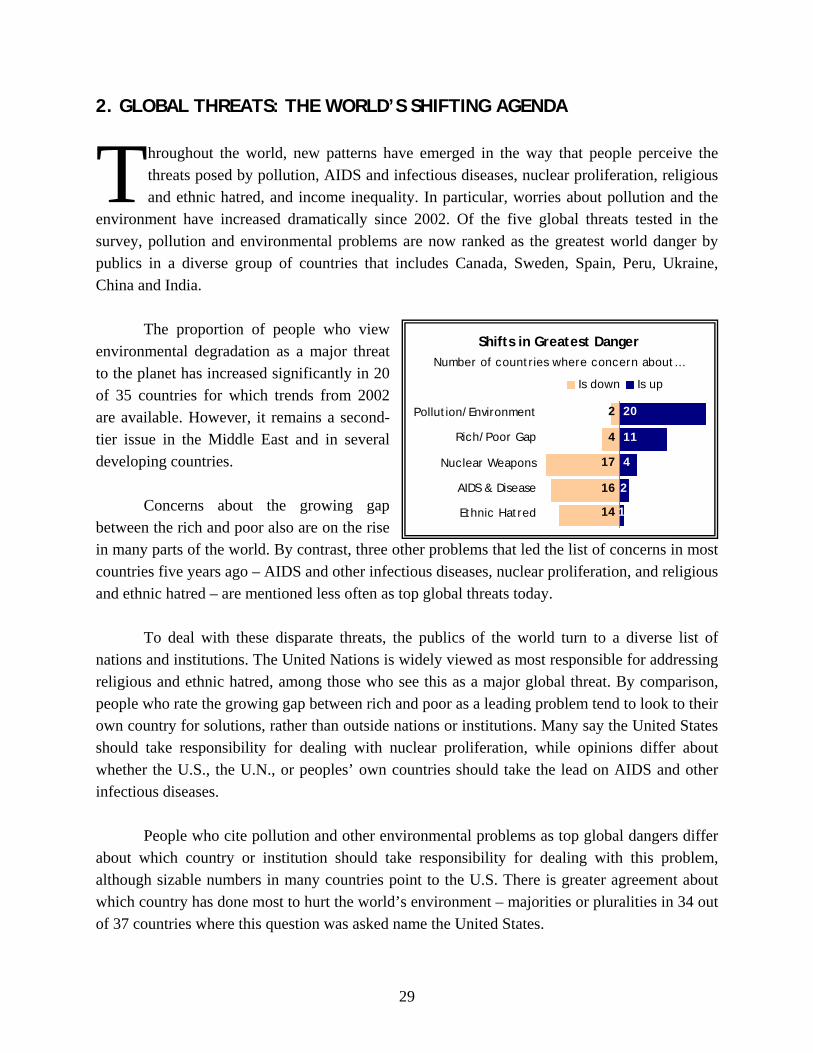
2. GLOBAL THREATS: THE WORLD’S SHIFTING AGENDA hroughout the world, new patterns have emerged in the way that people perceive the threats posed by pollution, AIDS and infectious diseases, nuclear proliferation, religious and ethnic hatred, and income inequality. In particular, worries about pollution and the
environment have increased dramatically since 2002. Of the five global threats tested in the survey, pollution and environmental problems are now ranked as the greatest world danger by publics in a diverse group of countries that includes Canada, Sweden, Spain, Peru, Ukraine, China and India.
The proportion of people who view
environmental degradation as a major threat to the planet has increased significantly in 20 of 35 countries for which trends from 2002 are available. However, it remains a second-tier issue in the Middle East and in several developing countries.
Concerns about the growing gap
between the rich and poor also are on the rise in many parts of the world. By contrast, three other problems that led the list of concerns in most countries five years ago – AIDS and other infectious diseases, nuclear proliferation, and religious and ethnic hatred – are mentioned less often as top global threats today.
To deal with these disparate threats, the publics of the world turn to a diverse list of
nations and institutions. The United Nations is widely viewed as most responsible for addressing religious and ethnic hatred, among those who see this as a major global threat. By comparison, people who rate the growing gap between rich and poor as a leading problem tend to look to their own country for solutions, rather than outside nations or institutions. Many say the United States should take responsibility for dealing with nuclear proliferation, while opinions differ about whether the U.S., the U.N., or peoples’ own countries should take the lead on AIDS and other infectious diseases.
People who cite pollution and other environmental problems as top global dangers differ
about which country or institution should take responsibility for dealing with this problem, although sizable numbers in many countries point to the U.S. There is greater agreement about which country has done most to hurt the world’s environment – majorities or pluralities in 34 out of 37 countries where this question was asked name the United States.
T
Shifts in Greatest Danger
2
4
17
16
14
20
11
4
2
1
Pollution/Environment
Rich/Poor Gap
Nuclear Weapons
AIDS & Disease
Ethnic Hatred
Is down Is up
Number of countries where concern about…
30
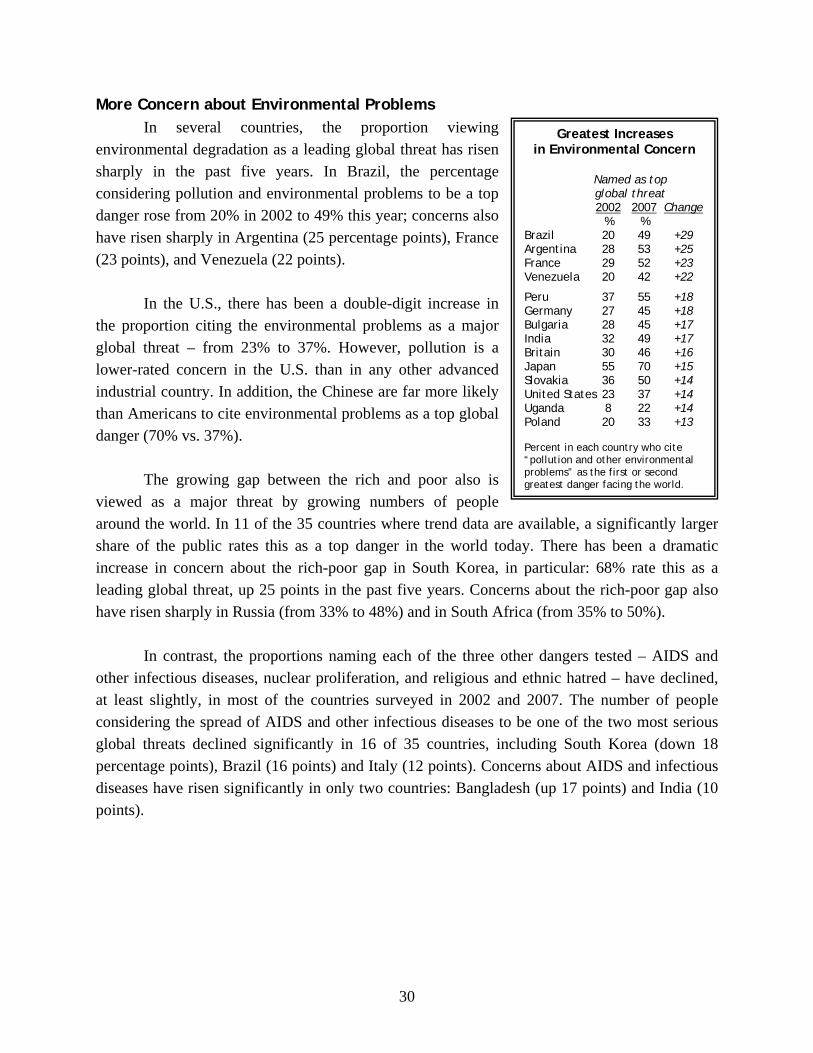
More Concern about Environmental Problems In several countries, the proportion viewing
environmental degradation as a leading global threat has risen sharply in the past five years. In Brazil, the percentage considering pollution and environmental problems to be a top danger rose from 20% in 2002 to 49% this year; concerns also have risen sharply in Argentina (25 percentage points), France (23 points), and Venezuela (22 points).
In the U.S., there has been a double-digit increase in
the proportion citing the environmental problems as a major global threat – from 23% to 37%. However, pollution is a lower-rated concern in the U.S. than in any other advanced industrial country. In addition, the Chinese are far more likely than Americans to cite environmental problems as a top global danger (70% vs. 37%).
The growing gap between the rich and poor also is
viewed as a major threat by growing numbers of people around the world. In 11 of the 35 countries where trend data are available, a significantly larger share of the public rates this as a top danger in the world today. There has been a dramatic increase in concern about the rich-poor gap in South Korea, in particular: 68% rate this as a leading global threat, up 25 points in the past five years. Concerns about the rich-poor gap also have risen sharply in Russia (from 33% to 48%) and in South Africa (from 35% to 50%).
In contrast, the proportions naming each of the three other dangers tested – AIDS and
other infectious diseases, nuclear proliferation, and religious and ethnic hatred – have declined, at least slightly, in most of the countries surveyed in 2002 and 2007. The number of people considering the spread of AIDS and other infectious diseases to be one of the two most serious global threats declined significantly in 16 of 35 countries, including South Korea (down 18 percentage points), Brazil (16 points) and Italy (12 points). Concerns about AIDS and infectious diseases have risen significantly in only two countries: Bangladesh (up 17 points) and India (10 points).
Greatest Increases in Environmental Concern
Named as top global threat
2002 2007 Change % % Brazil 20 49 +29 Argentina 28 53 +25 France 29 52 +23 Venezuela 20 42 +22
Peru 37 55 +18 Germany 27 45 +18 Bulgaria 28 45 +17 India 32 49 +17 Britain 30 46 +16 Japan 55 70 +15 Slovakia 36 50 +14 United States 23 37 +14 Uganda 8 22 +14 Poland 20 33 +13 Percent in each country who cite “pollution and other environmental problems” as the first or second greatest danger facing the world.
31
Even in Africa, where AIDS and disease remains the dominant concern, the proportions naming it as a top global threat dropped significantly in Ghana (by 11 percentage points), Uganda (10 points) and Kenya (seven points). Despite the declines, AIDS still is viewed as a global threat by solid majorities in every African country except Mali, including each of the three countries (Ghana, Uganda and Kenya) that registered the largest declines in concern.
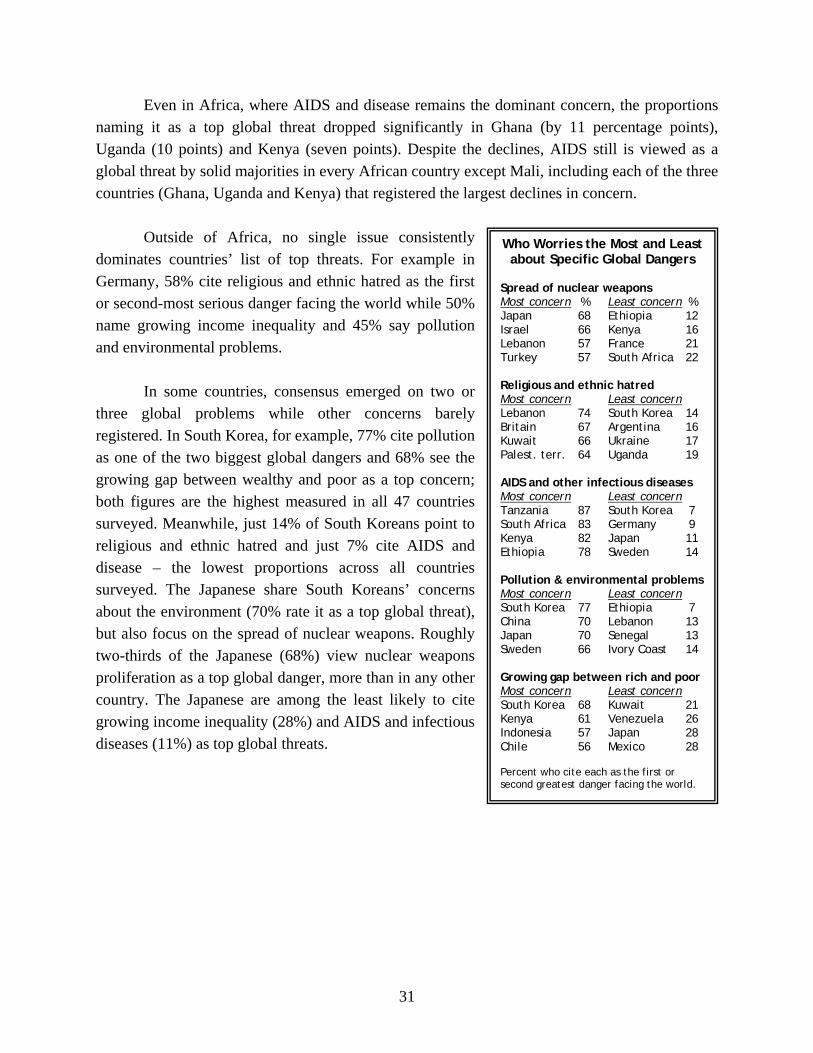
Outside of Africa, no single issue consistently
dominates countries’ list of top threats. For example in Germany, 58% cite religious and ethnic hatred as the first or second-most serious danger facing the world while 50% name growing income inequality and 45% say pollution and environmental problems.
In some countries, consensus emerged on two or
three global problems while other concerns barely registered. In South Korea, for example, 77% cite pollution as one of the two biggest global dangers and 68% see the growing gap between wealthy and poor as a top concern; both figures are the highest measured in all 47 countries surveyed. Meanwhile, just 14% of South Koreans point to religious and ethnic hatred and just 7% cite AIDS and disease – the lowest proportions across all countries surveyed. The Japanese share South Koreans’ concerns about the environment (70% rate it as a top global threat), but also focus on the spread of nuclear weapons. Roughly two-thirds of the Japanese (68%) view nuclear weapons proliferation as a top global danger, more than in any other country. The Japanese are among the least likely to cite growing income inequality (28%) and AIDS and infectious diseases (11%) as top global threats.
Who Worries the Most and Least about Specific Global Dangers
Spread of nuclear weapons Most concern % Least concern % Japan 68 Ethiopia 12 Israel 66 Kenya 16 Lebanon 57 France 21 Turkey 57 South Africa 22 Religious and ethnic hatred Most concern Least concern Lebanon 74 South Korea 14 Britain 67 Argentina 16 Kuwait 66 Ukraine 17 Palest. terr. 64 Uganda 19 AIDS and other infectious diseases Most concern Least concern Tanzania 87 South Korea 7 South Africa 83 Germany 9 Kenya 82 Japan 11 Ethiopia 78 Sweden 14 Pollution & environmental problems Most concern Least concern South Korea 77 Ethiopia 7 China 70 Lebanon 13 Japan 70 Senegal 13 Sweden 66 Ivory Coast 14 Growing gap between rich and poor Most concern Least concern South Korea 68 Kuwait 21 Kenya 61 Venezuela 26 Indonesia 57 Japan 28 Chile 56 Mexico 28 Percent who cite each as the first or second greatest danger facing the world.
32
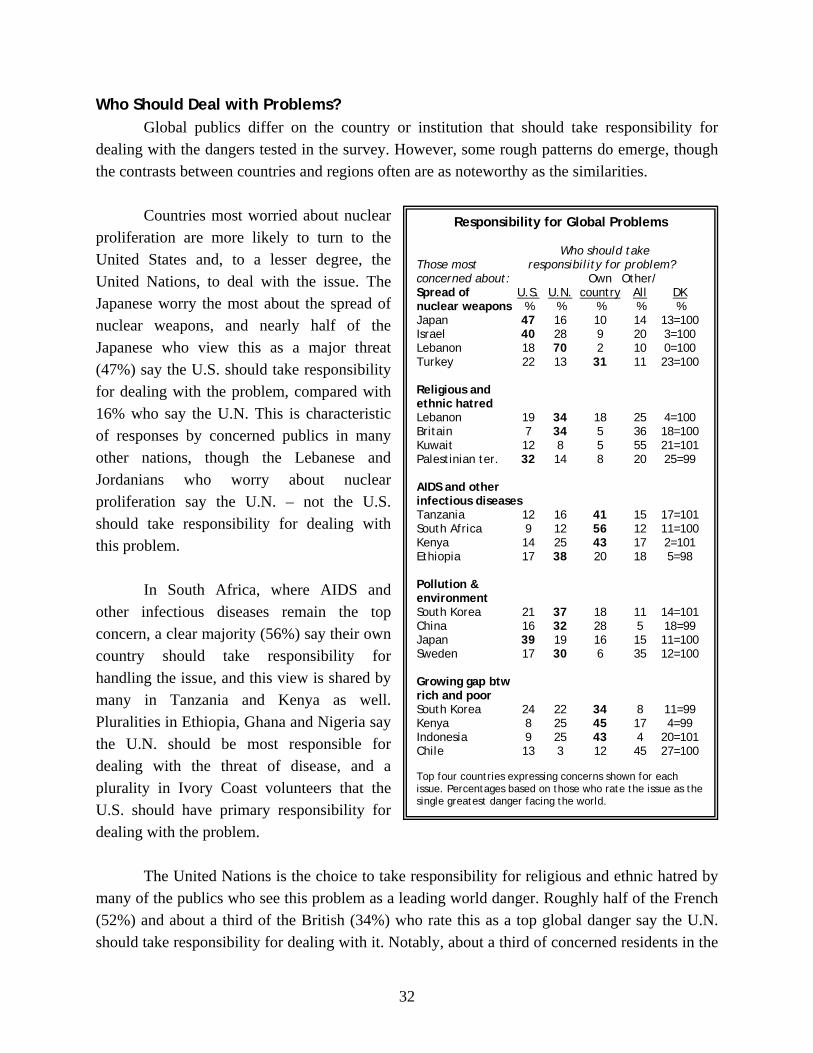
Who Should Deal with Problems? Global publics differ on the country or institution that should take responsibility for
dealing with the dangers tested in the survey. However, some rough patterns do emerge, though the contrasts between countries and regions often are as noteworthy as the similarities.
Countries most worried about nuclear
proliferation are more likely to turn to the United States and, to a lesser degree, the United Nations, to deal with the issue. The Japanese worry the most about the spread of nuclear weapons, and nearly half of the Japanese who view this as a major threat (47%) say the U.S. should take responsibility for dealing with the problem, compared with 16% who say the U.N. This is characteristic of responses by concerned publics in many other nations, though the Lebanese and Jordanians who worry about nuclear proliferation say the U.N. – not the U.S. should take responsibility for dealing with this problem.
In South Africa, where AIDS and
other infectious diseases remain the top concern, a clear majority (56%) say their own country should take responsibility for handling the issue, and this view is shared by many in Tanzania and Kenya as well. Pluralities in Ethiopia, Ghana and Nigeria say the U.N. should be most responsible for dealing with the threat of disease, and a plurality in Ivory Coast volunteers that the U.S. should have primary responsibility for dealing with the problem.
The United Nations is the choice to take responsibility for religious and ethnic hatred by
many of the publics who see this problem as a leading world danger. Roughly half of the French (52%) and about a third of the British (34%) who rate this as a top global danger say the U.N. should take responsibility for dealing with it. Notably, about a third of concerned residents in the
Responsibility for Global Problems Who should take Those most responsibility for problem? concerned about: Own Other/ Spread of U.S. U.N. country All DK nuclear weapons % % % % % Japan 47 16 10 14 13=100 Israel 40 28 9 20 3=100 Lebanon 18 70 2 10 0=100 Turkey 22 13 31 11 23=100 Religious and ethnic hatred Lebanon 19 34 18 25 4=100 Britain 7 34 5 36 18=100 Kuwait 12 8 5 55 21=101 Palestinian ter. 32 14 8 20 25=99 AIDS and other infectious diseases Tanzania 12 16 41 15 17=101 South Africa 9 12 56 12 11=100 Kenya 14 25 43 17 2=101 Ethiopia 17 38 20 18 5=98 Pollution & environment South Korea 21 37 18 11 14=101 China 16 32 28 5 18=99 Japan 39 19 16 15 11=100 Sweden 17 30 6 35 12=100 Growing gap btw rich and poor South Korea 24 22 34 8 11=99 Kenya 8 25 45 17 4=99 Indonesia 9 25 43 4 20=101 Chile 13 3 12 45 27=100 Top four countries expressing concerns shown for each issue. Percentages based on those who rate the issue as the single greatest danger facing the world.
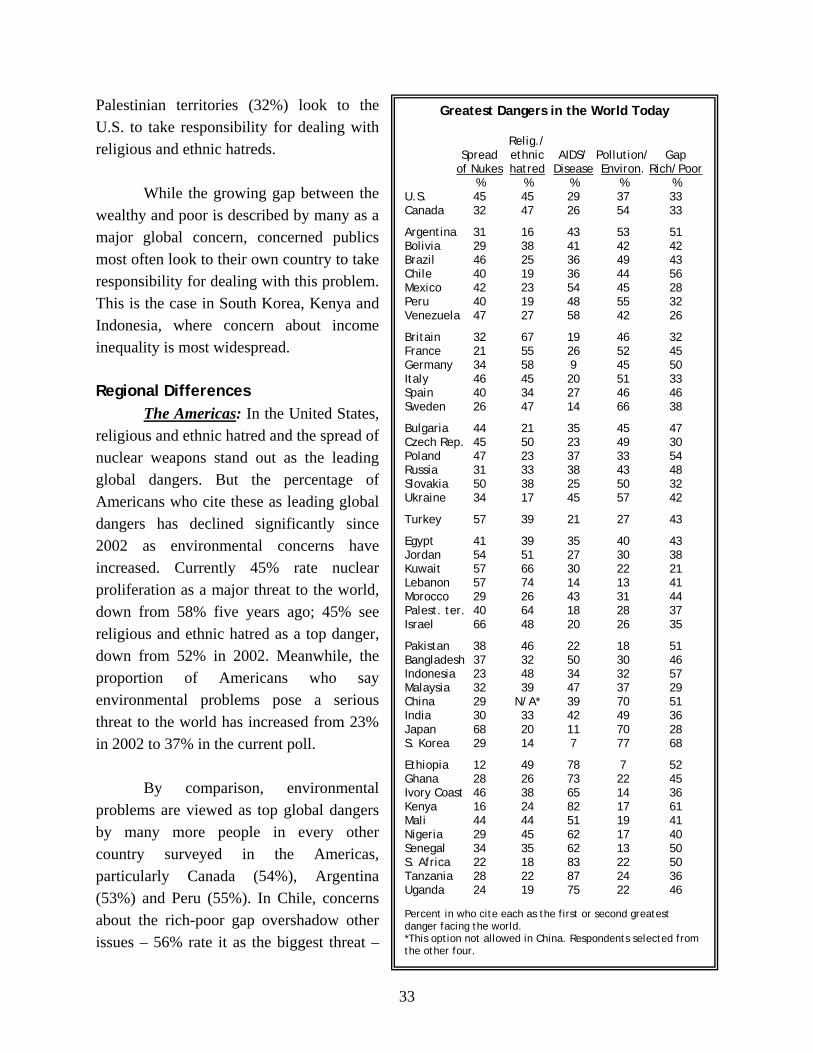
33
Palestinian territories (32%) look to the U.S. to take responsibility for dealing with religious and ethnic hatreds.
While the growing gap between the
wealthy and poor is described by many as a major global concern, concerned publics most often look to their own country to take responsibility for dealing with this problem. This is the case in South Korea, Kenya and Indonesia, where concern about income inequality is most widespread.
Regional Differences
The Americas: In the United States, religious and ethnic hatred and the spread of nuclear weapons stand out as the leading global dangers. But the percentage of Americans who cite these as leading global dangers has declined significantly since 2002 as environmental concerns have increased. Currently 45% rate nuclear proliferation as a major threat to the world, down from 58% five years ago; 45% see religious and ethnic hatred as a top danger, down from 52% in 2002. Meanwhile, the proportion of Americans who say environmental problems pose a serious threat to the world has increased from 23% in 2002 to 37% in the current poll.
By comparison, environmental
problems are viewed as top global dangers by many more people in every other country surveyed in the Americas, particularly Canada (54%), Argentina (53%) and Peru (55%). In Chile, concerns about the rich-poor gap overshadow other issues – 56% rate it as the biggest threat –
Greatest Dangers in the World Today Relig./ Spread ethnic AIDS/ Pollution/ Gap of Nukes hatred Disease Environ. Rich/Poor % % % % % U.S. 45 45 29 37 33 Canada 32 47 26 54 33
Argentina 31 16 43 53 51 Bolivia 29 38 41 42 42 Brazil 46 25 36 49 43 Chile 40 19 36 44 56 Mexico 42 23 54 45 28 Peru 40 19 48 55 32 Venezuela 47 27 58 42 26
Britain 32 67 19 46 32 France 21 55 26 52 45 Germany 34 58 9 45 50 Italy 46 45 20 51 33 Spain 40 34 27 46 46 Sweden 26 47 14 66 38
Bulgaria 44 21 35 45 47 Czech Rep. 45 50 23 49 30 Poland 47 23 37 33 54 Russia 31 33 38 43 48 Slovakia 50 38 25 50 32 Ukraine 34 17 45 57 42
Turkey 57 39 21 27 43
Egypt 41 39 35 40 43 Jordan 54 51 27 30 38 Kuwait 57 66 30 22 21 Lebanon 57 74 14 13 41 Morocco 29 26 43 31 44 Palest. ter. 40 64 18 28 37 Israel 66 48 20 26 35
Pakistan 38 46 22 18 51 Bangladesh 37 32 50 30 46 Indonesia 23 48 34 32 57 Malaysia 32 39 47 37 29 China 29 N/A* 39 70 51 India 30 33 42 49 36 Japan 68 20 11 70 28 S. Korea 29 14 7 77 68
Ethiopia 12 49 78 7 52 Ghana 28 26 73 22 45 Ivory Coast 46 38 65 14 36 Kenya 16 24 82 17 61 Mali 44 44 51 19 41 Nigeria 29 45 62 17 40 Senegal 34 35 62 13 50 S. Africa 22 18 83 22 50 Tanzania 28 22 87 24 36 Uganda 24 19 75 22 46 Percent in who cite each as the first or second greatest danger facing the world. *This option not allowed in China. Respondents selected from the other four.
34
while AIDS and infectious diseases are cited most frequently as global dangers in Venezuela (58%) and Mexico (54%).
Sub-Saharan Africa: AIDS and infectious diseases are named most frequently as global
threats by publics in each of the 10 countries surveyed in this region. The growing gap between the rich and the poor generally is the second most frequently named threat.
While the number citing AIDS and other infectious diseases as top global dangers is
somewhat diminished from 2002, these concerns remain widely prevalent throughout the region. As was true five years ago, overwhelming majorities see AIDS and infectious diseases as a top global threat in Tanzania (87%), South Africa (83%), Kenya (82%), Ethiopia (78%), Uganda (75%) and Ghana (73%). Somewhat fewer share this concern in Senegal (62%) and Mali (51%).
In seven of the 10 sub-Saharan African countries surveyed, the growing gap between rich
and poor is rated second most frequently – behind AIDS and infectious diseases – as a world threat. Majorities in Kenya (61%) and Ethiopia (52%), and half of those in Senegal, rate the widening rich-poor gap as a leading danger.
Middle East: Two problems dominate concerns across this region: the threat posed by the
spread of nuclear weapons, and religious and ethnic hatred. In nearly every Middle Eastern country surveyed, these issues are either the first or second most frequently mentioned threat facing the world. The proportion who name nuclear proliferation as a top global danger has increased in Jordan (by 21 percentage points), Turkey (11 points), and Lebanon (eight points) in the past five years (trends for other Middle Eastern countries are not available.)
In Lebanon, nearly three-in-four (74%) rate religious and ethnic hatred as a top threat,
while 57% say the same about nuclear weapons proliferation. These two issues also lead the list of concerns in Israel, where 66% cite the spread of nuclear weapons as the top world threat – more than any other country surveyed except Japan. Another 48% say religious and ethnic hatred is a top threat, the second most-frequently mentioned threat cited by Israelis among those tested in the survey.
In the neighboring Palestinian territories, the order of these two issues is reversed: Nearly
two-thirds (64%) rate religious and ethnic hatred as a top threat, while 40% cite nuclear proliferation.
Western Europe: Concern about the environment joins religious and ethnic hatred as the
top threats identified by publics in the six Western European countries included in the study. Concern about religious and ethnic hatred is highest in Great Britain (67% top global threat),
35
Germany (58%) and France (55%). In each of these countries, more people cite religious and ethnic hatred than the environment as a top global danger, though concern about the environment has risen sharply in all three countries.
But in Italy, Spain and Sweden, a different pattern emerges. Environmental worries
eclipse religious and ethnic animosities to lead the rankings of biggest threats to world stability. This is particularly the case in Sweden, where 66% cite the environment as the greatest global concern. Within the region, concerns about religious and ethnic violence rank the lowest in Spain at 34%. Concern about AIDS and infectious disease has dropped in all four countries where trends are available (Great Britain, France, Germany and Italy) and ranks as the lowest concern in five of the six Western European nations.
Asia: Environmental worries are especially acute in Japan, China and South Korea,
where 70% or more in each country name these concerns as a major danger. About half of Indians (49%) also cite environmental degradation as a top global threat, more than any other problem.
In contrast, less than a third of the publics in Indonesia, Bangladesh or Pakistan view
environmental problems as leading global threats. Instead, income inequality ranks as the most serious world threat in Pakistan (51%) and Indonesia (57%), while concern about AIDS and infectious disease has become the top concern in Bangladesh at 50%. Concern about disease is also up in India, and is the top concern of Malaysians, where 47% see it as a major global danger.
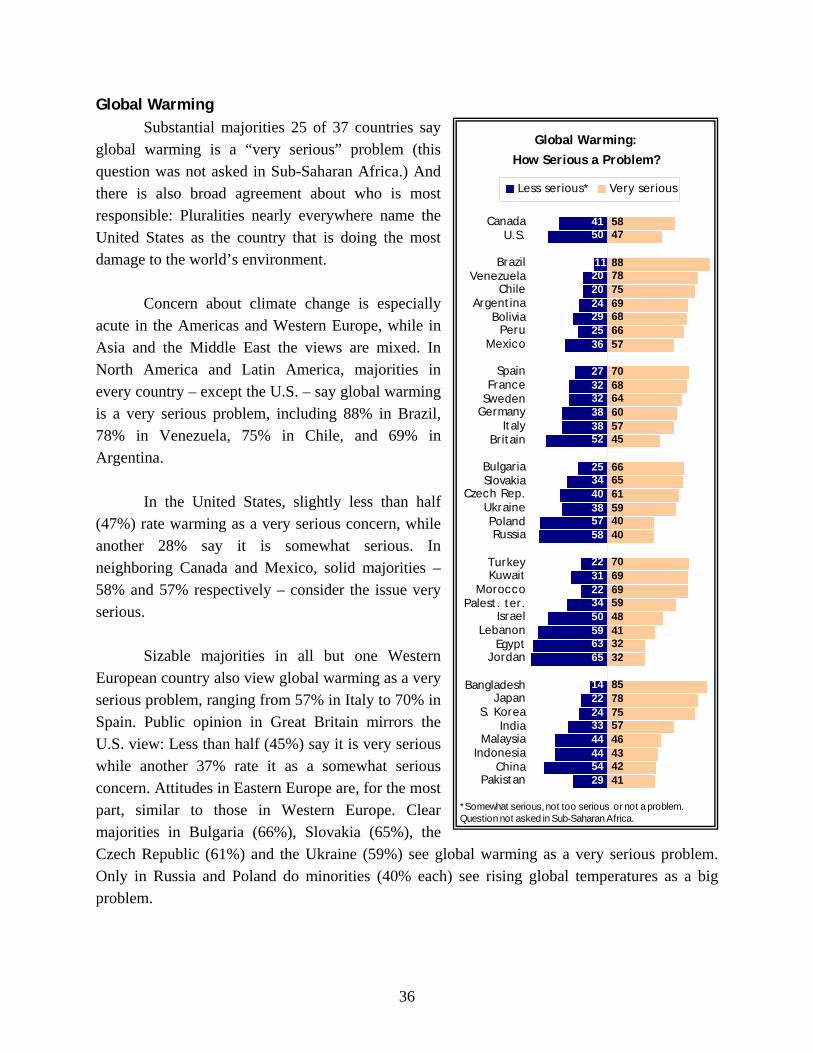
36
Global Warming Substantial majorities 25 of 37 countries say
global warming is a “very serious” problem (this question was not asked in Sub-Saharan Africa.) And there is also broad agreement about who is most responsible: Pluralities nearly everywhere name the United States as the country that is doing the most damage to the world’s environment.
Concern about climate change is especially
acute in the Americas and Western Europe, while in Asia and the Middle East the views are mixed. In North America and Latin America, majorities in every country – except the U.S. – say global warming is a very serious problem, including 88% in Brazil, 78% in Venezuela, 75% in Chile, and 69% in Argentina.
In the United States, slightly less than half
(47%) rate warming as a very serious concern, while another 28% say it is somewhat serious. In neighboring Canada and Mexico, solid majorities – 58% and 57% respectively – consider the issue very serious.
Sizable majorities in all but one Western
European country also view global warming as a very serious problem, ranging from 57% in Italy to 70% in Spain. Public opinion in Great Britain mirrors the U.S. view: Less than half (45%) say it is very serious while another 37% rate it as a somewhat serious concern. Attitudes in Eastern Europe are, for the most part, similar to those in Western Europe. Clear majorities in Bulgaria (66%), Slovakia (65%), the Czech Republic (61%) and the Ukraine (59%) see global warming as a very serious problem. Only in Russia and Poland do minorities (40% each) see rising global temperatures as a big problem.
Global Warming:How Serious a Problem?
4150
202024292536
273232383852
253440385758
2231223450596365
1422243344445429
47
75
66
6864605745
666561594040
7069695948413232
8578755746434241
11
58
70
57
8878
6968
CanadaU.S.
BrazilVenezuela
ChileArgentina
BoliviaPeru
Mexico
SpainFrance
SwedenGermany
ItalyBritain
BulgariaSlovakia
Czech Rep.UkrainePolandRussia
TurkeyKuwait
MoroccoPalest. ter.
IsraelLebanon
EgyptJordan
BangladeshJapan
S. KoreaIndia
MalaysiaIndonesia
ChinaPakistan
Less serious* Very serious
* Somewhat serious, not too serious or not a problem.Question not asked in Sub-Saharan Africa.
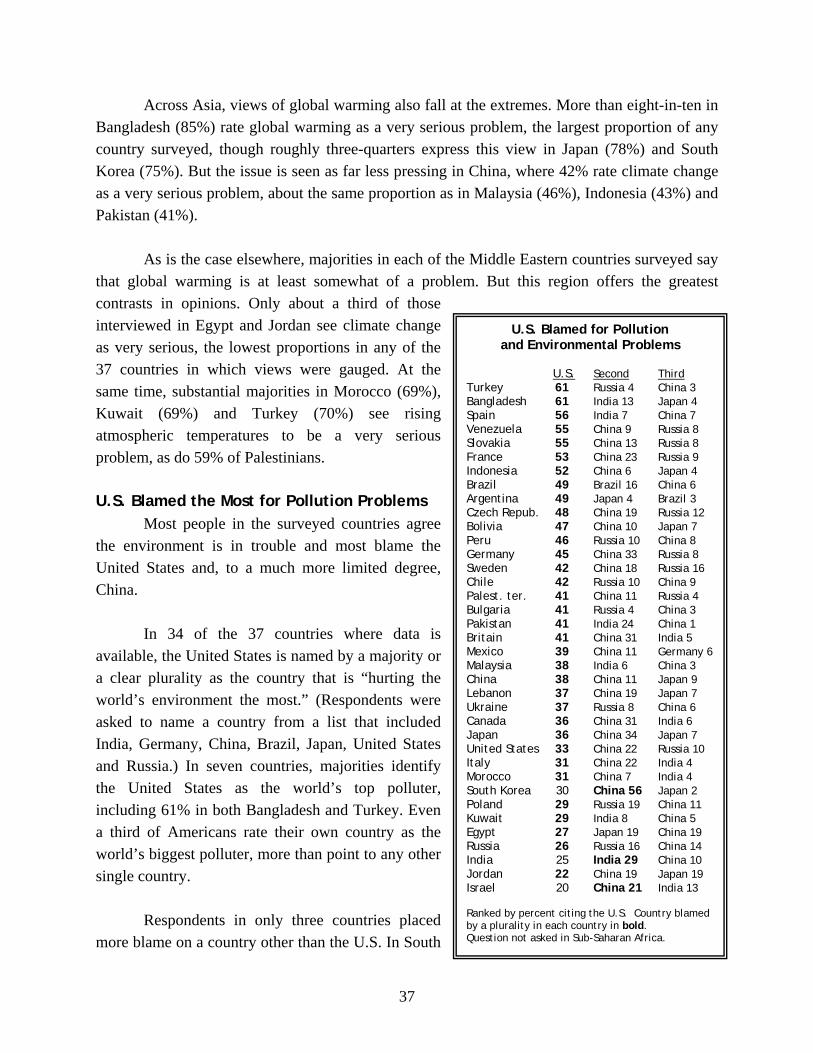
37
U.S. Blamed for Pollution and Environmental Problems
U.S. Second Third Turkey 61 Russia 4 China 3 Bangladesh 61 India 13 Japan 4 Spain 56 India 7 China 7 Venezuela 55 China 9 Russia 8 Slovakia 55 China 13 Russia 8 France 53 China 23 Russia 9 Indonesia 52 China 6 Japan 4 Brazil 49 Brazil 16 China 6 Argentina 49 Japan 4 Brazil 3 Czech Repub. 48 China 19 Russia 12 Bolivia 47 China 10 Japan 7 Peru 46 Russia 10 China 8 Germany 45 China 33 Russia 8 Sweden 42 China 18 Russia 16 Chile 42 Russia 10 China 9 Palest. ter. 41 China 11 Russia 4 Bulgaria 41 Russia 4 China 3 Pakistan 41 India 24 China 1 Britain 41 China 31 India 5 Mexico 39 China 11 Germany 6 Malaysia 38 India 6 China 3 China 38 China 11 Japan 9 Lebanon 37 China 19 Japan 7 Ukraine 37 Russia 8 China 6 Canada 36 China 31 India 6 Japan 36 China 34 Japan 7 United States 33 China 22 Russia 10 Italy 31 China 22 India 4 Morocco 31 China 7 India 4 South Korea 30 China 56 Japan 2 Poland 29 Russia 19 China 11 Kuwait 29 India 8 China 5 Egypt 27 Japan 19 China 19 Russia 26 Russia 16 China 14 India 25 India 29 China 10 Jordan 22 China 19 Japan 19 Israel 20 China 21 India 13 Ranked by percent citing the U.S. Country blamed by a plurality in each country in bold. Question not asked in Sub-Saharan Africa.
Across Asia, views of global warming also fall at the extremes. More than eight-in-ten in Bangladesh (85%) rate global warming as a very serious problem, the largest proportion of any country surveyed, though roughly three-quarters express this view in Japan (78%) and South Korea (75%). But the issue is seen as far less pressing in China, where 42% rate climate change as a very serious problem, about the same proportion as in Malaysia (46%), Indonesia (43%) and Pakistan (41%).
As is the case elsewhere, majorities in each of the Middle Eastern countries surveyed say
that global warming is at least somewhat of a problem. But this region offers the greatest contrasts in opinions. Only about a third of those interviewed in Egypt and Jordan see climate change as very serious, the lowest proportions in any of the 37 countries in which views were gauged. At the same time, substantial majorities in Morocco (69%), Kuwait (69%) and Turkey (70%) see rising atmospheric temperatures to be a very serious problem, as do 59% of Palestinians.
U.S. Blamed the Most for Pollution Problems
Most people in the surveyed countries agree the environment is in trouble and most blame the United States and, to a much more limited degree, China.
In 34 of the 37 countries where data is
available, the United States is named by a majority or a clear plurality as the country that is “hurting the world’s environment the most.” (Respondents were asked to name a country from a list that included India, Germany, China, Brazil, Japan, United States and Russia.) In seven countries, majorities identify the United States as the world’s top polluter, including 61% in both Bangladesh and Turkey. Even a third of Americans rate their own country as the world’s biggest polluter, more than point to any other single country.
Respondents in only three countries placed
more blame on a country other than the U.S. In South
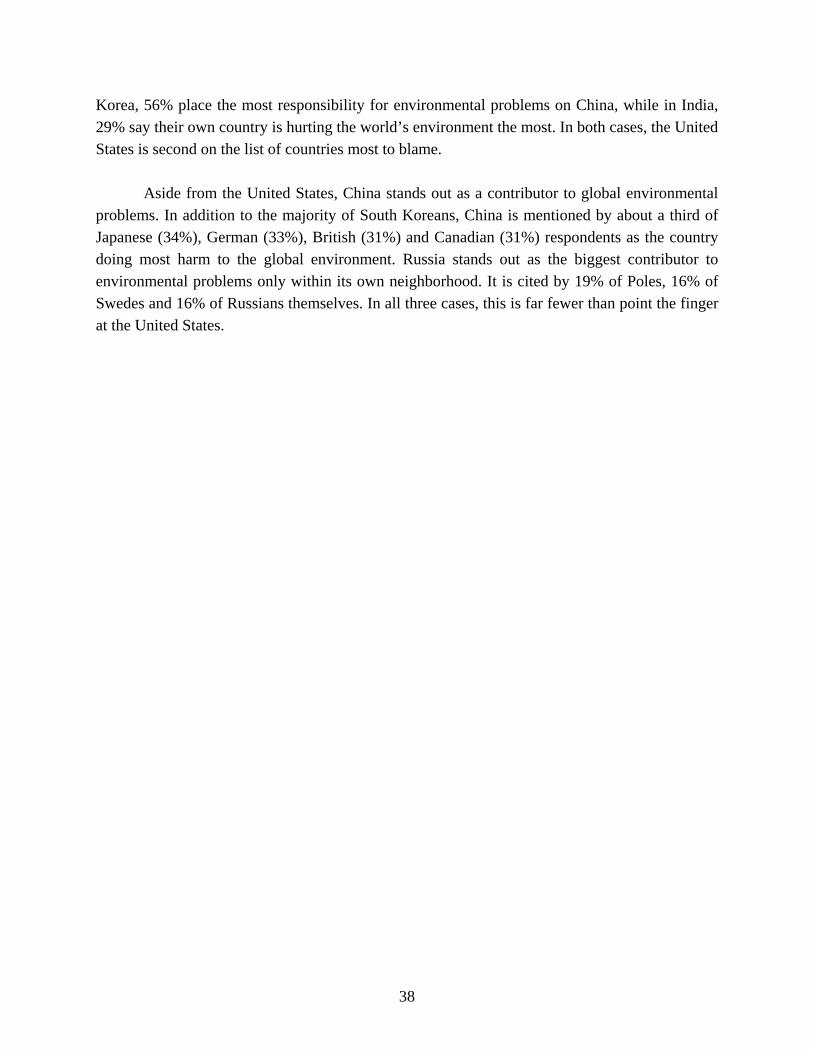
38
Korea, 56% place the most responsibility for environmental problems on China, while in India, 29% say their own country is hurting the world’s environment the most. In both cases, the United States is second on the list of countries most to blame.
Aside from the United States, China stands out as a contributor to global environmental
problems. In addition to the majority of South Koreans, China is mentioned by about a third of Japanese (34%), German (33%), British (31%) and Canadian (31%) respondents as the country doing most harm to the global environment. Russia stands out as the biggest contributor to environmental problems only within its own neighborhood. It is cited by 19% of Poles, 16% of Swedes and 16% of Russians themselves. In all three cases, this is far fewer than point the finger at the United States.
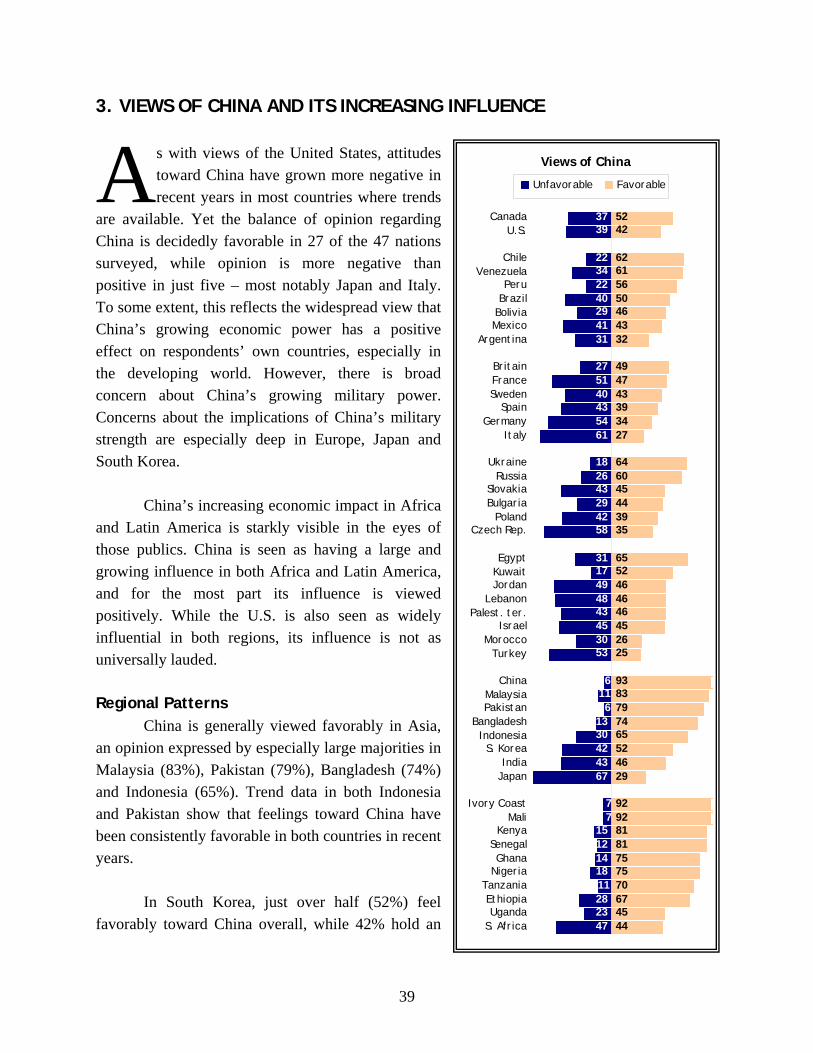
39
3. VIEWS OF CHINA AND ITS INCREASING INFLUENCE
s with views of the United States, attitudes toward China have grown more negative in recent years in most countries where trends
are available. Yet the balance of opinion regarding China is decidedly favorable in 27 of the 47 nations surveyed, while opinion is more negative than positive in just five – most notably Japan and Italy. To some extent, this reflects the widespread view that China’s growing economic power has a positive effect on respondents’ own countries, especially in the developing world. However, there is broad concern about China’s growing military power. Concerns about the implications of China’s military strength are especially deep in Europe, Japan and South Korea. China’s increasing economic impact in Africa and Latin America is starkly visible in the eyes of those publics. China is seen as having a large and growing influence in both Africa and Latin America, and for the most part its influence is viewed positively. While the U.S. is also seen as widely influential in both regions, its influence is not as universally lauded. Regional Patterns
China is generally viewed favorably in Asia, an opinion expressed by especially large majorities in Malaysia (83%), Pakistan (79%), Bangladesh (74%) and Indonesia (65%). Trend data in both Indonesia and Pakistan show that feelings toward China have been consistently favorable in both countries in recent years.
In South Korea, just over half (52%) feel
favorably toward China overall, while 42% hold an
A Views of China
3739
22342240294131
275140435461
26
294258
3117494843453053
1330424367
282347
5242
6261
50464332
4947433934
646045443935
655246464645
9383797465524629
9292
81757570674544
11
6
1214
715
7
18
43
18
611
56
2625
27
81
CanadaU.S.
Chile Venezuela
PeruBrazil
BoliviaMexico
Argentina
BritainFranceSweden
SpainGermany
Italy
UkraineRussia
SlovakiaBulgaria
PolandCzech Rep.
EgyptKuwaitJordan
LebanonPalest. ter.
IsraelMorocco
Turkey
ChinaMalaysiaPakistan
Bangladesh Indonesia
S. KoreaIndia
Japan
Ivory CoastMali
KenyaSenegalGhana
NigeriaTanzaniaEthiopiaUganda
S. Africa
Unfavorable Favorable
40
unfavorable opinion. These positive views exist despite serious concerns about China’s growing military and economic strength. However, South Korean opinions have shifted notably compared with 2002, when favorable views of China outnumbered unfavorable views by more than two-to-one (66% vs. 31%).
Feelings toward China have also deteriorated
among the publics of two other important neighbors – Japan and India. Current perceptions are decidedly negative today in Japan; two-thirds (67%) express an unfavorable view while just 29% feel favorably. This is in stark contrast to the 2002 Global Attitudes survey of Japan, when 55% gave a favorable rating to China and 42% felt unfavorably. Similarly, just two years ago Indians offered more positive than negative evaluations of China by nearly three-to-one (56% favorable, 20% unfavorable). But the share holding negative views has more than doubled to 43% today, while fewer than half (46%) offer a favorable rating.
Europeans also have become much more critical of China. Majorities today express unfavorable views in Italy (61%), the Czech Republic (58%), Germany (54%) and France (51%). Opinion is split in many other countries, and is favorable in Great Britain (49% favorable, 27% unfavorable) and Bulgaria (44% favorable, 29% unfavorable). In addition, China is viewed even more positively in Russia and Ukraine. In Ukraine, 64% have a favorable impression of China, while just 18% have a negative view. Opinion is only somewhat less positive in Russia (60% favorable, 26% unfavorable).
The trend is decidedly downward in many of the European countries that were surveyed in earlier Global Attitudes studies. Since 2005, favorable ratings for China have fallen 18 points in Spain, 16 points in Great Britain, 12 points in Germany, and 11 points in France. In the Americas, views of China are either favorable or mixed. The country is viewed most positively in Chile (62%), Venezuela (61%), Peru (56%), and Canada (52%). In the United States, the public is split evenly with 42% favorable and 39% unfavorable. Through much of Latin America, the balance of opinion toward the U.S. and China are roughly comparable – either both are viewed favorably or both unfavorably. Two standout exceptions are Mexico –
China Favorability Trends Where favorability: 2002 2005 2006 2007 Has fallen % % % % Russia 71 60 63 60 South Korea 66 -- -- 52 Britain -- 65 65 49 France -- 58 60 47 India -- 56 47 46 Lebanon -- 66 -- 46 Spain -- 57 45 39 Germany -- 46 56 34 Japan 55 -- 27 29 Turkey -- 40 33 25
Has risen Nigeria -- -- 59 75
Is stable or mixed China -- 88 94 93 Pakistan -- 79 69 79 Indonesia 68 73 62 65 Egypt -- -- 63 65 Canada -- 58 -- 52 Jordan -- 43 49 46 U.S. -- 43 52 42 Poland -- 37 -- 39 Countries with available trends shown.
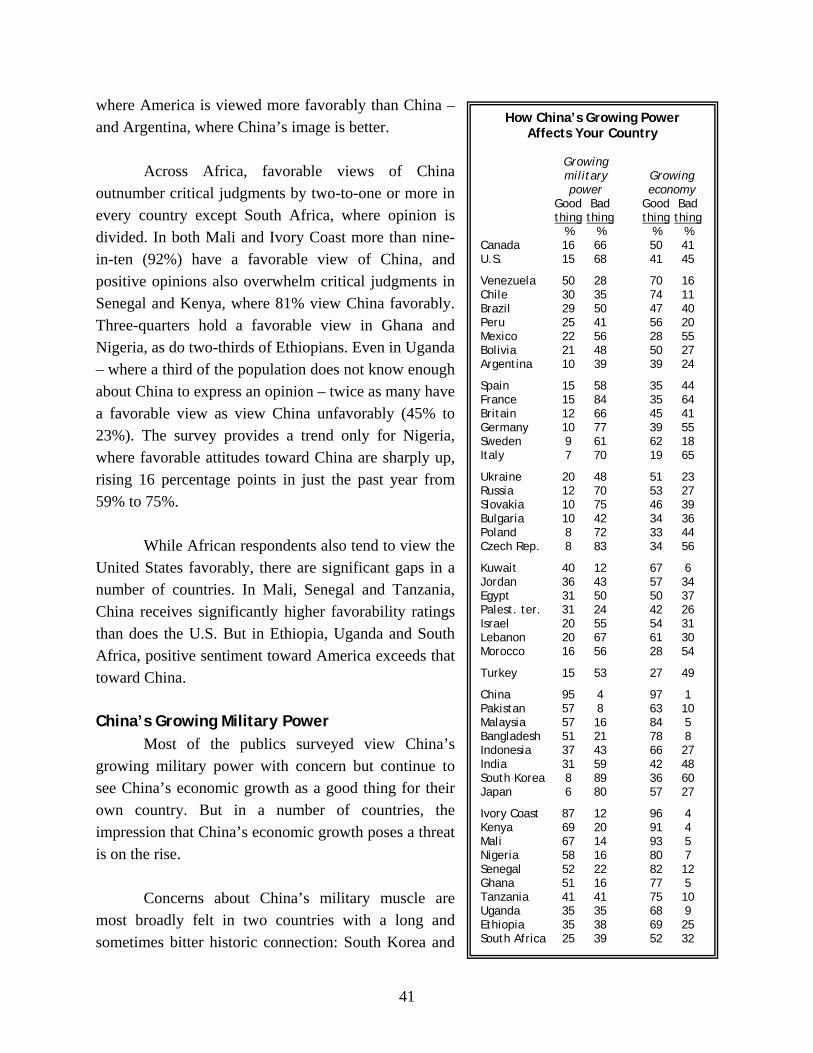
41
where America is viewed more favorably than China – and Argentina, where China’s image is better.
Across Africa, favorable views of China outnumber critical judgments by two-to-one or more in every country except South Africa, where opinion is divided. In both Mali and Ivory Coast more than nine-in-ten (92%) have a favorable view of China, and positive opinions also overwhelm critical judgments in Senegal and Kenya, where 81% view China favorably. Three-quarters hold a favorable view in Ghana and Nigeria, as do two-thirds of Ethiopians. Even in Uganda – where a third of the population does not know enough about China to express an opinion – twice as many have a favorable view as view China unfavorably (45% to 23%). The survey provides a trend only for Nigeria, where favorable attitudes toward China are sharply up, rising 16 percentage points in just the past year from 59% to 75%.
While African respondents also tend to view the
United States favorably, there are significant gaps in a number of countries. In Mali, Senegal and Tanzania, China receives significantly higher favorability ratings than does the U.S. But in Ethiopia, Uganda and South Africa, positive sentiment toward America exceeds that toward China. China’s Growing Military Power Most of the publics surveyed view China’s growing military power with concern but continue to see China’s economic growth as a good thing for their own country. But in a number of countries, the impression that China’s economic growth poses a threat is on the rise. Concerns about China’s military muscle are most broadly felt in two countries with a long and sometimes bitter historic connection: South Korea and
How China’s Growing Power Affects Your Country
Growing military Growing power economy Good Bad Good Bad thing thing thing thing % % % % Canada 16 66 50 41 U.S. 15 68 41 45
Venezuela 50 28 70 16 Chile 30 35 74 11 Brazil 29 50 47 40 Peru 25 41 56 20 Mexico 22 56 28 55 Bolivia 21 48 50 27 Argentina 10 39 39 24
Spain 15 58 35 44 France 15 84 35 64 Britain 12 66 45 41 Germany 10 77 39 55 Sweden 9 61 62 18 Italy 7 70 19 65
Ukraine 20 48 51 23 Russia 12 70 53 27 Slovakia 10 75 46 39 Bulgaria 10 42 34 36 Poland 8 72 33 44 Czech Rep. 8 83 34 56
Kuwait 40 12 67 6 Jordan 36 43 57 34 Egypt 31 50 50 37 Palest. ter. 31 24 42 26 Israel 20 55 54 31 Lebanon 20 67 61 30 Morocco 16 56 28 54
Turkey 15 53 27 49
China 95 4 97 1 Pakistan 57 8 63 10 Malaysia 57 16 84 5 Bangladesh 51 21 78 8 Indonesia 37 43 66 27 India 31 59 42 48 South Korea 8 89 36 60 Japan 6 80 57 27
Ivory Coast 87 12 96 4 Kenya 69 20 91 4 Mali 67 14 93 5 Nigeria 58 16 80 7 Senegal 52 22 82 12 Ghana 51 16 77 5 Tanzania 41 41 75 10 Uganda 35 35 68 9 Ethiopia 35 38 69 25 South Africa 25 39 52 32
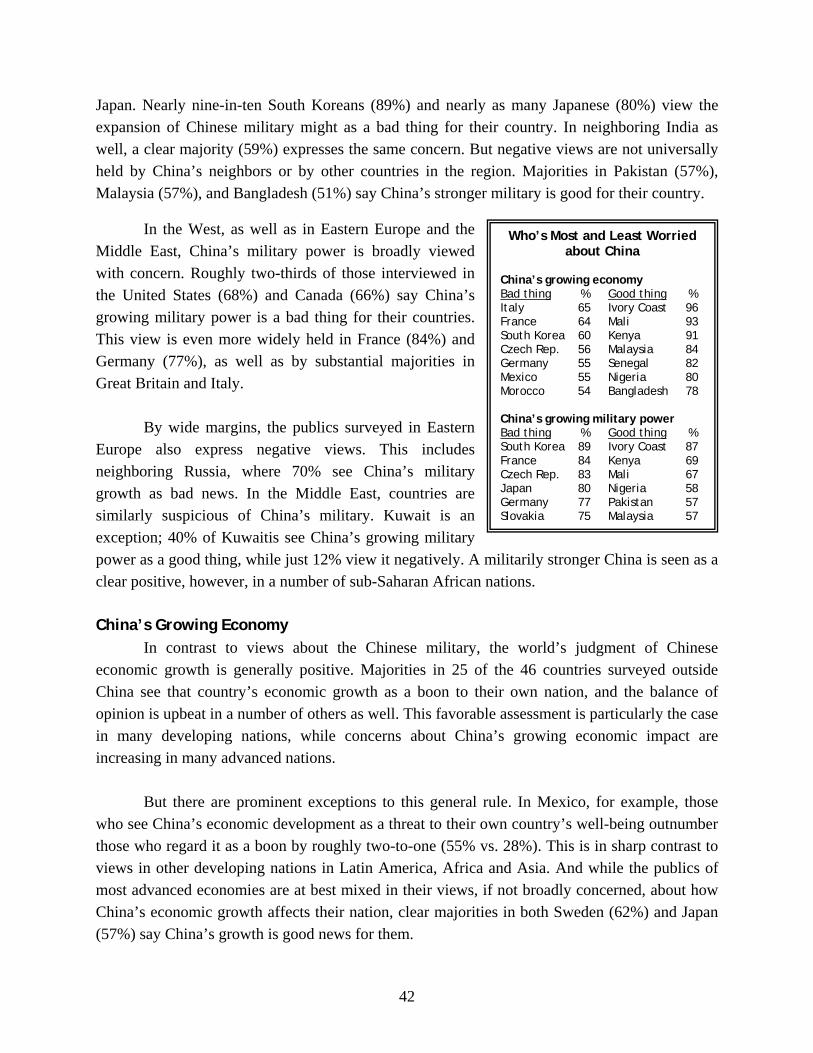
42
Japan. Nearly nine-in-ten South Koreans (89%) and nearly as many Japanese (80%) view the expansion of Chinese military might as a bad thing for their country. In neighboring India as well, a clear majority (59%) expresses the same concern. But negative views are not universally held by China’s neighbors or by other countries in the region. Majorities in Pakistan (57%), Malaysia (57%), and Bangladesh (51%) say China’s stronger military is good for their country. In the West, as well as in Eastern Europe and the Middle East, China’s military power is broadly viewed with concern. Roughly two-thirds of those interviewed in the United States (68%) and Canada (66%) say China’s growing military power is a bad thing for their countries. This view is even more widely held in France (84%) and Germany (77%), as well as by substantial majorities in Great Britain and Italy. By wide margins, the publics surveyed in Eastern Europe also express negative views. This includes neighboring Russia, where 70% see China’s military growth as bad news. In the Middle East, countries are similarly suspicious of China’s military. Kuwait is an exception; 40% of Kuwaitis see China’s growing military power as a good thing, while just 12% view it negatively. A militarily stronger China is seen as a clear positive, however, in a number of sub-Saharan African nations. China’s Growing Economy In contrast to views about the Chinese military, the world’s judgment of Chinese economic growth is generally positive. Majorities in 25 of the 46 countries surveyed outside China see that country’s economic growth as a boon to their own nation, and the balance of opinion is upbeat in a number of others as well. This favorable assessment is particularly the case in many developing nations, while concerns about China’s growing economic impact are increasing in many advanced nations. But there are prominent exceptions to this general rule. In Mexico, for example, those who see China’s economic development as a threat to their own country’s well-being outnumber those who regard it as a boon by roughly two-to-one (55% vs. 28%). This is in sharp contrast to views in other developing nations in Latin America, Africa and Asia. And while the publics of most advanced economies are at best mixed in their views, if not broadly concerned, about how China’s economic growth affects their nation, clear majorities in both Sweden (62%) and Japan (57%) say China’s growth is good news for them.
Who’s Most and Least Worried about China
China’s growing economy Bad thing % Good thing % Italy 65 Ivory Coast 96 France 64 Mali 93 South Korea 60 Kenya 91 Czech Rep. 56 Malaysia 84 Germany 55 Senegal 82 Mexico 55 Nigeria 80 Morocco 54 Bangladesh 78 China’s growing military power Bad thing % Good thing % South Korea 89 Ivory Coast 87 France 84 Kenya 69 Czech Rep. 83 Mali 67 Japan 80 Nigeria 58 Germany 77 Pakistan 57 Slovakia 75 Malaysia 57
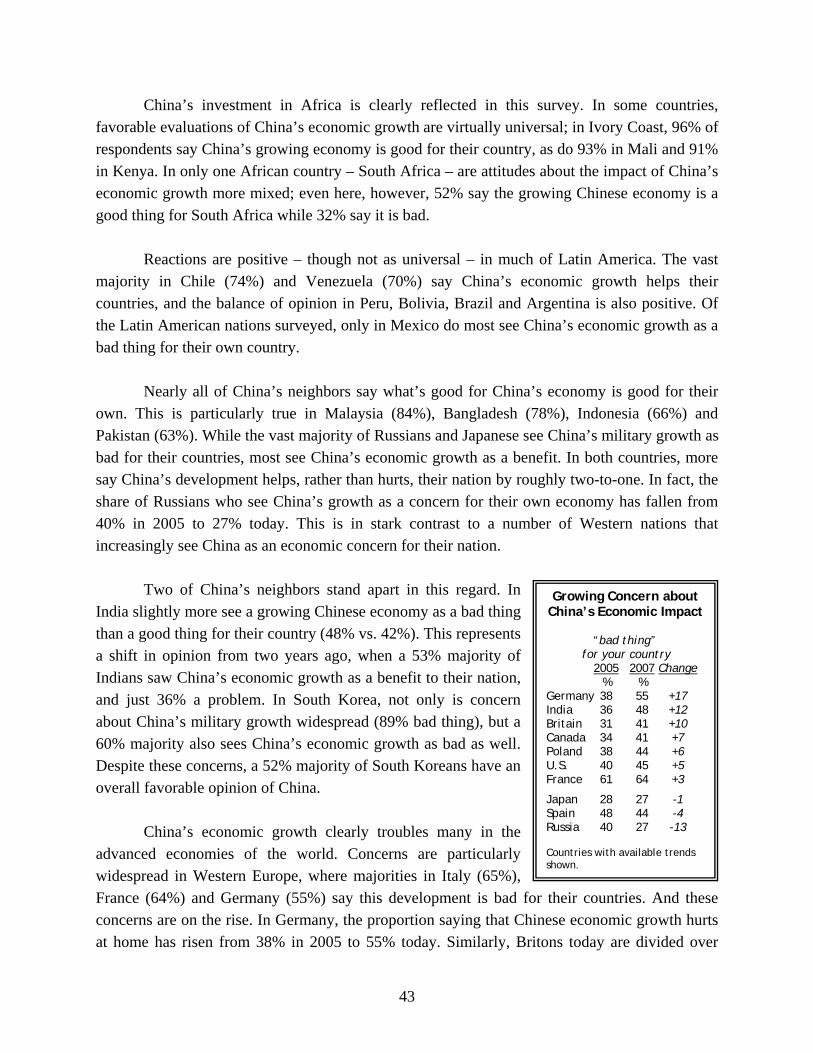
43
China’s investment in Africa is clearly reflected in this survey. In some countries, favorable evaluations of China’s economic growth are virtually universal; in Ivory Coast, 96% of respondents say China’s growing economy is good for their country, as do 93% in Mali and 91% in Kenya. In only one African country – South Africa – are attitudes about the impact of China’s economic growth more mixed; even here, however, 52% say the growing Chinese economy is a good thing for South Africa while 32% say it is bad.
Reactions are positive – though not as universal – in much of Latin America. The vast
majority in Chile (74%) and Venezuela (70%) say China’s economic growth helps their countries, and the balance of opinion in Peru, Bolivia, Brazil and Argentina is also positive. Of the Latin American nations surveyed, only in Mexico do most see China’s economic growth as a bad thing for their own country.
Nearly all of China’s neighbors say what’s good for China’s economy is good for their
own. This is particularly true in Malaysia (84%), Bangladesh (78%), Indonesia (66%) and Pakistan (63%). While the vast majority of Russians and Japanese see China’s military growth as bad for their countries, most see China’s economic growth as a benefit. In both countries, more say China’s development helps, rather than hurts, their nation by roughly two-to-one. In fact, the share of Russians who see China’s growth as a concern for their own economy has fallen from 40% in 2005 to 27% today. This is in stark contrast to a number of Western nations that increasingly see China as an economic concern for their nation.
Two of China’s neighbors stand apart in this regard. In
India slightly more see a growing Chinese economy as a bad thing than a good thing for their country (48% vs. 42%). This represents a shift in opinion from two years ago, when a 53% majority of Indians saw China’s economic growth as a benefit to their nation, and just 36% a problem. In South Korea, not only is concern about China’s military growth widespread (89% bad thing), but a 60% majority also sees China’s economic growth as bad as well. Despite these concerns, a 52% majority of South Koreans have an overall favorable opinion of China.
China’s economic growth clearly troubles many in the
advanced economies of the world. Concerns are particularly widespread in Western Europe, where majorities in Italy (65%), France (64%) and Germany (55%) say this development is bad for their countries. And these concerns are on the rise. In Germany, the proportion saying that Chinese economic growth hurts at home has risen from 38% in 2005 to 55% today. Similarly, Britons today are divided over
Growing Concern about China’s Economic Impact “bad thing” for your country 2005 2007 Change % % Germany 38 55 +17 India 36 48 +12 Britain 31 41 +10 Canada 34 41 +7 Poland 38 44 +6 U.S. 40 45 +5 France 61 64 +3
Japan 28 27 -1 Spain 48 44 -4 Russia 40 27 -13 Countries with available trends shown.
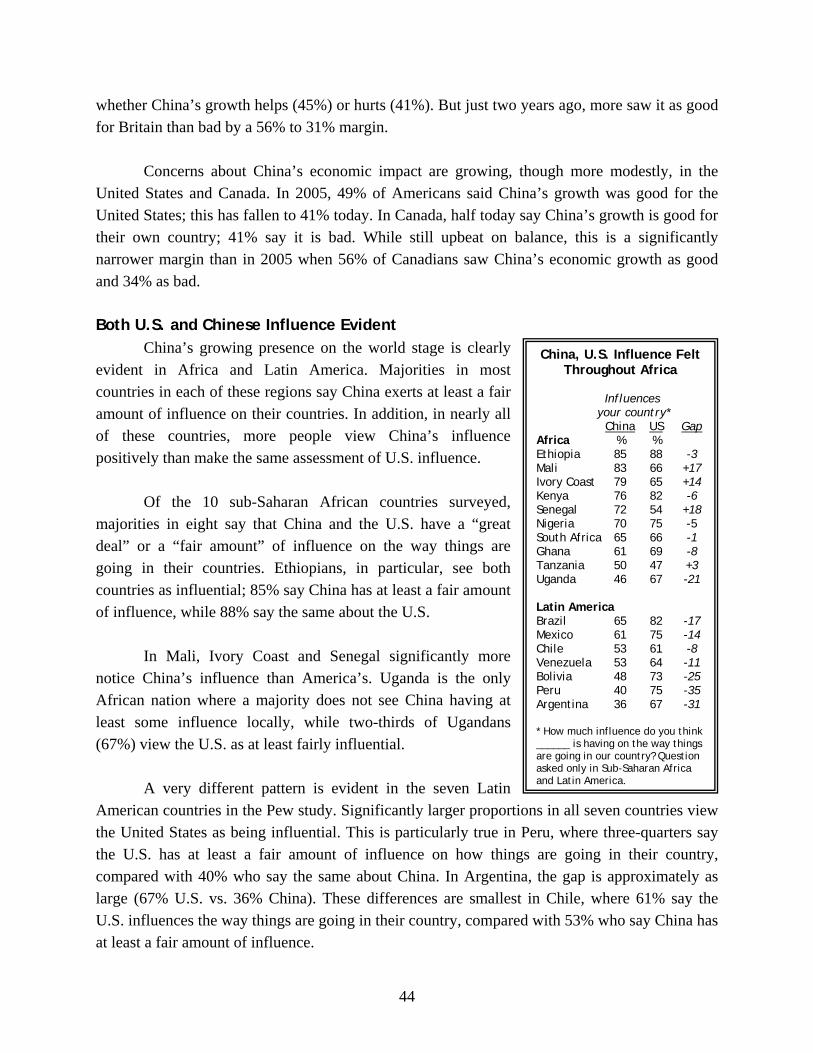
44
whether China’s growth helps (45%) or hurts (41%). But just two years ago, more saw it as good for Britain than bad by a 56% to 31% margin. Concerns about China’s economic impact are growing, though more modestly, in the United States and Canada. In 2005, 49% of Americans said China’s growth was good for the United States; this has fallen to 41% today. In Canada, half today say China’s growth is good for their own country; 41% say it is bad. While still upbeat on balance, this is a significantly narrower margin than in 2005 when 56% of Canadians saw China’s economic growth as good and 34% as bad. Both U.S. and Chinese Influence Evident China’s growing presence on the world stage is clearly evident in Africa and Latin America. Majorities in most countries in each of these regions say China exerts at least a fair amount of influence on their countries. In addition, in nearly all of these countries, more people view China’s influence positively than make the same assessment of U.S. influence.
Of the 10 sub-Saharan African countries surveyed, majorities in eight say that China and the U.S. have a “great deal” or a “fair amount” of influence on the way things are going in their countries. Ethiopians, in particular, see both countries as influential; 85% say China has at least a fair amount of influence, while 88% say the same about the U.S.
In Mali, Ivory Coast and Senegal significantly more
notice China’s influence than America’s. Uganda is the only African nation where a majority does not see China having at least some influence locally, while two-thirds of Ugandans (67%) view the U.S. as at least fairly influential.
A very different pattern is evident in the seven Latin
American countries in the Pew study. Significantly larger proportions in all seven countries view the United States as being influential. This is particularly true in Peru, where three-quarters say the U.S. has at least a fair amount of influence on how things are going in their country, compared with 40% who say the same about China. In Argentina, the gap is approximately as large (67% U.S. vs. 36% China). These differences are smallest in Chile, where 61% say the U.S. influences the way things are going in their country, compared with 53% who say China has at least a fair amount of influence.
China, U.S. Influence Felt Throughout Africa
Influences your country* China US Gap Africa % % Ethiopia 85 88 -3 Mali 83 66 +17 Ivory Coast 79 65 +14 Kenya 76 82 -6 Senegal 72 54 +18 Nigeria 70 75 -5 South Africa 65 66 -1 Ghana 61 69 -8 Tanzania 50 47 +3 Uganda 46 67 -21 Latin America Brazil 65 82 -17 Mexico 61 75 -14 Chile 53 61 -8 Venezuela 53 64 -11 Bolivia 48 73 -25 Peru 40 75 -35 Argentina 36 67 -31 * How much influence do you think ______ is having on the way things are going in our country? Question asked only in Sub-Saharan Africa and Latin America.
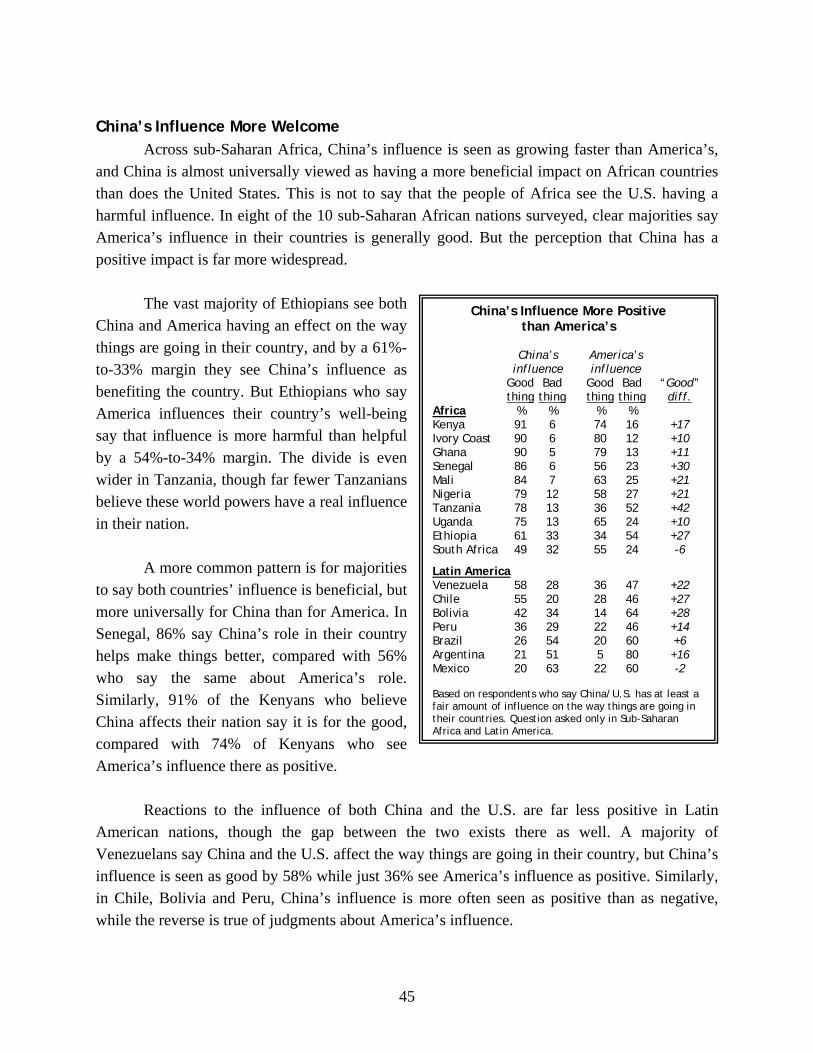
45
China’s Influence More Welcome
Across sub-Saharan Africa, China’s influence is seen as growing faster than America’s, and China is almost universally viewed as having a more beneficial impact on African countries than does the United States. This is not to say that the people of Africa see the U.S. having a harmful influence. In eight of the 10 sub-Saharan African nations surveyed, clear majorities say America’s influence in their countries is generally good. But the perception that China has a positive impact is far more widespread.
The vast majority of Ethiopians see both
China and America having an effect on the way things are going in their country, and by a 61%-to-33% margin they see China’s influence as benefiting the country. But Ethiopians who say America influences their country’s well-being say that influence is more harmful than helpful by a 54%-to-34% margin. The divide is even wider in Tanzania, though far fewer Tanzanians believe these world powers have a real influence in their nation.
A more common pattern is for majorities
to say both countries’ influence is beneficial, but more universally for China than for America. In Senegal, 86% say China’s role in their country helps make things better, compared with 56% who say the same about America’s role. Similarly, 91% of the Kenyans who believe China affects their nation say it is for the good, compared with 74% of Kenyans who see America’s influence there as positive.
Reactions to the influence of both China and the U.S. are far less positive in Latin
American nations, though the gap between the two exists there as well. A majority of Venezuelans say China and the U.S. affect the way things are going in their country, but China’s influence is seen as good by 58% while just 36% see America’s influence as positive. Similarly, in Chile, Bolivia and Peru, China’s influence is more often seen as positive than as negative, while the reverse is true of judgments about America’s influence.
China’s Influence More Positive than America’s
China’s America’s influence influence Good Bad Good Bad “Good” thing thing thing thing diff. Africa % % % % Kenya 91 6 74 16 +17 Ivory Coast 90 6 80 12 +10 Ghana 90 5 79 13 +11 Senegal 86 6 56 23 +30 Mali 84 7 63 25 +21 Nigeria 79 12 58 27 +21 Tanzania 78 13 36 52 +42 Uganda 75 13 65 24 +10 Ethiopia 61 33 34 54 +27 South Africa 49 32 55 24 -6
Latin America Venezuela 58 28 36 47 +22 Chile 55 20 28 46 +27 Bolivia 42 34 14 64 +28 Peru 36 29 22 46 +14 Brazil 26 54 20 60 +6 Argentina 21 51 5 80 +16 Mexico 20 63 22 60 -2 Based on respondents who say China/U.S. has at least a fair amount of influence on the way things are going in their countries. Question asked only in Sub-Saharan Africa and Latin America.
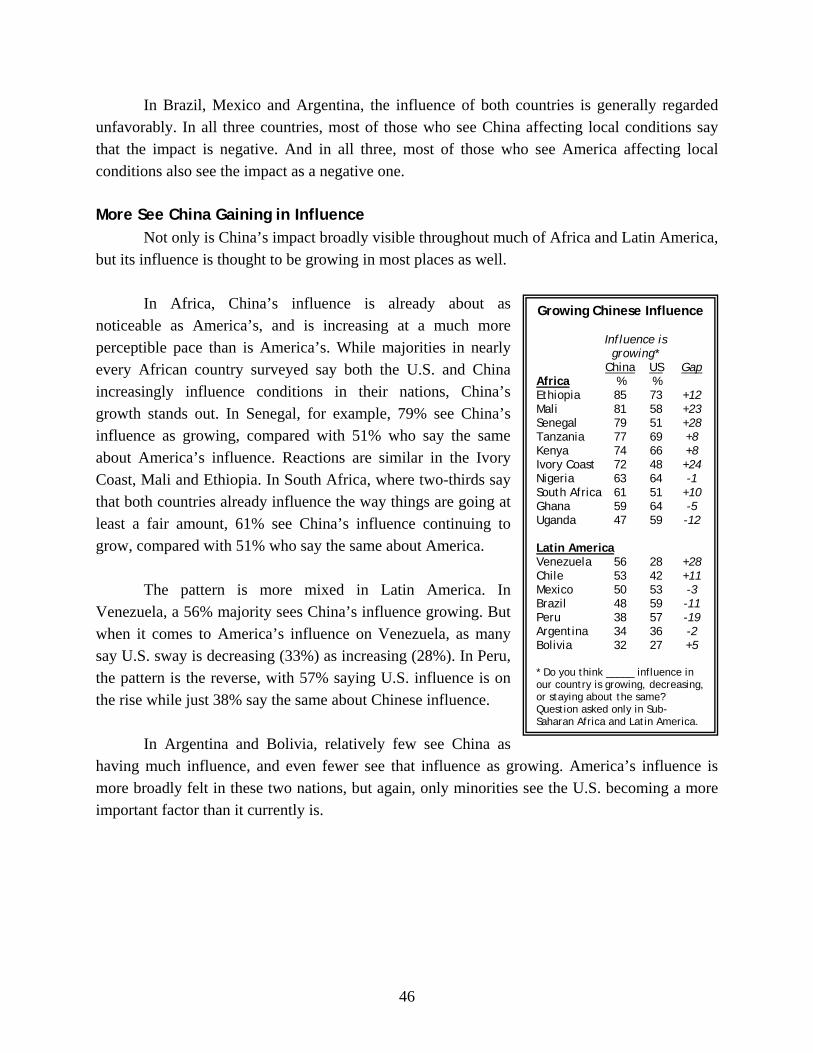
46
In Brazil, Mexico and Argentina, the influence of both countries is generally regarded unfavorably. In all three countries, most of those who see China affecting local conditions say that the impact is negative. And in all three, most of those who see America affecting local conditions also see the impact as a negative one.
More See China Gaining in Influence
Not only is China’s impact broadly visible throughout much of Africa and Latin America, but its influence is thought to be growing in most places as well.
In Africa, China’s influence is already about as
noticeable as America’s, and is increasing at a much more perceptible pace than is America’s. While majorities in nearly every African country surveyed say both the U.S. and China increasingly influence conditions in their nations, China’s growth stands out. In Senegal, for example, 79% see China’s influence as growing, compared with 51% who say the same about America’s influence. Reactions are similar in the Ivory Coast, Mali and Ethiopia. In South Africa, where two-thirds say that both countries already influence the way things are going at least a fair amount, 61% see China’s influence continuing to grow, compared with 51% who say the same about America.
The pattern is more mixed in Latin America. In
Venezuela, a 56% majority sees China’s influence growing. But when it comes to America’s influence on Venezuela, as many say U.S. sway is decreasing (33%) as increasing (28%). In Peru, the pattern is the reverse, with 57% saying U.S. influence is on the rise while just 38% say the same about Chinese influence.
In Argentina and Bolivia, relatively few see China as
having much influence, and even fewer see that influence as growing. America’s influence is more broadly felt in these two nations, but again, only minorities see the U.S. becoming a more important factor than it currently is.
Growing Chinese Influence Influence is growing* China US Gap Africa % % Ethiopia 85 73 +12 Mali 81 58 +23 Senegal 79 51 +28 Tanzania 77 69 +8 Kenya 74 66 +8 Ivory Coast 72 48 +24 Nigeria 63 64 -1 South Africa 61 51 +10 Ghana 59 64 -5 Uganda 47 59 -12 Latin America Venezuela 56 28 +28 Chile 53 42 +11 Mexico 50 53 -3 Brazil 48 59 -11 Peru 38 57 -19 Argentina 34 36 -2 Bolivia 32 27 +5 * Do you think _____ influence in our country is growing, decreasing, or staying about the same? Question asked only in Sub-Saharan Africa and Latin America.
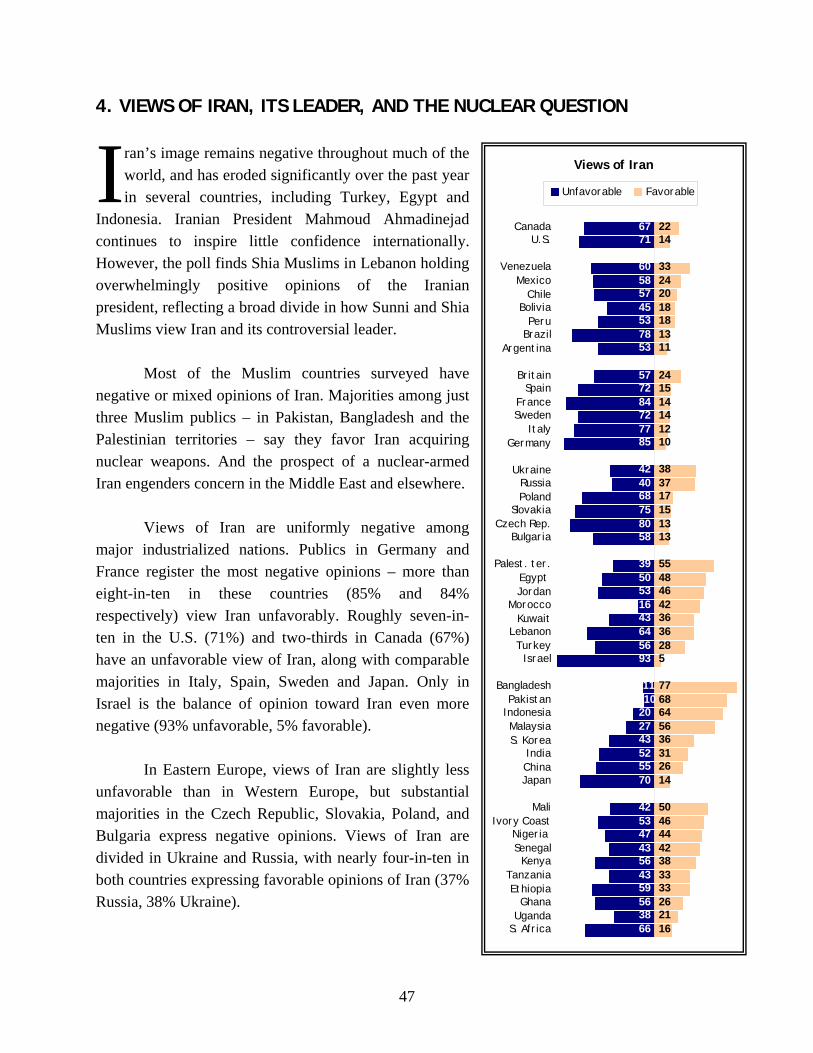
47
4. VIEWS OF IRAN, ITS LEADER, AND THE NUCLEAR QUESTION
ran’s image remains negative throughout much of the world, and has eroded significantly over the past year in several countries, including Turkey, Egypt and
Indonesia. Iranian President Mahmoud Ahmadinejad continues to inspire little confidence internationally. However, the poll finds Shia Muslims in Lebanon holding overwhelmingly positive opinions of the Iranian president, reflecting a broad divide in how Sunni and Shia Muslims view Iran and its controversial leader. Most of the Muslim countries surveyed have negative or mixed opinions of Iran. Majorities among just three Muslim publics – in Pakistan, Bangladesh and the Palestinian territories – say they favor Iran acquiring nuclear weapons. And the prospect of a nuclear-armed Iran engenders concern in the Middle East and elsewhere.
Views of Iran are uniformly negative among major industrialized nations. Publics in Germany and France register the most negative opinions – more than eight-in-ten in these countries (85% and 84% respectively) view Iran unfavorably. Roughly seven-in-ten in the U.S. (71%) and two-thirds in Canada (67%) have an unfavorable view of Iran, along with comparable majorities in Italy, Spain, Sweden and Japan. Only in Israel is the balance of opinion toward Iran even more negative (93% unfavorable, 5% favorable).
In Eastern Europe, views of Iran are slightly less unfavorable than in Western Europe, but substantial majorities in the Czech Republic, Slovakia, Poland, and Bulgaria express negative opinions. Views of Iran are divided in Ukraine and Russia, with nearly four-in-ten in both countries expressing favorable opinions of Iran (37% Russia, 38% Ukraine).
I Views of Iran
6771
60585745537853
577284727785
40
758058
3950531643645693
202743525570
42534743564359563866
2214
3324
18181311
2415141412
383717151313
554846423636
7768645636312614
5046
42383333262116
1011
42
68
44
10
528
20
CanadaU.S.
VenezuelaMexico
ChileBolivia
PeruBrazil
Argentina
BritainSpain
FranceSweden
ItalyGermany
UkraineRussiaPoland
SlovakiaCzech Rep.
Bulgaria
Palest. ter.Egypt Jordan
MoroccoKuwait
LebanonTurkey
Israel
BangladeshPakistan
IndonesiaMalaysiaS. Korea
IndiaChinaJapan
MaliIvory Coast
Nigeria Senegal
KenyaTanzaniaEthiopia
GhanaUganda
S. Africa
Unfavorable Favorable
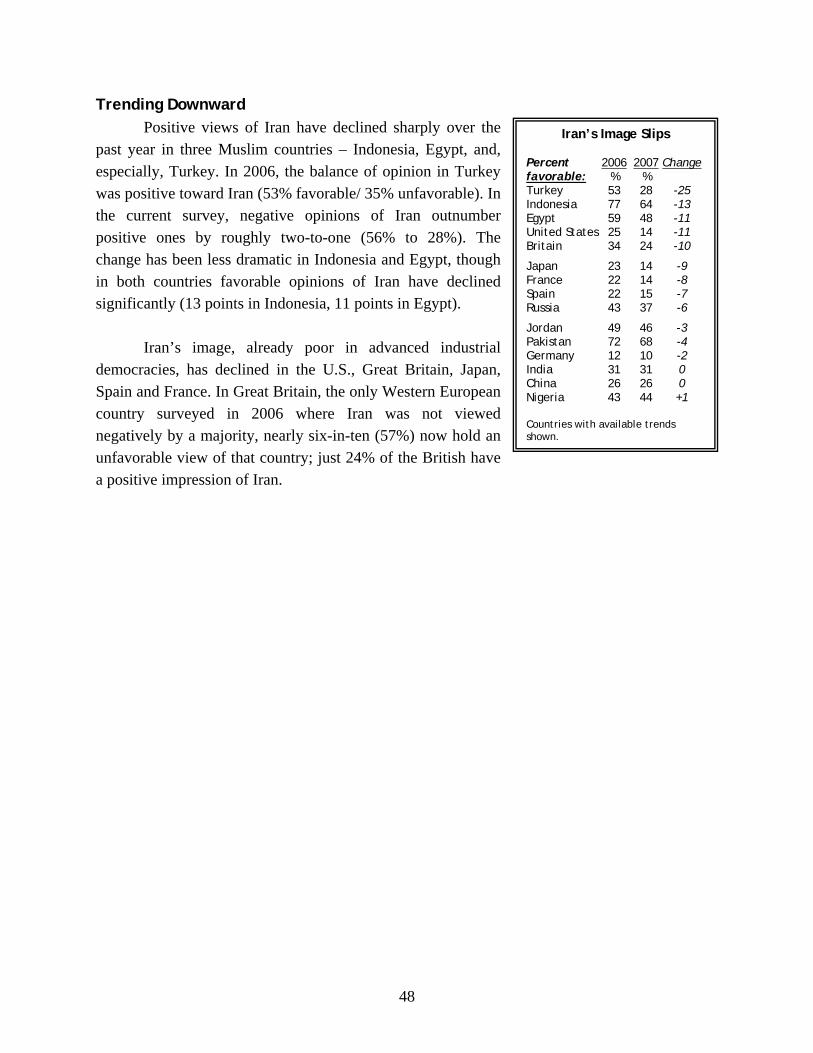
48
Trending Downward Positive views of Iran have declined sharply over the
past year in three Muslim countries – Indonesia, Egypt, and, especially, Turkey. In 2006, the balance of opinion in Turkey was positive toward Iran (53% favorable/ 35% unfavorable). In the current survey, negative opinions of Iran outnumber positive ones by roughly two-to-one (56% to 28%). The change has been less dramatic in Indonesia and Egypt, though in both countries favorable opinions of Iran have declined significantly (13 points in Indonesia, 11 points in Egypt).
Iran’s image, already poor in advanced industrial
democracies, has declined in the U.S., Great Britain, Japan, Spain and France. In Great Britain, the only Western European country surveyed in 2006 where Iran was not viewed negatively by a majority, nearly six-in-ten (57%) now hold an unfavorable view of that country; just 24% of the British have a positive impression of Iran.
Iran’s Image Slips Percent 2006 2007 Change favorable: % % Turkey 53 28 -25 Indonesia 77 64 -13 Egypt 59 48 -11 United States 25 14 -11 Britain 34 24 -10
Japan 23 14 -9 France 22 14 -8 Spain 22 15 -7 Russia 43 37 -6
Jordan 49 46 -3 Pakistan 72 68 -4 Germany 12 10 -2 India 31 31 0 China 26 26 0 Nigeria 43 44 +1 Countries with available trends shown.
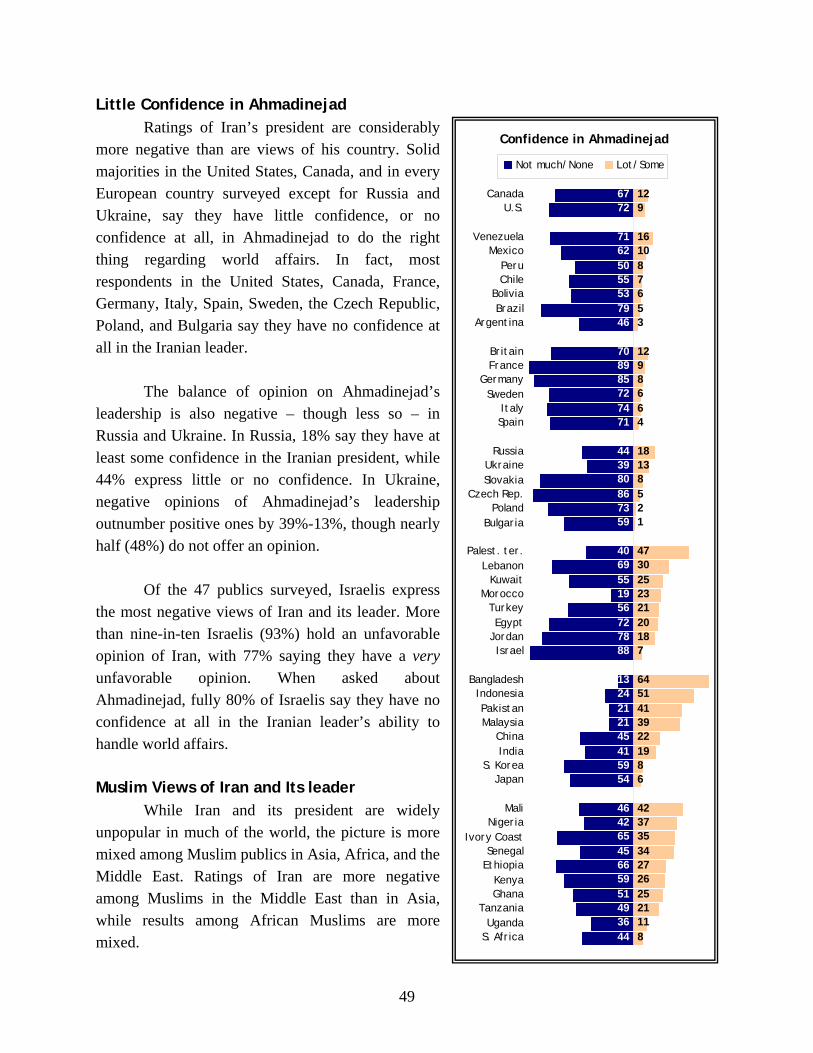
49
Little Confidence in Ahmadinejad Ratings of Iran’s president are considerably
more negative than are views of his country. Solid majorities in the United States, Canada, and in every European country surveyed except for Russia and Ukraine, say they have little confidence, or no confidence at all, in Ahmadinejad to do the right thing regarding world affairs. In fact, most respondents in the United States, Canada, France, Germany, Italy, Spain, Sweden, the Czech Republic, Poland, and Bulgaria say they have no confidence at all in the Iranian leader.
The balance of opinion on Ahmadinejad’s
leadership is also negative – though less so – in Russia and Ukraine. In Russia, 18% say they have at least some confidence in the Iranian president, while 44% express little or no confidence. In Ukraine, negative opinions of Ahmadinejad’s leadership outnumber positive ones by 39%-13%, though nearly half (48%) do not offer an opinion.
Of the 47 publics surveyed, Israelis express the most negative views of Iran and its leader. More than nine-in-ten Israelis (93%) hold an unfavorable opinion of Iran, with 77% saying they have a very unfavorable opinion. When asked about Ahmadinejad, fully 80% of Israelis say they have no confidence at all in the Iranian leader’s ability to handle world affairs. Muslim Views of Iran and Its leader While Iran and its president are widely unpopular in much of the world, the picture is more mixed among Muslim publics in Asia, Africa, and the Middle East. Ratings of Iran are more negative among Muslims in the Middle East than in Asia, while results among African Muslims are more mixed.
Confidence in Ahmadinejad
6772
71625055537946
708985727471
39
867359
4069551956727888
1324212145415954
46426545665951493644
129
1610
7653
129866
18138521
473025232120
64514139221986
4237
3427262521118
80
44
8
187
4
35
CanadaU.S.
VenezuelaMexico
PeruChile
BoliviaBrazil
Argentina
BritainFrance
GermanySweden
ItalySpain
RussiaUkraineSlovakia
Czech Rep.Poland
Bulgaria
Palest. ter.Lebanon
KuwaitMorocco
TurkeyEgypt
JordanIsrael
BangladeshIndonesiaPakistanMalaysia
ChinaIndia
S. KoreaJapan
MaliNigeria
Ivory CoastSenegal
EthiopiaKenyaGhana
TanzaniaUganda
S. Africa
Not much/None Lot/Some
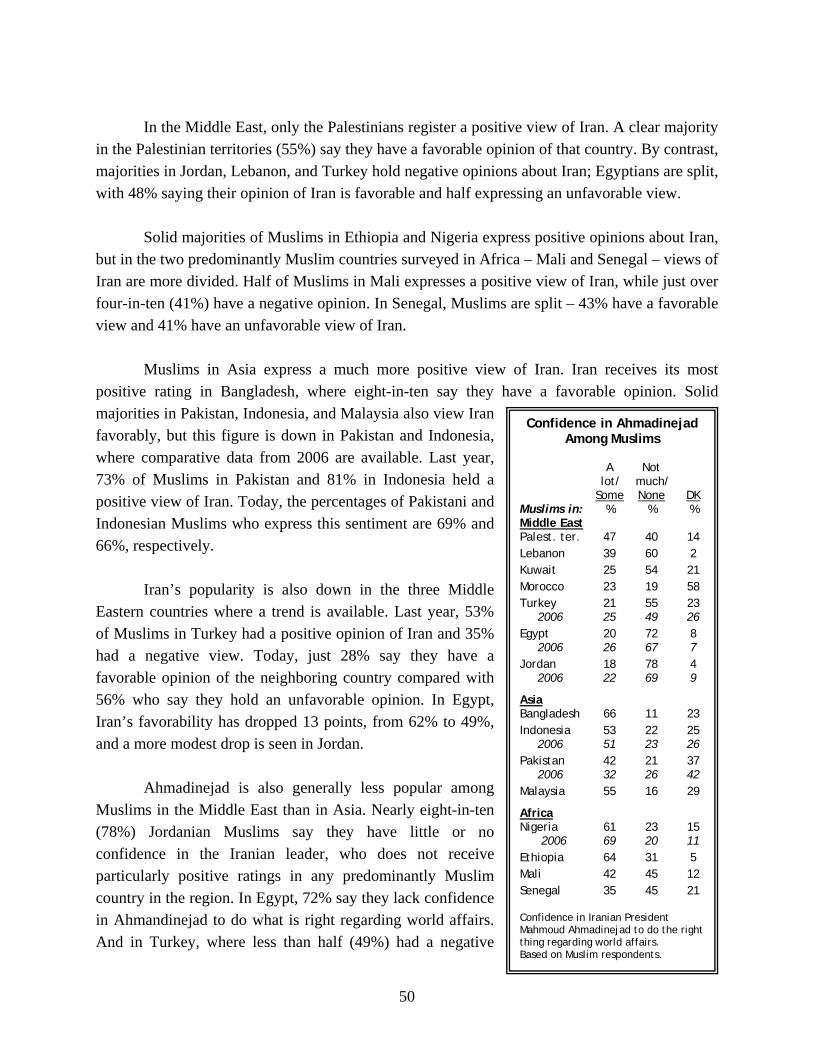
50
In the Middle East, only the Palestinians register a positive view of Iran. A clear majority
in the Palestinian territories (55%) say they have a favorable opinion of that country. By contrast, majorities in Jordan, Lebanon, and Turkey hold negative opinions about Iran; Egyptians are split, with 48% saying their opinion of Iran is favorable and half expressing an unfavorable view.
Solid majorities of Muslims in Ethiopia and Nigeria express positive opinions about Iran, but in the two predominantly Muslim countries surveyed in Africa – Mali and Senegal – views of Iran are more divided. Half of Muslims in Mali expresses a positive view of Iran, while just over four-in-ten (41%) have a negative opinion. In Senegal, Muslims are split – 43% have a favorable view and 41% have an unfavorable view of Iran.
Muslims in Asia express a much more positive view of Iran. Iran receives its most positive rating in Bangladesh, where eight-in-ten say they have a favorable opinion. Solid majorities in Pakistan, Indonesia, and Malaysia also view Iran favorably, but this figure is down in Pakistan and Indonesia, where comparative data from 2006 are available. Last year, 73% of Muslims in Pakistan and 81% in Indonesia held a positive view of Iran. Today, the percentages of Pakistani and Indonesian Muslims who express this sentiment are 69% and 66%, respectively.
Iran’s popularity is also down in the three Middle Eastern countries where a trend is available. Last year, 53% of Muslims in Turkey had a positive opinion of Iran and 35% had a negative view. Today, just 28% say they have a favorable opinion of the neighboring country compared with 56% who say they hold an unfavorable opinion. In Egypt, Iran’s favorability has dropped 13 points, from 62% to 49%, and a more modest drop is seen in Jordan.
Ahmadinejad is also generally less popular among
Muslims in the Middle East than in Asia. Nearly eight-in-ten (78%) Jordanian Muslims say they have little or no confidence in the Iranian leader, who does not receive particularly positive ratings in any predominantly Muslim country in the region. In Egypt, 72% say they lack confidence in Ahmandinejad to do what is right regarding world affairs. And in Turkey, where less than half (49%) had a negative
Confidence in Ahmadinejad Among Muslims
A Not lot/ much/ Some None DK Muslims in: % % % Middle East Palest. ter. 47 40 14 Lebanon 39 60 2 Kuwait 25 54 21 Morocco 23 19 58 Turkey 21 55 23 2006 25 49 26 Egypt 20 72 8 2006 26 67 7 Jordan 18 78 4 2006 22 69 9
Asia Bangladesh 66 11 23 Indonesia 53 22 25 2006 51 23 26 Pakistan 42 21 37 2006 32 26 42 Malaysia 55 16 29
Africa Nigeria 61 23 15 2006 69 20 11 Ethiopia 64 31 5 Mali 42 45 12 Senegal 35 45 21 Confidence in Iranian President Mahmoud Ahmadinejad to do the right thing regarding world affairs. Based on Muslim respondents.
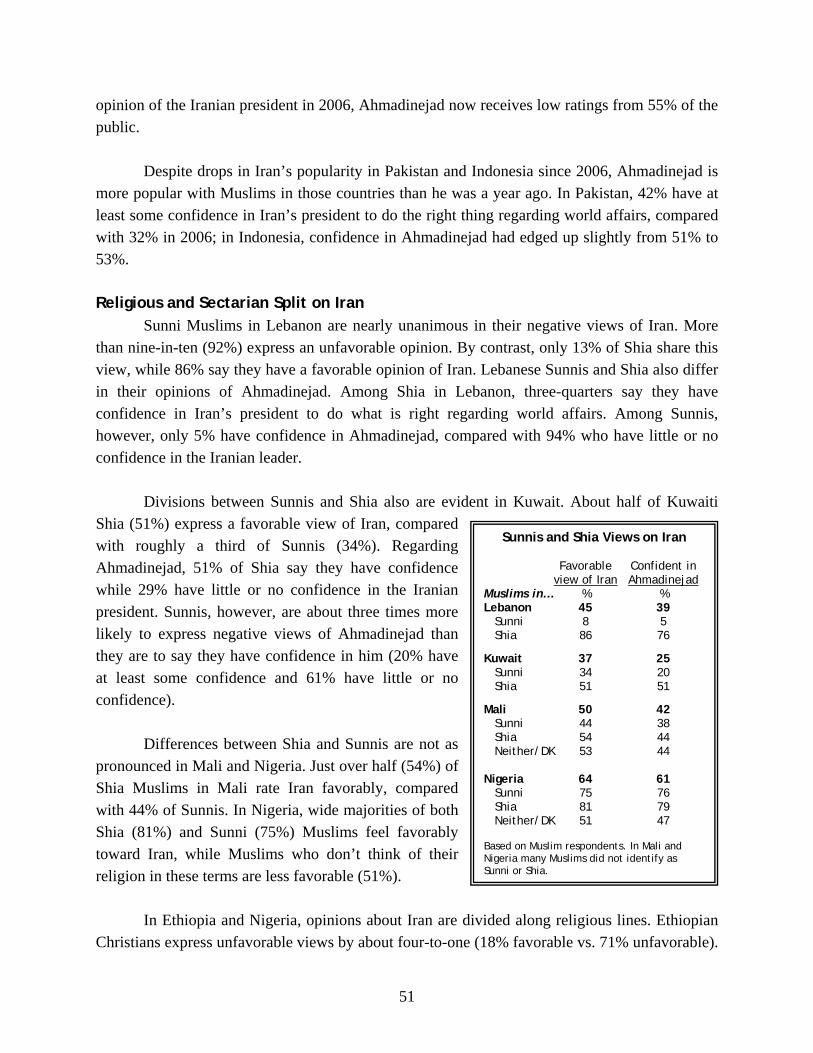
51
opinion of the Iranian president in 2006, Ahmadinejad now receives low ratings from 55% of the public.
Despite drops in Iran’s popularity in Pakistan and Indonesia since 2006, Ahmadinejad is
more popular with Muslims in those countries than he was a year ago. In Pakistan, 42% have at least some confidence in Iran’s president to do the right thing regarding world affairs, compared with 32% in 2006; in Indonesia, confidence in Ahmadinejad had edged up slightly from 51% to 53%.
Religious and Sectarian Split on Iran Sunni Muslims in Lebanon are nearly unanimous in their negative views of Iran. More than nine-in-ten (92%) express an unfavorable opinion. By contrast, only 13% of Shia share this view, while 86% say they have a favorable opinion of Iran. Lebanese Sunnis and Shia also differ in their opinions of Ahmadinejad. Among Shia in Lebanon, three-quarters say they have confidence in Iran’s president to do what is right regarding world affairs. Among Sunnis, however, only 5% have confidence in Ahmadinejad, compared with 94% who have little or no confidence in the Iranian leader. Divisions between Sunnis and Shia also are evident in Kuwait. About half of Kuwaiti Shia (51%) express a favorable view of Iran, compared with roughly a third of Sunnis (34%). Regarding Ahmadinejad, 51% of Shia say they have confidence while 29% have little or no confidence in the Iranian president. Sunnis, however, are about three times more likely to express negative views of Ahmadinejad than they are to say they have confidence in him (20% have at least some confidence and 61% have little or no confidence).
Differences between Shia and Sunnis are not as pronounced in Mali and Nigeria. Just over half (54%) of Shia Muslims in Mali rate Iran favorably, compared with 44% of Sunnis. In Nigeria, wide majorities of both Shia (81%) and Sunni (75%) Muslims feel favorably toward Iran, while Muslims who don’t think of their religion in these terms are less favorable (51%).
In Ethiopia and Nigeria, opinions about Iran are divided along religious lines. Ethiopian
Christians express unfavorable views by about four-to-one (18% favorable vs. 71% unfavorable).
Sunnis and Shia Views on Iran Favorable Confident in view of Iran Ahmadinejad Muslims in… % % Lebanon 45 39 Sunni 8 5 Shia 86 76
Kuwait 37 25 Sunni 34 20 Shia 51 51
Mali 50 42 Sunni 44 38 Shia 54 44 Neither/DK 53 44 Nigeria 64 61 Sunni 75 76 Shia 81 79 Neither/DK 51 47 Based on Muslim respondents. In Mali and Nigeria many Muslims did not identify as Sunni or Shia.
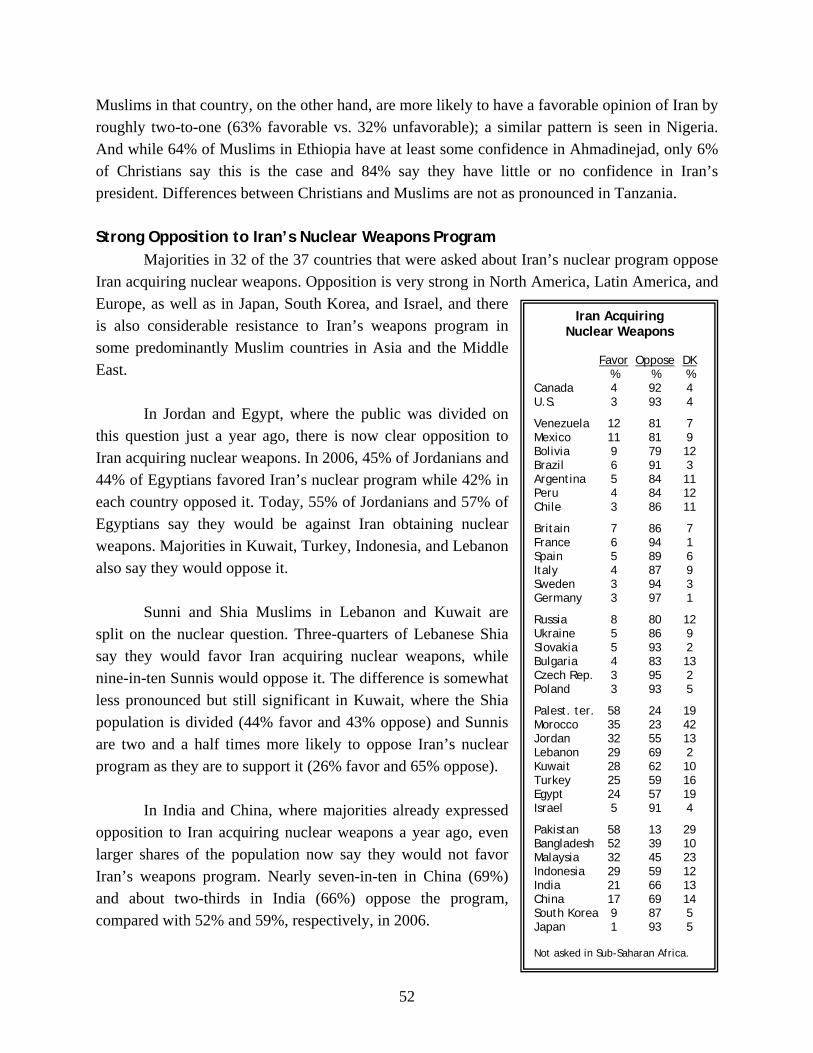
52
Muslims in that country, on the other hand, are more likely to have a favorable opinion of Iran by roughly two-to-one (63% favorable vs. 32% unfavorable); a similar pattern is seen in Nigeria. And while 64% of Muslims in Ethiopia have at least some confidence in Ahmadinejad, only 6% of Christians say this is the case and 84% say they have little or no confidence in Iran’s president. Differences between Christians and Muslims are not as pronounced in Tanzania. Strong Opposition to Iran’s Nuclear Weapons Program Majorities in 32 of the 37 countries that were asked about Iran’s nuclear program oppose Iran acquiring nuclear weapons. Opposition is very strong in North America, Latin America, and Europe, as well as in Japan, South Korea, and Israel, and there is also considerable resistance to Iran’s weapons program in some predominantly Muslim countries in Asia and the Middle East. In Jordan and Egypt, where the public was divided on this question just a year ago, there is now clear opposition to Iran acquiring nuclear weapons. In 2006, 45% of Jordanians and 44% of Egyptians favored Iran’s nuclear program while 42% in each country opposed it. Today, 55% of Jordanians and 57% of Egyptians say they would be against Iran obtaining nuclear weapons. Majorities in Kuwait, Turkey, Indonesia, and Lebanon also say they would oppose it. Sunni and Shia Muslims in Lebanon and Kuwait are split on the nuclear question. Three-quarters of Lebanese Shia say they would favor Iran acquiring nuclear weapons, while nine-in-ten Sunnis would oppose it. The difference is somewhat less pronounced but still significant in Kuwait, where the Shia population is divided (44% favor and 43% oppose) and Sunnis are two and a half times more likely to oppose Iran’s nuclear program as they are to support it (26% favor and 65% oppose). In India and China, where majorities already expressed opposition to Iran acquiring nuclear weapons a year ago, even larger shares of the population now say they would not favor Iran’s weapons program. Nearly seven-in-ten in China (69%) and about two-thirds in India (66%) oppose the program, compared with 52% and 59%, respectively, in 2006.
Iran Acquiring Nuclear Weapons
Favor Oppose DK % % % Canada 4 92 4 U.S. 3 93 4
Venezuela 12 81 7 Mexico 11 81 9 Bolivia 9 79 12 Brazil 6 91 3 Argentina 5 84 11 Peru 4 84 12 Chile 3 86 11
Britain 7 86 7 France 6 94 1 Spain 5 89 6 Italy 4 87 9 Sweden 3 94 3 Germany 3 97 1
Russia 8 80 12 Ukraine 5 86 9 Slovakia 5 93 2 Bulgaria 4 83 13 Czech Rep. 3 95 2 Poland 3 93 5
Palest. ter. 58 24 19 Morocco 35 23 42 Jordan 32 55 13 Lebanon 29 69 2 Kuwait 28 62 10 Turkey 25 59 16 Egypt 24 57 19 Israel 5 91 4
Pakistan 58 13 29 Bangladesh 52 39 10 Malaysia 32 45 23 Indonesia 29 59 12 India 21 66 13 China 17 69 14 South Korea 9 87 5 Japan 1 93 5 Not asked in Sub-Saharan Africa.
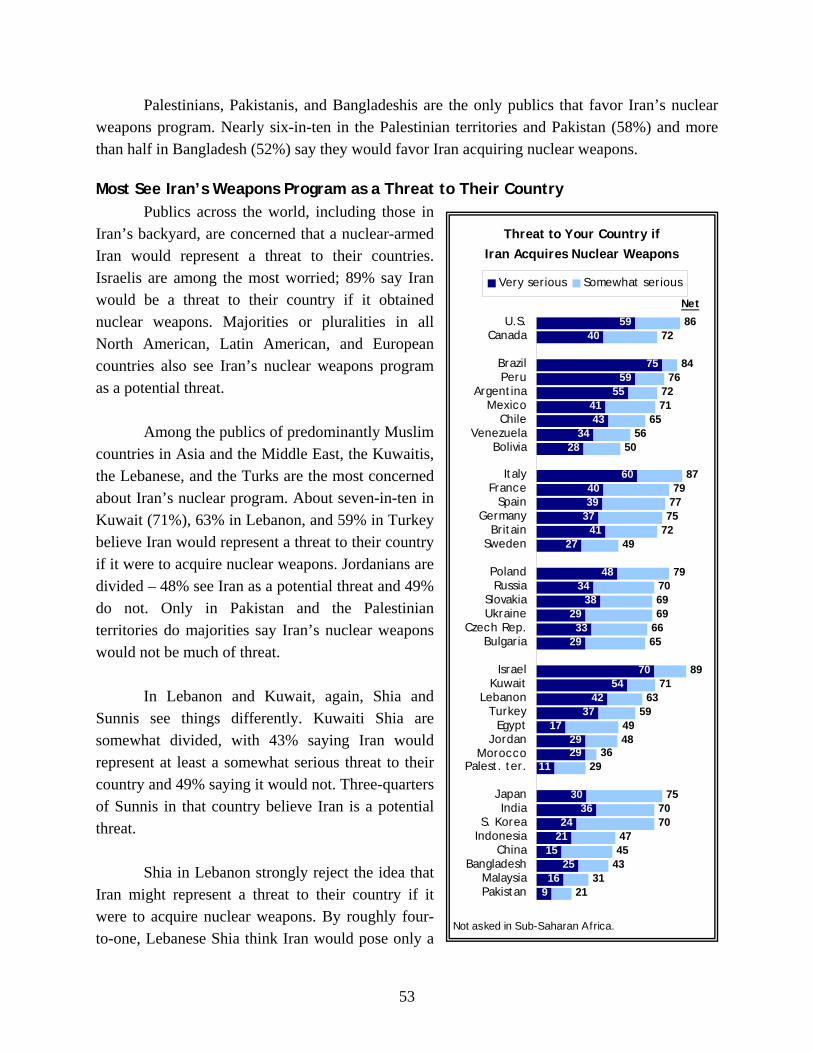
53
Palestinians, Pakistanis, and Bangladeshis are the only publics that favor Iran’s nuclear weapons program. Nearly six-in-ten in the Palestinian territories and Pakistan (58%) and more than half in Bangladesh (52%) say they would favor Iran acquiring nuclear weapons. Most See Iran’s Weapons Program as a Threat to Their Country Publics across the world, including those in Iran’s backyard, are concerned that a nuclear-armed Iran would represent a threat to their countries. Israelis are among the most worried; 89% say Iran would be a threat to their country if it obtained nuclear weapons. Majorities or pluralities in all North American, Latin American, and European countries also see Iran’s nuclear weapons program as a potential threat. Among the publics of predominantly Muslim countries in Asia and the Middle East, the Kuwaitis, the Lebanese, and the Turks are the most concerned about Iran’s nuclear program. About seven-in-ten in Kuwait (71%), 63% in Lebanon, and 59% in Turkey believe Iran would represent a threat to their country if it were to acquire nuclear weapons. Jordanians are divided – 48% see Iran as a potential threat and 49% do not. Only in Pakistan and the Palestinian territories do majorities say Iran’s nuclear weapons would not be much of threat. In Lebanon and Kuwait, again, Shia and Sunnis see things differently. Kuwaiti Shia are somewhat divided, with 43% saying Iran would represent at least a somewhat serious threat to their country and 49% saying it would not. Three-quarters of Sunnis in that country believe Iran is a potential threat. Shia in Lebanon strongly reject the idea that Iran might represent a threat to their country if it were to acquire nuclear weapons. By roughly four-to-one, Lebanese Shia think Iran would pose only a
Threat to Your Country ifIran Acquires Nuclear Weapons
5940
7559
554143
3428
604039
3741
27
4834
382933
29
7054
4237
172929
11
3036
2421
1525
169
8672
8476
7271
6556
50
8779
7775
7249
79706969
6665
8971
6359
4948
3629
757070
4745
4331
21
U.S.Canada
BrazilPeru
ArgentinaMexico
ChileVenezuela
Bolivia
ItalyFrance
SpainGermany
BritainSweden
PolandRussia
SlovakiaUkraine
Czech Rep.Bulgaria
IsraelKuwait
LebanonTurkey
EgyptJordan
MoroccoPalest. ter.
JapanIndia
S. KoreaIndonesia
ChinaBangladesh
MalaysiaPakistan
Very serious Somewhat serious
Net
Not asked in Sub-Saharan Africa.
54
minor threat or no threat at all (78% minor or no threat vs. 20% very serious or somewhat serious threat). By contrast, only 18% of Lebanese Sunnis believe Iran’s nuclear weapons would not be much of a threat to their country, while 81% worry that Iran might pose a threat.
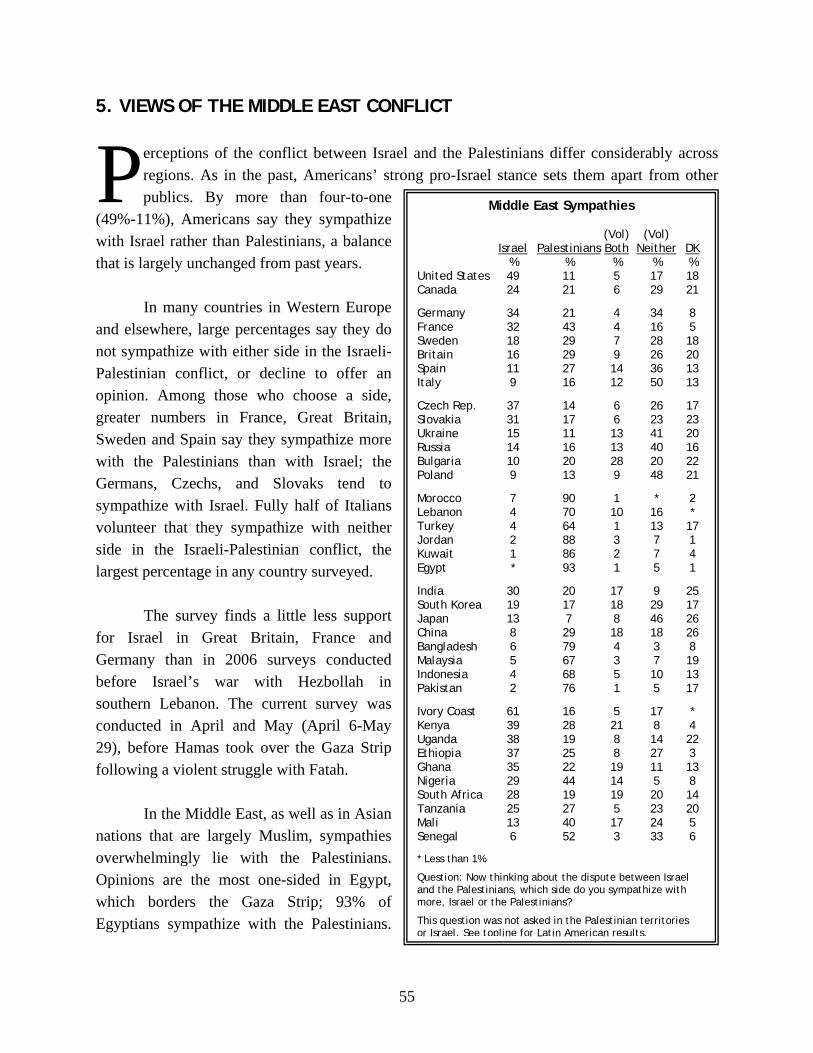
55
5. VIEWS OF THE MIDDLE EAST CONFLICT
erceptions of the conflict between Israel and the Palestinians differ considerably across regions. As in the past, Americans’ strong pro-Israel stance sets them apart from other publics. By more than four-to-one
(49%-11%), Americans say they sympathize with Israel rather than Palestinians, a balance that is largely unchanged from past years. In many countries in Western Europe and elsewhere, large percentages say they do not sympathize with either side in the Israeli-Palestinian conflict, or decline to offer an opinion. Among those who choose a side, greater numbers in France, Great Britain, Sweden and Spain say they sympathize more with the Palestinians than with Israel; the Germans, Czechs, and Slovaks tend to sympathize with Israel. Fully half of Italians volunteer that they sympathize with neither side in the Israeli-Palestinian conflict, the largest percentage in any country surveyed.
The survey finds a little less support for Israel in Great Britain, France and Germany than in 2006 surveys conducted before Israel’s war with Hezbollah in southern Lebanon. The current survey was conducted in April and May (April 6-May 29), before Hamas took over the Gaza Strip following a violent struggle with Fatah. In the Middle East, as well as in Asian nations that are largely Muslim, sympathies overwhelmingly lie with the Palestinians. Opinions are the most one-sided in Egypt, which borders the Gaza Strip; 93% of Egyptians sympathize with the Palestinians.
P Middle East Sympathies (Vol) (Vol) Israel Palestinians Both Neither DK % % % % % United States 49 11 5 17 18 Canada 24 21 6 29 21
Germany 34 21 4 34 8 France 32 43 4 16 5 Sweden 18 29 7 28 18 Britain 16 29 9 26 20 Spain 11 27 14 36 13 Italy 9 16 12 50 13
Czech Rep. 37 14 6 26 17 Slovakia 31 17 6 23 23 Ukraine 15 11 13 41 20 Russia 14 16 13 40 16 Bulgaria 10 20 28 20 22 Poland 9 13 9 48 21
Morocco 7 90 1 * 2 Lebanon 4 70 10 16 * Turkey 4 64 1 13 17 Jordan 2 88 3 7 1 Kuwait 1 86 2 7 4 Egypt * 93 1 5 1
India 30 20 17 9 25 South Korea 19 17 18 29 17 Japan 13 7 8 46 26 China 8 29 18 18 26 Bangladesh 6 79 4 3 8 Malaysia 5 67 3 7 19 Indonesia 4 68 5 10 13 Pakistan 2 76 1 5 17
Ivory Coast 61 16 5 17 * Kenya 39 28 21 8 4 Uganda 38 19 8 14 22 Ethiopia 37 25 8 27 3 Ghana 35 22 19 11 13 Nigeria 29 44 14 5 8 South Africa 28 19 19 20 14 Tanzania 25 27 5 23 20 Mali 13 40 17 24 5 Senegal 6 52 3 33 6 * Less than 1%.
Question: Now thinking about the dispute between Israel and the Palestinians, which side do you sympathize with more, Israel or the Palestinians?
This question was not asked in the Palestinian territories or Israel. See topline for Latin American results.
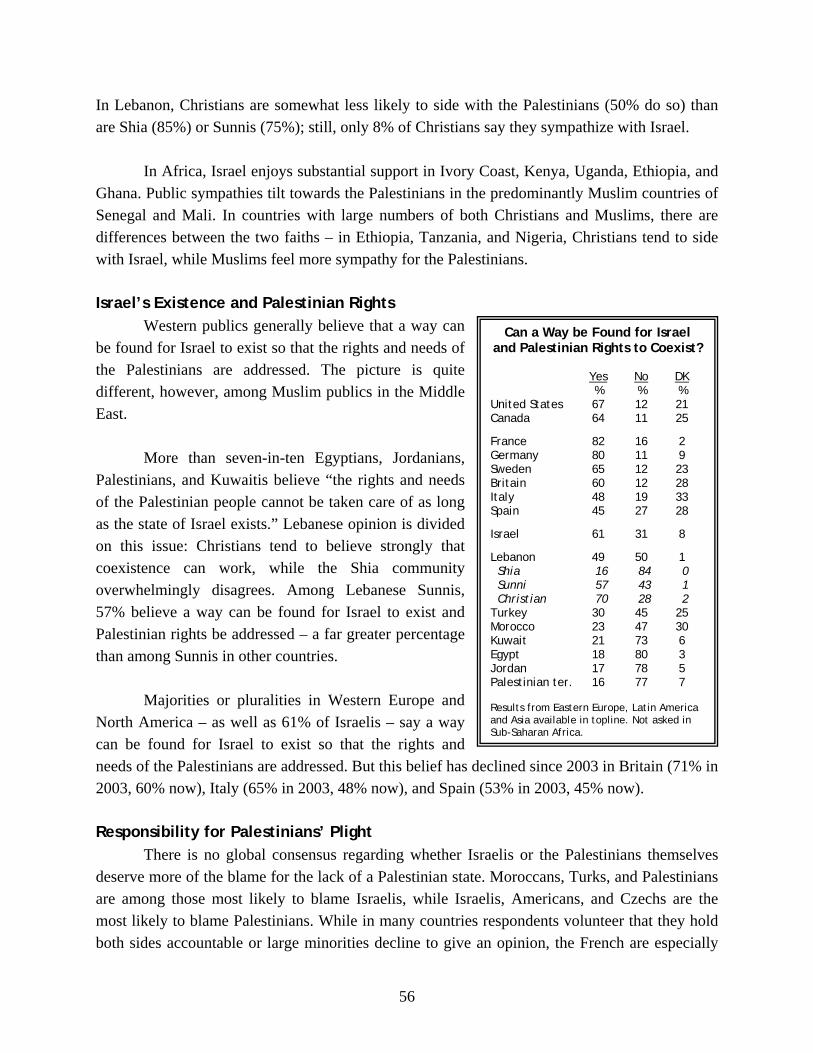
56
Can a Way be Found for Israel and Palestinian Rights to Coexist? Yes No DK % % % United States 67 12 21 Canada 64 11 25
France 82 16 2 Germany 80 11 9 Sweden 65 12 23 Britain 60 12 28 Italy 48 19 33 Spain 45 27 28
Israel 61 31 8
Lebanon 49 50 1 Shia 16 84 0 Sunni 57 43 1 Christian 70 28 2 Turkey 30 45 25 Morocco 23 47 30 Kuwait 21 73 6 Egypt 18 80 3 Jordan 17 78 5 Palestinian ter. 16 77 7 Results from Eastern Europe, Latin America and Asia available in topline. Not asked in Sub-Saharan Africa.
In Lebanon, Christians are somewhat less likely to side with the Palestinians (50% do so) than are Shia (85%) or Sunnis (75%); still, only 8% of Christians say they sympathize with Israel. In Africa, Israel enjoys substantial support in Ivory Coast, Kenya, Uganda, Ethiopia, and Ghana. Public sympathies tilt towards the Palestinians in the predominantly Muslim countries of Senegal and Mali. In countries with large numbers of both Christians and Muslims, there are differences between the two faiths – in Ethiopia, Tanzania, and Nigeria, Christians tend to side with Israel, while Muslims feel more sympathy for the Palestinians. Israel’s Existence and Palestinian Rights Western publics generally believe that a way can be found for Israel to exist so that the rights and needs of the Palestinians are addressed. The picture is quite different, however, among Muslim publics in the Middle East. More than seven-in-ten Egyptians, Jordanians, Palestinians, and Kuwaitis believe “the rights and needs of the Palestinian people cannot be taken care of as long as the state of Israel exists.” Lebanese opinion is divided on this issue: Christians tend to believe strongly that coexistence can work, while the Shia community overwhelmingly disagrees. Among Lebanese Sunnis, 57% believe a way can be found for Israel to exist and Palestinian rights be addressed – a far greater percentage than among Sunnis in other countries. Majorities or pluralities in Western Europe and North America – as well as 61% of Israelis – say a way can be found for Israel to exist so that the rights and needs of the Palestinians are addressed. But this belief has declined since 2003 in Britain (71% in 2003, 60% now), Italy (65% in 2003, 48% now), and Spain (53% in 2003, 45% now). Responsibility for Palestinians’ Plight There is no global consensus regarding whether Israelis or the Palestinians themselves deserve more of the blame for the lack of a Palestinian state. Moroccans, Turks, and Palestinians are among those most likely to blame Israelis, while Israelis, Americans, and Czechs are the most likely to blame Palestinians. While in many countries respondents volunteer that they hold both sides accountable or large minorities decline to give an opinion, the French are especially
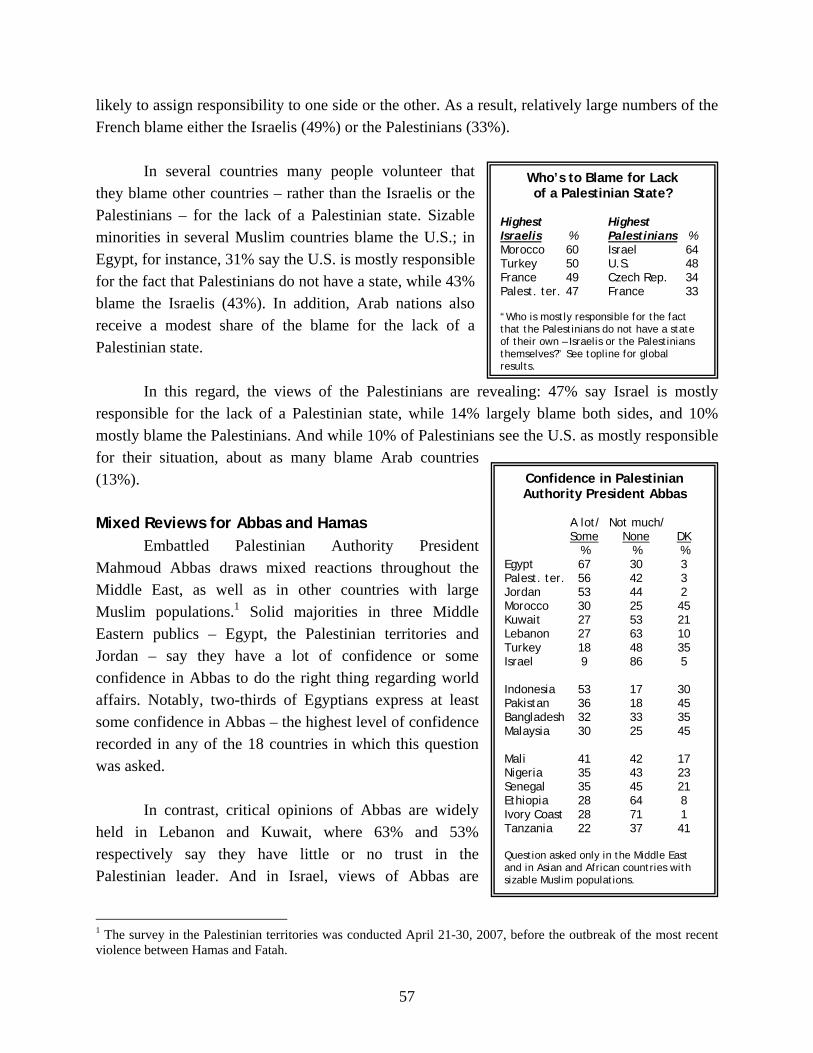
57
likely to assign responsibility to one side or the other. As a result, relatively large numbers of the French blame either the Israelis (49%) or the Palestinians (33%).
In several countries many people volunteer that they blame other countries – rather than the Israelis or the Palestinians – for the lack of a Palestinian state. Sizable minorities in several Muslim countries blame the U.S.; in Egypt, for instance, 31% say the U.S. is mostly responsible for the fact that Palestinians do not have a state, while 43% blame the Israelis (43%). In addition, Arab nations also receive a modest share of the blame for the lack of a Palestinian state.
In this regard, the views of the Palestinians are revealing: 47% say Israel is mostly responsible for the lack of a Palestinian state, while 14% largely blame both sides, and 10% mostly blame the Palestinians. And while 10% of Palestinians see the U.S. as mostly responsible for their situation, about as many blame Arab countries (13%). Mixed Reviews for Abbas and Hamas Embattled Palestinian Authority President Mahmoud Abbas draws mixed reactions throughout the Middle East, as well as in other countries with large Muslim populations.1 Solid majorities in three Middle Eastern publics – Egypt, the Palestinian territories and Jordan – say they have a lot of confidence or some confidence in Abbas to do the right thing regarding world affairs. Notably, two-thirds of Egyptians express at least some confidence in Abbas – the highest level of confidence recorded in any of the 18 countries in which this question was asked. In contrast, critical opinions of Abbas are widely held in Lebanon and Kuwait, where 63% and 53% respectively say they have little or no trust in the Palestinian leader. And in Israel, views of Abbas are
1 The survey in the Palestinian territories was conducted April 21-30, 2007, before the outbreak of the most recent violence between Hamas and Fatah.
Confidence in Palestinian Authority President Abbas
A lot/ Not much/ Some None DK % % % Egypt 67 30 3 Palest. ter. 56 42 3 Jordan 53 44 2 Morocco 30 25 45 Kuwait 27 53 21 Lebanon 27 63 10 Turkey 18 48 35 Israel 9 86 5 Indonesia 53 17 30 Pakistan 36 18 45 Bangladesh 32 33 35 Malaysia 30 25 45 Mali 41 42 17 Nigeria 35 43 23 Senegal 35 45 21 Ethiopia 28 64 8 Ivory Coast 28 71 1 Tanzania 22 37 41 Question asked only in the Middle East and in Asian and African countries with sizable Muslim populations.
Who’s to Blame for Lack of a Palestinian State?
Highest Highest Israelis % Palestinians % Morocco 60 Israel 64 Turkey 50 U.S. 48 France 49 Czech Rep. 34 Palest. ter. 47 France 33 “Who is mostly responsible for the fact that the Palestinians do not have a state of their own – Israelis or the Palestinians themselves?” See topline for global results.
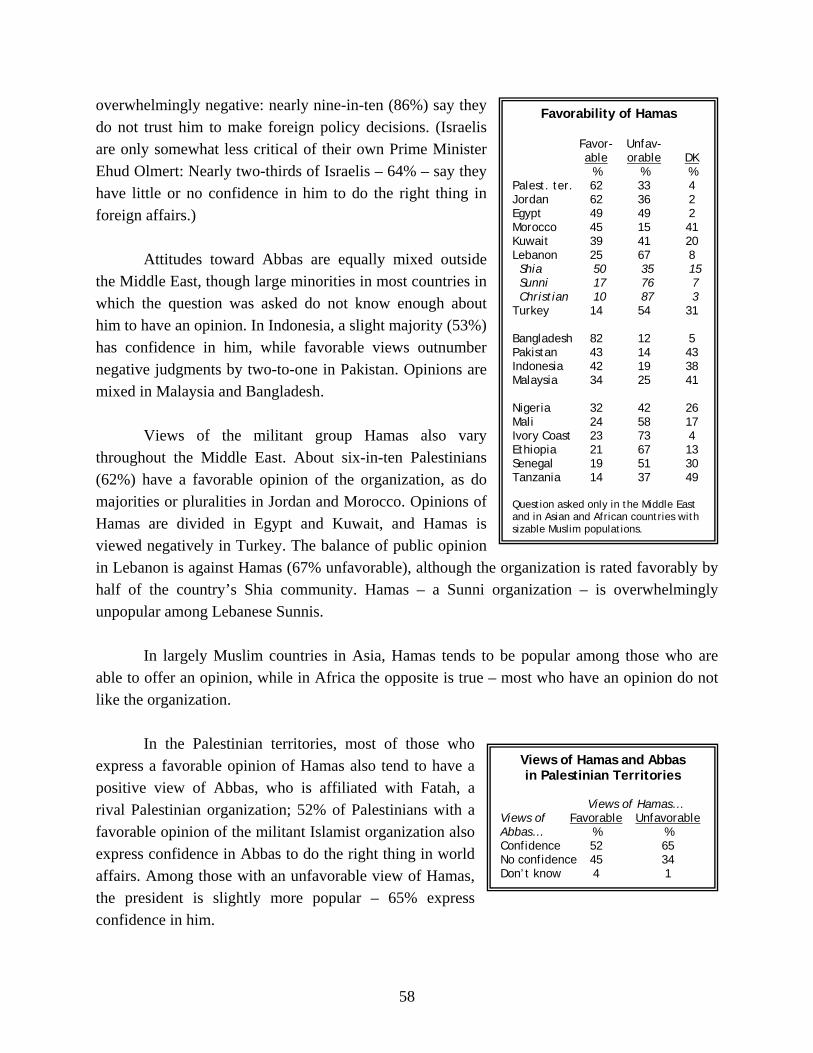
58
overwhelmingly negative: nearly nine-in-ten (86%) say they do not trust him to make foreign policy decisions. (Israelis are only somewhat less critical of their own Prime Minister Ehud Olmert: Nearly two-thirds of Israelis – 64% – say they have little or no confidence in him to do the right thing in foreign affairs.) Attitudes toward Abbas are equally mixed outside the Middle East, though large minorities in most countries in which the question was asked do not know enough about him to have an opinion. In Indonesia, a slight majority (53%) has confidence in him, while favorable views outnumber negative judgments by two-to-one in Pakistan. Opinions are mixed in Malaysia and Bangladesh. Views of the militant group Hamas also vary throughout the Middle East. About six-in-ten Palestinians (62%) have a favorable opinion of the organization, as do majorities or pluralities in Jordan and Morocco. Opinions of Hamas are divided in Egypt and Kuwait, and Hamas is viewed negatively in Turkey. The balance of public opinion in Lebanon is against Hamas (67% unfavorable), although the organization is rated favorably by half of the country’s Shia community. Hamas – a Sunni organization – is overwhelmingly unpopular among Lebanese Sunnis.
In largely Muslim countries in Asia, Hamas tends to be popular among those who are able to offer an opinion, while in Africa the opposite is true – most who have an opinion do not like the organization. In the Palestinian territories, most of those who express a favorable opinion of Hamas also tend to have a positive view of Abbas, who is affiliated with Fatah, a rival Palestinian organization; 52% of Palestinians with a favorable opinion of the militant Islamist organization also express confidence in Abbas to do the right thing in world affairs. Among those with an unfavorable view of Hamas, the president is slightly more popular – 65% express confidence in him.
Views of Hamas and Abbas in Palestinian Territories
Views of Hamas… Views of Favorable Unfavorable Abbas… % % Confidence 52 65 No confidence 45 34 Don’t know 4 1
Favorability of Hamas Favor- Unfav- able orable DK % % % Palest. ter. 62 33 4 Jordan 62 36 2 Egypt 49 49 2 Morocco 45 15 41 Kuwait 39 41 20 Lebanon 25 67 8 Shia 50 35 15 Sunni 17 76 7 Christian 10 87 3 Turkey 14 54 31 Bangladesh 82 12 5 Pakistan 43 14 43 Indonesia 42 19 38 Malaysia 34 25 41 Nigeria 32 42 26 Mali 24 58 17 Ivory Coast 23 73 4 Ethiopia 21 67 13 Senegal 19 51 30 Tanzania 14 37 49 Question asked only in the Middle East and in Asian and African countries with sizable Muslim populations.
59
U.S. Policies in the Region Throughout the Muslim countries of the Middle East, overwhelming majorities believe U.S. policy in the region favors Israel too much, including more than eight-in-ten respondents in Jordan (91%), the Palestinian territories (90%), Lebanon (89%), Kuwait (86%), Egypt (86%), and Morocco (81%). This belief is widespread in other largely Muslim countries as well, such as Indonesia (69%), Bangladesh (55%), and Malaysia (55%). In addition, solid majorities in France (62%) and Germany (57%) who say U.S. policies favor Israel too much. Even in Israel, a slim 42% plurality says America is too supportive of their country, while 13% say the U.S. favors the Palestinians too much and 37% say U.S. policies are fair. About a third of Americans (34%) see U.S. policy in the region as fair, 27% see it biased toward Israel, and 8% biased toward the Palestinians. With few exceptions, only small minorities of respondents in the 37 countries where this question was asked see American policy as overly supportive of the Palestinians (it was not asked in sub-Saharan Africa).

60
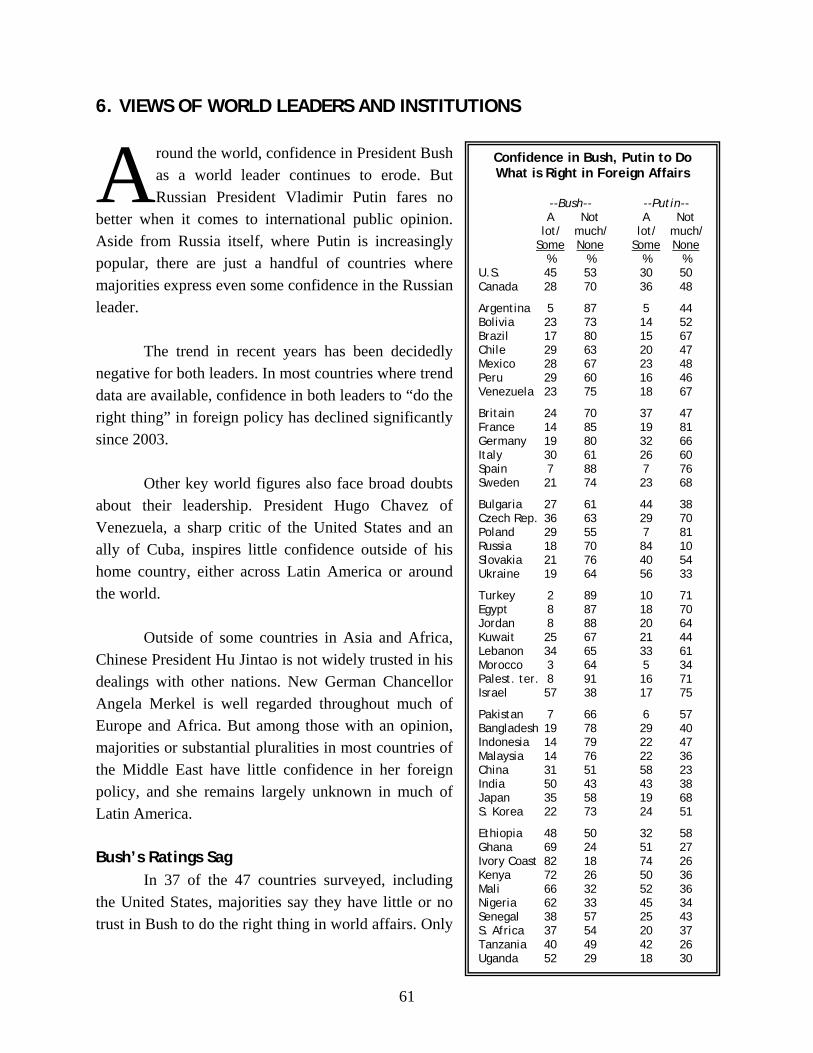
61
6. VIEWS OF WORLD LEADERS AND INSTITUTIONS
round the world, confidence in President Bush as a world leader continues to erode. But Russian President Vladimir Putin fares no
better when it comes to international public opinion. Aside from Russia itself, where Putin is increasingly popular, there are just a handful of countries where majorities express even some confidence in the Russian leader. The trend in recent years has been decidedly negative for both leaders. In most countries where trend data are available, confidence in both leaders to “do the right thing” in foreign policy has declined significantly since 2003.
Other key world figures also face broad doubts about their leadership. President Hugo Chavez of Venezuela, a sharp critic of the United States and an ally of Cuba, inspires little confidence outside of his home country, either across Latin America or around the world.
Outside of some countries in Asia and Africa, Chinese President Hu Jintao is not widely trusted in his dealings with other nations. New German Chancellor Angela Merkel is well regarded throughout much of Europe and Africa. But among those with an opinion, majorities or substantial pluralities in most countries of the Middle East have little confidence in her foreign policy, and she remains largely unknown in much of Latin America. Bush’s Ratings Sag
In 37 of the 47 countries surveyed, including the United States, majorities say they have little or no trust in Bush to do the right thing in world affairs. Only
A Confidence in Bush, Putin to Do What is Right in Foreign Affairs
--Bush-- --Putin-- A Not A Not lot/ much/ lot/ much/ Some None Some None % % % % U.S. 45 53 30 50 Canada 28 70 36 48
Argentina 5 87 5 44 Bolivia 23 73 14 52 Brazil 17 80 15 67 Chile 29 63 20 47 Mexico 28 67 23 48 Peru 29 60 16 46 Venezuela 23 75 18 67
Britain 24 70 37 47 France 14 85 19 81 Germany 19 80 32 66 Italy 30 61 26 60 Spain 7 88 7 76 Sweden 21 74 23 68
Bulgaria 27 61 44 38 Czech Rep. 36 63 29 70 Poland 29 55 7 81 Russia 18 70 84 10 Slovakia 21 76 40 54 Ukraine 19 64 56 33
Turkey 2 89 10 71 Egypt 8 87 18 70 Jordan 8 88 20 64 Kuwait 25 67 21 44 Lebanon 34 65 33 61 Morocco 3 64 5 34 Palest. ter. 8 91 16 71 Israel 57 38 17 75
Pakistan 7 66 6 57 Bangladesh 19 78 29 40 Indonesia 14 79 22 47 Malaysia 14 76 22 36 China 31 51 58 23 India 50 43 43 38 Japan 35 58 19 68 S. Korea 22 73 24 51
Ethiopia 48 50 32 58 Ghana 69 24 51 27 Ivory Coast 82 18 74 26 Kenya 72 26 50 36 Mali 66 32 52 36 Nigeria 62 33 45 34 Senegal 38 57 25 43 S. Africa 37 54 20 37 Tanzania 40 49 42 26 Uganda 52 29 18 30
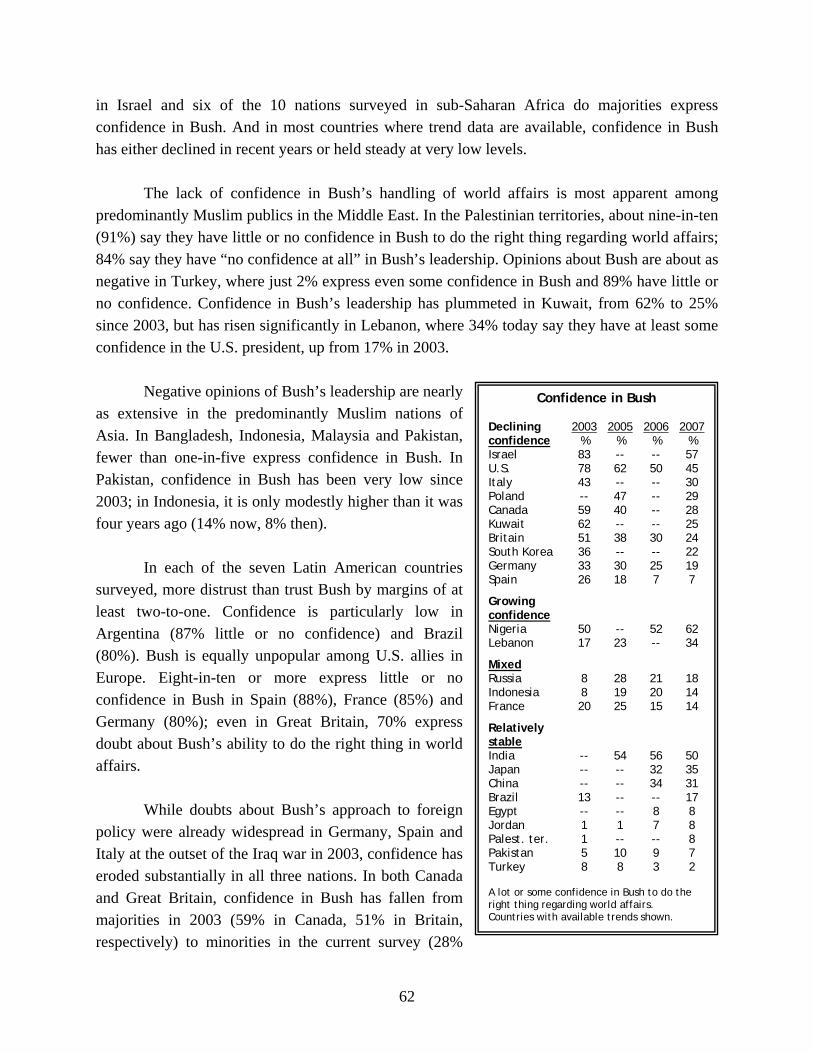
62
in Israel and six of the 10 nations surveyed in sub-Saharan Africa do majorities express confidence in Bush. And in most countries where trend data are available, confidence in Bush has either declined in recent years or held steady at very low levels.
The lack of confidence in Bush’s handling of world affairs is most apparent among predominantly Muslim publics in the Middle East. In the Palestinian territories, about nine-in-ten (91%) say they have little or no confidence in Bush to do the right thing regarding world affairs; 84% say they have “no confidence at all” in Bush’s leadership. Opinions about Bush are about as negative in Turkey, where just 2% express even some confidence in Bush and 89% have little or no confidence. Confidence in Bush’s leadership has plummeted in Kuwait, from 62% to 25% since 2003, but has risen significantly in Lebanon, where 34% today say they have at least some confidence in the U.S. president, up from 17% in 2003.
Negative opinions of Bush’s leadership are nearly
as extensive in the predominantly Muslim nations of Asia. In Bangladesh, Indonesia, Malaysia and Pakistan, fewer than one-in-five express confidence in Bush. In Pakistan, confidence in Bush has been very low since 2003; in Indonesia, it is only modestly higher than it was four years ago (14% now, 8% then).
In each of the seven Latin American countries
surveyed, more distrust than trust Bush by margins of at least two-to-one. Confidence is particularly low in Argentina (87% little or no confidence) and Brazil (80%). Bush is equally unpopular among U.S. allies in Europe. Eight-in-ten or more express little or no confidence in Bush in Spain (88%), France (85%) and Germany (80%); even in Great Britain, 70% express doubt about Bush’s ability to do the right thing in world affairs.
While doubts about Bush’s approach to foreign
policy were already widespread in Germany, Spain and Italy at the outset of the Iraq war in 2003, confidence has eroded substantially in all three nations. In both Canada and Great Britain, confidence in Bush has fallen from majorities in 2003 (59% in Canada, 51% in Britain, respectively) to minorities in the current survey (28%
Confidence in Bush Declining 2003 2005 2006 2007 confidence % % % % Israel 83 -- -- 57 U.S. 78 62 50 45 Italy 43 -- -- 30 Poland -- 47 -- 29 Canada 59 40 -- 28 Kuwait 62 -- -- 25 Britain 51 38 30 24 South Korea 36 -- -- 22 Germany 33 30 25 19 Spain 26 18 7 7
Growing confidence Nigeria 50 -- 52 62 Lebanon 17 23 -- 34
Mixed Russia 8 28 21 18 Indonesia 8 19 20 14 France 20 25 15 14
Relatively stable India -- 54 56 50 Japan -- -- 32 35 China -- -- 34 31 Brazil 13 -- -- 17 Egypt -- -- 8 8 Jordan 1 1 7 8 Palest. ter. 1 -- -- 8 Pakistan 5 10 9 7 Turkey 8 8 3 2 A lot or some confidence in Bush to do the right thing regarding world affairs. Countries with available trends shown.
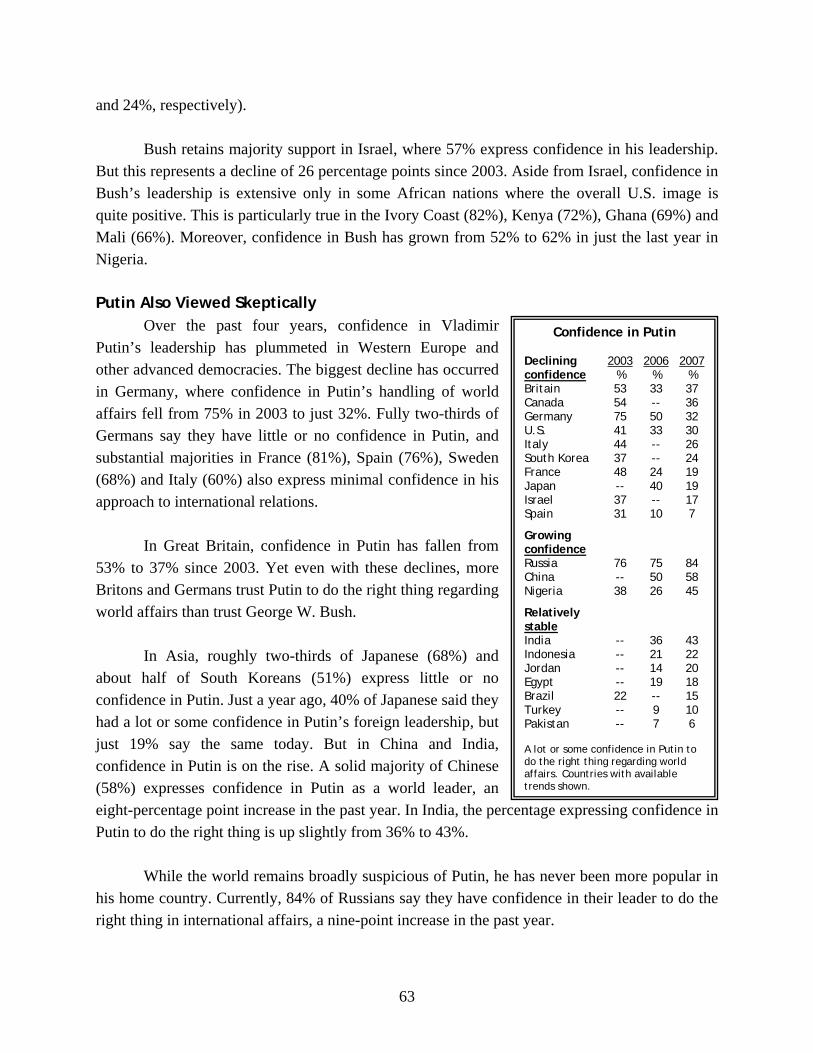
63
and 24%, respectively). Bush retains majority support in Israel, where 57% express confidence in his leadership.
But this represents a decline of 26 percentage points since 2003. Aside from Israel, confidence in Bush’s leadership is extensive only in some African nations where the overall U.S. image is quite positive. This is particularly true in the Ivory Coast (82%), Kenya (72%), Ghana (69%) and Mali (66%). Moreover, confidence in Bush has grown from 52% to 62% in just the last year in Nigeria.
Putin Also Viewed Skeptically
Over the past four years, confidence in Vladimir Putin’s leadership has plummeted in Western Europe and other advanced democracies. The biggest decline has occurred in Germany, where confidence in Putin’s handling of world affairs fell from 75% in 2003 to just 32%. Fully two-thirds of Germans say they have little or no confidence in Putin, and substantial majorities in France (81%), Spain (76%), Sweden (68%) and Italy (60%) also express minimal confidence in his approach to international relations.
In Great Britain, confidence in Putin has fallen from
53% to 37% since 2003. Yet even with these declines, more Britons and Germans trust Putin to do the right thing regarding world affairs than trust George W. Bush.
In Asia, roughly two-thirds of Japanese (68%) and
about half of South Koreans (51%) express little or no confidence in Putin. Just a year ago, 40% of Japanese said they had a lot or some confidence in Putin’s foreign leadership, but just 19% say the same today. But in China and India, confidence in Putin is on the rise. A solid majority of Chinese (58%) expresses confidence in Putin as a world leader, an eight-percentage point increase in the past year. In India, the percentage expressing confidence in Putin to do the right thing is up slightly from 36% to 43%.
While the world remains broadly suspicious of Putin, he has never been more popular in
his home country. Currently, 84% of Russians say they have confidence in their leader to do the right thing in international affairs, a nine-point increase in the past year.
Confidence in Putin Declining 2003 2006 2007 confidence % % % Britain 53 33 37 Canada 54 -- 36 Germany 75 50 32 U.S. 41 33 30 Italy 44 -- 26 South Korea 37 -- 24 France 48 24 19 Japan -- 40 19 Israel 37 -- 17 Spain 31 10 7
Growing confidence Russia 76 75 84 China -- 50 58 Nigeria 38 26 45
Relatively stable India -- 36 43 Indonesia -- 21 22 Jordan -- 14 20 Egypt -- 19 18 Brazil 22 -- 15 Turkey -- 9 10 Pakistan -- 7 6 A lot or some confidence in Putin to do the right thing regarding world affairs. Countries with available trends shown.
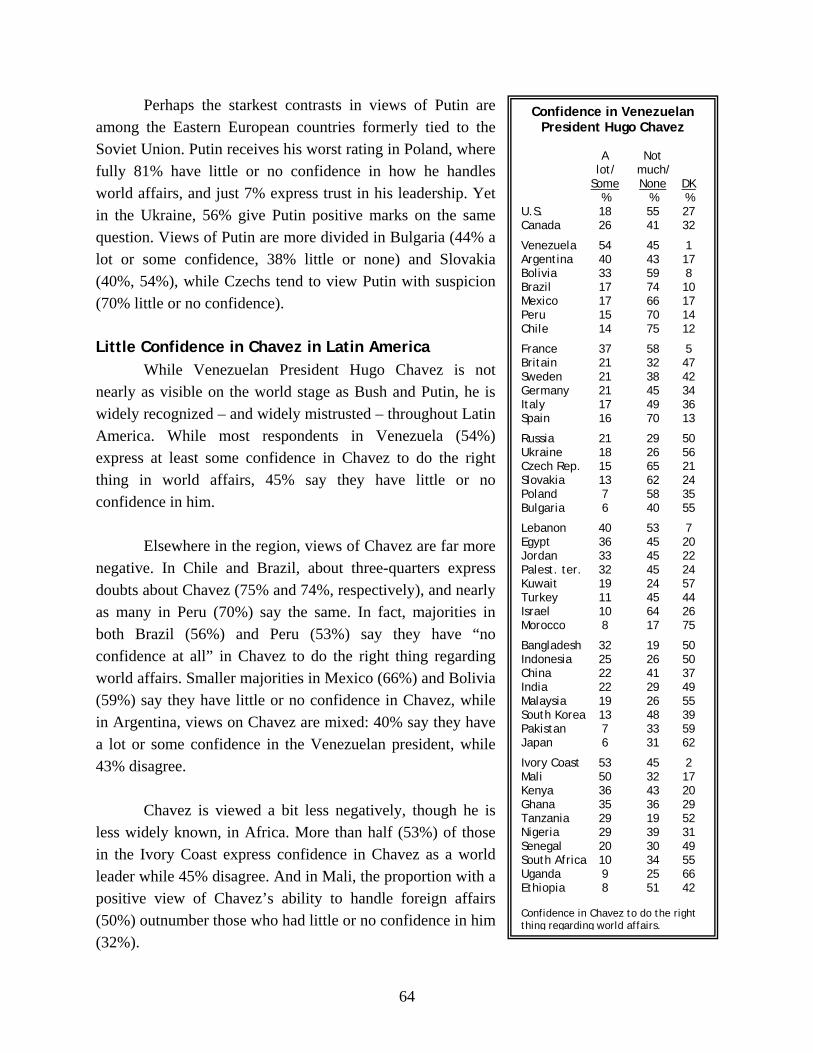
64
Perhaps the starkest contrasts in views of Putin are among the Eastern European countries formerly tied to the Soviet Union. Putin receives his worst rating in Poland, where fully 81% have little or no confidence in how he handles world affairs, and just 7% express trust in his leadership. Yet in the Ukraine, 56% give Putin positive marks on the same question. Views of Putin are more divided in Bulgaria (44% a lot or some confidence, 38% little or none) and Slovakia (40%, 54%), while Czechs tend to view Putin with suspicion (70% little or no confidence). Little Confidence in Chavez in Latin America While Venezuelan President Hugo Chavez is not nearly as visible on the world stage as Bush and Putin, he is widely recognized – and widely mistrusted – throughout Latin America. While most respondents in Venezuela (54%) express at least some confidence in Chavez to do the right thing in world affairs, 45% say they have little or no confidence in him. Elsewhere in the region, views of Chavez are far more negative. In Chile and Brazil, about three-quarters express doubts about Chavez (75% and 74%, respectively), and nearly as many in Peru (70%) say the same. In fact, majorities in both Brazil (56%) and Peru (53%) say they have “no confidence at all” in Chavez to do the right thing regarding world affairs. Smaller majorities in Mexico (66%) and Bolivia (59%) say they have little or no confidence in Chavez, while in Argentina, views on Chavez are mixed: 40% say they have a lot or some confidence in the Venezuelan president, while 43% disagree. Chavez is viewed a bit less negatively, though he is less widely known, in Africa. More than half (53%) of those in the Ivory Coast express confidence in Chavez as a world leader while 45% disagree. And in Mali, the proportion with a positive view of Chavez’s ability to handle foreign affairs (50%) outnumber those who had little or no confidence in him (32%).
Confidence in Venezuelan President Hugo Chavez
A Not lot/ much/ Some None DK % % % U.S. 18 55 27 Canada 26 41 32
Venezuela 54 45 1 Argentina 40 43 17 Bolivia 33 59 8 Brazil 17 74 10 Mexico 17 66 17 Peru 15 70 14 Chile 14 75 12
France 37 58 5 Britain 21 32 47 Sweden 21 38 42 Germany 21 45 34 Italy 17 49 36 Spain 16 70 13
Russia 21 29 50 Ukraine 18 26 56 Czech Rep. 15 65 21 Slovakia 13 62 24 Poland 7 58 35 Bulgaria 6 40 55
Lebanon 40 53 7 Egypt 36 45 20 Jordan 33 45 22 Palest. ter. 32 45 24 Kuwait 19 24 57 Turkey 11 45 44 Israel 10 64 26 Morocco 8 17 75
Bangladesh 32 19 50 Indonesia 25 26 50 China 22 41 37 India 22 29 49 Malaysia 19 26 55 South Korea 13 48 39 Pakistan 7 33 59 Japan 6 31 62
Ivory Coast 53 45 2 Mali 50 32 17 Kenya 36 43 20 Ghana 35 36 29 Tanzania 29 19 52 Nigeria 29 39 31 Senegal 20 30 49 South Africa 10 34 55 Uganda 9 25 66 Ethiopia 8 51 42 Confidence in Chavez to do the right thing regarding world affairs.
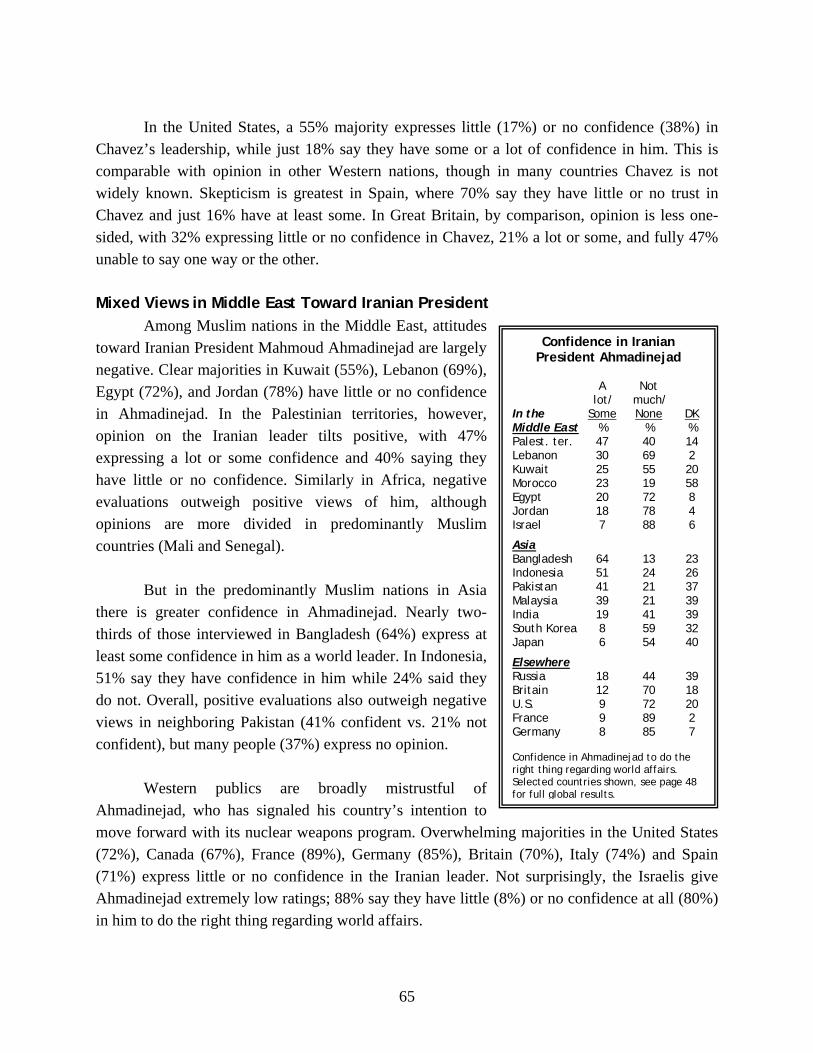
65
In the United States, a 55% majority expresses little (17%) or no confidence (38%) in Chavez’s leadership, while just 18% say they have some or a lot of confidence in him. This is comparable with opinion in other Western nations, though in many countries Chavez is not widely known. Skepticism is greatest in Spain, where 70% say they have little or no trust in Chavez and just 16% have at least some. In Great Britain, by comparison, opinion is less one-sided, with 32% expressing little or no confidence in Chavez, 21% a lot or some, and fully 47% unable to say one way or the other. Mixed Views in Middle East Toward Iranian President
Among Muslim nations in the Middle East, attitudes toward Iranian President Mahmoud Ahmadinejad are largely negative. Clear majorities in Kuwait (55%), Lebanon (69%), Egypt (72%), and Jordan (78%) have little or no confidence in Ahmadinejad. In the Palestinian territories, however, opinion on the Iranian leader tilts positive, with 47% expressing a lot or some confidence and 40% saying they have little or no confidence. Similarly in Africa, negative evaluations outweigh positive views of him, although opinions are more divided in predominantly Muslim countries (Mali and Senegal). But in the predominantly Muslim nations in Asia there is greater confidence in Ahmadinejad. Nearly two-thirds of those interviewed in Bangladesh (64%) express at least some confidence in him as a world leader. In Indonesia, 51% say they have confidence in him while 24% said they do not. Overall, positive evaluations also outweigh negative views in neighboring Pakistan (41% confident vs. 21% not confident), but many people (37%) express no opinion.
Western publics are broadly mistrustful of
Ahmadinejad, who has signaled his country’s intention to move forward with its nuclear weapons program. Overwhelming majorities in the United States (72%), Canada (67%), France (89%), Germany (85%), Britain (70%), Italy (74%) and Spain (71%) express little or no confidence in the Iranian leader. Not surprisingly, the Israelis give Ahmadinejad extremely low ratings; 88% say they have little (8%) or no confidence at all (80%) in him to do the right thing regarding world affairs.
Confidence in Iranian President Ahmadinejad
A Not lot/ much/ In the Some None DK Middle East % % % Palest. ter. 47 40 14 Lebanon 30 69 2 Kuwait 25 55 20 Morocco 23 19 58 Egypt 20 72 8 Jordan 18 78 4 Israel 7 88 6
Asia Bangladesh 64 13 23 Indonesia 51 24 26 Pakistan 41 21 37 Malaysia 39 21 39 India 19 41 39 South Korea 8 59 32 Japan 6 54 40
Elsewhere Russia 18 44 39 Britain 12 70 18 U.S. 9 72 20 France 9 89 2 Germany 8 85 7 Confidence in Ahmadinejad to do the right thing regarding world affairs. Selected countries shown, see page 48 for full global results.
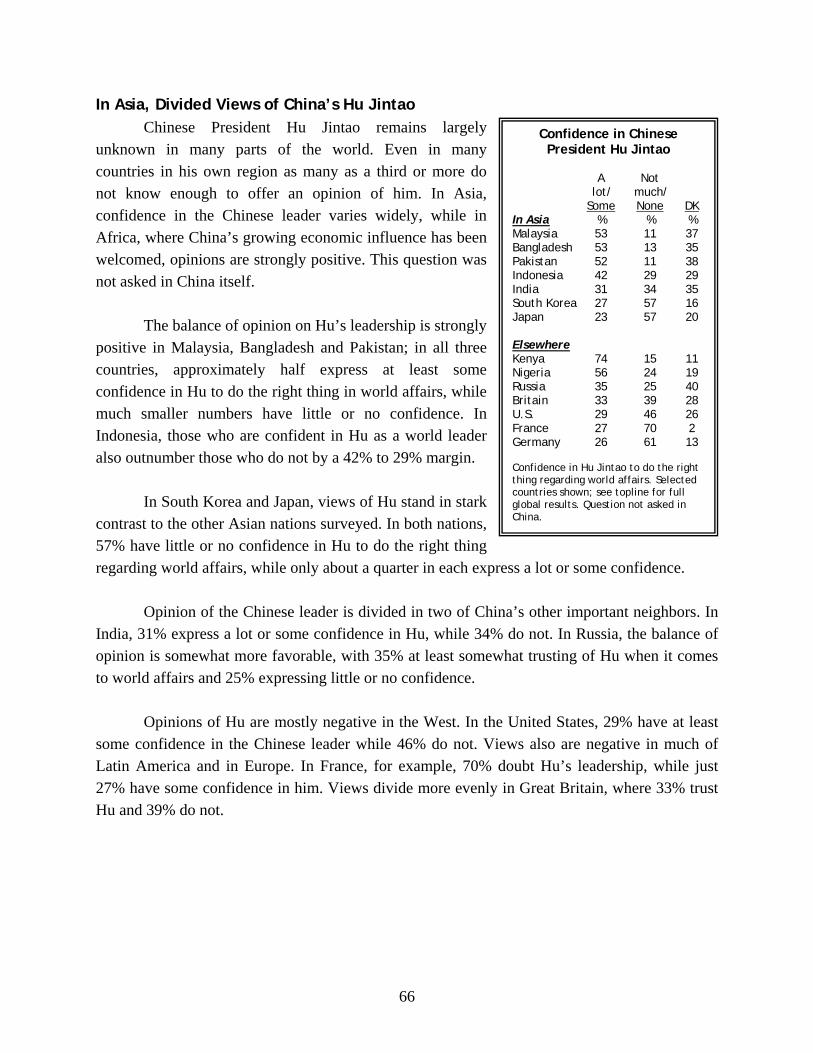
66
In Asia, Divided Views of China’s Hu Jintao Chinese President Hu Jintao remains largely unknown in many parts of the world. Even in many countries in his own region as many as a third or more do not know enough to offer an opinion of him. In Asia, confidence in the Chinese leader varies widely, while in Africa, where China’s growing economic influence has been welcomed, opinions are strongly positive. This question was not asked in China itself. The balance of opinion on Hu’s leadership is strongly positive in Malaysia, Bangladesh and Pakistan; in all three countries, approximately half express at least some confidence in Hu to do the right thing in world affairs, while much smaller numbers have little or no confidence. In Indonesia, those who are confident in Hu as a world leader also outnumber those who do not by a 42% to 29% margin. In South Korea and Japan, views of Hu stand in stark contrast to the other Asian nations surveyed. In both nations, 57% have little or no confidence in Hu to do the right thing regarding world affairs, while only about a quarter in each express a lot or some confidence. Opinion of the Chinese leader is divided in two of China’s other important neighbors. In India, 31% express a lot or some confidence in Hu, while 34% do not. In Russia, the balance of opinion is somewhat more favorable, with 35% at least somewhat trusting of Hu when it comes to world affairs and 25% expressing little or no confidence. Opinions of Hu are mostly negative in the West. In the United States, 29% have at least some confidence in the Chinese leader while 46% do not. Views also are negative in much of Latin America and in Europe. In France, for example, 70% doubt Hu’s leadership, while just 27% have some confidence in him. Views divide more evenly in Great Britain, where 33% trust Hu and 39% do not.
Confidence in Chinese President Hu Jintao
A Not lot/ much/ Some None DK In Asia % % % Malaysia 53 11 37 Bangladesh 53 13 35 Pakistan 52 11 38 Indonesia 42 29 29 India 31 34 35 South Korea 27 57 16 Japan 23 57 20 Elsewhere Kenya 74 15 11 Nigeria 56 24 19 Russia 35 25 40 Britain 33 39 28 U.S. 29 46 26 France 27 70 2 Germany 26 61 13 Confidence in Hu Jintao to do the right thing regarding world affairs. Selected countries shown; see topline for full global results. Question not asked in China.
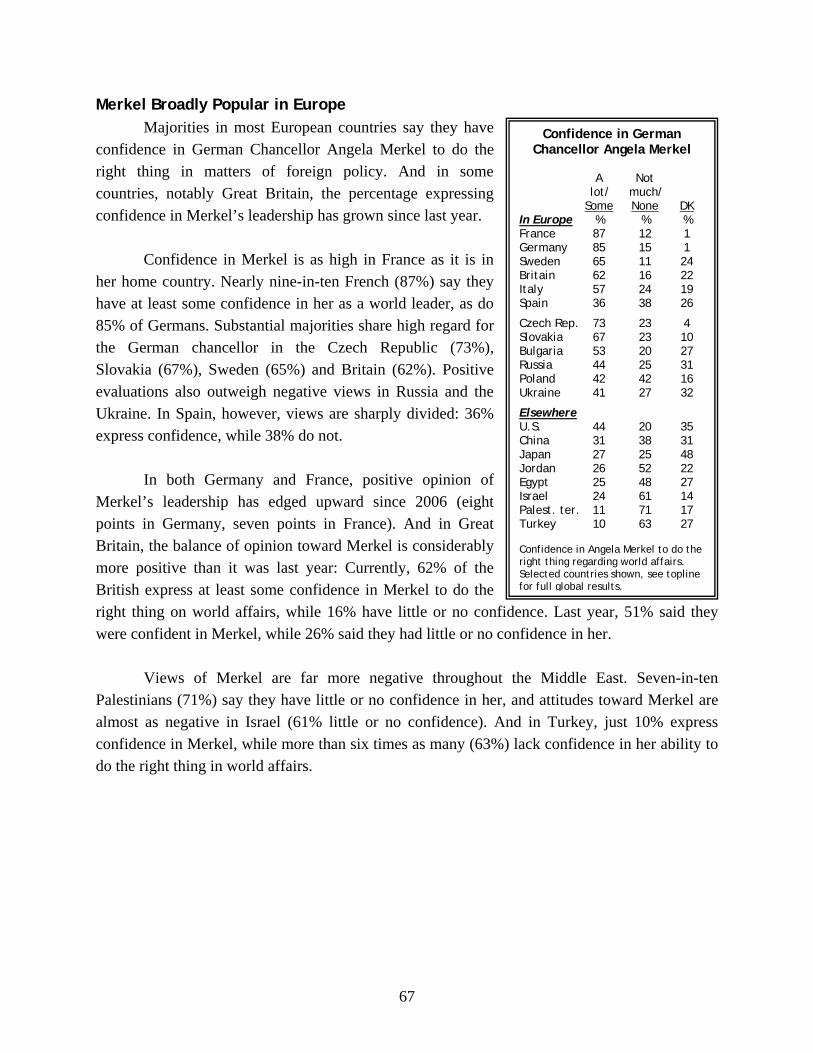
67
Merkel Broadly Popular in Europe Majorities in most European countries say they have
confidence in German Chancellor Angela Merkel to do the right thing in matters of foreign policy. And in some countries, notably Great Britain, the percentage expressing confidence in Merkel’s leadership has grown since last year.
Confidence in Merkel is as high in France as it is in her home country. Nearly nine-in-ten French (87%) say they have at least some confidence in her as a world leader, as do 85% of Germans. Substantial majorities share high regard for the German chancellor in the Czech Republic (73%), Slovakia (67%), Sweden (65%) and Britain (62%). Positive evaluations also outweigh negative views in Russia and the Ukraine. In Spain, however, views are sharply divided: 36% express confidence, while 38% do not.
In both Germany and France, positive opinion of
Merkel’s leadership has edged upward since 2006 (eight points in Germany, seven points in France). And in Great Britain, the balance of opinion toward Merkel is considerably more positive than it was last year: Currently, 62% of the British express at least some confidence in Merkel to do the right thing on world affairs, while 16% have little or no confidence. Last year, 51% said they were confident in Merkel, while 26% said they had little or no confidence in her. Views of Merkel are far more negative throughout the Middle East. Seven-in-ten Palestinians (71%) say they have little or no confidence in her, and attitudes toward Merkel are almost as negative in Israel (61% little or no confidence). And in Turkey, just 10% express confidence in Merkel, while more than six times as many (63%) lack confidence in her ability to do the right thing in world affairs.
Confidence in German Chancellor Angela Merkel
A Not lot/ much/ Some None DK In Europe % % % France 87 12 1 Germany 85 15 1 Sweden 65 11 24 Britain 62 16 22 Italy 57 24 19 Spain 36 38 26
Czech Rep. 73 23 4 Slovakia 67 23 10 Bulgaria 53 20 27 Russia 44 25 31 Poland 42 42 16 Ukraine 41 27 32
Elsewhere U.S. 44 20 35 China 31 38 31 Japan 27 25 48 Jordan 26 52 22 Egypt 25 48 27 Israel 24 61 14 Palest. ter. 11 71 17 Turkey 10 63 27 Confidence in Angela Merkel to do the right thing regarding world affairs. Selected countries shown, see topline for full global results.
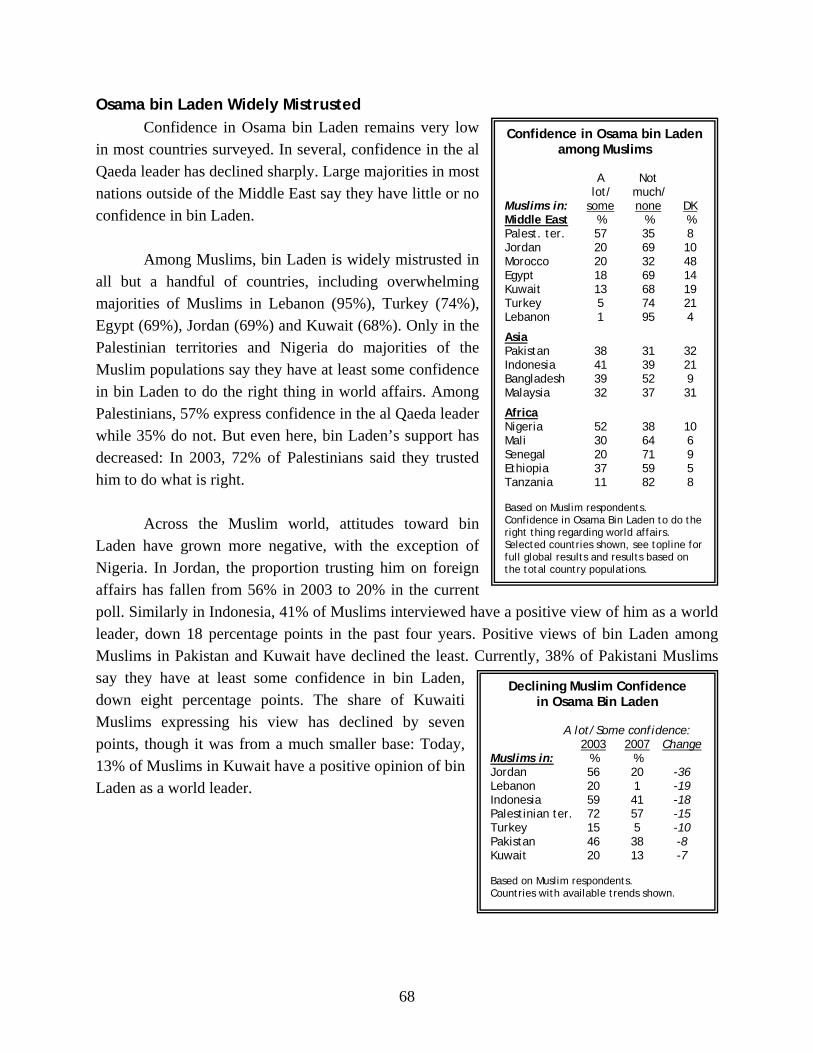
68
Osama bin Laden Widely Mistrusted Confidence in Osama bin Laden remains very low in most countries surveyed. In several, confidence in the al Qaeda leader has declined sharply. Large majorities in most nations outside of the Middle East say they have little or no confidence in bin Laden.
Among Muslims, bin Laden is widely mistrusted in all but a handful of countries, including overwhelming majorities of Muslims in Lebanon (95%), Turkey (74%), Egypt (69%), Jordan (69%) and Kuwait (68%). Only in the Palestinian territories and Nigeria do majorities of the Muslim populations say they have at least some confidence in bin Laden to do the right thing in world affairs. Among Palestinians, 57% express confidence in the al Qaeda leader while 35% do not. But even here, bin Laden’s support has decreased: In 2003, 72% of Palestinians said they trusted him to do what is right.
Across the Muslim world, attitudes toward bin Laden have grown more negative, with the exception of Nigeria. In Jordan, the proportion trusting him on foreign affairs has fallen from 56% in 2003 to 20% in the current poll. Similarly in Indonesia, 41% of Muslims interviewed have a positive view of him as a world leader, down 18 percentage points in the past four years. Positive views of bin Laden among Muslims in Pakistan and Kuwait have declined the least. Currently, 38% of Pakistani Muslims say they have at least some confidence in bin Laden, down eight percentage points. The share of Kuwaiti Muslims expressing his view has declined by seven points, though it was from a much smaller base: Today, 13% of Muslims in Kuwait have a positive opinion of bin Laden as a world leader.
Declining Muslim Confidence in Osama Bin Laden
A lot/Some confidence: 2003 2007 Change Muslims in: % % Jordan 56 20 -36 Lebanon 20 1 -19 Indonesia 59 41 -18 Palestinian ter. 72 57 -15 Turkey 15 5 -10 Pakistan 46 38 -8 Kuwait 20 13 -7 Based on Muslim respondents. Countries with available trends shown.
Confidence in Osama bin Laden among Muslims
A Not lot/ much/ Muslims in: some none DK Middle East % % % Palest. ter. 57 35 8 Jordan 20 69 10 Morocco 20 32 48 Egypt 18 69 14 Kuwait 13 68 19 Turkey 5 74 21 Lebanon 1 95 4
Asia Pakistan 38 31 32 Indonesia 41 39 21 Bangladesh 39 52 9 Malaysia 32 37 31
Africa Nigeria 52 38 10 Mali 30 64 6 Senegal 20 71 9 Ethiopia 37 59 5 Tanzania 11 82 8 Based on Muslim respondents. Confidence in Osama Bin Laden to do the right thing regarding world affairs. Selected countries shown, see topline for full global results and results based on the total country populations.
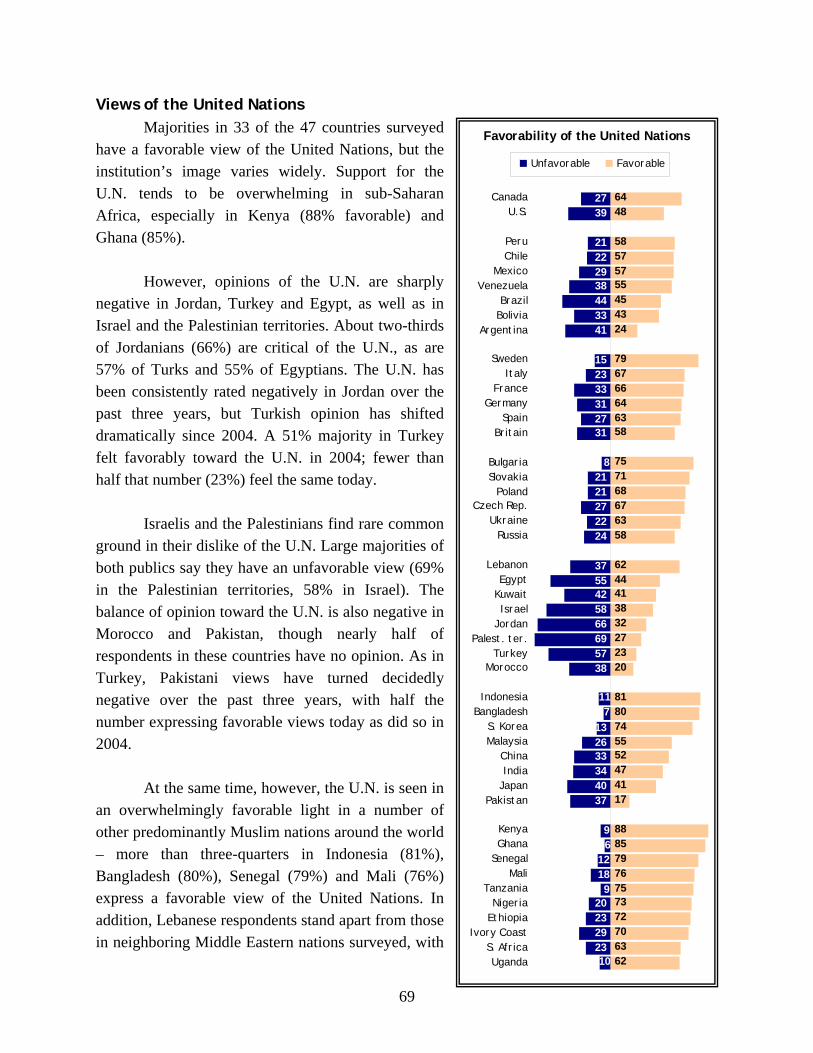
69
Views of the United Nations Majorities in 33 of the 47 countries surveyed
have a favorable view of the United Nations, but the institution’s image varies widely. Support for the U.N. tends to be overwhelming in sub-Saharan Africa, especially in Kenya (88% favorable) and Ghana (85%). However, opinions of the U.N. are sharply negative in Jordan, Turkey and Egypt, as well as in Israel and the Palestinian territories. About two-thirds of Jordanians (66%) are critical of the U.N., as are 57% of Turks and 55% of Egyptians. The U.N. has been consistently rated negatively in Jordan over the past three years, but Turkish opinion has shifted dramatically since 2004. A 51% majority in Turkey felt favorably toward the U.N. in 2004; fewer than half that number (23%) feel the same today. Israelis and the Palestinians find rare common ground in their dislike of the U.N. Large majorities of both publics say they have an unfavorable view (69% in the Palestinian territories, 58% in Israel). The balance of opinion toward the U.N. is also negative in Morocco and Pakistan, though nearly half of respondents in these countries have no opinion. As in Turkey, Pakistani views have turned decidedly negative over the past three years, with half the number expressing favorable views today as did so in 2004. At the same time, however, the U.N. is seen in an overwhelmingly favorable light in a number of other predominantly Muslim nations around the world – more than three-quarters in Indonesia (81%), Bangladesh (80%), Senegal (79%) and Mali (76%) express a favorable view of the United Nations. In addition, Lebanese respondents stand apart from those in neighboring Middle Eastern nations surveyed, with
2122
38
3341
152333312731
2121272224
3755425866695738
2633344037
20232923
43
79
75716867
62444138322723
8180745552474117
8885797675737270636210
9
6
13
8
1812
44
29
2739
117
9
20
5863
58
67
6364
4555
58
5757
6448
24
66
CanadaU.S.
PeruChile
MexicoVenezuela
BrazilBolivia
Argentina
SwedenItaly
FranceGermany
SpainBritain
BulgariaSlovakia
PolandCzech Rep.
UkraineRussia
LebanonEgypt
KuwaitIsrael
JordanPalest. ter.
TurkeyMorocco
IndonesiaBangladesh
S. KoreaMalaysia
ChinaIndia
JapanPakistan
KenyaGhana
SenegalMali
TanzaniaNigeria
Ethiopia Ivory Coast
S. AfricaUganda
Unfavorable Favorable
Favorability of the United Nations
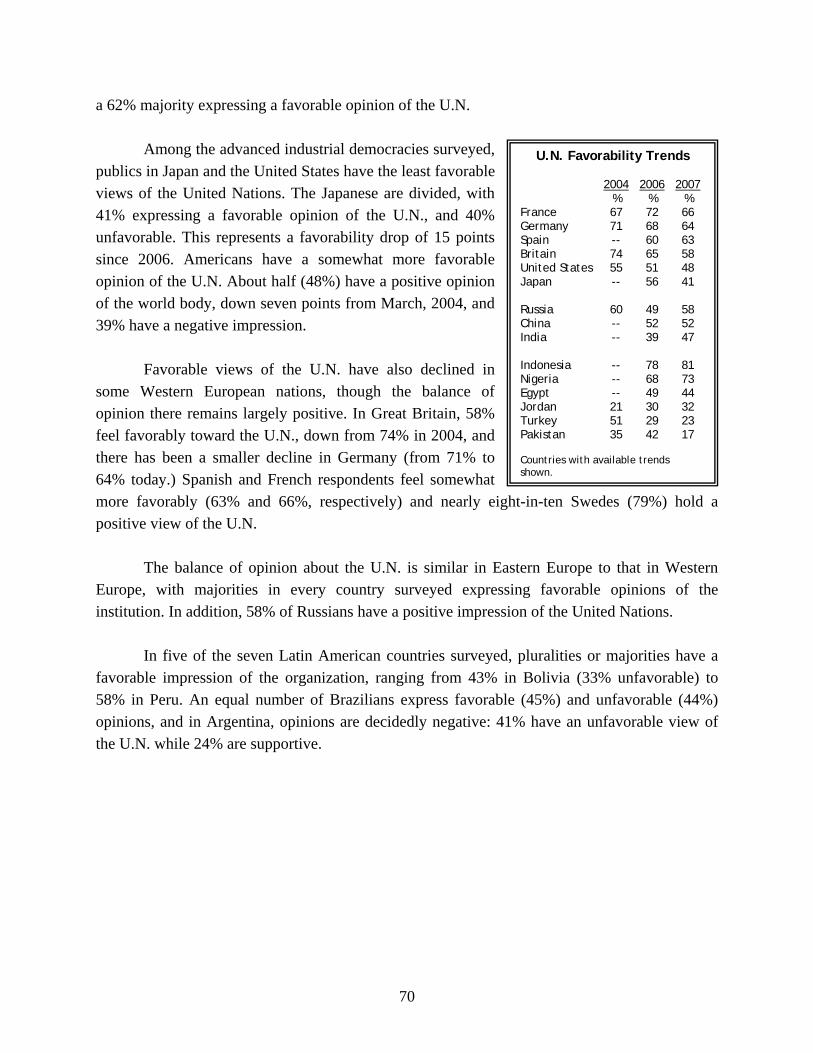
70
a 62% majority expressing a favorable opinion of the U.N. Among the advanced industrial democracies surveyed, publics in Japan and the United States have the least favorable views of the United Nations. The Japanese are divided, with 41% expressing a favorable opinion of the U.N., and 40% unfavorable. This represents a favorability drop of 15 points since 2006. Americans have a somewhat more favorable opinion of the U.N. About half (48%) have a positive opinion of the world body, down seven points from March, 2004, and 39% have a negative impression.
Favorable views of the U.N. have also declined in some Western European nations, though the balance of opinion there remains largely positive. In Great Britain, 58% feel favorably toward the U.N., down from 74% in 2004, and there has been a smaller decline in Germany (from 71% to 64% today.) Spanish and French respondents feel somewhat more favorably (63% and 66%, respectively) and nearly eight-in-ten Swedes (79%) hold a positive view of the U.N.
The balance of opinion about the U.N. is similar in Eastern Europe to that in Western
Europe, with majorities in every country surveyed expressing favorable opinions of the institution. In addition, 58% of Russians have a positive impression of the United Nations.
In five of the seven Latin American countries surveyed, pluralities or majorities have a
favorable impression of the organization, ranging from 43% in Bolivia (33% unfavorable) to 58% in Peru. An equal number of Brazilians express favorable (45%) and unfavorable (44%) opinions, and in Argentina, opinions are decidedly negative: 41% have an unfavorable view of the U.N. while 24% are supportive.
U.N. Favorability Trends 2004 2006 2007 % % % France 67 72 66 Germany 71 68 64 Spain -- 60 63 Britain 74 65 58 United States 55 51 48 Japan -- 56 41 Russia 60 49 58 China -- 52 52 India -- 39 47 Indonesia -- 78 81 Nigeria -- 68 73 Egypt -- 49 44 Jordan 21 30 32 Turkey 51 29 23 Pakistan 35 42 17 Countries with available trends shown.
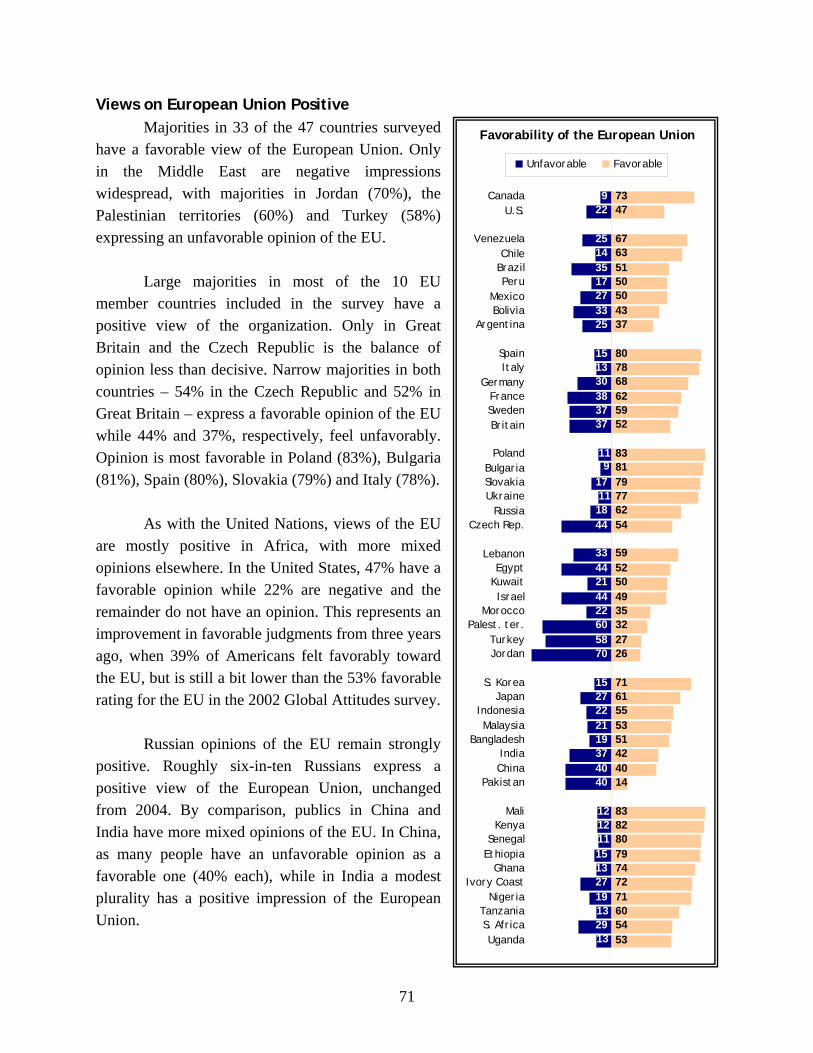
71
Views on European Union Positive Majorities in 33 of the 47 countries surveyed
have a favorable view of the European Union. Only in the Middle East are negative impressions widespread, with majorities in Jordan (70%), the Palestinian territories (60%) and Turkey (58%) expressing an unfavorable opinion of the EU.
Large majorities in most of the 10 EU
member countries included in the survey have a positive view of the organization. Only in Great Britain and the Czech Republic is the balance of opinion less than decisive. Narrow majorities in both countries – 54% in the Czech Republic and 52% in Great Britain – express a favorable opinion of the EU while 44% and 37%, respectively, feel unfavorably. Opinion is most favorable in Poland (83%), Bulgaria (81%), Spain (80%), Slovakia (79%) and Italy (78%).
As with the United Nations, views of the EU are mostly positive in Africa, with more mixed opinions elsewhere. In the United States, 47% have a favorable opinion while 22% are negative and the remainder do not have an opinion. This represents an improvement in favorable judgments from three years ago, when 39% of Americans felt favorably toward the EU, but is still a bit lower than the 53% favorable rating for the EU in the 2002 Global Attitudes survey. Russian opinions of the EU remain strongly positive. Roughly six-in-ten Russians express a positive view of the European Union, unchanged from 2004. By comparison, publics in China and India have more mixed opinions of the EU. In China, as many people have an unfavorable opinion as a favorable one (40% each), while in India a modest plurality has a positive impression of the European Union.
2514
17
3325
151330
3737
18
3344214422605870
222119374040
13
19
29
43
80
83817977
59525049353227
7161555351424014
8382807974727160545313
13
27
1212
9
11
38
17
44
11
1511
27
35
922
1527
26
5462
52
78
5962
5050
67
5163
7347
37
68
CanadaU.S.
VenezuelaChile
BrazilPeru
MexicoBolivia
Argentina
SpainItaly
GermanyFranceSwedenBritain
PolandBulgariaSlovakiaUkraine
RussiaCzech Rep.
LebanonEgypt
KuwaitIsrael
MoroccoPalest. ter.
TurkeyJordan
S. KoreaJapan
IndonesiaMalaysia
BangladeshIndiaChina
Pakistan
MaliKenya
SenegalEthiopia
GhanaIvory Coast
NigeriaTanzaniaS. AfricaUganda
Unfavorable Favorable
Favorability of the European Union
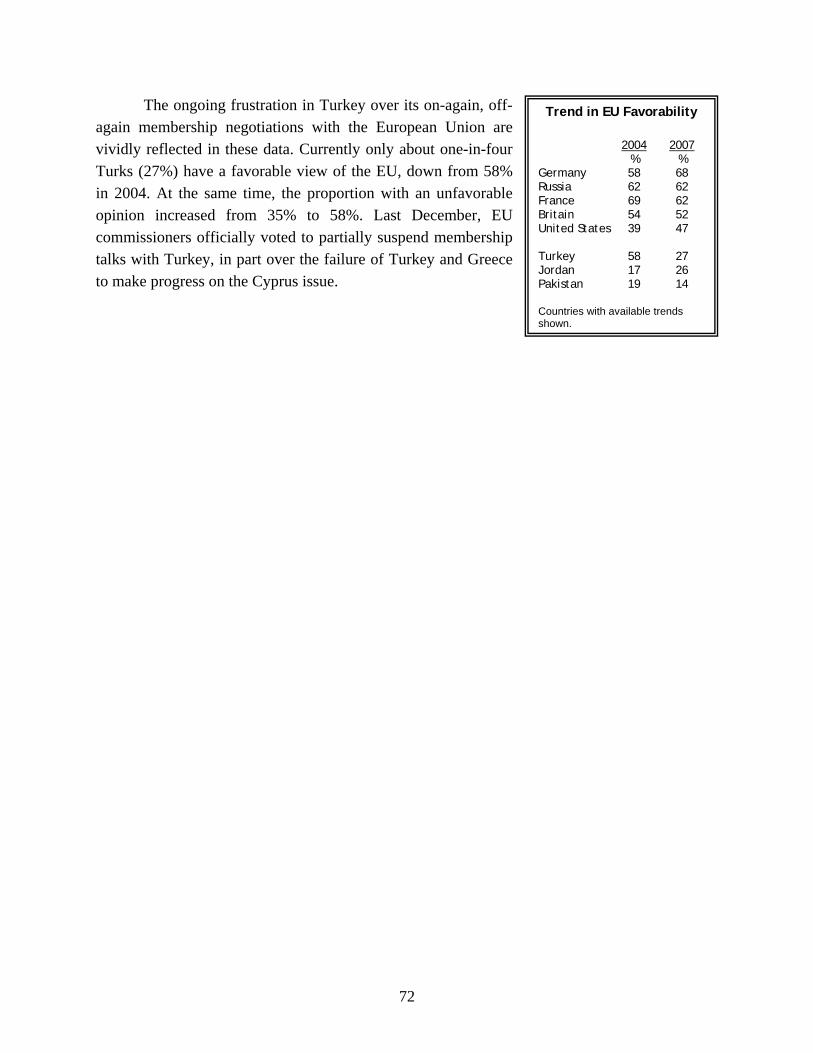
72
The ongoing frustration in Turkey over its on-again, off-again membership negotiations with the European Union are vividly reflected in these data. Currently only about one-in-four Turks (27%) have a favorable view of the EU, down from 58% in 2004. At the same time, the proportion with an unfavorable opinion increased from 35% to 58%. Last December, EU commissioners officially voted to partially suspend membership talks with Turkey, in part over the failure of Turkey and Greece to make progress on the Cyprus issue.
Trend in EU Favorability 2004 2007 % % Germany 58 68 Russia 62 62 France 69 62 Britain 54 52 United States 39 47 Turkey 58 27 Jordan 17 26 Pakistan 19 14 Countries with available trends shown.
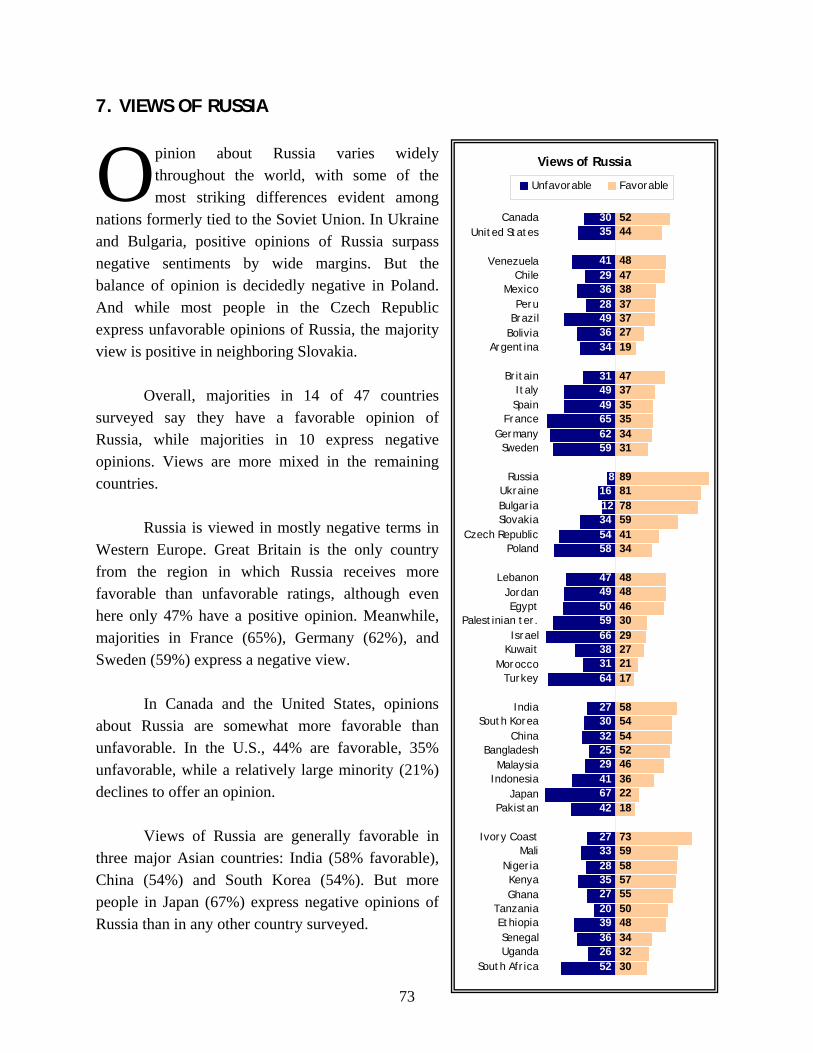
73
7. VIEWS OF RUSSIA
pinion about Russia varies widely throughout the world, with some of the most striking differences evident among
nations formerly tied to the Soviet Union. In Ukraine and Bulgaria, positive opinions of Russia surpass negative sentiments by wide margins. But the balance of opinion is decidedly negative in Poland. And while most people in the Czech Republic express unfavorable opinions of Russia, the majority view is positive in neighboring Slovakia.
Overall, majorities in 14 of 47 countries
surveyed say they have a favorable opinion of Russia, while majorities in 10 express negative opinions. Views are more mixed in the remaining countries.
Russia is viewed in mostly negative terms in Western Europe. Great Britain is the only country from the region in which Russia receives more favorable than unfavorable ratings, although even here only 47% have a positive opinion. Meanwhile, majorities in France (65%), Germany (62%), and Sweden (59%) express a negative view.
In Canada and the United States, opinions about Russia are somewhat more favorable than unfavorable. In the U.S., 44% are favorable, 35% unfavorable, while a relatively large minority (21%) declines to offer an opinion.
Views of Russia are generally favorable in three major Asian countries: India (58% favorable), China (54%) and South Korea (54%). But more people in Japan (67%) express negative opinions of Russia than in any other country surveyed.
O Views of Russia
3035
41293628493634
314949656259
16
345458
4749505966383164
2730322529416742
27332835272039362652
5244
4847
37372719
4737353534
898178594134
484846302927
5854545246362218
7359
57555048343230
8
12
58
31
1721
38
CanadaUnited States
VenezuelaChile
MexicoPeru
BrazilBolivia
Argentina
BritainItalySpain
FranceGermany
Sweden
RussiaUkraineBulgariaSlovakia
Czech RepublicPoland
LebanonJordanEgypt
Palestinian ter.Israel
KuwaitMorocco
Turkey
IndiaSouth Korea
ChinaBangladesh
MalaysiaIndonesia
JapanPakistan
Ivory CoastMali
NigeriaKenyaGhana
TanzaniaEthiopiaSenegalUganda
South Africa
Unfavorable Favorable
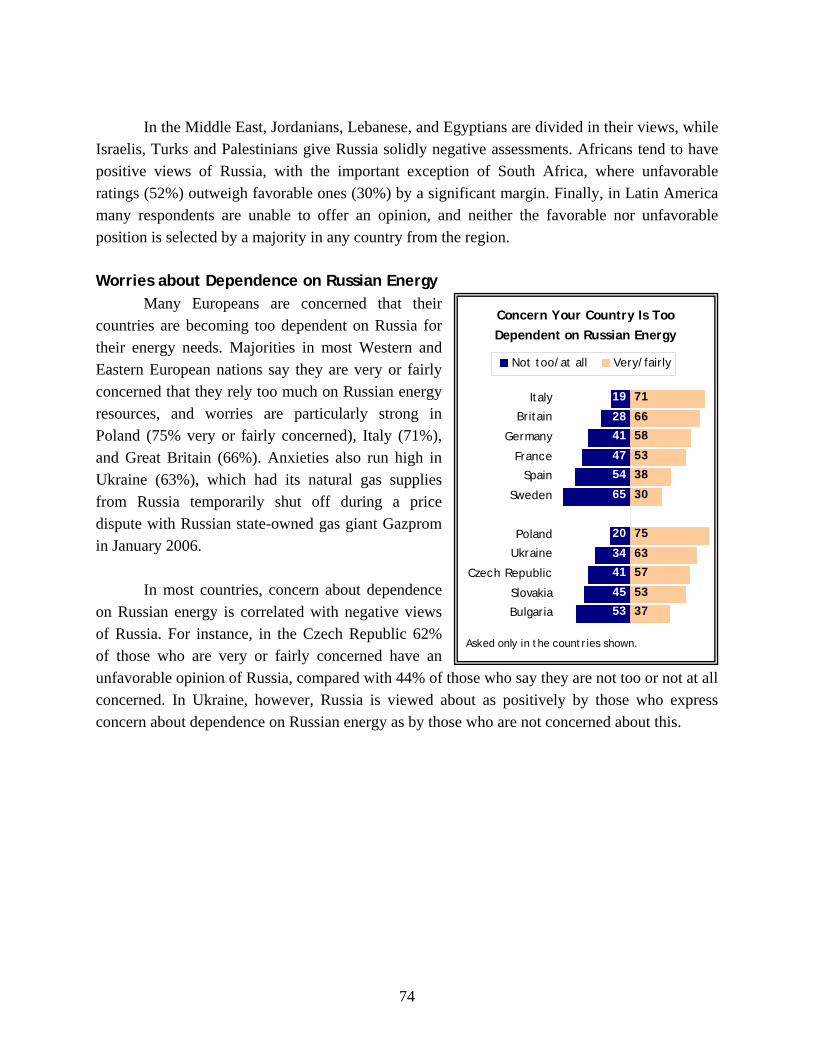
74
In the Middle East, Jordanians, Lebanese, and Egyptians are divided in their views, while
Israelis, Turks and Palestinians give Russia solidly negative assessments. Africans tend to have positive views of Russia, with the important exception of South Africa, where unfavorable ratings (52%) outweigh favorable ones (30%) by a significant margin. Finally, in Latin America many respondents are unable to offer an opinion, and neither the favorable nor unfavorable position is selected by a majority in any country from the region.
Worries about Dependence on Russian Energy Many Europeans are concerned that their countries are becoming too dependent on Russia for their energy needs. Majorities in most Western and Eastern European nations say they are very or fairly concerned that they rely too much on Russian energy resources, and worries are particularly strong in Poland (75% very or fairly concerned), Italy (71%), and Great Britain (66%). Anxieties also run high in Ukraine (63%), which had its natural gas supplies from Russia temporarily shut off during a price dispute with Russian state-owned gas giant Gazprom in January 2006. In most countries, concern about dependence on Russian energy is correlated with negative views of Russia. For instance, in the Czech Republic 62% of those who are very or fairly concerned have an unfavorable opinion of Russia, compared with 44% of those who say they are not too or not at all concerned. In Ukraine, however, Russia is viewed about as positively by those who express concern about dependence on Russian energy as by those who are not concerned about this.
Concern Your Country Is Too Dependent on Russian Energy
19
28
41
47
54
65
20
34
45
53
71
66
53
38
75
63
57
53
37
41
30
58
Italy
Britain
Germany
France
Spain
Sweden
Poland
Ukraine
Czech Republic
Slovakia
Bulgaria
Not too/at all Very/fairly
Asked only in the countries shown.
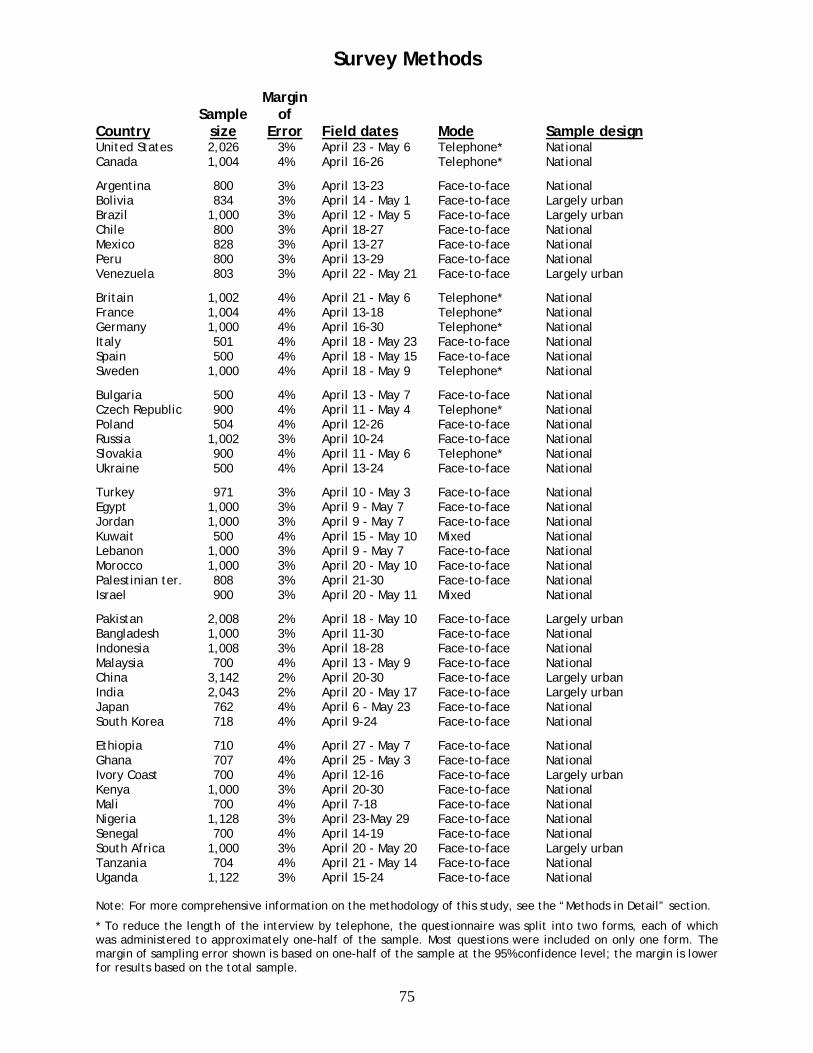
75
Survey Methods
Country
Sample size
Margin of
Error Field dates Mode
Sample design
United States 2,026 3% April 23 - May 6 Telephone* National Canada 1,004 4% April 16-26 Telephone* National
Argentina 800 3% April 13-23 Face-to-face National Bolivia 834 3% April 14 - May 1 Face-to-face Largely urban Brazil 1,000 3% April 12 - May 5 Face-to-face Largely urban Chile 800 3% April 18-27 Face-to-face National Mexico 828 3% April 13-27 Face-to-face National Peru 800 3% April 13-29 Face-to-face National Venezuela 803 3% April 22 - May 21 Face-to-face Largely urban
Britain 1,002 4% April 21 - May 6 Telephone* National France 1,004 4% April 13-18 Telephone* National Germany 1,000 4% April 16-30 Telephone* National Italy 501 4% April 18 - May 23 Face-to-face National Spain 500 4% April 18 - May 15 Face-to-face National Sweden 1,000 4% April 18 - May 9 Telephone* National
Bulgaria 500 4% April 13 - May 7 Face-to-face National Czech Republic 900 4% April 11 - May 4 Telephone* National Poland 504 4% April 12-26 Face-to-face National Russia 1,002 3% April 10-24 Face-to-face National Slovakia 900 4% April 11 - May 6 Telephone* National Ukraine 500 4% April 13-24 Face-to-face National
Turkey 971 3% April 10 - May 3 Face-to-face National Egypt 1,000 3% April 9 - May 7 Face-to-face National Jordan 1,000 3% April 9 - May 7 Face-to-face National Kuwait 500 4% April 15 - May 10 Mixed National Lebanon 1,000 3% April 9 - May 7 Face-to-face National Morocco 1,000 3% April 20 - May 10 Face-to-face National Palestinian ter. 808 3% April 21-30 Face-to-face National Israel 900 3% April 20 - May 11 Mixed National
Pakistan 2,008 2% April 18 - May 10 Face-to-face Largely urban Bangladesh 1,000 3% April 11-30 Face-to-face National Indonesia 1,008 3% April 18-28 Face-to-face National Malaysia 700 4% April 13 - May 9 Face-to-face National China 3,142 2% April 20-30 Face-to-face Largely urban India 2,043 2% April 20 - May 17 Face-to-face Largely urban Japan 762 4% April 6 - May 23 Face-to-face National South Korea 718 4% April 9-24 Face-to-face National
Ethiopia 710 4% April 27 - May 7 Face-to-face National Ghana 707 4% April 25 - May 3 Face-to-face National Ivory Coast 700 4% April 12-16 Face-to-face Largely urban Kenya 1,000 3% April 20-30 Face-to-face National Mali 700 4% April 7-18 Face-to-face National Nigeria 1,128 3% April 23-May 29 Face-to-face National Senegal 700 4% April 14-19 Face-to-face National South Africa 1,000 3% April 20 - May 20 Face-to-face Largely urban Tanzania 704 4% April 21 - May 14 Face-to-face National Uganda 1,122 3% April 15-24 Face-to-face National Note: For more comprehensive information on the methodology of this study, see the “Methods in Detail” section.
* To reduce the length of the interview by telephone, the questionnaire was split into two forms, each of which was administered to approximately one-half of the sample. Most questions were included on only one form. The margin of sampling error shown is based on one-half of the sample at the 95% confidence level; the margin is lower for results based on the total sample.
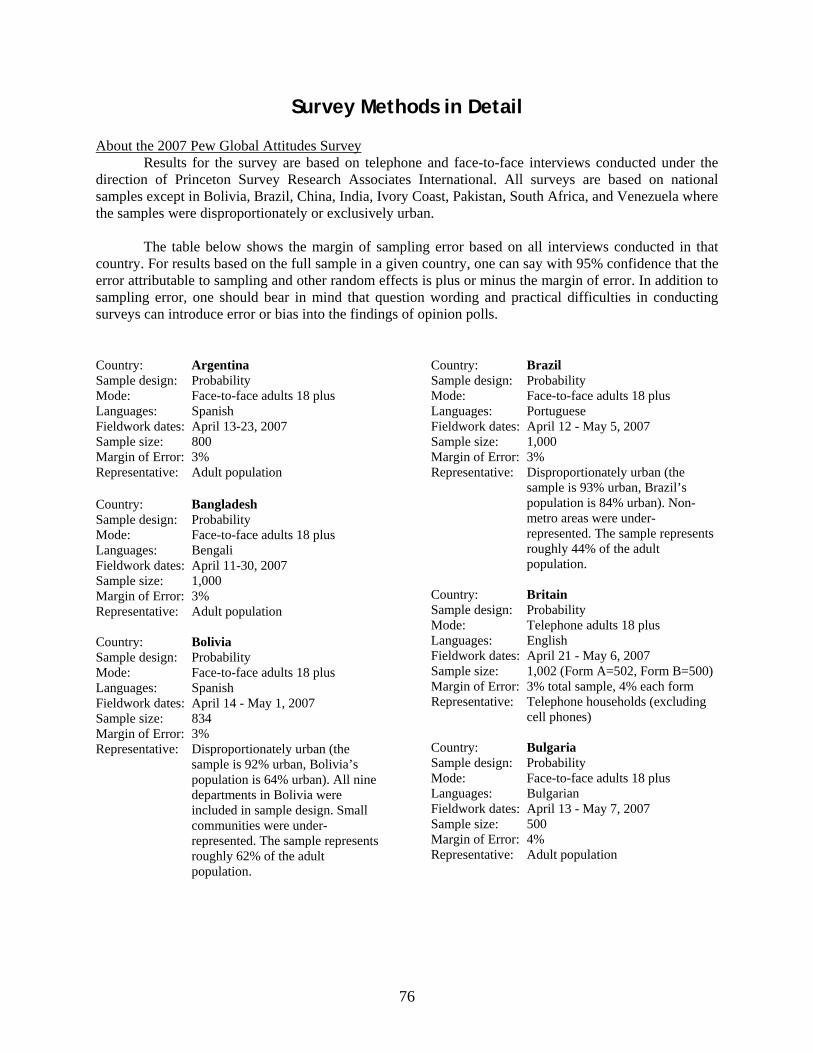
76
Survey Methods in Detail About the 2007 Pew Global Attitudes Survey Results for the survey are based on telephone and face-to-face interviews conducted under the direction of Princeton Survey Research Associates International. All surveys are based on national samples except in Bolivia, Brazil, China, India, Ivory Coast, Pakistan, South Africa, and Venezuela where the samples were disproportionately or exclusively urban. The table below shows the margin of sampling error based on all interviews conducted in that country. For results based on the full sample in a given country, one can say with 95% confidence that the error attributable to sampling and other random effects is plus or minus the margin of error. In addition to sampling error, one should bear in mind that question wording and practical difficulties in conducting surveys can introduce error or bias into the findings of opinion polls. Country: Argentina Sample design: Probability Mode: Face-to-face adults 18 plus Languages: Spanish Fieldwork dates: April 13-23, 2007 Sample size: 800 Margin of Error: 3% Representative: Adult population Country: Bangladesh Sample design: Probability Mode: Face-to-face adults 18 plus Languages: Bengali Fieldwork dates: April 11-30, 2007 Sample size: 1,000 Margin of Error: 3% Representative: Adult population Country: Bolivia Sample design: Probability Mode: Face-to-face adults 18 plus Languages: Spanish Fieldwork dates: April 14 - May 1, 2007 Sample size: 834 Margin of Error: 3% Representative: Disproportionately urban (the
sample is 92% urban, Bolivia’s population is 64% urban). All nine departments in Bolivia were included in sample design. Small communities were under-represented. The sample represents roughly 62% of the adult population.
Country: Brazil Sample design: Probability Mode: Face-to-face adults 18 plus Languages: Portuguese Fieldwork dates: April 12 - May 5, 2007 Sample size: 1,000 Margin of Error: 3% Representative: Disproportionately urban (the
sample is 93% urban, Brazil’s population is 84% urban). Non-metro areas were under-represented. The sample represents roughly 44% of the adult population.
Country: Britain Sample design: Probability Mode: Telephone adults 18 plus Languages: English Fieldwork dates: April 21 - May 6, 2007 Sample size: 1,002 (Form A=502, Form B=500) Margin of Error: 3% total sample, 4% each form Representative: Telephone households (excluding
cell phones) Country: Bulgaria Sample design: Probability Mode: Face-to-face adults 18 plus Languages: Bulgarian Fieldwork dates: April 13 - May 7, 2007 Sample size: 500 Margin of Error: 4% Representative: Adult population
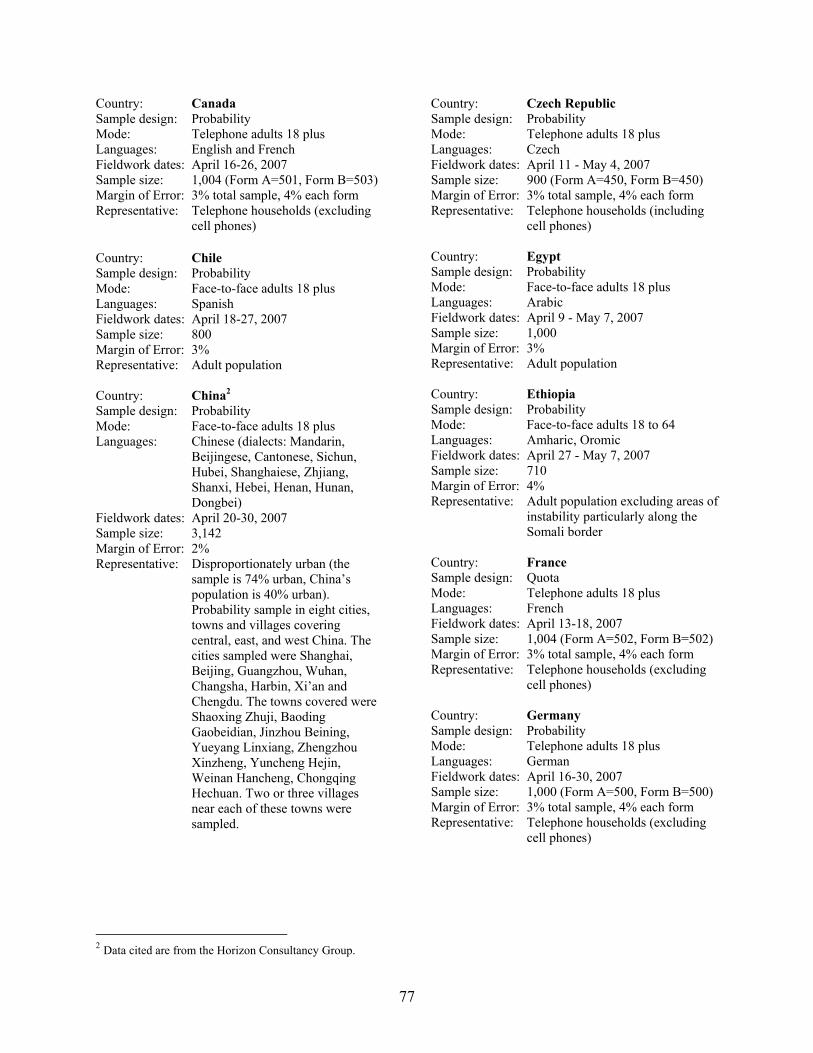
77
Country: Canada Sample design: Probability Mode: Telephone adults 18 plus Languages: English and French Fieldwork dates: April 16-26, 2007 Sample size: 1,004 (Form A=501, Form B=503) Margin of Error: 3% total sample, 4% each form Representative: Telephone households (excluding
cell phones) Country: Chile Sample design: Probability Mode: Face-to-face adults 18 plus Languages: Spanish Fieldwork dates: April 18-27, 2007 Sample size: 800 Margin of Error: 3% Representative: Adult population Country: China2 Sample design: Probability Mode: Face-to-face adults 18 plus Languages: Chinese (dialects: Mandarin,
Beijingese, Cantonese, Sichun, Hubei, Shanghaiese, Zhjiang, Shanxi, Hebei, Henan, Hunan, Dongbei)
Fieldwork dates: April 20-30, 2007 Sample size: 3,142 Margin of Error: 2% Representative: Disproportionately urban (the
sample is 74% urban, China’s population is 40% urban). Probability sample in eight cities, towns and villages covering central, east, and west China. The cities sampled were Shanghai, Beijing, Guangzhou, Wuhan, Changsha, Harbin, Xi’an and Chengdu. The towns covered were Shaoxing Zhuji, Baoding Gaobeidian, Jinzhou Beining, Yueyang Linxiang, Zhengzhou Xinzheng, Yuncheng Hejin, Weinan Hancheng, Chongqing Hechuan. Two or three villages near each of these towns were sampled.
2 Data cited are from the Horizon Consultancy Group.
Country: Czech Republic Sample design: Probability Mode: Telephone adults 18 plus Languages: Czech Fieldwork dates: April 11 - May 4, 2007 Sample size: 900 (Form A=450, Form B=450) Margin of Error: 3% total sample, 4% each form Representative: Telephone households (including
cell phones) Country: Egypt Sample design: Probability Mode: Face-to-face adults 18 plus Languages: Arabic Fieldwork dates: April 9 - May 7, 2007 Sample size: 1,000 Margin of Error: 3% Representative: Adult population Country: Ethiopia Sample design: Probability Mode: Face-to-face adults 18 to 64 Languages: Amharic, Oromic Fieldwork dates: April 27 - May 7, 2007 Sample size: 710 Margin of Error: 4% Representative: Adult population excluding areas of
instability particularly along the Somali border
Country: France Sample design: Quota Mode: Telephone adults 18 plus Languages: French Fieldwork dates: April 13-18, 2007 Sample size: 1,004 (Form A=502, Form B=502) Margin of Error: 3% total sample, 4% each form Representative: Telephone households (excluding
cell phones) Country: Germany Sample design: Probability Mode: Telephone adults 18 plus Languages: German Fieldwork dates: April 16-30, 2007 Sample size: 1,000 (Form A=500, Form B=500) Margin of Error: 3% total sample, 4% each form Representative: Telephone households (excluding
cell phones)
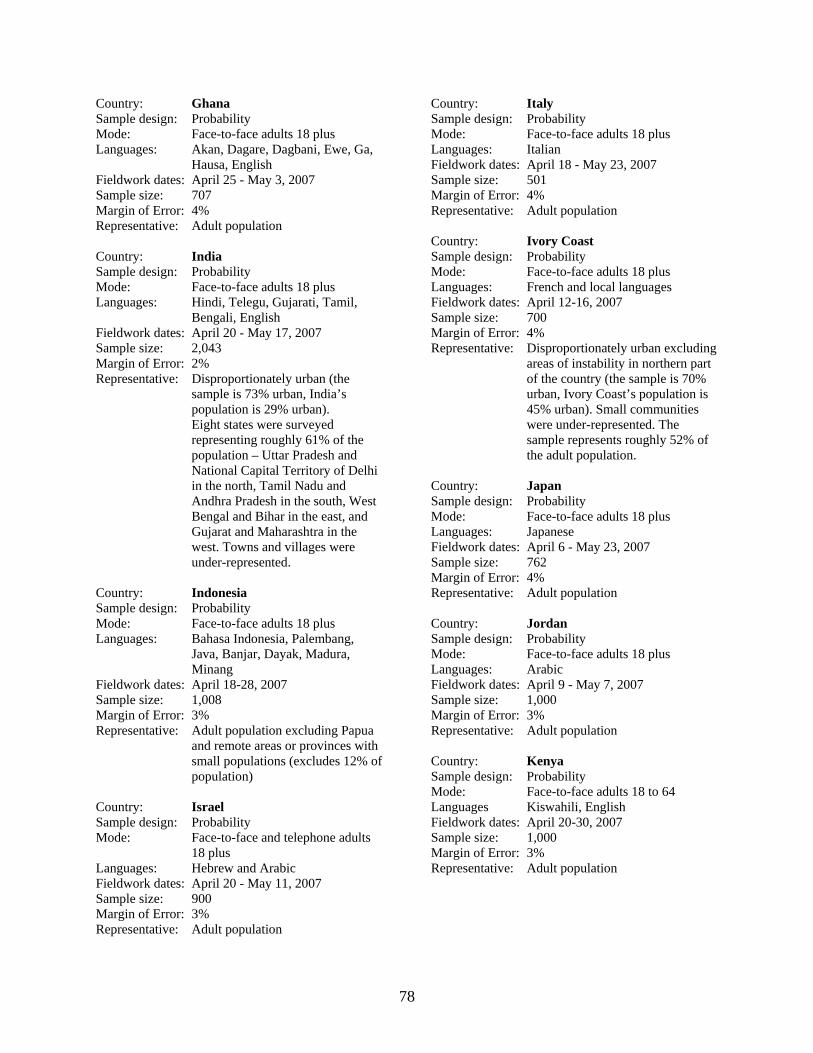
78
Country: Ghana Sample design: Probability Mode: Face-to-face adults 18 plus Languages: Akan, Dagare, Dagbani, Ewe, Ga,
Hausa, English Fieldwork dates: April 25 - May 3, 2007 Sample size: 707 Margin of Error: 4% Representative: Adult population Country: India Sample design: Probability Mode: Face-to-face adults 18 plus Languages: Hindi, Telegu, Gujarati, Tamil,
Bengali, English Fieldwork dates: April 20 - May 17, 2007 Sample size: 2,043 Margin of Error: 2% Representative: Disproportionately urban (the
sample is 73% urban, India’s population is 29% urban). Eight states were surveyed representing roughly 61% of the population – Uttar Pradesh and National Capital Territory of Delhi in the north, Tamil Nadu and Andhra Pradesh in the south, West Bengal and Bihar in the east, and Gujarat and Maharashtra in the west. Towns and villages were under-represented.
Country: Indonesia Sample design: Probability Mode: Face-to-face adults 18 plus Languages: Bahasa Indonesia, Palembang,
Java, Banjar, Dayak, Madura, Minang
Fieldwork dates: April 18-28, 2007 Sample size: 1,008 Margin of Error: 3% Representative: Adult population excluding Papua
and remote areas or provinces with small populations (excludes 12% of population)
Country: Israel Sample design: Probability Mode: Face-to-face and telephone adults
18 plus Languages: Hebrew and Arabic Fieldwork dates: April 20 - May 11, 2007 Sample size: 900 Margin of Error: 3% Representative: Adult population
Country: Italy Sample design: Probability Mode: Face-to-face adults 18 plus Languages: Italian Fieldwork dates: April 18 - May 23, 2007 Sample size: 501 Margin of Error: 4% Representative: Adult population Country: Ivory Coast Sample design: Probability Mode: Face-to-face adults 18 plus Languages: French and local languages Fieldwork dates: April 12-16, 2007 Sample size: 700 Margin of Error: 4% Representative: Disproportionately urban excluding
areas of instability in northern part of the country (the sample is 70% urban, Ivory Coast’s population is 45% urban). Small communities were under-represented. The sample represents roughly 52% of the adult population.
Country: Japan Sample design: Probability Mode: Face-to-face adults 18 plus Languages: Japanese Fieldwork dates: April 6 - May 23, 2007 Sample size: 762 Margin of Error: 4% Representative: Adult population Country: Jordan Sample design: Probability Mode: Face-to-face adults 18 plus Languages: Arabic Fieldwork dates: April 9 - May 7, 2007 Sample size: 1,000 Margin of Error: 3% Representative: Adult population Country: Kenya Sample design: Probability Mode: Face-to-face adults 18 to 64 Languages Kiswahili, English Fieldwork dates: April 20-30, 2007 Sample size: 1,000 Margin of Error: 3% Representative: Adult population
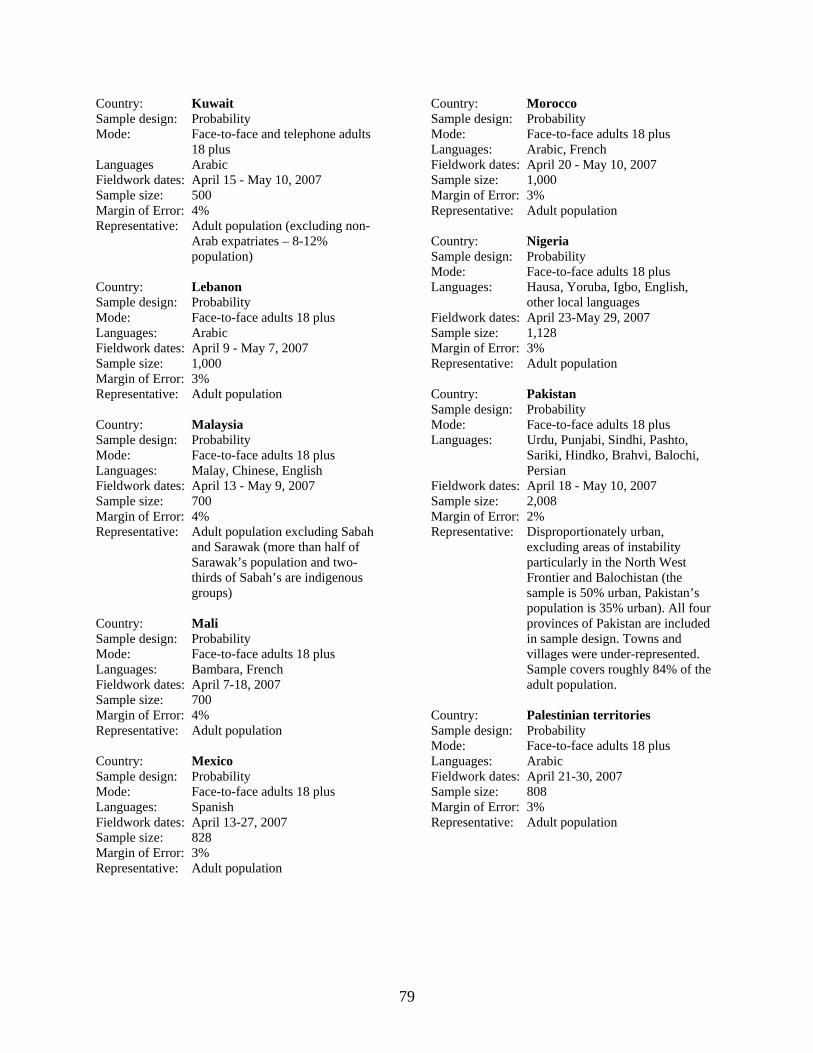
79
Country: Kuwait Sample design: Probability Mode: Face-to-face and telephone adults
18 plus Languages Arabic Fieldwork dates: April 15 - May 10, 2007 Sample size: 500 Margin of Error: 4% Representative: Adult population (excluding non-
Arab expatriates – 8-12% population)
Country: Lebanon Sample design: Probability Mode: Face-to-face adults 18 plus Languages: Arabic Fieldwork dates: April 9 - May 7, 2007 Sample size: 1,000 Margin of Error: 3% Representative: Adult population Country: Malaysia Sample design: Probability Mode: Face-to-face adults 18 plus Languages: Malay, Chinese, English Fieldwork dates: April 13 - May 9, 2007 Sample size: 700 Margin of Error: 4% Representative: Adult population excluding Sabah
and Sarawak (more than half of Sarawak’s population and two-thirds of Sabah’s are indigenous groups)
Country: Mali Sample design: Probability Mode: Face-to-face adults 18 plus Languages: Bambara, French Fieldwork dates: April 7-18, 2007 Sample size: 700 Margin of Error: 4% Representative: Adult population Country: Mexico Sample design: Probability Mode: Face-to-face adults 18 plus Languages: Spanish Fieldwork dates: April 13-27, 2007 Sample size: 828 Margin of Error: 3% Representative: Adult population
Country: Morocco Sample design: Probability Mode: Face-to-face adults 18 plus Languages: Arabic, French Fieldwork dates: April 20 - May 10, 2007 Sample size: 1,000 Margin of Error: 3% Representative: Adult population Country: Nigeria Sample design: Probability Mode: Face-to-face adults 18 plus Languages: Hausa, Yoruba, Igbo, English,
other local languages Fieldwork dates: April 23-May 29, 2007 Sample size: 1,128 Margin of Error: 3% Representative: Adult population Country: Pakistan Sample design: Probability Mode: Face-to-face adults 18 plus Languages: Urdu, Punjabi, Sindhi, Pashto,
Sariki, Hindko, Brahvi, Balochi, Persian
Fieldwork dates: April 18 - May 10, 2007 Sample size: 2,008 Margin of Error: 2% Representative: Disproportionately urban,
excluding areas of instability particularly in the North West Frontier and Balochistan (the sample is 50% urban, Pakistan’s population is 35% urban). All four provinces of Pakistan are included in sample design. Towns and villages were under-represented. Sample covers roughly 84% of the adult population.
Country: Palestinian territories Sample design: Probability Mode: Face-to-face adults 18 plus Languages: Arabic Fieldwork dates: April 21-30, 2007 Sample size: 808 Margin of Error: 3% Representative: Adult population
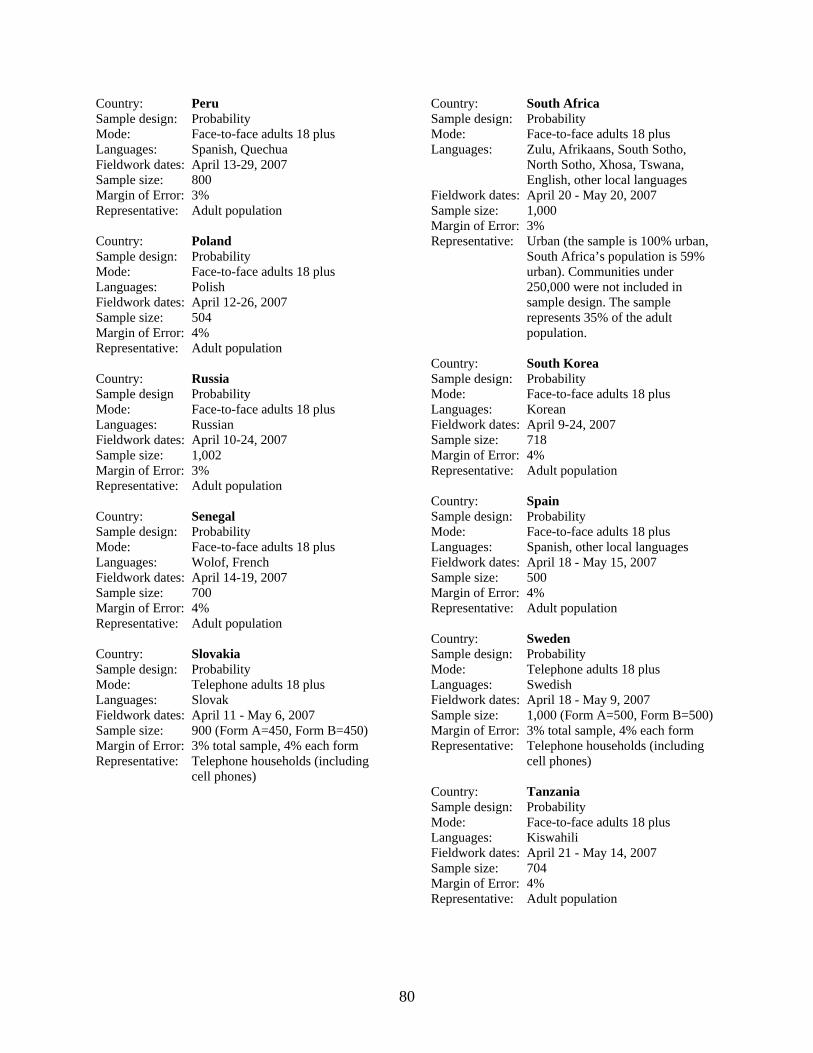
80
Country: Peru Sample design: Probability Mode: Face-to-face adults 18 plus Languages: Spanish, Quechua Fieldwork dates: April 13-29, 2007 Sample size: 800 Margin of Error: 3% Representative: Adult population Country: Poland Sample design: Probability Mode: Face-to-face adults 18 plus Languages: Polish Fieldwork dates: April 12-26, 2007 Sample size: 504 Margin of Error: 4% Representative: Adult population Country: Russia Sample design Probability Mode: Face-to-face adults 18 plus Languages: Russian Fieldwork dates: April 10-24, 2007 Sample size: 1,002 Margin of Error: 3% Representative: Adult population Country: Senegal Sample design: Probability Mode: Face-to-face adults 18 plus Languages: Wolof, French Fieldwork dates: April 14-19, 2007 Sample size: 700 Margin of Error: 4% Representative: Adult population Country: Slovakia Sample design: Probability Mode: Telephone adults 18 plus Languages: Slovak Fieldwork dates: April 11 - May 6, 2007 Sample size: 900 (Form A=450, Form B=450) Margin of Error: 3% total sample, 4% each form Representative: Telephone households (including
cell phones)
Country: South Africa Sample design: Probability Mode: Face-to-face adults 18 plus Languages: Zulu, Afrikaans, South Sotho,
North Sotho, Xhosa, Tswana, English, other local languages
Fieldwork dates: April 20 - May 20, 2007 Sample size: 1,000 Margin of Error: 3% Representative: Urban (the sample is 100% urban,
South Africa’s population is 59% urban). Communities under 250,000 were not included in sample design. The sample represents 35% of the adult population.
Country: South Korea Sample design: Probability Mode: Face-to-face adults 18 plus Languages: Korean Fieldwork dates: April 9-24, 2007 Sample size: 718 Margin of Error: 4% Representative: Adult population Country: Spain Sample design: Probability Mode: Face-to-face adults 18 plus Languages: Spanish, other local languages Fieldwork dates: April 18 - May 15, 2007 Sample size: 500 Margin of Error: 4% Representative: Adult population Country: Sweden Sample design: Probability Mode: Telephone adults 18 plus Languages: Swedish Fieldwork dates: April 18 - May 9, 2007 Sample size: 1,000 (Form A=500, Form B=500) Margin of Error: 3% total sample, 4% each form Representative: Telephone households (including
cell phones) Country: Tanzania Sample design: Probability Mode: Face-to-face adults 18 plus Languages: Kiswahili Fieldwork dates: April 21 - May 14, 2007 Sample size: 704 Margin of Error: 4% Representative: Adult population
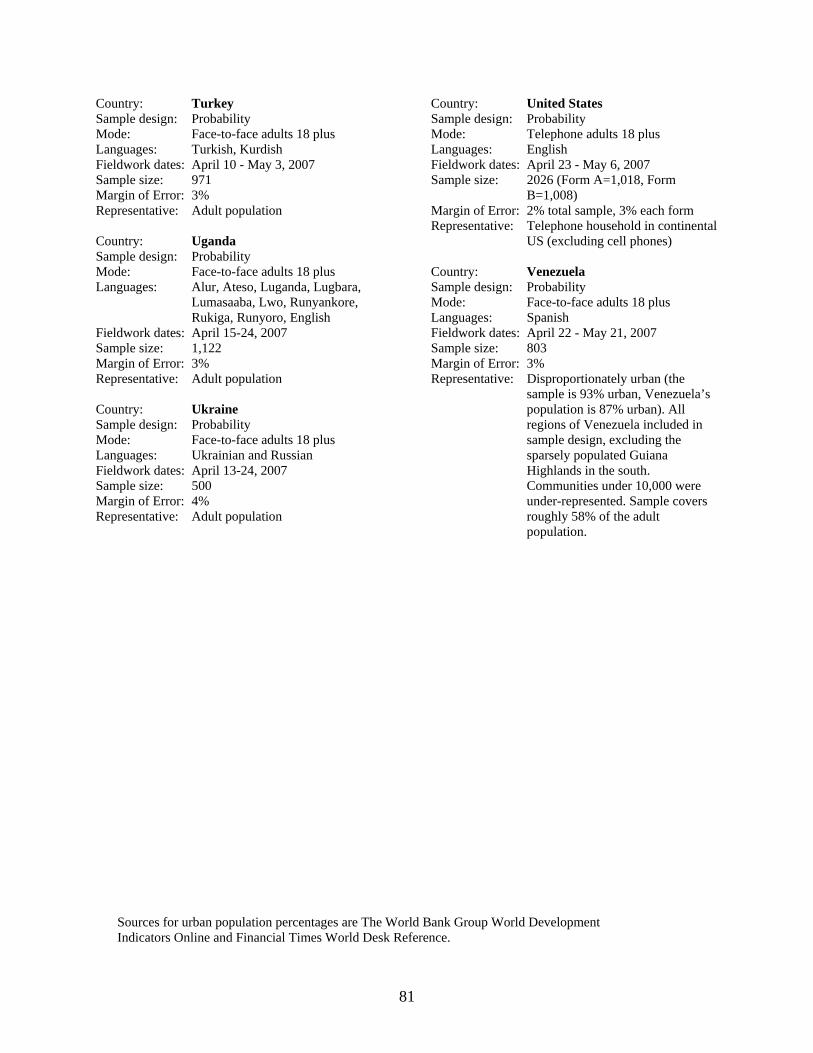
81
Country: Turkey Sample design: Probability Mode: Face-to-face adults 18 plus Languages: Turkish, Kurdish Fieldwork dates: April 10 - May 3, 2007 Sample size: 971 Margin of Error: 3% Representative: Adult population Country: Uganda Sample design: Probability Mode: Face-to-face adults 18 plus Languages: Alur, Ateso, Luganda, Lugbara,
Lumasaaba, Lwo, Runyankore, Rukiga, Runyoro, English
Fieldwork dates: April 15-24, 2007 Sample size: 1,122 Margin of Error: 3% Representative: Adult population Country: Ukraine Sample design: Probability Mode: Face-to-face adults 18 plus Languages: Ukrainian and Russian Fieldwork dates: April 13-24, 2007 Sample size: 500 Margin of Error: 4% Representative: Adult population
Country: United States Sample design: Probability Mode: Telephone adults 18 plus Languages: English Fieldwork dates: April 23 - May 6, 2007 Sample size: 2026 (Form A=1,018, Form
B=1,008) Margin of Error: 2% total sample, 3% each form Representative: Telephone household in continental
US (excluding cell phones) Country: Venezuela Sample design: Probability Mode: Face-to-face adults 18 plus Languages: Spanish Fieldwork dates: April 22 - May 21, 2007 Sample size: 803 Margin of Error: 3% Representative: Disproportionately urban (the
sample is 93% urban, Venezuela’s population is 87% urban). All regions of Venezuela included in sample design, excluding the sparsely populated Guiana Highlands in the south. Communities under 10,000 were under-represented. Sample covers roughly 58% of the adult population.
Sources for urban population percentages are The World Bank Group World Development Indicators Online and Financial Times World Desk Reference.

82
83
Pew Global Attitudes Project: Spring 2007 Survey Survey of 47 Publics
----FINAL 2007 COMPARATIVE TOPLINE---- Countries and regions included in the survey:
The Americas: Argentina, Bolivia, Brazil, Canada, Chile, Mexico, Peru, United States, Venezuela Western Europe: Britain, France, Germany, Italy, Spain, Sweden Eastern Europe: Bulgaria, Czech Republic, Poland, Russia, Slovakia, Ukraine Middle East: Egypt, Israel, Jordan, Kuwait, Lebanon, Morocco, Palestinian territories, Turkey Asia: Bangladesh, China, India, Indonesia, Japan, Malaysia, Pakistan, South Korea Africa: Ethiopia, Ghana, Ivory Coast, Kenya, Mali, Nigeria, Senegal, South Africa, Tanzania, Uganda
Methodological notes:
• Data based on national samples except in Bolivia, Brazil, China, India, Ivory Coast, Pakistan, South Africa, and Venezuela, where the samples were disproportionately or exclusively urban.
• In Britain, Canada, Czech Republic, France, Germany, Slovakia, Sweden, and United States, the
questionnaire was split into two forms, each of which was administered to approximately one-half of the sample. In these countries, most questions were assigned to one form or another. The exceptions were items in Q16 and all demographic questions, which were included on both forms and asked of the full sample.
• Due to rounding, percentages may not total 100%. The topline “total” columns always show
100%, however, because they are based on unrounded numbers.
• When the number of respondents in a category is less than one half of one percent (<0.5), the figure is rounded to zero (0%).
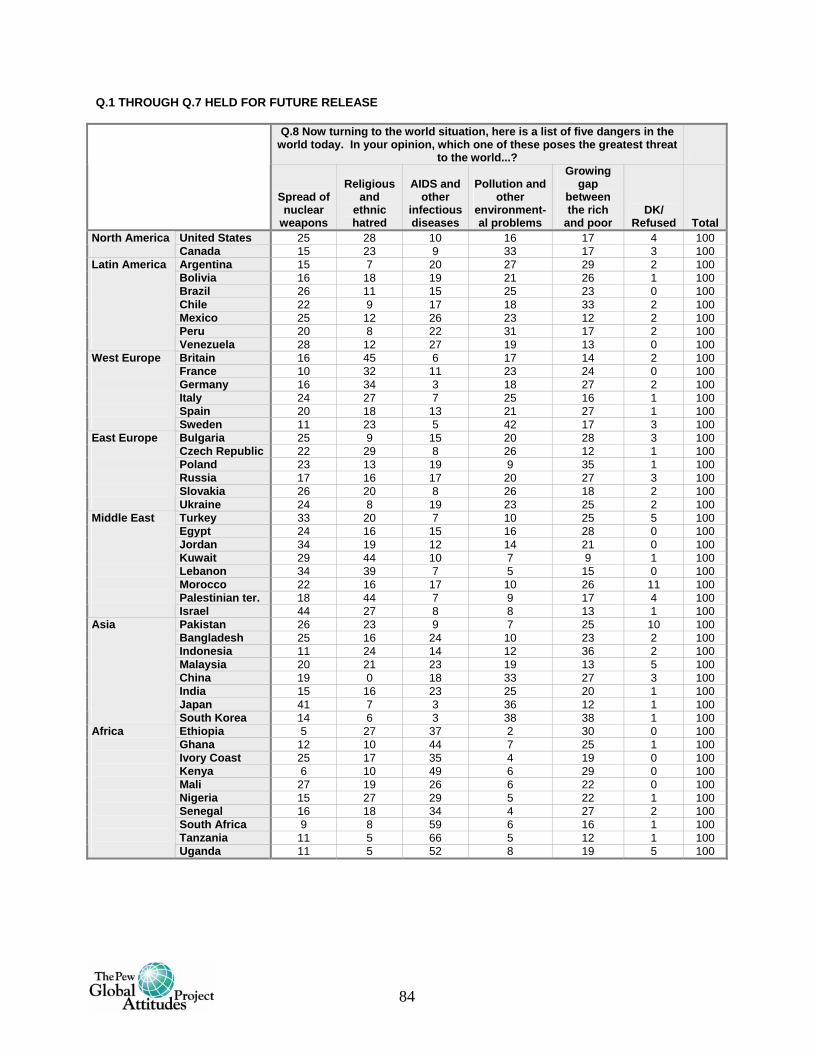
84
Q.1 THROUGH Q.7 HELD FOR FUTURE RELEASE
Q.8 Now turning to the world situation, here is a list of five dangers in the world today. In your opinion, which one of these poses the greatest threat
to the world...?
Spread of nuclear
weapons
Religious and
ethnic hatred
AIDS and other
infectious diseases
Pollution and other
environment-al problems
Growing gap
between the rich
and poor DK/
Refused Total United States 25 28 10 16 17 4 100 North America
Canada 15 23 9 33 17 3 100 Argentina 15 7 20 27 29 2 100 Bolivia 16 18 19 21 26 1 100 Brazil 26 11 15 25 23 0 100 Chile 22 9 17 18 33 2 100 Mexico 25 12 26 23 12 2 100 Peru 20 8 22 31 17 2 100
Latin America Venezuela 28 12 27 19 13 0 100
Britain 16 45 6 17 14 2 100 France 10 32 11 23 24 0 100 Germany 16 34 3 18 27 2 100 Italy 24 27 7 25 16 1 100 Spain 20 18 13 21 27 1 100
West Europe Sweden 11 23 5 42 17 3 100
Bulgaria 25 9 15 20 28 3 100 Czech Republic 22 29 8 26 12 1 100 Poland 23 13 19 9 35 1 100 Russia 17 16 17 20 27 3 100 Slovakia 26 20 8 26 18 2 100
East Europe Ukraine 24 8 19 23 25 2 100
Turkey 33 20 7 10 25 5 100 Egypt 24 16 15 16 28 0 100 Jordan 34 19 12 14 21 0 100 Kuwait 29 44 10 7 9 1 100 Lebanon 34 39 7 5 15 0 100 Morocco 22 16 17 10 26 11 100 Palestinian ter. 18 44 7 9 17 4 100
Middle East Israel 44 27 8 8 13 1 100
Pakistan 26 23 9 7 25 10 100 Bangladesh 25 16 24 10 23 2 100 Indonesia 11 24 14 12 36 2 100 Malaysia 20 21 23 19 13 5 100 China 19 0 18 33 27 3 100 India 15 16 23 25 20 1 100 Japan 41 7 3 36 12 1 100
Asia South Korea 14 6 3 38 38 1 100
Ethiopia 5 27 37 2 30 0 100 Ghana 12 10 44 7 25 1 100 Ivory Coast 25 17 35 4 19 0 100 Kenya 6 10 49 6 29 0 100 Mali 27 19 26 6 22 0 100 Nigeria 15 27 29 5 22 1 100 Senegal 16 18 34 4 27 2 100 South Africa 9 8 59 6 16 1 100 Tanzania 11 5 66 5 12 1 100
Africa Uganda 11 5 52 8 19 5 100
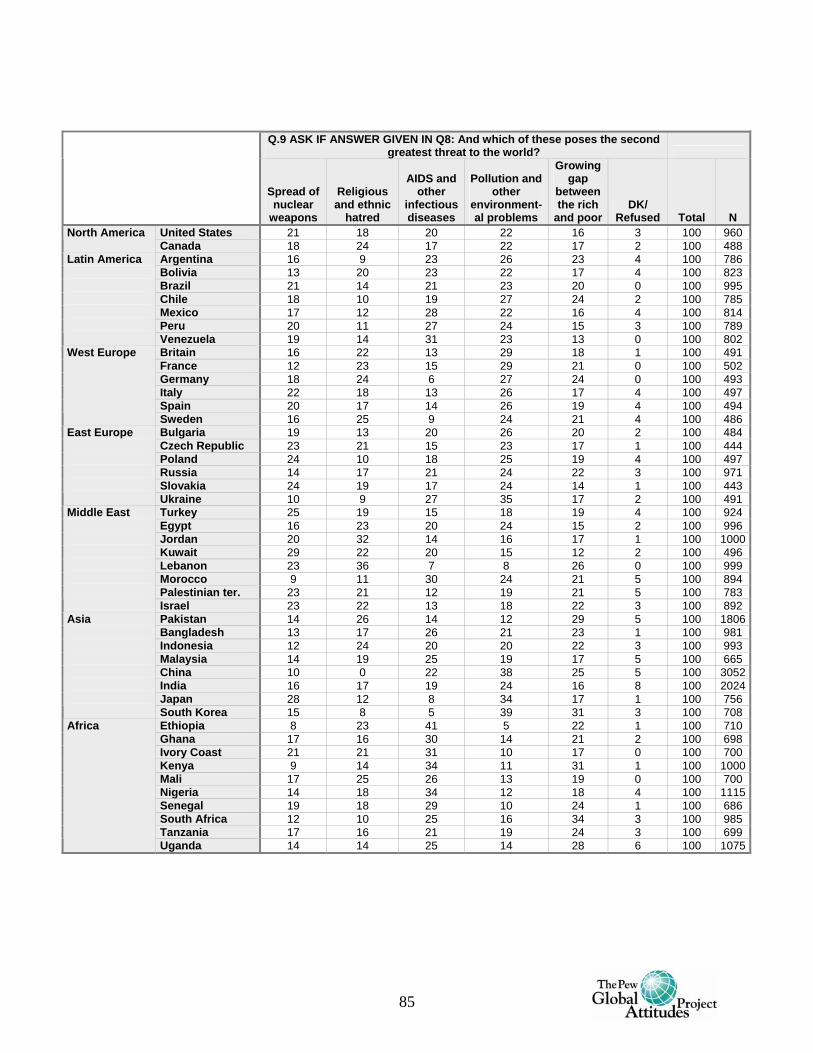
85
Q.9 ASK IF ANSWER GIVEN IN Q8: And which of these poses the second greatest threat to the world?
Spread of nuclear
weapons
Religious and ethnic
hatred
AIDS and other
infectious diseases
Pollution and other
environment-al problems
Growing gap
between the rich
and poor DK/
Refused Total N United States 21 18 20 22 16 3 100 960 North America
Canada 18 24 17 22 17 2 100 488 Argentina 16 9 23 26 23 4 100 786 Bolivia 13 20 23 22 17 4 100 823 Brazil 21 14 21 23 20 0 100 995 Chile 18 10 19 27 24 2 100 785 Mexico 17 12 28 22 16 4 100 814 Peru 20 11 27 24 15 3 100 789
Latin America Venezuela 19 14 31 23 13 0 100 802
Britain 16 22 13 29 18 1 100 491 France 12 23 15 29 21 0 100 502 Germany 18 24 6 27 24 0 100 493 Italy 22 18 13 26 17 4 100 497 Spain 20 17 14 26 19 4 100 494
West Europe Sweden 16 25 9 24 21 4 100 486
Bulgaria 19 13 20 26 20 2 100 484 Czech Republic 23 21 15 23 17 1 100 444 Poland 24 10 18 25 19 4 100 497 Russia 14 17 21 24 22 3 100 971 Slovakia 24 19 17 24 14 1 100 443
East Europe Ukraine 10 9 27 35 17 2 100 491
Turkey 25 19 15 18 19 4 100 924 Egypt 16 23 20 24 15 2 100 996 Jordan 20 32 14 16 17 1 100 1000Kuwait 29 22 20 15 12 2 100 496 Lebanon 23 36 7 8 26 0 100 999 Morocco 9 11 30 24 21 5 100 894 Palestinian ter. 23 21 12 19 21 5 100 783
Middle East Israel 23 22 13 18 22 3 100 892
Pakistan 14 26 14 12 29 5 100 1806Bangladesh 13 17 26 21 23 1 100 981 Indonesia 12 24 20 20 22 3 100 993 Malaysia 14 19 25 19 17 5 100 665 China 10 0 22 38 25 5 100 3052India 16 17 19 24 16 8 100 2024Japan 28 12 8 34 17 1 100 756
Asia South Korea 15 8 5 39 31 3 100 708
Ethiopia 8 23 41 5 22 1 100 710 Ghana 17 16 30 14 21 2 100 698 Ivory Coast 21 21 31 10 17 0 100 700 Kenya 9 14 34 11 31 1 100 1000Mali 17 25 26 13 19 0 100 700 Nigeria 14 18 34 12 18 4 100 1115Senegal 19 18 29 10 24 1 100 686 South Africa 12 10 25 16 34 3 100 985 Tanzania 17 16 21 19 24 3 100 699
Africa Uganda 14 14 25 14 28 6 100 1075
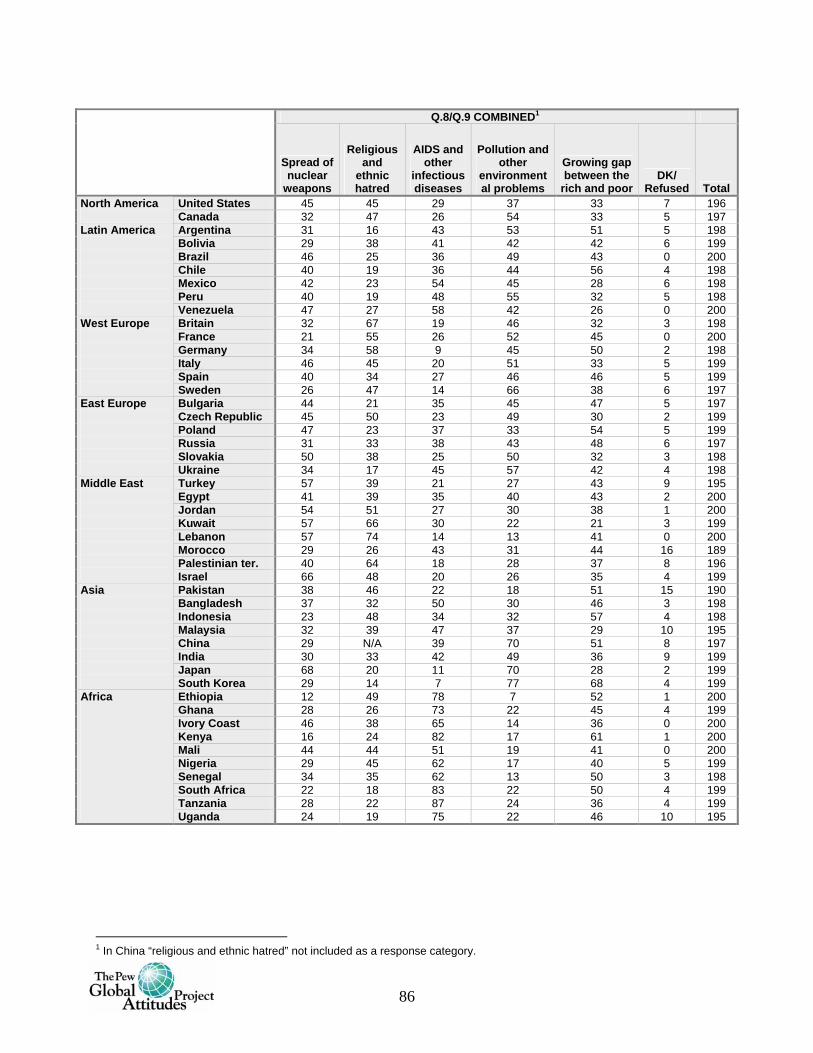
86
Q.8/Q.9 COMBINED1
Spread of nuclear
weapons
Religious and
ethnic hatred
AIDS and other
infectious diseases
Pollution and other
environmental problems
Growing gap between the
rich and poor DK/
Refused Total United States 45 45 29 37 33 7 196 North America
Canada 32 47 26 54 33 5 197 Argentina 31 16 43 53 51 5 198 Bolivia 29 38 41 42 42 6 199 Brazil 46 25 36 49 43 0 200 Chile 40 19 36 44 56 4 198 Mexico 42 23 54 45 28 6 198 Peru 40 19 48 55 32 5 198
Latin America Venezuela 47 27 58 42 26 0 200
Britain 32 67 19 46 32 3 198 France 21 55 26 52 45 0 200 Germany 34 58 9 45 50 2 198 Italy 46 45 20 51 33 5 199 Spain 40 34 27 46 46 5 199
West Europe Sweden 26 47 14 66 38 6 197
Bulgaria 44 21 35 45 47 5 197 Czech Republic 45 50 23 49 30 2 199 Poland 47 23 37 33 54 5 199 Russia 31 33 38 43 48 6 197 Slovakia 50 38 25 50 32 3 198
East Europe Ukraine 34 17 45 57 42 4 198
Turkey 57 39 21 27 43 9 195 Egypt 41 39 35 40 43 2 200 Jordan 54 51 27 30 38 1 200 Kuwait 57 66 30 22 21 3 199 Lebanon 57 74 14 13 41 0 200 Morocco 29 26 43 31 44 16 189 Palestinian ter. 40 64 18 28 37 8 196
Middle East Israel 66 48 20 26 35 4 199
Pakistan 38 46 22 18 51 15 190 Bangladesh 37 32 50 30 46 3 198 Indonesia 23 48 34 32 57 4 198 Malaysia 32 39 47 37 29 10 195 China 29 N/A 39 70 51 8 197 India 30 33 42 49 36 9 199 Japan 68 20 11 70 28 2 199
Asia South Korea 29 14 7 77 68 4 199
Ethiopia 12 49 78 7 52 1 200 Ghana 28 26 73 22 45 4 199 Ivory Coast 46 38 65 14 36 0 200 Kenya 16 24 82 17 61 1 200 Mali 44 44 51 19 41 0 200 Nigeria 29 45 62 17 40 5 199 Senegal 34 35 62 13 50 3 198 South Africa 22 18 83 22 50 4 199 Tanzania 28 22 87 24 36 4 199
Africa Uganda 24 19 75 22 46 10 195
1 In China “religious and ethnic hatred” not included as a response category.
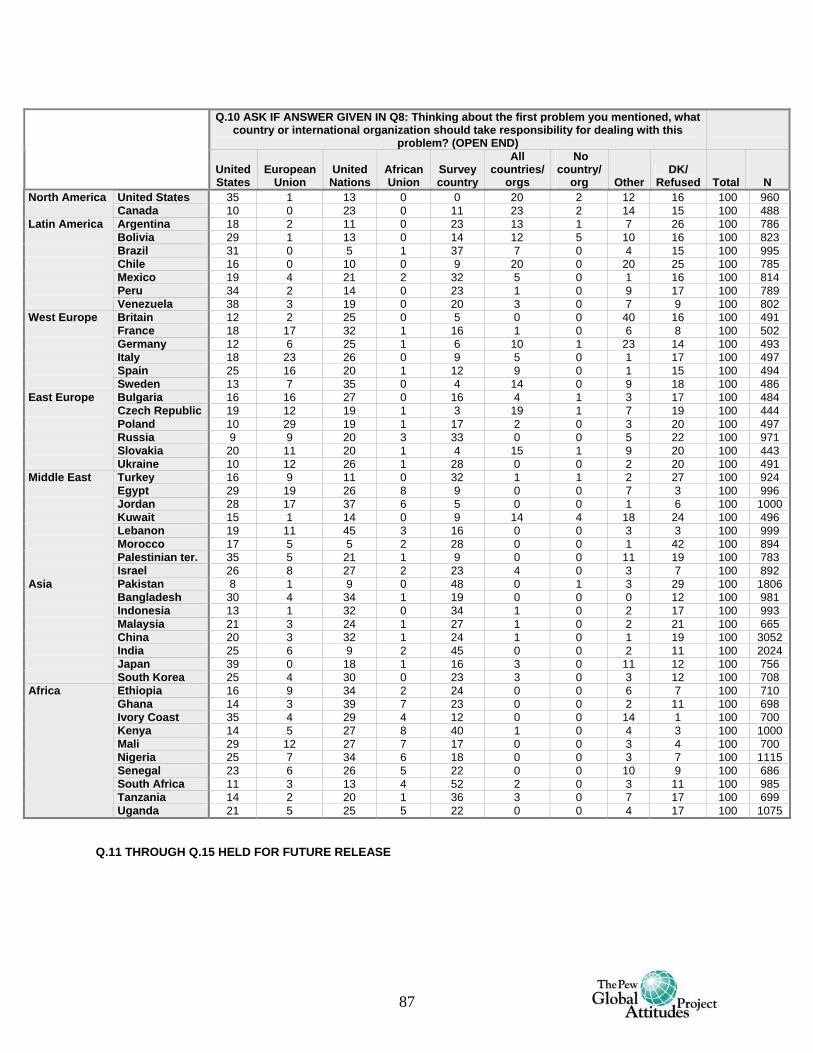
87
Q.10 ASK IF ANSWER GIVEN IN Q8: Thinking about the first problem you mentioned, what
country or international organization should take responsibility for dealing with this problem? (OPEN END)
United States
European Union
United Nations
African Union
Survey country
All countries/
orgs
No country/
org Other DK/
Refused Total N United States 35 1 13 0 0 20 2 12 16 100 960 North America
Canada 10 0 23 0 11 23 2 14 15 100 488 Argentina 18 2 11 0 23 13 1 7 26 100 786 Bolivia 29 1 13 0 14 12 5 10 16 100 823 Brazil 31 0 5 1 37 7 0 4 15 100 995 Chile 16 0 10 0 9 20 0 20 25 100 785 Mexico 19 4 21 2 32 5 0 1 16 100 814 Peru 34 2 14 0 23 1 0 9 17 100 789
Latin America Venezuela 38 3 19 0 20 3 0 7 9 100 802
Britain 12 2 25 0 5 0 0 40 16 100 491 France 18 17 32 1 16 1 0 6 8 100 502 Germany 12 6 25 1 6 10 1 23 14 100 493 Italy 18 23 26 0 9 5 0 1 17 100 497 Spain 25 16 20 1 12 9 0 1 15 100 494
West Europe Sweden 13 7 35 0 4 14 0 9 18 100 486
Bulgaria 16 16 27 0 16 4 1 3 17 100 484 Czech Republic 19 12 19 1 3 19 1 7 19 100 444 Poland 10 29 19 1 17 2 0 3 20 100 497 Russia 9 9 20 3 33 0 0 5 22 100 971 Slovakia 20 11 20 1 4 15 1 9 20 100 443
East Europe Ukraine 10 12 26 1 28 0 0 2 20 100 491
Turkey 16 9 11 0 32 1 1 2 27 100 924 Egypt 29 19 26 8 9 0 0 7 3 100 996 Jordan 28 17 37 6 5 0 0 1 6 100 1000 Kuwait 15 1 14 0 9 14 4 18 24 100 496 Lebanon 19 11 45 3 16 0 0 3 3 100 999 Morocco 17 5 5 2 28 0 0 1 42 100 894 Palestinian ter. 35 5 21 1 9 0 0 11 19 100 783
Middle East Israel 26 8 27 2 23 4 0 3 7 100 892
Pakistan 8 1 9 0 48 0 1 3 29 100 1806 Bangladesh 30 4 34 1 19 0 0 0 12 100 981 Indonesia 13 1 32 0 34 1 0 2 17 100 993 Malaysia 21 3 24 1 27 1 0 2 21 100 665 China 20 3 32 1 24 1 0 1 19 100 3052 India 25 6 9 2 45 0 0 2 11 100 2024 Japan 39 0 18 1 16 3 0 11 12 100 756
Asia South Korea 25 4 30 0 23 3 0 3 12 100 708
Ethiopia 16 9 34 2 24 0 0 6 7 100 710 Ghana 14 3 39 7 23 0 0 2 11 100 698 Ivory Coast 35 4 29 4 12 0 0 14 1 100 700 Kenya 14 5 27 8 40 1 0 4 3 100 1000 Mali 29 12 27 7 17 0 0 3 4 100 700 Nigeria 25 7 34 6 18 0 0 3 7 100 1115 Senegal 23 6 26 5 22 0 0 10 9 100 686 South Africa 11 3 13 4 52 2 0 3 11 100 985 Tanzania 14 2 20 1 36 3 0 7 17 100 699
Africa Uganda 21 5 25 5 22 0 0 4 17 100 1075
Q.11 THROUGH Q.15 HELD FOR FUTURE RELEASE
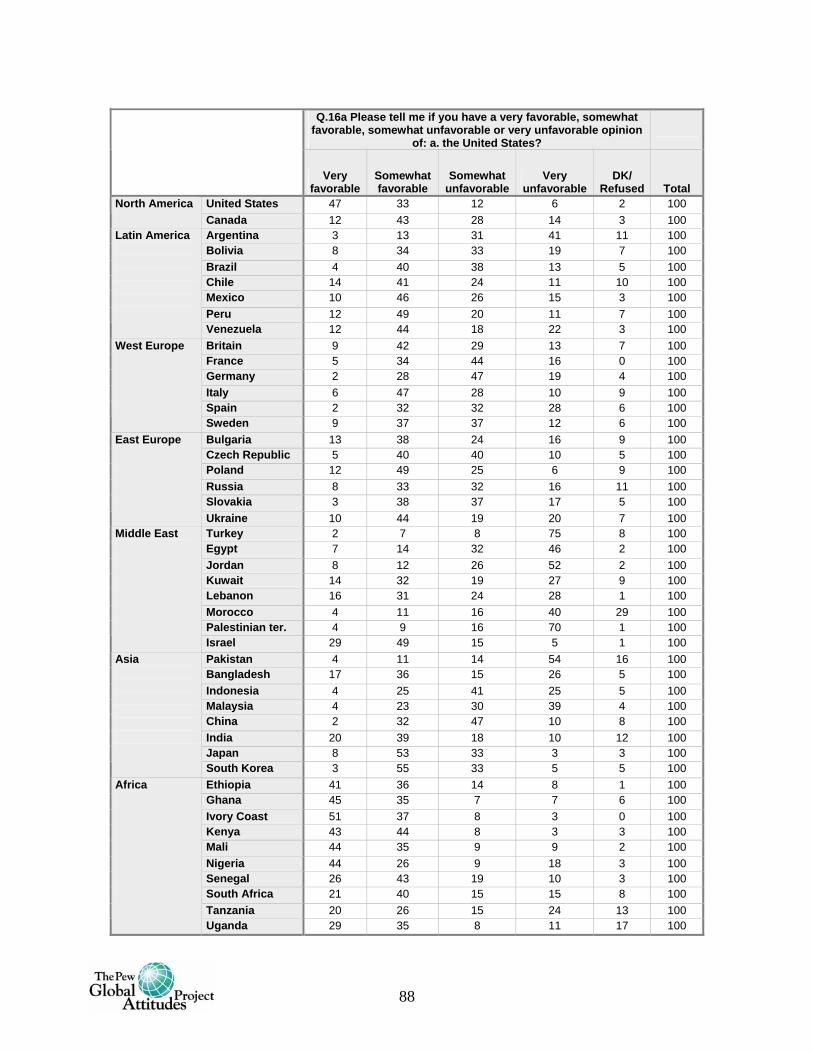
88
Q.16a Please tell me if you have a very favorable, somewhat
favorable, somewhat unfavorable or very unfavorable opinion of: a. the United States?
Very favorable
Somewhat favorable
Somewhat unfavorable
Very unfavorable
DK/ Refused Total
United States 47 33 12 6 2 100 North America Canada 12 43 28 14 3 100
Argentina 3 13 31 41 11 100 Bolivia 8 34 33 19 7 100 Brazil 4 40 38 13 5 100 Chile 14 41 24 11 10 100 Mexico 10 46 26 15 3 100 Peru 12 49 20 11 7 100
Latin America
Venezuela 12 44 18 22 3 100 Britain 9 42 29 13 7 100 France 5 34 44 16 0 100 Germany 2 28 47 19 4 100 Italy 6 47 28 10 9 100 Spain 2 32 32 28 6 100
West Europe
Sweden 9 37 37 12 6 100 Bulgaria 13 38 24 16 9 100 Czech Republic 5 40 40 10 5 100 Poland 12 49 25 6 9 100 Russia 8 33 32 16 11 100 Slovakia 3 38 37 17 5 100
East Europe
Ukraine 10 44 19 20 7 100 Turkey 2 7 8 75 8 100 Egypt 7 14 32 46 2 100 Jordan 8 12 26 52 2 100 Kuwait 14 32 19 27 9 100 Lebanon 16 31 24 28 1 100 Morocco 4 11 16 40 29 100 Palestinian ter. 4 9 16 70 1 100
Middle East
Israel 29 49 15 5 1 100 Pakistan 4 11 14 54 16 100 Bangladesh 17 36 15 26 5 100 Indonesia 4 25 41 25 5 100 Malaysia 4 23 30 39 4 100 China 2 32 47 10 8 100 India 20 39 18 10 12 100 Japan 8 53 33 3 3 100
Asia
South Korea 3 55 33 5 5 100 Ethiopia 41 36 14 8 1 100 Ghana 45 35 7 7 6 100 Ivory Coast 51 37 8 3 0 100 Kenya 43 44 8 3 3 100 Mali 44 35 9 9 2 100 Nigeria 44 26 9 18 3 100 Senegal 26 43 19 10 3 100 South Africa 21 40 15 15 8 100 Tanzania 20 26 15 24 13 100
Africa
Uganda 29 35 8 11 17 100
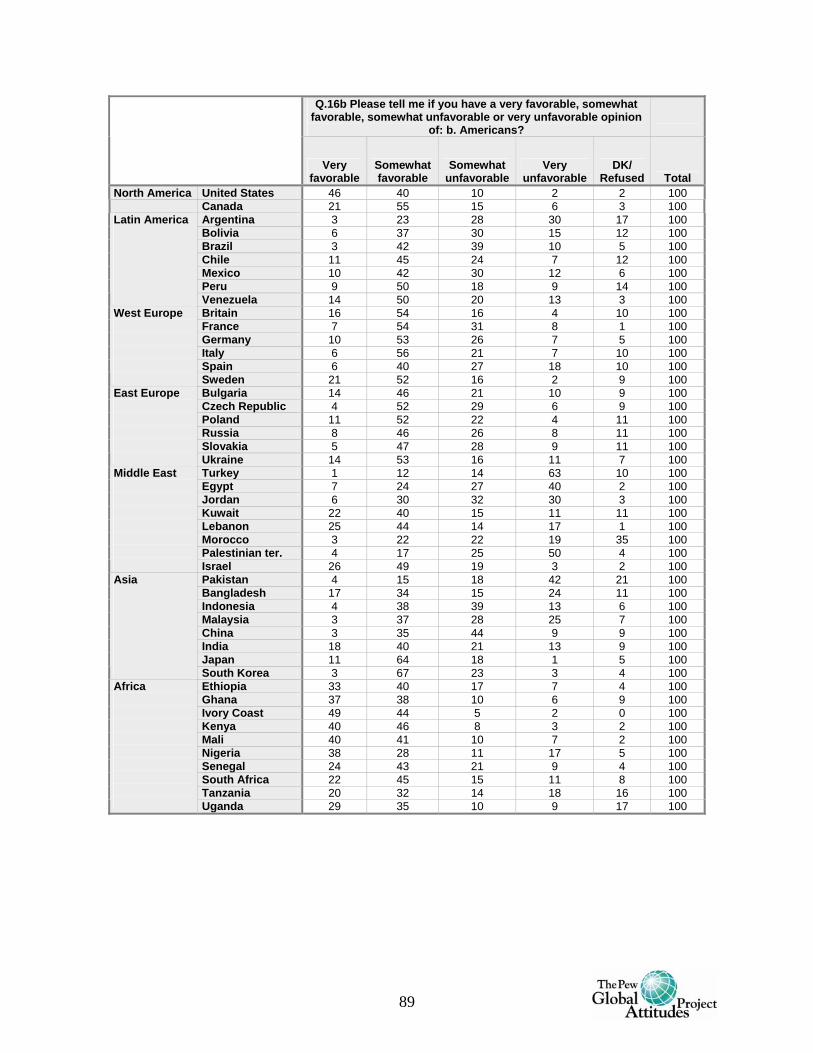
89
Q.16b Please tell me if you have a very favorable, somewhat favorable, somewhat unfavorable or very unfavorable opinion
of: b. Americans?
Very favorable
Somewhat favorable
Somewhat unfavorable
Very unfavorable
DK/ Refused Total
North America United States 46 40 10 2 2 100 Canada 21 55 15 6 3 100
Argentina 3 23 28 30 17 100 Bolivia 6 37 30 15 12 100 Brazil 3 42 39 10 5 100 Chile 11 45 24 7 12 100 Mexico 10 42 30 12 6 100 Peru 9 50 18 9 14 100
Latin America Venezuela 14 50 20 13 3 100
Britain 16 54 16 4 10 100 France 7 54 31 8 1 100 Germany 10 53 26 7 5 100 Italy 6 56 21 7 10 100 Spain 6 40 27 18 10 100
West Europe Sweden 21 52 16 2 9 100
Bulgaria 14 46 21 10 9 100 Czech Republic 4 52 29 6 9 100 Poland 11 52 22 4 11 100 Russia 8 46 26 8 11 100 Slovakia 5 47 28 9 11 100
East Europe Ukraine 14 53 16 11 7 100
Turkey 1 12 14 63 10 100 Egypt 7 24 27 40 2 100 Jordan 6 30 32 30 3 100 Kuwait 22 40 15 11 11 100 Lebanon 25 44 14 17 1 100 Morocco 3 22 22 19 35 100 Palestinian ter. 4 17 25 50 4 100
Middle East Israel 26 49 19 3 2 100
Pakistan 4 15 18 42 21 100 Bangladesh 17 34 15 24 11 100 Indonesia 4 38 39 13 6 100 Malaysia 3 37 28 25 7 100 China 3 35 44 9 9 100 India 18 40 21 13 9 100 Japan 11 64 18 1 5 100
Asia South Korea 3 67 23 3 4 100
Ethiopia 33 40 17 7 4 100 Ghana 37 38 10 6 9 100 Ivory Coast 49 44 5 2 0 100 Kenya 40 46 8 3 2 100 Mali 40 41 10 7 2 100 Nigeria 38 28 11 17 5 100 Senegal 24 43 21 9 4 100 South Africa 22 45 15 11 8 100 Tanzania 20 32 14 18 16 100
Africa Uganda 29 35 10 9 17 100
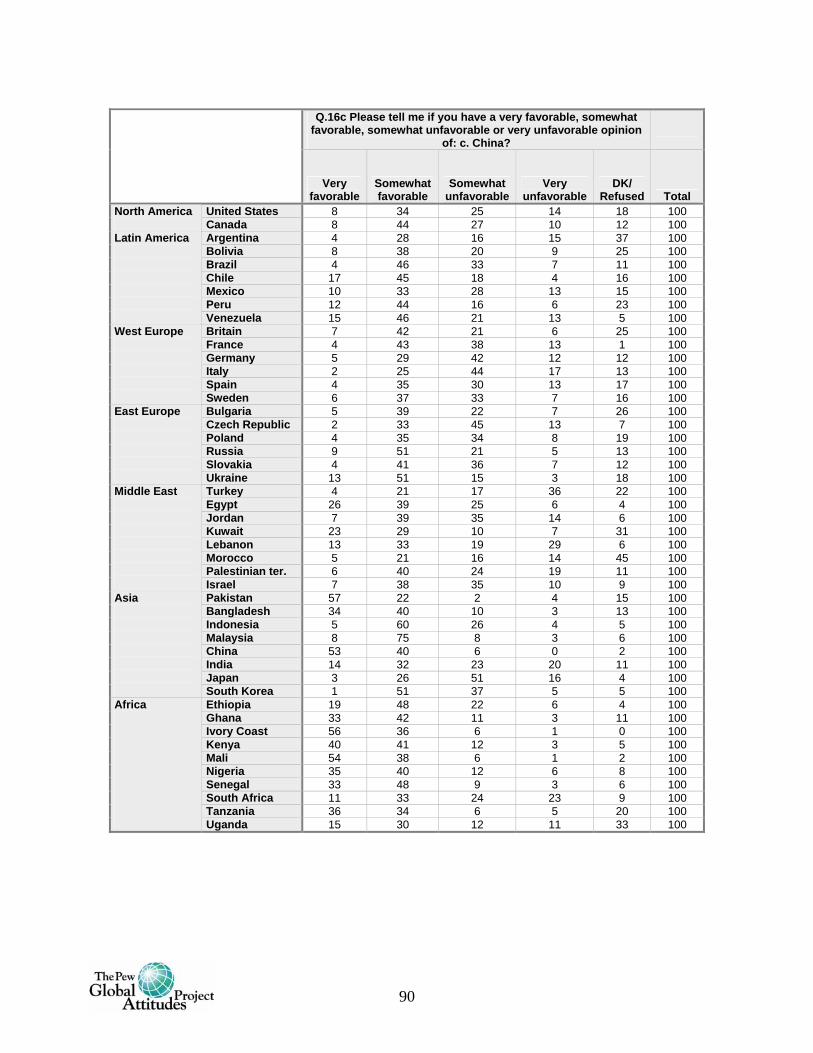
90
Q.16c Please tell me if you have a very favorable, somewhat
favorable, somewhat unfavorable or very unfavorable opinion of: c. China?
Very favorable
Somewhat favorable
Somewhat unfavorable
Very unfavorable
DK/ Refused Total
United States 8 34 25 14 18 100 North America Canada 8 44 27 10 12 100
Argentina 4 28 16 15 37 100 Bolivia 8 38 20 9 25 100 Brazil 4 46 33 7 11 100 Chile 17 45 18 4 16 100 Mexico 10 33 28 13 15 100 Peru 12 44 16 6 23 100
Latin America Venezuela 15 46 21 13 5 100
Britain 7 42 21 6 25 100 France 4 43 38 13 1 100 Germany 5 29 42 12 12 100 Italy 2 25 44 17 13 100 Spain 4 35 30 13 17 100
West Europe Sweden 6 37 33 7 16 100
Bulgaria 5 39 22 7 26 100 Czech Republic 2 33 45 13 7 100 Poland 4 35 34 8 19 100 Russia 9 51 21 5 13 100 Slovakia 4 41 36 7 12 100
East Europe Ukraine 13 51 15 3 18 100
Turkey 4 21 17 36 22 100 Egypt 26 39 25 6 4 100 Jordan 7 39 35 14 6 100 Kuwait 23 29 10 7 31 100 Lebanon 13 33 19 29 6 100 Morocco 5 21 16 14 45 100 Palestinian ter. 6 40 24 19 11 100
Middle East Israel 7 38 35 10 9 100
Pakistan 57 22 2 4 15 100 Bangladesh 34 40 10 3 13 100 Indonesia 5 60 26 4 5 100 Malaysia 8 75 8 3 6 100 China 53 40 6 0 2 100 India 14 32 23 20 11 100 Japan 3 26 51 16 4 100
Asia South Korea 1 51 37 5 5 100
Ethiopia 19 48 22 6 4 100 Ghana 33 42 11 3 11 100 Ivory Coast 56 36 6 1 0 100 Kenya 40 41 12 3 5 100 Mali 54 38 6 1 2 100 Nigeria 35 40 12 6 8 100 Senegal 33 48 9 3 6 100 South Africa 11 33 24 23 9 100 Tanzania 36 34 6 5 20 100
Africa Uganda 15 30 12 11 33 100
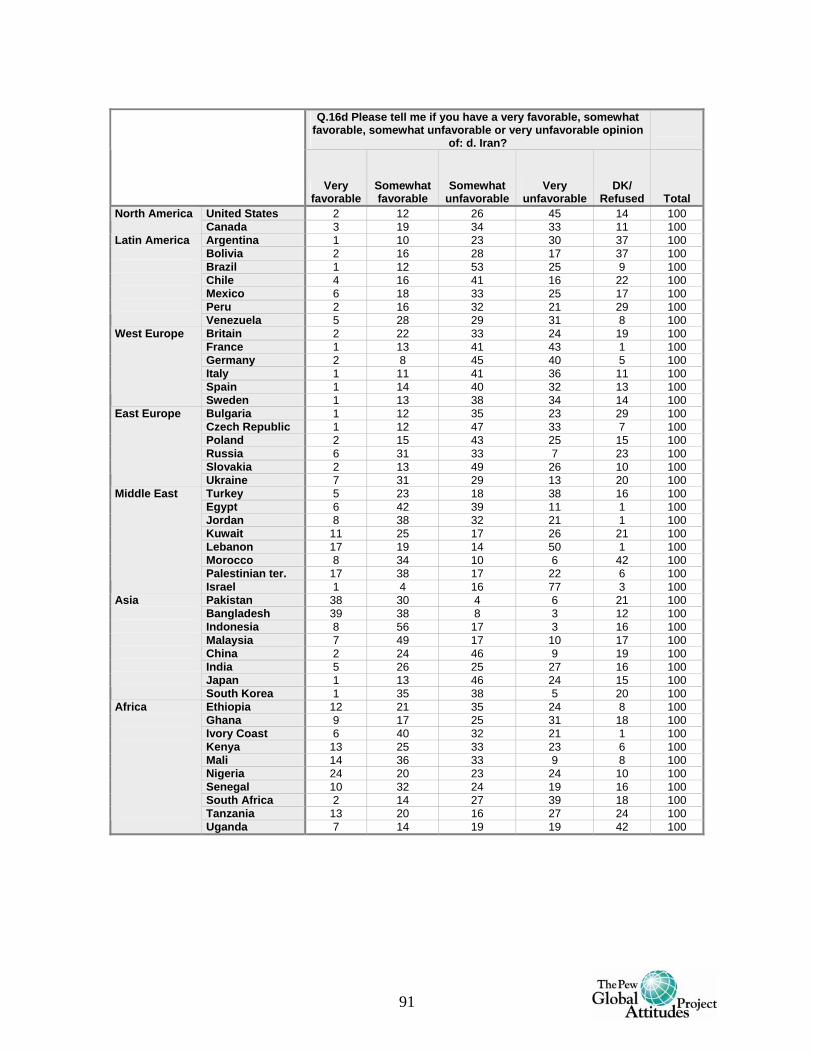
91
Q.16d Please tell me if you have a very favorable, somewhat
favorable, somewhat unfavorable or very unfavorable opinion of: d. Iran?
Very favorable
Somewhat favorable
Somewhat unfavorable
Very unfavorable
DK/ Refused Total
United States 2 12 26 45 14 100 North America Canada 3 19 34 33 11 100
Argentina 1 10 23 30 37 100 Bolivia 2 16 28 17 37 100 Brazil 1 12 53 25 9 100 Chile 4 16 41 16 22 100 Mexico 6 18 33 25 17 100 Peru 2 16 32 21 29 100
Latin America Venezuela 5 28 29 31 8 100
Britain 2 22 33 24 19 100 France 1 13 41 43 1 100 Germany 2 8 45 40 5 100 Italy 1 11 41 36 11 100 Spain 1 14 40 32 13 100
West Europe Sweden 1 13 38 34 14 100
Bulgaria 1 12 35 23 29 100 Czech Republic 1 12 47 33 7 100 Poland 2 15 43 25 15 100 Russia 6 31 33 7 23 100 Slovakia 2 13 49 26 10 100
East Europe Ukraine 7 31 29 13 20 100
Turkey 5 23 18 38 16 100 Egypt 6 42 39 11 1 100 Jordan 8 38 32 21 1 100 Kuwait 11 25 17 26 21 100 Lebanon 17 19 14 50 1 100 Morocco 8 34 10 6 42 100 Palestinian ter. 17 38 17 22 6 100
Middle East Israel 1 4 16 77 3 100
Pakistan 38 30 4 6 21 100 Bangladesh 39 38 8 3 12 100 Indonesia 8 56 17 3 16 100 Malaysia 7 49 17 10 17 100 China 2 24 46 9 19 100 India 5 26 25 27 16 100 Japan 1 13 46 24 15 100
Asia South Korea 1 35 38 5 20 100
Ethiopia 12 21 35 24 8 100 Ghana 9 17 25 31 18 100 Ivory Coast 6 40 32 21 1 100 Kenya 13 25 33 23 6 100 Mali 14 36 33 9 8 100 Nigeria 24 20 23 24 10 100 Senegal 10 32 24 19 16 100 South Africa 2 14 27 39 18 100 Tanzania 13 20 16 27 24 100
Africa Uganda 7 14 19 19 42 100
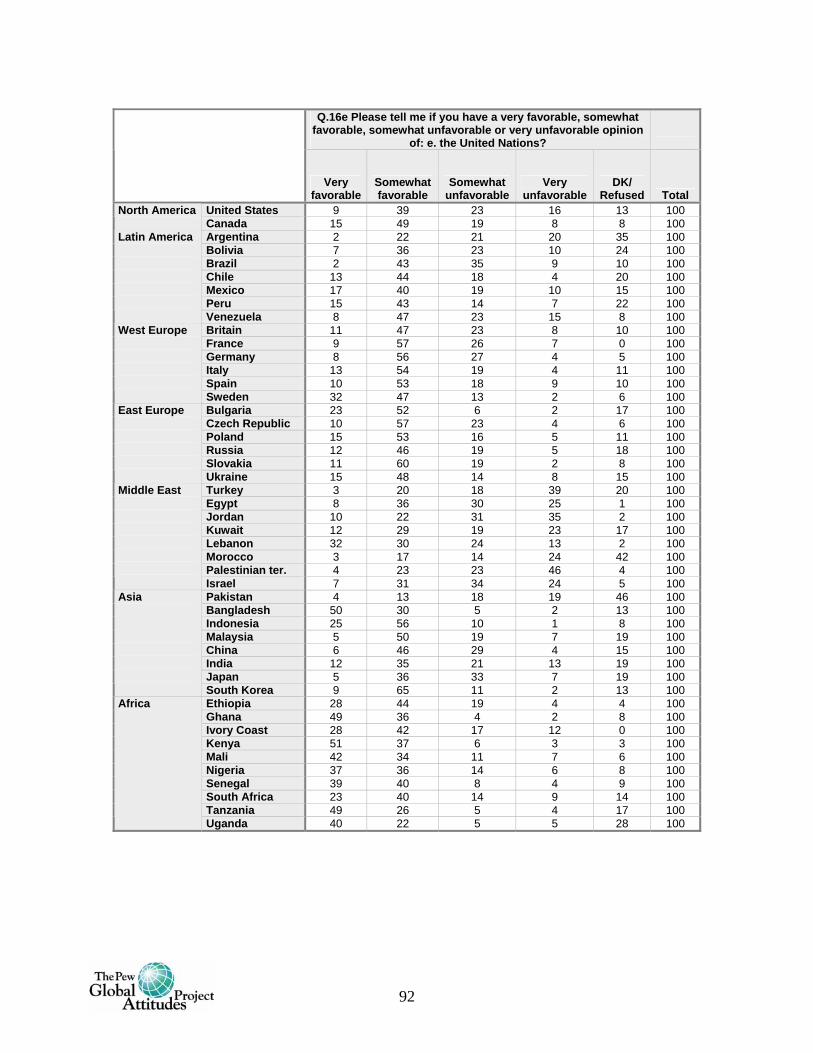
92
Q.16e Please tell me if you have a very favorable, somewhat
favorable, somewhat unfavorable or very unfavorable opinion of: e. the United Nations?
Very favorable
Somewhat favorable
Somewhat unfavorable
Very unfavorable
DK/ Refused Total
United States 9 39 23 16 13 100 North America Canada 15 49 19 8 8 100
Argentina 2 22 21 20 35 100 Bolivia 7 36 23 10 24 100 Brazil 2 43 35 9 10 100 Chile 13 44 18 4 20 100 Mexico 17 40 19 10 15 100 Peru 15 43 14 7 22 100
Latin America Venezuela 8 47 23 15 8 100
Britain 11 47 23 8 10 100 France 9 57 26 7 0 100 Germany 8 56 27 4 5 100 Italy 13 54 19 4 11 100 Spain 10 53 18 9 10 100
West Europe Sweden 32 47 13 2 6 100
Bulgaria 23 52 6 2 17 100 Czech Republic 10 57 23 4 6 100 Poland 15 53 16 5 11 100 Russia 12 46 19 5 18 100 Slovakia 11 60 19 2 8 100
East Europe Ukraine 15 48 14 8 15 100
Turkey 3 20 18 39 20 100 Egypt 8 36 30 25 1 100 Jordan 10 22 31 35 2 100 Kuwait 12 29 19 23 17 100 Lebanon 32 30 24 13 2 100 Morocco 3 17 14 24 42 100 Palestinian ter. 4 23 23 46 4 100
Middle East Israel 7 31 34 24 5 100
Pakistan 4 13 18 19 46 100 Bangladesh 50 30 5 2 13 100 Indonesia 25 56 10 1 8 100 Malaysia 5 50 19 7 19 100 China 6 46 29 4 15 100 India 12 35 21 13 19 100 Japan 5 36 33 7 19 100
Asia South Korea 9 65 11 2 13 100
Ethiopia 28 44 19 4 4 100 Ghana 49 36 4 2 8 100 Ivory Coast 28 42 17 12 0 100 Kenya 51 37 6 3 3 100 Mali 42 34 11 7 6 100 Nigeria 37 36 14 6 8 100 Senegal 39 40 8 4 9 100 South Africa 23 40 14 9 14 100 Tanzania 49 26 5 4 17 100
Africa Uganda 40 22 5 5 28 100
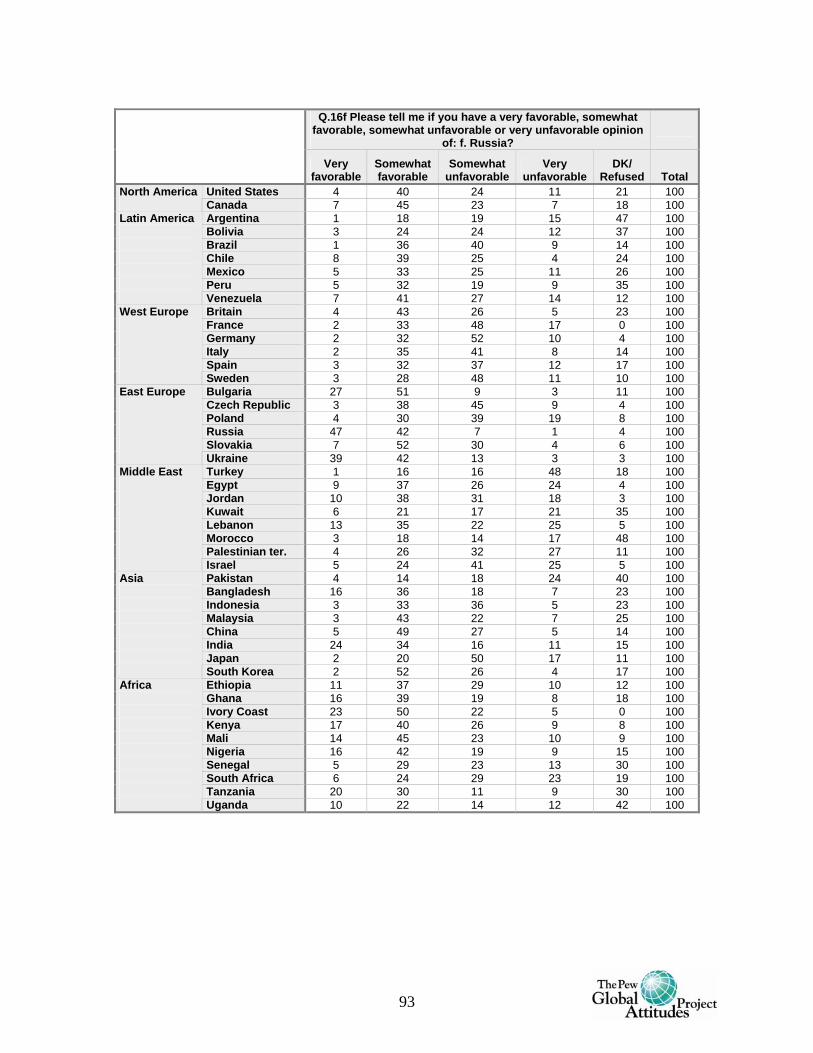
93
Q.16f Please tell me if you have a very favorable, somewhat
favorable, somewhat unfavorable or very unfavorable opinion of: f. Russia?
Very favorable
Somewhat favorable
Somewhat unfavorable
Very unfavorable
DK/ Refused Total
United States 4 40 24 11 21 100 North America Canada 7 45 23 7 18 100
Argentina 1 18 19 15 47 100 Bolivia 3 24 24 12 37 100 Brazil 1 36 40 9 14 100 Chile 8 39 25 4 24 100 Mexico 5 33 25 11 26 100 Peru 5 32 19 9 35 100
Latin America Venezuela 7 41 27 14 12 100
Britain 4 43 26 5 23 100 France 2 33 48 17 0 100 Germany 2 32 52 10 4 100 Italy 2 35 41 8 14 100 Spain 3 32 37 12 17 100
West Europe Sweden 3 28 48 11 10 100
Bulgaria 27 51 9 3 11 100 Czech Republic 3 38 45 9 4 100 Poland 4 30 39 19 8 100 Russia 47 42 7 1 4 100 Slovakia 7 52 30 4 6 100
East Europe Ukraine 39 42 13 3 3 100
Turkey 1 16 16 48 18 100 Egypt 9 37 26 24 4 100 Jordan 10 38 31 18 3 100 Kuwait 6 21 17 21 35 100 Lebanon 13 35 22 25 5 100 Morocco 3 18 14 17 48 100 Palestinian ter. 4 26 32 27 11 100
Middle East Israel 5 24 41 25 5 100
Pakistan 4 14 18 24 40 100 Bangladesh 16 36 18 7 23 100 Indonesia 3 33 36 5 23 100 Malaysia 3 43 22 7 25 100 China 5 49 27 5 14 100 India 24 34 16 11 15 100 Japan 2 20 50 17 11 100
Asia South Korea 2 52 26 4 17 100
Ethiopia 11 37 29 10 12 100 Ghana 16 39 19 8 18 100 Ivory Coast 23 50 22 5 0 100 Kenya 17 40 26 9 8 100 Mali 14 45 23 10 9 100 Nigeria 16 42 19 9 15 100 Senegal 5 29 23 13 30 100 South Africa 6 24 29 23 19 100 Tanzania 20 30 11 9 30 100
Africa Uganda 10 22 14 12 42 100
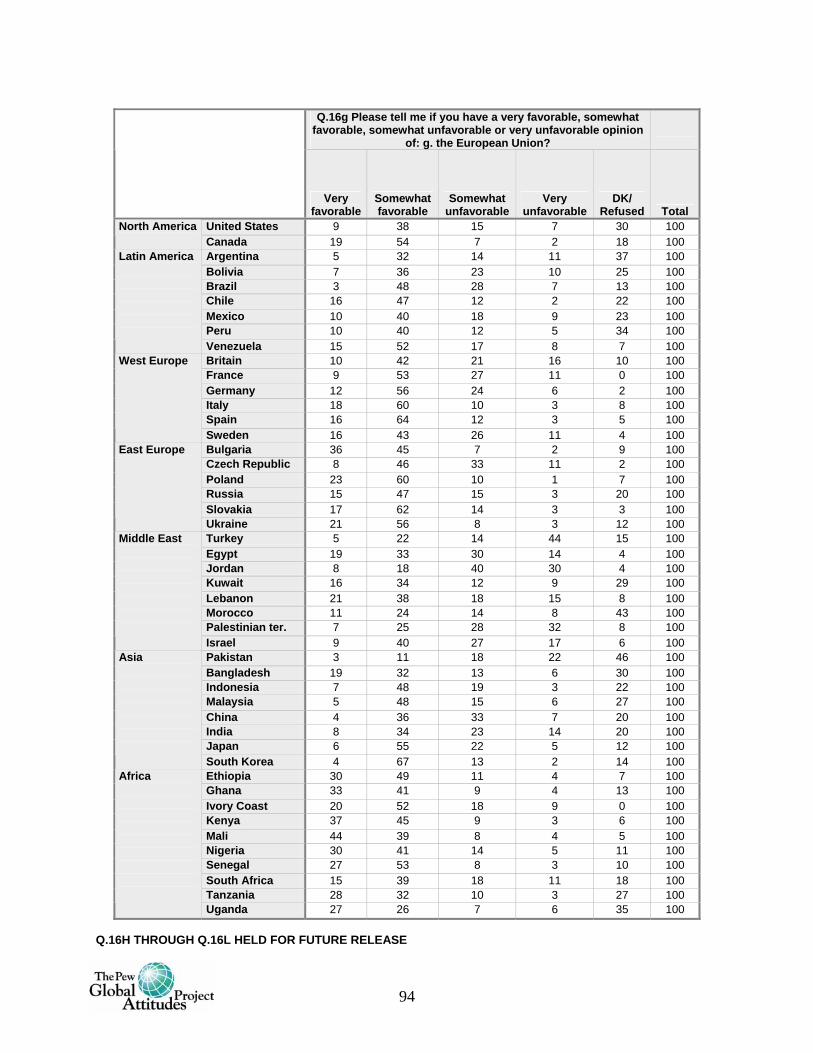
94
Q.16g Please tell me if you have a very favorable, somewhat
favorable, somewhat unfavorable or very unfavorable opinion of: g. the European Union?
Very favorable
Somewhat favorable
Somewhat unfavorable
Very unfavorable
DK/ Refused Total
United States 9 38 15 7 30 100 North America Canada 19 54 7 2 18 100
Argentina 5 32 14 11 37 100 Bolivia 7 36 23 10 25 100 Brazil 3 48 28 7 13 100 Chile 16 47 12 2 22 100 Mexico 10 40 18 9 23 100 Peru 10 40 12 5 34 100
Latin America
Venezuela 15 52 17 8 7 100 Britain 10 42 21 16 10 100 France 9 53 27 11 0 100 Germany 12 56 24 6 2 100 Italy 18 60 10 3 8 100 Spain 16 64 12 3 5 100
West Europe
Sweden 16 43 26 11 4 100 Bulgaria 36 45 7 2 9 100 Czech Republic 8 46 33 11 2 100 Poland 23 60 10 1 7 100 Russia 15 47 15 3 20 100 Slovakia 17 62 14 3 3 100
East Europe
Ukraine 21 56 8 3 12 100 Turkey 5 22 14 44 15 100 Egypt 19 33 30 14 4 100 Jordan 8 18 40 30 4 100 Kuwait 16 34 12 9 29 100 Lebanon 21 38 18 15 8 100 Morocco 11 24 14 8 43 100 Palestinian ter. 7 25 28 32 8 100
Middle East
Israel 9 40 27 17 6 100 Pakistan 3 11 18 22 46 100 Bangladesh 19 32 13 6 30 100 Indonesia 7 48 19 3 22 100 Malaysia 5 48 15 6 27 100 China 4 36 33 7 20 100 India 8 34 23 14 20 100 Japan 6 55 22 5 12 100
Asia
South Korea 4 67 13 2 14 100 Ethiopia 30 49 11 4 7 100 Ghana 33 41 9 4 13 100 Ivory Coast 20 52 18 9 0 100 Kenya 37 45 9 3 6 100 Mali 44 39 8 4 5 100 Nigeria 30 41 14 5 11 100 Senegal 27 53 8 3 10 100 South Africa 15 39 18 11 18 100 Tanzania 28 32 10 3 27 100
Africa
Uganda 27 26 7 6 35 100 Q.16H THROUGH Q.16L HELD FOR FUTURE RELEASE
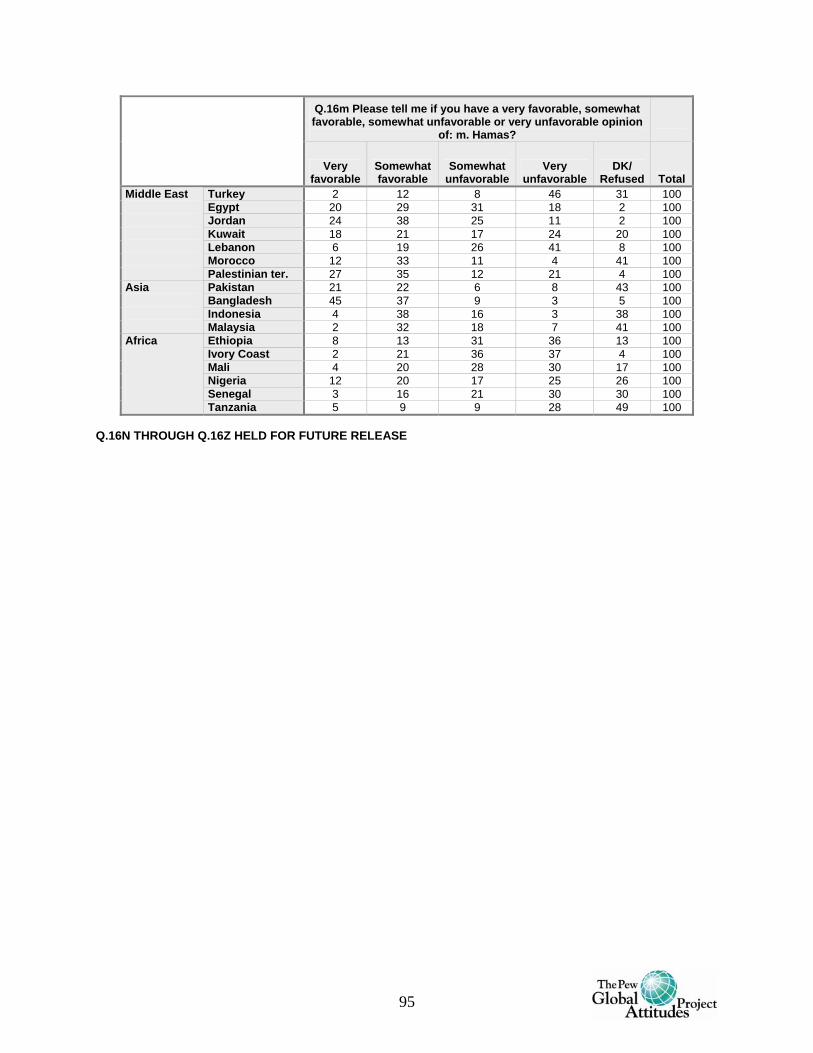
95
Q.16m Please tell me if you have a very favorable, somewhat favorable, somewhat unfavorable or very unfavorable opinion
of: m. Hamas?
Very favorable
Somewhat favorable
Somewhat unfavorable
Very unfavorable
DK/ Refused Total
Turkey 2 12 8 46 31 100 Egypt 20 29 31 18 2 100 Jordan 24 38 25 11 2 100 Kuwait 18 21 17 24 20 100 Lebanon 6 19 26 41 8 100 Morocco 12 33 11 4 41 100
Middle East Palestinian ter. 27 35 12 21 4 100
Pakistan 21 22 6 8 43 100 Bangladesh 45 37 9 3 5 100 Indonesia 4 38 16 3 38 100
Asia Malaysia 2 32 18 7 41 100
Ethiopia 8 13 31 36 13 100 Ivory Coast 2 21 36 37 4 100 Mali 4 20 28 30 17 100 Nigeria 12 20 17 25 26 100 Senegal 3 16 21 30 30 100
Africa
Tanzania 5 9 9 28 49 100 Q.16N THROUGH Q.16Z HELD FOR FUTURE RELEASE
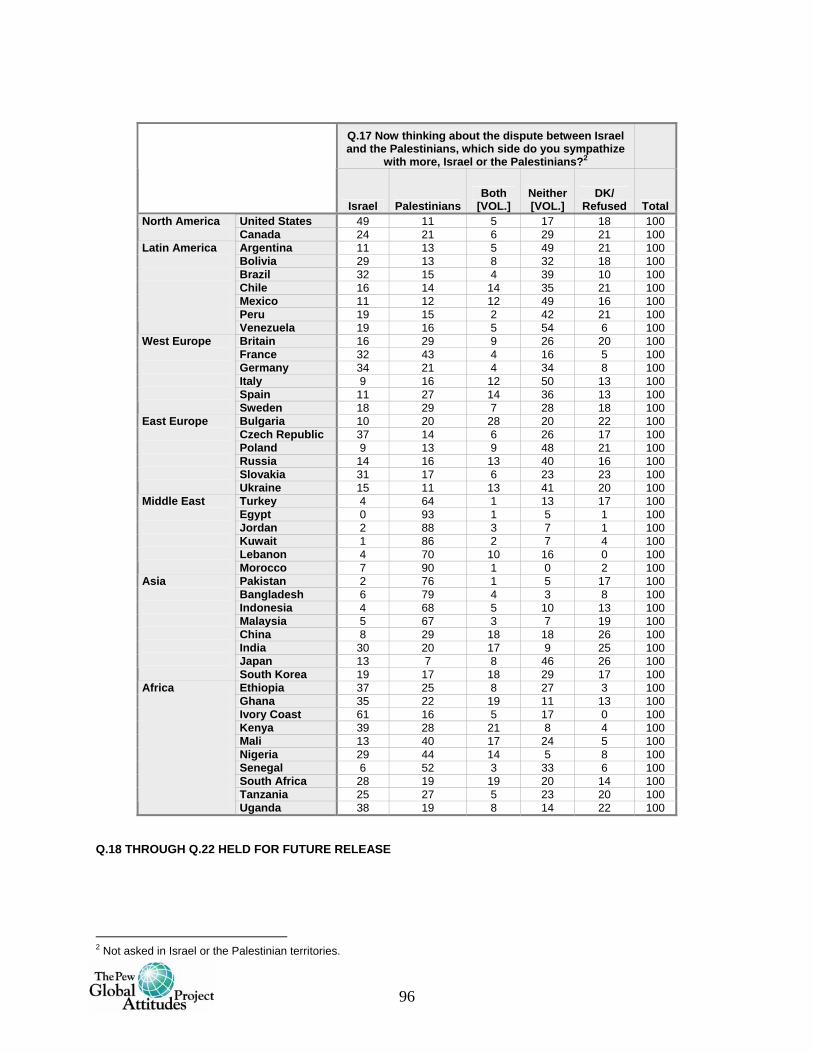
96
Q.17 Now thinking about the dispute between Israel and the Palestinians, which side do you sympathize
with more, Israel or the Palestinians?2
Israel Palestinians
Both [VOL.]
Neither [VOL.]
DK/ Refused Total
United States 49 11 5 17 18 100 North America Canada 24 21 6 29 21 100
Argentina 11 13 5 49 21 100 Bolivia 29 13 8 32 18 100 Brazil 32 15 4 39 10 100 Chile 16 14 14 35 21 100 Mexico 11 12 12 49 16 100 Peru 19 15 2 42 21 100
Latin America Venezuela 19 16 5 54 6 100
Britain 16 29 9 26 20 100 France 32 43 4 16 5 100 Germany 34 21 4 34 8 100 Italy 9 16 12 50 13 100 Spain 11 27 14 36 13 100
West Europe Sweden 18 29 7 28 18 100
Bulgaria 10 20 28 20 22 100 Czech Republic 37 14 6 26 17 100 Poland 9 13 9 48 21 100 Russia 14 16 13 40 16 100 Slovakia 31 17 6 23 23 100
East Europe Ukraine 15 11 13 41 20 100
Turkey 4 64 1 13 17 100 Egypt 0 93 1 5 1 100 Jordan 2 88 3 7 1 100 Kuwait 1 86 2 7 4 100 Lebanon 4 70 10 16 0 100
Middle East Morocco 7 90 1 0 2 100
Pakistan 2 76 1 5 17 100 Bangladesh 6 79 4 3 8 100 Indonesia 4 68 5 10 13 100 Malaysia 5 67 3 7 19 100 China 8 29 18 18 26 100 India 30 20 17 9 25 100 Japan 13 7 8 46 26 100
Asia South Korea 19 17 18 29 17 100
Ethiopia 37 25 8 27 3 100 Ghana 35 22 19 11 13 100 Ivory Coast 61 16 5 17 0 100 Kenya 39 28 21 8 4 100 Mali 13 40 17 24 5 100 Nigeria 29 44 14 5 8 100 Senegal 6 52 3 33 6 100 South Africa 28 19 19 20 14 100 Tanzania 25 27 5 23 20 100
Africa Uganda 38 19 8 14 22 100
Q.18 THROUGH Q.22 HELD FOR FUTURE RELEASE
2 Not asked in Israel or the Palestinian territories.
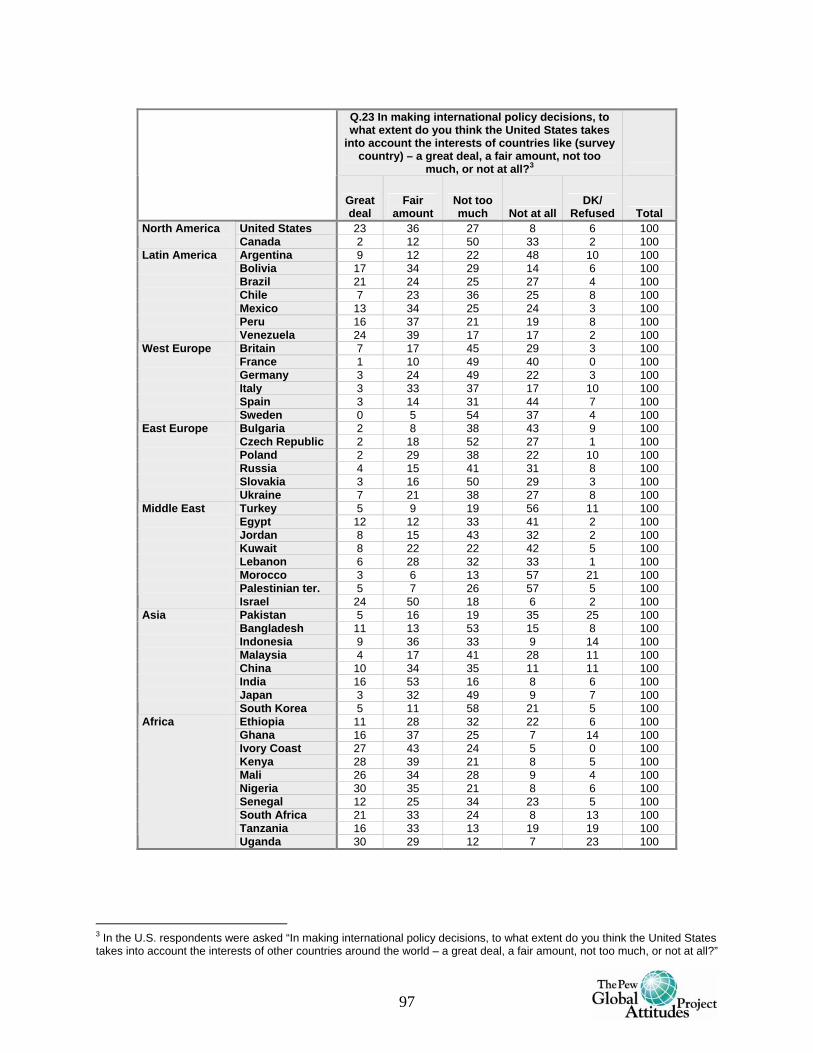
97
Q.23 In making international policy decisions, to what extent do you think the United States takes
into account the interests of countries like (survey country) – a great deal, a fair amount, not too
much, or not at all?3
Great deal
Fair amount
Not too much Not at all
DK/ Refused Total
United States 23 36 27 8 6 100 North America Canada 2 12 50 33 2 100
Argentina 9 12 22 48 10 100 Bolivia 17 34 29 14 6 100 Brazil 21 24 25 27 4 100 Chile 7 23 36 25 8 100 Mexico 13 34 25 24 3 100 Peru 16 37 21 19 8 100
Latin America Venezuela 24 39 17 17 2 100
Britain 7 17 45 29 3 100 France 1 10 49 40 0 100 Germany 3 24 49 22 3 100 Italy 3 33 37 17 10 100 Spain 3 14 31 44 7 100
West Europe Sweden 0 5 54 37 4 100
Bulgaria 2 8 38 43 9 100 Czech Republic 2 18 52 27 1 100 Poland 2 29 38 22 10 100 Russia 4 15 41 31 8 100 Slovakia 3 16 50 29 3 100
East Europe Ukraine 7 21 38 27 8 100
Turkey 5 9 19 56 11 100 Egypt 12 12 33 41 2 100 Jordan 8 15 43 32 2 100 Kuwait 8 22 22 42 5 100 Lebanon 6 28 32 33 1 100 Morocco 3 6 13 57 21 100 Palestinian ter. 5 7 26 57 5 100
Middle East Israel 24 50 18 6 2 100
Pakistan 5 16 19 35 25 100 Bangladesh 11 13 53 15 8 100 Indonesia 9 36 33 9 14 100 Malaysia 4 17 41 28 11 100 China 10 34 35 11 11 100 India 16 53 16 8 6 100 Japan 3 32 49 9 7 100
Asia South Korea 5 11 58 21 5 100
Ethiopia 11 28 32 22 6 100 Ghana 16 37 25 7 14 100 Ivory Coast 27 43 24 5 0 100 Kenya 28 39 21 8 5 100 Mali 26 34 28 9 4 100 Nigeria 30 35 21 8 6 100 Senegal 12 25 34 23 5 100 South Africa 21 33 24 8 13 100 Tanzania 16 33 13 19 19 100
Africa Uganda 30 29 12 7 23 100
3 In the U.S. respondents were asked “In making international policy decisions, to what extent do you think the United States takes into account the interests of other countries around the world – a great deal, a fair amount, not too much, or not at all?”
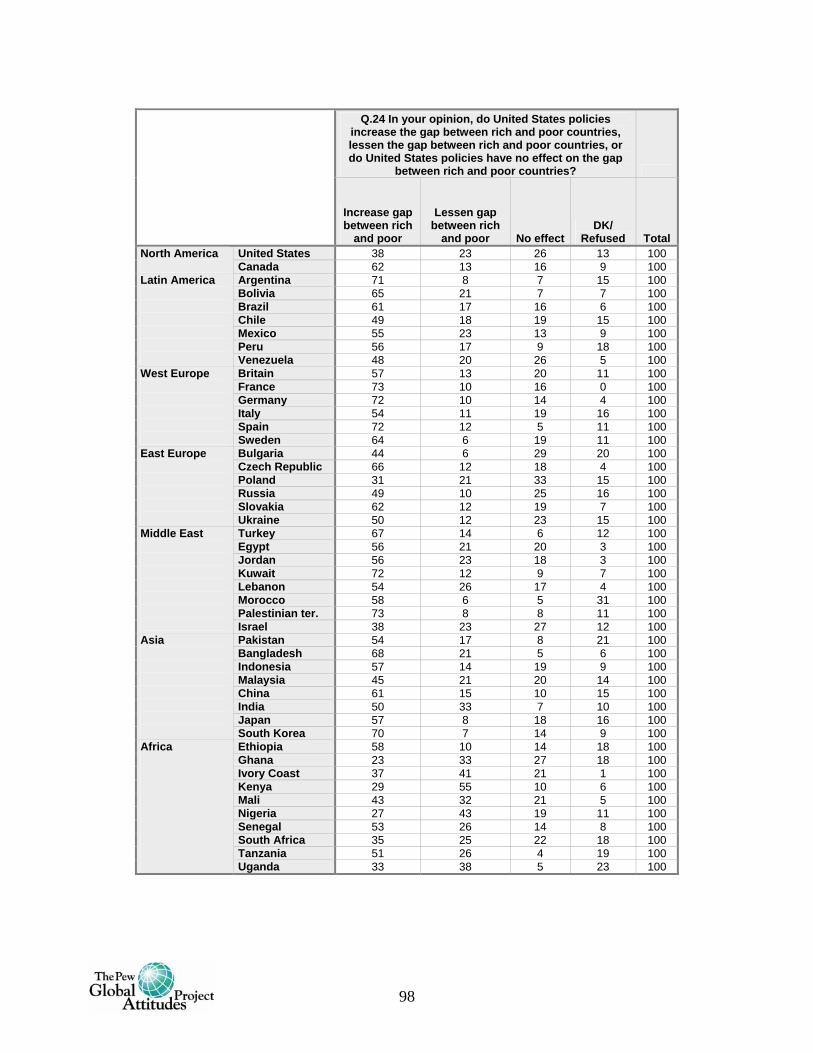
98
Q.24 In your opinion, do United States policies
increase the gap between rich and poor countries, lessen the gap between rich and poor countries, or do United States policies have no effect on the gap
between rich and poor countries?
Increase gap between rich
and poor
Lessen gap between rich
and poor No effectDK/
Refused Total United States 38 23 26 13 100 North America
Canada 62 13 16 9 100 Argentina 71 8 7 15 100 Bolivia 65 21 7 7 100 Brazil 61 17 16 6 100 Chile 49 18 19 15 100 Mexico 55 23 13 9 100 Peru 56 17 9 18 100
Latin America Venezuela 48 20 26 5 100
Britain 57 13 20 11 100 France 73 10 16 0 100 Germany 72 10 14 4 100 Italy 54 11 19 16 100 Spain 72 12 5 11 100
West Europe Sweden 64 6 19 11 100
Bulgaria 44 6 29 20 100 Czech Republic 66 12 18 4 100 Poland 31 21 33 15 100 Russia 49 10 25 16 100 Slovakia 62 12 19 7 100
East Europe Ukraine 50 12 23 15 100
Turkey 67 14 6 12 100 Egypt 56 21 20 3 100 Jordan 56 23 18 3 100 Kuwait 72 12 9 7 100 Lebanon 54 26 17 4 100 Morocco 58 6 5 31 100 Palestinian ter. 73 8 8 11 100
Middle East Israel 38 23 27 12 100
Pakistan 54 17 8 21 100 Bangladesh 68 21 5 6 100 Indonesia 57 14 19 9 100 Malaysia 45 21 20 14 100 China 61 15 10 15 100 India 50 33 7 10 100 Japan 57 8 18 16 100
Asia South Korea 70 7 14 9 100
Ethiopia 58 10 14 18 100 Ghana 23 33 27 18 100 Ivory Coast 37 41 21 1 100 Kenya 29 55 10 6 100 Mali 43 32 21 5 100 Nigeria 27 43 19 11 100 Senegal 53 26 14 8 100 South Africa 35 25 22 18 100 Tanzania 51 26 4 19 100
Africa Uganda 33 38 5 23 100
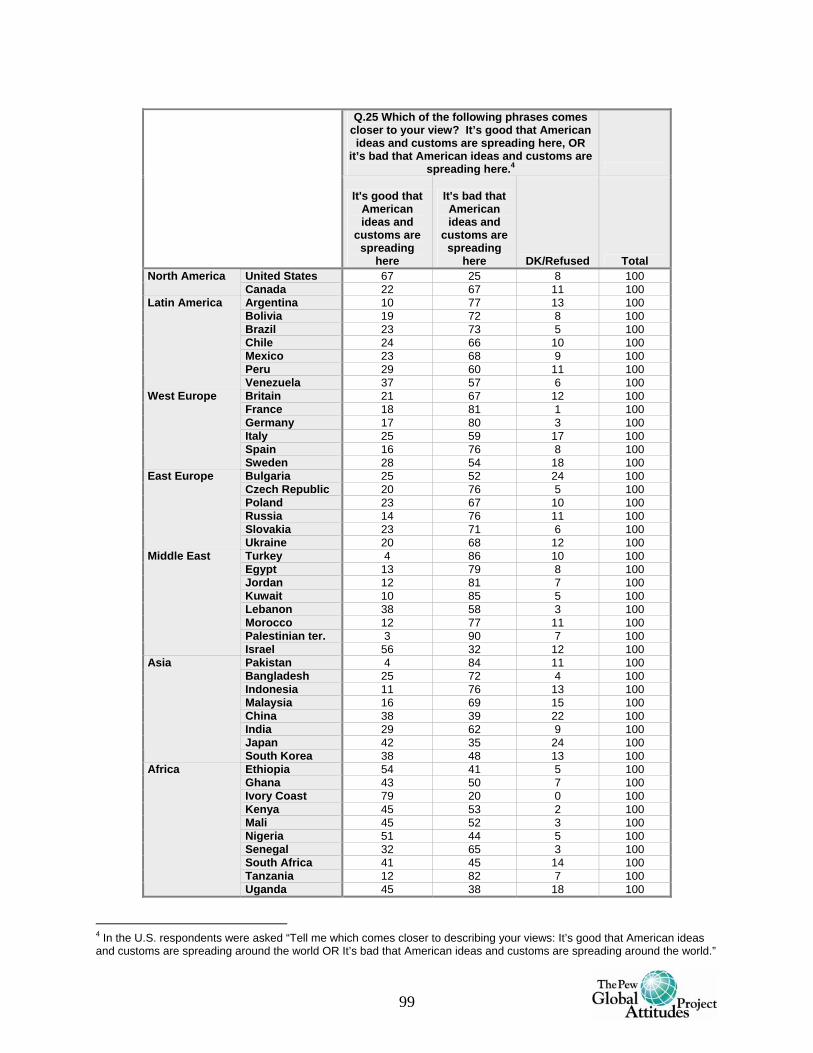
99
Q.25 Which of the following phrases comes
closer to your view? It’s good that American ideas and customs are spreading here, OR
it’s bad that American ideas and customs are spreading here.4
It's good that American ideas and
customs are spreading
here
It's bad that American ideas and
customs are spreading
here DK/Refused Total United States 67 25 8 100 North America Canada 22 67 11 100 Argentina 10 77 13 100 Bolivia 19 72 8 100 Brazil 23 73 5 100 Chile 24 66 10 100 Mexico 23 68 9 100 Peru 29 60 11 100
Latin America
Venezuela 37 57 6 100 Britain 21 67 12 100 France 18 81 1 100 Germany 17 80 3 100 Italy 25 59 17 100 Spain 16 76 8 100
West Europe
Sweden 28 54 18 100 Bulgaria 25 52 24 100 Czech Republic 20 76 5 100 Poland 23 67 10 100 Russia 14 76 11 100 Slovakia 23 71 6 100
East Europe
Ukraine 20 68 12 100 Turkey 4 86 10 100 Egypt 13 79 8 100 Jordan 12 81 7 100 Kuwait 10 85 5 100 Lebanon 38 58 3 100 Morocco 12 77 11 100 Palestinian ter. 3 90 7 100
Middle East
Israel 56 32 12 100 Pakistan 4 84 11 100 Bangladesh 25 72 4 100 Indonesia 11 76 13 100 Malaysia 16 69 15 100 China 38 39 22 100 India 29 62 9 100 Japan 42 35 24 100
Asia
South Korea 38 48 13 100 Ethiopia 54 41 5 100 Ghana 43 50 7 100 Ivory Coast 79 20 0 100 Kenya 45 53 2 100 Mali 45 52 3 100 Nigeria 51 44 5 100 Senegal 32 65 3 100 South Africa 41 45 14 100 Tanzania 12 82 7 100
Africa
Uganda 45 38 18 100
4 In the U.S. respondents were asked “Tell me which comes closer to describing your views: It’s good that American ideas and customs are spreading around the world OR It’s bad that American ideas and customs are spreading around the world.”
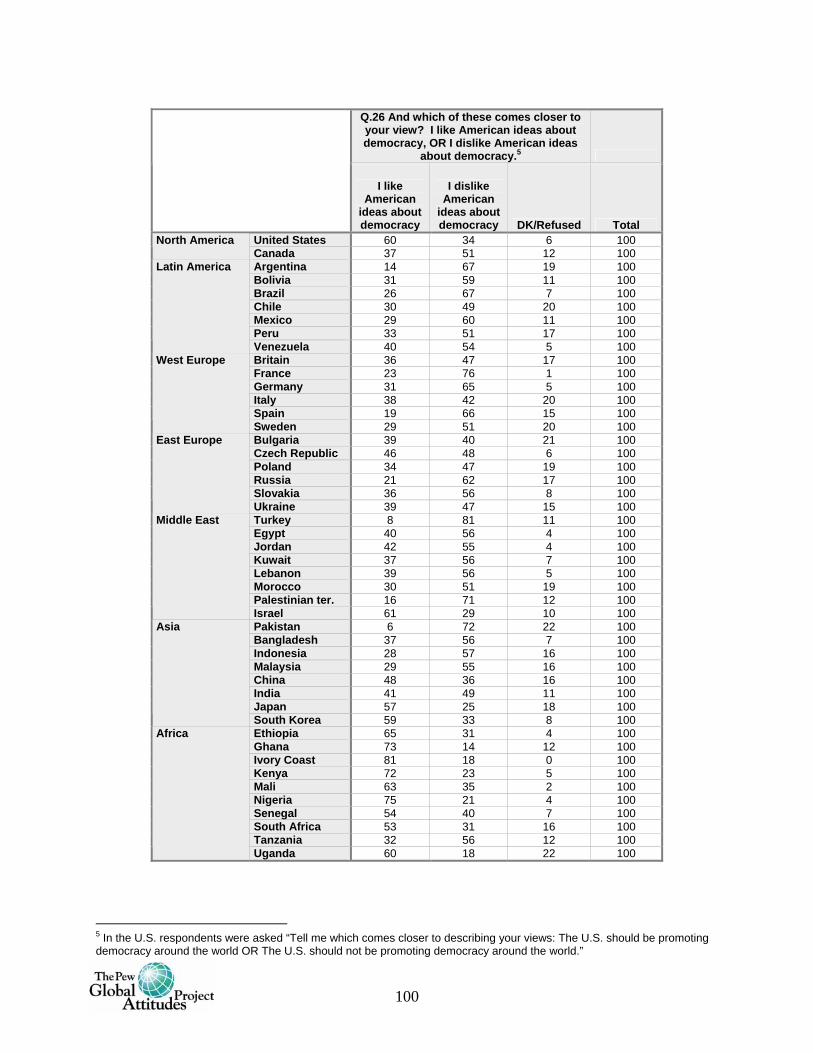
100
Q.26 And which of these comes closer to your view? I like American ideas about democracy, OR I dislike American ideas
about democracy.5
I like American
ideas about democracy
I dislike American
ideas about democracy DK/Refused Total
United States 60 34 6 100 North America Canada 37 51 12 100 Argentina 14 67 19 100 Bolivia 31 59 11 100 Brazil 26 67 7 100 Chile 30 49 20 100 Mexico 29 60 11 100 Peru 33 51 17 100
Latin America
Venezuela 40 54 5 100 Britain 36 47 17 100 France 23 76 1 100 Germany 31 65 5 100 Italy 38 42 20 100 Spain 19 66 15 100
West Europe
Sweden 29 51 20 100 Bulgaria 39 40 21 100 Czech Republic 46 48 6 100 Poland 34 47 19 100 Russia 21 62 17 100 Slovakia 36 56 8 100
East Europe
Ukraine 39 47 15 100 Turkey 8 81 11 100 Egypt 40 56 4 100 Jordan 42 55 4 100 Kuwait 37 56 7 100 Lebanon 39 56 5 100 Morocco 30 51 19 100 Palestinian ter. 16 71 12 100
Middle East
Israel 61 29 10 100 Pakistan 6 72 22 100 Bangladesh 37 56 7 100 Indonesia 28 57 16 100 Malaysia 29 55 16 100 China 48 36 16 100 India 41 49 11 100 Japan 57 25 18 100
Asia
South Korea 59 33 8 100 Ethiopia 65 31 4 100 Ghana 73 14 12 100 Ivory Coast 81 18 0 100 Kenya 72 23 5 100 Mali 63 35 2 100 Nigeria 75 21 4 100 Senegal 54 40 7 100 South Africa 53 31 16 100 Tanzania 32 56 12 100
Africa
Uganda 60 18 22 100
5 In the U.S. respondents were asked “Tell me which comes closer to describing your views: The U.S. should be promoting democracy around the world OR The U.S. should not be promoting democracy around the world.”
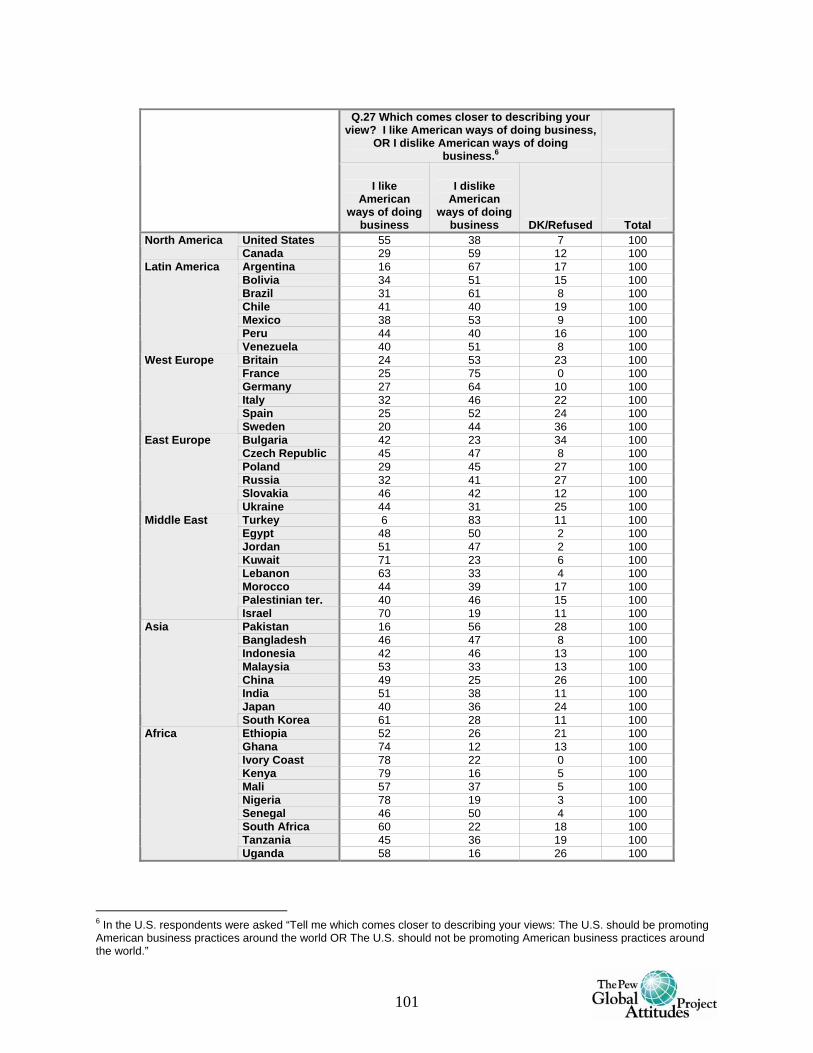
101
Q.27 Which comes closer to describing your
view? I like American ways of doing business, OR I dislike American ways of doing
business.6
I like American
ways of doing business
I dislike American
ways of doing business DK/Refused Total
United States 55 38 7 100 North America Canada 29 59 12 100 Argentina 16 67 17 100 Bolivia 34 51 15 100 Brazil 31 61 8 100 Chile 41 40 19 100 Mexico 38 53 9 100 Peru 44 40 16 100
Latin America
Venezuela 40 51 8 100 Britain 24 53 23 100 France 25 75 0 100 Germany 27 64 10 100 Italy 32 46 22 100 Spain 25 52 24 100
West Europe
Sweden 20 44 36 100 Bulgaria 42 23 34 100 Czech Republic 45 47 8 100 Poland 29 45 27 100 Russia 32 41 27 100 Slovakia 46 42 12 100
East Europe
Ukraine 44 31 25 100 Turkey 6 83 11 100 Egypt 48 50 2 100 Jordan 51 47 2 100 Kuwait 71 23 6 100 Lebanon 63 33 4 100 Morocco 44 39 17 100 Palestinian ter. 40 46 15 100
Middle East
Israel 70 19 11 100 Pakistan 16 56 28 100 Bangladesh 46 47 8 100 Indonesia 42 46 13 100 Malaysia 53 33 13 100 China 49 25 26 100 India 51 38 11 100 Japan 40 36 24 100
Asia
South Korea 61 28 11 100 Ethiopia 52 26 21 100 Ghana 74 12 13 100 Ivory Coast 78 22 0 100 Kenya 79 16 5 100 Mali 57 37 5 100 Nigeria 78 19 3 100 Senegal 46 50 4 100 South Africa 60 22 18 100 Tanzania 45 36 19 100
Africa
Uganda 58 16 26 100
6 In the U.S. respondents were asked “Tell me which comes closer to describing your views: The U.S. should be promoting American business practices around the world OR The U.S. should not be promoting American business practices around the world.”
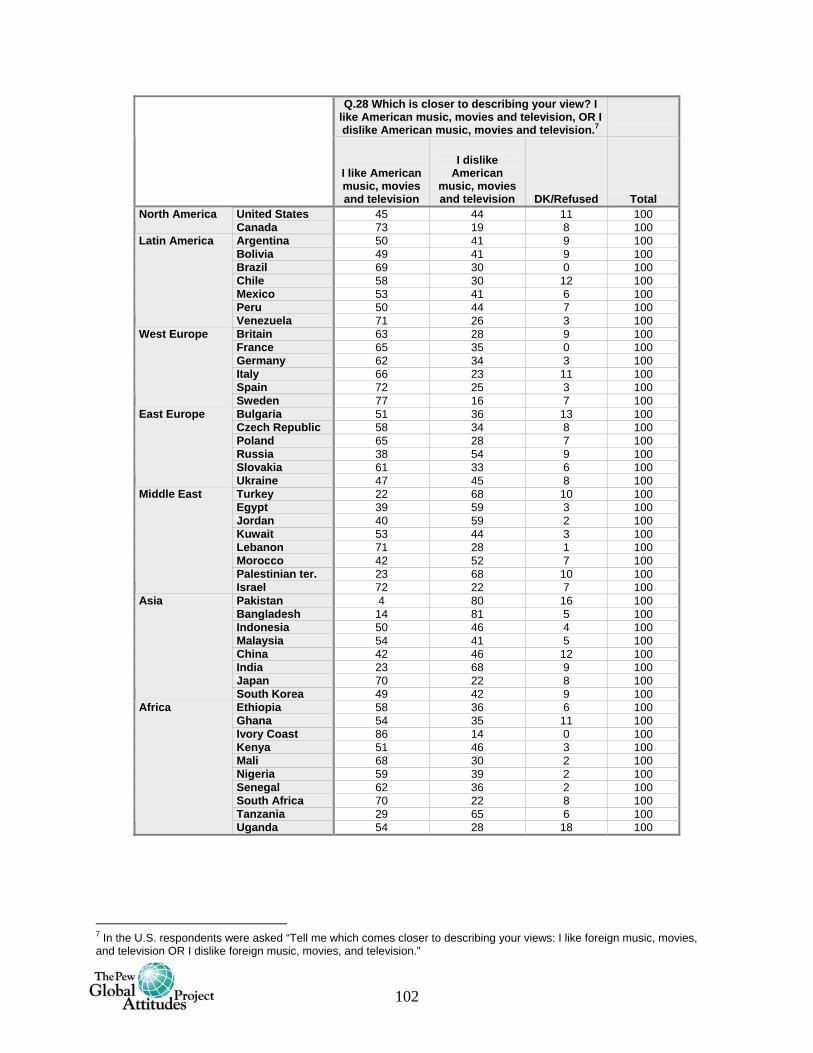
102
Q.28 Which is closer to describing your view? I like American music, movies and television, OR I dislike American music, movies and television.7
I like American music, movies and television
I dislike American
music, movies and television DK/Refused Total
United States 45 44 11 100 North America Canada 73 19 8 100 Argentina 50 41 9 100 Bolivia 49 41 9 100 Brazil 69 30 0 100 Chile 58 30 12 100 Mexico 53 41 6 100 Peru 50 44 7 100
Latin America
Venezuela 71 26 3 100 Britain 63 28 9 100 France 65 35 0 100 Germany 62 34 3 100 Italy 66 23 11 100 Spain 72 25 3 100
West Europe
Sweden 77 16 7 100 Bulgaria 51 36 13 100 Czech Republic 58 34 8 100 Poland 65 28 7 100 Russia 38 54 9 100 Slovakia 61 33 6 100
East Europe
Ukraine 47 45 8 100 Turkey 22 68 10 100 Egypt 39 59 3 100 Jordan 40 59 2 100 Kuwait 53 44 3 100 Lebanon 71 28 1 100 Morocco 42 52 7 100 Palestinian ter. 23 68 10 100
Middle East
Israel 72 22 7 100 Pakistan 4 80 16 100 Bangladesh 14 81 5 100 Indonesia 50 46 4 100 Malaysia 54 41 5 100 China 42 46 12 100 India 23 68 9 100 Japan 70 22 8 100
Asia
South Korea 49 42 9 100 Ethiopia 58 36 6 100 Ghana 54 35 11 100 Ivory Coast 86 14 0 100 Kenya 51 46 3 100 Mali 68 30 2 100 Nigeria 59 39 2 100 Senegal 62 36 2 100 South Africa 70 22 8 100 Tanzania 29 65 6 100
Africa
Uganda 54 28 18 100
7 In the U.S. respondents were asked “Tell me which comes closer to describing your views: I like foreign music, movies, and television OR I dislike foreign music, movies, and television.”
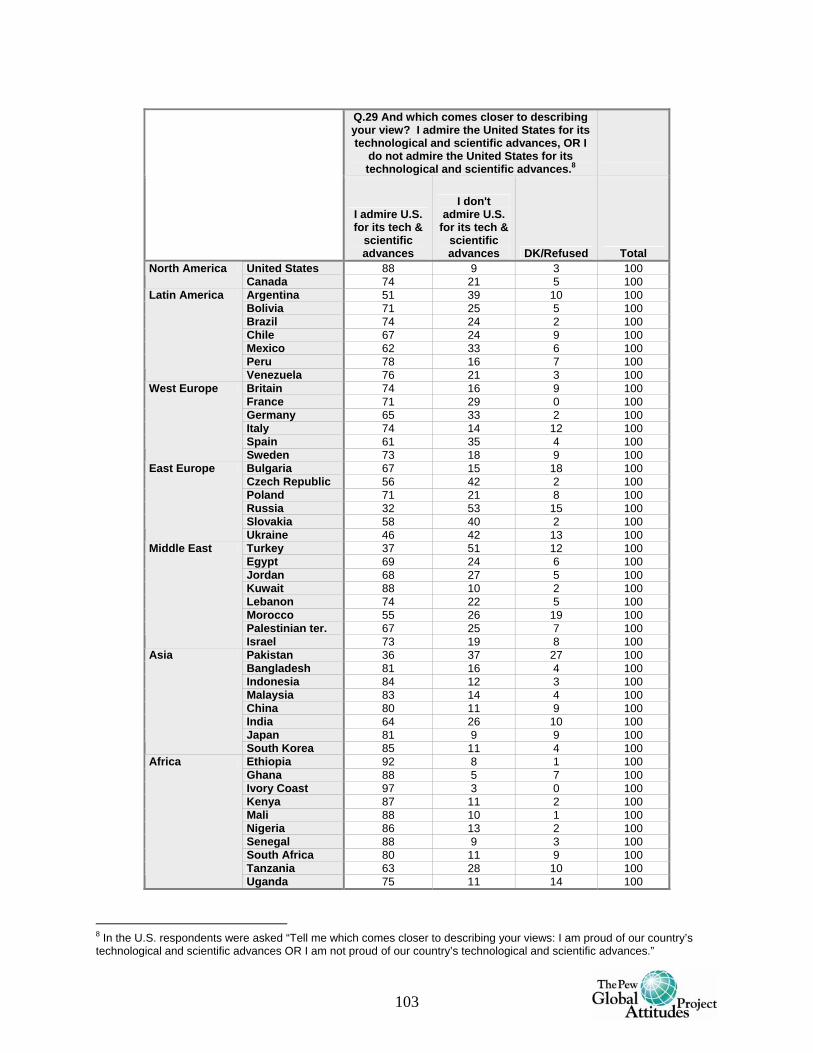
103
Q.29 And which comes closer to describing your view? I admire the United States for its technological and scientific advances, OR I
do not admire the United States for its technological and scientific advances.8
I admire U.S. for its tech &
scientific advances
I don't admire U.S.
for its tech & scientific advances DK/Refused Total
United States 88 9 3 100 North America Canada 74 21 5 100 Argentina 51 39 10 100 Bolivia 71 25 5 100 Brazil 74 24 2 100 Chile 67 24 9 100 Mexico 62 33 6 100 Peru 78 16 7 100
Latin America
Venezuela 76 21 3 100 Britain 74 16 9 100 France 71 29 0 100 Germany 65 33 2 100 Italy 74 14 12 100 Spain 61 35 4 100
West Europe
Sweden 73 18 9 100 Bulgaria 67 15 18 100 Czech Republic 56 42 2 100 Poland 71 21 8 100 Russia 32 53 15 100 Slovakia 58 40 2 100
East Europe
Ukraine 46 42 13 100 Turkey 37 51 12 100 Egypt 69 24 6 100 Jordan 68 27 5 100 Kuwait 88 10 2 100 Lebanon 74 22 5 100 Morocco 55 26 19 100 Palestinian ter. 67 25 7 100
Middle East
Israel 73 19 8 100 Pakistan 36 37 27 100 Bangladesh 81 16 4 100 Indonesia 84 12 3 100 Malaysia 83 14 4 100 China 80 11 9 100 India 64 26 10 100 Japan 81 9 9 100
Asia
South Korea 85 11 4 100 Ethiopia 92 8 1 100 Ghana 88 5 7 100 Ivory Coast 97 3 0 100 Kenya 87 11 2 100 Mali 88 10 1 100 Nigeria 86 13 2 100 Senegal 88 9 3 100 South Africa 80 11 9 100 Tanzania 63 28 10 100
Africa
Uganda 75 11 14 100
8 In the U.S. respondents were asked “Tell me which comes closer to describing your views: I am proud of our country’s technological and scientific advances OR I am not proud of our country’s technological and scientific advances.”
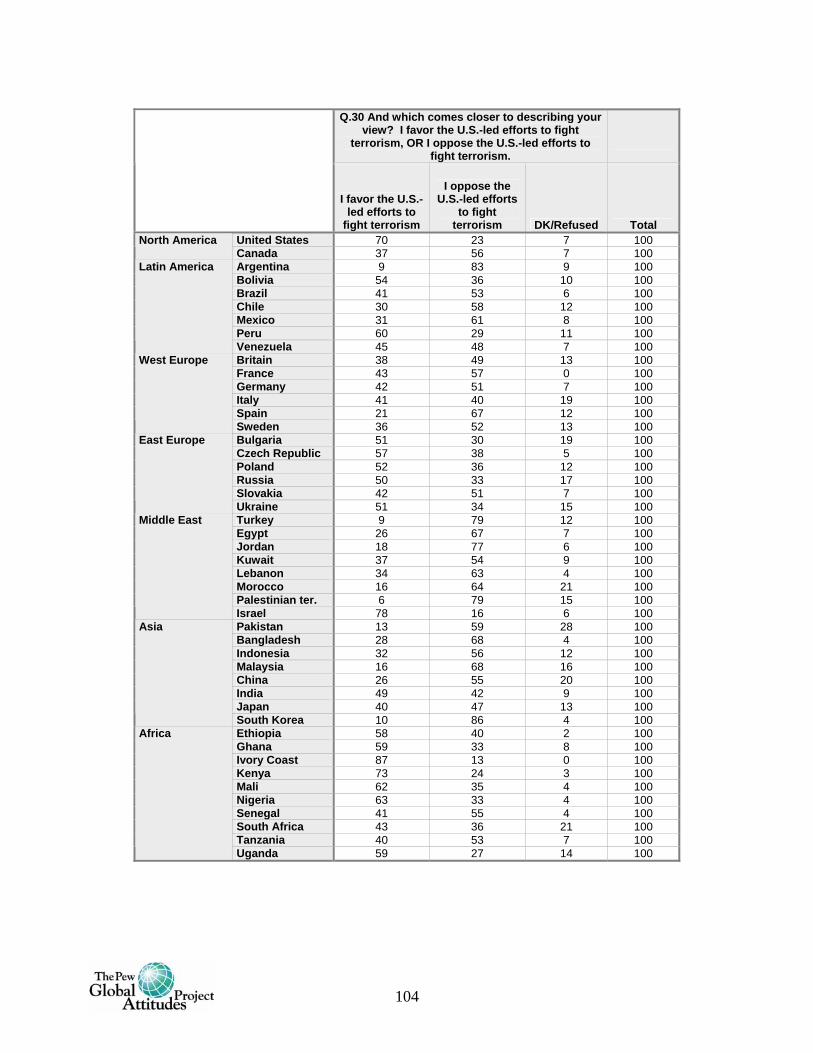
104
Q.30 And which comes closer to describing your
view? I favor the U.S.-led efforts to fight terrorism, OR I oppose the U.S.-led efforts to
fight terrorism.
I favor the U.S.-led efforts to
fight terrorism
I oppose the U.S.-led efforts
to fight terrorism DK/Refused Total
United States 70 23 7 100 North America Canada 37 56 7 100 Argentina 9 83 9 100 Bolivia 54 36 10 100 Brazil 41 53 6 100 Chile 30 58 12 100 Mexico 31 61 8 100 Peru 60 29 11 100
Latin America
Venezuela 45 48 7 100 Britain 38 49 13 100 France 43 57 0 100 Germany 42 51 7 100 Italy 41 40 19 100 Spain 21 67 12 100
West Europe
Sweden 36 52 13 100 Bulgaria 51 30 19 100 Czech Republic 57 38 5 100 Poland 52 36 12 100 Russia 50 33 17 100 Slovakia 42 51 7 100
East Europe
Ukraine 51 34 15 100 Turkey 9 79 12 100 Egypt 26 67 7 100 Jordan 18 77 6 100 Kuwait 37 54 9 100 Lebanon 34 63 4 100 Morocco 16 64 21 100 Palestinian ter. 6 79 15 100
Middle East
Israel 78 16 6 100 Pakistan 13 59 28 100 Bangladesh 28 68 4 100 Indonesia 32 56 12 100 Malaysia 16 68 16 100 China 26 55 20 100 India 49 42 9 100 Japan 40 47 13 100
Asia
South Korea 10 86 4 100 Ethiopia 58 40 2 100 Ghana 59 33 8 100 Ivory Coast 87 13 0 100 Kenya 73 24 3 100 Mali 62 35 4 100 Nigeria 63 33 4 100 Senegal 41 55 4 100 South Africa 43 36 21 100 Tanzania 40 53 7 100
Africa
Uganda 59 27 14 100
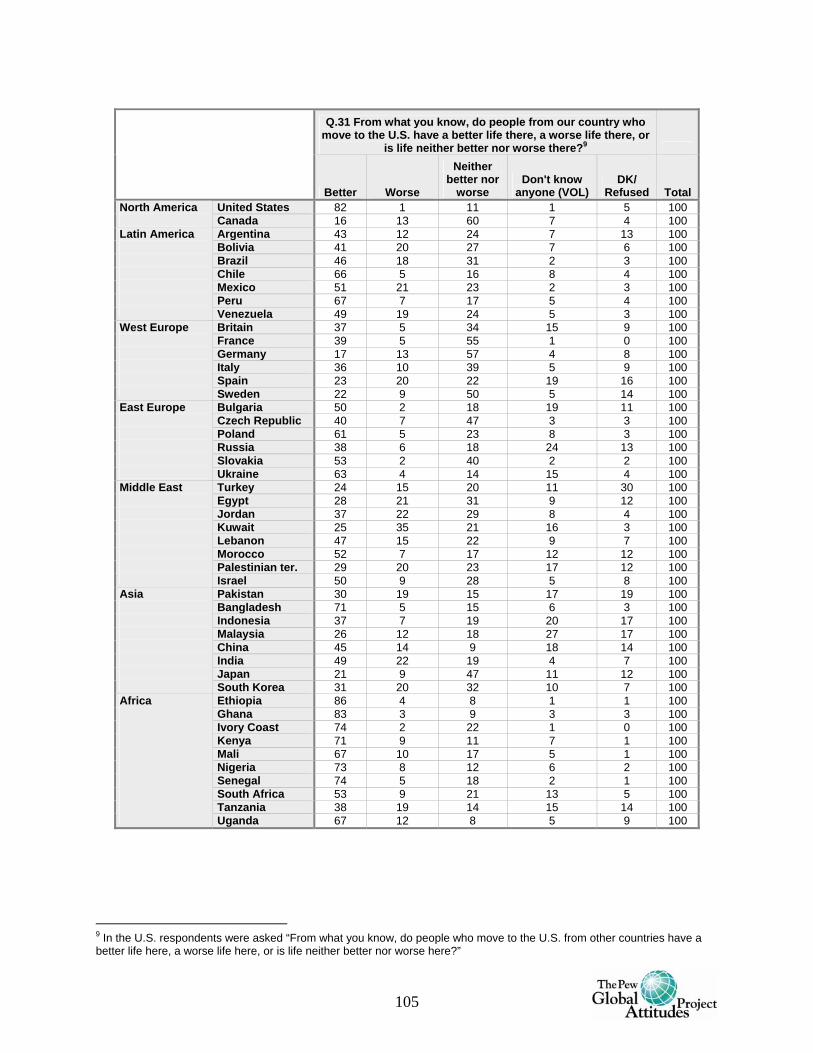
105
Q.31 From what you know, do people from our country who move to the U.S. have a better life there, a worse life there, or
is life neither better nor worse there?9
Better Worse
Neither better nor
worse Don't know
anyone (VOL) DK/
Refused Total United States 82 1 11 1 5 100 North America
Canada 16 13 60 7 4 100 Argentina 43 12 24 7 13 100 Bolivia 41 20 27 7 6 100 Brazil 46 18 31 2 3 100 Chile 66 5 16 8 4 100 Mexico 51 21 23 2 3 100 Peru 67 7 17 5 4 100
Latin America Venezuela 49 19 24 5 3 100
Britain 37 5 34 15 9 100 France 39 5 55 1 0 100 Germany 17 13 57 4 8 100 Italy 36 10 39 5 9 100 Spain 23 20 22 19 16 100
West Europe Sweden 22 9 50 5 14 100
Bulgaria 50 2 18 19 11 100 Czech Republic 40 7 47 3 3 100 Poland 61 5 23 8 3 100 Russia 38 6 18 24 13 100 Slovakia 53 2 40 2 2 100
East Europe Ukraine 63 4 14 15 4 100
Turkey 24 15 20 11 30 100 Egypt 28 21 31 9 12 100 Jordan 37 22 29 8 4 100 Kuwait 25 35 21 16 3 100 Lebanon 47 15 22 9 7 100 Morocco 52 7 17 12 12 100 Palestinian ter. 29 20 23 17 12 100
Middle East Israel 50 9 28 5 8 100
Pakistan 30 19 15 17 19 100 Bangladesh 71 5 15 6 3 100 Indonesia 37 7 19 20 17 100 Malaysia 26 12 18 27 17 100 China 45 14 9 18 14 100 India 49 22 19 4 7 100 Japan 21 9 47 11 12 100
Asia South Korea 31 20 32 10 7 100
Ethiopia 86 4 8 1 1 100 Ghana 83 3 9 3 3 100 Ivory Coast 74 2 22 1 0 100 Kenya 71 9 11 7 1 100 Mali 67 10 17 5 1 100 Nigeria 73 8 12 6 2 100 Senegal 74 5 18 2 1 100 South Africa 53 9 21 13 5 100 Tanzania 38 19 14 15 14 100
Africa Uganda 67 12 8 5 9 100
9 In the U.S. respondents were asked “From what you know, do people who move to the U.S. from other countries have a better life here, a worse life here, or is life neither better nor worse here?”
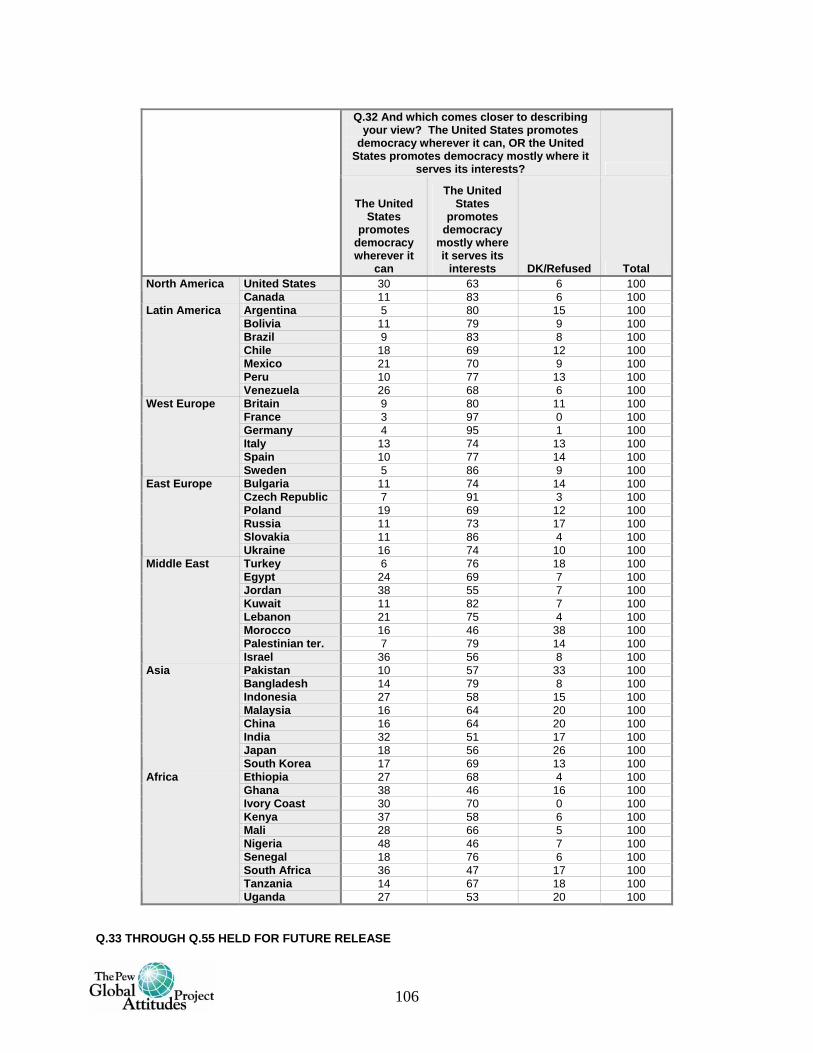
106
Q.32 And which comes closer to describing
your view? The United States promotes democracy wherever it can, OR the United
States promotes democracy mostly where it serves its interests?
The United States
promotes democracy wherever it
can
The United States
promotes democracy
mostly where it serves its
interests DK/Refused Total United States 30 63 6 100 North America Canada 11 83 6 100 Argentina 5 80 15 100 Bolivia 11 79 9 100 Brazil 9 83 8 100 Chile 18 69 12 100 Mexico 21 70 9 100 Peru 10 77 13 100
Latin America
Venezuela 26 68 6 100 Britain 9 80 11 100 France 3 97 0 100 Germany 4 95 1 100 Italy 13 74 13 100 Spain 10 77 14 100
West Europe
Sweden 5 86 9 100 Bulgaria 11 74 14 100 Czech Republic 7 91 3 100 Poland 19 69 12 100 Russia 11 73 17 100 Slovakia 11 86 4 100
East Europe
Ukraine 16 74 10 100 Turkey 6 76 18 100 Egypt 24 69 7 100 Jordan 38 55 7 100 Kuwait 11 82 7 100 Lebanon 21 75 4 100 Morocco 16 46 38 100 Palestinian ter. 7 79 14 100
Middle East
Israel 36 56 8 100 Pakistan 10 57 33 100 Bangladesh 14 79 8 100 Indonesia 27 58 15 100 Malaysia 16 64 20 100 China 16 64 20 100 India 32 51 17 100 Japan 18 56 26 100
Asia
South Korea 17 69 13 100 Ethiopia 27 68 4 100 Ghana 38 46 16 100 Ivory Coast 30 70 0 100 Kenya 37 58 6 100 Mali 28 66 5 100 Nigeria 48 46 7 100 Senegal 18 76 6 100 South Africa 36 47 17 100 Tanzania 14 67 18 100
Africa
Uganda 27 53 20 100 Q.33 THROUGH Q.55 HELD FOR FUTURE RELEASE
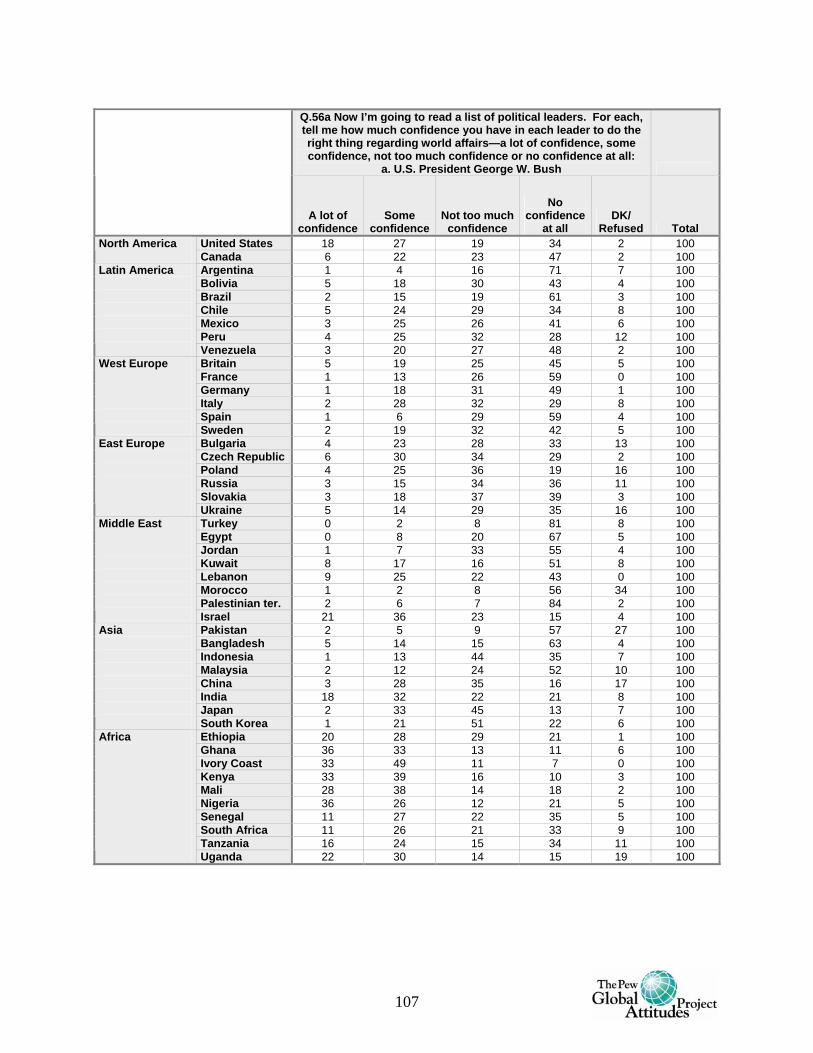
107
Q.56a Now I’m going to read a list of political leaders. For each, tell me how much confidence you have in each leader to do the right thing regarding world affairs—a lot of confidence, some confidence, not too much confidence or no confidence at all:
a. U.S. President George W. Bush
A lot of confidence
Some confidence
Not too much confidence
No confidence
at all DK/
Refused Total United States 18 27 19 34 2 100 North America
Canada 6 22 23 47 2 100 Argentina 1 4 16 71 7 100 Bolivia 5 18 30 43 4 100 Brazil 2 15 19 61 3 100 Chile 5 24 29 34 8 100 Mexico 3 25 26 41 6 100 Peru 4 25 32 28 12 100
Latin America Venezuela 3 20 27 48 2 100
Britain 5 19 25 45 5 100 France 1 13 26 59 0 100 Germany 1 18 31 49 1 100 Italy 2 28 32 29 8 100 Spain 1 6 29 59 4 100
West Europe Sweden 2 19 32 42 5 100
Bulgaria 4 23 28 33 13 100 Czech Republic 6 30 34 29 2 100 Poland 4 25 36 19 16 100 Russia 3 15 34 36 11 100 Slovakia 3 18 37 39 3 100
East Europe Ukraine 5 14 29 35 16 100
Turkey 0 2 8 81 8 100 Egypt 0 8 20 67 5 100 Jordan 1 7 33 55 4 100 Kuwait 8 17 16 51 8 100 Lebanon 9 25 22 43 0 100 Morocco 1 2 8 56 34 100 Palestinian ter. 2 6 7 84 2 100
Middle East Israel 21 36 23 15 4 100
Pakistan 2 5 9 57 27 100 Bangladesh 5 14 15 63 4 100 Indonesia 1 13 44 35 7 100 Malaysia 2 12 24 52 10 100 China 3 28 35 16 17 100 India 18 32 22 21 8 100 Japan 2 33 45 13 7 100
Asia South Korea 1 21 51 22 6 100
Ethiopia 20 28 29 21 1 100 Ghana 36 33 13 11 6 100 Ivory Coast 33 49 11 7 0 100 Kenya 33 39 16 10 3 100 Mali 28 38 14 18 2 100 Nigeria 36 26 12 21 5 100 Senegal 11 27 22 35 5 100 South Africa 11 26 21 33 9 100 Tanzania 16 24 15 34 11 100
Africa Uganda 22 30 14 15 19 100
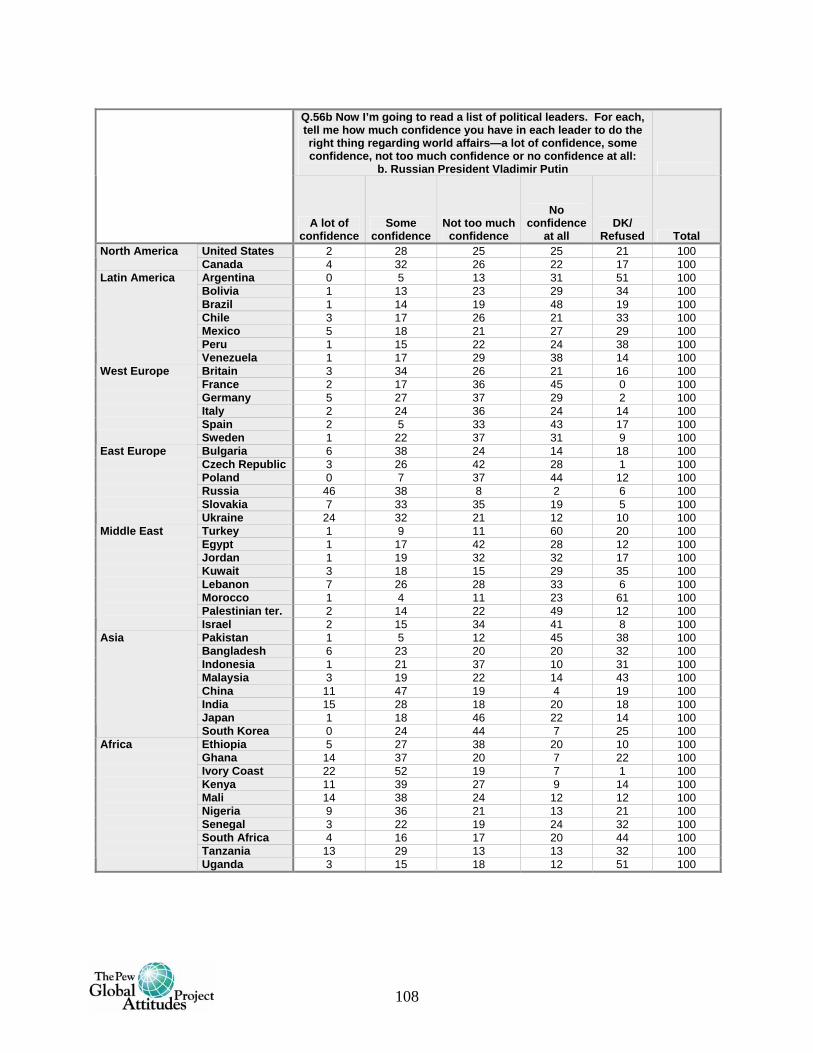
108
Q.56b Now I’m going to read a list of political leaders. For each, tell me how much confidence you have in each leader to do the right thing regarding world affairs—a lot of confidence, some confidence, not too much confidence or no confidence at all:
b. Russian President Vladimir Putin
A lot of confidence
Some confidence
Not too much confidence
No confidence
at all DK/
Refused Total United States 2 28 25 25 21 100 North America
Canada 4 32 26 22 17 100 Argentina 0 5 13 31 51 100 Bolivia 1 13 23 29 34 100 Brazil 1 14 19 48 19 100 Chile 3 17 26 21 33 100 Mexico 5 18 21 27 29 100 Peru 1 15 22 24 38 100
Latin America Venezuela 1 17 29 38 14 100
Britain 3 34 26 21 16 100 France 2 17 36 45 0 100 Germany 5 27 37 29 2 100 Italy 2 24 36 24 14 100 Spain 2 5 33 43 17 100
West Europe Sweden 1 22 37 31 9 100
Bulgaria 6 38 24 14 18 100 Czech Republic 3 26 42 28 1 100 Poland 0 7 37 44 12 100 Russia 46 38 8 2 6 100 Slovakia 7 33 35 19 5 100
East Europe Ukraine 24 32 21 12 10 100
Turkey 1 9 11 60 20 100 Egypt 1 17 42 28 12 100 Jordan 1 19 32 32 17 100 Kuwait 3 18 15 29 35 100 Lebanon 7 26 28 33 6 100 Morocco 1 4 11 23 61 100 Palestinian ter. 2 14 22 49 12 100
Middle East Israel 2 15 34 41 8 100
Pakistan 1 5 12 45 38 100 Bangladesh 6 23 20 20 32 100 Indonesia 1 21 37 10 31 100 Malaysia 3 19 22 14 43 100 China 11 47 19 4 19 100 India 15 28 18 20 18 100 Japan 1 18 46 22 14 100
Asia South Korea 0 24 44 7 25 100
Ethiopia 5 27 38 20 10 100 Ghana 14 37 20 7 22 100 Ivory Coast 22 52 19 7 1 100 Kenya 11 39 27 9 14 100 Mali 14 38 24 12 12 100 Nigeria 9 36 21 13 21 100 Senegal 3 22 19 24 32 100 South Africa 4 16 17 20 44 100 Tanzania 13 29 13 13 32 100
Africa Uganda 3 15 18 12 51 100
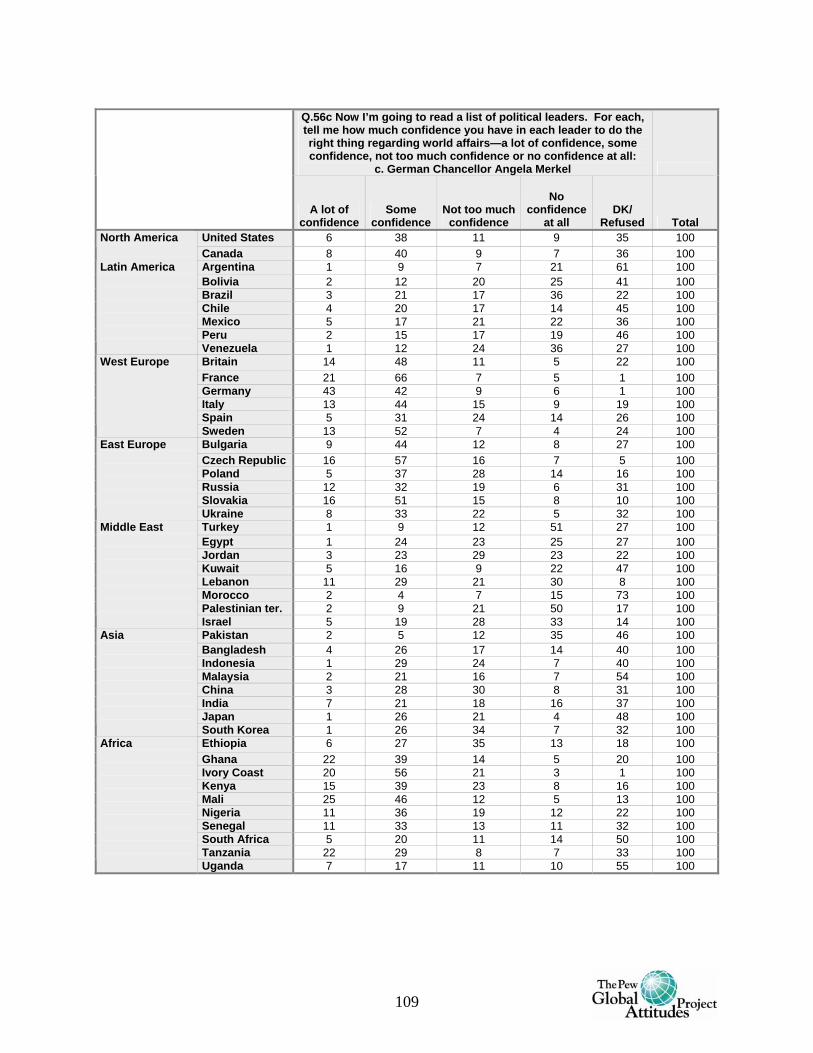
109
Q.56c Now I’m going to read a list of political leaders. For each, tell me how much confidence you have in each leader to do the right thing regarding world affairs—a lot of confidence, some confidence, not too much confidence or no confidence at all:
c. German Chancellor Angela Merkel
A lot of confidence
Some confidence
Not too much confidence
No confidence
at all DK/
Refused Total United States 6 38 11 9 35 100 North America
Canada 8 40 9 7 36 100 Argentina 1 9 7 21 61 100 Bolivia 2 12 20 25 41 100 Brazil 3 21 17 36 22 100 Chile 4 20 17 14 45 100 Mexico 5 17 21 22 36 100 Peru 2 15 17 19 46 100
Latin America Venezuela 1 12 24 36 27 100
Britain 14 48 11 5 22 100 France 21 66 7 5 1 100 Germany 43 42 9 6 1 100 Italy 13 44 15 9 19 100 Spain 5 31 24 14 26 100
West Europe Sweden 13 52 7 4 24 100
Bulgaria 9 44 12 8 27 100 Czech Republic 16 57 16 7 5 100 Poland 5 37 28 14 16 100 Russia 12 32 19 6 31 100 Slovakia 16 51 15 8 10 100
East Europe Ukraine 8 33 22 5 32 100
Turkey 1 9 12 51 27 100 Egypt 1 24 23 25 27 100 Jordan 3 23 29 23 22 100 Kuwait 5 16 9 22 47 100 Lebanon 11 29 21 30 8 100 Morocco 2 4 7 15 73 100 Palestinian ter. 2 9 21 50 17 100
Middle East Israel 5 19 28 33 14 100
Pakistan 2 5 12 35 46 100 Bangladesh 4 26 17 14 40 100 Indonesia 1 29 24 7 40 100 Malaysia 2 21 16 7 54 100 China 3 28 30 8 31 100 India 7 21 18 16 37 100 Japan 1 26 21 4 48 100
Asia South Korea 1 26 34 7 32 100
Ethiopia 6 27 35 13 18 100 Ghana 22 39 14 5 20 100 Ivory Coast 20 56 21 3 1 100 Kenya 15 39 23 8 16 100 Mali 25 46 12 5 13 100 Nigeria 11 36 19 12 22 100 Senegal 11 33 13 11 32 100 South Africa 5 20 11 14 50 100 Tanzania 22 29 8 7 33 100
Africa Uganda 7 17 11 10 55 100
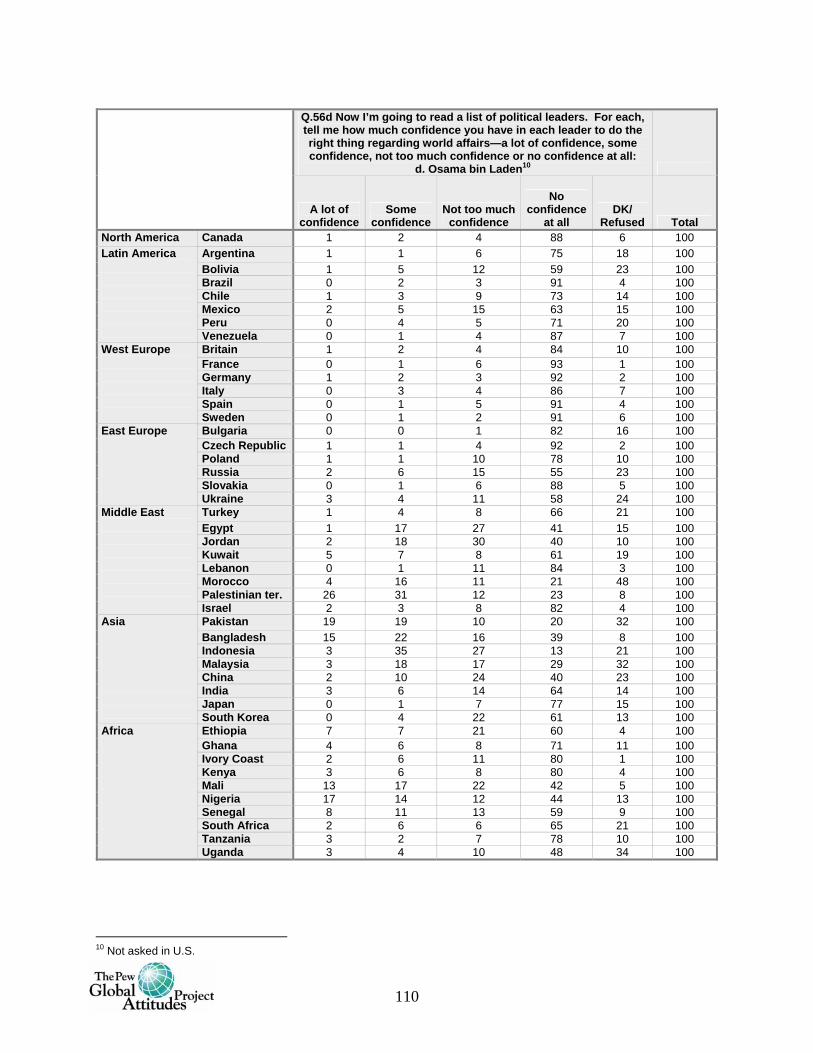
110
Q.56d Now I’m going to read a list of political leaders. For each, tell me how much confidence you have in each leader to do the right thing regarding world affairs—a lot of confidence, some confidence, not too much confidence or no confidence at all:
d. Osama bin Laden10
A lot of confidence
Some confidence
Not too much confidence
No confidence
at all DK/
Refused Total North America Canada 1 2 4 88 6 100
Argentina 1 1 6 75 18 100 Bolivia 1 5 12 59 23 100 Brazil 0 2 3 91 4 100 Chile 1 3 9 73 14 100 Mexico 2 5 15 63 15 100 Peru 0 4 5 71 20 100
Latin America Venezuela 0 1 4 87 7 100
Britain 1 2 4 84 10 100 France 0 1 6 93 1 100 Germany 1 2 3 92 2 100 Italy 0 3 4 86 7 100 Spain 0 1 5 91 4 100
West Europe Sweden 0 1 2 91 6 100
Bulgaria 0 0 1 82 16 100 Czech Republic 1 1 4 92 2 100 Poland 1 1 10 78 10 100 Russia 2 6 15 55 23 100 Slovakia 0 1 6 88 5 100
East Europe Ukraine 3 4 11 58 24 100
Turkey 1 4 8 66 21 100 Egypt 1 17 27 41 15 100 Jordan 2 18 30 40 10 100 Kuwait 5 7 8 61 19 100 Lebanon 0 1 11 84 3 100 Morocco 4 16 11 21 48 100 Palestinian ter. 26 31 12 23 8 100
Middle East Israel 2 3 8 82 4 100
Pakistan 19 19 10 20 32 100 Bangladesh 15 22 16 39 8 100 Indonesia 3 35 27 13 21 100 Malaysia 3 18 17 29 32 100 China 2 10 24 40 23 100 India 3 6 14 64 14 100 Japan 0 1 7 77 15 100
Asia South Korea 0 4 22 61 13 100
Ethiopia 7 7 21 60 4 100 Ghana 4 6 8 71 11 100 Ivory Coast 2 6 11 80 1 100 Kenya 3 6 8 80 4 100 Mali 13 17 22 42 5 100 Nigeria 17 14 12 44 13 100 Senegal 8 11 13 59 9 100 South Africa 2 6 6 65 21 100 Tanzania 3 2 7 78 10 100
Africa Uganda 3 4 10 48 34 100
10 Not asked in U.S.
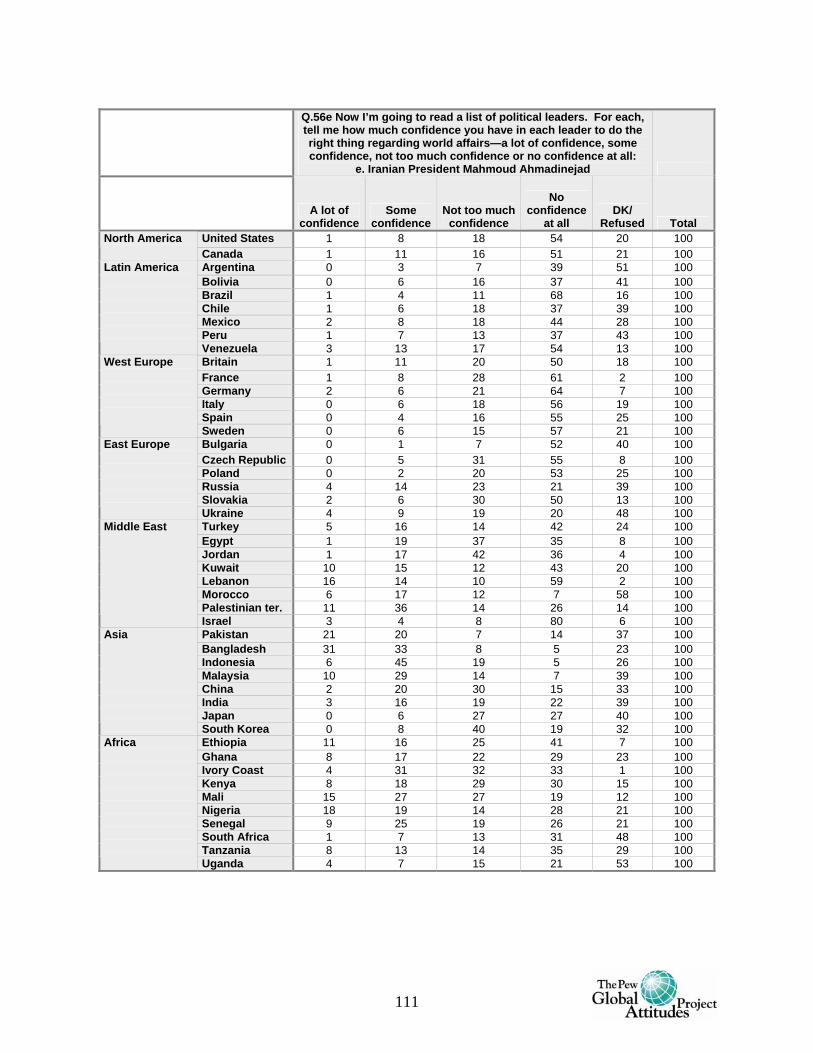
111
Q.56e Now I’m going to read a list of political leaders. For each, tell me how much confidence you have in each leader to do the right thing regarding world affairs—a lot of confidence, some confidence, not too much confidence or no confidence at all:
e. Iranian President Mahmoud Ahmadinejad
A lot of
confidenceSome
confidenceNot too much
confidence
No confidence
at all DK/
Refused Total United States 1 8 18 54 20 100 North America
Canada 1 11 16 51 21 100 Argentina 0 3 7 39 51 100 Bolivia 0 6 16 37 41 100 Brazil 1 4 11 68 16 100 Chile 1 6 18 37 39 100 Mexico 2 8 18 44 28 100 Peru 1 7 13 37 43 100
Latin America Venezuela 3 13 17 54 13 100
Britain 1 11 20 50 18 100 France 1 8 28 61 2 100 Germany 2 6 21 64 7 100 Italy 0 6 18 56 19 100 Spain 0 4 16 55 25 100
West Europe Sweden 0 6 15 57 21 100
Bulgaria 0 1 7 52 40 100 Czech Republic 0 5 31 55 8 100 Poland 0 2 20 53 25 100 Russia 4 14 23 21 39 100 Slovakia 2 6 30 50 13 100
East Europe Ukraine 4 9 19 20 48 100
Turkey 5 16 14 42 24 100 Egypt 1 19 37 35 8 100 Jordan 1 17 42 36 4 100 Kuwait 10 15 12 43 20 100 Lebanon 16 14 10 59 2 100 Morocco 6 17 12 7 58 100 Palestinian ter. 11 36 14 26 14 100
Middle East Israel 3 4 8 80 6 100
Pakistan 21 20 7 14 37 100 Bangladesh 31 33 8 5 23 100 Indonesia 6 45 19 5 26 100 Malaysia 10 29 14 7 39 100 China 2 20 30 15 33 100 India 3 16 19 22 39 100 Japan 0 6 27 27 40 100
Asia South Korea 0 8 40 19 32 100
Ethiopia 11 16 25 41 7 100 Ghana 8 17 22 29 23 100 Ivory Coast 4 31 32 33 1 100 Kenya 8 18 29 30 15 100 Mali 15 27 27 19 12 100 Nigeria 18 19 14 28 21 100 Senegal 9 25 19 26 21 100 South Africa 1 7 13 31 48 100 Tanzania 8 13 14 35 29 100
Africa Uganda 4 7 15 21 53 100
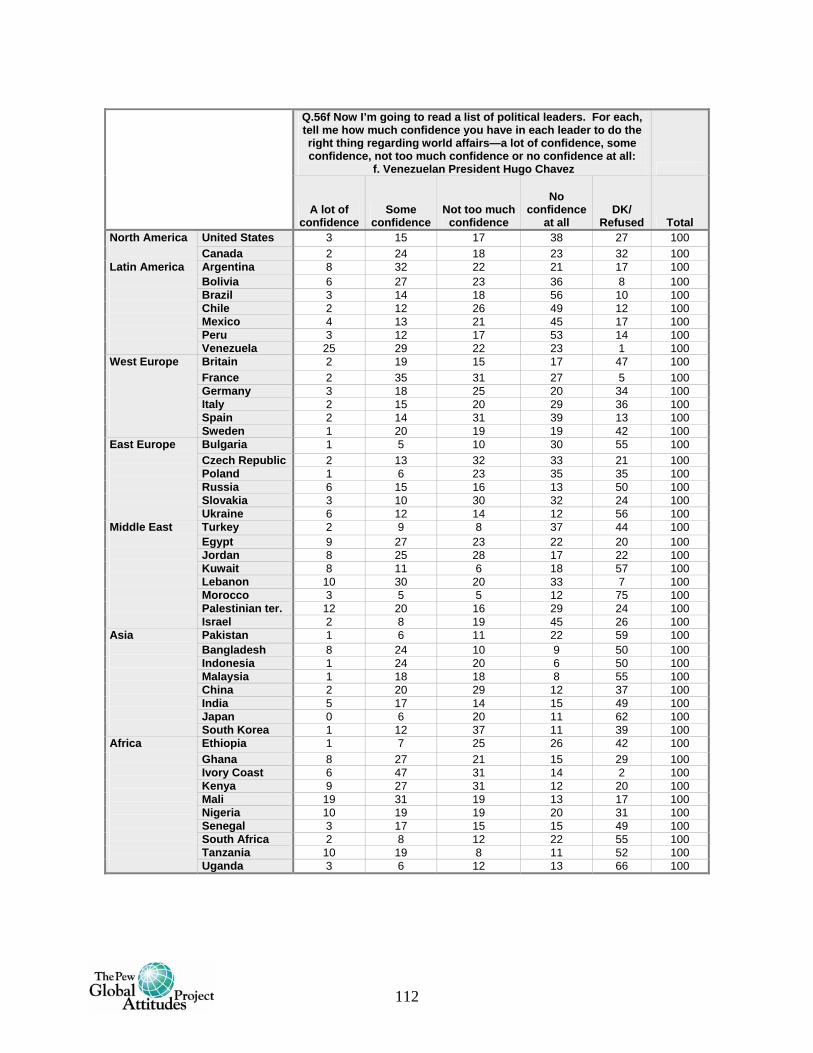
112
Q.56f Now I’m going to read a list of political leaders. For each, tell me how much confidence you have in each leader to do the right thing regarding world affairs—a lot of confidence, some confidence, not too much confidence or no confidence at all:
f. Venezuelan President Hugo Chavez
A lot of confidence
Some confidence
Not too much confidence
No confidence
at all DK/
Refused Total United States 3 15 17 38 27 100 North America
Canada 2 24 18 23 32 100 Argentina 8 32 22 21 17 100 Bolivia 6 27 23 36 8 100 Brazil 3 14 18 56 10 100 Chile 2 12 26 49 12 100 Mexico 4 13 21 45 17 100 Peru 3 12 17 53 14 100
Latin America Venezuela 25 29 22 23 1 100
Britain 2 19 15 17 47 100 France 2 35 31 27 5 100 Germany 3 18 25 20 34 100 Italy 2 15 20 29 36 100 Spain 2 14 31 39 13 100
West Europe Sweden 1 20 19 19 42 100
Bulgaria 1 5 10 30 55 100 Czech Republic 2 13 32 33 21 100 Poland 1 6 23 35 35 100 Russia 6 15 16 13 50 100 Slovakia 3 10 30 32 24 100
East Europe Ukraine 6 12 14 12 56 100
Turkey 2 9 8 37 44 100 Egypt 9 27 23 22 20 100 Jordan 8 25 28 17 22 100 Kuwait 8 11 6 18 57 100 Lebanon 10 30 20 33 7 100 Morocco 3 5 5 12 75 100 Palestinian ter. 12 20 16 29 24 100
Middle East Israel 2 8 19 45 26 100
Pakistan 1 6 11 22 59 100 Bangladesh 8 24 10 9 50 100 Indonesia 1 24 20 6 50 100 Malaysia 1 18 18 8 55 100 China 2 20 29 12 37 100 India 5 17 14 15 49 100 Japan 0 6 20 11 62 100
Asia South Korea 1 12 37 11 39 100
Ethiopia 1 7 25 26 42 100 Ghana 8 27 21 15 29 100 Ivory Coast 6 47 31 14 2 100 Kenya 9 27 31 12 20 100 Mali 19 31 19 13 17 100 Nigeria 10 19 19 20 31 100 Senegal 3 17 15 15 49 100 South Africa 2 8 12 22 55 100 Tanzania 10 19 8 11 52 100
Africa Uganda 3 6 12 13 66 100
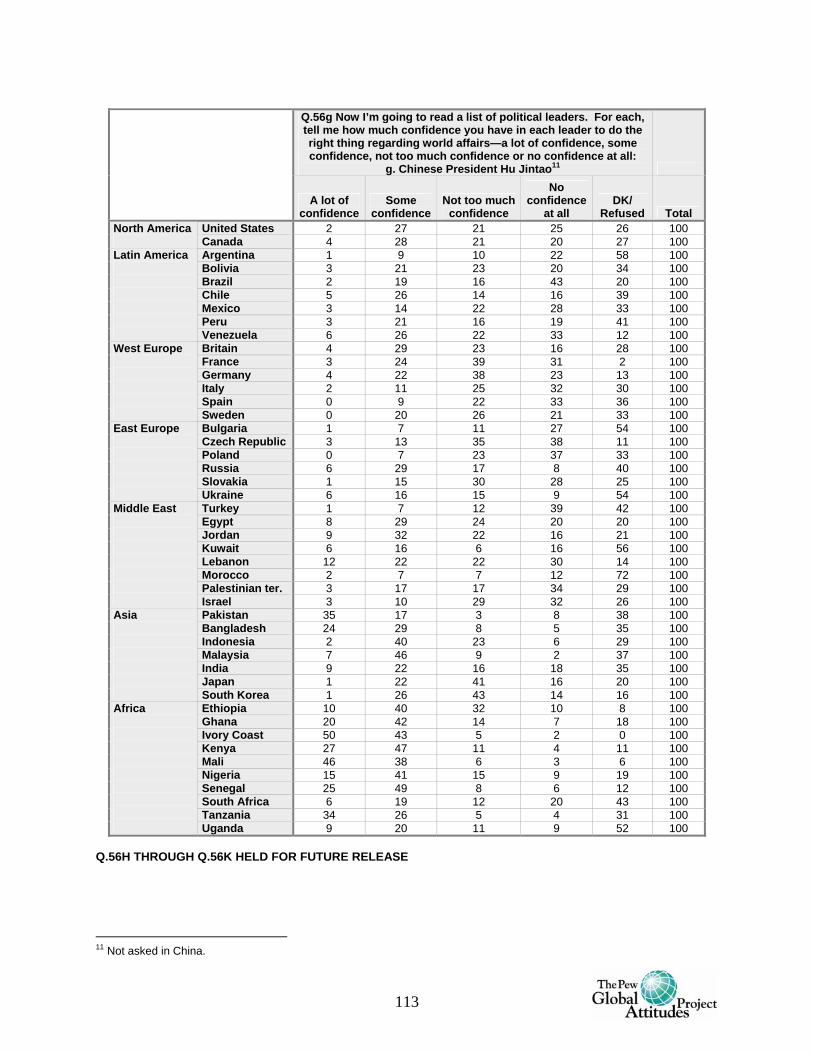
113
Q.56g Now I’m going to read a list of political leaders. For each, tell me how much confidence you have in each leader to do the right thing regarding world affairs—a lot of confidence, some confidence, not too much confidence or no confidence at all:
g. Chinese President Hu Jintao11
A lot of confidence
Some confidence
Not too much confidence
No confidence
at all DK/
Refused Total United States 2 27 21 25 26 100 North America
Canada 4 28 21 20 27 100 Argentina 1 9 10 22 58 100 Bolivia 3 21 23 20 34 100 Brazil 2 19 16 43 20 100 Chile 5 26 14 16 39 100 Mexico 3 14 22 28 33 100 Peru 3 21 16 19 41 100
Latin America Venezuela 6 26 22 33 12 100
Britain 4 29 23 16 28 100 France 3 24 39 31 2 100 Germany 4 22 38 23 13 100 Italy 2 11 25 32 30 100 Spain 0 9 22 33 36 100
West Europe Sweden 0 20 26 21 33 100
Bulgaria 1 7 11 27 54 100 Czech Republic 3 13 35 38 11 100 Poland 0 7 23 37 33 100 Russia 6 29 17 8 40 100 Slovakia 1 15 30 28 25 100
East Europe Ukraine 6 16 15 9 54 100
Turkey 1 7 12 39 42 100 Egypt 8 29 24 20 20 100 Jordan 9 32 22 16 21 100 Kuwait 6 16 6 16 56 100 Lebanon 12 22 22 30 14 100 Morocco 2 7 7 12 72 100 Palestinian ter. 3 17 17 34 29 100
Middle East Israel 3 10 29 32 26 100
Pakistan 35 17 3 8 38 100 Bangladesh 24 29 8 5 35 100 Indonesia 2 40 23 6 29 100 Malaysia 7 46 9 2 37 100 India 9 22 16 18 35 100 Japan 1 22 41 16 20 100
Asia South Korea 1 26 43 14 16 100
Ethiopia 10 40 32 10 8 100 Ghana 20 42 14 7 18 100 Ivory Coast 50 43 5 2 0 100 Kenya 27 47 11 4 11 100 Mali 46 38 6 3 6 100 Nigeria 15 41 15 9 19 100 Senegal 25 49 8 6 12 100 South Africa 6 19 12 20 43 100 Tanzania 34 26 5 4 31 100
Africa Uganda 9 20 11 9 52 100
Q.56H THROUGH Q.56K HELD FOR FUTURE RELEASE
11 Not asked in China.
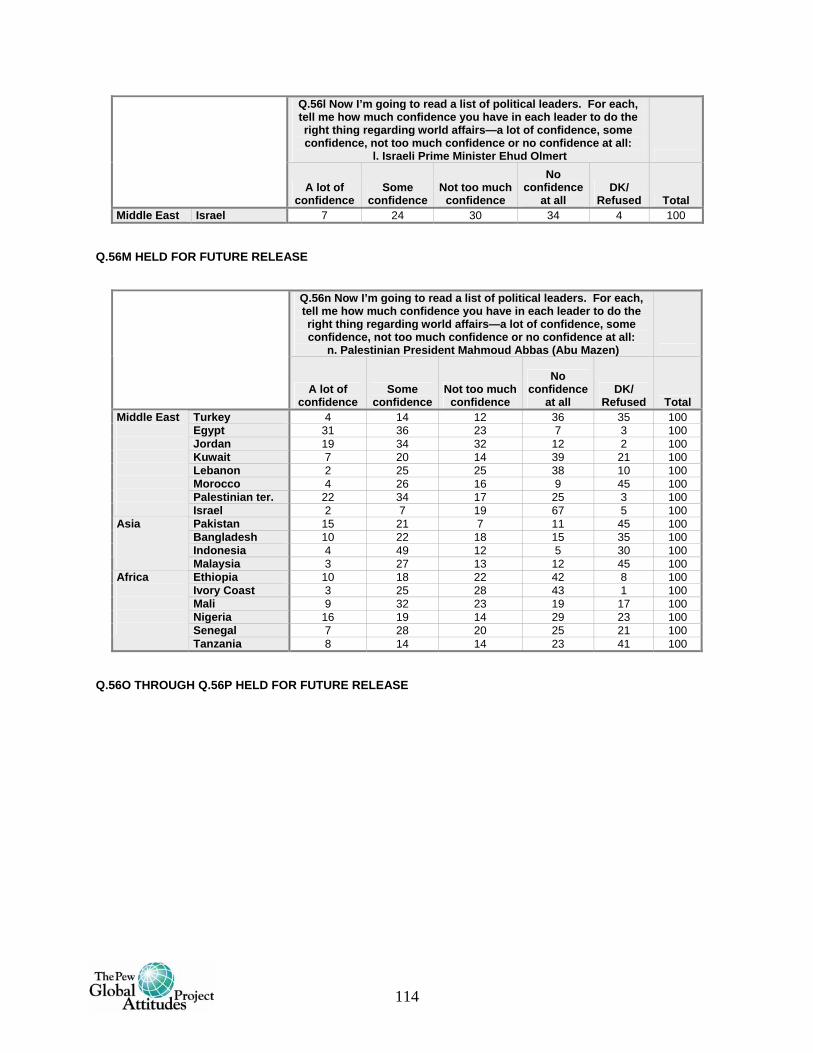
114
Q.56l Now I’m going to read a list of political leaders. For each, tell me how much confidence you have in each leader to do the right thing regarding world affairs—a lot of confidence, some confidence, not too much confidence or no confidence at all:
l. Israeli Prime Minister Ehud Olmert
A lot of confidence
Some confidence
Not too much confidence
No confidence
at all DK/
Refused Total Middle East Israel 7 24 30 34 4 100
Q.56M HELD FOR FUTURE RELEASE
Q.56n Now I’m going to read a list of political leaders. For each, tell me how much confidence you have in each leader to do the right thing regarding world affairs—a lot of confidence, some confidence, not too much confidence or no confidence at all:
n. Palestinian President Mahmoud Abbas (Abu Mazen)
A lot of confidence
Some confidence
Not too much confidence
No confidence
at all DK/
Refused Total Turkey 4 14 12 36 35 100 Egypt 31 36 23 7 3 100 Jordan 19 34 32 12 2 100 Kuwait 7 20 14 39 21 100 Lebanon 2 25 25 38 10 100 Morocco 4 26 16 9 45 100 Palestinian ter. 22 34 17 25 3 100
Middle East Israel 2 7 19 67 5 100
Pakistan 15 21 7 11 45 100 Bangladesh 10 22 18 15 35 100 Indonesia 4 49 12 5 30 100
Asia Malaysia 3 27 13 12 45 100
Ethiopia 10 18 22 42 8 100 Ivory Coast 3 25 28 43 1 100 Mali 9 32 23 19 17 100 Nigeria 16 19 14 29 23 100 Senegal 7 28 20 25 21 100
Africa
Tanzania 8 14 14 23 41 100 Q.56O THROUGH Q.56P HELD FOR FUTURE RELEASE
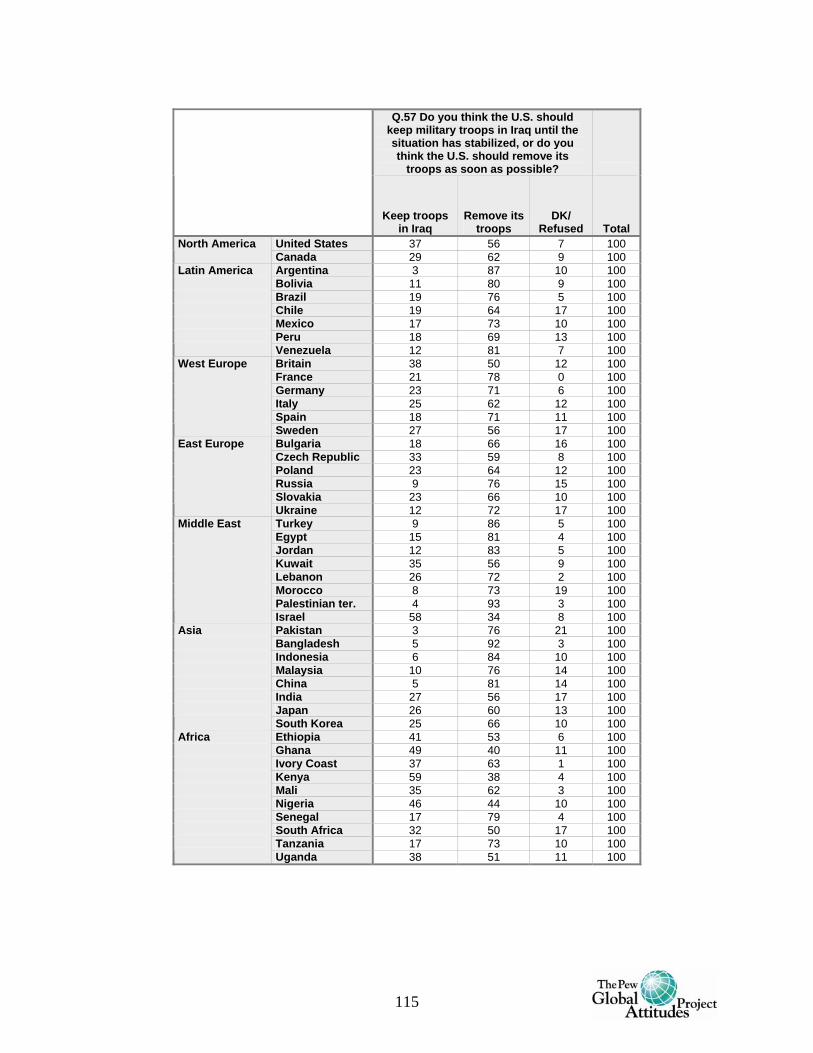
115
Q.57 Do you think the U.S. should
keep military troops in Iraq until the situation has stabilized, or do you think the U.S. should remove its
troops as soon as possible?
Keep troops in Iraq
Remove its troops
DK/ Refused Total
United States 37 56 7 100 North America Canada 29 62 9 100
Argentina 3 87 10 100 Bolivia 11 80 9 100 Brazil 19 76 5 100 Chile 19 64 17 100 Mexico 17 73 10 100 Peru 18 69 13 100
Latin America Venezuela 12 81 7 100
Britain 38 50 12 100 France 21 78 0 100 Germany 23 71 6 100 Italy 25 62 12 100 Spain 18 71 11 100
West Europe Sweden 27 56 17 100
Bulgaria 18 66 16 100 Czech Republic 33 59 8 100 Poland 23 64 12 100 Russia 9 76 15 100 Slovakia 23 66 10 100
East Europe Ukraine 12 72 17 100
Turkey 9 86 5 100 Egypt 15 81 4 100 Jordan 12 83 5 100 Kuwait 35 56 9 100 Lebanon 26 72 2 100 Morocco 8 73 19 100 Palestinian ter. 4 93 3 100
Middle East Israel 58 34 8 100
Pakistan 3 76 21 100 Bangladesh 5 92 3 100 Indonesia 6 84 10 100 Malaysia 10 76 14 100 China 5 81 14 100 India 27 56 17 100 Japan 26 60 13 100
Asia South Korea 25 66 10 100
Ethiopia 41 53 6 100 Ghana 49 40 11 100 Ivory Coast 37 63 1 100 Kenya 59 38 4 100 Mali 35 62 3 100 Nigeria 46 44 10 100 Senegal 17 79 4 100 South Africa 32 50 17 100 Tanzania 17 73 10 100
Africa Uganda 38 51 11 100
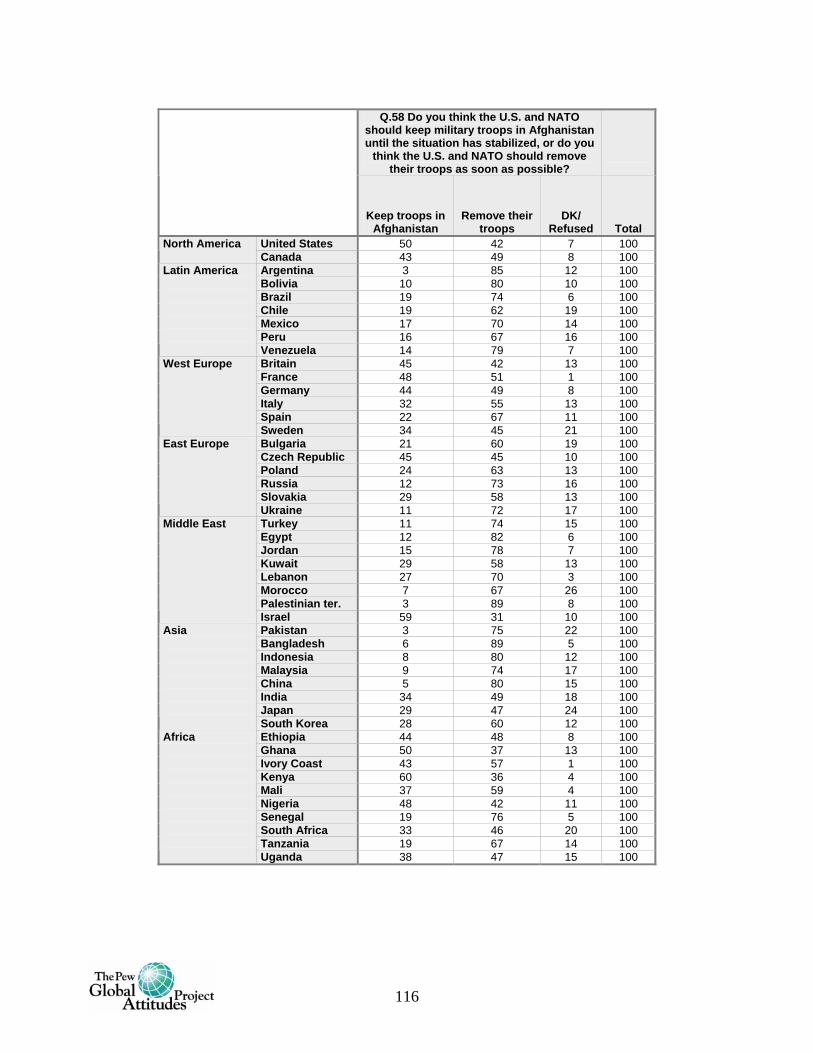
116
Q.58 Do you think the U.S. and NATO
should keep military troops in Afghanistan until the situation has stabilized, or do you
think the U.S. and NATO should remove their troops as soon as possible?
Keep troops in Afghanistan
Remove their troops
DK/ Refused Total
United States 50 42 7 100 North America Canada 43 49 8 100
Argentina 3 85 12 100 Bolivia 10 80 10 100 Brazil 19 74 6 100 Chile 19 62 19 100 Mexico 17 70 14 100 Peru 16 67 16 100
Latin America Venezuela 14 79 7 100
Britain 45 42 13 100 France 48 51 1 100 Germany 44 49 8 100 Italy 32 55 13 100 Spain 22 67 11 100
West Europe Sweden 34 45 21 100
Bulgaria 21 60 19 100 Czech Republic 45 45 10 100 Poland 24 63 13 100 Russia 12 73 16 100 Slovakia 29 58 13 100
East Europe Ukraine 11 72 17 100
Turkey 11 74 15 100 Egypt 12 82 6 100 Jordan 15 78 7 100 Kuwait 29 58 13 100 Lebanon 27 70 3 100 Morocco 7 67 26 100 Palestinian ter. 3 89 8 100
Middle East Israel 59 31 10 100
Pakistan 3 75 22 100 Bangladesh 6 89 5 100 Indonesia 8 80 12 100 Malaysia 9 74 17 100 China 5 80 15 100 India 34 49 18 100 Japan 29 47 24 100
Asia South Korea 28 60 12 100
Ethiopia 44 48 8 100 Ghana 50 37 13 100 Ivory Coast 43 57 1 100 Kenya 60 36 4 100 Mali 37 59 4 100 Nigeria 48 42 11 100 Senegal 19 76 5 100 South Africa 33 46 20 100 Tanzania 19 67 14 100
Africa Uganda 38 47 15 100
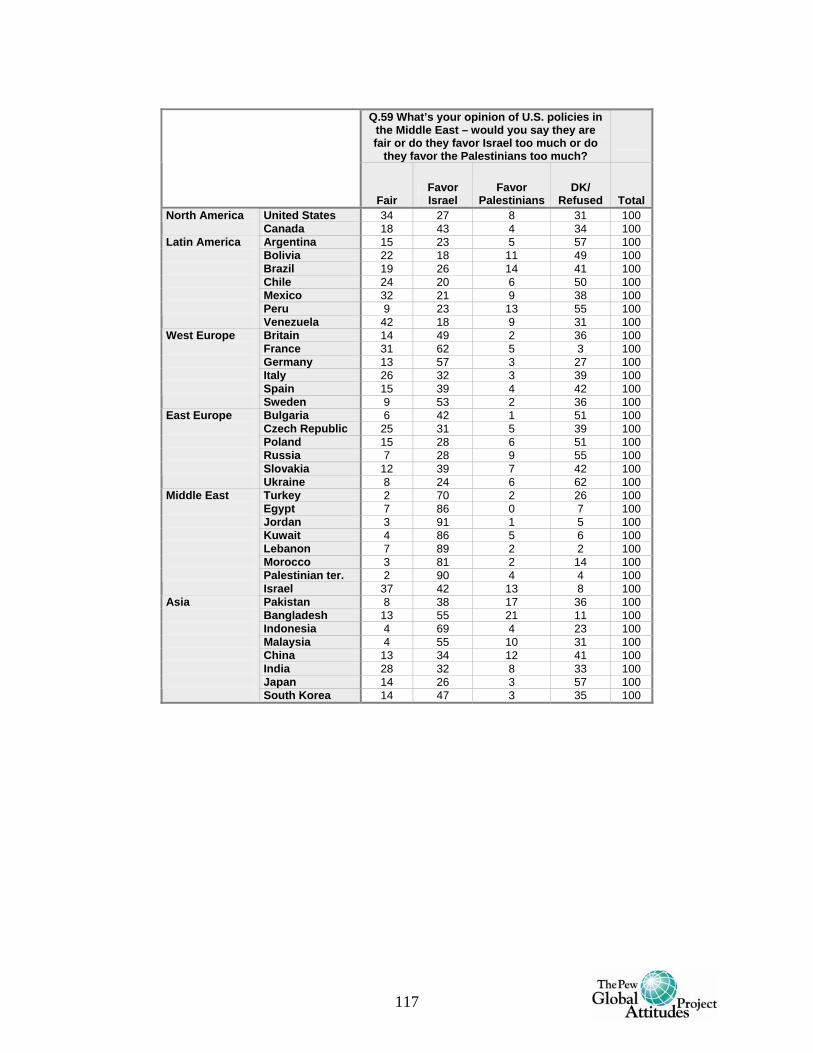
117
Q.59 What’s your opinion of U.S. policies in
the Middle East – would you say they are fair or do they favor Israel too much or do
they favor the Palestinians too much?
Fair
Favor Israel
Favor Palestinians
DK/ Refused Total
United States 34 27 8 31 100 North America Canada 18 43 4 34 100
Argentina 15 23 5 57 100 Bolivia 22 18 11 49 100 Brazil 19 26 14 41 100 Chile 24 20 6 50 100 Mexico 32 21 9 38 100 Peru 9 23 13 55 100
Latin America Venezuela 42 18 9 31 100
Britain 14 49 2 36 100 France 31 62 5 3 100 Germany 13 57 3 27 100 Italy 26 32 3 39 100 Spain 15 39 4 42 100
West Europe Sweden 9 53 2 36 100
Bulgaria 6 42 1 51 100 Czech Republic 25 31 5 39 100 Poland 15 28 6 51 100 Russia 7 28 9 55 100 Slovakia 12 39 7 42 100
East Europe Ukraine 8 24 6 62 100
Turkey 2 70 2 26 100 Egypt 7 86 0 7 100 Jordan 3 91 1 5 100 Kuwait 4 86 5 6 100 Lebanon 7 89 2 2 100 Morocco 3 81 2 14 100 Palestinian ter. 2 90 4 4 100
Middle East Israel 37 42 13 8 100
Pakistan 8 38 17 36 100 Bangladesh 13 55 21 11 100 Indonesia 4 69 4 23 100 Malaysia 4 55 10 31 100 China 13 34 12 41 100 India 28 32 8 33 100 Japan 14 26 3 57 100
Asia South Korea 14 47 3 35 100
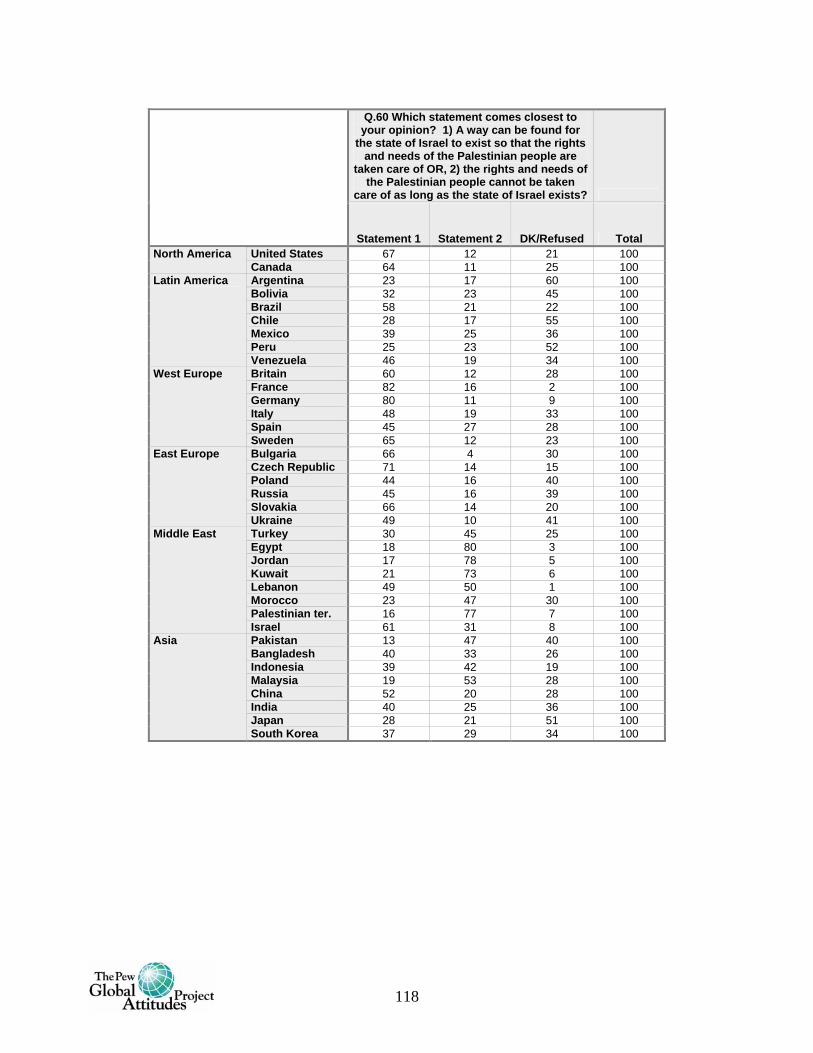
118
Q.60 Which statement comes closest to your opinion? 1) A way can be found for
the state of Israel to exist so that the rights and needs of the Palestinian people are
taken care of OR, 2) the rights and needs of the Palestinian people cannot be taken
care of as long as the state of Israel exists?
Statement 1 Statement 2 DK/Refused Total United States 67 12 21 100 North America Canada 64 11 25 100 Argentina 23 17 60 100 Bolivia 32 23 45 100 Brazil 58 21 22 100 Chile 28 17 55 100 Mexico 39 25 36 100 Peru 25 23 52 100
Latin America
Venezuela 46 19 34 100 Britain 60 12 28 100 France 82 16 2 100 Germany 80 11 9 100 Italy 48 19 33 100 Spain 45 27 28 100
West Europe
Sweden 65 12 23 100 Bulgaria 66 4 30 100 Czech Republic 71 14 15 100 Poland 44 16 40 100 Russia 45 16 39 100 Slovakia 66 14 20 100
East Europe
Ukraine 49 10 41 100 Turkey 30 45 25 100 Egypt 18 80 3 100 Jordan 17 78 5 100 Kuwait 21 73 6 100 Lebanon 49 50 1 100 Morocco 23 47 30 100 Palestinian ter. 16 77 7 100
Middle East
Israel 61 31 8 100 Pakistan 13 47 40 100 Bangladesh 40 33 26 100 Indonesia 39 42 19 100 Malaysia 19 53 28 100 China 52 20 28 100 India 40 25 36 100 Japan 28 21 51 100
Asia
South Korea 37 29 34 100
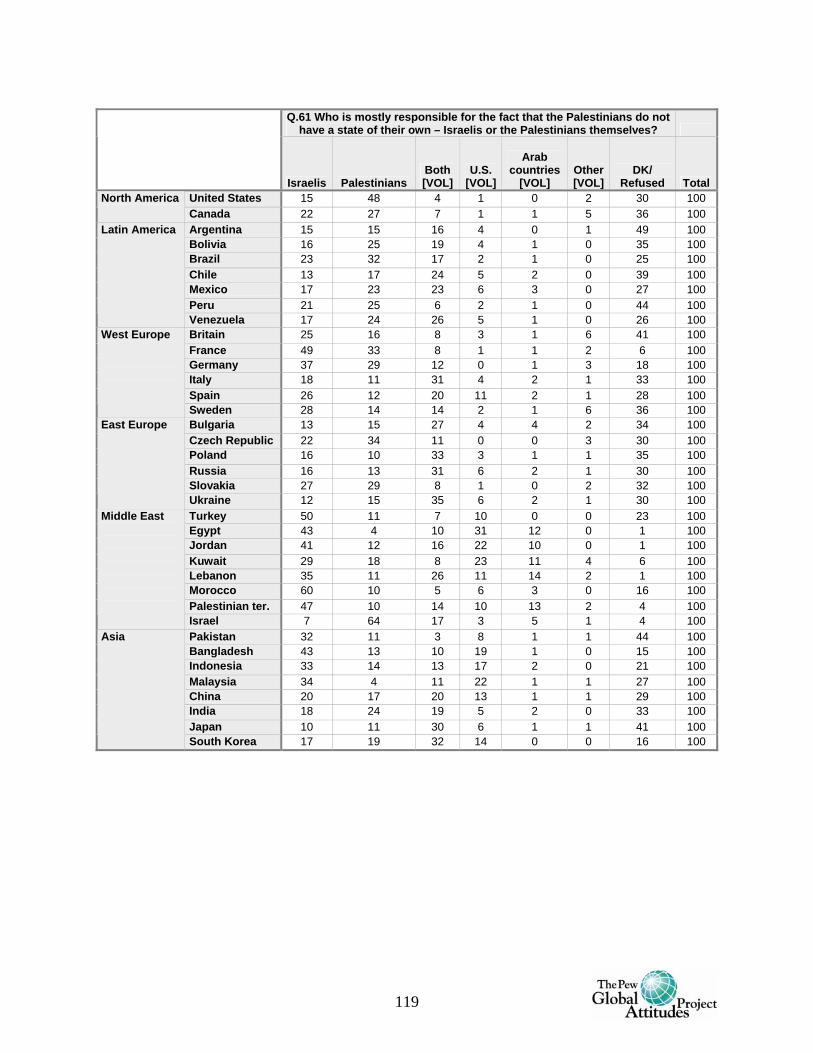
119
Q.61 Who is mostly responsible for the fact that the Palestinians do not
have a state of their own – Israelis or the Palestinians themselves?
Israelis Palestinians
Both [VOL]
U.S. [VOL]
Arab countries
[VOL] Other [VOL]
DK/ Refused Total
United States 15 48 4 1 0 2 30 100 North America Canada 22 27 7 1 1 5 36 100
Argentina 15 15 16 4 0 1 49 100 Bolivia 16 25 19 4 1 0 35 100 Brazil 23 32 17 2 1 0 25 100 Chile 13 17 24 5 2 0 39 100 Mexico 17 23 23 6 3 0 27 100 Peru 21 25 6 2 1 0 44 100
Latin America
Venezuela 17 24 26 5 1 0 26 100 Britain 25 16 8 3 1 6 41 100 France 49 33 8 1 1 2 6 100 Germany 37 29 12 0 1 3 18 100 Italy 18 11 31 4 2 1 33 100 Spain 26 12 20 11 2 1 28 100
West Europe
Sweden 28 14 14 2 1 6 36 100 Bulgaria 13 15 27 4 4 2 34 100 Czech Republic 22 34 11 0 0 3 30 100 Poland 16 10 33 3 1 1 35 100 Russia 16 13 31 6 2 1 30 100 Slovakia 27 29 8 1 0 2 32 100
East Europe
Ukraine 12 15 35 6 2 1 30 100 Turkey 50 11 7 10 0 0 23 100 Egypt 43 4 10 31 12 0 1 100 Jordan 41 12 16 22 10 0 1 100 Kuwait 29 18 8 23 11 4 6 100 Lebanon 35 11 26 11 14 2 1 100 Morocco 60 10 5 6 3 0 16 100 Palestinian ter. 47 10 14 10 13 2 4 100
Middle East
Israel 7 64 17 3 5 1 4 100 Pakistan 32 11 3 8 1 1 44 100 Bangladesh 43 13 10 19 1 0 15 100 Indonesia 33 14 13 17 2 0 21 100 Malaysia 34 4 11 22 1 1 27 100 China 20 17 20 13 1 1 29 100 India 18 24 19 5 2 0 33 100 Japan 10 11 30 6 1 1 41 100
Asia
South Korea 17 19 32 14 0 0 16 100
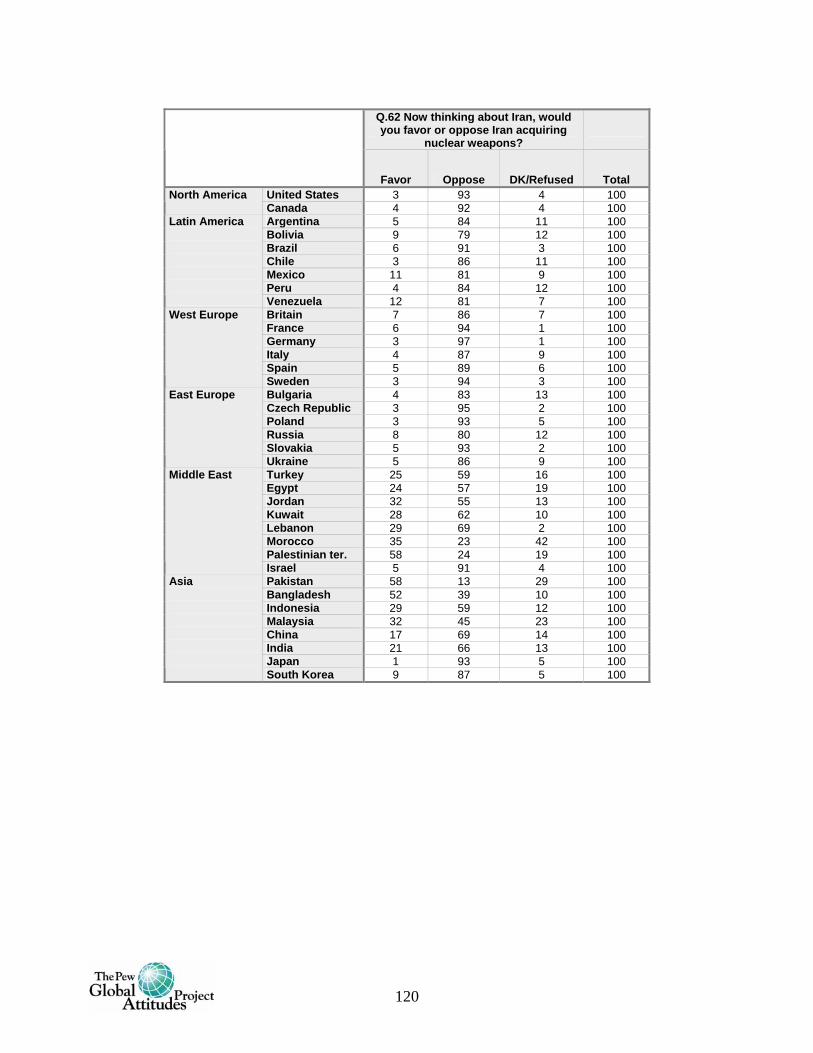
120
Q.62 Now thinking about Iran, would you favor or oppose Iran acquiring
nuclear weapons?
Favor Oppose DK/Refused Total
United States 3 93 4 100 North America Canada 4 92 4 100
Argentina 5 84 11 100 Bolivia 9 79 12 100 Brazil 6 91 3 100 Chile 3 86 11 100 Mexico 11 81 9 100 Peru 4 84 12 100
Latin America Venezuela 12 81 7 100
Britain 7 86 7 100 France 6 94 1 100 Germany 3 97 1 100 Italy 4 87 9 100 Spain 5 89 6 100
West Europe Sweden 3 94 3 100
Bulgaria 4 83 13 100 Czech Republic 3 95 2 100 Poland 3 93 5 100 Russia 8 80 12 100 Slovakia 5 93 2 100
East Europe Ukraine 5 86 9 100
Turkey 25 59 16 100 Egypt 24 57 19 100 Jordan 32 55 13 100 Kuwait 28 62 10 100 Lebanon 29 69 2 100 Morocco 35 23 42 100 Palestinian ter. 58 24 19 100
Middle East Israel 5 91 4 100
Pakistan 58 13 29 100 Bangladesh 52 39 10 100 Indonesia 29 59 12 100 Malaysia 32 45 23 100 China 17 69 14 100 India 21 66 13 100 Japan 1 93 5 100
Asia South Korea 9 87 5 100
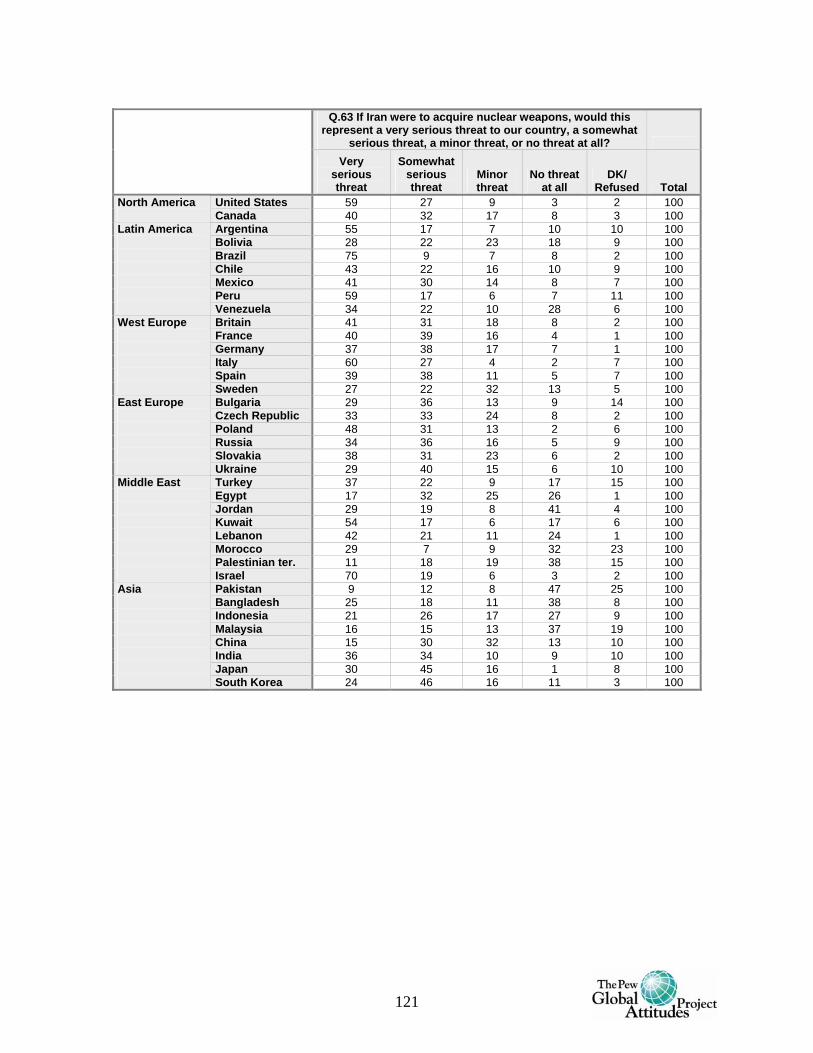
121
Q.63 If Iran were to acquire nuclear weapons, would this
represent a very serious threat to our country, a somewhat serious threat, a minor threat, or no threat at all?
Very serious threat
Somewhat serious threat
Minor threat
No threat at all
DK/ Refused Total
United States 59 27 9 3 2 100 North America Canada 40 32 17 8 3 100
Argentina 55 17 7 10 10 100 Bolivia 28 22 23 18 9 100 Brazil 75 9 7 8 2 100 Chile 43 22 16 10 9 100 Mexico 41 30 14 8 7 100 Peru 59 17 6 7 11 100
Latin America Venezuela 34 22 10 28 6 100
Britain 41 31 18 8 2 100 France 40 39 16 4 1 100 Germany 37 38 17 7 1 100 Italy 60 27 4 2 7 100 Spain 39 38 11 5 7 100
West Europe Sweden 27 22 32 13 5 100
Bulgaria 29 36 13 9 14 100 Czech Republic 33 33 24 8 2 100 Poland 48 31 13 2 6 100 Russia 34 36 16 5 9 100 Slovakia 38 31 23 6 2 100
East Europe Ukraine 29 40 15 6 10 100
Turkey 37 22 9 17 15 100 Egypt 17 32 25 26 1 100 Jordan 29 19 8 41 4 100 Kuwait 54 17 6 17 6 100 Lebanon 42 21 11 24 1 100 Morocco 29 7 9 32 23 100 Palestinian ter. 11 18 19 38 15 100
Middle East Israel 70 19 6 3 2 100
Pakistan 9 12 8 47 25 100 Bangladesh 25 18 11 38 8 100 Indonesia 21 26 17 27 9 100 Malaysia 16 15 13 37 19 100 China 15 30 32 13 10 100 India 36 34 10 9 10 100 Japan 30 45 16 1 8 100
Asia South Korea 24 46 16 11 3 100
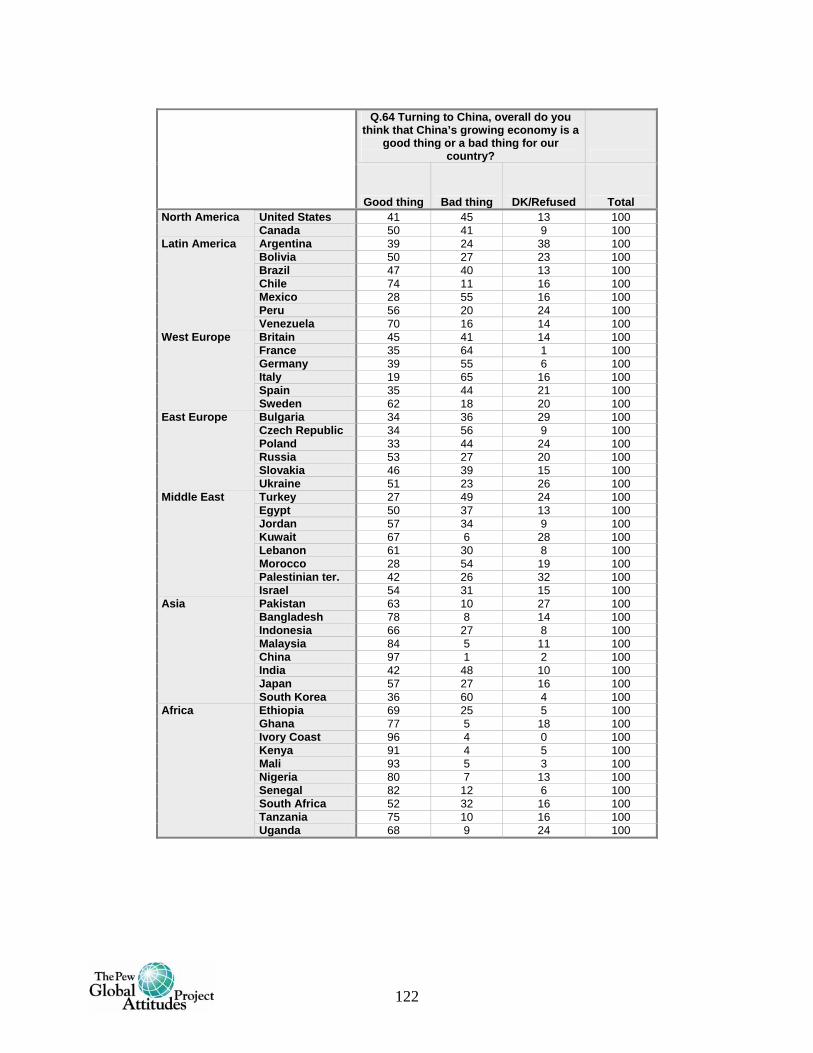
122
Q.64 Turning to China, overall do you
think that China’s growing economy is a good thing or a bad thing for our
country?
Good thing Bad thing DK/Refused Total United States 41 45 13 100 North America Canada 50 41 9 100 Argentina 39 24 38 100 Bolivia 50 27 23 100 Brazil 47 40 13 100 Chile 74 11 16 100 Mexico 28 55 16 100 Peru 56 20 24 100
Latin America
Venezuela 70 16 14 100 Britain 45 41 14 100 France 35 64 1 100 Germany 39 55 6 100 Italy 19 65 16 100 Spain 35 44 21 100
West Europe
Sweden 62 18 20 100 Bulgaria 34 36 29 100 Czech Republic 34 56 9 100 Poland 33 44 24 100 Russia 53 27 20 100 Slovakia 46 39 15 100
East Europe
Ukraine 51 23 26 100 Turkey 27 49 24 100 Egypt 50 37 13 100 Jordan 57 34 9 100 Kuwait 67 6 28 100 Lebanon 61 30 8 100 Morocco 28 54 19 100 Palestinian ter. 42 26 32 100
Middle East
Israel 54 31 15 100 Pakistan 63 10 27 100 Bangladesh 78 8 14 100 Indonesia 66 27 8 100 Malaysia 84 5 11 100 China 97 1 2 100 India 42 48 10 100 Japan 57 27 16 100
Asia
South Korea 36 60 4 100 Ethiopia 69 25 5 100 Ghana 77 5 18 100 Ivory Coast 96 4 0 100 Kenya 91 4 5 100 Mali 93 5 3 100 Nigeria 80 7 13 100 Senegal 82 12 6 100 South Africa 52 32 16 100 Tanzania 75 10 16 100
Africa
Uganda 68 9 24 100
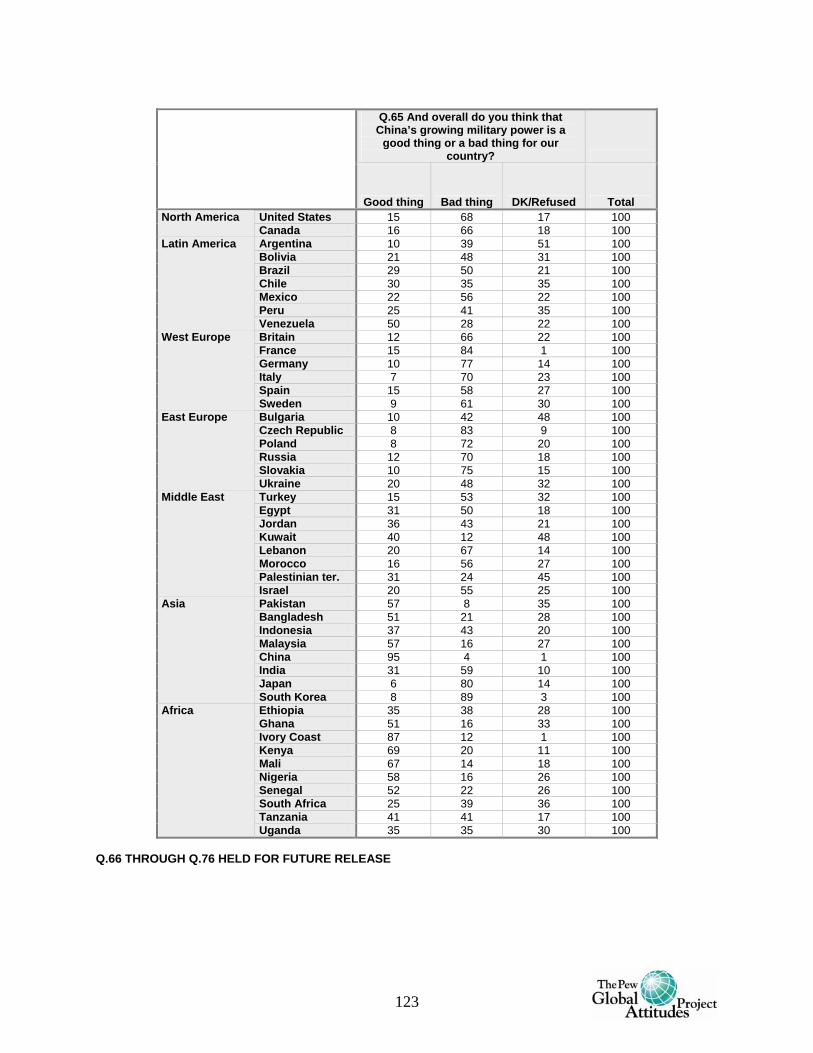
123
Q.65 And overall do you think that China’s growing military power is a
good thing or a bad thing for our country?
Good thing Bad thing DK/Refused Total United States 15 68 17 100 North America Canada 16 66 18 100 Argentina 10 39 51 100 Bolivia 21 48 31 100 Brazil 29 50 21 100 Chile 30 35 35 100 Mexico 22 56 22 100 Peru 25 41 35 100
Latin America
Venezuela 50 28 22 100 Britain 12 66 22 100 France 15 84 1 100 Germany 10 77 14 100 Italy 7 70 23 100 Spain 15 58 27 100
West Europe
Sweden 9 61 30 100 Bulgaria 10 42 48 100 Czech Republic 8 83 9 100 Poland 8 72 20 100 Russia 12 70 18 100 Slovakia 10 75 15 100
East Europe
Ukraine 20 48 32 100 Turkey 15 53 32 100 Egypt 31 50 18 100 Jordan 36 43 21 100 Kuwait 40 12 48 100 Lebanon 20 67 14 100 Morocco 16 56 27 100 Palestinian ter. 31 24 45 100
Middle East
Israel 20 55 25 100 Pakistan 57 8 35 100 Bangladesh 51 21 28 100 Indonesia 37 43 20 100 Malaysia 57 16 27 100 China 95 4 1 100 India 31 59 10 100 Japan 6 80 14 100
Asia
South Korea 8 89 3 100 Ethiopia 35 38 28 100 Ghana 51 16 33 100 Ivory Coast 87 12 1 100 Kenya 69 20 11 100 Mali 67 14 18 100 Nigeria 58 16 26 100 Senegal 52 22 26 100 South Africa 25 39 36 100 Tanzania 41 41 17 100
Africa
Uganda 35 35 30 100 Q.66 THROUGH Q.76 HELD FOR FUTURE RELEASE
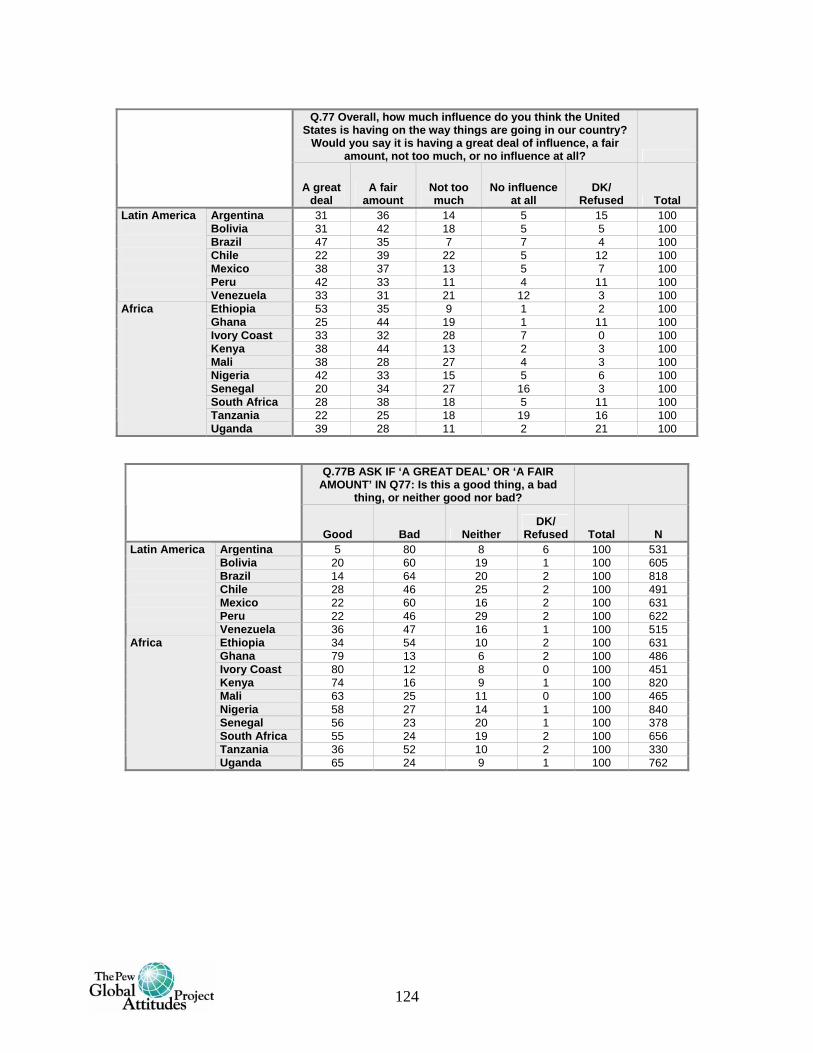
124
Q.77 Overall, how much influence do you think the United
States is having on the way things are going in our country? Would you say it is having a great deal of influence, a fair
amount, not too much, or no influence at all?
A great deal
A fair amount
Not too much
No influence at all
DK/ Refused Total
Argentina 31 36 14 5 15 100 Bolivia 31 42 18 5 5 100 Brazil 47 35 7 7 4 100 Chile 22 39 22 5 12 100 Mexico 38 37 13 5 7 100 Peru 42 33 11 4 11 100
Latin America Venezuela 33 31 21 12 3 100
Ethiopia 53 35 9 1 2 100 Ghana 25 44 19 1 11 100 Ivory Coast 33 32 28 7 0 100 Kenya 38 44 13 2 3 100 Mali 38 28 27 4 3 100 Nigeria 42 33 15 5 6 100 Senegal 20 34 27 16 3 100 South Africa 28 38 18 5 11 100 Tanzania 22 25 18 19 16 100
Africa Uganda 39 28 11 2 21 100
Q.77B ASK IF ‘A GREAT DEAL’ OR ‘A FAIR AMOUNT’ IN Q77: Is this a good thing, a bad
thing, or neither good nor bad?
Good Bad Neither
DK/ Refused Total N
Argentina 5 80 8 6 100 531 Bolivia 20 60 19 1 100 605 Brazil 14 64 20 2 100 818 Chile 28 46 25 2 100 491 Mexico 22 60 16 2 100 631 Peru 22 46 29 2 100 622
Latin America Venezuela 36 47 16 1 100 515
Ethiopia 34 54 10 2 100 631 Ghana 79 13 6 2 100 486 Ivory Coast 80 12 8 0 100 451 Kenya 74 16 9 1 100 820 Mali 63 25 11 0 100 465 Nigeria 58 27 14 1 100 840 Senegal 56 23 20 1 100 378 South Africa 55 24 19 2 100 656 Tanzania 36 52 10 2 100 330
Africa Uganda 65 24 9 1 100 762
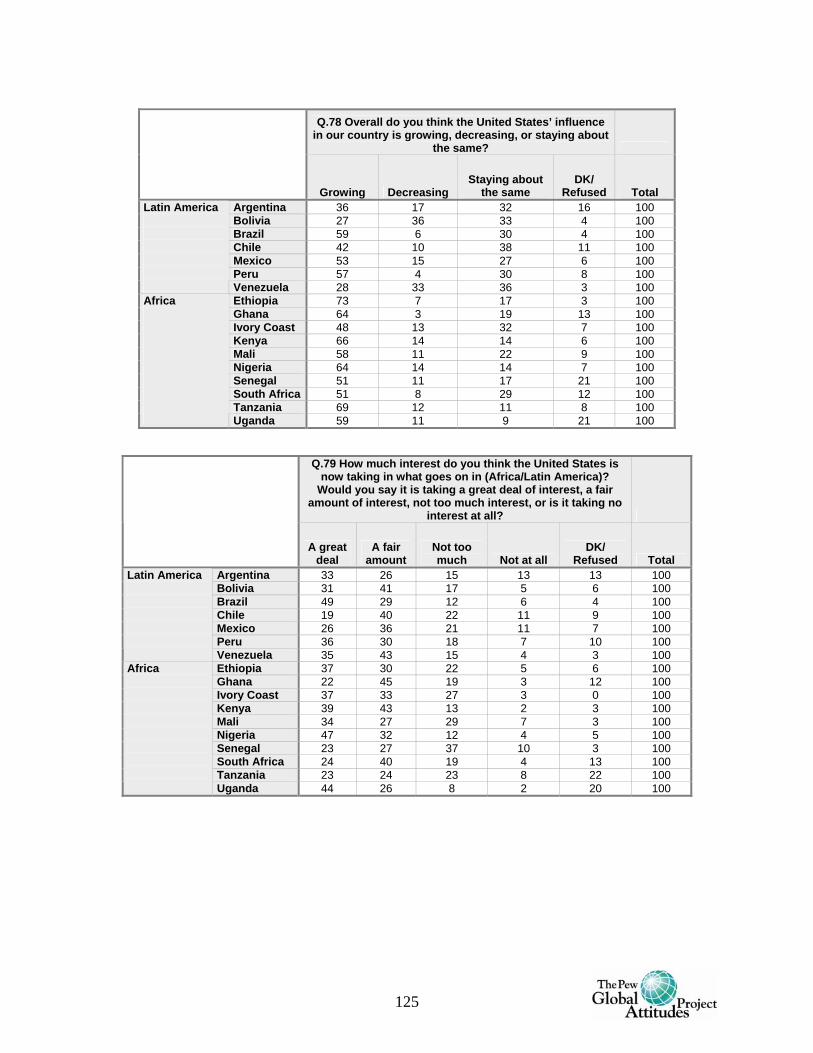
125
Q.78 Overall do you think the United States’ influence in our country is growing, decreasing, or staying about
the same?
Growing Decreasing
Staying about the same
DK/ Refused Total
Argentina 36 17 32 16 100 Bolivia 27 36 33 4 100 Brazil 59 6 30 4 100 Chile 42 10 38 11 100 Mexico 53 15 27 6 100 Peru 57 4 30 8 100
Latin America Venezuela 28 33 36 3 100
Ethiopia 73 7 17 3 100 Ghana 64 3 19 13 100 Ivory Coast 48 13 32 7 100 Kenya 66 14 14 6 100 Mali 58 11 22 9 100 Nigeria 64 14 14 7 100 Senegal 51 11 17 21 100 South Africa 51 8 29 12 100 Tanzania 69 12 11 8 100
Africa Uganda 59 11 9 21 100
Q.79 How much interest do you think the United States is now taking in what goes on in (Africa/Latin America)?
Would you say it is taking a great deal of interest, a fair amount of interest, not too much interest, or is it taking no
interest at all?
A great deal
A fair amount
Not too much Not at all
DK/ Refused Total
Argentina 33 26 15 13 13 100 Bolivia 31 41 17 5 6 100 Brazil 49 29 12 6 4 100 Chile 19 40 22 11 9 100 Mexico 26 36 21 11 7 100 Peru 36 30 18 7 10 100
Latin America Venezuela 35 43 15 4 3 100
Ethiopia 37 30 22 5 6 100 Ghana 22 45 19 3 12 100 Ivory Coast 37 33 27 3 0 100 Kenya 39 43 13 2 3 100 Mali 34 27 29 7 3 100 Nigeria 47 32 12 4 5 100 Senegal 23 27 37 10 3 100 South Africa 24 40 19 4 13 100 Tanzania 23 24 23 8 22 100
Africa Uganda 44 26 8 2 20 100
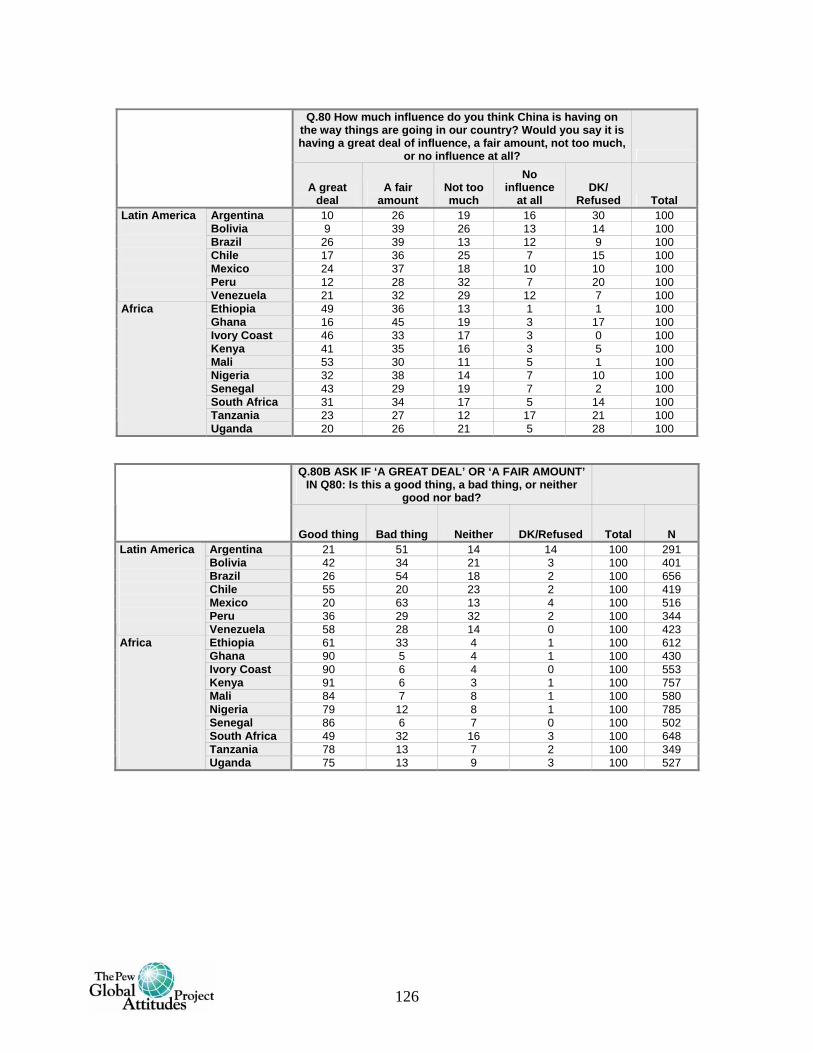
126
Q.80 How much influence do you think China is having on
the way things are going in our country? Would you say it is having a great deal of influence, a fair amount, not too much,
or no influence at all?
A great deal
A fair amount
Not too much
No influence
at all DK/
Refused Total Argentina 10 26 19 16 30 100 Bolivia 9 39 26 13 14 100 Brazil 26 39 13 12 9 100 Chile 17 36 25 7 15 100 Mexico 24 37 18 10 10 100 Peru 12 28 32 7 20 100
Latin America Venezuela 21 32 29 12 7 100
Ethiopia 49 36 13 1 1 100 Ghana 16 45 19 3 17 100 Ivory Coast 46 33 17 3 0 100 Kenya 41 35 16 3 5 100 Mali 53 30 11 5 1 100 Nigeria 32 38 14 7 10 100 Senegal 43 29 19 7 2 100 South Africa 31 34 17 5 14 100 Tanzania 23 27 12 17 21 100
Africa Uganda 20 26 21 5 28 100
Q.80B ASK IF ‘A GREAT DEAL’ OR ‘A FAIR AMOUNT’ IN Q80: Is this a good thing, a bad thing, or neither
good nor bad?
Good thing Bad thing Neither DK/Refused Total N
Argentina 21 51 14 14 100 291 Bolivia 42 34 21 3 100 401 Brazil 26 54 18 2 100 656 Chile 55 20 23 2 100 419 Mexico 20 63 13 4 100 516 Peru 36 29 32 2 100 344
Latin America Venezuela 58 28 14 0 100 423
Ethiopia 61 33 4 1 100 612 Ghana 90 5 4 1 100 430 Ivory Coast 90 6 4 0 100 553 Kenya 91 6 3 1 100 757 Mali 84 7 8 1 100 580 Nigeria 79 12 8 1 100 785 Senegal 86 6 7 0 100 502 South Africa 49 32 16 3 100 648 Tanzania 78 13 7 2 100 349
Africa Uganda 75 13 9 3 100 527
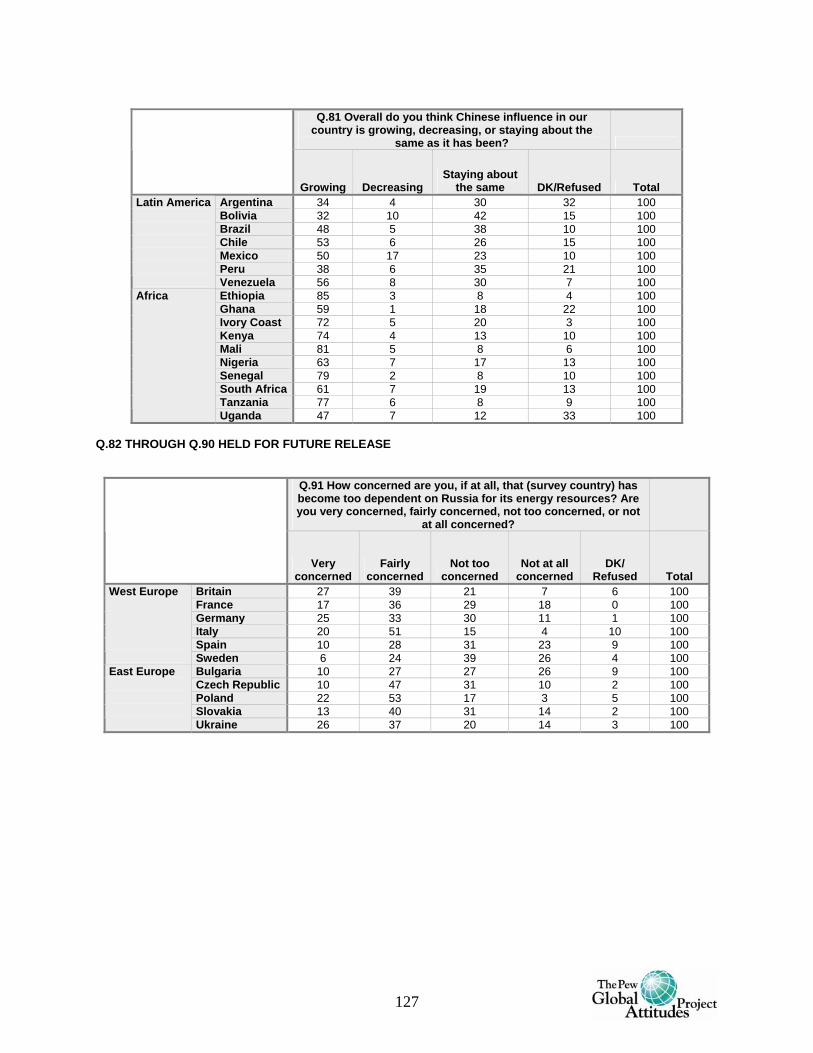
127
Q.81 Overall do you think Chinese influence in our
country is growing, decreasing, or staying about the same as it has been?
Growing Decreasing
Staying about the same DK/Refused Total
Argentina 34 4 30 32 100 Bolivia 32 10 42 15 100 Brazil 48 5 38 10 100 Chile 53 6 26 15 100 Mexico 50 17 23 10 100 Peru 38 6 35 21 100
Latin America Venezuela 56 8 30 7 100
Ethiopia 85 3 8 4 100 Ghana 59 1 18 22 100 Ivory Coast 72 5 20 3 100 Kenya 74 4 13 10 100 Mali 81 5 8 6 100 Nigeria 63 7 17 13 100 Senegal 79 2 8 10 100 South Africa 61 7 19 13 100 Tanzania 77 6 8 9 100
Africa Uganda 47 7 12 33 100
Q.82 THROUGH Q.90 HELD FOR FUTURE RELEASE
Q.91 How concerned are you, if at all, that (survey country) has become too dependent on Russia for its energy resources? Are you very concerned, fairly concerned, not too concerned, or not
at all concerned?
Very concerned
Fairly concerned
Not too concerned
Not at all concerned
DK/ Refused Total
Britain 27 39 21 7 6 100 France 17 36 29 18 0 100 Germany 25 33 30 11 1 100 Italy 20 51 15 4 10 100 Spain 10 28 31 23 9 100
West Europe Sweden 6 24 39 26 4 100
Bulgaria 10 27 27 26 9 100 Czech Republic 10 47 31 10 2 100 Poland 22 53 17 3 5 100 Slovakia 13 40 31 14 2 100
East Europe Ukraine 26 37 20 14 3 100
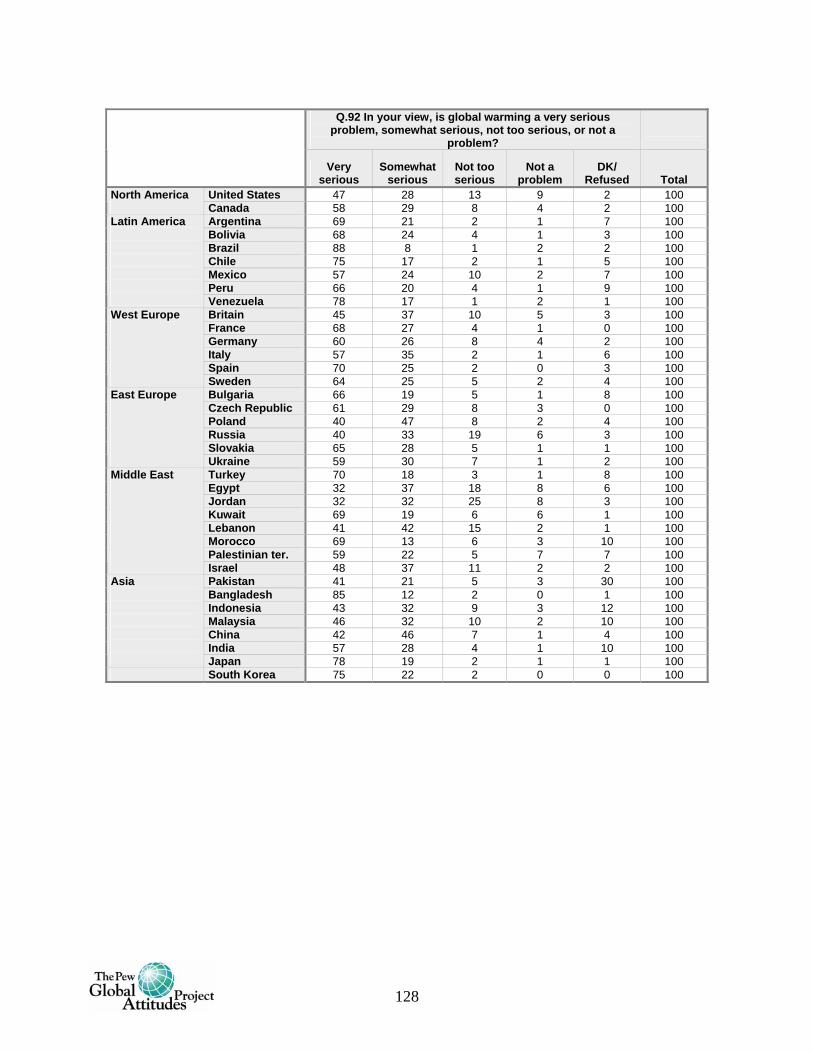
128
Q.92 In your view, is global warming a very serious
problem, somewhat serious, not too serious, or not a problem?
Very serious
Somewhat serious
Not too serious
Not a problem
DK/ Refused Total
United States 47 28 13 9 2 100 North America Canada 58 29 8 4 2 100
Argentina 69 21 2 1 7 100 Bolivia 68 24 4 1 3 100 Brazil 88 8 1 2 2 100 Chile 75 17 2 1 5 100 Mexico 57 24 10 2 7 100 Peru 66 20 4 1 9 100
Latin America Venezuela 78 17 1 2 1 100
Britain 45 37 10 5 3 100 France 68 27 4 1 0 100 Germany 60 26 8 4 2 100 Italy 57 35 2 1 6 100 Spain 70 25 2 0 3 100
West Europe Sweden 64 25 5 2 4 100
Bulgaria 66 19 5 1 8 100 Czech Republic 61 29 8 3 0 100 Poland 40 47 8 2 4 100 Russia 40 33 19 6 3 100 Slovakia 65 28 5 1 1 100
East Europe Ukraine 59 30 7 1 2 100
Turkey 70 18 3 1 8 100 Egypt 32 37 18 8 6 100 Jordan 32 32 25 8 3 100 Kuwait 69 19 6 6 1 100 Lebanon 41 42 15 2 1 100 Morocco 69 13 6 3 10 100 Palestinian ter. 59 22 5 7 7 100
Middle East Israel 48 37 11 2 2 100
Pakistan 41 21 5 3 30 100 Bangladesh 85 12 2 0 1 100 Indonesia 43 32 9 3 12 100 Malaysia 46 32 10 2 10 100 China 42 46 7 1 4 100 India 57 28 4 1 10 100
Asia Japan 78 19 2 1 1 100 South Korea 75 22 2 0 0 100
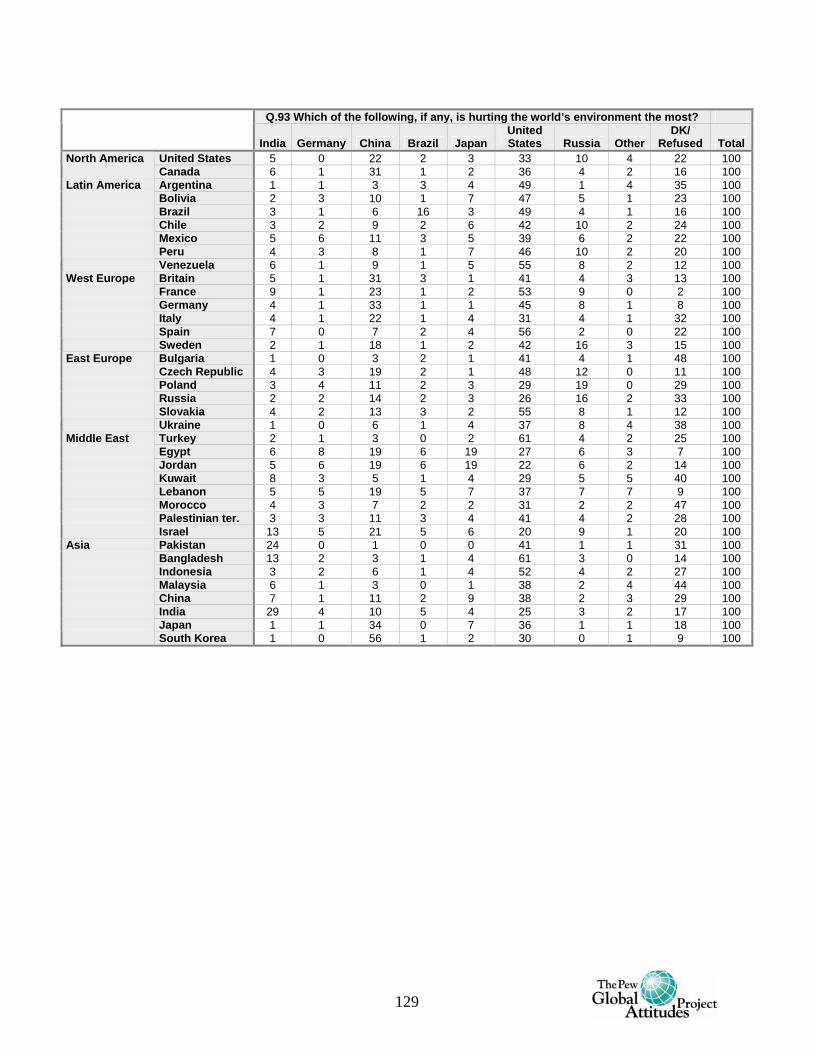
129
Q.93 Which of the following, if any, is hurting the world’s environment the most?
India Germany China Brazil Japan
United States Russia Other
DK/ Refused Total
United States 5 0 22 2 3 33 10 4 22 100 North America Canada 6 1 31 1 2 36 4 2 16 100
Argentina 1 1 3 3 4 49 1 4 35 100 Bolivia 2 3 10 1 7 47 5 1 23 100 Brazil 3 1 6 16 3 49 4 1 16 100 Chile 3 2 9 2 6 42 10 2 24 100 Mexico 5 6 11 3 5 39 6 2 22 100 Peru 4 3 8 1 7 46 10 2 20 100
Latin America Venezuela 6 1 9 1 5 55 8 2 12 100
Britain 5 1 31 3 1 41 4 3 13 100 France 9 1 23 1 2 53 9 0 2 100 Germany 4 1 33 1 1 45 8 1 8 100 Italy 4 1 22 1 4 31 4 1 32 100 Spain 7 0 7 2 4 56 2 0 22 100
West Europe Sweden 2 1 18 1 2 42 16 3 15 100
Bulgaria 1 0 3 2 1 41 4 1 48 100 Czech Republic 4 3 19 2 1 48 12 0 11 100 Poland 3 4 11 2 3 29 19 0 29 100 Russia 2 2 14 2 3 26 16 2 33 100 Slovakia 4 2 13 3 2 55 8 1 12 100
East Europe Ukraine 1 0 6 1 4 37 8 4 38 100
Turkey 2 1 3 0 2 61 4 2 25 100 Egypt 6 8 19 6 19 27 6 3 7 100 Jordan 5 6 19 6 19 22 6 2 14 100 Kuwait 8 3 5 1 4 29 5 5 40 100 Lebanon 5 5 19 5 7 37 7 7 9 100 Morocco 4 3 7 2 2 31 2 2 47 100 Palestinian ter. 3 3 11 3 4 41 4 2 28 100
Middle East Israel 13 5 21 5 6 20 9 1 20 100
Pakistan 24 0 1 0 0 41 1 1 31 100 Bangladesh 13 2 3 1 4 61 3 0 14 100 Indonesia 3 2 6 1 4 52 4 2 27 100 Malaysia 6 1 3 0 1 38 2 4 44 100 China 7 1 11 2 9 38 2 3 29 100 India 29 4 10 5 4 25 3 2 17 100 Japan 1 1 34 0 7 36 1 1 18 100
Asia South Korea 1 0 56 1 2 30 0 1 9 100