RISING MILK PRICE – A CAUSE FOR CONCERN ON FOOD SECURITY No. 472_1.pdf · RISING MILK PRICE – A...
38
IIMB-WP N0. 472 1 WORKING PAPER NO: 472 RISING MILK PRICE – A CAUSE FOR CONCERN ON FOOD SECURITY S Rajeshwaran Doctoral student Centre for Public Policy Indian Institute of Management Bangalore Bannerghatta Road, Bangalore – 5600 76 [email protected] Gopal Naik Professor Economics & Social Science Indian Institute of Management Bangalore Bannerghatta Road, Bangalore – 5600 76 Ph: 080-26993194 [email protected] R. Albert Christopher Dhas Associate Professor Economics Department The American College, Madurai [email protected] Year of Publication-October 2014
Transcript of RISING MILK PRICE – A CAUSE FOR CONCERN ON FOOD SECURITY No. 472_1.pdf · RISING MILK PRICE – A...
IIMB-WP N0. 472
1
WORKING PAPER NO: 472
RISING MILK PRICE – A CAUSE FOR CONCERN ON FOOD SECURITY
S Rajeshwaran Doctoral student
Centre for Public Policy Indian Institute of Management Bangalore Bannerghatta Road, Bangalore – 5600 76
Gopal Naik Professor
Economics & Social Science Indian Institute of Management Bangalore Bannerghatta Road, Bangalore – 5600 76
Ph: 080-26993194 [email protected]
R. Albert Christopher Dhas Associate Professor
Economics Department The American College, Madurai
Year of Publication-October 2014

IIMB-WP N0. 472
2
Rising Milk Price – A Cause for Concern on Food Security Abstract Continuous rise in food prices has been posing a serious policy challenge in India. Milk is a major contributor to the food price rise due to its high growth in demand in the domestic and international markets with domestic supply not keeping pace. Mere market price signal is inadequate for the milk production system to respond. This is due to supply constraints including increasing cost of production. This situation is expected to continue with lower growth in milk producing adult female animal population. Therefore, policy measures need to be relooked at to study and strengthen the entire production ecosystem in terms of technology, access to information, credit availability, improvement in risk cover mechanisms and access to markets to enhance profitability and reduce risk, to incentivise dairy animal rearing and milk production. Keywords: Milk Price, Milk Production, Food Security, Buffer Stock, Policy Ecosystem

IIMB-WP N0. 472
3
In the recent years, high and persistent food inflation has been a matter of concern and focus
of policy discussions, in India. While it undermines the purchasing power of every citizen,
the poor are particularly affected as they have limited means to hedge against inflation
inflicting a ‘hidden tax’i on them and aggravating their nutritional deficiency status (Deaton
and Dreze 2009). The price of milk, an important item contributing to this food inflation, has
been steadily rising in the domestic market. Even in the last one year from May 2013 to May
2014, the consumer price of milk has risen by 14.5%ii.
The pressure on the food articles price indices is said to have mostly come from milk, meat
products, fruits and vegetables during the period 2005-06 through 2012-13. Policy measures
related to fiscal deficit and monetary expansion, domestic supply variable such as rising farm
wages and global food inflation explain 98% of the variation in food inflation in India (Gulati
and Saini 2013). Demand shocks have also been attributed to the present food inflation by a
few studies (Landes 2007) (Gokarn 2010a). Economic policy changes can also cause a shift
in demand for farm products and affect their prices significantly (Thompson 1988).
Bhattacharya and Rao et. al (2014) attributed the present rise in milk price to an increased
demand in domestic market with no commensurate increase in supply indicating a structural
problem and aver that post-2009, the price rise of animal proteins, including milk is the
major driver of food inflation in India.
Based on earlier studies on the rise in India’s food inflation, Bandara (2013) classifies its
drivers under four categories of factors of demand, supply, institutions and policy. However,
some of the key factors that are specific to milk sector such as role of export and buffer stock
and productive population have not been addressed by the researchers. This paper tries to
address this gap by systematically examining domestic and international markets for milk
individually and then analysing how they are inter-linked.
Our analysis is in line with suggestion made by Bandara (2013) that every sector of the
Indian food economy needs to be studied independently. Accordingly, we try to correlate the
major factors impacting domestic demand and supply of milk and the relationship between
domestic and international milk markets, along with the policies on the international trade of
skim milk powder (SMP). We follow it with a discussion on increasing cost of milk
production by way of feeding cost, wages and energy prices along with major supply side
constraints such as credit and insurance and livestock market. Finally, we discuss the possible

IIMB-WP N0. 472
4
negative effect of reduced male animals on productivity of female population as well as the
reduction in growth of female animals on growth in milk production, post-2007.
Specifically, we examine how the international prices are transmitted to domestic markets
through levels of domestic buffer stock of SMP and why a mere rise in the price of milk is
found to be insufficient to incentivise Indian dairy farmers to enhance investments in dairy
animal rearing and technology to increase milk supply. The latest USDA Global Agricultural
Information Network (GAIN) Report of Oct 2014 also reaffirms its earlier doubts about the
ability of the existing initiatives of the government including the National Dairy Plan and the
organised milk trade which accounts for only 30% of total milk production to be able to
service the growing domestic demand for milk (Mani and Intodia 2014).
The flow diagram (Figure 1) identifies the important factors that influence the domestic price
of milk, by way of demand, supply and policy.
Figure 1 Conceptual diagram on factors of Milk Price in India
In the recent past, India has been experiencing a strong growth in demand for dairy products
estimated at 6% to 8% per annum, whereas growth in supply is only 3% to 4% per annumiii.
Punjabi (2009) cautioned that the emerging mismatch between demand and supply of milk in
India is severely worrisome as it would then become a net milk deficit country and thus rely
have to on the world market. Even without considering the export market, Yaron (2014)

IIMB-WP N0. 472
5
cautions that the ever increasing rise in domestic demand for dairy products with a large
demand-supply gap could lead India to being a net importer of dairy products in the near
future. For the present, the supply is being augmented on a temporary ad hoc basis as and
when necessary by way of imports. However, the large volume India requires against the
supplies available in the international market has bearing on global milk prices. Further, the
international market is highly volatile. Hence, imports as a permanent arrangement seems to
be not a solution and would only aggravate the rise in domestic price, further. Therefore, the
present sharp rise in exports of dairy products specifically for SMP from India over the last
two years in 2012-13 and 2013-14 may not be revealing the true picture of the demand-
supply gap for milk. In no foreseeable future is India expected to have surplus for exports.
Further, consumption of milk and dairy products in the developing world is expected to
continue on a path of rising growth rate, at least till 2030 (Alexandratos 2008). Therefore,
there is an urgent need to take a fresh look at the present interventions and areas that need to
be freshly addressed, towards increasing growth rate in domestic milk production.
Self-sufficiency in food from domestic supplies has been the prime motive behind the highly
interventionist agricultural external trade policies in India (Shreedhar, Gupta et al. 2012). The
policy intervention in respect of milk also follows similar lines of allowing or disallowing of
free export of SMP while keeping in mind the domestic requirement. It is being argued here
that a shortfall in quantity of SMP available for reconstitution to liquid milk arising from
exports led to a situation wherein, the rise in the global milk price was fully transmitted to the
domestic milk price between 2006 and 2013.
Trend in Milk Price:
The wholesale price index (WPI)
of milk has risen at a
Compounded Annual Growth
Rate (CAGR) of 10.5% in the
last 8 years from April 2006 to
March 2014. This is 2.23 times
the rise of CAGR of 4.7%, in the
previous 8-year period from
April 1988 to March 2006iv
129.5
187
103.4
230.1
100
120
140
160
180
200
220
240
1998 Apr 2006 Mar 2006 Apr 2014 Mar
Base Year 1993-94 Base Year 2004-05
WPI-Milk
Figure 2 Growth of WPI-Milk over two periods
IIMB-WP N0. 472
6
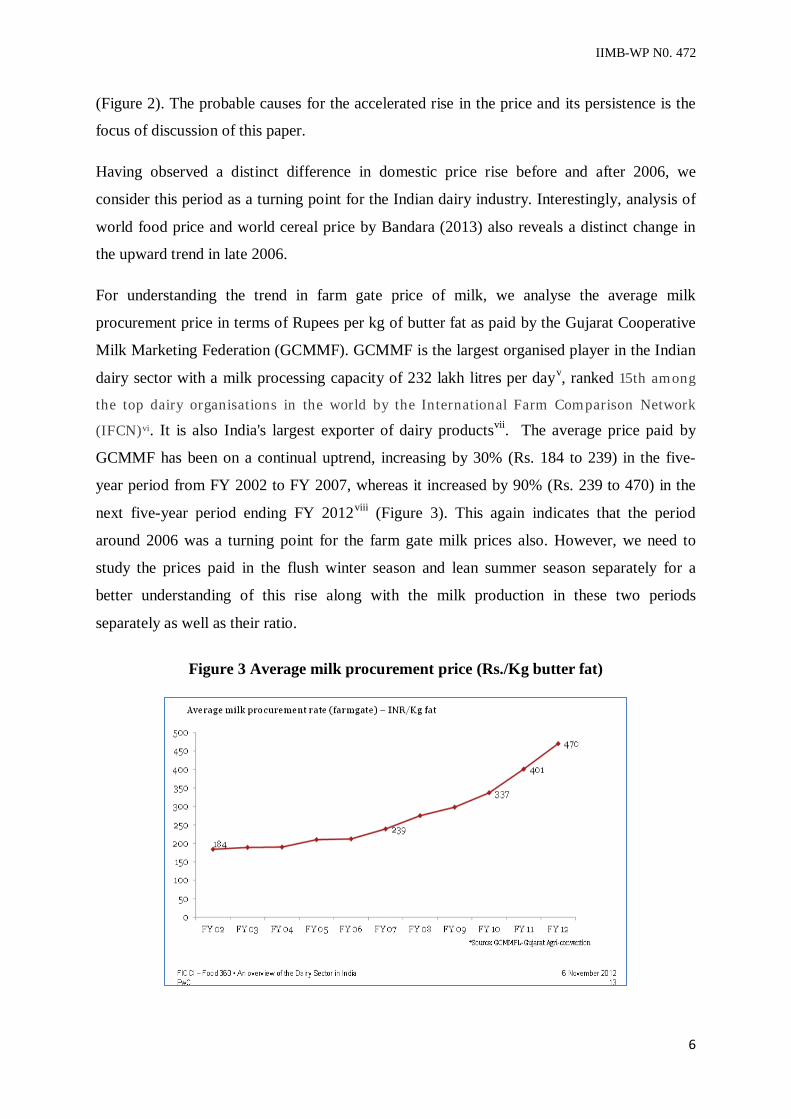
(Figure 2). The probable causes for the accelerated rise in the price and its persistence is the
focus of discussion of this paper.
Having observed a distinct difference in domestic price rise before and after 2006, we
consider this period as a turning point for the Indian dairy industry. Interestingly, analysis of
world food price and world cereal price by Bandara (2013) also reveals a distinct change in
the upward trend in late 2006.
For understanding the trend in farm gate price of milk, we analyse the average milk
procurement price in terms of Rupees per kg of butter fat as paid by the Gujarat Cooperative
Milk Marketing Federation (GCMMF). GCMMF is the largest organised player in the Indian
dairy sector with a milk processing capacity of 232 lakh litres per dayv, ranked 15th among
the top dairy organisations in the world by the International Farm Comparison Network
(IFCN)vi. It is also India's largest exporter of dairy productsvii. The average price paid by
GCMMF has been on a continual uptrend, increasing by 30% (Rs. 184 to 239) in the five-
year period from FY 2002 to FY 2007, whereas it increased by 90% (Rs. 239 to 470) in the
next five-year period ending FY 2012viii (Figure 3). This again indicates that the period
around 2006 was a turning point for the farm gate milk prices also. However, we need to
study the prices paid in the flush winter season and lean summer season separately for a
better understanding of this rise along with the milk production in these two periods
separately as well as their ratio.
Figure 3 Average milk procurement price (Rs./Kg butter fat)

IIMB-WP N0. 472
7
It is pertinent here to understand how milk price was kept under manageable limits in India,
in the earlier period and therefore get us a better perspective of the changed situation. Similar
to any agricultural commodity, milk production also has a seasonal variation whereas
consumption is fairly constant. This necessitates the creation and maintenance of a buffer
stock of SMP and butter, till the time of utility which is normally less than one year.
Firstly, there was a ban on export of SMP and import was allowed on ad hoc basis only when
necessary and canalised through authorised agencies. It began with the creation of a domestic
buffer stock of SMP using the milk powder gifted by US under PL 480ix in the 1970s under
the Operation Flood programme. It was this buffer stock of SMP that was used in
reconstitution of liquid milk for sale to urban consumers in the lean summer months when
supply was less than demand. This enabled the dairy cooperatives to service the urban
market, all round the year. The SMP got replenished in the following flush winter season
when domestic milk supply was more than demand, using the newly created milk powder
plants by the dairy cooperatives under the financial and technical consultancy of the National
Dairy Development Board (NDDB). It was this buffer stock of SMP coupled with a ban on
export of SMP that provided the leverage required to moderate the rise in domestic milk
price. The importance of buffer stock of SMP on milk price rise in moderating the increase in
milk price was clearly recognised by the Cabinet Committee in February 2007 and therefore
called for creation of a 10,000 MT domestic buffer stock while simultaneously banning
exports till the end of lean season in September 2007.
So, the price rise post-2006 may have been caused by a sharp drop in the domestic buffer
stock of SMP. This is indicated by the fact that the export of SMP had a tenfold increase from
4,025 MT in 2003-04 to 40,263 MT in 2005-06, effectively drawing down the domestic
buffer stock of SMP. Analysis of stock of SMP in the country at the beginning of calendar
year from 2004 to 2010 reveals that the variation remained between 5,000 and 15,000 MTx,
indicating that there was no undue build-up of stocks. This rise in export of SMP was
triggered by the steep rise in the international market price from Rs.88 per kg in early 2006 to
Rs.148 per kg by the end of 2006. Such sudden and high growth in exports indicates that
inventory of SMP was readily available in the country as domestic buffer stock. Very little
quantity could have come from the previous year’s inventory, as shelf life of SMP produced
in India is generally less than 12 months. This is at a time when the growth in production was
constant and the growth in domestic milk consumption was increasing. However, only a

IIMB-WP N0. 472
8
month-wise analysis of stock of SMP, production and consumption can give us a clearer
picture. The WPI of SMP rose at a CAGR of 8% between April 2006 and March 2014.
The attractiveness of the export market for SMP for the domestic manufacturers is due to
industry-specific reasons. The industry especially those in the organised sector build their
business on the 15–30-day credit line provided to them by their milk suppliers, the dairy
farmers and have cash sales at the market end. So, lock-in of working capital by way of
finished goods is looked down upon. Further, milk powder plants are capital and power
intensive with low capacity utilisation of less than 25%. Secondly, converting liquid milk to
SMP entails additional cost towards processing, transport and storage. The lock-in period for
SMP between production and sales realisation could be as high as 6–10 months as major
portion of requirement for SMP in the domestic market is in summer lean months while
production is in the winter flush season. Hence, an international market with higher price and
no seasonal variation is found to be attractive to domestic SMP producers, especially at
higher price levelsxi.
So, with the sudden rise in export of SMP, the domestic industry which uses SMP for
recombination for domestic liquid milk market was adversely affected by shortage of SMP in
2006 and early 2007. It is this shortage that is purported to have had a cascading effect
causing the domestic milk price to rise at an accelerated pace. Bhattacharya et al (2014) also
endorse that by 2008-09, the demand for milk and milk products had overrun the domestic
supply.
We find a similar scenario for cereals, wherein the drawing down of buffer stock of cereals in
China is said to be one of the factors to have caused the sudden rise in price of cereals in
2008 (Alexandratos 2008).
Having discussed the trend in the domestic price of milk at the wholesale and farm-gate
levels and the role played by the buffer stock in moderating price rise, we proceed to analyse
the effect of domestic demand and supply factors on domestic price and the linkage with
international market.
Domestic Demand: Food expenditure in India constituted 52.9% and 42.6% for those living in rural and urban
areas, respectively in 2011-12xii. Of the food expenditure, share of milk is 8% (Rs.115) for
rural and 7% (Rs.184) for urban areas. The urban consumer is spending 60% more on milk

IIMB-WP N0. 472
9
and milk products compared to his/her rural counterpart (Table 1), indicating that
urbanisation and rural to urban migration would further the increase in demand for milk.
Table 1 Monthly per capita expenditure in 2011-12
Item MPCE* (Rs.) % of Total MPCE
Rural Urban Rural Urban Milk & Milk products 115 184 8.0 7.0 Cereals 154 175 10.8 6.7 Egg, fish & meat 68 96 4.8 3.7 Beverages, refreshments & processed food 113 236 7.9 9.0 Food Total 756 1121 52.9 42.6 Total 1430 2630 100 100 * Avg. Monthly Per Capita Consumer ExpenditureMMRP in 2011-12 Source: NSS 68th Round Key Indicators of Per Capita Expenditure
The weightage that milk price has on food inflation can be seen from the fact that it forms the
second most important food item consumed in terms of money spent. Per capita monthly
expenditure on milk and milk products is more than cereals in urban areas, while it is next
only to cereals in rural. Therefore, increasing milk prices is likely to have significant effect
on food price inflation (Bhattacharya, Rao et al. 2014).
However, the average per capita expenditure masks the high inter-state and intra-state
variationxiii. Urban consumers in Chhattisgarh spend 3.83 times more money (Rs. 64 vs
Rs.14) than their rural counterparts, while in Haryana, they spend nearly an equal amount
(Rs.452 vs Rs.475). From these figures, it is also evident that there is high inter-state
variation also in both rural and urban regions.
Between 1993-94 and 2011-12, the proportion of expenditure on milk by consumers has
come down from 9.5% to 9.1% for rural areas and from 9.8% to 7.8% for urban areasxiv.
However, between 2009-10 and 2011-12, the total per capita expenditure (MPCEMMRP) has
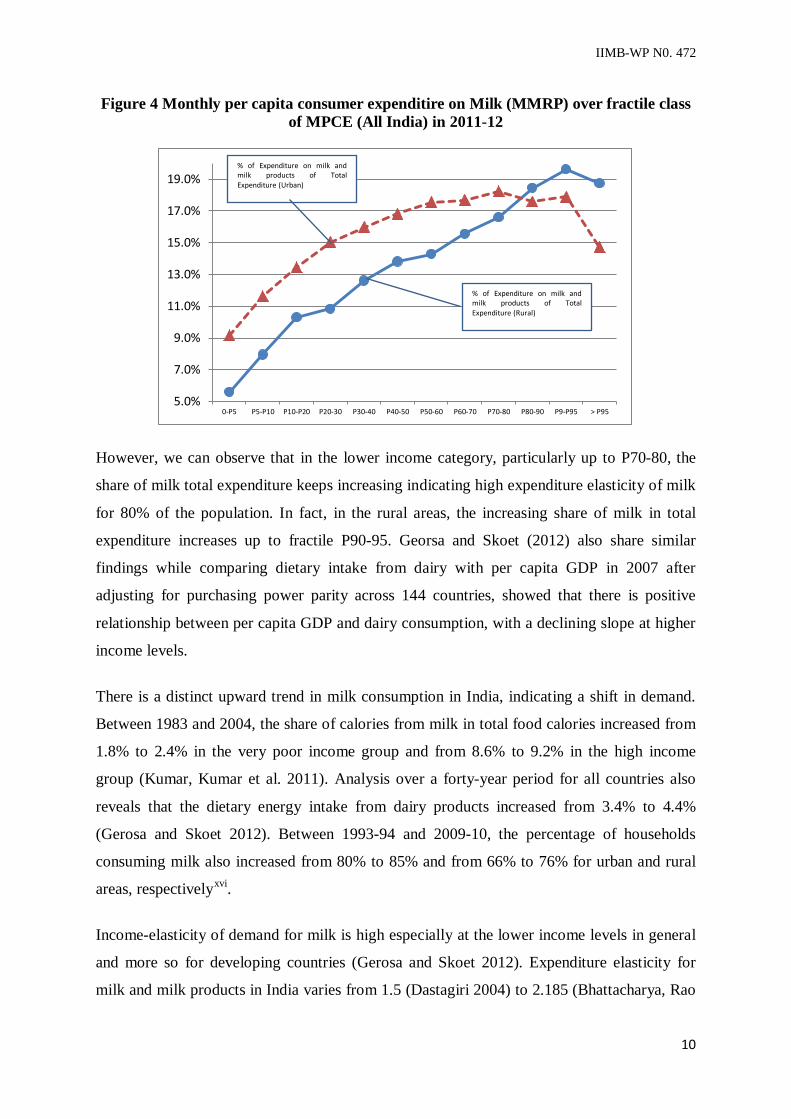
increased by 36% and 33% for rural and urban areas, respectively. Fractile analysis of
consumer expenditure on milk (MPCEMMRP) in 2011-12 across income groupsxv shows
decline only for the highest income (>P95), indicating the inelastic expenditure elasticity for
milk (Figure 4) for all other groups.
IIMB-WP N0. 472
10
Figure 4 Monthly per capita consumer expenditire on Milk (MMRP) over fractile class of MPCE (All India) in 2011-12
However, we can observe that in the lower income category, particularly up to P70-80, the
share of milk total expenditure keeps increasing indicating high expenditure elasticity of milk
for 80% of the population. In fact, in the rural areas, the increasing share of milk in total
expenditure increases up to fractile P90-95. Georsa and Skoet (2012) also share similar
findings while comparing dietary intake from dairy with per capita GDP in 2007 after
adjusting for purchasing power parity across 144 countries, showed that there is positive
relationship between per capita GDP and dairy consumption, with a declining slope at higher
income levels.
There is a distinct upward trend in milk consumption in India, indicating a shift in demand.
Between 1983 and 2004, the share of calories from milk in total food calories increased from
1.8% to 2.4% in the very poor income group and from 8.6% to 9.2% in the high income
group (Kumar, Kumar et al. 2011). Analysis over a forty-year period for all countries also
reveals that the dietary energy intake from dairy products increased from 3.4% to 4.4%
(Gerosa and Skoet 2012). Between 1993-94 and 2009-10, the percentage of households
consuming milk also increased from 80% to 85% and from 66% to 76% for urban and rural
areas, respectivelyxvi.
Income-elasticity of demand for milk is high especially at the lower income levels in general
and more so for developing countries (Gerosa and Skoet 2012). Expenditure elasticity for
milk and milk products in India varies from 1.5 (Dastagiri 2004) to 2.185 (Bhattacharya, Rao
5.0%
7.0%
9.0%
11.0%
13.0%
15.0%
17.0%
19.0%
0-P5 P5-P10 P10-P20 P20-30 P30-40 P40-50 P50-60 P60-70 P70-80 P80-90 P9-P95 > P95
% of Expenditure on milk and milk products of Total Expenditure (Rural)
% of Expenditure on milk and milk products of Total Expenditure (Urban)

IIMB-WP N0. 472
11
et al. 2014). The average income elasticity for milk is 1.64 across all income groups, going up
to 2.34 for very poor households (Kumar, Kumar et al. 2011). This shows that an increase in
income would lead to more than proportionate increase in demand for milk and milk products
and therefore drive up the food inflation.
However, the demand for milk has a high price elasticity of –2.989 in India (Dastagiri 2004)
implying high variability in consumption with respect to price changes. This is in contrast to
the –0.59 mean price elasticity for milk consumers in a developed economy such as United
States of America (Andreyava, Long et al. 2010). Therefore, if for any reason the growth in
income level in India reduces and the price of milk increases, a sharp fall in milk
consumption level is expected, especially at the lower income level.
Study across countries has also shown a positive relationship between dietary energy intake
from dairy products and per capita GDP of income (Gerosa and Skoet 2012), with greater
effect of income on consumption at lower income levels. Kumar, Kumar et al. (2011)
studying the impact of changes in both income and price have concluded that lower income
groups would be more adversely affected by the increasing food inflation. With increased
income, milk consumption amongst the lowest 10% income group in China increased by
100% between 1996 and 2003 (Fuller, Huang et al. 2006). Therefore, with increasing income
levels in India, this growth trend in percentage of households consuming milk as well as per
capita consumption is expected to continue increasing.
An important indicator of growth in demand for milk is the growing demand for SMP as it is
mainly used for reconstitution into liquid milk along with butter when fresh milk supply is in
short supply, in the lean summer months. Domestic consumption of SMP has grown steadily
at a CAGR of 8.1%, from 1.95 lakh MT to 4.25 lakh MT between 2002 and 2013xvii. During
this 10-year period, domestic supply has generally remained above demand with a small
quantity of buffer stock to carry over to the next year, providing dampening effect to the rise
in milk price.
South and East Asia experienced the fastest growth in milk consumption of 4.0% and 5.9%
per annum, respectively between 1961 and 2007 in the world. The demand for milk and dairy
products excluding butter (fresh milk equivalent) in the developing countries is expected to
increase by 27% from 52 kg per person per year in 2005/07 to 66 kg per person per year in
2030. Even this level of consumption would only be 31% of that in developed countries
(Alexandratos and Jelle 2012). This indicates the possibility of high growth in demand for
IIMB-WP N0. 472
12
milk and dairy products in developing countries. This is especially true for India, which has
predominantly a vegetarian population with preference for milk over meat, as a source of
animal protein. Gerosa and Skoet (2012) also affirm that there is scope for consumption
growth for milk in developing countries where the per capita consumption is low.
A “secular shift” in food consumption is said to have occurred with preference for high-value
agricultural products such as milk (Eapen and Nair 2012). As a result, pressure on the Food
Article Price Index came from high value products such as milk (Gulati and Saini 2013) for
most of the time from 2005-06 to 2012-13.
The matter of concern is while growth in consumption is increasing; growth in milk
production is declining, at the national level (Gokarn 2010a, Bhattacharya, Rao et al. 2014,
Bhattacharya, Rao et al. May 2014). The USDA GAIN report states that consumption growth
in the Indian dairy market has been 6.8% per annum, over the last decadexviii. This means that
the growth in milk supply has to increase at a minimum of 6.8% on CAGR basis, merely to
keep pace with the domestic demand growth, not considering the export market. So, the
Government of India’s projected growth of 4.1% in milk production indicates something
amiss on the policy front.
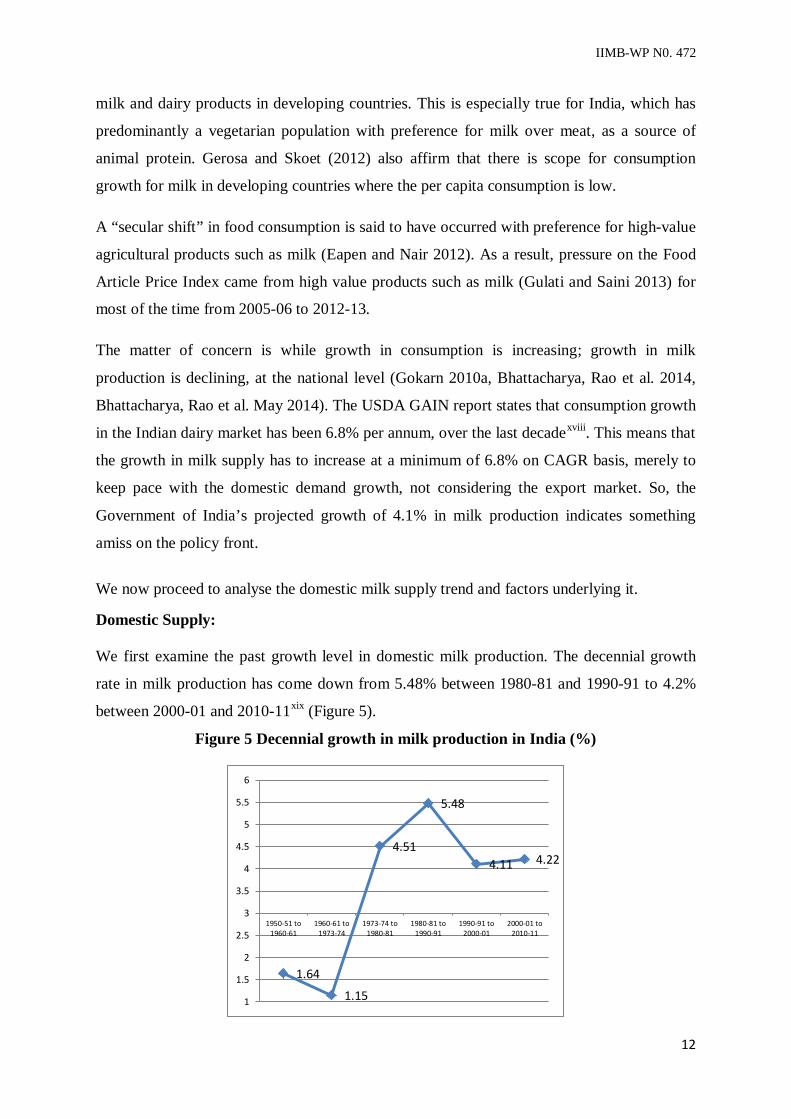
We now proceed to analyse the domestic milk supply trend and factors underlying it. Domestic Supply: We first examine the past growth level in domestic milk production. The decennial growth
rate in milk production has come down from 5.48% between 1980-81 and 1990-91 to 4.2%
between 2000-01 and 2010-11xix (Figure 5).
Figure 5 Decennial growth in milk production in India (%)
1.64
1.15
4.51
5.48
4.11 4.22
1
1.5
2
2.5
3
3.5
4
4.5
5
5.5
6
1950-51 to1960-61
1960-61 to1973-74
1973-74 to1980-81
1980-81 to1990-91
1990-91 to2000-01
2000-01 to2010-11

IIMB-WP N0. 472
13
In the short-term too, the annual growth in domestic milk production is exhibiting a distinct
downtrend, coming down to 3.5% in 2012-13 from 5.7% in 2006-07 (Figure 6). Gokarn
(2010a) while analysing the annual growth rate in milk production, has shown that it is not
only declining but also volatile. FAO estimates that the growth in milk production would be
3.9%xx in the calendar year 2014, while the Government of India in December 2013
anticipated a growth rate of 5.5% during the financial year 2013-14xxi.
Figure 6 Annual growth rate in milk production in India
Now, we will have a look at the targets set by the Government of India. It estimates that the
domestic demand for milk would reach 191 MT by 2020. This effectively requires an
incremental production of 58 MT in the next 9 years from the level of 132.43 MTxxii in 2012-
13 with a CAGR of 4.1%. It is to be noted here that the previous incremental quantity of 58
MT of milk was achieved in 15 years. Therefore, the past trend in growth, both in the long
and short terms indicates that even this level of 4.1% per annum growth in milk production is
difficult to achieve (Mani and Intodia 2014).
The average per capita availability of milk in India reached 296 grams per day in 2011-12
from 178 grams per day in 1999-92xxiii. It is significant to note that the per capita availability
of milk has accelerated since 2005-06. During the 7-year period from 2005-06 to 2011-12, it
grew at a CAGR of 2.7% as compared to the CAGR of 1.9% in the previous seven-year
period (Figure 6). This again indicates that the period around 2006 was indeed a turning
point, even for per capita consumption, considering the fact that a very small portion is
exported and that the consumption and supply are nearly equal.
5.7%
5.2%
4.0% 3.7%
4.6%
5.0%
3.5% 3.5%
4.0%
4.5%
5.0%
5.5%
6.0%
2006-07 2007-08 2008-09 2009-10 2010-11 2011-12 2012-13

IIMB-WP N0. 472
14
Figure 7 Growth in per capita availability of milk (Gm/day)
Delgado (2003) estimated that with an annual growth rate of 3.5%, the per capita
consumption in India would reach 288 grams per day by the year 2020xxiv. However, we
observe that this level of 288 grams per day has been surpassed nine years earlier, in 2011-12
itself, mainly due to the increased growth in per capita consumption of milk in India after
2005-06.
The per capita consumption of milk in rural areas increased at a CAGR of 1.2% and at 1% in
urban areas, between 2004-05 and 2009-10. This accelerated growth in milk availability and
consumption is in line with the general trend of increased contribution of livestock products
to calorie intake in developing countries (Gerosa and Skoet 2012).
However, as we have seen in milk consumption, there are major regional differences in the
level and trend of milk production, across states. For example, in 2011-12, the per capita
availability of milk in Punjab was 945 grams per day; whereas in Tripura, it was only 80
grams per day. Similarly, milk production in Punjab grew at a CAGR of 0.9%; whereas in
Tripura, it grew at a CAGR of 4%, in the five-year period from 2007-08 to 2012-13. This
highlights the need for state-level interventions to enhance milk production.
Milk supply response to high prices is constrained by the biological factors. In the short-run,
there is excess capacity to produce more milk from existing breedable adult female animal
population. This could be obtained in two ways: directly by higher per capita milk production
and indirectly by reduction in reproductive and metabolic problems. With a more balanced
nutrition (Kannan, Garg et al. 2011) and reducing negative energy balance status (Butler and
Smith 1989, Wathes, Fenwick et al. 2007) and feeding full requirement of proteins (Jain,
180
200
220
240
260
280
300
92-9
393
-94
94-9
595
-96
96-9
797
-98
98-9
999
-00
00-0
101
-02
02-0
303
-04
04-0
505
-06
06-0
707
-08
08-0
909
-10
10-1
111
-12

IIMB-WP N0. 472
15
Saksule et al. 2012), one could obtain higher milk yield in the short-term. So, in response to
the rise in price of milk, a typical firm, farm in our case, increases its output by moving along
the short-run marginal cost curve. Higher profit earned encourages increased milk production
through higher capacity utilisation, expansion of existing dairy farms and new farmers
entering dairy animal rearing.
However, this increases the demand for factors of production such as cattle feed and labour,
resulting in rise in their prices. Constituents of cattle feed are mainly cereals, oil cakes and
molasses. Demand for these three items arises from other sources also. Oil cakes have high
export potential, while molasses used for producing ethanol finds the domestic bio-fuel and
liquor market more remunerative. Bhattacharya et al (May 2014) have shown that in the four-
year period between 2007-08 and 2012-13, the price of oil cakes rose at CAGR of 13% due to
shortfall in oilseed production. Gokarn (2010a), while discussing the rise in the price of
proteins in general, also expresses concern on the adverse impact of price of cattle feed on
cost of milk production. The oil cakes and molasses are both by-products of agriculture,
namely oilseeds and sugarcane, respectively and therefore have a lag response. Further, semi-
skilled rural labour force required to manage dairy animals finds alternative socially more
valued livelihood such as construction work in urban centres, thus increasing the cost of
production.
A main source of increase in milk production is the increase in the number of adult female
bovine animals yielding milk. However, we observe that their growth in terms of percentage
is on the decline over the last one decade, according to the last three animal censuses (Table
2).

IIMB-WP N0. 472
16
Table 2 Growth rate in female bovine population over three censuses
Year of Census CAGR
Female animal type 2003 2007 2012 2003 to
2007 2007 to
2012 2003 to 20012
Buffaloes
Young (< 3 years) 27367 29767 34724 2.12% 3.13% 2.68%
Adult (> 3 years) 47574 51375 53855 1.94% 0.95% 1.39%
Indigenous Cattle
Young (< 3 years) 29281 31086 32579 1.51% 0.94% 2.16%
Adult (> 3 years) 49594 54268 52488 2.28% -0.66% 0.63%
Crossbred Cattle
Young (< 2.5 years) 6664 9094 11635 8.08% 5.05% 6.39%
Adult (> 2.5 years) 10836 14571 19636 7.68% 6.15% 6.83%
Young Female Total 63312 69947 78938 2.52% 2.45% 2.48%
Adult Female Total 108004 120214 125979 2.17% 0.94% 1.73%
Number in thousands Source: 17th, 18th and 19th Livestock Censuses, GoI
The annual growth rate of adult female animal population more than halved from 2.17% to
0.94% per annum over the last two census periods. Specifically, annual growth on CAGR
basis in adult female buffaloes, indigenous cattle and crossbred cattle has come down from
1.94% to 0.95%, from 2.28% to –0.66% and from 7.68% to 6.15%, respectively.
Further, from the point of future growth in milk production, a high number of young female
calves attaining adulthood leads to increased growth. However, their growth rate marginally
declined from CAGR of 2.52% to 2.45%. However, this overall growth rate conceals the fact
that the growth in adult female animals over the next three years will be derived mainly from
buffalo calves as their growth in terms of CAGR has increased from 2.12% to 3.13%. The
growth rate of young crossbred cattle has come down from a CAGR of 8.08% to 5.05% and
young indigenous cattle down from 1.51% to 0.94%. A reduction in total population indicates
that some of the economically weak farmers may be moving out of dairy animal rearing.
It is important to note that this reduction in growth of adult female productive population and
a near constant growth in young calves occurred in a period when milk prices were rising at
an accelerated pace, at least in nominal terms. Only two situations could explain the reduction
in growth of adult female population; one, the attrition rate was high. Second, there was a
slowdown in proportion of young stock coming into adulthood, though the actual numbers
may have increased. Since there is little reduction in overall growth rate of young stock
coming into adulthood, we deduce that the attrition rate indeed is high. A reduction in growth

IIMB-WP N0. 472
17
of number of productive animals adversely affects the growth in milk production, unless and
otherwise this is nullified by sufficient growth in productivity per animal. Further, we find
that the growth over the next three years is mainly derived from buffaloes and not from
indigenous cattle or crossbred cattle. This indicates that there is a perceptible change in
growth trend with preference for buffalo rearing as against rearing of indigenous and
crossbred cattle. So, the entire institutional system for breeding and breed development may
need to be geared to cater to this preference for buffaloes. This preference for buffalo rearing
may be on account of the fact that a shift from rearing of indigenous cattle to crossbred cattle
involves a paradigm shift in rearing practices. The former is a low-input, low-output and low-
risk system while the latter is high-input, high-output and high-risk system. Farmers seem to
continue preferring the former type of rearing practice.
However, there is a rationale behind the emphasis on rearing and hence breeding of crossbred
cattle over indigenous cattle or even buffaloes, with the former giving a higher milk yield per
day than the other two. At the national level in 2012-13, crossbred cattle, buffaloes and
indigenous cattle produced an average per day milk yield of 7.02, 4.8 and 2.36 Kg,
respectivelyxxv. As a result, 15% of total number of animals, that is, the crossbred cattle,
yielded 25% of total milk produced in the country during 2012-13xxvi (Table 3).
Table 3 Estimates of milch animals and milk yield and milk yield rates in 2012-13
Dairy animal type Milch animals ('000) Milk production ('000 MT) Average milk yield
per day (Kg) No % Quantity % Crossbred cattle 12642 15% 32384 25% 7.02 Indigenous cattle 31870 38% 27421 22% 2.36 Buffalo 38638 46% 67675 53% 4.80
Total 83150 127480 However, as in milk consumption and per capita availability, there are inter-state variations in
average milk yield per animal per day high for all the three categories of dairy animals. For
example, milk yield per day of crossbred cattle varies from 11 litres in Punjab to 4.05 litres in
Assam; while even the indigenous cattle in Punjab yielded 6.52 litres of milk.
The total number of artificial inseminations (AI) performed in India reached 500.8 lakh,
increasing at a CAGR of 10% between 2004-05 and 2011-12xxvii; though it is unclear whether
the breakup of their total number reflects proportion of milk-yielding population in terms of
cattle and buffaloes. Milk productivity of female animals is being improved through bringing

IIMB-WP N0. 472
18
more number of animals under the AI programme using frozen semen from pedigreed and
proven bulls (especially, exotic breeds) and crossbred for cattle. In fact, productivity
enhancement is one of the main components being taken up under the National Dairy Plan
aiming to bring 50% of breedable adult female animals under AI by 2021-22xxviii.
Price of milk at the consumer end is determined by the level of fresh milk production and
stock of SMP available for reconstitution. So, the demand for SMP is a proxy indicator of
demand for milk. The annual domestic production of SMP has steadily increased from 1.85
lakh MT in 2002 to 4.5 lakh MT in 2012, growing at a CAGR of 9.3%, as per USDA Global
Agricultural Information Network Report on India. India produced 4.7 lakh MT of SMP in
2013 (Mani 2013) and the SMP is expected to go up to 5.2 and 5.5 lakh MT in 2014 and
2015, respectivelyxxix.
International Scenario: The international price of milk has risen at a CAGR of 10.67% between January 2006 and
January 2014xxx, indicating that the domestic milk price rise of 10.5% merely mirrored the
international price rise. However, recently there has been disconnect between the two prices.
During the eight-month period between January 2014 and August 2014, the international
price of milk fell by 28%, while the domestic price has risen by about 5%.
The international milk price indicated by the FAO dairy price index increased at a CAGR of
9.8% between 2004 and 2013xxxi (Table 4). The year-on-year price changes suggest a high
degree of variation, ranging from an increase by 68.9% during calendar year 2007 to a
decrease by 33.4% in 2009.

IIMB-WP N0. 472
19
Table 4 FAO Dairy Price Index
Year FAO Dairy Price Index % Change (Y-o-Y)
2004 123.5 2005 135.2 9.5% 2006 129.7 -4.1% 2007 219.1 68.9% 2008 223.1 1.8% 2009 148.6 -33.4% 2010 206.6 39.0% 2011 229.5 11.1% 2012 193.6 -15.6% 2013 242.7 25.4%
Source: http://www.fao.org/worldfoodsituation/foodpricesindex/en/
Consists of WMP, SMP and cheese price quotations; the average is weighted by the world average export trade
shares for 2002-04
However, a month-wise analysis of domestic milk price (using WPI of milk) and
international milk price (using the world milk price) in terms of energy corrected milk of 4%
fat and 3.3% protein as calculated by the International Farm Comparison Network (IFCN)
shows that the rise in their prices follows different patterns (Figure 8).
Figure 8 Comparison of domestic and international milk prices
The steady rise in the domestic prices stands in contrast to the highly volatile growth in the
world price (Kumar 2009).
20.0
25.0
30.0
35.0
40.0
45.0
50.0
55.0
100
120
140
160
180
200
220
240
2006Jan
2007Jan
2008Jan
2009Jan
2010Jan
2011Jan
2012Jan
2013Jan
2014Jan
WPI of Milk World milk Price $ / 100 Kilo ECM

IIMB-WP N0. 472
20
The international price of SMP also rose from a level of around USD 1000 per MT to USD
2000 between 1980 and 2006, growing at a CAGR of 1.2% and rose sharply to above USD
4,000 per MT in 2007 (Kumar 2009). This indicates that there was a demand shock in the
international milk market around 2006, resulting in price rise.
India is the largest producer of milk accounting for 17%xxxii
xxxiii
of world milk production and is
also the largest consumer of milk in the world. According to FAO, India contributed one-
third the quantity of milk produced by developing countries and 16% of the total world
production in 2009 (Gerosa and Skoet 2012). Only five countries, United States of America,
European Union, New Zealand, Australia and India being self-sufficient in milk accounted
for all exports of SMP. Amongst these producers, New Zealand and the European Union
account for 50% of the world milk trade (FAO 2014). Asian countries accounted for 55%
of the total milk imports from the international market and is expected to further grow in the
next decade due to rising disposable income and increasing population in these countries
(Gerosa and Skoet 2012). This is clearly observed from the growth in import of milk and
milk products by China, growing over 300% from 38 lakh MT in 2008 to 124 lakh MT in
2013 (FAO 2014).
FAO (2010) while examining the status and trends in the global dairy sector cautions that
milk is likely to become one of the most volatile agricultural commodities in the world due to
the strong influence that small changes in the quantities available internationally have on the
world market prices. There is also time-lag in milk production as a result of price change and
delayed reaction of the demand to changing dairy commodity prices. IFCN Dairy Report
2013 also forecasts that the volatility in the international milk market would continue in the
near future. This volatility in price cautioned by FAO and IFCN is reflected in the
international prices of SMP between 2006 and 2009; the price of SMP with 1.25% butter fat
varied from USD 2000–5500 per MTxxxiv. This variation in price of SMP continues to occur,
till date. It has in fact come down by 45% in 8 months from USD 4,693/MT in January 2014
to USD 2,600/MT in August 2014xxxv. This sharp fall in the international market price is
attributed to reduced purchases by China and Russia and higher production by European
Union and New Zealand (FAO 2014). A similar volatility was earlier observed in the 7-
month period between November 2006 and April 2007, when the FAO international dairy
price index rose by 46% and the price of SMP rose by 56%, where the spike in price of SMP
is attributed to depletion of its public stocks in the European Union (FAO 2014). This once
again indicates the role of buffer stock of SMP, on maintaining milk price level.

IIMB-WP N0. 472
21
So, such high price variation in the international market (Kumar 2009) and current account
deficit of USD 7.8 billion (1.7% of GDP) in the first quarter of 2014-15 for Indiaxxxvi,
prevents India from depending on imports as a substitute for enhancing domestic production.
Policy support should therefore be provided to improve productivity (Kolhar 2013).
Figure 9 WPI of SMP deflated with international price of 1.5% butter fat (Rs./MT)
To understand the competitiveness of the domestic market vis-à-vis the international market,
post-2006, we perform a simple ratio analysis of WPI for SMP with the international price of
1.25% butter fat SMP, after converting its price into Indian Rupee (INR) at the month’s
prevailing exchange rate. The figure shows that during 2006 to 2008, the price of SMP in the
international market was highly attractive as compared to the domestic price. This scenario
repeats itself in the winter of 2009 and 2010 and the whole of 2013 (Figure 9). We need to
recognise while analysing this ratio that the domestic demand for SMP in India is seasonal;
whereas the international demand is more constant.
Between 2003-04 and 2011-12, India’s export of SMP varied between 0 and 40,000 MT with
a maximum value of Rs.450 crore in 2007-08. The exports in 20011-12 had reduced to a near
zero. This was due to a ban on exports between February 2011 and June 2012. So, the record
levels of export occurred during 9 months of 2012-13 and 12 months of 2013-14. In 2013-14,
1.24 lakh MT of SMP valued at Rs.2605 crore was exportedxxxvii
xxxviii
(Figure 10). This formed
78% of the total value of dairy products exported from India in 2013-14 and about 7% of the
total world trade in SMP (FAO 2014). Of this, GCMMF, the major player in the Indian dairy
market, contributed 0.20 lakh MT . So, all players across the spectrum from conservative
0.00055
0.00065
0.00075
0.00085
0.00095
0.00105
0.00115
0.00125
0.00135
2006 2007 2008 2009 2010 2011 2012 2013

IIMB-WP N0. 472
22
to aggressive were keen to service the highly volatile but remunerative export market for
SMP rather than the domestic market, which itself was on the rise in terms of demand but not
price. During this period, WPI of powder milk in India had come down marginally from
183.2 in April 2012 to 180.7 in April 2013 but increased to 188.6 by March 2014xxxix.
Figure 10 Quantity and value of SMP exported from India
Imports of SMP are still canalised through a few designated national-level agencies including
NDDB. Any quantity imported over and above the Tariff Rate Quota agreed upon by the
Government of India entails 60% customs duty (Mani and Intodia 2014). This is essential to
protect the domestic sector from cheap imports.
We have so far examined how the nominal price of milk in the domestic and international
markets has moved, while briefly assessing the reasons that can be attributed to them. We
now analyse how the real price of milk in the domestic market in terms of key inputs has
changed over time. For this, we deflate the milk price with cost of inputs such as labour,
cattle feed and food-grain.
4
27 40
26 32
24 12 11
0
70
124
-10
10
30
50
70
90
110
130
0.0
500.0
1000.0
1500.0
2000.0
2500.0
3000.0
2003-04 2004-05 2005-06 2006-07 2007-08 2008-09 2009-10 2010-11 2011-12 2012-13 2013-14
Crore Rs. ('000MT)
IIMB-WP N0. 472
23
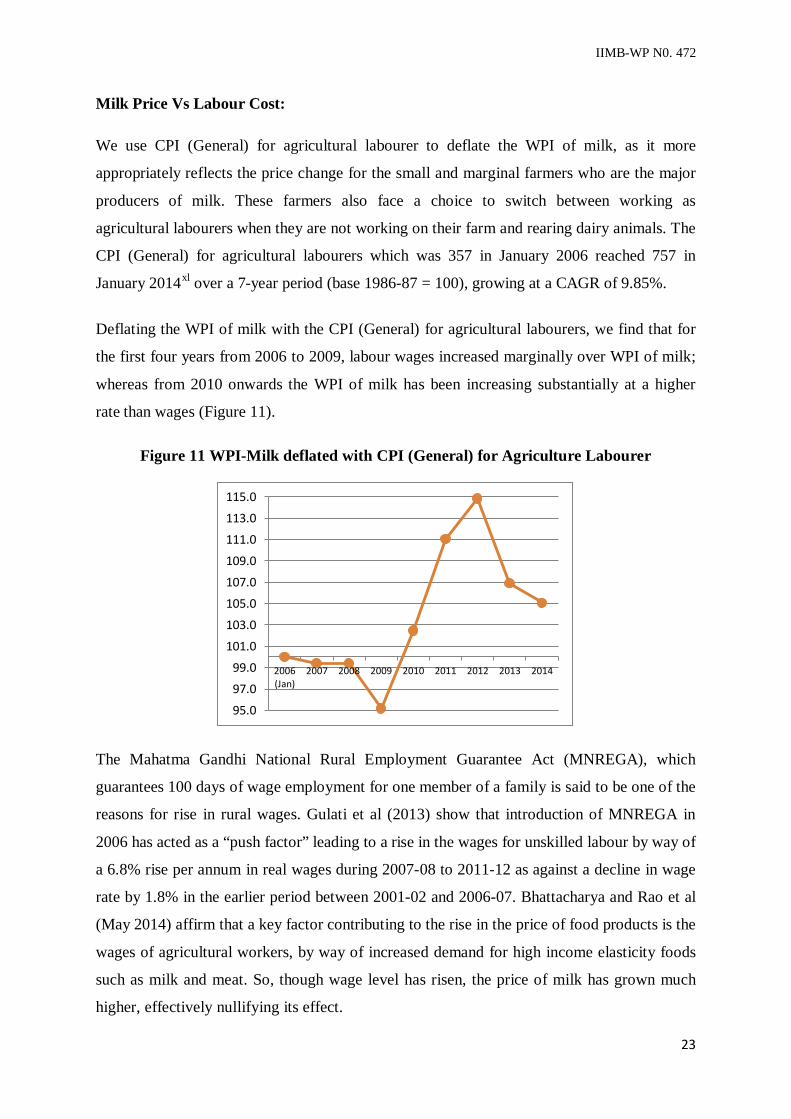
Milk Price Vs Labour Cost: We use CPI (General) for agricultural labourer to deflate the WPI of milk, as it more
appropriately reflects the price change for the small and marginal farmers who are the major
producers of milk. These farmers also face a choice to switch between working as
agricultural labourers when they are not working on their farm and rearing dairy animals. The
CPI (General) for agricultural labourers which was 357 in January 2006 reached 757 in
January 2014xl over a 7-year period (base 1986-87 = 100), growing at a CAGR of 9.85%.
Deflating the WPI of milk with the CPI (General) for agricultural labourers, we find that for
the first four years from 2006 to 2009, labour wages increased marginally over WPI of milk;
whereas from 2010 onwards the WPI of milk has been increasing substantially at a higher
rate than wages (Figure 11).
Figure 11 WPI-Milk deflated with CPI (General) for Agriculture Labourer
The Mahatma Gandhi National Rural Employment Guarantee Act (MNREGA), which
guarantees 100 days of wage employment for one member of a family is said to be one of the
reasons for rise in rural wages. Gulati et al (2013) show that introduction of MNREGA in
2006 has acted as a “push factor” leading to a rise in the wages for unskilled labour by way of
a 6.8% rise per annum in real wages during 2007-08 to 2011-12 as against a decline in wage
rate by 1.8% in the earlier period between 2001-02 and 2006-07. Bhattacharya and Rao et al
(May 2014) affirm that a key factor contributing to the rise in the price of food products is the
wages of agricultural workers, by way of increased demand for high income elasticity foods
such as milk and meat. So, though wage level has risen, the price of milk has grown much
higher, effectively nullifying its effect.
95.0
97.0
99.0
101.0
103.0
105.0
107.0
109.0
111.0
113.0
115.0
2006(Jan)
2007 2008 2009 2010 2011 2012 2013 2014

IIMB-WP N0. 472
24
Milk price vs Cattle feed price: WPI of milk has risen 124 basis points over eight years, from 101.3 (January 2006) to 225.4
(December 2013). Deflating it with WPI of cattle feed (with base January 2006 = 100) or a
simple ratio analysis of WPI of milk with WPI of cattle feed for this period shows that the
rise in the WPI of cattle feed has generally kept pace with the rise in the WPI of milk,
effectively nullifying the rise in milk price. Further, during the 3 years from 2007 to 2009 and
in 2013, the cost of feed rose higher than milk price (Figure 12).
Figure 12 WPI of Milk deflated with WPI (Cattle Feed)
Feeding cattle is the major recurring expense in dairy animal rearing and cattle feed forms a
significant portion of feeding cost. Cereals, oil cakes and molasses form important
constituents of cattle feed, quantity and cost-wise. All the three raw materials have demand
not just from the cattle feed market but also from other markets leading to a demand shock
for them and hence a rise in their prices.
About 36% of world consumption of cereals goes into cattle feed, bulk of it in the form of
coarse grains (Alexandratos and Jelle 2012). So, their diversion to bio-fuel production would
increase cost of cattle feed production. Kumar and Kumar et al (2011) caution that price
inflation in wheat and rice would increase the demand for coarse cereals for human
consumption with adverse impact on manufacturing of cattle feed and thus influence rearing
of livestock negatively.
Price of oil seed cakes is high, due to high demand in the international market. India exported
54.8 lakh MT of oil seed cake in 2011-12, worth Rs.8300 crorexli. Further, oil seeds being an
agricultural produce, their derivative product oilseed cakes are produced only during certain
80
100
120
140
160
180
200
220
Year2006 2007 2008 2009 2010 2011 2012 2013
WPI-Milk
Deflated WPI-Milk with WPI Cattle Feed Base Jan 2006

IIMB-WP N0. 472
25
season of the year, while consumption is spread across the year. This results in a temporal
difference between production and consumption leading to storage cost. There is also a
spatial difference between source of production and place of consumption, adding to its cost
of transport, processing, storage, handling and wastage. Similarly, molasses also has
alternative ready markets for the manufacture of bio-fuels and alcohol and therefore
commands high price.
Further, a higher level of working capital is needed to buy the same quantity of cattle feed.
This is important, for the small and marginal farmers as credit is difficult to be obtained,
particularly for working capital.
This is one of the reasons dairy cooperatives across India provide cattle feed and other input
services on credit to their member farmers. Farmers who are not supplying milk to the dairy
cooperative do not have this credit facility. This accentuates the general problem of dairy
farmers providing little or no cattle feed to animals that do not yield milk, as it leads to a
negative cash flow not just to their business of dairy animal rearing but also at the household
level. Experimental trial provides support to the hypothesis that cows fed with diet rich in
protein in the last month of pregnancy yield higher and better quality of milk subsequent to
calving (Park, Shirley et al. 2002). Therefore, by underfeeding dairy animals in their last
stage of pregnancy, farmers lose out on the incremental quantity of milk.
Thus, a rise in the price of cattle feed adversely affects the growth in milk production.
Milk Price Vs Food grain price: As milk forms part of the overall food basket, it is pertinent to analyse how milk price has
moved against the cost of food grains (cereals + pulses).
Deflating the WPI of milk with the WPI of food grains (Figure 13), we find that from 2006 to
2010, milk price lagged behind the rise in price of food grains. However, from 2010, WPI of
milk has risen in terms of real price vis-à-vis WPI of food grains (Figure 13). This may be
explained by Bennett’s Law which states that with an increase in income of consumers in
developing countries, there will be a movement away from starchy cereals to other foods
such as animal proteins, fruits and vegetables.

IIMB-WP N0. 472
26
Figure 13 WPI Milk deflated with WPI-Food grain (cereals+pulses)
Supply constraints: Energy Cost: In the organised milk trade, high proportion of consumer rupee is spent on energy towards its
movement from farm to consumer, temporally and spatially and for cooling, wherein non-
renewable energy resources play an important role. The cost involves not just the energy
resource as a consumable raw material but the entire infrastructure that needs to be
maintained and manned on a 24 × 7 basis since milk is a perishable commodity. As per the
experience of the author, this cost can be up to 10–15% of the margin between the farm gate
and retail prices. Bhattacharya and Rao et. al (May 2014) have also highlighted the role of
fuel in widening the gap between farm gate and retail food prices. The rise in petroleum
prices and the consequent demand for bio-fuel production from cereals through increase in
cost of energy has been considered as an important factor for the rise in food prices (Becker
and Posner 2008) (Evans 2008). The price of petroleum influences food prices through many
channels (Bhattacharya, Rao et al. 2014). India being a large oil-import-dependent country,
rise in oil price results in increased fertiliser price and transport cost, directly affecting the
cost of food production (Gokarn 2010, Bandara 2013). In fact, increase in fuel price is one of
the factors often ascribed by milk marketers to increase the consumer pricexlii.
We finally examine the key supply side constraint which is the growth in production capacity
that may be causing the milk supply to be sticky.
Milk Production Capacity Constraint:
90
110
130
150
170
190
210
230
Year2006 2007 2008 2009 2010 2011 2012 2013
WPI-Milk
Deflated WPI-Milk with WPI Food grain (Base Year 2006)

IIMB-WP N0. 472
27
The shortfall in growth of milk production can result either from a low increase in the net
number of adult female animals or insufficient enhancement in the productivity of existing
adult milk producing animals. We had earlier observed that there is reduction in growth of
adult females of all types with the annual growth coming down from a CAGR of 2.17% to
0.94%, whereas there was no drop in the overall growth of young dairy animals. So, reduced
growth rate of the adult productive population may be one of the important factors for
constrained growth in milk production. This could be due to high cost or non-availability of
credit and risk-cover mechanisms.
Unlike developed nations, India does not have a separate beefxliii industry, i.e., rearing
specific breeds of cows or buffaloes for beef. The supply comes from the bullocks of
indigenous and crossbred cattle, male buffaloes and non-milk or low milk producing females.
Most of the adult unproductive male and female buffaloes are sold and end in slaughter
houses for beef production, legally. As, there is ban on cow slaughter across the country
except in Kerala and West Bengal, old and uneconomic animals are transhipped to these
states and slaughtered.
Sale of livestock is frequently used as a consumption smoothing mechanism, especially
among small and marginal farmers (Rosenzweig and Wolpin 1993). So, cash in lump sum
often has higher priority over future probable stream of small incomes from milk, particularly
for poor people. This gets accentuated when there is a drop in the farm gate price of milkxliv
or difficulty in obtaining free green grass due to insufficient rains. Thereby, some of the
female adult animals and young calves that still have the capacity to breed and produce milk,
along with the male animals, may end up in slaughter houses.
India exported a record quantity of buffalo meat worth Rs.22,627 crore in 2013-14. This was
58.6% more in value and 36.9% more in quantity, over the previous year, becoming the 2nd
largest exporter of beef in the international market with 20% market sharexlv. It is significant
to note here that the value of buffalo meat exports was 8.7 times the value of export of dairy
products, in the same yearxlvi. Even in the triennium ending 1988, 70.5% of the foreign
exchange earnings from the livestock sector was derived from the sale of bovine meat
(Kumar 2009).

IIMB-WP N0. 472
28
An equal quantity of bovine meat is said to be consumed in the domestic market. Between
April 2005 and March 2014, the domestic price of beef and buffalo meat grew at a CAGR of
9.2%, indicated by the increase in its WPI from 100.9 to 222.8.
In addition, the author’s study of sheep and goat rearing in Andhra Pradesh reveals demand
for “pseudo-mutton”xlvii, meat from young calves of buffaloes and cattle. From the farmer’s
perspective, sale of young calves gives immediate capital returns and removes all uncertainty
of future cash-flows. The pseudo-mutton is bought mainly by bulk consumers such as
roadside hotels and restaurants with attached bars. If this situation is generally prevalent
across the country, then it is another reason for the reducing growth rate of milk producing
population and therefore constrained growth in milk production.
Our argument on growth in total demand for beef, export and domestic consumption put
together is substantiated by the 19th Livestock Census 2012, which shows a reduction of
180.9 lakh in male bovine animals from 2007 to 2012, in rural areas. Males of buffaloes and
indigenous and crossbred cattle have reduced by 17.37%, 18.81% and 11.48%, respectively
(Table 4). This is of course, in addition to the lower growth rate of female animals, though
their actual numbers have increased.
Table 5 Growth in male bovine population in rural region
Type of Male
Livestock Census No. (Year)
17th (2003)
18th (2007)
19th (2012)
Exotic/Crossbred cow 44.4 62.9 55.7 Indigenous cow 749.0 749.9 608.8
Buffalo 169.9 187.8 155.1 Source: DoAHDF, GoI, 17th to 19th Livestock Census
The reduction in male buffaloes is a cause for immediate concern since 53% of the total milk
production in the country was derived from buffaloes in 2012-13xlviii and farmers today prefer
rearing of female buffalo calves rather than calves of indigenous or crossbred cows. Even
today, natural service by local bulls is the default choice by majority of buffalo owning
farmers to conceive their buffaloes. It is also well-documented that the presence of adult bulls
in a village through pheromone effect ensures that female population of buffalo and cattle
attain maturity earlier and conceive faster. Age at first calving and inter-calving period are
IIMB-WP N0. 472
29
two key economic traits directly affecting life-time milk yield and profitability of rearing a
dairy animal.
The importance of presence of male buffaloes is evident in Kutch district of Gujarat where
the bulls of Banni buffaloes are kept with the female throughout their lifetime, day and night.
As a result, the female Banni buffaloes display the lowest age at first calving (36–42 months)
and shortest inter-calving period (12–14 months) amongst all buffalo breeds of Indiaxlix.
Therefore, reduction in uncastrated male animals in villages leads to longer age at first
calving and higher inter-calving period; and adversely affects the life-time milk yield and
profitability.
Capital Asset Growth: In 2011-12, capital asset formation in agriculture and allied sectors as a percentage of
agricultural GDP was 19.8%, which is less than half of overall capital formation in the Indian
economy of 40%, indicating lack of the much needed fresh investments required for growth
of the sector. Of this, 85% was derived from private sourcesl. On the formal credit side,
reducing investments in dairy sector is indicated by the reducing proportion of total refinance
by NABARD for dairy development, coming down from 5.77% in 2011-12 to 4.34% in
2013-14. Hence, credit is one of the reasons for reduced growth rate of adult female animals,
either by not being available or available only at high cost. Further, the cost of credit for
livestock purchase is high because all formal credit institutions compel farmers to avail
insurance for the animal against death at the time of purchase basically to protect themselves
from default of loan. Hence, majority of dairy animal purchases are made by only those who
have 100% of the required capital in liquid form. Lack or high cost of credit results in
growing inequality and poverty (Aghion and Bolton 1997).
The positive effects of livestock credit have been well-established. Credit for livestock
purchase increases the rural poor income enabling them to come out of poverty (Abedullah,
Mahmood et al. 2009). Credit increases production efficiency indicated by a positive
correlation of yield and income with credit (Iqbal, Munir et al. 2003) (Sandika 2011).
As of 2010-11, only about 6% of the total adult bovine population was covered by insurance
against death. This is despite the government actively supporting insurance of productive
cows and buffaloes with 50% subsidy on the premium amount for two animals yielding
above 1500 litres per lactation, per family, for a period of 3 years.
IIMB-WP N0. 472
30
With insurance and credit being fully linked to each other, it can be deduced that credit from
formal financial institutions is also limited to around 6% of the total adult animal population.
Such low penetration of credit shows that credit is a key supply constraint to enhance milk
production. One cannot look at insurance in isolation as a value proposition but in
conjunction with credit, farm inputs and services, as a means to enhance productivity and
reduce risk (Dick and Wang 2010).
Discussions with credit and insurance agencies reveal that they are averse to increasing their
exposure to livestock sector due to moral hazard and adverse selection problems arising from
information symmetry. This is due to lack of proper identification of dairy animals. Further,
technical and economic details about an individual animal are simply absent or selectively
available, but not shared. On account of information asymmetry, institutions providing
breeding and health services are also able to offer only below par services.
With information asymmetry, fraudulent representation of animal quality is rewarded with
average price, instead of being penalised (Koontz and Purcel 1997). Information asymmetry
by way of adverse selection has a role in price and turnover of the Indian cow market
(Anagol 2009). So, there is little or no price incentive by way of animal sale or value for the
farmer. Therefore, information asymmetry is also an important constraining factor to growth
in milk production.
Investments towards reducing information asymmetry in dairy animal market are highly
beneficial but by way of externalities. Therefore, need arises for the state to intervene in
creating essential institutions that support rural financial intermediation – institutions that
exist to disseminate information regarding market fundamentals and credit rating bureaus
(Conning and Udry 2007).
Conclusion: The reasons for the persistent rise in the price of milk in India were analysed by
understanding the causal factors that contribute to its demand and supply.
Between 2006 and 2013, the international price was fully transmitted to the domestic price,
resulting in a near similar percentage rise. While this increase came with a high level of price
volatility in the international market, the rise in the domestic price was steady and
continuous. Since 2006, global price is seen to be transmitted to the domestic price due to a
IIMB-WP N0. 472
31
probable reduction in the level of domestic buffer stock on account of free export of SMP. It
was this domestic buffer stock of SMP that had moderated the milk price rise, in previous
years. The ban on export was lifted not due to glut in domestic stock of SMP but to enable the
SMP manufacturers benefit from the then prevailing high international price.
After 2006, growth in demand for milk in India is rising at twice the growth rate of milk
production; 6% to 8% vs 3% to 4%, making that year a turning point for the Indian dairy
sector. This is confirmed by the growth in per capita milk consumption, post-2006. The
growth in milk consumption in developing countries is expected to continue, offering
livelihood opportunity for milk producers in India, especially the small and marginal farmers
who own 71% of the productive adult populationli (Delgado 2003).
With increased demand for milk and the supply not responding to it, there is a continuous and
increasing mismatch between the two, leading to persistence in milk price inflation. The
alternative to domestic production is importing of SMP. However, this is not a viable
alternative for milk due to its high and perpetual requirement, limited availability and high
price volatility in the international market and high current account deficit (Kolhar 2013).
Further, demand for milk in many Asian countries which are net-importers of milk such as
China has also picked up. With few exporting countries and limited quantity available for
international trade, a small increase in the domestic demand could affect the international
price disproportionately.
In addition to this demand shock and institutional failure, supply side constraints also act as
dampener to the growth in domestic milk production. While these supply constraints are not
new, their effect has been magnified due to the increased demand for milk. The full
production potential of dairy animals in India is not being realised due to constraints in
feeding, breeding, health and managementlii. With increase in cost of inputs, the sector seems
to have moved into high-cost industry status, undermining profitability and hence
experiencing stickiness in supply. The constraints in the supply side in terms of milk
production faced by small and landless farmers apart from high cost of feed are lack of credit
and risk-cover, availability of health and breeding services and information asymmetry in the
market.
In fact, the supply side constraints seem to far outweigh the advantage of a persistent rise in
milk price such that farmers have started to withdraw from dairy animal rearing. This is
revealed by the reduction in growth of number of adult female stock whose growth rate has

IIMB-WP N0. 472
32
come down from 2.17% per annum between 2003 and 2007 to 0.94% per annum between
2007 and 2012. In the same period, there has also been a drastic fall in total number of male
animals by 181 lakh (18%). Such sudden large-scale reduction in population is due to
increasing market demand for beef. Apart from increased domestic consumption, India has
become world’s 2nd largest exporter of beef, that too without breeding of animals exclusively
for beef.
This is a serious concern since incremental growth in milk production can come only from an
increase in the number of productive population and improvement in productive efficiency of
existing dairy animals (Dhas 2010). This reduction in population of males and slowing of
growth of females indicate that various interventions made by all parties concerned have not
borne fruit especially after 2006. Further, they seem to have targeted only total milk
production by way of production per animal and less on increasing productive number of
female animals. This is reiterated by the fact that insurance and credit for animal purchase
can be accessed by less than 6% of the total population. Thereby, capital asset growth is
seriously undermined. All these have cumulatively constrained the growth rate in milk
production to around 3% to 4%.
Even the growth rate of total young female stock of dairy animals is also marginally
declining except for buffalo calves. In other words, farmers rearing cows and buffaloes
within the existing production eco-system are not reciprocating adequately to the milk price
which grew at a CAGR of 10.25% but responding more to beef price which grew at a CAGR
of 8.8%, on nominal terms, during April 2006 to March 2014. So this reduction in total
population indicates that economically weak farmers may be moving out of dairy animal
rearing, per se.
The productivity per animal may also be adversely affected by the reduction in male
population, especially buffaloes. Serious concerns are being expressed as to whether the
present level and scope of interventions concentrating on the organised milk sector which
represents only 30% of total milk production would be able to cater to the growing domestic
demandliii. This means that given the existing production, eco-system milk production level is
on the production frontier and the only way to higher growth is from a change in the factors
of the production eco-system itself.
Therefore, without the supply responding more vigorously, milk price is bound to remain in
the uptrend causing further strain on food inflation. So, the challenge India is facing today is

IIMB-WP N0. 472
33
in enhancing domestic production (Bandara 2013) by increasing productivity (Gokarn 2011)
and ensuring capital asset growth in female animal population.
To make the milk supply system respond better, economic and social incentives could come
outside the milk system, which is the animal itself. To achieve growth in numbers especially
those with above average quantity of milk yield, unique identification, maintenance of live
database of each animal is required. Further it is to be made available for sharing it on a
dynamic basis 24 × 7 in an easily retrievable and readable format to all stake-holders,
beginning with the farmer. This would not only enable farmers to reduce their cost of
production but also reduce the ill effects of adverse selection and moral hazard of information
asymmetry paving way for higher penetration of credit and insurance and enable the
development of a vibrant dairy animal market. This is possible only through proactive
intervention of the government both at the central and state levels.
Finally, though we have discussed the issue at the national level, there is huge disparity in
terms of consumption and production at intra-state and inter-state levels, making it extremely
difficult to compare one with another. Hence, there is dire need to perform state and region-
wise analysis of the problem of insufficient milk supply response from the perspective of
capital, debt, technology, information, input, risk-cover mechanism, institutions as well as
outputs. This would enable well-informed choices suited to local conditions from policy
makers, for nurturing conditions that would encourage dairy farmers to not only increase
productivity but also increase the number of female animals.
Figures
Figure 1 Conceptual diagram on factors of Milk Price in India ........................................................... 4 Figure 2 Growth of WPI-Milk over two periods ................................................................................. 5 Figure 3 Average milk procurement price (Rs./Kg butter fat) ............................................................. 6 Figure 4 Monthly per capita consumer expenditire on Milk (MMRP) over fractile class of MPCE (All India) in 2011-12 ............................................................................................................................. 10 Figure 5 Decennial growth in milk production in India (%) .............................................................. 12 Figure 6 Annual growth rate in milk production in India .................................................................. 13 Figure 7 Growth in per capita availability of milk (Gm/day) ............................................................ 14 Figure 8 Comparison of domestic and international milk prices ....................................................... 19 Figure 9 WPI of SMP deflated with international price of 1.5% butter fat (Rs./MT) ......................... 21 Figure 10 Quantity and value of SMP exported from India............................................................... 22 Figure 11 WPI-Milk deflated with CPI (General) for Agriculture Labourer ...................................... 23 Figure 12 WPI of Milk deflated with WPI (Cattle Feed) .................................................................. 24 Figure 13 WPI Milk deflated with WPI-Food grain (cereals+pulses) ................................................ 26
IIMB-WP N0. 472
34
Tables
Table 1 Monthly per capita expenditure in 2011-12 ........................................................................... 9 Table 2 Growth rate in female bovine population over three censuses .............................................. 16 Table 3 Estimates of milch animals and milk yield and milk yield rates in 2012-13 .......................... 17 Table 4 FAO Dairy Price Index ....................................................................................................... 19 Table 5 Growth in male bovine population in rural region ................................................................ 28
References
Abedullah, N. Mahmood, M. Khalid and S. Kouser (2009). "THE ROLE OF AGRICULTURAL CREDIT IN THE GROWTH OF LIVESTOCK SECTOR: A CASE STUDY OF FAISALABAD." Pakistan Veterinary Journal 29(2): 81-84. Aghion, P. and P. Bolton (1997). "A Theory of Trickle-down growth and development." Review of Economic Studies. Alexandratos, N. (2008). "Food Price Surges: Possible Causes, Past Experience and Longer Term Relevance." Population and Development Review 34(4): 663-697. Alexandratos, N. and B. Jelle (2012). World Agriculture Towards 2030/2050 The 2012 Revision. ESA Working Paper. Rome, FAO. 12: 147. Anagol, S. (2009). Adverse Selection in Asset Markets: Theory and Evidence from the Indian Market for Cows. Ph.D, Yale University. Andreyava, T., W. M. Long and D. K. Brownell (2010). "The impact of food prices on consumption: A systematic review of research on the price elasticity of demand for food." American Journal of Public Health 100(2): 216-222. Bandara, J. S. (2013). "What is driving India's Food Inflation? A survey of recent evidence." South Asia Economic Journal 14(1): 127-156. Becker, G. and R. Posner (2008). "Rising Food Prices and Public Policy - Becker." www.becker-posner-blog.com 2014. Bhattacharya, R., N. Rao and A. S. Gupta (2014). Understanding Food Inflation in India. ADB South Asia Working Paper Series. Manila, Asian Development Bank. Bhattacharya, R., N. Rao and A. S. Gupta (May 2014). Understanding Food Inflation in India. ADB South Asia Working Paper Series. Manila, Asian Development Bank. Butler, W. R. and R. D. Smith (1989). "Interrelationships between Energy Balance and Post-Partum Reproductive Function in Dairy Cattle." Journal of Dairy Science 72: 767-783. Conning, J. and C. Udry (2007). Rural Financial Markets in Developing Countries. New Haven, Economic Growth Centre, Yale University. Dastagiri, M. B. (2004). Demand and Supply Projections for Livestock Products in India. Policy Paper 21. New Delhi, ICAR (NCAP). Deaton, A. and J. Dreze (2009). "Food and Nutrition in India: Facts and Interpretations." Economic and Political Weekly 44(7): 42-64. Delgado, L. C. (2003). "Rising consumption of meat and milk in developing countries has created a new food revolution." Journal of Nutrition 133(11): 3907-3910. Dhas, A. C. (2010). Bovine Economy of India - Conceptual Analysis and Empirical Evidence. New Delhi, Serials Publications.

IIMB-WP N0. 472
35
Dick, J. A. W. and W. Wang (2010). "Government Interventions in Agricultural Interventions." Agriculture and Agricultural Science Procedia 1: 4-12. Eapen, L. M. and S. R. Nair (2012). "Food Price Inflation in India (2008 to 2010)." Economic & Political Weekly XLVll(20). Evans, A. (2008). Rising Food Prices: Drivers and implications for development. Chatham House Briefing Paper. London, Chatham House. FAO (2010). Status and Prospects for small holder milk production A Global perspective. Pro-poor Livestock Policy Initiative. T. Hemme and J. Otte. Rome, FAO. FAO (2014). Milk and milk products: Price and trade Update April 2014. Milk and milk products: Price and trade Update. Rome, FAO. May 2014. Fuller, F., J. Huang, H. Ma and S. Rozelle (2006). "Got Milk? The rapid rise of China's dairy sector and its future prospects." Food Policy 31(3): 201-215. Gerosa, S. and J. Skoet (2012). Milk Availability - Trends in production and demand and medium term outlook. ESA Working Paper No 12-01. A. D. E. Division. Rome, FAO. Gokarn, S. (2010). "Managing Inflation in the post-crisis environment." Yojana 54(Special Issue, August): 5-9. Gokarn, S. (2010a). The Price of Protein. Monthly Bulletin November 2010, RBI. Gokarn, S. (2011). Food Inflation: This time it's different. Kale Memorial Lecture. Pune, Gokhale Institute of Politics and Economics. Gulati, A., S. Jain and N. Satija (2013). Rising Farm Wages in India: The push and pull factors. Discussion Paper. New Delhi, Ministry of Agriculture (CACP). 5. Gulati, A. and S. Saini (2013). Taming Food Inflation in India. New Delhi, Commission for Agricultural Costs and Prices, Min. of Agri, GoI. Iqbal, M., A. Munir and K. Abbas (2003). "The impact of institutional credit on agricultural production in Pakistan." The Pakistan Development Review 42(4): 469-485. Jain, R. K., C. M. Saksule, D. R. K and V. Mudgal (2012). "Nutritional status of cows and buffaloes during advanced pregnancy in Indore district of Madhya Pradesh." Indian Journal of Animal Nutrition 29(3): 246-250. Kannan, A., M. R. Garg and M. K. B. V (2011). "Effect of ration balancing on milk production, microbial protein synthesis and methane emission in crossbred cows under field conditions in Chittoor district of Andhra Pradesh." Indian Journal of Animal Nutrition 28(2): 117-123. Kolhar, S. (2013). Inflation measurement for policy analytical issues and application to India. Fellow Programme in Managment, Indian Institute of Management. Koontz, S. R. and W. D. Purcel (1997). Price Discovery and the Future of the Livestock Sector. Price Discovery in Concentrated Livestock Markets: Issues, Answers, Future Directions. W. D. Purcel. Blacksburg, VA, Research Institute on Livestock pricing, Department of Agricultural and Applied Economics, Virginia Tech: 6-17. Kumar, A. (2009). India's Livestock Sector Trade: Opportunities and Challenges under WTO Regime. Policy Paper. New Delhi, National Centre for Agricultural Economics and Policy Research, Indian Council for Agricultural Research. Kumar, P., A. Kumar, S. Parappurathu and S. S. Raju (2011). "Estimation of Demand Elasticity for Food Commodities in India." Agricultural Economics Research Review 24(Jan-Jun 2011): 1-14. Landes, M. (2007). Indian agriculture and policy in transition. USDA Economic Research Service, USDA. Mani, R. (2013). India Dairy Products Annual 2013. Global Agricultural Information Network Report. Washington DC, United States Department of Agriculture (USDA). IN. Mani, R. and V. Intodia (2014). India Dairy and Products Annual 2014. Global Agricultural Information Network (GAIN). Washington, D C, United States Department of Agriculture (USDA). Park, A. F., J. E. Shirley, T. C. Titgemeyer, M. M. J, V. M. J and V. M. J (2002). "Effect of protein level in prepartum diets on metabolism and production of dairy cows." Journal of Dairy Science 85: 1815-1528.

IIMB-WP N0. 472
36
Punjabi, M. (2009). India: Increasing Demand Challenges the Dairy Sector. Smallholder dairy development - Lessons learned in Asia.. N. Morgan. Bangkok, FAO, ANIMAL PRODUCTION AND HEALTH COMMISSION FOR ASIA AND THE PACIFIC. Rosenzweig, M. R. and K. I. Wolpin (1993). "Credit Market Constraints, Consumption Smoothing, and the Accumulation of Durable Production Assets in Low-Income Countries: Investments in Bullocks in India." Journal of Political Economy 101(2): 223-244. Sandika, A. (2011). "Factors affecting marketable surplus and income of dairy farmers in Sri Lanka." Veterinary Research 4(4): 104-108. Shreedhar, G., N. Gupta, H. Pullabhotla, A. Ganesh-Kumar and A. Gulati (2012). A review of input and output policies for cereals production in India. IFPRI Discussion Paper 01159. New Delhi, International Food Policy Research Institute. Thompson, R. L. (1988). US Macro-economic policy and Agriculture. Macro economics, Agriculture and Exchange Rates. P. L. Paalberg and R. G. Chambers, Westview Press. Wathes, D. C., M. Fenwick, Z. Cheng, N. Bourne, S. Llewellyn, D. G. Morris, D. Kenny, J. Murphy and R. Fitzpatrick (2007). "Influence of negative energy balance on cyclicity and fertility in the high producing dairy cow." Theriogenology 68S: 232-241. Yaron, L. (2014). Milk ;Quality in India. 53rd National Mastitis Countil (NMC) Annual Meeting, Fortworth, TX, National Mastitis Council.
i Taming Food Inflation in India, Ashok Gulati & Shweta Saini, Commission for Agricultural Costs and Prices (Apr 2013) viewed on Jul 26, 2014 (http://cacp.dacnet.nic.in/ViewQuestionare.aspx?Input=2&DocId=1&PageId=42&KeyId=473) ii News in Economic Times on 5 Aug 2014 of announcement by the Agriculture Minister, Govt. of India in the Lok Sabha viewed on 24 Sep 2014 (http://economictimes.indiatimes.com/industry/cons-products/food/milk-price-up-by-14-50-per-cent-in-last-one-year/articleshow/39683978.cms) iii USDA GAIN Report IN2132 dt. 15 Oct 2012 viewed on 15 Oct 2014 (http://gain.fas.usda.gov/Recent%20GAIN%20Publications/Dairy%20and%20Products%20Annual_New%20Delhi_India_10-15-2012.pdf) iv Min. of Commerce, GoI viewed on 24 Jul 2014 (http://www.indiastat.com/table/economy/8/foodarticles/15930/15278/data.aspx) v Chairman, GCMMF speech at its 40th Annual General Body Meeting viewed on 20 Sep 2014 (http://amul.com/m/exports) vi News Report in The Hindu Business Line dated Sept 24, 2014 viewed on Sept 25, 2014 (http://www.thehindubusinessline.com/industry-and-economy/agri-biz/amul-jumps-to-rank-15thin-ifcn-listing/article6442422.ece) vii GCMMF website viewed on 20 Sep 2014 (http://amul.com/m/exports) viii GCMMF-Gujarat Agri Convention 2012 Viewed on 3 Sep 2013 (http://www.ficcifood360.in/2edition/pdfs/day2-2012/dairy/Pre-lunch/2.Mr.Sunjay,PWC.pdf) ix Exercept from speech “Perspectives on “US Food Aid – 50 years of food for peace” by Ambassador Himachal SOm, Permanent Representative of India to UN Agencies in Rome on 26th May 2004. Viewed on May 28, 2014 (http://foodaid.org/resources/what-people-are-saying/). x Source: USDA Global Agriculture Information Network Reports from 2003 to 2013 viewed on 08 Oct 2013 (http://apps.fas.usda.gov/scriptsw/attacherep/legacy.asp) and (http://gain.fas.usda.gov/Lists/Advanced%20Search/AllItems.aspx) xi News article titled, “Milk powder ban pits cooperatives against corporates” in Economic Times dated Sept 5, 2007 viewed on (http://articles.economictimes.indiatimes.com/2007-09-05/news/28447676_1_milk-powder-dairy-majors-export-ban) xii as per Average Modified Mixed Reference Period Monthly Per Capita Consumer Expenditure (MPCEMMRP) of the 68th Round (2011-12) Household expenditure survey of NSSO xiii NSS 68th Round Survey Household consumer expenditure in India Table 3.2-R and 3.2-U Pages A-43 to A 66 xiv NSS 68th Round Survey Household consumer expenditure in India Table T9 Page 20 xv NSS 68th Round Survey Household consumer expenditure in India Table 4.2-R Page A-64 xvi xvi Shalini Gupta, Food Expenditure and Intake in the NSS 66th Round, EPW Vol XLVII (2) Jan 2012

IIMB-WP N0. 472
37
xvii Source: USDA Global Agriculture Information Network Reports from 2003 to 2013 viewed on 08 Oct 2013 (http://apps.fas.usda.gov/scriptsw/attacherep/legacy.asp) and (http://gain.fas.usda.gov/Lists/Advanced%20Search/AllItems.aspx) xviii USDA GAIN Report No.IN3119 India Dairy and Products Annual 2013 xix GoI, MoA xx Food Outlook, Oct 2013, FAO Page 56 xxi Press Report of Ministry of Agriculture, Government of India, viewed on 30 Sept 2014 (http://pib.nic.in/newsite/PrintRelease.aspx?relid=101864) xxii Minutes of Meeting of Technical Committee for improvement Animal Husbandry Statistics held during 4th & 5th July 2013, Page 11 Viewed on May 28,2014 (http://dahd.nic.in/dahd/WriteReadData/TCD%202013%20Minutes.pdf) xxiii MoA, GoI viewed on Jun 3, 2014 (http://www.nddb.org/English/Statistics/Pages/Milk-Production-States-Capital.aspx ) xxiv Delgado’s calculation was based on July 2002 version of International Food Policy Research Institute’s (IFPRI’s) International Model for Policy Analysis of Agricultural commodities and Trade (IMPACT), a global food model first suggested by Rosegrant et.al. in 2001 in their paper, “Global Food Projections to 2020: Emerging Trends and alternative futures” xxv Source: Dept. of AH, D & F, GoI viewed on 21 Oct 2014 (http://dahd.nic.in/dahd/WriteReadData/TCD%202013%20Minutes.pdf) xxvi Source: Dept. of AH, F & D, GoI viewed on 22 Oct 2014 (http://dahd.nic.in/dahd/WriteReadData/TCD%202013%20Minutes.pdf) xxvii Source: Dept of AH, D & F, GoI viewed on 21 Oct 2014 (http://www.nddb.org/English/Statistics/Pages/Performed-States.aspx) xxviii News Report in Economic Times dt. 23 Jul 2011 viewed on 08 Oct 2014 (http://articles.economictimes.indiatimes.com/2011-07-23/news/29806559_1_cattle-breeds-white-revolution-artificial-insemination) xxix USDA GAIN Report No. IN4089 dt. 15 Oct 2014 viewed on 22 Oct 2014 (http://gain.fas.usda.gov/Recent%20GAIN%20Publications/Dairy%20and%20Products%20Annual_New%20Delhi_India_10-15-2014.pdf) xxx Source: IFCN website viewed on 06 Oct 2014 (http://www.ifcndairy.org/en/output/prices/milk_indicator2013.php) xxxi FAO Dairy Price Index consists of price quotations of butter, SMP, WMP and cheese, where the average is weighted by the World average export trade shares for 2002-04, deflated using the World Bank Manufactures Unit Value Index rebased from 2005=100 to 2002-04=100, viewed on (http://www.fao.org/worldfoodsituation/foodpricesindex/en/) xxxii USDA GAIN: India Dairy and Products Annual 2013 Viewed on May 28, 2014 (http://www.thedairysite.com/reports/?id=2918) xxxiii Food Outlook, Oct 2013, FAO http://www.fao.org/fileadmin/templates/est/COMM_MARKETS_MONITORING/Dairy/Documents/November_2013.pdf Page 10 xxxiv Understanding Dairy Markets viewed on Aug 25, 2014 (http://future.aae.wisc.edu/data/weekly_values/by_area/1707) xxxv News article in Economic Times dt. Sept 11, 2014 viewed on (http://articles.economictimes.indiatimes.com/2014-09-11/news/53811417_1_milk-powder-flush-season-smp-prices) xxxvi Source: Reserve Bank of India data viewed on Oct 03, 2014 (http://www.tradingeconomics.com/india/current-account) xxxvii DGCIS Annual Report viewed on Jul 25, 2014 (http://agriexchange.apeda.gov.in/product_profile/exp_f_india.aspx?categorycode=0407) xxxviii Source: The Hindu businessline viewed on (20 Oct 2014) http://www.thehindubusinessline.com/companies/milk-powder-to-drive-dairy-exports-to-record-this-fiscal/article5781276.ece xxxix Source: Ministry of Commerce , GoI from Indiastat viewed on 20 Oct 2014 (http://www.indiastat.com/table/economy/8/foodproducts/15936/561612/data.aspx) xl Ministry of Labour and Employment, GoI viewed on 24 Jul 2014 (http://www.indiastat.com/economy/8/agriculturallabourers/14432/consumerpriceindexnumbersfoodindexforagriculturallabourers19572014/449576/stats.aspx) xli Solvent Extractors’ Association of India viewed on Jul 28, 2014 (http://articles.economictimes.indiatimes.com/2012-04-04/news/31287717_1_rapeseed-meal-indian-oilmeal-rice-bran-extraction) xlii GCMMF citing rise in fuel price to increase retail price of milk in Oct 2013, in The Hindu Business Line dated Oct 14, 2013 viewed on 25 Sept 2014 (http://www.thehindubusinessline.com/industry-and-economy/agri-biz/milk-prices-on-the-boil-as-fuel-feed-costs-increase/article5234281.ece) xliii Beef refers here to meat from cattle as well as buffalo meat put together

IIMB-WP N0. 472
38
xliv Editorial on milk price in The Hindu Business Line dated Feb 10, 2014 viewed on Sep 25, 2014 (http://www.thehindubusinessline.com/opinion/editorial/milk-on-the-boil/article5673999.ece) xlv Source: USDA Livestock and Poultry: World Market and Trade April 2014 viewed on 08 Oct 2014 (http://apps.fas.usda.gov/psdonline/circulars/livestock_poultry.pdf) xlvi DGCIS Report viewed on 24 Jul 2014 (http://agriexchange.apeda.gov.in/product_profile/exp_f_india.aspx?categorycode=0407) xlvii Young female and male calves of buffalo and cattle are sold as mutton (meat from sheep) to bulk consumers such as roadside hotels and bar cum restaurants. This is possible due to two reasons. From the consumer side, there is a high price differential between the two, with mutton costing nearly twice as much as beef. WPI of mutton has increased at a CAGR of 10.25% whereas WPI of milk increased at a CAGR of 10.5%, over the eight year period from Apr 06 to March 2014. xlviii Indiastat viewed on 14 Sept 2014 http://www.indiastat.com/table/agriculture/2/milkanddairyproducts/167/788614/data.aspx xlix Paper by Yadav, PV, Bhatti, R and Das, S; A note on traditional breeding practices among Maldharis of Banni region of Kutch district of Gujrat viewed on http://www.sahjeevan.org/research_study/ah/01_A%20paper%20on%20Banni%20Buffalo.pdf l NABARD Annual Report 2013-14 li As per the NSS 59th Round of survey 2002-03 lii Report of the Working Group on Animal Husbandry and Dairying 12th 5-year Plan (2012-17) submitted to the Planning Commission, Government of India liii USDA Global Agricultural Information Network India Dairy and Products Annual Report No. IN4089 dt. 15 Oct 2014 viewed on 22 Oct 2014 (http://gain.fas.usda.gov/Recent%20GAIN%20Publications/Livestock%20and%20Products%20Annual_New%20Delhi_India_9-12-2014.pdf)