Research Trends and Metrics
27
Research trends
-
Upload
taylor-francis-africa -
Category
Education
-
view
95 -
download
1
Transcript of Research Trends and Metrics

Research trends

World research trends
0%
5%
10%
15%
20%
25%
30%
35%
40%1
99
5
19
96
19
97
19
98
19
99
20
00
20
01
20
02
20
03
20
04
20
05
20
06
20
07
20
08
20
09
20
10
20
11
20
12
20
13
20
14
Pe
rce
nta
ge o
f G
lob
al R
ese
arch
Ou
tpu
t
USA
China
UK
Germany
Japan
Africa
Data: Thomson Reuters Web of Science

South African research output
0.0%
0.1%
0.2%
0.3%
0.4%
0.5%
0.6%
0.7%
0.8%
0.9%
Pe
rce
nta
ge o
f W
orl
d R
ese
arch
Data: Thomson Reuters Web of Science
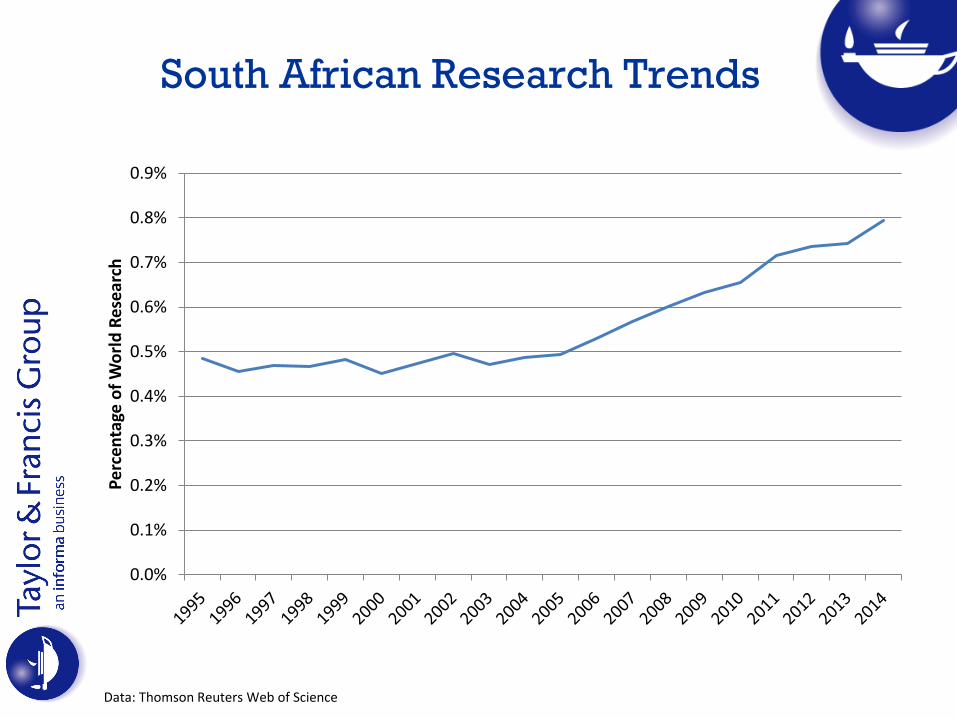
South African Research Trends
0.0%
0.1%
0.2%
0.3%
0.4%
0.5%
0.6%
0.7%
0.8%
0.9%
Pe
rce
nta
ge o
f W
orl
d R
ese
arch
Data: Thomson Reuters Web of Science

South African Open Access
0%
5%
10%
15%
20%
25%
30%
35%
40%
2005 2006 2007 2008 2009 2010 2011 2012 2013 2014
Pe
rce
nta
ge o
f C
on
ten
t P
ub
lish
ed
in F
ull
OA
Jo
urn
al
Brazil
South Africa
China
India
Russia
Data: Thomson Reuters Web of Science

South African highly cited
research
Data: Thomson Reuters Web of Science
0.0%
0.2%
0.4%
0.6%
0.8%
1.0%
1.2%
1.4%
1.6%
1.8%
2005 2006 2007 2008 2009 2010 2011 2012 2013 2014
Pe
rce
rnag
e o
f "H
igh
ly C
ite
d"
Ou
tpu
t
South Africa
China
Russia
India
Brazil

Impact Factors?

“When a measure becomes a target, it ceases to be a good measure.”
-Goodhart’s Law
Image : © Ciara McDonnell CC BY

Publish good papers.

Publish papers in good journals.

Publish as many shorter papers as possible in high
impact factor journals regardless of whether or not it’s
the best venue for the research.

Image : © Thomas Anderson CC-BY
Metrics in the networked age

Image : © NapInterrupted CC-BY

Do we need filters?
-
50,000
100,000
150,000
200,000
250,000
-
200,000
400,000
600,000
800,000
1,000,000
1,200,000
1,400,000
1,600,0001
90
0
19
05
19
10
19
15
19
20
19
25
19
30
19
35
19
40
19
45
19
50
19
55
19
60
19
65
19
70
19
75
19
80
19
85
19
90
19
95
20
00
20
05
20
10
Art
icle
s an
d R
evie
ws
(So
cial
Sci
en
ce)
Art
icle
s an
d R
evie
ws(
Scie
nce
)
Science Citation Index Social Science Citation Index
Data: Thomson Reuters Web of Science

Image : © Jason Howie CC-BY

Image : © Randel Monroe CC-BY-NC

Image : © Julien Haler CC-BY
Image: © Carlos José CC BY
Abuse of metrics
Image: © HeatSync Labs CC BY

• MAP OF SOUTH AFRICA
the South African context
South African Journals
• Ulrich’s lists 214 journals published from South Africa
• DHET lists 273 accredited journals for 2015.

South African Journals
Based on Ulrich’s data
• 115 are tracked in altmetric.com
• 105 index in Scopus
• 64 Web of Science
• 41 are in no A&I services.


Internet Usage
0%
10%
20%
30%
40%
50%
60%
70%
80%
90%
100%
UK USA Russia Brazil South Africa China India
Inte
rnet
Pe
net
rati
on
Data: Live Internet Stats
• Currently tracked news items