
2011 Global Payroll Metrics, Trends And Best Practices
33
2011 Payroll Performance Study Results| 1 © 2011 The Hackett Group, Inc. All rights reserved. Reproduction of this document or any portion thereof without prior written consent is prohibited. GLOBAL PAYROLL PERFORMANCE STUDY 2011 RESULTS PRESENTATION Presented to: Study Participants The Hackett Group Felicia Cheek– Practice Leader, Global Time to Pay Advisory Program Fall, 2011
description
Insight from 2011 Global Payroll Performance Study
Transcript of 2011 Global Payroll Metrics, Trends And Best Practices
2011 Payroll Performance Study Results| 1© 2011 The Hackett Group, Inc. All rights reserved. Reproduction of this document or any portion thereof without prior written consent is prohibited.
GLOBAL PAYROLL PERFORMANCE STUDY 2011
RESULTS PRESENTATION
Presented to: Study Participants
The Hackett Group
Felicia Cheek– Practice Leader, Global Time to Pay Advisory Program
Fall, 2011
2011 Payroll Performance Study Results| 2© 2011 The Hackett Group, Inc. All rights reserved. Reproduction of this document or any portion thereof without prior written consent is prohibited.
Statement of Confidentiality and Usage Restrictions
This document contains trade secrets and other information that are company sensitive, proprietary, and
confidential, the disclosure of which would provide a competitive advantage to others. As a result, the
reproduction, copying, or redistribution of this document or the contents contained herein, in whole or in part, for
any purpose is strictly prohibited without the prior written consent of The Hackett Group.
Copyright © 2011 The Hackett Group, World-Class Defined. All rights reserved.
2011 Payroll Performance Study Results| 3© 2011 The Hackett Group, Inc. All rights reserved. Reproduction of this document or any portion thereof without prior written consent is prohibited.
Today’s Hackett Facilitator
Ms. Cheek is the leader of the Global Time-to-Pay Advisory
Program with primary responsibility for payroll and WFM advisory
services as well as setting the agenda for payroll research. Ms.
Cheek works closely with Finance, HR and Shared Services
professionals who own the payroll process to provide strategic
insight, metrics and best practices.
The current agenda for the program includes providing global
insight necessary to create a comprehensive payroll globalization
strategy and a Service Delivery Model that leverages best practices
in a global environment. A major part of the advisory program
framework focuses on facilitating peer interaction with top
performing payroll organizations.
She has passion for payroll and enjoys empowering payroll leaders
by providing strategic and tactical insight necessary to increase
the value and support of payroll organizations. She is a 2009
recipient of the APA’s Meritorious Award and a 2009 APA Hall of
Fame Inductee.
2011 Payroll Performance Study Results| 4© 2011 The Hackett Group, Inc. All rights reserved. Reproduction of this document or any portion thereof without prior written consent is prohibited.
Contents
Key Observations From the 2011 Global Payroll Performance Study
Top Performer Overview and Trends
Global Observations & Metrics
Next Steps
Closing Statements
2011 Payroll Performance Study Results| 5© 2011 The Hackett Group, Inc. All rights reserved. Reproduction of this document or any portion thereof without prior written consent is prohibited.
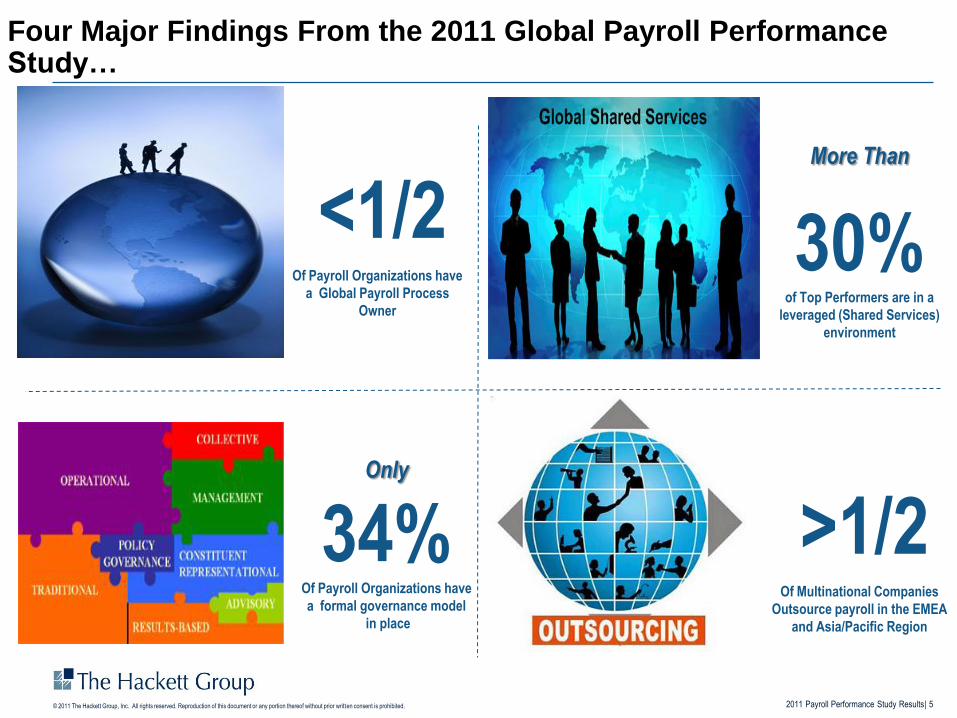
Four Major Findings From the 2011 Global Payroll Performance Study…
<1/2Of Payroll Organizations have
a Global Payroll Process
Owner
Only
34%Of Payroll Organizations have
a formal governance model
in place
More Than
30%of Top Performers are in a
leveraged (Shared Services)
environment
>1/2Of Multinational Companies
Outsource payroll in the EMEA
and Asia/Pacific Region
2011 Payroll Performance Study Results| 6© 2011 The Hackett Group, Inc. All rights reserved. Reproduction of this document or any portion thereof without prior written consent is prohibited.
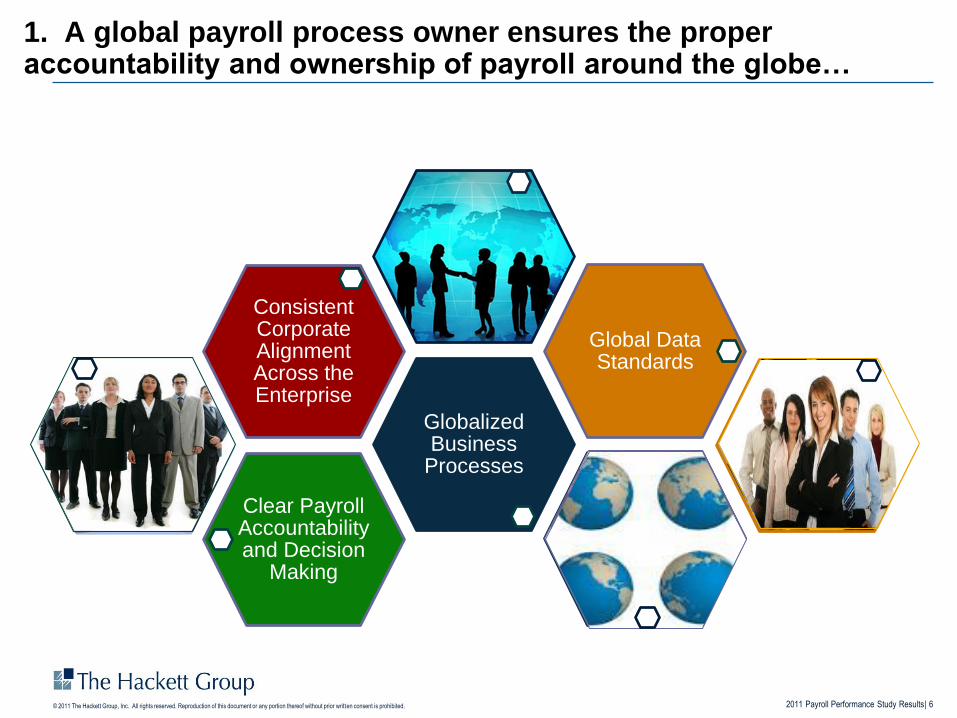
1. A global payroll process owner ensures the proper accountability and ownership of payroll around the globe…
Clear Payroll Accountability and Decision
Making
Globalized Business
Processes
Consistent Corporate Alignment Across the Enterprise
Global Data Standards
2011 Payroll Performance Study Results| 7© 2011 The Hackett Group, Inc. All rights reserved. Reproduction of this document or any portion thereof without prior written consent is prohibited.
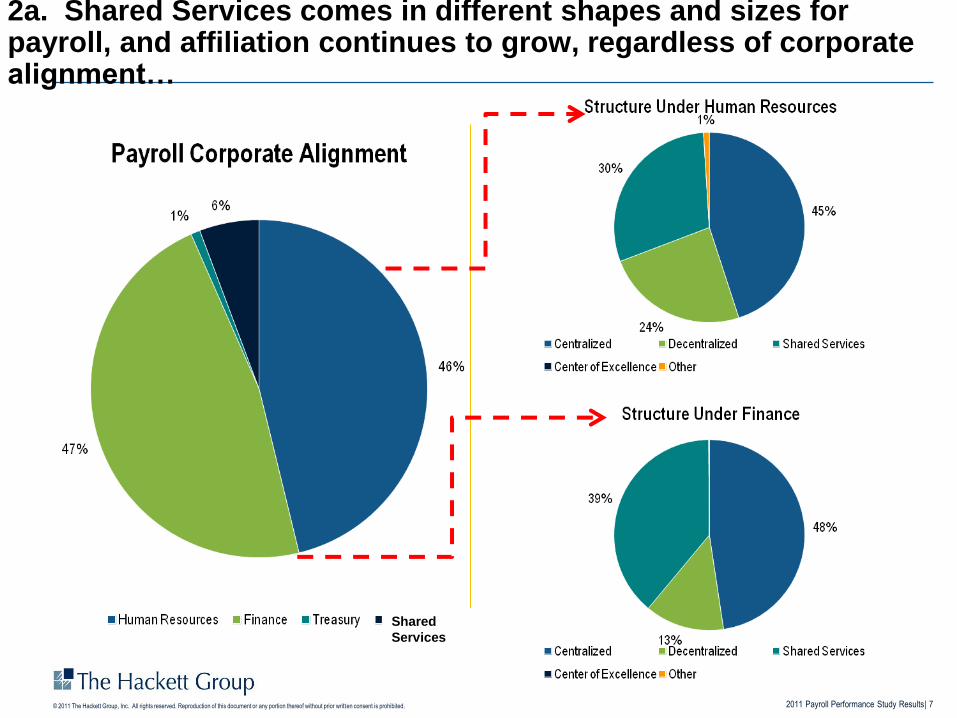
2a. Shared Services comes in different shapes and sizes for payroll, and affiliation continues to grow, regardless of corporate alignment…
Shared
Services
2011 Payroll Performance Study Results| 8© 2011 The Hackett Group, Inc. All rights reserved. Reproduction of this document or any portion thereof without prior written consent is prohibited.
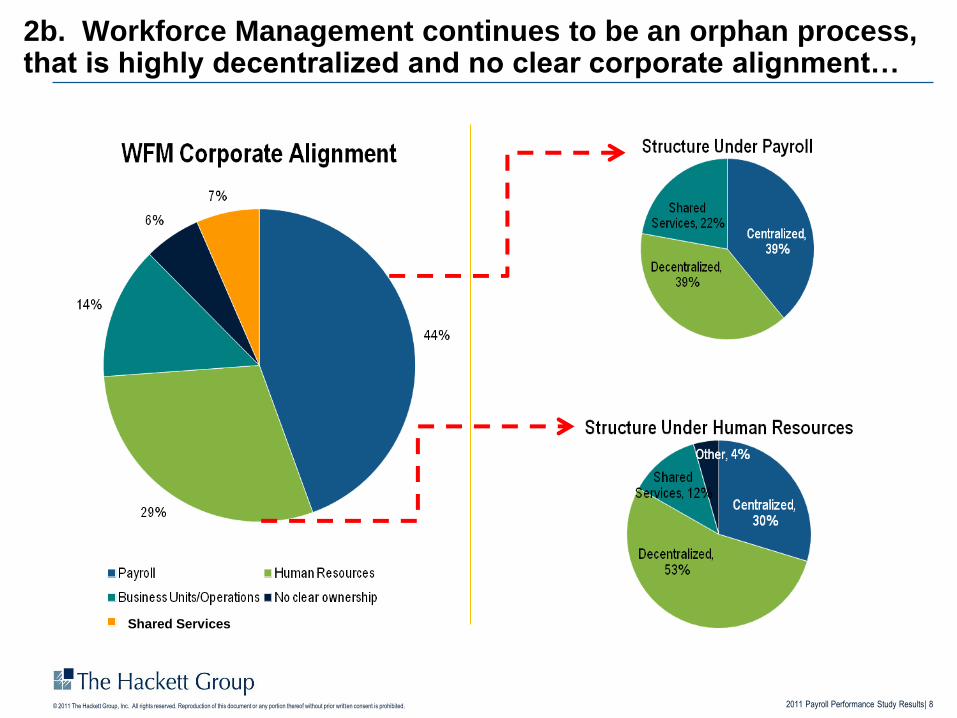
2b. Workforce Management continues to be an orphan process, that is highly decentralized and no clear corporate alignment…
Shared Services

2011 Payroll Performance Study Results| 9© 2011 The Hackett Group, Inc. All rights reserved. Reproduction of this document or any portion thereof without prior written consent is prohibited.
3. Savvy payroll organizations realize the benefit of a formal governance model and the importance of using it to link payroll to the business…
Ensure the goals and objectives of the payroll organization are
In line with that of the broader business7% have no formal
governance model
in place

2011 Payroll Performance Study Results| 10© 2011 The Hackett Group, Inc. All rights reserved. Reproduction of this document or any portion thereof without prior written consent is prohibited.
4. Payroll Leaders are becoming more comfortable leveraging outsourcing as a means of delivering services through the best service point…
2011 Payroll Performance Study Results| 11© 2011 The Hackett Group, Inc. All rights reserved. Reproduction of this document or any portion thereof without prior written consent is prohibited.
Contents
Key Observations From the 2011 Global Payroll Performance Study
Top Performer Overview and Trends
Global Observations & Metrics
Next Steps
Closing Statements
2011 Payroll Performance Study Results| 12© 2011 The Hackett Group, Inc. All rights reserved. Reproduction of this document or any portion thereof without prior written consent is prohibited.
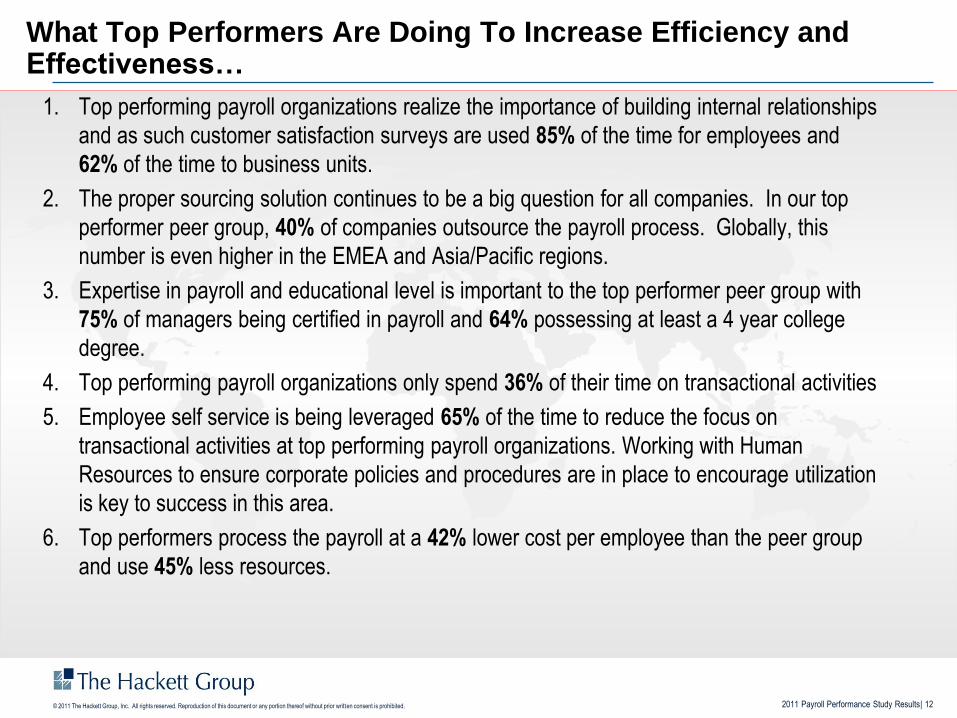
1. Top performing payroll organizations realize the importance of building internal relationships
and as such customer satisfaction surveys are used 85% of the time for employees and
62% of the time to business units.
2. The proper sourcing solution continues to be a big question for all companies. In our top
performer peer group, 40% of companies outsource the payroll process. Globally, this
number is even higher in the EMEA and Asia/Pacific regions.
3. Expertise in payroll and educational level is important to the top performer peer group with
75% of managers being certified in payroll and 64% possessing at least a 4 year college
degree.
4. Top performing payroll organizations only spend 36% of their time on transactional activities
5. Employee self service is being leveraged 65% of the time to reduce the focus on
transactional activities at top performing payroll organizations. Working with Human
Resources to ensure corporate policies and procedures are in place to encourage utilization
is key to success in this area.
6. Top performers process the payroll at a 42% lower cost per employee than the peer group
and use 45% less resources.
What Top Performers Are Doing To Increase Efficiency and Effectiveness…

2011 Payroll Performance Study Results| 13© 2011 The Hackett Group, Inc. All rights reserved. Reproduction of this document or any portion thereof without prior written consent is prohibited.
$74.05
$127.02
Top Performer Global Peer Group
Top Performers process payroll at a 42% lower cost per employee
than the peer group
…Top Performers are leveraging scalability and using creative
sourcing solutions to lower the cost of paying employees in countries
with small employee populations.
2011 Payroll Performance Study Results| 14© 2011 The Hackett Group, Inc. All rights reserved. Reproduction of this document or any portion thereof without prior written consent is prohibited.
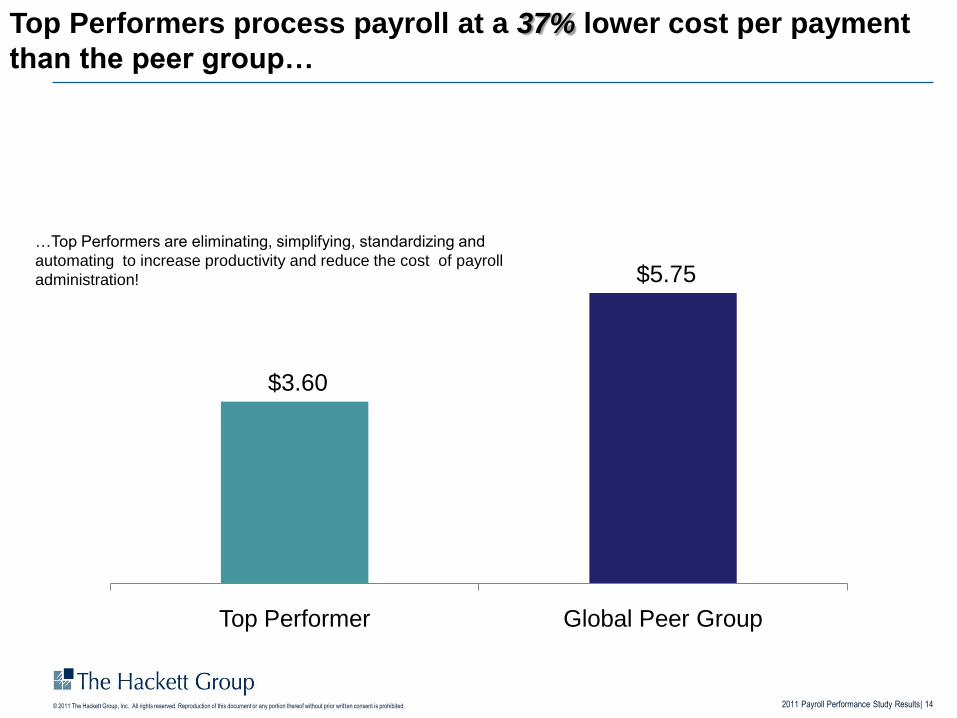
$3.60
$5.75
Top Performer Global Peer Group
Top Performers process payroll at a 37% lower cost per payment
than the peer group…
…Top Performers are eliminating, simplifying, standardizing and
automating to increase productivity and reduce the cost of payroll
administration!
2011 Payroll Performance Study Results| 15© 2011 The Hackett Group, Inc. All rights reserved. Reproduction of this document or any portion thereof without prior written consent is prohibited.
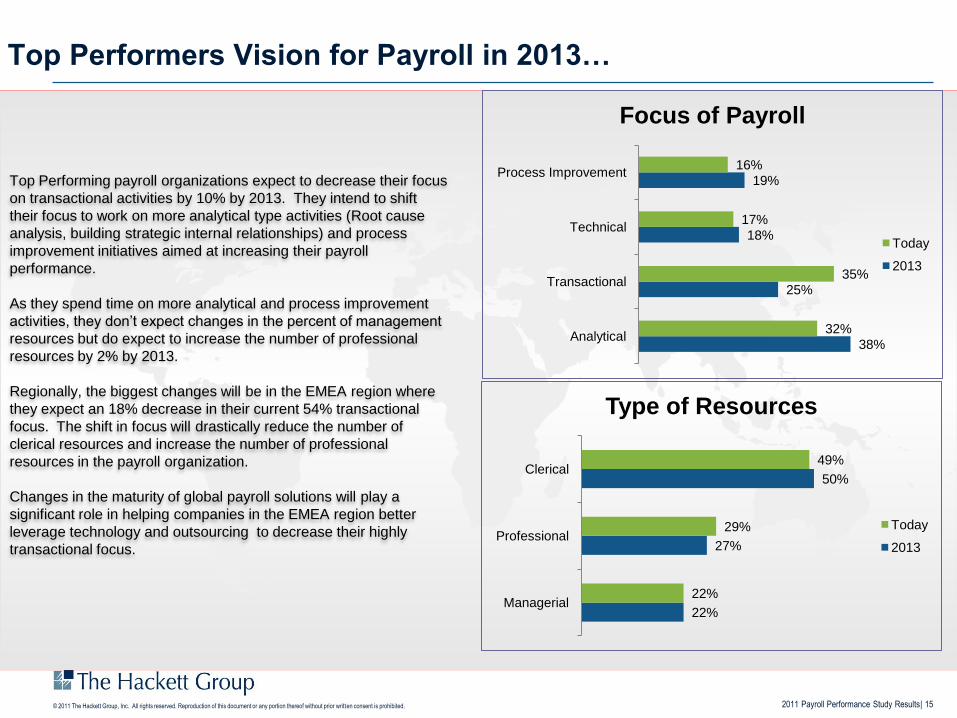
Top Performers Vision for Payroll in 2013…
Top Performing payroll organizations expect to decrease their focus
on transactional activities by 10% by 2013. They intend to shift
their focus to work on more analytical type activities (Root cause
analysis, building strategic internal relationships) and process
improvement initiatives aimed at increasing their payroll
performance.
As they spend time on more analytical and process improvement
activities, they don’t expect changes in the percent of management
resources but do expect to increase the number of professional
resources by 2% by 2013.
Regionally, the biggest changes will be in the EMEA region where
they expect an 18% decrease in their current 54% transactional
focus. The shift in focus will drastically reduce the number of
clerical resources and increase the number of professional
resources in the payroll organization.
Changes in the maturity of global payroll solutions will play a
significant role in helping companies in the EMEA region better
leverage technology and outsourcing to decrease their highly
transactional focus.
38%
25%
18%
19%
32%
35%
17%
16%
Analytical
Transactional
Technical
Process Improvement
Focus of Payroll
Today
2013
22%
27%
50%
22%
29%
49%
Managerial
Professional
Clerical
Type of Resources
Today
2013
2011 Payroll Performance Study Results| 16© 2011 The Hackett Group, Inc. All rights reserved. Reproduction of this document or any portion thereof without prior written consent is prohibited.
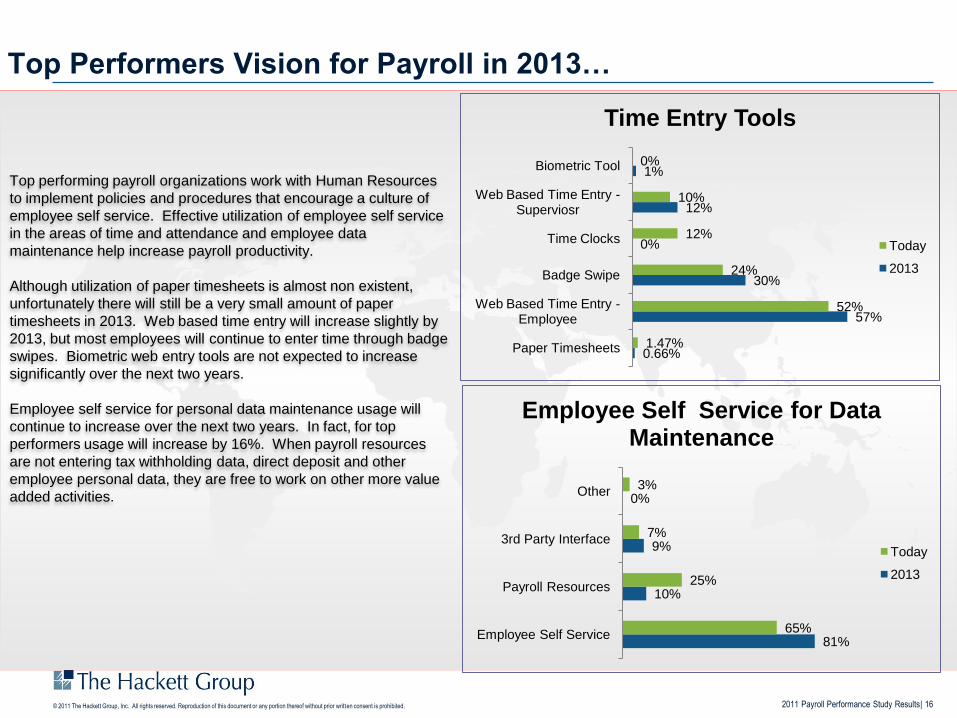
Top Performers Vision for Payroll in 2013…
Top performing payroll organizations work with Human Resources
to implement policies and procedures that encourage a culture of
employee self service. Effective utilization of employee self service
in the areas of time and attendance and employee data
maintenance help increase payroll productivity.
Although utilization of paper timesheets is almost non existent,
unfortunately there will still be a very small amount of paper
timesheets in 2013. Web based time entry will increase slightly by
2013, but most employees will continue to enter time through badge
swipes. Biometric web entry tools are not expected to increase
significantly over the next two years.
Employee self service for personal data maintenance usage will
continue to increase over the next two years. In fact, for top
performers usage will increase by 16%. When payroll resources
are not entering tax withholding data, direct deposit and other
employee personal data, they are free to work on other more value
added activities.
81%
10%
9%
0%
65%
25%
7%
3%
Employee Self Service
Payroll Resources
3rd Party Interface
Other
Employee Self Service for Data Maintenance
Today
2013
0.66%
57%
30%
0%
12%
1%
1.47%
52%
24%
12%
10%
0%
Paper Timesheets
Web Based Time Entry -Employee
Badge Swipe
Time Clocks
Web Based Time Entry -Superviosr
Biometric Tool
Time Entry Tools
Today
2013
2011 Payroll Performance Study Results| 17© 2011 The Hackett Group, Inc. All rights reserved. Reproduction of this document or any portion thereof without prior written consent is prohibited.
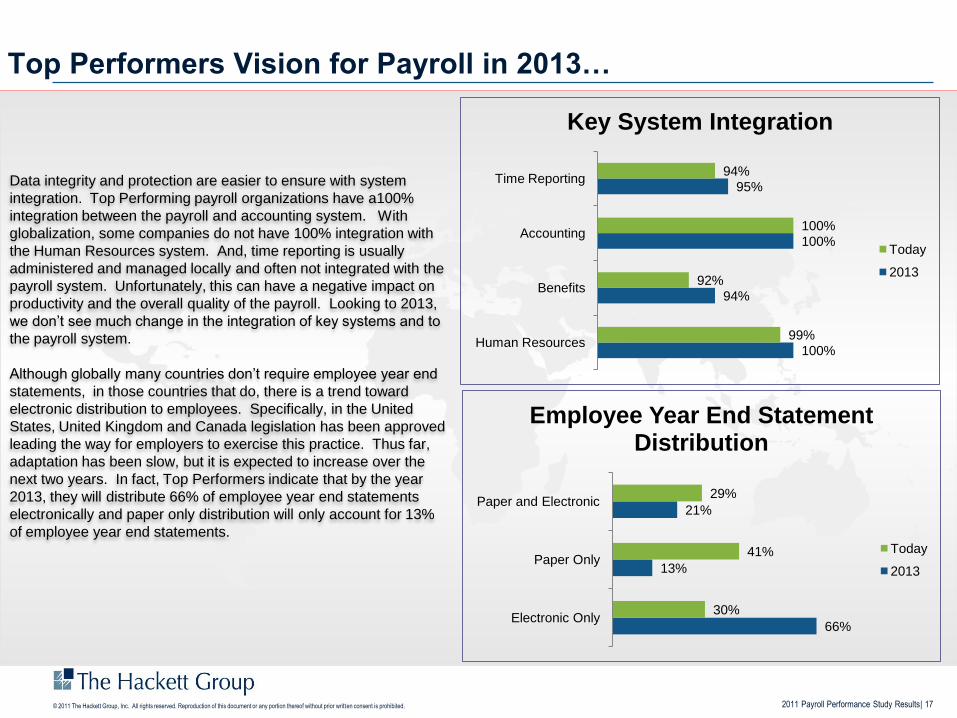
Top Performers Vision for Payroll in 2013…
Data integrity and protection are easier to ensure with system
integration. Top Performing payroll organizations have a100%
integration between the payroll and accounting system. With
globalization, some companies do not have 100% integration with
the Human Resources system. And, time reporting is usually
administered and managed locally and often not integrated with the
payroll system. Unfortunately, this can have a negative impact on
productivity and the overall quality of the payroll. Looking to 2013,
we don’t see much change in the integration of key systems and to
the payroll system.
Although globally many countries don’t require employee year end
statements, in those countries that do, there is a trend toward
electronic distribution to employees. Specifically, in the United
States, United Kingdom and Canada legislation has been approved
leading the way for employers to exercise this practice. Thus far,
adaptation has been slow, but it is expected to increase over the
next two years. In fact, Top Performers indicate that by the year
2013, they will distribute 66% of employee year end statements
electronically and paper only distribution will only account for 13%
of employee year end statements.
100%
94%
100%
95%
99%
92%
100%
94%
Human Resources
Benefits
Accounting
Time Reporting
Key System Integration
Today
2013
66%
13%
21%
30%
41%
29%
Electronic Only
Paper Only
Paper and Electronic
Employee Year End Statement Distribution
Today
2013
2011 Payroll Performance Study Results| 18© 2011 The Hackett Group, Inc. All rights reserved. Reproduction of this document or any portion thereof without prior written consent is prohibited.
Contents
Key Observations From the 2011 Global Payroll Performance Study
Top Performer Overview and Trends
Global Observations & Metrics
Next Steps
Closing Statements
2011 Payroll Performance Study Results| 19© 2011 The Hackett Group, Inc. All rights reserved. Reproduction of this document or any portion thereof without prior written consent is prohibited.
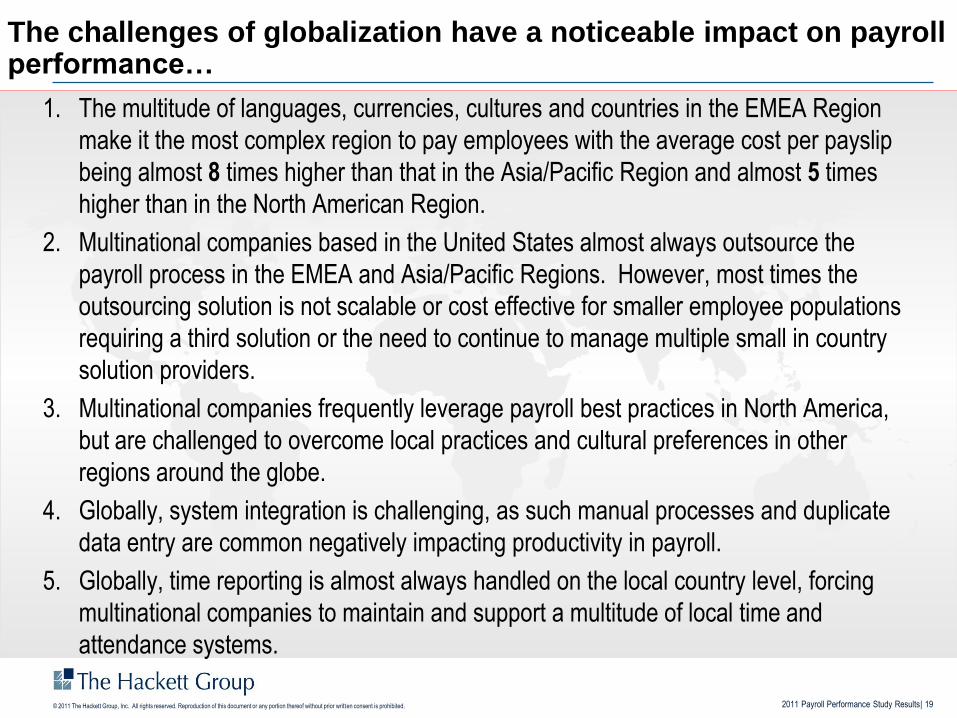
The challenges of globalization have a noticeable impact on payroll performance…
1. The multitude of languages, currencies, cultures and countries in the EMEA Region
make it the most complex region to pay employees with the average cost per payslip
being almost 8 times higher than that in the Asia/Pacific Region and almost 5 times
higher than in the North American Region.
2. Multinational companies based in the United States almost always outsource the
payroll process in the EMEA and Asia/Pacific Regions. However, most times the
outsourcing solution is not scalable or cost effective for smaller employee populations
requiring a third solution or the need to continue to manage multiple small in country
solution providers.
3. Multinational companies frequently leverage payroll best practices in North America,
but are challenged to overcome local practices and cultural preferences in other
regions around the globe.
4. Globally, system integration is challenging, as such manual processes and duplicate
data entry are common negatively impacting productivity in payroll.
5. Globally, time reporting is almost always handled on the local country level, forcing
multinational companies to maintain and support a multitude of local time and
attendance systems.
2011 Payroll Performance Study Results| 20© 2011 The Hackett Group, Inc. All rights reserved. Reproduction of this document or any portion thereof without prior written consent is prohibited.
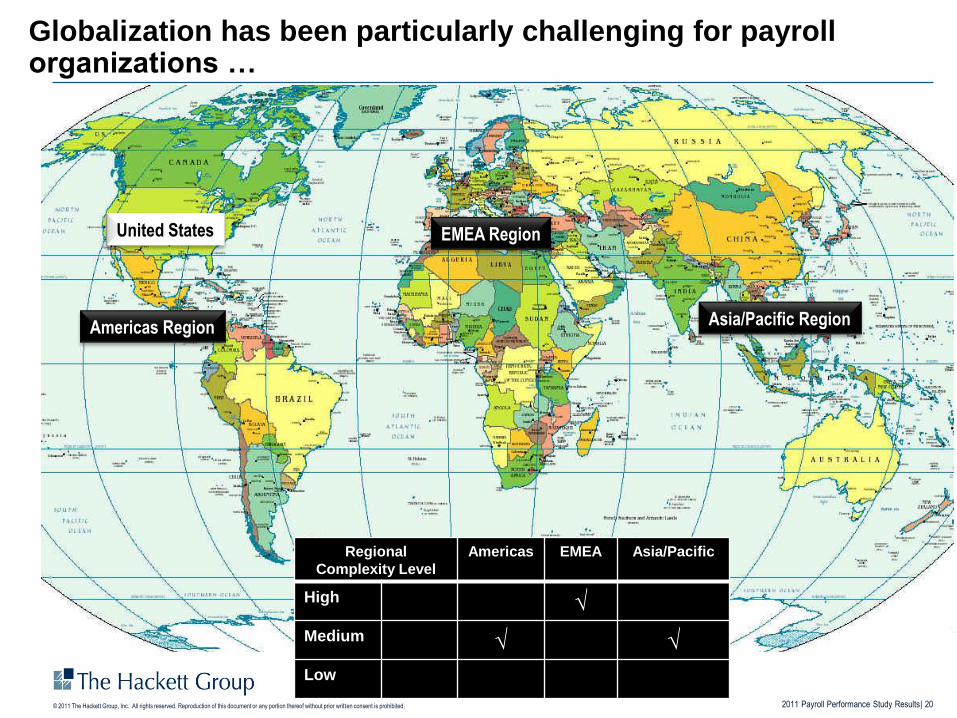
Globalization has been particularly challenging for payroll organizations …
Asia/Pacific Region
EMEA Region
Regional
Complexity Level
Americas EMEA Asia/Pacific
High √
Medium √ √
Low
Americas Region
United States
2011 Payroll Performance Study Results| 21© 2011 The Hackett Group, Inc. All rights reserved. Reproduction of this document or any portion thereof without prior written consent is prohibited.
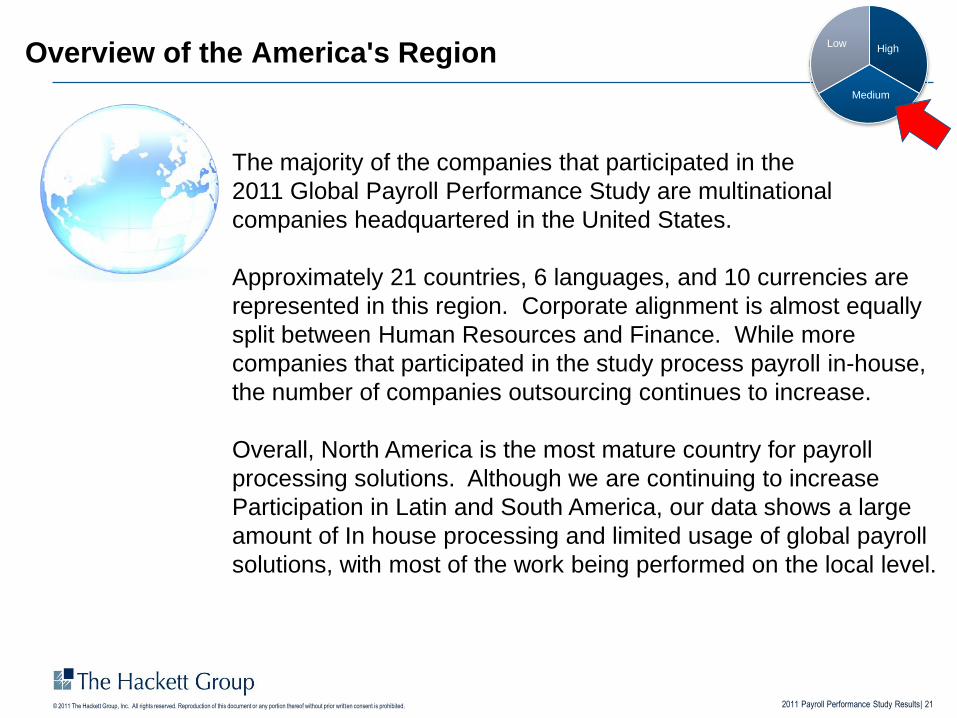
The majority of the companies that participated in the
2011 Global Payroll Performance Study are multinational
companies headquartered in the United States.
Approximately 21 countries, 6 languages, and 10 currencies are
represented in this region. Corporate alignment is almost equally
split between Human Resources and Finance. While more
companies that participated in the study process payroll in-house,
the number of companies outsourcing continues to increase.
Overall, North America is the most mature country for payroll
processing solutions. Although we are continuing to increase
Participation in Latin and South America, our data shows a large
amount of In house processing and limited usage of global payroll
solutions, with most of the work being performed on the local level.
Overview of the America's Region High
Medium
Low
2011 Payroll Performance Study Results| 22© 2011 The Hackett Group, Inc. All rights reserved. Reproduction of this document or any portion thereof without prior written consent is prohibited.
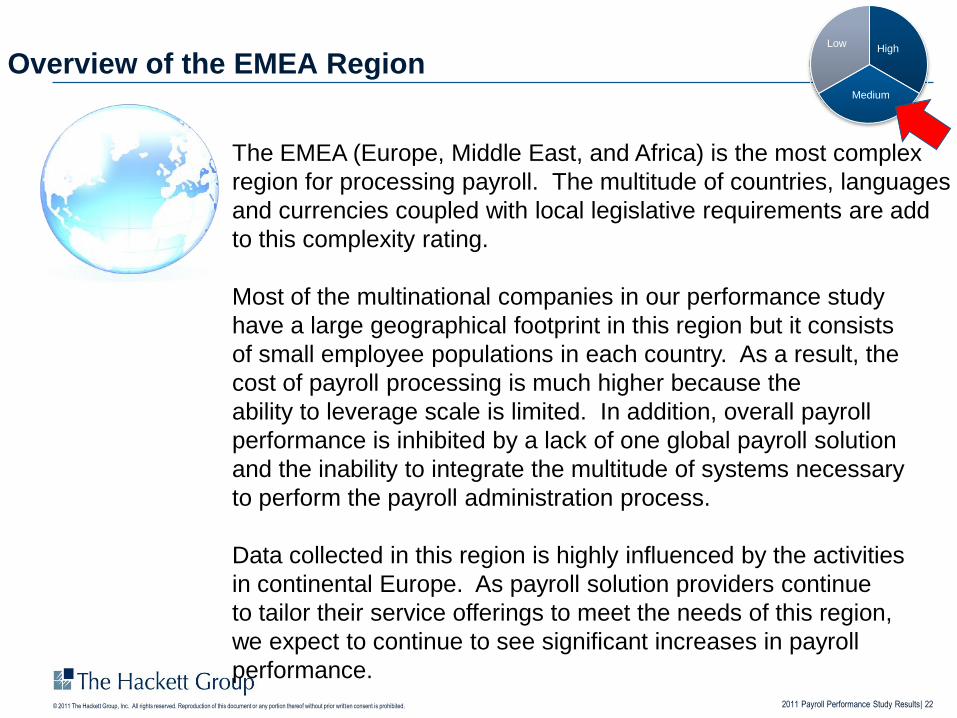
The EMEA (Europe, Middle East, and Africa) is the most complex
region for processing payroll. The multitude of countries, languages
and currencies coupled with local legislative requirements are add
to this complexity rating.
Most of the multinational companies in our performance study
have a large geographical footprint in this region but it consists
of small employee populations in each country. As a result, the
cost of payroll processing is much higher because the
ability to leverage scale is limited. In addition, overall payroll
performance is inhibited by a lack of one global payroll solution
and the inability to integrate the multitude of systems necessary
to perform the payroll administration process.
Data collected in this region is highly influenced by the activities
in continental Europe. As payroll solution providers continue
to tailor their service offerings to meet the needs of this region,
we expect to continue to see significant increases in payroll
performance.
Overview of the EMEA RegionHigh
Medium
Low
2011 Payroll Performance Study Results| 23© 2011 The Hackett Group, Inc. All rights reserved. Reproduction of this document or any portion thereof without prior written consent is prohibited.
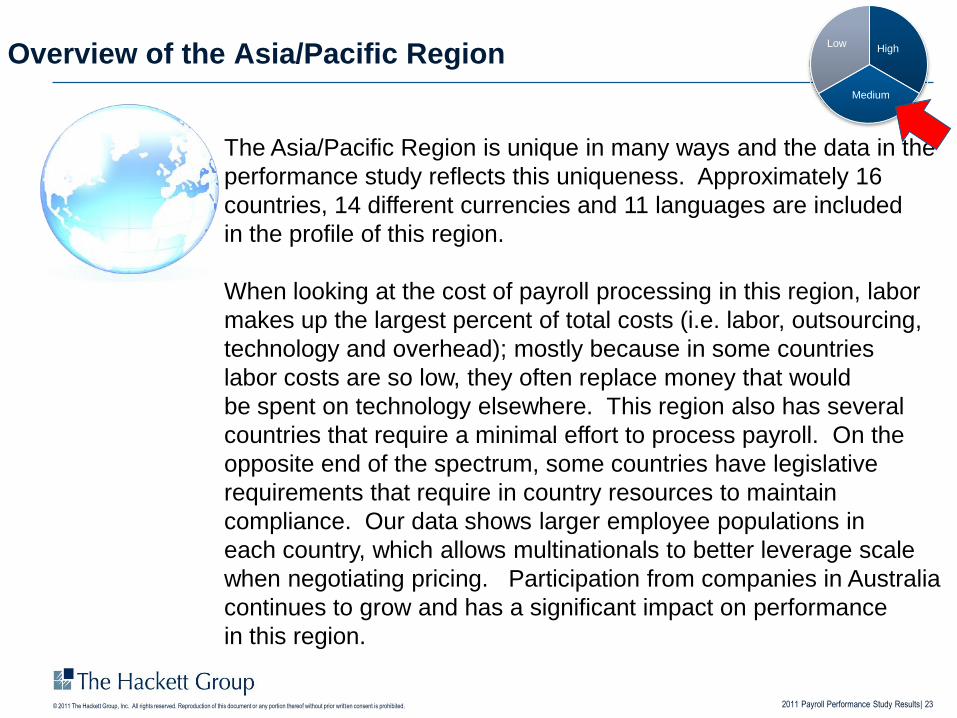
The Asia/Pacific Region is unique in many ways and the data in the
performance study reflects this uniqueness. Approximately 16
countries, 14 different currencies and 11 languages are included
in the profile of this region.
When looking at the cost of payroll processing in this region, labor
makes up the largest percent of total costs (i.e. labor, outsourcing,
technology and overhead); mostly because in some countries
labor costs are so low, they often replace money that would
be spent on technology elsewhere. This region also has several
countries that require a minimal effort to process payroll. On the
opposite end of the spectrum, some countries have legislative
requirements that require in country resources to maintain
compliance. Our data shows larger employee populations in
each country, which allows multinationals to better leverage scale
when negotiating pricing. Participation from companies in Australia
continues to grow and has a significant impact on performance
in this region.
Overview of the Asia/Pacific Region High
Medium
Low
2011 Payroll Performance Study Results| 24© 2011 The Hackett Group, Inc. All rights reserved. Reproduction of this document or any portion thereof without prior written consent is prohibited.
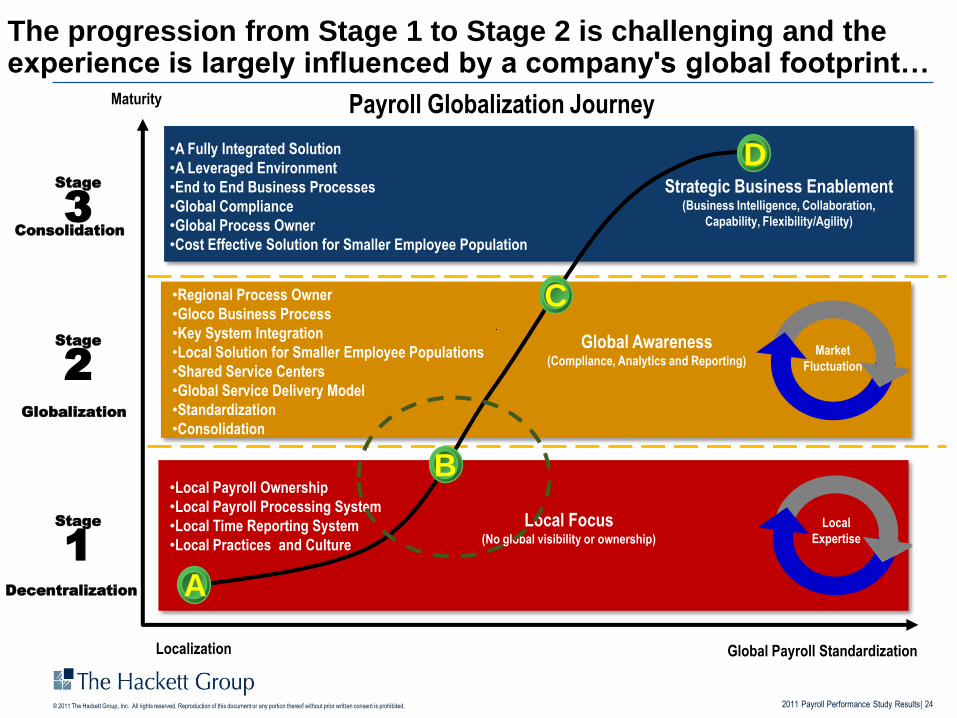
Stage
3
Stage
2
Stage
1
Decentralization
Globalization
Consolidation
Global Payroll Standardization
Maturity
Strategic Business Enablement(Business Intelligence, Collaboration,
Capability, Flexibility/Agility)
Global Awareness(Compliance, Analytics and Reporting)
Local Focus(No global visibility or ownership)
•Local Payroll Ownership
•Local Payroll Processing System
•Local Time Reporting System
•Local Practices and Culture
•Regional Process Owner
•Gloco Business Process
•Key System Integration
•Local Solution for Smaller Employee Populations
•Shared Service Centers
•Global Service Delivery Model
•Standardization
•Consolidation
•A Fully Integrated Solution
•A Leveraged Environment
•End to End Business Processes
•Global Compliance
•Global Process Owner
•Cost Effective Solution for Smaller Employee Population
Local
Expertise
Market
Fluctuation
Localization
The progression from Stage 1 to Stage 2 is challenging and the experience is largely influenced by a company's global footprint…
A
B
C
D
Payroll Globalization Journey
2011 Payroll Performance Study Results| 25© 2011 The Hackett Group, Inc. All rights reserved. Reproduction of this document or any portion thereof without prior written consent is prohibited.
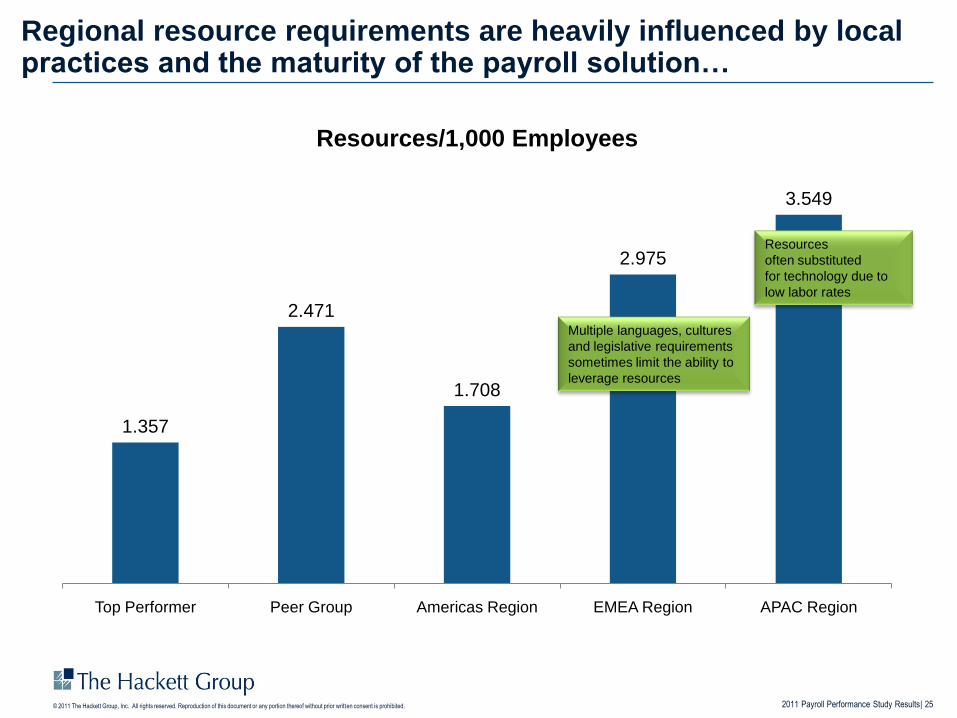
Regional resource requirements are heavily influenced by local practices and the maturity of the payroll solution…
1.357
2.471
1.708
2.975
3.549
Top Performer Peer Group Americas Region EMEA Region APAC Region
Resources/1,000 Employees
Multiple languages, cultures
and legislative requirements
sometimes limit the ability to
leverage resources
Resources
often substituted
for technology due to
low labor rates
2011 Payroll Performance Study Results| 26© 2011 The Hackett Group, Inc. All rights reserved. Reproduction of this document or any portion thereof without prior written consent is prohibited.
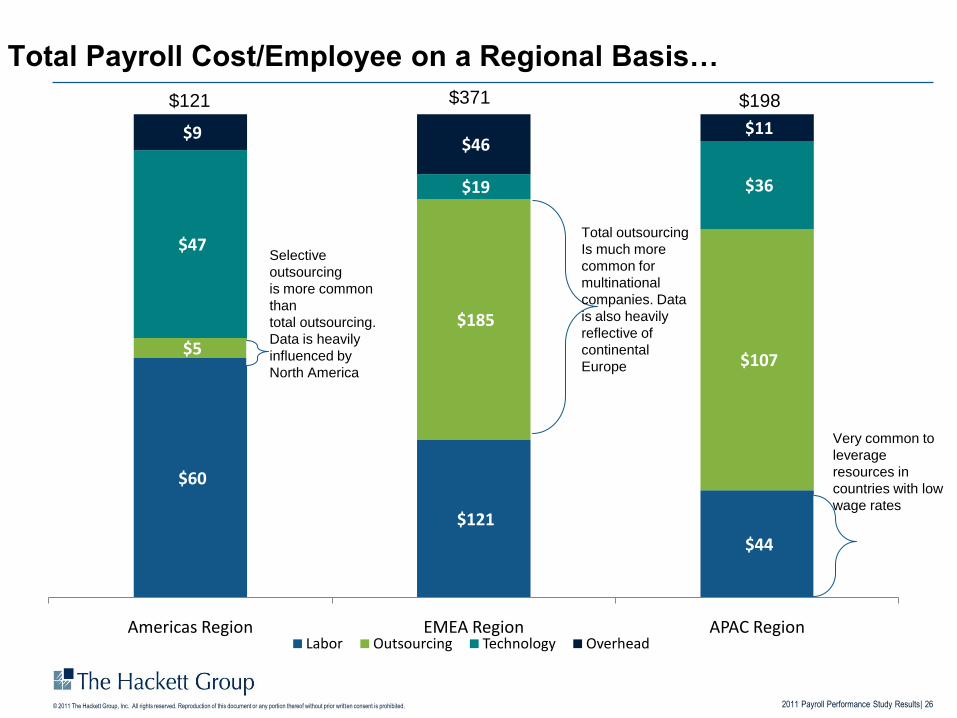
$60
$121
$44
$5
$185
$107
$47
$19 $36
$9 $46
$11
Americas Region EMEA Region APAC RegionLabor Outsourcing Technology Overhead
Total Payroll Cost/Employee on a Regional Basis…
$121 $371 $198
Selective
outsourcing
is more common
than
total outsourcing.
Data is heavily
influenced by
North America
Total outsourcing
Is much more
common for
multinational
companies. Data
is also heavily
reflective of
continental
Europe
Very common to
leverage
resources in
countries with low
wage rates
2011 Payroll Performance Study Results| 27© 2011 The Hackett Group, Inc. All rights reserved. Reproduction of this document or any portion thereof without prior written consent is prohibited.
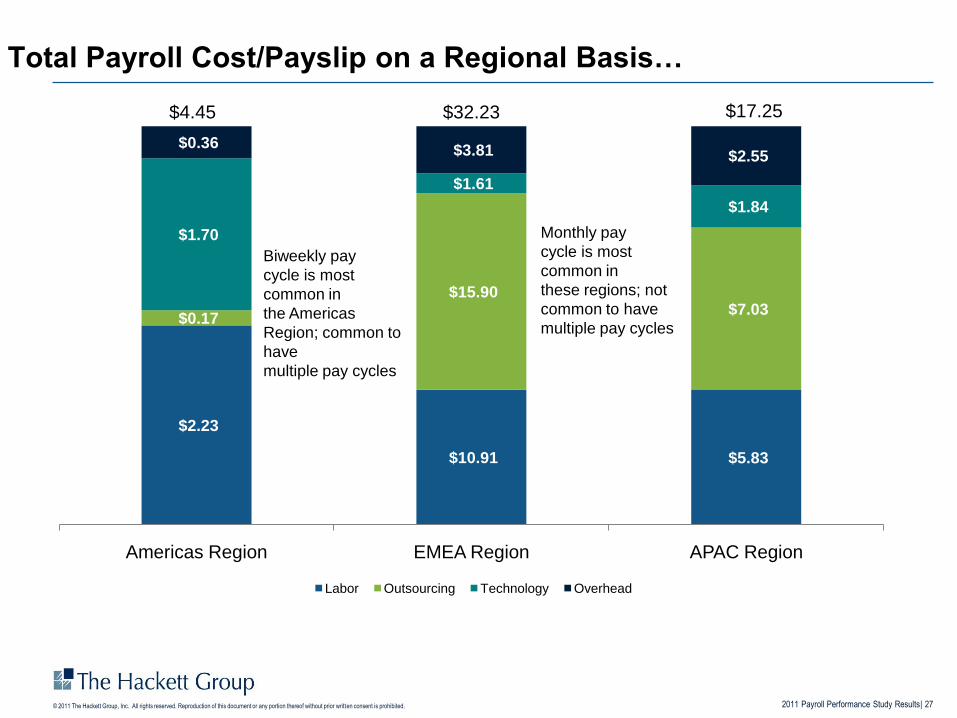
$2.23
$10.91 $5.83
$0.17
$15.90 $7.03
$1.70
$1.61
$1.84
$0.36 $3.81 $2.55
Americas Region EMEA Region APAC Region
Labor Outsourcing Technology Overhead
Total Payroll Cost/Payslip on a Regional Basis…
$4.45 $32.23 $17.25
Monthly pay
cycle is most
common in
these regions; not
common to have
multiple pay cycles
Biweekly pay
cycle is most
common in
the Americas
Region; common to
have
multiple pay cycles
2011 Payroll Performance Study Results| 28© 2011 The Hackett Group, Inc. All rights reserved. Reproduction of this document or any portion thereof without prior written consent is prohibited.
Contents
Key Observations From the 2011 Global Payroll Performance Study
Top Performer Overview and Trends
Global Observations & Metrics
Next Steps
Closing Statements
2011 Payroll Performance Study Results| 29© 2011 The Hackett Group, Inc. All rights reserved. Reproduction of this document or any portion thereof without prior written consent is prohibited.
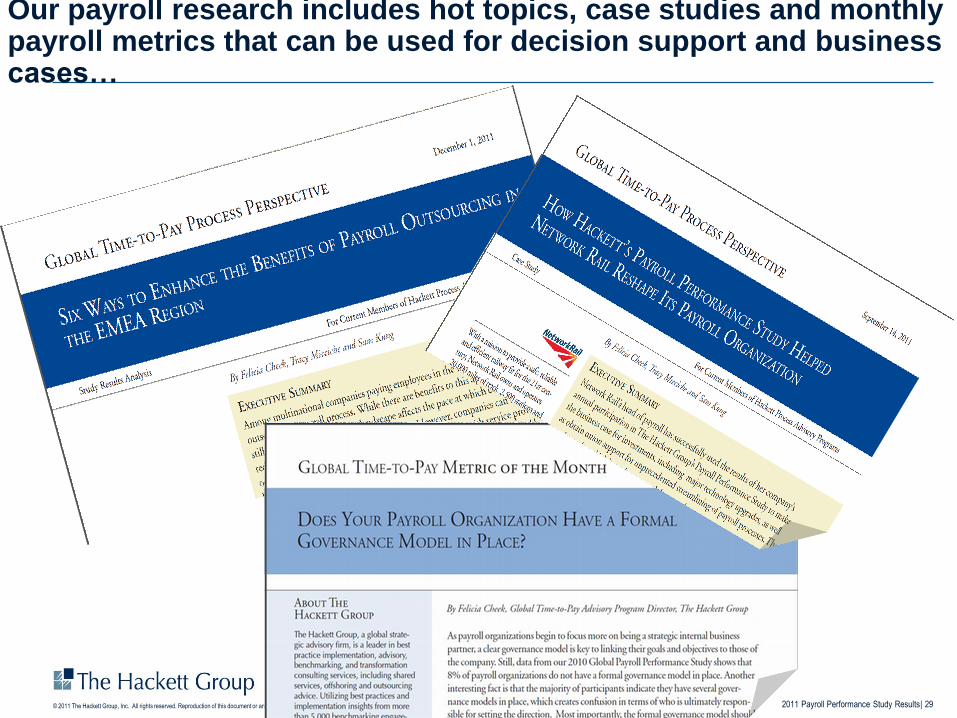
Our payroll research includes hot topics, case studies and monthly payroll metrics that can be used for decision support and business cases…
2011 Payroll Performance Study Results| 30© 2011 The Hackett Group, Inc. All rights reserved. Reproduction of this document or any portion thereof without prior written consent is prohibited.
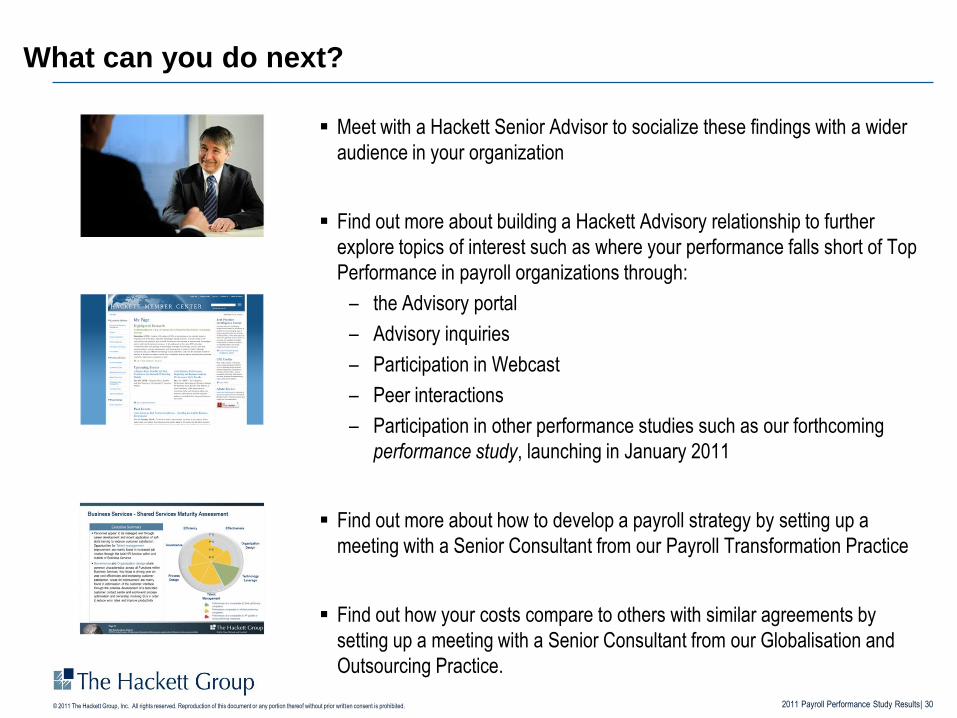
What can you do next?
Meet with a Hackett Senior Advisor to socialize these findings with a wider
audience in your organization
Find out more about building a Hackett Advisory relationship to further
explore topics of interest such as where your performance falls short of Top
Performance in payroll organizations through:
– the Advisory portal
– Advisory inquiries
– Participation in Webcast
– Peer interactions
– Participation in other performance studies such as our forthcoming
performance study, launching in January 2011
Find out more about how to develop a payroll strategy by setting up a
meeting with a Senior Consultant from our Payroll Transformation Practice
Find out how your costs compare to others with similar agreements by
setting up a meeting with a Senior Consultant from our Globalisation and
Outsourcing Practice.
2011 Payroll Performance Study Results| 31© 2011 The Hackett Group, Inc. All rights reserved. Reproduction of this document or any portion thereof without prior written consent is prohibited.
Contents
Key Observations From the 2011 Global Payroll Performance Study
Top Performer Overview and Trends
Global Observations & Metrics
Next Steps
Closing Statements

2011 Payroll Performance Study Results| 32© 2011 The Hackett Group, Inc. All rights reserved. Reproduction of this document or any portion thereof without prior written consent is prohibited.
Questions, Comments and Closing Comments…
Felicia Cheek
Senior Advisor – Global Time to Pay Advisory Program
Phone: + 1.770.703.7470
Mobile: +1.404.218.8666
www.thehackettgroup.com
Suite N500
1117 Perimeter Center West
Atlanta, GA 30338
Phone: +1 770 225 3600
Martin House
5 Martin Lane
London EC4R 0DP
Phone: +44 207 398 9100
Torhaus Westhafen
Speicherstrasse 59
60327 Frankfurt am Main, Germany
Phone: +49 69 900217 0
8, rue de Port Mahon
75002 Paris, France
Phone: +33 1 53 43 0400
Strawinskylaan 3051G, 1077 ZX
Amsterdam, The Netherlands
Phone: +31 20 301 2210
Suite 403
35 Lime Street
Sydney, NSW2000
Australia
Phone +61 2 9299 8830