Research Article Metabolic Syndrome according to Three...
11
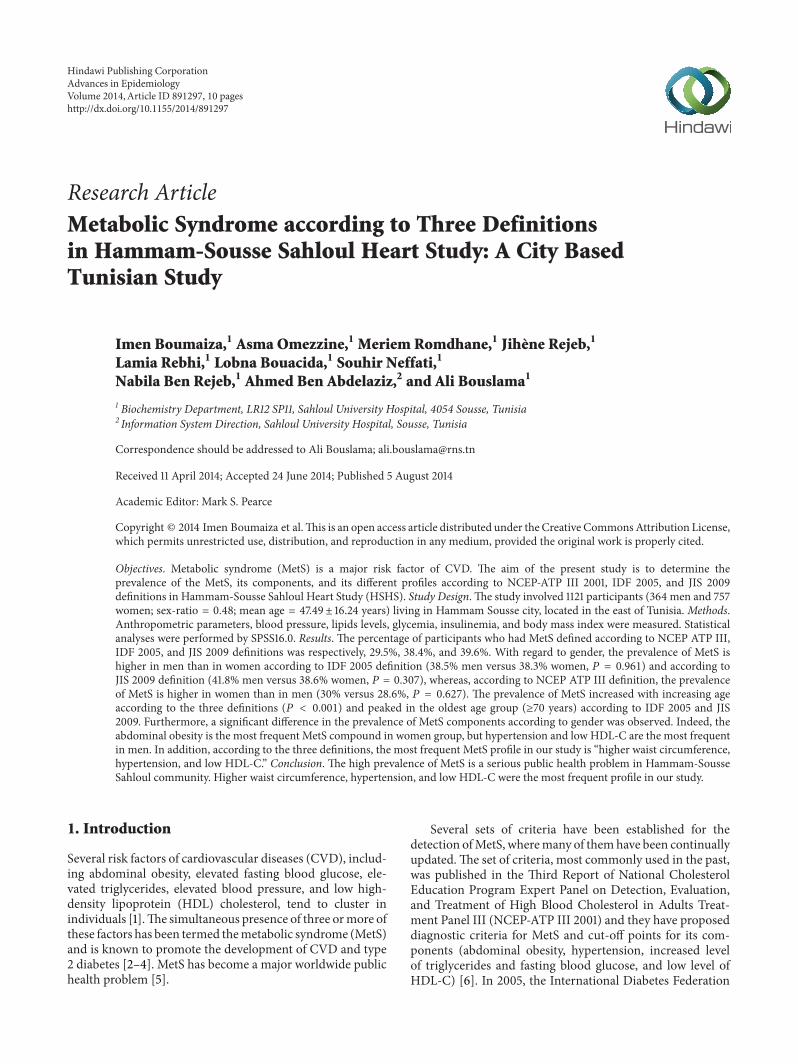
Research Article Metabolic Syndrome according to Three Definitions in Hammam-Sousse Sahloul Heart Study: A City Based Tunisian Study Imen Boumaiza, 1 Asma Omezzine, 1 Meriem Romdhane, 1 Jihène Rejeb, 1 Lamia Rebhi, 1 Lobna Bouacida, 1 Souhir Neffati, 1 Nabila Ben Rejeb, 1 Ahmed Ben Abdelaziz, 2 and Ali Bouslama 1 1 Biochemistry Department, LR12 SP11, Sahloul University Hospital, 4054 Sousse, Tunisia 2 Information System Direction, Sahloul University Hospital, Sousse, Tunisia Correspondence should be addressed to Ali Bouslama; [email protected] Received 11 April 2014; Accepted 24 June 2014; Published 5 August 2014 Academic Editor: Mark S. Pearce Copyright © 2014 Imen Boumaiza et al. is is an open access article distributed under the Creative Commons Attribution License, which permits unrestricted use, distribution, and reproduction in any medium, provided the original work is properly cited. Objectives. Metabolic syndrome (MetS) is a major risk factor of CVD. e aim of the present study is to determine the prevalence of the MetS, its components, and its different profiles according to NCEP-ATP III 2001, IDF 2005, and JIS 2009 definitions in Hammam-Sousse Sahloul Heart Study (HSHS). Study Design. e study involved 1121 participants (364 men and 757 women; sex-ratio = 0.48; mean age = 47.49 ± 16.24 years) living in Hammam Sousse city, located in the east of Tunisia. Methods. Anthropometric parameters, blood pressure, lipids levels, glycemia, insulinemia, and body mass index were measured. Statistical analyses were performed by SPSS16.0. Results. e percentage of participants who had MetS defined according to NCEP ATP III, IDF 2005, and JIS 2009 definitions was respectively, 29.5%, 38.4%, and 39.6%. With regard to gender, the prevalence of MetS is higher in men than in women according to IDF 2005 definition (38.5% men versus 38.3% women, = 0.961) and according to JIS 2009 definition (41.8% men versus 38.6% women, = 0.307), whereas, according to NCEP ATP III definition, the prevalence of MetS is higher in women than in men (30% versus 28.6%, = 0.627). e prevalence of MetS increased with increasing age according to the three definitions ( < 0.001) and peaked in the oldest age group (≥70 years) according to IDF 2005 and JIS 2009. Furthermore, a significant difference in the prevalence of MetS components according to gender was observed. Indeed, the abdominal obesity is the most frequent MetS compound in women group, but hypertension and low HDL-C are the most frequent in men. In addition, according to the three definitions, the most frequent MetS profile in our study is “higher waist circumference, hypertension, and low HDL-C.” Conclusion. e high prevalence of MetS is a serious public health problem in Hammam-Sousse Sahloul community. Higher waist circumference, hypertension, and low HDL-C were the most frequent profile in our study. 1. Introduction Several risk factors of cardiovascular diseases (CVD), includ- ing abdominal obesity, elevated fasting blood glucose, ele- vated triglycerides, elevated blood pressure, and low high- density lipoprotein (HDL) cholesterol, tend to cluster in individuals [1]. e simultaneous presence of three or more of these factors has been termed the metabolic syndrome (MetS) and is known to promote the development of CVD and type 2 diabetes [2–4]. MetS has become a major worldwide public health problem [5]. Several sets of criteria have been established for the detection of MetS, where many of them have been continually updated. e set of criteria, most commonly used in the past, was published in the ird Report of National Cholesterol Education Program Expert Panel on Detection, Evaluation, and Treatment of High Blood Cholesterol in Adults Treat- ment Panel III (NCEP-ATP III 2001) and they have proposed diagnostic criteria for MetS and cut-off points for its com- ponents (abdominal obesity, hypertension, increased level of triglycerides and fasting blood glucose, and low level of HDL-C) [6]. In 2005, the International Diabetes Federation Hindawi Publishing Corporation Advances in Epidemiology Volume 2014, Article ID 891297, 10 pages http://dx.doi.org/10.1155/2014/891297
Transcript of Research Article Metabolic Syndrome according to Three...
Research ArticleMetabolic Syndrome according to Three Definitionsin Hammam-Sousse Sahloul Heart Study: A City BasedTunisian Study
Imen Boumaiza,1 Asma Omezzine,1 Meriem Romdhane,1 Jihène Rejeb,1
Lamia Rebhi,1 Lobna Bouacida,1 Souhir Neffati,1
Nabila Ben Rejeb,1 Ahmed Ben Abdelaziz,2 and Ali Bouslama1
1 Biochemistry Department, LR12 SP11, Sahloul University Hospital, 4054 Sousse, Tunisia2 Information System Direction, Sahloul University Hospital, Sousse, Tunisia
Correspondence should be addressed to Ali Bouslama; [email protected]
Received 11 April 2014; Accepted 24 June 2014; Published 5 August 2014
Academic Editor: Mark S. Pearce
Copyright © 2014 Imen Boumaiza et al.This is an open access article distributed under the Creative CommonsAttribution License,which permits unrestricted use, distribution, and reproduction in any medium, provided the original work is properly cited.
Objectives. Metabolic syndrome (MetS) is a major risk factor of CVD. The aim of the present study is to determine theprevalence of the MetS, its components, and its different profiles according to NCEP-ATP III 2001, IDF 2005, and JIS 2009definitions in Hammam-Sousse Sahloul Heart Study (HSHS). Study Design. The study involved 1121 participants (364 men and 757women; sex-ratio = 0.48; mean age = 47.49± 16.24 years) living in Hammam Sousse city, located in the east of Tunisia. Methods.Anthropometric parameters, blood pressure, lipids levels, glycemia, insulinemia, and body mass index were measured. Statisticalanalyses were performed by SPSS16.0. Results. The percentage of participants who had MetS defined according to NCEP ATP III,IDF 2005, and JIS 2009 definitions was respectively, 29.5%, 38.4%, and 39.6%. With regard to gender, the prevalence of MetS ishigher in men than in women according to IDF 2005 definition (38.5% men versus 38.3% women, 𝑃 = 0.961) and according toJIS 2009 definition (41.8% men versus 38.6% women, 𝑃 = 0.307), whereas, according to NCEP ATP III definition, the prevalenceof MetS is higher in women than in men (30% versus 28.6%, 𝑃 = 0.627). The prevalence of MetS increased with increasing ageaccording to the three definitions (𝑃 < 0.001) and peaked in the oldest age group (≥70 years) according to IDF 2005 and JIS2009. Furthermore, a significant difference in the prevalence of MetS components according to gender was observed. Indeed, theabdominal obesity is the most frequent MetS compound in women group, but hypertension and low HDL-C are the most frequentin men. In addition, according to the three definitions, the most frequent MetS profile in our study is “higher waist circumference,hypertension, and low HDL-C.” Conclusion. The high prevalence of MetS is a serious public health problem in Hammam-SousseSahloul community. Higher waist circumference, hypertension, and low HDL-C were the most frequent profile in our study.
1. Introduction
Several risk factors of cardiovascular diseases (CVD), includ-ing abdominal obesity, elevated fasting blood glucose, ele-vated triglycerides, elevated blood pressure, and low high-density lipoprotein (HDL) cholesterol, tend to cluster inindividuals [1].The simultaneous presence of three ormore ofthese factors has been termed themetabolic syndrome (MetS)and is known to promote the development of CVD and type2 diabetes [2–4]. MetS has become a major worldwide publichealth problem [5].
Several sets of criteria have been established for thedetection ofMetS, wheremany of themhave been continuallyupdated.The set of criteria, most commonly used in the past,was published in the Third Report of National CholesterolEducation Program Expert Panel on Detection, Evaluation,and Treatment of High Blood Cholesterol in Adults Treat-ment Panel III (NCEP-ATP III 2001) and they have proposeddiagnostic criteria for MetS and cut-off points for its com-ponents (abdominal obesity, hypertension, increased levelof triglycerides and fasting blood glucose, and low level ofHDL-C) [6]. In 2005, the International Diabetes Federation
Hindawi Publishing CorporationAdvances in EpidemiologyVolume 2014, Article ID 891297, 10 pageshttp://dx.doi.org/10.1155/2014/891297
2 Advances in Epidemiology
recommended a new definition of metabolic syndrome, theIDF definition [7]. Recently, A joint interim statement (JIS2009) of the International Diabetes Federation Task Forceon Epidemiology and Prevention (National Heart, Lung, andBlood Institute; American Heart Association; World HeartFederation; International Atherosclerosis Society; and Inter-national Association for the Study of Obesity) collaborated torelease a unified set of criteria [8].
The estimated prevalence of MetS has varied due to thevariability of the evaluated population, such as the ethnicgroup, the gender, and the age, and due to the diagnosticcriteria [9].
Among 8,608 noninstitutionalized civilian population oftheUS aged≥20 years, the age-adjusted prevalencewas 23.9%using the ATP III definition and 25.1% using the WHO defi-nition. Among all participants, 86.2%were classified as eitherhaving or not having the MetS under both definitions [5].According to NCEP ATP III 2001 definition, the prevalenceof MetS is 32.3% in the Americans [10], 31.6% in the Indians[11], and 33.1% in the Iranians [12].
In Europe, numerous small studies suggest significantgeographical variations, with the prevalence among thenondiabetic population which was estimated at 25.9% inmenand 23.4% in women (DECODE Study Group) [13] and theFrenchDESIR study reported that the prevalence ofMetSwas10% [14]. The prevalence of MetS in United States, accordingto the National Health and Nutrition Examination Survey(NHANES) in 2003–2006, was 34% [15].
In Tunisia and as a result of economic growth and itsassociated sociodemographic changes, the burden of CVDand risk factors has been increased [16]. At present, onlythree studies have investigated the prevalence of MetS, [17–19]. Bouguerra et al. reported that the prevalence of MetS,by using the definition of the NCEP ATPIII [18], was16.3% and Allal-Elasmi et al. reported that the prevalence ofMetS, according to NCEP ATPIII definition [19], was 31.2%.Harzallah et al. reported that, using the IDF criteria, theprevalence was found to be 45.5%, 28.7% according to WHO1999 definition, and 24.3% according to NECP ATPIII2001definition [17]. The studies reported by Harzallah et al. [17]and Bouguerra et al. [18] were now out of date. The study ofBouguerra et al. [18] has important limitations; the principalone is the nonmeasurement of HDL-C and the second one isthe poor response rate of men.
The results of the different studies change according to theadopted definition. The objective of the present report is toestimate the prevalence of theMetS and its compounds by ageand by sex in Hammam-Sousse Sahloul Heart Study (HSHS),a city based Tunisian study, according to NCEP-ATP III 2001,IDF 2005 definition, and JIS 2009 definitions.
2. Materials and Methods
2.1. Study Population. The HSHS is an epidemiological pop-ulation study type “community based” in cardiovascularrisks with very broad research aims. Hammam Sousse city(the governorate of Sousse, Tunisia), located in the east ofTunisia, included a population of 35 000 people. The HSHS
was led with a sample of 1000 households (33 clusters ∗ 33households) of the city of Hammam Sousse, from Februaryto June 2009, and drawn lots by the technique of samplingin clusters in two degrees and in proportional probability. Allpeople present at home the day of the investigation, aged 20years or more, were included in the study.
The main purpose of the HSHS is to study the impactof lifestyle factors and metabolic perturbations on aspects ofhealth, such as the quality of life, the prevalence of MetS,obesity, hypertension, and type 2 diabetes, and the incidenceof chronic diseases.
A structured questionnaire was completed to the allmembers of the household. Anthropometric, demographic,and socioeconomic data were obtained for each subjectincluding age, gender and marital status, level of educa-tion, occupation, household income, reproductive historyin women, and family and personal history of obesity,diabetes, hypertension, and CVD. Also data on lifestyle,including physical exercise, dietary intake, smoking habits,and frequency of alcohol consumption, were collected.
We calculated the size of the sample by reference to thefollowing hypothesis:
(i) a confidence level of 95%,(ii) an estimated prevalence of 50%,(iii) a precision of 3%.
So, an optimal sample size of 1111 subjects using the fol-lowing equation [20] 𝑛 = [𝑧2(𝑝𝑞/Δ2)𝑘] has been determined(𝑧 = reduced gap; 𝑝 = prevalence; 𝑞 = 1 − 𝑝; Δ = precision; 𝑘= cluster coefficient).
2.2. Anthropometric Parameters and Blood Pressure Measure-ments. Weight and height were measured on the subjectsbarefooted and lightly clothed. Waist circumference (WC)was measured by trained examiner from the narrowest pointbetween the lower borders of the rib cage and the iliac crest.
Blood pressure was read three times from the left armof seated subjects with a blood pressure monitor after 20minutes of rest.The average of the two lastmeasurements wasrecorded for each subject.
2.3. Biochemical Measurements. Blood samples were col-lected from subjects after 12 hours of overnight fast. Serumtotal cholesterol (TC) and triglycerides (TG) were deter-mined by standard assays. HDL-C was measured by directassay. Low density lipoprotein-cholesterol (LDL-C) concen-trations were calculated with the Friedewald formula [21] ifTG< 4mmol/L. If not, LDL-C concentrationsweremeasuredby direct assay. Fasting glucose was measured by the glucoseoxidasemethod. All biochemical parameters were performedon the Synchron CX7 Clinical System using the Beckmanreagents (Beckman Coulter, Fullerton, CA, USA).
2.4. Definitions of Risk Factors. Diabetes mellitus was definedas fasting glucose more than 7mmol/L or currently receivingantidiabetic medication [22]. Hypertension was defined asgreater than 140/90mmHg or currently of antihypertensive
Advances in Epidemiology 3
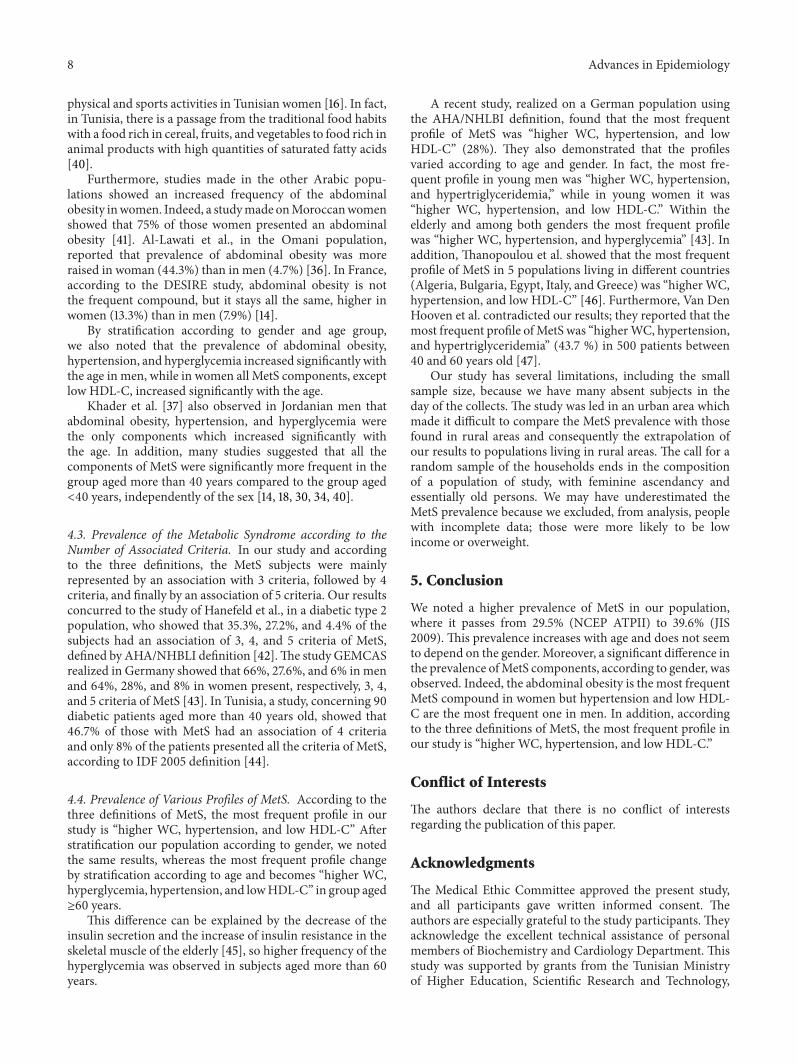
medication [23]. Dyslipidemia was defined as LDL-C con-centration more than or equal to 4.1mmoL/L and/or HDL-C concentration less than or equal to 1mmoL/L and/ortriglyceride concentrationmore than or equal to 1.71mmoL/L[24]. MetS was defined according to NCEP-ATP III 2001definition [6], IDF 2005 definition [7], and JIS 2009 definition[8] (Table 7).
2.5. Statistical Analysis. Statistical analyses were performedby SPSS version 16. The quantitative results were reported asmeans ± SD and were compared by Student’s 𝑡-test to equalvariance if the distribution is Gaussian; if the distributionis not Gaussian, the quantitative results were reported asmedian [min–max] and comparedby the nonparametric test;Mann-Whitney 𝑈 test is used. The qualitative variables havebeen compared by the test of Chi deux and were expressedin effective (𝑛) and in percentage (%). The MetS prevalence,according to the three used definitions, has been measuredafter adjustment according to the class of age and sex andthe weights of these different strata in the structure of thepopulation, according to the population census in 2004(http://www.tunisie-statistiques.tn). A 𝑃 value of <0.05 wasconsidered statistically significant for all tests.
3. Results
3.1. Sociodemographic and Clinical Characteristics. 1441 sub-jects completed the interview. We excluded 320 peoplewho did not complete physical examination and/or biologicspecimen collection. We thus included 1121 participants withcomplete data in this analysis.The study was approved by theMedicalHospital EthicCommittee and informed consentwasobtained from all study subjects.
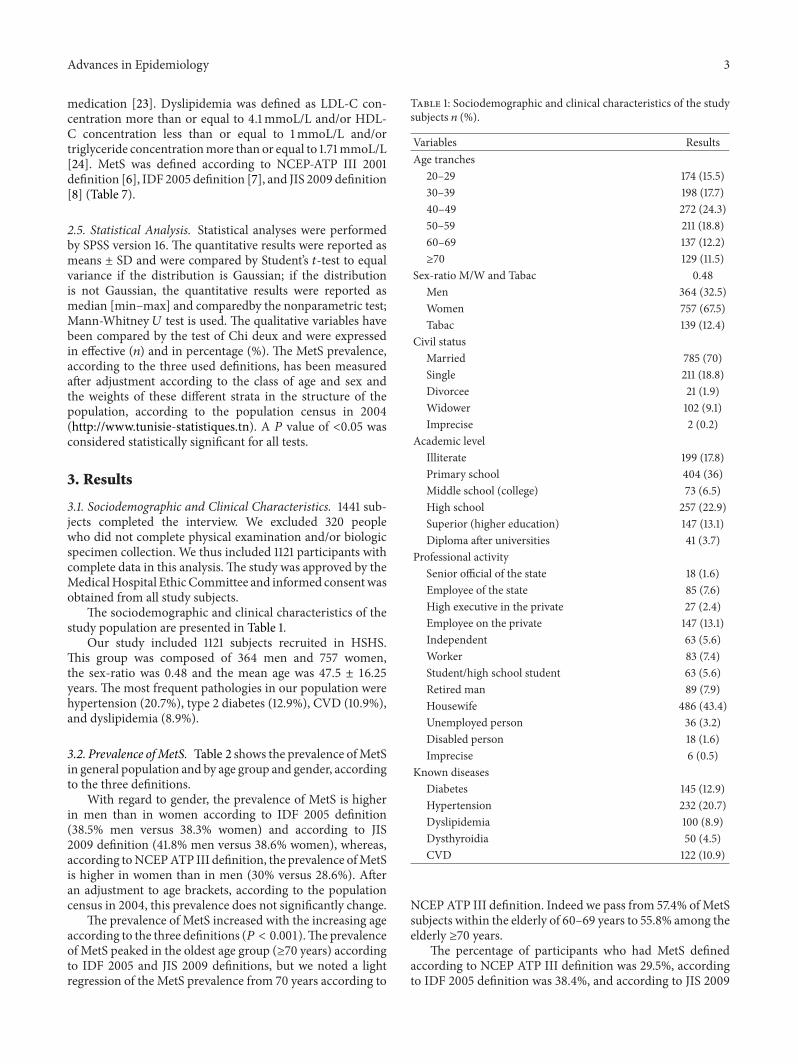
The sociodemographic and clinical characteristics of thestudy population are presented in Table 1.
Our study included 1121 subjects recruited in HSHS.This group was composed of 364 men and 757 women,the sex-ratio was 0.48 and the mean age was 47.5 ± 16.25years. The most frequent pathologies in our population werehypertension (20.7%), type 2 diabetes (12.9%), CVD (10.9%),and dyslipidemia (8.9%).
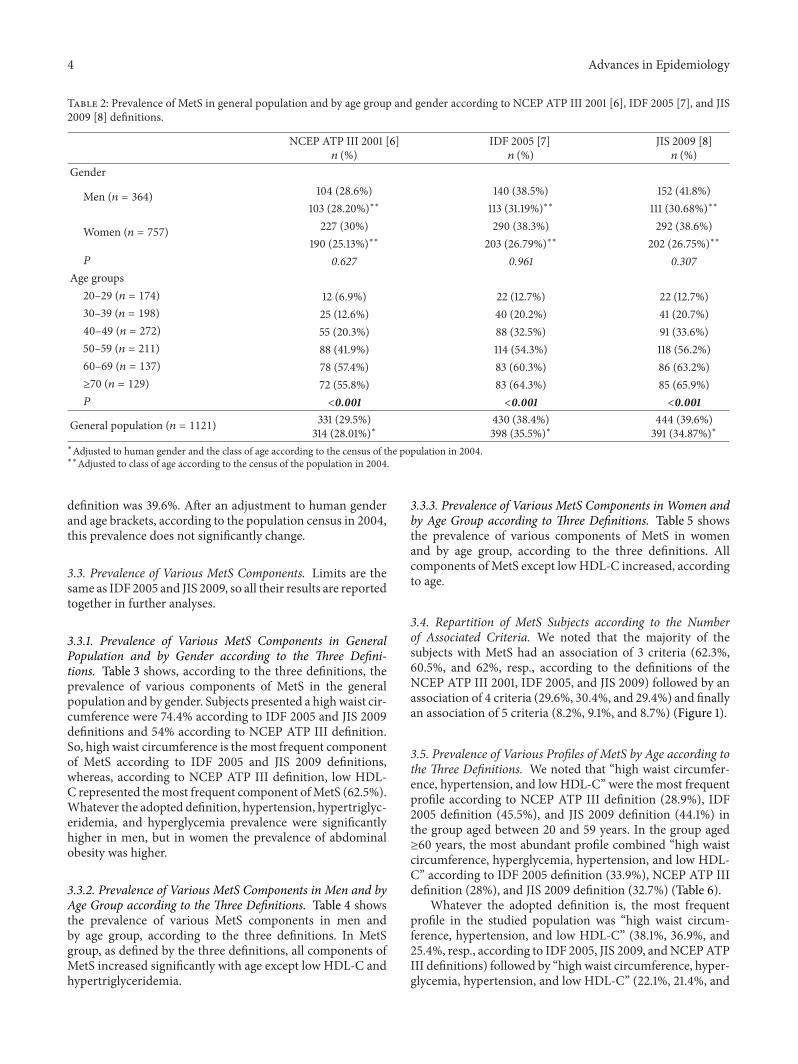
3.2. Prevalence ofMetS. Table 2 shows the prevalence ofMetSin general population and by age group and gender, accordingto the three definitions.
With regard to gender, the prevalence of MetS is higherin men than in women according to IDF 2005 definition(38.5% men versus 38.3% women) and according to JIS2009 definition (41.8% men versus 38.6% women), whereas,according toNCEPATP III definition, the prevalence ofMetSis higher in women than in men (30% versus 28.6%). Afteran adjustment to age brackets, according to the populationcensus in 2004, this prevalence does not significantly change.
The prevalence of MetS increased with the increasing ageaccording to the three definitions (𝑃 < 0.001).The prevalenceof MetS peaked in the oldest age group (≥70 years) accordingto IDF 2005 and JIS 2009 definitions, but we noted a lightregression of the MetS prevalence from 70 years according to
Table 1: Sociodemographic and clinical characteristics of the studysubjects 𝑛 (%).
Variables ResultsAge tranches
20–29 174 (15.5)30–39 198 (17.7)40–49 272 (24.3)50–59 211 (18.8)60–69 137 (12.2)≥70 129 (11.5)
Sex-ratio M/W and Tabac 0.48Men 364 (32.5)Women 757 (67.5)Tabac 139 (12.4)
Civil statusMarried 785 (70)Single 211 (18.8)Divorcee 21 (1.9)Widower 102 (9.1)Imprecise 2 (0.2)
Academic levelIlliterate 199 (17.8)Primary school 404 (36)Middle school (college) 73 (6.5)High school 257 (22.9)Superior (higher education) 147 (13.1)Diploma after universities 41 (3.7)
Professional activitySenior official of the state 18 (1.6)Employee of the state 85 (7.6)High executive in the private 27 (2.4)Employee on the private 147 (13.1)Independent 63 (5.6)Worker 83 (7.4)Student/high school student 63 (5.6)Retired man 89 (7.9)Housewife 486 (43.4)Unemployed person 36 (3.2)Disabled person 18 (1.6)Imprecise 6 (0.5)
Known diseasesDiabetes 145 (12.9)Hypertension 232 (20.7)Dyslipidemia 100 (8.9)Dysthyroidia 50 (4.5)CVD 122 (10.9)
NCEP ATP III definition. Indeed we pass from 57.4% ofMetSsubjects within the elderly of 60–69 years to 55.8% among theelderly ≥70 years.
The percentage of participants who had MetS definedaccording to NCEP ATP III definition was 29.5%, accordingto IDF 2005 definition was 38.4%, and according to JIS 2009
4 Advances in Epidemiology
Table 2: Prevalence of MetS in general population and by age group and gender according to NCEP ATP III 2001 [6], IDF 2005 [7], and JIS2009 [8] definitions.
NCEP ATP III 2001 [6]𝑛 (%)
IDF 2005 [7]𝑛 (%)
JIS 2009 [8]𝑛 (%)
Gender
Men (𝑛 = 364) 104 (28.6%) 140 (38.5%) 152 (41.8%)103 (28.20%)∗∗ 113 (31.19%)∗∗ 111 (30.68%)∗∗
Women (𝑛 = 757) 227 (30%) 290 (38.3%) 292 (38.6%)190 (25.13%)∗∗ 203 (26.79%)∗∗ 202 (26.75%)∗∗
𝑃 0.627 0.961 0.307Age groups
20–29 (𝑛 = 174) 12 (6.9%) 22 (12.7%) 22 (12.7%)30–39 (𝑛 = 198) 25 (12.6%) 40 (20.2%) 41 (20.7%)40–49 (𝑛 = 272) 55 (20.3%) 88 (32.5%) 91 (33.6%)50–59 (𝑛 = 211) 88 (41.9%) 114 (54.3%) 118 (56.2%)60–69 (𝑛 = 137) 78 (57.4%) 83 (60.3%) 86 (63.2%)≥70 (𝑛 = 129) 72 (55.8%) 83 (64.3%) 85 (65.9%)𝑃 <0.001 <0.001 <0.001
General population (𝑛 = 1121) 331 (29.5%)314 (28.01%)∗
430 (38.4%)398 (35.5%)∗
444 (39.6%)391 (34.87%)∗
∗Adjusted to human gender and the class of age according to the census of the population in 2004.∗∗Adjusted to class of age according to the census of the population in 2004.
definition was 39.6%. After an adjustment to human genderand age brackets, according to the population census in 2004,this prevalence does not significantly change.
3.3. Prevalence of Various MetS Components. Limits are thesame as IDF 2005 and JIS 2009, so all their results are reportedtogether in further analyses.
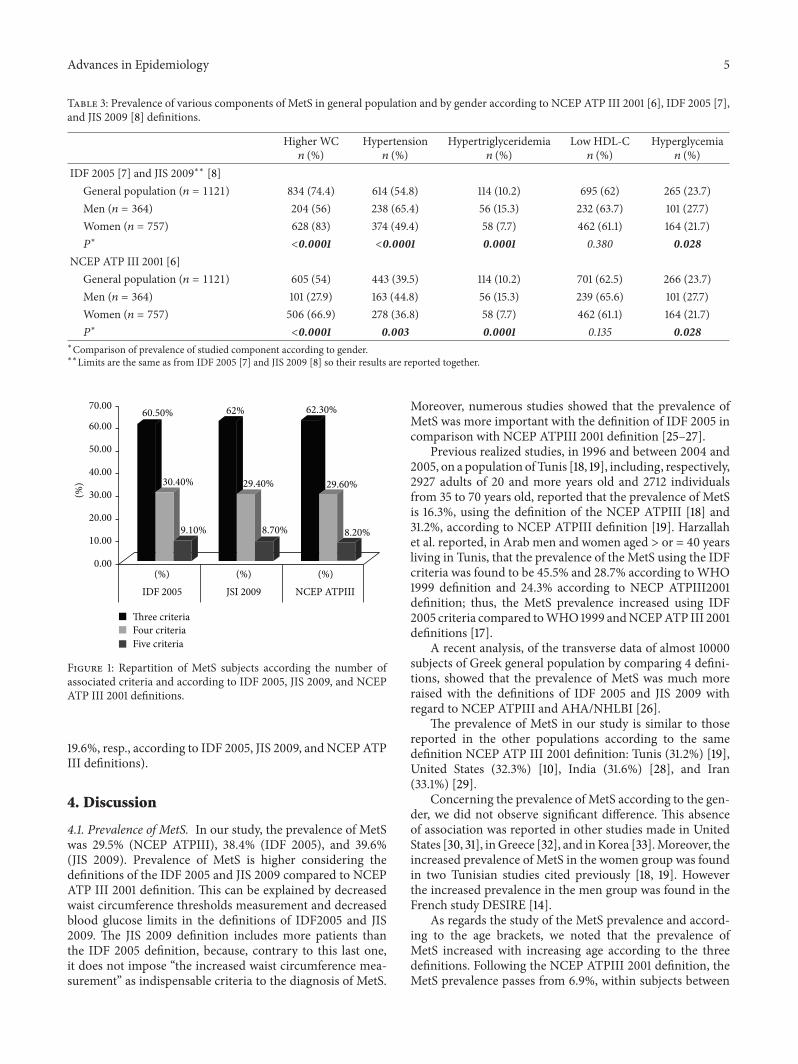
3.3.1. Prevalence of Various MetS Components in GeneralPopulation and by Gender according to the Three Defini-tions. Table 3 shows, according to the three definitions, theprevalence of various components of MetS in the generalpopulation and by gender. Subjects presented a highwaist cir-cumference were 74.4% according to IDF 2005 and JIS 2009definitions and 54% according to NCEP ATP III definition.So, high waist circumference is the most frequent componentof MetS according to IDF 2005 and JIS 2009 definitions,whereas, according to NCEP ATP III definition, low HDL-C represented themost frequent component ofMetS (62.5%).Whatever the adopted definition, hypertension, hypertriglyc-eridemia, and hyperglycemia prevalence were significantlyhigher in men, but in women the prevalence of abdominalobesity was higher.
3.3.2. Prevalence of Various MetS Components in Men and byAge Group according to the Three Definitions. Table 4 showsthe prevalence of various MetS components in men andby age group, according to the three definitions. In MetSgroup, as defined by the three definitions, all components ofMetS increased significantly with age except low HDL-C andhypertriglyceridemia.
3.3.3. Prevalence of Various MetS Components in Women andby Age Group according to Three Definitions. Table 5 showsthe prevalence of various components of MetS in womenand by age group, according to the three definitions. Allcomponents ofMetS except lowHDL-C increased, accordingto age.
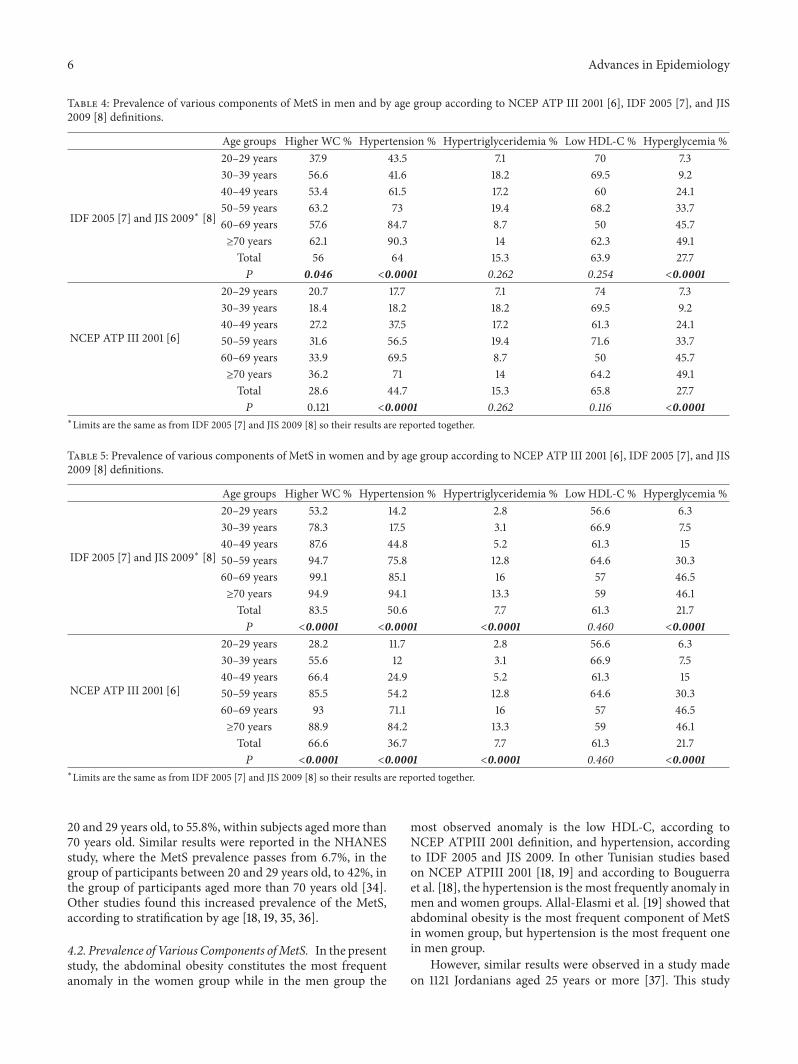
3.4. Repartition of MetS Subjects according to the Numberof Associated Criteria. We noted that the majority of thesubjects with MetS had an association of 3 criteria (62.3%,60.5%, and 62%, resp., according to the definitions of theNCEP ATP III 2001, IDF 2005, and JIS 2009) followed by anassociation of 4 criteria (29.6%, 30.4%, and 29.4%) and finallyan association of 5 criteria (8.2%, 9.1%, and 8.7%) (Figure 1).
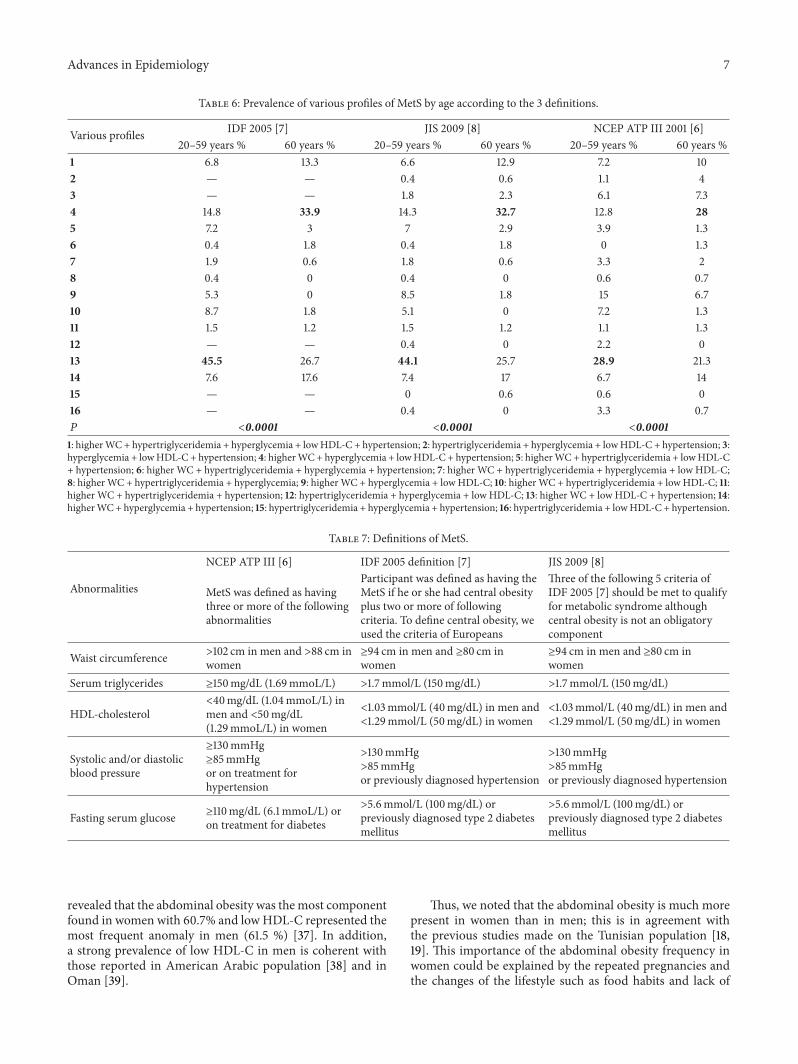
3.5. Prevalence of Various Profiles of MetS by Age according tothe Three Definitions. We noted that “high waist circumfer-ence, hypertension, and low HDL-C” were the most frequentprofile according to NCEP ATP III definition (28.9%), IDF2005 definition (45.5%), and JIS 2009 definition (44.1%) inthe group aged between 20 and 59 years. In the group aged≥60 years, the most abundant profile combined “high waistcircumference, hyperglycemia, hypertension, and low HDL-C” according to IDF 2005 definition (33.9%), NCEP ATP IIIdefinition (28%), and JIS 2009 definition (32.7%) (Table 6).
Whatever the adopted definition is, the most frequentprofile in the studied population was “high waist circum-ference, hypertension, and low HDL-C” (38.1%, 36.9%, and25.4%, resp., according to IDF 2005, JIS 2009, andNCEPATPIII definitions) followed by “high waist circumference, hyper-glycemia, hypertension, and low HDL-C” (22.1%, 21.4%, and
Advances in Epidemiology 5
Table 3: Prevalence of various components of MetS in general population and by gender according to NCEP ATP III 2001 [6], IDF 2005 [7],and JIS 2009 [8] definitions.
Higher WC𝑛 (%)
Hypertension𝑛 (%)
Hypertriglyceridemia𝑛 (%)
Low HDL-C𝑛 (%)
Hyperglycemia𝑛 (%)
IDF 2005 [7] and JIS 2009∗∗ [8]General population (𝑛 = 1121) 834 (74.4) 614 (54.8) 114 (10.2) 695 (62) 265 (23.7)Men (𝑛 = 364) 204 (56) 238 (65.4) 56 (15.3) 232 (63.7) 101 (27.7)Women (𝑛 = 757) 628 (83) 374 (49.4) 58 (7.7) 462 (61.1) 164 (21.7)𝑃∗
<0.0001 <0.0001 0.0001 0.380 0.028NCEP ATP III 2001 [6]
General population (𝑛 = 1121) 605 (54) 443 (39.5) 114 (10.2) 701 (62.5) 266 (23.7)Men (𝑛 = 364) 101 (27.9) 163 (44.8) 56 (15.3) 239 (65.6) 101 (27.7)Women (𝑛 = 757) 506 (66.9) 278 (36.8) 58 (7.7) 462 (61.1) 164 (21.7)𝑃∗
<0.0001 0.003 0.0001 0.135 0.028∗Comparison of prevalence of studied component according to gender.∗∗Limits are the same as from IDF 2005 [7] and JIS 2009 [8] so their results are reported together.
0.00
10.00
20.00
30.00
40.00
50.00
60.00
70.00
(%) (%) (%)IDF 2005 JSI 2009 NCEP ATPIII
60.50% 62% 62.30%
30.40% 29.40% 29.60%
9.10% 8.70% 8.20%
Three criteriaFour criteriaFive criteria
(%)
Figure 1: Repartition of MetS subjects according the number ofassociated criteria and according to IDF 2005, JIS 2009, and NCEPATP III 2001 definitions.
19.6%, resp., according to IDF 2005, JIS 2009, and NCEPATPIII definitions).
4. Discussion
4.1. Prevalence of MetS. In our study, the prevalence of MetSwas 29.5% (NCEP ATPIII), 38.4% (IDF 2005), and 39.6%(JIS 2009). Prevalence of MetS is higher considering thedefinitions of the IDF 2005 and JIS 2009 compared to NCEPATP III 2001 definition. This can be explained by decreasedwaist circumference thresholds measurement and decreasedblood glucose limits in the definitions of IDF2005 and JIS2009. The JIS 2009 definition includes more patients thanthe IDF 2005 definition, because, contrary to this last one,it does not impose “the increased waist circumference mea-surement” as indispensable criteria to the diagnosis of MetS.
Moreover, numerous studies showed that the prevalence ofMetS was more important with the definition of IDF 2005 incomparison with NCEP ATPIII 2001 definition [25–27].
Previous realized studies, in 1996 and between 2004 and2005, on a population of Tunis [18, 19], including, respectively,2927 adults of 20 and more years old and 2712 individualsfrom 35 to 70 years old, reported that the prevalence of MetSis 16.3%, using the definition of the NCEP ATPIII [18] and31.2%, according to NCEP ATPIII definition [19]. Harzallahet al. reported, in Arab men and women aged > or = 40 yearsliving in Tunis, that the prevalence of the MetS using the IDFcriteria was found to be 45.5% and 28.7% according toWHO1999 definition and 24.3% according to NECP ATPIII2001definition; thus, the MetS prevalence increased using IDF2005 criteria compared toWHO1999 andNCEPATP III 2001definitions [17].
A recent analysis, of the transverse data of almost 10000subjects of Greek general population by comparing 4 defini-tions, showed that the prevalence of MetS was much moreraised with the definitions of IDF 2005 and JIS 2009 withregard to NCEP ATPIII and AHA/NHLBI [26].
The prevalence of MetS in our study is similar to thosereported in the other populations according to the samedefinition NCEP ATP III 2001 definition: Tunis (31.2%) [19],United States (32.3%) [10], India (31.6%) [28], and Iran(33.1%) [29].
Concerning the prevalence of MetS according to the gen-der, we did not observe significant difference. This absenceof association was reported in other studies made in UnitedStates [30, 31], inGreece [32], and inKorea [33].Moreover, theincreased prevalence of MetS in the women group was foundin two Tunisian studies cited previously [18, 19]. Howeverthe increased prevalence in the men group was found in theFrench study DESIRE [14].
As regards the study of the MetS prevalence and accord-ing to the age brackets, we noted that the prevalence ofMetS increased with increasing age according to the threedefinitions. Following the NCEP ATPIII 2001 definition, theMetS prevalence passes from 6.9%, within subjects between
6 Advances in Epidemiology
Table 4: Prevalence of various components of MetS in men and by age group according to NCEP ATP III 2001 [6], IDF 2005 [7], and JIS2009 [8] definitions.
Age groups Higher WC % Hypertension % Hypertriglyceridemia % Low HDL-C % Hyperglycemia %
IDF 2005 [7] and JIS 2009∗ [8]
20–29 years 37.9 43.5 7.1 70 7.330–39 years 56.6 41.6 18.2 69.5 9.240–49 years 53.4 61.5 17.2 60 24.150–59 years 63.2 73 19.4 68.2 33.760–69 years 57.6 84.7 8.7 50 45.7≥70 years 62.1 90.3 14 62.3 49.1Total 56 64 15.3 63.9 27.7𝑃 0.046 <0.0001 0.262 0.254 <0.0001
NCEP ATP III 2001 [6]
20–29 years 20.7 17.7 7.1 74 7.330–39 years 18.4 18.2 18.2 69.5 9.240–49 years 27.2 37.5 17.2 61.3 24.150–59 years 31.6 56.5 19.4 71.6 33.760–69 years 33.9 69.5 8.7 50 45.7≥70 years 36.2 71 14 64.2 49.1Total 28.6 44.7 15.3 65.8 27.7𝑃 0.121 <0.0001 0.262 0.116 <0.0001
∗Limits are the same as from IDF 2005 [7] and JIS 2009 [8] so their results are reported together.
Table 5: Prevalence of various components of MetS in women and by age group according to NCEP ATP III 2001 [6], IDF 2005 [7], and JIS2009 [8] definitions.
Age groups Higher WC % Hypertension % Hypertriglyceridemia % Low HDL-C % Hyperglycemia %
IDF 2005 [7] and JIS 2009∗ [8]
20–29 years 53.2 14.2 2.8 56.6 6.330–39 years 78.3 17.5 3.1 66.9 7.540–49 years 87.6 44.8 5.2 61.3 1550–59 years 94.7 75.8 12.8 64.6 30.360–69 years 99.1 85.1 16 57 46.5≥70 years 94.9 94.1 13.3 59 46.1Total 83.5 50.6 7.7 61.3 21.7𝑃 <0.0001 <0.0001 <0.0001 0.460 <0.0001
NCEP ATP III 2001 [6]
20–29 years 28.2 11.7 2.8 56.6 6.330–39 years 55.6 12 3.1 66.9 7.540–49 years 66.4 24.9 5.2 61.3 1550–59 years 85.5 54.2 12.8 64.6 30.360–69 years 93 71.1 16 57 46.5≥70 years 88.9 84.2 13.3 59 46.1Total 66.6 36.7 7.7 61.3 21.7𝑃 <0.0001 <0.0001 <0.0001 0.460 <0.0001
∗Limits are the same as from IDF 2005 [7] and JIS 2009 [8] so their results are reported together.
20 and 29 years old, to 55.8%, within subjects aged more than70 years old. Similar results were reported in the NHANESstudy, where the MetS prevalence passes from 6.7%, in thegroup of participants between 20 and 29 years old, to 42%, inthe group of participants aged more than 70 years old [34].Other studies found this increased prevalence of the MetS,according to stratification by age [18, 19, 35, 36].
4.2. Prevalence of Various Components ofMetS. In the presentstudy, the abdominal obesity constitutes the most frequentanomaly in the women group while in the men group the
most observed anomaly is the low HDL-C, according toNCEP ATPIII 2001 definition, and hypertension, accordingto IDF 2005 and JIS 2009. In other Tunisian studies basedon NCEP ATPIII 2001 [18, 19] and according to Bouguerraet al. [18], the hypertension is the most frequently anomaly inmen and women groups. Allal-Elasmi et al. [19] showed thatabdominal obesity is the most frequent component of MetSin women group, but hypertension is the most frequent onein men group.
However, similar results were observed in a study madeon 1121 Jordanians aged 25 years or more [37]. This study
Advances in Epidemiology 7
Table 6: Prevalence of various profiles of MetS by age according to the 3 definitions.
Various profiles IDF 2005 [7] JIS 2009 [8] NCEP ATP III 2001 [6]20–59 years % 60 years % 20–59 years % 60 years % 20–59 years % 60 years %
1 6.8 13.3 6.6 12.9 7.2 102 — — 0.4 0.6 1.1 43 — — 1.8 2.3 6.1 7.34 14.8 33.9 14.3 32.7 12.8 285 7.2 3 7 2.9 3.9 1.36 0.4 1.8 0.4 1.8 0 1.37 1.9 0.6 1.8 0.6 3.3 28 0.4 0 0.4 0 0.6 0.79 5.3 0 8.5 1.8 15 6.710 8.7 1.8 5.1 0 7.2 1.311 1.5 1.2 1.5 1.2 1.1 1.312 — — 0.4 0 2.2 013 45.5 26.7 44.1 25.7 28.9 21.314 7.6 17.6 7.4 17 6.7 1415 — — 0 0.6 0.6 016 — — 0.4 0 3.3 0.7𝑃 <0.0001 <0.0001 <0.00011: higherWC+ hypertriglyceridemia + hyperglycemia + lowHDL-C + hypertension; 2: hypertriglyceridemia + hyperglycemia + lowHDL-C + hypertension; 3:hyperglycemia + lowHDL-C + hypertension; 4: higherWC+ hyperglycemia + lowHDL-C + hypertension; 5: higherWC+ hypertriglyceridemia + lowHDL-C+ hypertension; 6: higher WC + hypertriglyceridemia + hyperglycemia + hypertension; 7: higher WC + hypertriglyceridemia + hyperglycemia + low HDL-C;8: higherWC + hypertriglyceridemia + hyperglycemia; 9: higherWC + hyperglycemia + low HDL-C; 10: higherWC + hypertriglyceridemia + low HDL-C; 11:higher WC + hypertriglyceridemia + hypertension; 12: hypertriglyceridemia + hyperglycemia + low HDL-C; 13: higher WC + low HDL-C + hypertension; 14:higherWC+ hyperglycemia + hypertension; 15: hypertriglyceridemia + hyperglycemia + hypertension; 16: hypertriglyceridemia + lowHDL-C + hypertension.
Table 7: Definitions of MetS.
Abnormalities
NCEP ATP III [6] IDF 2005 definition [7] JIS 2009 [8]
MetS was defined as havingthree or more of the followingabnormalities
Participant was defined as having theMetS if he or she had central obesityplus two or more of followingcriteria. To define central obesity, weused the criteria of Europeans
Three of the following 5 criteria ofIDF 2005 [7] should be met to qualifyfor metabolic syndrome althoughcentral obesity is not an obligatorycomponent
Waist circumference >102 cm in men and >88 cm inwomen
≥94 cm in men and ≥80 cm inwomen
≥94 cm in men and ≥80 cm inwomen
Serum triglycerides ≥150mg/dL (1.69mmoL/L) >1.7mmol/L (150mg/dL) >1.7mmol/L (150mg/dL)
HDL-cholesterol<40mg/dL (1.04mmoL/L) inmen and <50mg/dL(1.29mmoL/L) in women
<1.03mmol/L (40mg/dL) in men and<1.29mmol/L (50mg/dL) in women
<1.03mmol/L (40mg/dL) in men and<1.29mmol/L (50mg/dL) in women
Systolic and/or diastolicblood pressure
≥130mmHg≥85mmHgor on treatment forhypertension
>130mmHg>85mmHgor previously diagnosed hypertension
>130mmHg>85mmHgor previously diagnosed hypertension
Fasting serum glucose ≥110mg/dL (6.1mmoL/L) oron treatment for diabetes
>5.6mmol/L (100mg/dL) orpreviously diagnosed type 2 diabetesmellitus
>5.6mmol/L (100mg/dL) orpreviously diagnosed type 2 diabetesmellitus
revealed that the abdominal obesity was themost componentfound in women with 60.7% and lowHDL-C represented themost frequent anomaly in men (61.5 %) [37]. In addition,a strong prevalence of low HDL-C in men is coherent withthose reported in American Arabic population [38] and inOman [39].
Thus, we noted that the abdominal obesity is much morepresent in women than in men; this is in agreement withthe previous studies made on the Tunisian population [18,19]. This importance of the abdominal obesity frequency inwomen could be explained by the repeated pregnancies andthe changes of the lifestyle such as food habits and lack of
8 Advances in Epidemiology
physical and sports activities in Tunisian women [16]. In fact,in Tunisia, there is a passage from the traditional food habitswith a food rich in cereal, fruits, and vegetables to food rich inanimal products with high quantities of saturated fatty acids[40].
Furthermore, studies made in the other Arabic popu-lations showed an increased frequency of the abdominalobesity inwomen. Indeed, a studymade onMoroccanwomenshowed that 75% of those women presented an abdominalobesity [41]. Al-Lawati et al., in the Omani population,reported that prevalence of abdominal obesity was moreraised in woman (44.3%) than in men (4.7%) [36]. In France,according to the DESIRE study, abdominal obesity is notthe frequent compound, but it stays all the same, higher inwomen (13.3%) than in men (7.9%) [14].
By stratification according to gender and age group,we also noted that the prevalence of abdominal obesity,hypertension, and hyperglycemia increased significantly withthe age in men, while in women all MetS components, exceptlow HDL-C, increased significantly with the age.
Khader et al. [37] also observed in Jordanian men thatabdominal obesity, hypertension, and hyperglycemia werethe only components which increased significantly withthe age. In addition, many studies suggested that all thecomponents of MetS were significantly more frequent in thegroup aged more than 40 years compared to the group aged<40 years, independently of the sex [14, 18, 30, 34, 40].
4.3. Prevalence of the Metabolic Syndrome according to theNumber of Associated Criteria. In our study and accordingto the three definitions, the MetS subjects were mainlyrepresented by an association with 3 criteria, followed by 4criteria, and finally by an association of 5 criteria. Our resultsconcurred to the study of Hanefeld et al., in a diabetic type 2population, who showed that 35.3%, 27.2%, and 4.4% of thesubjects had an association of 3, 4, and 5 criteria of MetS,defined by AHA/NHBLI definition [42].The study GEMCASrealized in Germany showed that 66%, 27.6%, and 6% inmenand 64%, 28%, and 8% in women present, respectively, 3, 4,and 5 criteria of MetS [43]. In Tunisia, a study, concerning 90diabetic patients aged more than 40 years old, showed that46.7% of those with MetS had an association of 4 criteriaand only 8% of the patients presented all the criteria of MetS,according to IDF 2005 definition [44].
4.4. Prevalence of Various Profiles of MetS. According to thethree definitions of MetS, the most frequent profile in ourstudy is “higher WC, hypertension, and low HDL-C” Afterstratification our population according to gender, we notedthe same results, whereas the most frequent profile changeby stratification according to age and becomes “higher WC,hyperglycemia, hypertension, and lowHDL-C” in group aged≥60 years.
This difference can be explained by the decrease of theinsulin secretion and the increase of insulin resistance in theskeletal muscle of the elderly [45], so higher frequency of thehyperglycemia was observed in subjects aged more than 60years.
A recent study, realized on a German population usingthe AHA/NHLBI definition, found that the most frequentprofile of MetS was “higher WC, hypertension, and lowHDL-C” (28%). They also demonstrated that the profilesvaried according to age and gender. In fact, the most fre-quent profile in young men was “higher WC, hypertension,and hypertriglyceridemia,” while in young women it was“higher WC, hypertension, and low HDL-C.” Within theelderly and among both genders the most frequent profilewas “higher WC, hypertension, and hyperglycemia” [43]. Inaddition, Thanopoulou et al. showed that the most frequentprofile of MetS in 5 populations living in different countries(Algeria, Bulgaria, Egypt, Italy, and Greece) was “higherWC,hypertension, and low HDL-C” [46]. Furthermore, Van DenHooven et al. contradicted our results; they reported that themost frequent profile ofMetS was “higherWC, hypertension,and hypertriglyceridemia” (43.7 %) in 500 patients between40 and 60 years old [47].
Our study has several limitations, including the smallsample size, because we have many absent subjects in theday of the collects. The study was led in an urban area whichmade it difficult to compare the MetS prevalence with thosefound in rural areas and consequently the extrapolation ofour results to populations living in rural areas. The call for arandom sample of the households ends in the compositionof a population of study, with feminine ascendancy andessentially old persons. We may have underestimated theMetS prevalence because we excluded, from analysis, peoplewith incomplete data; those were more likely to be lowincome or overweight.
5. Conclusion
We noted a higher prevalence of MetS in our population,where it passes from 29.5% (NCEP ATPII) to 39.6% (JIS2009). This prevalence increases with age and does not seemto depend on the gender. Moreover, a significant difference inthe prevalence ofMetS components, according to gender, wasobserved. Indeed, the abdominal obesity is the most frequentMetS compound in women but hypertension and low HDL-C are the most frequent one in men. In addition, accordingto the three definitions of MetS, the most frequent profile inour study is “higher WC, hypertension, and low HDL-C.”
Conflict of Interests
The authors declare that there is no conflict of interestsregarding the publication of this paper.
Acknowledgments
The Medical Ethic Committee approved the present study,and all participants gave written informed consent. Theauthors are especially grateful to the study participants. Theyacknowledge the excellent technical assistance of personalmembers of Biochemistry and Cardiology Department. Thisstudy was supported by grants from the Tunisian Ministryof Higher Education, Scientific Research and Technology,
Advances in Epidemiology 9
Sahloul University Hospital, the Ministry of Health (LR12SP11), and Hammam-Sousse municipality. Without theirextremely generous and strong support, this project wouldnot have happened.
References
[1] P. W. F. Wilson, W. B. Kannel, H. Silbershatz, and R. B.D’Agostino, “Clustering ofmetabolic factors and coronary heartdisease,” Archives of Internal Medicine, vol. 159, no. 10, pp. 1104–1109, 1999.
[2] H. Iso, S. Sato, A. Kitamura et al., “Metabolic syndrome and therisk of ischemic heart disease and stroke among Japanese menand women,” Stroke, vol. 38, no. 6, pp. 1744–1751, 2007.
[3] B. Isomaa, P. Almgren, T. Tuomi et al., “Cardiovascular mor-bidity and mortality associated with the metabolic syndrome,”Diabetes Care, vol. 24, no. 4, pp. 683–689, 2001.
[4] S. M. Grundy, J. I. Cleeman, S. R. Daniels et al., “Diagnosis andmanagement of the metabolic syndrome: an American HeartAssociation/NationalHeart, Lung, andBlood Institute scientificstatement,” Circulation, vol. 112, no. 17, pp. 2735–2752, 2005.
[5] E. S. Ford, “Prevalence of the metabolic syndrome defined bythe international diabetes federation among adults in the U.S.,”Diabetes Care, vol. 28, no. 11, pp. 2745–2749, 2005.
[6] “Executive Summary of the Third Report of the NationalCholesterol Education Program (NCEP) Expert Panel onDetection, Evaluation, and Treatment of High Blood Choles-terol in Adults (Adult Treatment Panel III),” The Journal of theAmerican Medical Association, vol. 285, no. 19, pp. 2486–2497,2001.
[7] K. G. M. M. Alberti, P. Zimmet, and J. Shaw, “The metabolicsyndrome—a new worldwide definition,” The Lancet, vol. 366,no. 9491, pp. 1059–1062, 2005.
[8] K. G. M. M. Alberti, R. H. Eckel, S. M. Grundy et al., “Har-monizing the metabolic syndrome: a joint interim statement ofthe international diabetes federation task force on epidemiologyand prevention; national heart, lung, and blood institute; Amer-ican heart association; world heart federation; internationalatherosclerosis society; and international association for thestudy of obesity,” Circulation, vol. 120, no. 16, pp. 1640–1645,2009.
[9] R. H. Eckel, S. M. Grundy, and P. Z. Zimmet, “The metabolicsyndrome,”The Lancet, vol. 365, no. 9468, pp. 1415–1428, 2005.
[10] E. S. Ford, W. H. Giles, and A. H. Mokdad, “Increasingprevalence of the metabolic syndrome among U.S. adults,”Diabetes Care, vol. 27, no. 10, pp. 2444–2449, 2004.
[11] R. Gupta, P. C. Deedwania, A. Gupta, S. Rastogi, R. B. Panwar,and K. Kothari, “Prevalence du syndrome metabolique dansune population indienne urbaine,” International Journal ofCardiology, vol. 97, pp. 257–261, 2004.
[12] F. Azizi, P. Salehi, A. Etemadi, and S. Zahedi-Asl, “Prevalencedu syndrome metabolique dans une population urbaine: deslipides et du glucoseTeheran etude,” Diabetes Research andClinical Practice, vol. 61, pp. 29–37, 2003.
[13] Q. Qiao, J. Pitkaniemi, J. Tuomilehto et al., “Comparison ofdifferent definitions of the metabolic syndrome in relationto cardiovascular mortality in European men and women,”Diabetologia, vol. 49, no. 12, pp. 2837–2846, 2006.
[14] B. Balkau, M. Vernay, L. Mhamdi et al., “The incidenceand persistence of the NCEP (National Cholesterol EducationProgram) metabolic syndrome. The French D.E.S.I.R. study,”Diabetes & Metabolism, vol. 29, pp. 526–532, 2003.
[15] R. B. Ervin, “Prevalence of metabolic syndrome among adults20 years of age and over, by sex, age, race and ethnicity, andbody mass index: United States, 2003–2006,” National HealthStatistics Reports 13, National Center for Health Statistics, 2009.
[16] H. Ben Romdhane, H.Haouala, A. Belhani et al., “Epidemiolog-ical transition and health impact in Tunisia,” Tunisie Medicale,vol. 83, no. 5, pp. 1–7, 2005.
[17] F. Harzallah, H. Alberti, and F. Ben Khalifa, “The metabolicsyndrome in an Arab population: a first look at the newInternational Diabetes Federation criteria,” Diabetic Medicine,vol. 23, no. 4, pp. 441–444, 2006.
[18] R. Bouguerra, L. Ben Salem, H. Alberti et al., “Prevalence ofmetabolic abnormalities in the Tunisian adults: a populationbased study,” Diabetes and Metabolism, vol. 32, no. 3, pp. 215–221, 2006.
[19] M. Allal-Elasmi, S. Haj Taieb, M. Hsairi et al., “The metabolicsyndrome: prevalence, main characteristics and associationwith socio-economic status in adults living in Great Tunis,”Diabetes & Metabolism, vol. 36, no. 3, pp. 204–208, 2010.
[20] R. Magnani, Sampling Guide: IMPACT Food Security andNutrition Monitoring Project, ISTI, Arlington, Va, USA, 1997.
[21] W. T. Friedewald, R. I. Levy, and D. S. Fredrickson, “Estimationof the concentration of low-density lipoprotein cholesterol inplasma without use of the preparative ultracentrifuge,” ClinicalChemistry, vol. 18, no. 6, pp. 499–502, 1972.
[22] K. G. Alberti and P. Z. Zimmet, “Definition, diagnosis andclassification of diabetes mellitus and its complications. Part1: diagnosis and classification of diabetes mellitus provisionalreport of a WHO consultation,” Diabetic Medicine, vol. 15, pp.539–553, 1998.
[23] A. V. Chobanian, G. L. Bakris, H. R. Black et al., “The seventhreport of the joint national committee on prevention, detection,evaluation, and treatment of high blood pressure: the JNC 7report,” The Journal of the American Medical Association, vol.289, no. 19, pp. 2560–2572, 2003.
[24] Expert Panel on Detection, Evaluation, and Treatment of HighBlood Cholesterol in Adults, “Executive summary of The thirdreport of The national cholesterol education program (NCEP)expert panel on detection, evaluation, and treatment of highblood cholesterol in adults (Adult Treatment Panel III),” TheJournal of the AmericanMedical Association, vol. 285, no. 19, pp.2486–2497, 2001.
[25] M. A. Cornier, D. Dabelea, T. L. Hernandez et al., “Themetabolic syndrome,” Endocrine Reviews, vol. 29, no. 7, pp. 777–822, 2008.
[26] V. G. Athyros, E. S. Ganotakis, K. Tziomalos et al., “Comparisonof four definitions of the metabolic syndrome in a Greek(Mediterranean) population,” Current Medical Research andOpinion, vol. 26, no. 3, pp. 713–719, 2010.
[27] E. Mannucci, M. Monami, G. Bardini, A. Ognibene, and C. M.Rotella, “National cholesterol educational program and inter-national diabetes federation diagnostic criteria for metabolicsyndrome in an Italian cohort: results from the FIBAR study,”Journal of Endocrinological Investigation, vol. 30, no. 11, pp. 925–930, 2007.
[28] R. Gupta, PC. Deedwania, A. Gupta, S. Rastogi, RB. Panwar,and K. Kothari, “Prevalence du syndrome metabolique dansune population indienne urbaine,” International Journal ofCardiology, vol. 97, pp. 257–261, 2004.
[29] F. Azizi, P. Salehi, A. Etemadi, and S. Zahedi-Asl, “Prevalencedu syndrome metabolique dans une population urbaine: des
10 Advances in Epidemiology
lipides et du glucose Teheran etude,” Diabetes Research andClinical Practice, vol. 61, pp. 29–37, 2003.
[30] E. S. Ford, W. H. Giles, and W. H. Dietz, “Prevalence of themetabolic syndrome among US adults: findings from theThirdNational Health and Nutrition Examination Survey,” Journal ofthe American Medical Association, vol. 287, no. 3, pp. 356–359,2002.
[31] B. Balkau, T. Drivsholm, K. Borch-Johnsen et al., “Frequencyof the WHO metabolic syndrome in European cohorts, andan alternative definition of an insulin resistance syndrome,”Diabetes & Metabolism, vol. 28, no. 5, pp. 364–376, 2002.
[32] V. G. Athyros, V. I. Bouloukos, A. N. Pehlivanidis et al., “Theprevalence of the metabolic syndrome in Greece: The MetS-Greece Multicentre Study,” Diabetes, Obesity and Metabolism,vol. 7, no. 4, pp. 397–405, 2005.
[33] H. S. Park, S. M. Kim, J. S. Lee et al., “Prevalence and trendsof metabolic syndrome in Korea: Korean national health andnutrition survey 1998–2001,” Diabetes, Obesity and Metabolism,vol. 9, no. 1, pp. 50–58, 2007.
[34] Y.W. Park, S. Zhu, L. Palaniappan, S. Heshka, M. R. Carnethon,and S. B. Heymsfield, “The metabolic syndrome: prevalenceand associated risk factor findings in the US population fromthe Third National Health and Nutrition Examination Survey,1988–1994,” Archives of Internal Medicine, vol. 163, pp. 427–436,2003.
[35] M. Ravikiran, A. Bhansali, P. RaviKumar et al., “Prevalence andrisk factors of metabolic syndrome among Asian Indians: acommunity survey,”Diabetes Research and Clinical Practice, vol.89, no. 2, pp. 181–188, 2010.
[36] J. A. Al-Lawati, A. J. Mohammed, H. Q. Al-Hinai, and P. Jousi-lahti, “Prevalence of the metabolic syndrome among Omaniadults,” Diabetes Care, vol. 26, no. 6, pp. 1781–1785, 2003.
[37] Y. Khader, A. Bateiha, M. El-Khateeb, A. Al-Shaikh, and K.Ajlouni, “High prevalence of the metabolic syndrome amongNorthern Jordanians,” Journal of Diabetes and Its Complications,vol. 21, no. 4, pp. 214–219, 2007.
[38] L. A. Jaber, M. B. Brown, A. Hammad, Q. Zhu, and W. H.Herman, “The prevalence ofthemetabolic syndrome amongArab Americans,” Diabetes Care, vol. 27, no. 1, pp. 234–238,2004.
[39] H. F. Abdul-Rahim, A. Husseini, E. Bjertness, R. Giacaman, N.H. Gordon, and J. Jervell, “Themetabolic syndrome in theWestBank population: an urban-rural comparison,” Diabetes Care,vol. 24, no. 2, pp. 275–279, 2001.
[40] H. Ghannem, “The challenge of preventing cardiovasculardisease in Tunisia,” Preventing Chronic Disease, vol. 3, articleA13, 2006.
[41] M. Rguibi and R. Belahsen, “Metabolic syndrome amongMoroccan Sahraoui adult women,” American Journal of HumanBiology, vol. 16, no. 5, pp. 598–601, 2004.
[42] M. Hanefeld, C. Koehler, S. Gallo, I. Benke, and P. Ott,“Impact of the individual components of the metabolic syn-drome and their different combinations on the prevalence ofatherosclerotic vascular disease in type 2 diabetes: the Diabetesin Germany (DIG) study,” Cardiovascular Diabetology, vol. 6,article 13, 2007.
[43] S. Moebus, C. Balijepalli, C. Losch et al., “Age- and sex-specificprevalence and ten-year risk for cardiovascular disease of all 16risk factor combinations of the metabolic syndrome—a cross-sectional study,” Cardiovascular Diabetology, vol. 9, article 34,2010.
[44] I. Ben Ammar, J. Ben Slimene, C. Hmida, F. Ben Mami, S.Dakhli, and A. Achour, “P84 prevalence et caracteristiques dusyndrome metabolique dans un groupe de patients diabetique,”Diabetes and Metabolism, vol. 35, article 48, 2009.
[45] A. J. Scheen, “Diabetes mellitus in the elderly: Insulin resistanceand/or impaired insulin secretion?” Diabetes and Metabolism,vol. 31, pp. S27–S34, 2005.
[46] A. Thanopoulou, B. Karamanos, F. Angelico et al., “Epi-demiological evidence for the non-random clustering of thecomponents of the metabolic syndrome: multicentre study ofthe Mediterranean group for the study of diabetes,” EuropeanJournal of Clinical Nutrition, vol. 60, no. 12, pp. 1376–1383, 2006.
[47] C. VanDenHooven, J. Ploemacher, andM.Godwin, “Metabolicsyndrome in a family practice population: prevalence andclinical characteristics,” Canadian Family Physician, vol. 52, no.8, pp. 982–983, 2006.

Submit your manuscripts athttp://www.hindawi.com
Stem CellsInternational
Hindawi Publishing Corporationhttp://www.hindawi.com Volume 2014
Hindawi Publishing Corporationhttp://www.hindawi.com Volume 2014
MEDIATORSINFLAMMATION
of
Hindawi Publishing Corporationhttp://www.hindawi.com Volume 2014
Behavioural Neurology
EndocrinologyInternational Journal of
Hindawi Publishing Corporationhttp://www.hindawi.com Volume 2014
Hindawi Publishing Corporationhttp://www.hindawi.com Volume 2014
Disease Markers
Hindawi Publishing Corporationhttp://www.hindawi.com Volume 2014
BioMed Research International
OncologyJournal of
Hindawi Publishing Corporationhttp://www.hindawi.com Volume 2014
Hindawi Publishing Corporationhttp://www.hindawi.com Volume 2014
Oxidative Medicine and Cellular Longevity
Hindawi Publishing Corporationhttp://www.hindawi.com Volume 2014
PPAR Research
The Scientific World JournalHindawi Publishing Corporation http://www.hindawi.com Volume 2014
Immunology ResearchHindawi Publishing Corporationhttp://www.hindawi.com Volume 2014
Journal of
ObesityJournal of
Hindawi Publishing Corporationhttp://www.hindawi.com Volume 2014
Hindawi Publishing Corporationhttp://www.hindawi.com Volume 2014
Computational and Mathematical Methods in Medicine
OphthalmologyJournal of
Hindawi Publishing Corporationhttp://www.hindawi.com Volume 2014
Diabetes ResearchJournal of
Hindawi Publishing Corporationhttp://www.hindawi.com Volume 2014
Hindawi Publishing Corporationhttp://www.hindawi.com Volume 2014
Research and TreatmentAIDS
Hindawi Publishing Corporationhttp://www.hindawi.com Volume 2014
Gastroenterology Research and Practice
Hindawi Publishing Corporationhttp://www.hindawi.com Volume 2014
Parkinson’s Disease
Evidence-Based Complementary and Alternative Medicine
Volume 2014Hindawi Publishing Corporationhttp://www.hindawi.com


![Metabolic Syndrome[1]](https://static.fdocuments.us/doc/165x107/577cd7141a28ab9e789dffc3/metabolic-syndrome1.jpg)