Report by Tim Veitch · 2018-06-12 · Transport Modelling for West Gate Tunnel Project Report by...
59
Report by Tim Veitch Transport Modelling for West Gate Tunnel Project August 2017
Transcript of Report by Tim Veitch · 2018-06-12 · Transport Modelling for West Gate Tunnel Project Report by...

Report by Tim Veitch
Transport Modelling for West Gate
Tunnel Project
August 2017
Transport Modelling for West Gate Tunnel Project
Report by Tim Veitch
Project 17-034
Transport Modelling for West Gate Tunnel Project
Report by Tim Veitch
3
Table of Contents
1. Introduction ......................................................................................................................1
2. Qualifications and experience ..........................................................................................2
3. VLC’s role in the EES ..........................................................................................................2
4. Coding of the West Gate Tunnel Project within VLC’s modelling......................................6
5. Further work since preparation of the Technical Reports .................................................8
6. Written Submissions .........................................................................................................8 6.1 Submissions Reviewed .............................................................................................................. 8 6.2 Summary of Issues Raised ......................................................................................................... 9 6.3 Response to Issues Raised in the Submissions ........................................................................ 10
6.3.1 Issues related to modelling assumptions........................................................................... 10 6.3.2 Issues related to traffic impacts ........................................................................................ 21 6.3.3 Issues relating to the robustness of the traffic modelling .................................................. 28
7. Response to IAC Questions and Further Information Request .......................................34
Appendix A - Matters Raised by PPV Guide to Expert Evidence ...............................................37
Appendix B - Tim Veitch’s Curriculum Vitae .............................................................................40
Appendix C – Detailed definition of the Project in VLC’s modelling .........................................44
Appendix D – Letter of Instruction ...........................................................................................52

Transport Modelling for West Gate Tunnel Project
Report by Tim Veitch
1
1. Introduction
My firm Veitch Lister Consulting (VLC) prepared the following technical reports (Technical Reports), which were included as Technical Reports to the Environment Effects Statement (EES) for the West Gate Tunnel Project (Project):
VLC Report Title VLC Report Date Report number in EES
“Transport Modelling for West Gate Tunnel Project -
Transport Modelling Summary”
15 May 2017 Appendix G of Technical
Report A
“Transport Modelling for West Gate Tunnel Project -
Local Area Model Validation Report for 2014 Model -
Version 3.1.0”
1 May 2017 Appendix H of Technical
Report A
“Transport Modelling for West Gate Tunnel Project -
Base Case Model Development Report for 2014 EES
Model - Version 3.1.0”
1 May 2017 Appendix I of Technical
Report A
“Transport Modelling for West Gate Tunnel Project -
Melbourne Wide Model Validation Report Version
3.1.0”
1 May 2017 Appendix J of Technical
Report A
“Transport Modelling for West Gate Tunnel Project -
Greenhouse Gas Assessment - Zenith Economics
Assessment Model”
19 April 2017 Appendix D of Technical
Report Q
Table 1: VLC's Technical Reports included in the EES
My role in preparing the Technical Reports was as an Expert Technical Advisor. I was responsible for providing specialist technical advice, including advice related to model design, development and application. The bulk of VLC’s work on this project was undertaken by the following VLC staff:
• Mike Veitch – Project Director – Qualification: Master of Science (Transportation Engineering), University of Leeds, 1972; Bachelor of Engineering (Civil), University of Leeds, 1970;
• Aaron Alaimo – Project Manager – Qualifications: Bachelor of Engineering (Civil), University of Melbourne 1997; and
• Louisa Sorrentino – Senior Transport Modeller – Qualification: Bachelor of Engineering (Civil), University of Melbourne 2012.
I adopt the Technical Reports, in combination with this document, as my written expert evidence for the purposes of the West Gate Tunnel Project Inquiry and Advisory Committee's review of the EES, draft planning scheme amendment and works approval application.

Transport Modelling for West Gate Tunnel Project
Report by Tim Veitch
2
2. Qualifications and experience
Appendix A contains a statement setting out my qualifications and experience, and the other matters raised by Planning Panels Victoria 'Guide to Expert Evidence'.
A copy of my curriculum vitae is provided in Appendix B.
3. VLC’s role in the EES
In summary, VLC’s role in the EES was to:
• Refine the Zenith model to ensure that it is suitable for forecasting demand for West
Gate Tunnel, and forecasting the strategic level impacts of the Project on the
surrounding road network;
• Apply the resulting model to produce traffic volumes for 2014, and traffic forecasts for
2031, with and without the project, including testing alternate configurations of the
Project; and
• Provide the resulting traffic forecasts to other members of the Project Team, in order
for them to consider the detailed effects of the Project.
The Zenith model is a strategic transport model covering all of Melbourne, Geelong, Bendigo, Ballarat and Traralgon. Zenith uses the standard four step travel modelling process:
1. Trip Generation – which determines how many trips are made to and from each area;
2. Trip Distribution – which determines where each trip goes;
3. Mode Choice – which determines what mode each trip uses; and
4. Trip Assignment – which determines the route taken by each trip.
The Zenith model requires the following input data:
• Demographic and land use data – the metropolitan area is divided up into discrete areas called travel zones. On average, each travel zone contains around 1500 people. For each travel zone, the Zenith model requires as input:
o the resident population (including its demographic profile);
o the employment which occurs in the zone, and the breakdown of employment by industry;
o the education institutions located in the zone, including the number of equivalent full time enrolments (primary, secondary and tertiary); and
o traffic generation associated with Ports, Airports, etc.
• Transportation network data – the transportation network is represented as a network of links, each having a free flow speed (for each mode) and an hourly capacity. Banned turns are defined where particular turning movements are not allowed or cannot physically be made. The public transportation network is

Transport Modelling for West Gate Tunnel Project
Report by Tim Veitch
3
represented as a series of routes, each with their own operating frequency by time of day. The stopping patterns of each public transport route are also defined.
• Transportation costs – the model takes as input information about fuel prices, toll prices, perceived costs of parking, and public transport fares.
• Behavioural parameters – the model takes as input a series of behavioural relationships and parameters, which determine how trip makers are predicted to behave in different situations. The parameters are statistically derived from surveys of the actual travel made by people living in Melbourne, which were conducted between 2007 and 2010 (the Victorian Survey of Travel and Activity, 2007-2010).
As part of the EES, the Zenith model was calibrated for the year 2014. The above inputs for 2014 were based on available data sources including:
• ABS Census data;
• Open Street Maps, Near Maps, etc.;
• VicRoads lists of recently completed road projects;
• ABS population estimates; and
• Public transport timetables.
The sources of future year model input assumptions are shown in Figure 1 below. In general, future year model inputs were obtained from the State of Victoria’s “Reference Case transport modelling assumptions”. The Reference Case transport modelling assumptions are a set of agreed future modelling assumptions, which are output from a formal State Government Governance Process. The Deputy Secretary of Transport is responsible for that Governance Process and for approving transport modelling assumptions. The Deputy Secretary is assisted by a Project Modelling Steering Committee, which is supported by a Project Modelling Technical Advisory Group. The Governance Structure is detailed in the “Guidelines for Transport Modelling and Economic Appraisal in Victoria”. The Reference Case transport modelling assumptions output from this process are used on all State Government transport projects, and include assumptions related to population, employment, future upgrades to the transport network, and transport costs. VLC’s report “Transport Modelling for West Gate Tunnel Project - Base Case Model Development Report for 2014 EES Model - Version 3.1.0” 1st May, 2017, which is included in Appendix I of Technical Report A of the EES, includes all of VLC’s future base case modelling assumptions. Appendix A of that report sets out the State of Victoria’s Reference Case transport modelling assumptions. Specific model inputs related to the Project itself (including the design of the Project, the locations of truck curfews, etc.) were provided by the Project Team, which consisted of the Western Distributor Authority (WDA), VicRoads, and other Technical Advisors to WDA.

Transport Modelling for West Gate Tunnel Project
Report by Tim Veitch
4
Figure 1: Sources of future input assumptions
For each scenario, VLC provided outputs from the Zenith model to other members of the Project Team. The outputs for each scenario included:
• traffic volumes for each road segment, by vehicle type and time of day;
• estimated average traffic speeds by time of day; and
• cordon trip matrices for the study area by time of day.
We understand that the Zenith model outputs were used in the manner set out in Figure 2 below.

Transport Modelling for West Gate Tunnel Project
Report by Tim Veitch
5
Figure 2: Use of VLC model output by the Project Team

Transport Modelling for West Gate Tunnel Project
Report by Tim Veitch
6
4. Coding of the West Gate Tunnel Project within VLC’s
modelling
The EES does not contain specific details of the network assumptions made by VLC to reflect the West Gate Tunnel Project in the Zenith model. For each road section, VLC defined the following attributes:
• Road type (which determines which vehicle types are allowed to use the road); • Number of lanes; • Hourly capacity (vehicles per hour); and • Free flow speeds (i.e. average speed under light traffic).
The detailed assumptions were developed in conjunction with technical advisors from the Project Team and from VicRoads, and are presented in Appendix C of this report. The key assumptions are as follows:
• The West Gate Tunnel – In our traffic modelling, we have coded the West Gate Tunnel as having only 2 lanes in each direction, with a capacity of 3200 vehicles per hour (1600 vehicles per hour per lane). The assumed free flow speed (and speed limit) for the West Gate Tunnel is assumed to be 80 kilometres / hour;
• The Footscray Road Viaduct – We have assumed that the Footscray Road Viaduct will have 3 lanes in each direction. Two of those lanes will have a normal hourly capacity of 1600 vehicles per hour (equivalent to a full lane), while the third lane will have a reduced hourly capacity of 800 vehicles per hour, due to higher levels of weaving expected, resulting in a total capacity of 4000 vehicles per hour. The Footscray Road Viaduct is assumed to have a free flow speed (and speed limit) of 80 kilometres per hour;
• Wurundjeri Way Extension – a 2 lane each way extension of Wurundjeri Way, with a flyover at its current intersection at Dudley Street to a new intersection with Dynon Road (capacity 900 vehicles per hour per lane, free flow speed 40 kilometres per hour);
• Connections to / from the Port of Melbourne
o Connections have been coded to MacKenzie Road, with one lane each direction (capacity 1400 vehicles per hour per lane, free flow speed 40 kilometres per hour). Cars are banned from using these ramps;
o A single lane each way connection has been coded from the eastbound Footscray Road Viaduct to allow access to the intersection of Appleton Dock Road and Footscray Road (capacity 1400 vehicles per hour per lane, free flow speed 40 kilometres per hour). No left turn (towards the CBD) is permitted from this ramp;
Transport Modelling for West Gate Tunnel Project
Report by Tim Veitch
7
• Connections to / from the city
o Connections from the Footscray Road Viaduct to Footscray Road east of CityLink (1 lane each way, 1400 vehicles per hour per lane, free flow speed 40 kilometres per hour);
o Connections from the Footscray Road Viaduct to the intersection of the Dynon Road / Wurundjeri Road Extension (2 lanes each way, 1400 vehicles per hour per lane, free flow speed 40 kilometres per hour);
• Connections to / from CityLink - North facing connections from the Footscray Road Viaduct to CityLink (2 lanes each way, 1400 vehicles per hour per lane, free flow speed 80 kilometres per hour);
• Connections between West Gate Freeway and West Gate Tunnel - the connections between West Gate Freeway and West Gate Tunnel are assumed to occur west of Williamstown Road, and have 2 lanes in each direction (capacity 1600 vehicles per hour per lane, free flow speed: 80 kilometres per hour). Traffic from Williamstown Road cannot access the West Gate Tunnel. Traffic from the West Gate Tunnel is only able to connect to the West Gate Freeway Collector Distributor (and not the West Gate Freeway Main Line);
• Connections from West Gate Freeway to Hyde Street / Simcock Avenue - a new connection is assumed between the West Gate Freeway Collector Distributor and Hyde Street / Simcock Avenue. The connection to the West Gate Freeway Collector Distributor occurs west of Williamstown Road. For eastbound traffic, the connection is to Hyde Street north of the West Gate Freeway. However, for westbound traffic, the connection is to Simcock Avenue, south of the West Gate Freeway. Both have capacity of 1400 vehicles per hour per lane, free flow speed of 40 kilometres per hour;
• West Gate Freeway Upgrade - The West Gate Freeway is assumed to have two separate carriageways in each direction:
o a “Collector Distributor” carriageway which connects to Grieve Parade, Millers Road, Williamstown Road, Hyde Street, the West Gate Bridge and the West Gate Tunnel. The Collector Distributor is assumed to have 3 lanes in each direction, with an average capacity of 1500 vehicles per hour per lane (resulting in a total capacity of 4500 vehicles per hour), and a free flow speed of 95 kilometres per hour (west of the Newport freight rail line);
o A “Main Line” carriageway which connects from the interchange with the Western Ring Road (M80) / Princes Freeway all the way to the West Gate Bridge, with no on or off ramps until the east facing Williamstown Road ramps. The Main Line is assumed to have 3 lanes in each direction, with a per lane capacity of 1900 vehicles per hour per lane (resulting in a total capacity of 5700 vehicles per hour), and a free flow speed of 95 kilometres per hour (west of the Newport freight rail line);
• Interchange between the West Gate Freeway / Western Ring Road / Princes Freeway - all movements are allowed at the interchange between these freeways, including connections to both the West Gate Freeway Main Line and West Gate Freeway Collector Distributor.

Transport Modelling for West Gate Tunnel Project
Report by Tim Veitch
8
5. Further work since preparation of the Technical
Reports
Since the Technical Reports were finalised, my team and I have undertaken further work in relation to our traffic modelling for the Project. In summary, we have:
• Provided more detailed traffic modelling outputs to other members of the technical team via Tony Frodsham; and
• Undertaken “select link analyses” to identify the origins and destinations of the trips forecast to use certain roads, and provided the results to John Kiriakidis (GTA).
However, this further work has not caused me to change my opinions as expressed in the Technical Reports.
6. Written Submissions
6.1 Submissions Reviewed
My team and I have read public submissions to the EES, draft planning scheme amendment and works approval application, where those submissions were identified by the Technical Advisors as being relevant to my area of expertise. These include the following submissions:
PPV ID PPV ID PPV ID PPV ID
72 195 291 378
80 200 299 387
95 206 300 389
132 213 308 392
148 223 312 402
158 227 314 405
160 231 318 409
163 236 326 410
169 262 344 422
170 263 348 426
176 276 352 430
184 282 354 473
186 284 357 486
188 285 371 503
190 286 374
192 289 375
Transport Modelling for West Gate Tunnel Project
Report by Tim Veitch
9
My team also undertook a ‘key word search’ of the other public submissions, and identified a small number of other submissions that had some relevance to my expertise. My team and I have read those submissions. These included the following submissions:
PPV ID PPV ID PPV ID PPV ID
38 303 423 457
217 327 432 458
221 364 434 467
232 367 437
244 388 438
288 394 444
6.2 Summary of Issues Raised
The submissions have raised the following issues relevant to my area of expertise:
Issues related to traffic modelling assumptions
• Area covered by the model
• Forecast years included in the model
• Truck curfew assumptions
• Speed flow curves
• Treatment of induced demand
• Public transport network assumptions
• Future public transport mode share
• Urban redevelopment sites
• Road and rail connections to / from and within the Port of Melbourne
• Forecast truck volumes into and out of the Port of Melbourne
• Construction traffic
• Treatment of truck types (including Dangerous Goods Vehicles)
• Bus crush capacities
• The effects of new vehicle technologies, autonomous vehicles, electric vehicles, job automation, 3D printing
Transport Modelling for West Gate Tunnel Project
Report by Tim Veitch
10
Issues related to traffic impacts of the Project
• Traffic impacts on roads inside the primary study area of the Project
• Traffic impacts outside of the primary study area of the Project
• The effect of increased traffic volumes on public transport services
• The effect of construction traffic
Issues related to the robustness of the traffic modelling
• Concerns that the traffic forecasts are overstated or understated as a result of:
o The use of a four step model
o “Projecting” historical traffic growth trends forward, rather than making a “prediction”
o Failure to adequately take account of induced demand
• Concerns about pessimism bias and “predict and provide”
• Concerns about forecast public transport usage being too high or too low
• Concerns about whether the forecast travel time savings are consistent between the EES and Business Case
6.3 Response to Issues Raised in the Submissions
Set out below are my comments and responses to the issues raised by the written submissions relevant to the area of my expertise.
6.3.1 Issues related to modelling assumptions
6.3.1.1 Area covered by the modelling
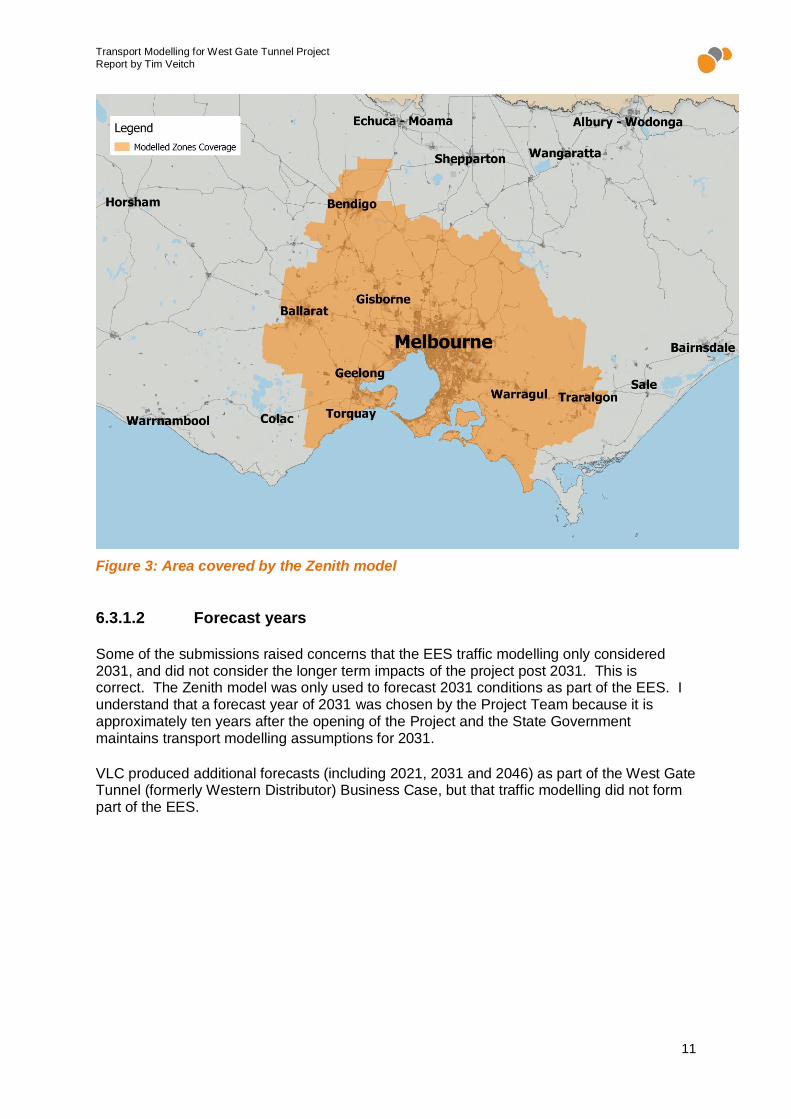
Some submissions raised concerns that the area considered within the traffic modelling was too small. This view likely arose because the traffic impacts reported in the EES only show the impact within a primary study area. However, the model used by VLC for the Project (the Zenith model) covers a much larger area than the primary study area of the project, and includes all of Melbourne, plus the surrounding regional cities of Geelong, Bendigo, Ballarat and Traralgon. The area covered by the Zenith model is shown in Figure 3 below.
Transport Modelling for West Gate Tunnel Project
Report by Tim Veitch
11
Figure 3: Area covered by the Zenith model
6.3.1.2 Forecast years
Some of the submissions raised concerns that the EES traffic modelling only considered 2031, and did not consider the longer term impacts of the project post 2031. This is correct. The Zenith model was only used to forecast 2031 conditions as part of the EES. I understand that a forecast year of 2031 was chosen by the Project Team because it is approximately ten years after the opening of the Project and the State Government maintains transport modelling assumptions for 2031.
VLC produced additional forecasts (including 2021, 2031 and 2046) as part of the West Gate Tunnel (formerly Western Distributor) Business Case, but that traffic modelling did not form part of the EES.

Transport Modelling for West Gate Tunnel Project
Report by Tim Veitch
12
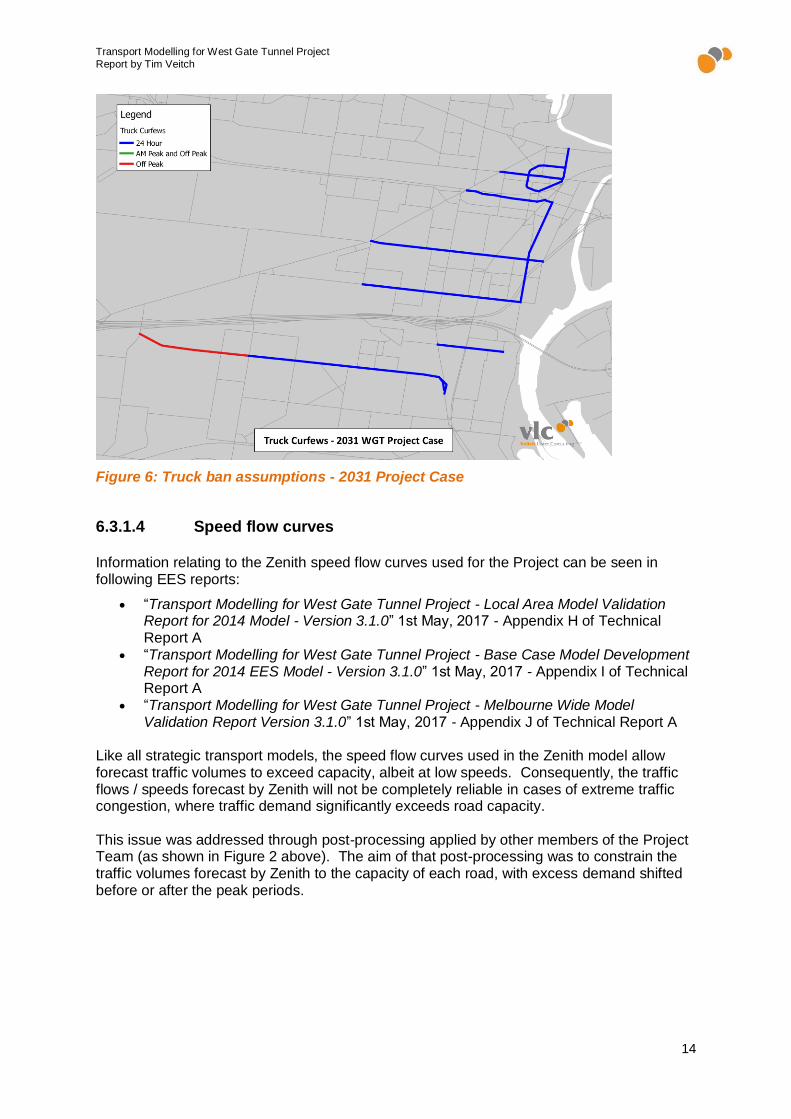
6.3.1.3 Truck curfew assumptions
Some of the submissions raised concerns about the details of truck curfew assumptions, particularly in relation to Blackshaws Road and Hudsons Road. In our modelling, we have reflected truck curfews and other physical constraints which prevent access to trucks, by “banning” trucks from using certain roads, at particular times of the day. Our assumed truck bans are set out below.
Three levels of ban have been modelled:
• 24 hour ban • AM peak and evening off peak ban (7am-9am & 6pm-7am) • Evening off peak ban (6pm-7am)
Figure 4, Figure 5 and Figure 6 below depict the truck bans assumed in the modelling for:
• The base year (2014): o Hyde Street (North of Francis Street) - 24 hour o Barkly Street (between Moore Street and Geelong Road) - 24 hour o Irving Street / French Street / Donald Street - 24 hour o Hyde Street / Douglas Parade (South of Francis Street) - evening off-peak o Francis Street - evening off-peak o Somerville Road - evening off-peak
• The 2031 Base Case scenario (no West Gate Tunnel): o Base year plus o Buckley Street - 24 hour o Moore Street - 24 hour o Somerville Road - AM peak and evening off-peak o Hudsons Road - evening off-peak
• The 2031 Project Case scenario (with West Gate Tunnel): o 2031 Base Case plus o Francis Street - 24 hour o Hudsons Road - 24 hour o Somerville Road - 24 hour o Blackshaws Road (Melbourne Road to Millers Road) - 24 hour o Blackshaws Road (Grieve Parade to Millers Road) - evening off-peak o Removal of the following bans
▪ Hyde Street / Douglas Parade (South of Francis Street) ▪ Francis Street east of Hyde Street
Because the model “bans” trucks from using certain roads, the model implicitly assumes 100% compliance with curfews. In addition, the modelling assumes that all trucks are banned from using these roads at the times specified above. Consequently, VLC’s modelling does not include any concept of permits, which might exempt local trucks from certain curfews.

Transport Modelling for West Gate Tunnel Project
Report by Tim Veitch
13
Figure 4: Truck ban assumptions for 2014
Figure 5: Truck ban assumptions - 2031 Base Case
Transport Modelling for West Gate Tunnel Project
Report by Tim Veitch
14
Figure 6: Truck ban assumptions - 2031 Project Case
6.3.1.4 Speed flow curves
Information relating to the Zenith speed flow curves used for the Project can be seen in following EES reports:
• “Transport Modelling for West Gate Tunnel Project - Local Area Model Validation Report for 2014 Model - Version 3.1.0” 1st May, 2017 - Appendix H of Technical Report A
• “Transport Modelling for West Gate Tunnel Project - Base Case Model Development Report for 2014 EES Model - Version 3.1.0” 1st May, 2017 - Appendix I of Technical Report A
• “Transport Modelling for West Gate Tunnel Project - Melbourne Wide Model Validation Report Version 3.1.0” 1st May, 2017 - Appendix J of Technical Report A
Like all strategic transport models, the speed flow curves used in the Zenith model allow forecast traffic volumes to exceed capacity, albeit at low speeds. Consequently, the traffic flows / speeds forecast by Zenith will not be completely reliable in cases of extreme traffic congestion, where traffic demand significantly exceeds road capacity. This issue was addressed through post-processing applied by other members of the Project Team (as shown in Figure 2 above). The aim of that post-processing was to constrain the traffic volumes forecast by Zenith to the capacity of each road, with excess demand shifted before or after the peak periods.

Transport Modelling for West Gate Tunnel Project
Report by Tim Veitch
15
6.3.1.5 Induced demand
Some of the submissions raised concerns over whether “induced demand” had been accounted for in the modelling.
When transportation infrastructure is built or upgraded, it can make certain types of travel more attractive, which can “induce” additional travel.
Induced demand was discussed in Section 1.2.4 of the VLC report “Transport Modelling Summary, May 2017” which is contained in Appendix G of Technical Report A within the EES.
The State Government has published two documents that discuss the capabilities of travel demand forecasting models in dealing with the way people and businesses respond to a road improvement:
• “Induced Travel Demand - Draft Position Paper", Department of Transport Victoria, November 2009
• “Transport Modelling Guidelines - Volume 2: Strategic Modelling”, VicRoads, December 2011
The views expressed by DEDJTR (formally DoT) and VicRoads in their reports on induced demand are consistent with VLC’s views on the subject. Updated for the West Gate Tunnel project, VLC’s view are summarised below:
• Changing route - handled adequately by the West Gate Tunnel project model, which includes all of Melbourne and the surrounding regional cities (using the Traffic Assignment Sub-Model);
• Changing destination - handled adequately by the West Gate Tunnel project model (using the Destination Choice Sub-Model);
• Changing mode - handled adequately by the West Gate Tunnel project model (using the Mode Choice Sub-Model);
• Changing departure time - current models do not predict this phenomenon, meaning that travellers are not predicted to change their departure time in response to congestion. Consequently, under heavily congested conditions, the model will tend to overpredict traffic volumes during the predefined peak periods and underpredict traffic volumes outside the peaks. In the Transport Impact Assessment, this was accounted as a post-processing step by other technical advisors. With this taken into consideration, I expect this limitation will have a fairly minimal impact on the West Gate Tunnel Project;
• Making additional journeys - there is no consensus on whether this actually occurs to a scale that has any material impact on the capacity consumption of roads and/or economic benefit assessments. Research by the State concludes that the “...induced demand from making additional journeys can be assumed to be negligible and need not be dealt with in the transport model” (VicRoads Transport Modelling Guidelines Volume 2, dated 26/04/2012). I consider it unlikely that this form of induced demand will have a significant impact on the West Gate Tunnel project; and
• Land use changes - current transportation models do not (on their own) currently predict this phenomenon, and would benefit from more investment in research on this topic. This was handled via sensitivity testing of land use scenarios reflecting WGT Project uplift effects.
Transport Modelling for West Gate Tunnel Project
Report by Tim Veitch
16
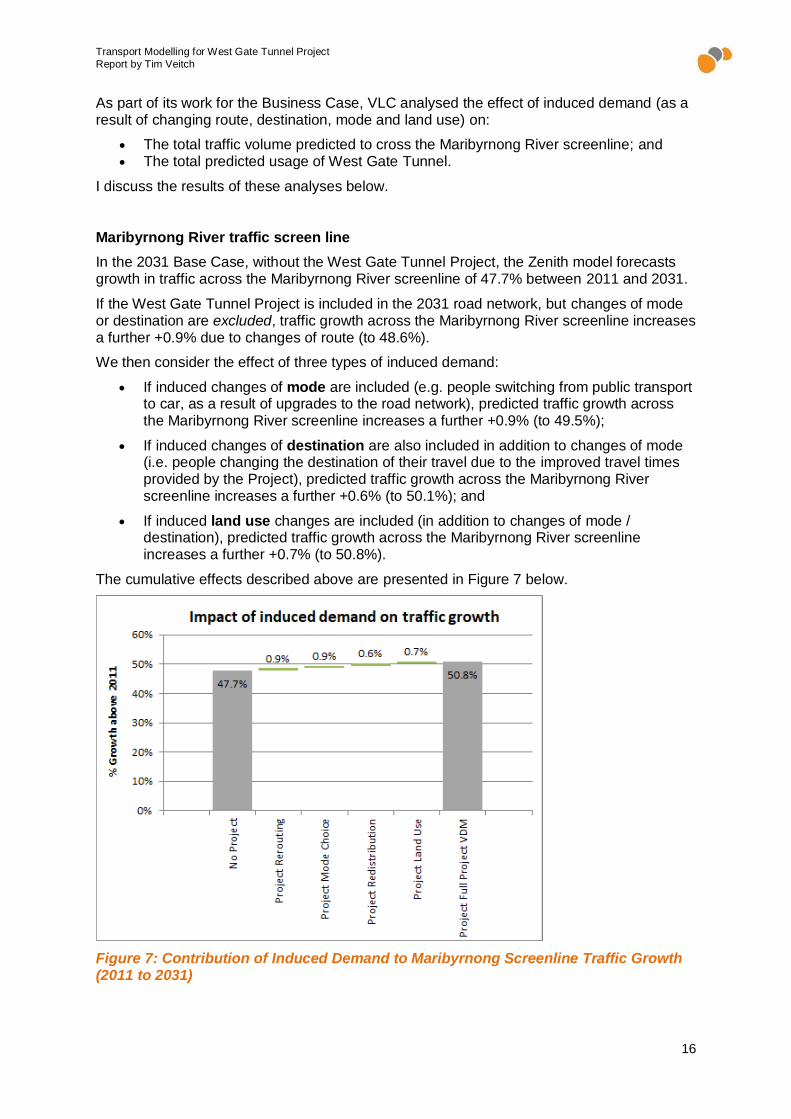
As part of its work for the Business Case, VLC analysed the effect of induced demand (as a result of changing route, destination, mode and land use) on:
• The total traffic volume predicted to cross the Maribyrnong River screenline; and • The total predicted usage of West Gate Tunnel.
I discuss the results of these analyses below.
Maribyrnong River traffic screen line
In the 2031 Base Case, without the West Gate Tunnel Project, the Zenith model forecasts growth in traffic across the Maribyrnong River screenline of 47.7% between 2011 and 2031.
If the West Gate Tunnel Project is included in the 2031 road network, but changes of mode or destination are excluded, traffic growth across the Maribyrnong River screenline increases a further +0.9% due to changes of route (to 48.6%).
We then consider the effect of three types of induced demand:
• If induced changes of mode are included (e.g. people switching from public transport to car, as a result of upgrades to the road network), predicted traffic growth across the Maribyrnong River screenline increases a further +0.9% (to 49.5%);
• If induced changes of destination are also included in addition to changes of mode (i.e. people changing the destination of their travel due to the improved travel times provided by the Project), predicted traffic growth across the Maribyrnong River screenline increases a further +0.6% (to 50.1%); and
• If induced land use changes are included (in addition to changes of mode / destination), predicted traffic growth across the Maribyrnong River screenline increases a further +0.7% (to 50.8%).
The cumulative effects described above are presented in Figure 7 below.
Figure 7: Contribution of Induced Demand to Maribyrnong Screenline Traffic Growth (2011 to 2031)

Transport Modelling for West Gate Tunnel Project
Report by Tim Veitch
17
Impact of Induced Demand on Forecast West Gate Tunnel traffic volumes
A similar analysis was conducted in respect of the predicted usage of West Gate Tunnel. It was found that:
• Induced changes of mode (e.g. from public transport to car) increased the predicted usage of the West Gate Tunnel in 2031 by 2.1%;
• Induced changes of destination increased the predicted usage of the West Gate Tunnel by a further 3.5%; and
• Induced changes in land use increased the predicted usage of the West Gate Tunnel by a further 0.9%.
The cumulative impacts described above are presented in Table 2 below.
Table 2: Contribution of Induced Demand to West Gate Tunnel Volumes
6.3.1.6 Public transport network assumptions
VLC’s modelling of 2031 (in both the Base and Project Cases) included the Metro Tunnel Project (formerly known as Melbourne Metro). Consequently, VLC’s modelling of 2031 includes higher train frequencies and capacities on all suburban lines, particularly those in the west. The assumed percentage change in inbound hourly AM peak passenger capacities is shown in Figure 8 below.

Transport Modelling for West Gate Tunnel Project
Report by Tim Veitch
18
Figure 8: Change in inbound hourly passenger capacities in the AM peak between 2014 and 2031
6.3.1.7 Future public transport mode share
Future public transport mode share (i.e. the share of all trips made by public transport) in 2031 is not an input to the model. Instead, future public transport mode share is a predicted output of the model, taking into account:
• Changes to the future road and public transport networks; • Changes to transport costs (e.g. fuel, parking, tolls, public transport fares, etc.); • Forecast changes in traffic congestion; • Where population and employment growth are assumed to occur; and • Changes in demographic profiles.
In the 2014 model, the estimated share of motorised trips made by public transport in the entire modelled area is 10% (including Melbourne, Geelong, Ballarat, Bendigo and Traralgon). By 2031, this share is predicted to increase to 14%.
Despite the forecast increase in the share of trips made by public transport, the overall absolute amount of car travel (measured in terms of car kilometres travelled) is still forecast to increase substantially by 36%. This is because:
• Population is expected to increase by approximately 34% between 2014 and 2031 in metropolitan Melbourne, according to VIF2014 forecasts; and
• Much of this population growth is forecast to occur in outer suburbs, where the average car trip length is relatively long.

Transport Modelling for West Gate Tunnel Project
Report by Tim Veitch
19
6.3.1.8 Urban redevelopment sites
The forecast demographic and land use assumptions for 2031 are documented in Section 3.1 of VLC’s “Transport Modelling for West Gate Tunnel Project - Base Case Model Development Report for 2014 EES Model - Version 3.1.0” 1st May, 2017 - Appendix I of Technical Report A.
Future input assumptions for population, employment and education enrolments were sourced from DEDJTR, based on the work of SGS. Several submissions raised concerns about major urban renewal projects not being included in the modelling assumptions, particularly the following sites:
• Former Dons site in Blackshaws Road, Altona North (Precinct 15) • Blackshaws Road and Stephenson Street, South Kingsville (Precinct 16) • Melbourne Road and Birmingham Street, Spotswood (Precinct 17) • Old Bradmill (Yarraville Gardens) site in Francis Street • E-Gate • Arden / Macaulay urban renewal area
In the EES, the Former Dons site (Precinct 15), Blackshaws Road and Stephenson Street, South Kingsville (Precinct 16) and Melbourne Road and Birmingham Street, Spotswood (Precinct 17), the Old Bradmill (Yarraville Gardens) site in Francis Street and the Arden / Macaulay urban renewal area are assumed to be fully completed in 2031, while E Gate is assumed to be partially completed in the 2031.
6.3.1.9 Road and rail connections to / from and within the Port of
Melbourne
Some of the submissions raised concerns over whether West Gate Tunnel Project would be necessary if the Port of Melbourne was connected to an intermodal terminal in the west by rail. The EES traffic model developed by VLC is based on 2031 Reference Case Assumptions developed by the State of Victoria for transport modelling purposes. The 2031 Reference Case assumes the following:
• Port of Melbourne (PoM) remains the only container port in Victoria through to 2046; • No change to the rail connection at Port of Melbourne in the modelling of 2031; • Interstate rail freight shifts from Dynon to the Western Intermodal Freight Terminal
(WIFT) in 2032, therefore WIFT first appears in the 2046 scenario; and • Port Rail Shuttle (PRS) first appears in the 2046 scenario (PRS was formerly known
as the Melbourne Intermodal System (MIS)).
6.3.1.10 Forecast truck volumes into and out of the Port of Melbourne
The number of trucks entering and leaving the Port of Melbourne in 2031 is an assumed input to VLC’s model. Our assumptions are based on the State of Victoria’s 2031 Reference Case transport modelling assumptions, and can be seen in Table 3.3 in VLC’s “Transport Modelling for West Gate Tunnel Project - Base Case Model Development Report for 2014 EES Model - Version 3.1.0”, dated 1st of May 2017, which can be found in Appendix I of Technical Report A.
6.3.1.11 Construction traffic
Construction traffic associated with the construction of the West Gate Tunnel Project (or any other project) is not reflected in VLC’s modelling.
Transport Modelling for West Gate Tunnel Project
Report by Tim Veitch
20
6.3.1.12 Treatment of truck types (including Dangerous Goods Vehicles)
Some of the submissions raised concerns about whether the modelling properly took account of Dangerous Goods Vehicles.
The strategic modelling undertaken by VLC does not distinguish between Dangerous Goods Vehicles and other trucks. In VLC’s modelling, trucks are segmented into two categories:
• Light trucks (Austroads vehicle class 3: 2 axle medium rigid trucks) • Heavy trucks (Austroads vehicle classes 4 and above)
6.3.1.13 Bus crush capacities
One of the submissions questioned the bus crush capacities assumed in the modelling. Crush capacity is defined as the maximum number of passengers that can reasonably be accommodated in a public transport vehicle. One of VLC’s technical notes refers to buses having an assumed crush capacity of 75, whereas one of the submissions notes that there is a legal limit of 68 passengers, and questions whether using this assumption would change the modelling results.
The modelling undertaken by VLC for the West Gate Tunnel EES assumed that public transport vehicles are unconstrained (i.e. have no upper bound on their crush capacity). The reasons for this are as follows:
• Modelling public transport capacity constraints significantly increases model run times (and thus increases the cost of modelling); and
• It was considered that modelling public transport capacity constraints would not materially alter the results for the West Gate Tunnel Project.
To confirm the latter point, we undertook a sensitivity test of the Project Case in which public transport capacity constraints were applied (using crush capacities of 75 for buses). The result was to increase the predicted usage of West Gate Tunnel by 1.8% (Table 3.3 in VLC’s report “Transport Modelling for West Gate Tunnel Project - Transport Modelling Summary”, 15th May, 2017 found in Appendix G of Technical Report A).
We do not consider this material in the context of the EES. If a crush capacity of 68 had been applied to buses (instead of 75), we expect the increase would have been very slightly larger.
6.3.1.14 The effects of new vehicle technologies, autonomous vehicles,
electric vehicles, job automation, 3D printing
Some of the submissions raised concerns about whether the modelling had taken account of potential future changes to:
• Vehicle technology (e.g. autonomous vehicles, electric vehicles) • Manufacturing technology (e.g. 3-D printing) • Artificial intelligence (resulting in further job automation)
The modelling does not reflect any potential disruption or change caused by autonomous or electric vehicles. There is a great deal of uncertainty about what the impact of these technologies will be, or when that impact might occur. For example, autonomous vehicles may allow higher hourly vehicle capacities to be achieved on freeways. However, autonomous vehicles may also increase the demand for car travel (by older and younger people, and those travelling to the CBD who no longer need to park).

Transport Modelling for West Gate Tunnel Project
Report by Tim Veitch
21
The traffic modelling also does not make any explicit assumptions about changes to manufacturing technology (e.g. 3-D printing), or job automation. However, the Zenith model takes as input employment forecasts (by industry category) which are provided as part of the State of Victoria’s Reference Case Assumptions for 2031. Those employment forecasts may make some allowance for such changes.
6.3.2 Issues related to traffic impacts
6.3.2.1 Traffic impacts within the primary study area
Many of the submissions raised concerns that the Project will cause an increase in traffic, and particularly an increase in the volume of trucks, on certain roads, including:
• Roads that provide connections to / from the West Gate Freeway, such as Williamstown / Melbourne Road, Millers Road, Grieve Parade, Hyde Street;
• Roads in Hobsons Bay which may attract greater truck volumes as a result of toll avoidance and proposed truck curfews in Yarraville, such as Blackshaws Road, Hudsons Road, Mason Street, Kororoit Creek Road, and North Road; and
• Roads which may increase in volume as a result of the Project’s connections to the CBD, such as Hawke Street, Victoria Street, Dryburgh Street, Arden Street, Macaulay Road, Queensberry Street, Curzon Street and the intersection of Footscray Road and Wurundjeri Way.
Figures 11-14 and 11-15 of the EES show the estimated impact of the Project on total traffic and truck volumes respectively, in the vicinity of the Project. Figure 25-6 from the EES shows the estimated traffic impacts near the city access connections. Those figures from the EES are presented in Figure 9, Figure 10 and Figure 11 below.
Figure 9: Forecast changes in two-way weekday traffic volumes caused by the Project in 2031 (capacity constrained) Source: Figure 11-14 of the EES

Transport Modelling for West Gate Tunnel Project
Report by Tim Veitch
22
Figure 10: Forecast changes in two-way weekday truck volumes caused by the Project in 2031 (capacity constrained) Source: Figure 11-15 of the EES

Transport Modelling for West Gate Tunnel Project
Report by Tim Veitch
23
Figure 11: Forecast changes in two-way weekday traffic volumes caused by the Project in 2031 in Inner Melbourne (capacity constrained) Source: Figure 25-6 of the EES

Transport Modelling for West Gate Tunnel Project
Report by Tim Veitch
24
The impacts shown in the above figures are not a pure output from the Zenith model, but are instead a derived output following a post-processing step, which applies capacity constraints to the Zenith outputs, as described in Figure 2 above.
6.3.2.2 Traffic impacts outside of the primary study area
Figures 11-14, 11-15 and 25-6 of the EES show the traffic impacts of the Project within the local vicinity of the Project. Some of the submissions raised concerns about traffic impacts outside of this area.
The traffic model we have used for this Project does consider traffic impacts outside of the local vicinity of the Project.
The forecast impact of the Project on weekday traffic volumes (including cars and trucks) in a wider area in 2031 is shown in Figure 12 below. Blue indicates a decrease in traffic volumes, while red indicates an increase, while freeway impacts have not been shown because they are of a significantly larger magnitude than the other changes, and would therefore render the other changes illegible. The results in Figure 12 below are slightly different to the results shown in the EES in the local vicinity of the Project (in Figure 9 above). That is because:
• The results in Figure 12 below are pure outputs of the Zenith model, and are not constrained based on the physical capacities of each road, whereas the results in the EES have been refined by applying capacity constraints using a post-processing step, as summarised in Figure 2 above; and
• The Zenith model results shown in Figure 12 below are based on truck bans on the roads shown in Section 0 above. The traffic impacts in the EES are more refined because they make some allowance for local trucks which may be exempt from truck curfews. In addition, the EES assumes that ‘traffic management measures’ will be implemented on Blackshaws Road and Hudsons Road to reduce truck traffic, whereas Zenith assumes that trucks are banned on those roads as follows:
o a 24 hour truck ban on Blackshaws Road east of Millers Road; o an evening off peak truck ban on Blackshaws Road west of Millers Road; and o a 24 hour truck ban on Hudsons Road east of Melbourne Road.
In the vicinity of the Project, the traffic impacts in the EES should be relied upon rather than the pure Zenith outputs below.
Referring to Figure 12 below, in the areas outside of the local vicinity of the Project, it can be seen that the model forecasts that total weekday traffic volumes will:
• reduce on a number of east-west roads such as Somerville Road (west of Geelong Road), Sunshine Road, Ballarat Road and Racecourse Road (west of CityLink); and
• increase in the western suburbs on Douglas Parade, Boundary Road, and slightly increase on Mason Street, and increase in the inner north on Victoria Parade / Victoria Street, the Alexandra Parade Corridor and Johnston Street.
The forecast impact on weekday truck volumes is shown in Figure 13 below. In the areas outside of the local vicinity of the Project, the model forecasts that truck volumes will increase on Douglas Parade, North Road, Mason Street, and small increases in West Melbourne and North Melbourne.
The modelling assumes that there are no curfew exemptions for trucks destined for local areas. If such exemptions were introduced, the effect could be to dampen the truck decreases on roads where curfews are assumed to apply, and to dampen the truck increases on other roads.

Transport Modelling for West Gate Tunnel Project
Report by Tim Veitch
25
Figure 12: Zenith output showing wider changes in weekday traffic volumes caused by the Project in 2031 (not capacity constrained)

Transport Modelling for West Gate Tunnel Project
Report by Tim Veitch
26
Figure 13: Zenith output showing wider changes in weekday truck volumes caused by the Project in 2031 (not capacity constrained)

Transport Modelling for West Gate Tunnel Project
Report by Tim Veitch
27
6.3.2.3 The effect of increased traffic volumes on public transport
services
Some of the submissions also raised concerns about whether the increased traffic volumes on certain roads could impede buses and trams.
Figure 14 below shows the forecast increases and decreases in total traffic, overlaid with the 2031 bus network in black. A number of bus routes operate on road segments where traffic volumes are forecast to decrease, and are therefore expected to experience travel time improvements to some degree. Some examples include the 404 (Williamstown - Moonee Ponds), the 414 (Laverton Station to Footscray), and the 431 (Yarraville to Kingsville).
Some bus routes operate along sections of roads that are forecast to experience traffic increases (such as Millers Road), and are therefore expected to experience a deterioration in travel time to some degree on those sections. However, these bus routes generally also use sections of road that benefit from reduced traffic volumes (and improved travel speeds). Therefore, the net effect should generally be to improve bus travel times in the west. However, buses in the inner city (e.g. on the eastern end of Victoria Street and route 401) may experience a slight deterioration in travel times.
Figure 14: Zenith output showing changes in traffic volumes in relation to the bus network (not capacity constrained)
Figure 15 below depicts the forecast impact of the Project on weekday traffic volumes in the inner northern suburbs where trams may be affected. The 2031 tram network (based on DEDJTR service plans) is overlaid in black.
The Project is forecast to cause an increase in east-west traffic through Melbourne’s inner north, along Victoria Street / Victoria Parade, Queensberry Street and Cemetery Road East. These traffic increases may result in slight delays to north-south tram movements serving the CBD if traffic signals and phasings are adjusted to cater for the increased east-west demand.
This issue is discussed in greater detail the Transport Impact Assessment included as Technical Report A in the EES.

Transport Modelling for West Gate Tunnel Project
Report by Tim Veitch
28
Figure 15: Zenith output showing changes in traffic volumes in relation to the tram network (not capacity constrained)
6.3.2.4 Construction Traffic
Some of the submissions raised concerns about construction traffic related to the West Gate Tunnel Project, the Metro Tunnel Project, and various other land redevelopments. Particular concerns were raised in relation to New Street in South Kingsville. Our modelling has not accounted for construction traffic.
6.3.3 Issues relating to the robustness of the traffic modelling
6.3.3.1 Concerns that the traffic forecasts are overstated or understated
Some of the submissions raised concerns that the traffic forecasts are understated or overstated, for various reasons.
Some of the concerns related to the assumptions made in the modelling (e.g. the inclusion of additional road network upgrades such as the CityLink Tullamarine Widening Project, or whether or not a new rail freight connection is included to the Port of Melbourne). Where that is the case, my response is that the assumptions adopted in the modelling are based on the State of Victoria’s Reference Case transport modelling assumptions, consistent with those used on other major projects.

Transport Modelling for West Gate Tunnel Project
Report by Tim Veitch
29
Some of the concerns related to the transport modelling methodology used by VLC to produce its forecasts. In summary, those concerns were:
• The use of a four step model
• That the model’s traffic forecasts are simply a “projection” of historical traffic growth, and not a “prediction”
• Whether induced demand has been adequately taken account of
• Whether the traffic forecasts produced by the model are reasonable
I address each of these issues below.
The use a four step model
Some of the submissions are critical of VLC’s use of a four step modelling approach to forecast traffic in 2031. The main criticisms were:
• That four step modelling originated in the United States in the 1950s, explicitly to support road network expansion within major cities, and that such models are now out-of-date; and
• That four step models are “notoriously inaccurate”, particularly for toll roads.
In response to the first criticism:
• While the high level “framework” of four step modelling originated in the 1950s, the practice of four step modelling has changed significantly since then, underpinned by increases in computing power, and the availability of more reliable data sets. The main changes have been the inclusion of greater spatial detail, greater demographic detail, greater segmentation of trip purposes and time periods, and the inclusion of non-car travel within the model (e.g. public transport, walking and cycling); and
• Enhanced four step models remain the most common approach used by transport modellers around the world. All of the operational transport models commonly used in Australia are four step models.
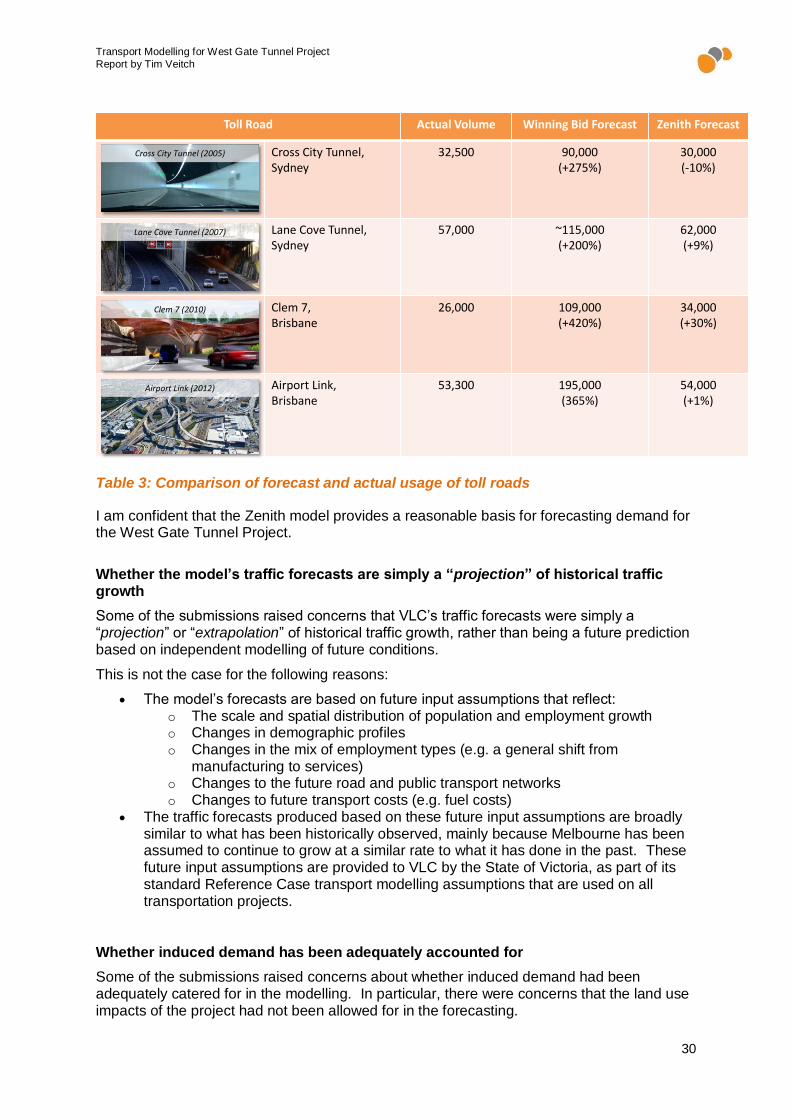
In response to the second criticism (regarding accuracy):
• It is correct that some toll road forecasts in Australia have been very inaccurate, with four toll roads going into bankruptcy (the Cross City Tunnel (Sydney), Lane Cove Tunnel (Sydney), Clem7 tunnel (Brisbane) and Airport Link (Brisbane)). Other toll roads have also been overpredicted, but to a lesser degree, including EastLink (Melbourne) and Sydney’s M7;
• VLC was not responsible for the inaccurate traffic forecasts produced for any of the above mentioned toll roads. Where VLC has used its Zenith model to produce traffic forecasts for toll roads in Australia, those forecasts have consistently achieved a credible level of accuracy. This includes forecasts for all of the four failed toll roads, as well as EastLink in Melbourne for the Victorian State Government; and
• Having produced reliable traffic forecasts for Australian toll roads, and having conducted post-mortem audits of the models used on 3 of the above 4 failed toll roads (in our role as expert witnesses or expert advisors), it is VLC’s view that the inaccurate toll road forecasts produced for Australian toll roads were not caused by the four step modelling approach.
The Zenith model, which is being used to produce traffic forecasts for the West Gate Tunnel Project, has a strong track record of predicting demand for toll roads. Table 3 below presents a comparison of the Zenith model’s traffic forecasts (where such forecasts have been produced prior to opening of the project) compared with actual traffic volumes observed approximately 18 months after opening on four toll roads in Australia. For reference, the inaccurate forecasts produced by the successful bidder on each project are also included.
Transport Modelling for West Gate Tunnel Project
Report by Tim Veitch
30
Table 3: Comparison of forecast and actual usage of toll roads
I am confident that the Zenith model provides a reasonable basis for forecasting demand for the West Gate Tunnel Project.
Whether the model’s traffic forecasts are simply a “projection” of historical traffic growth
Some of the submissions raised concerns that VLC’s traffic forecasts were simply a “projection” or “extrapolation” of historical traffic growth, rather than being a future prediction based on independent modelling of future conditions.
This is not the case for the following reasons:
• The model’s forecasts are based on future input assumptions that reflect: o The scale and spatial distribution of population and employment growth o Changes in demographic profiles o Changes in the mix of employment types (e.g. a general shift from
manufacturing to services) o Changes to the future road and public transport networks o Changes to future transport costs (e.g. fuel costs)
• The traffic forecasts produced based on these future input assumptions are broadly similar to what has been historically observed, mainly because Melbourne has been assumed to continue to grow at a similar rate to what it has done in the past. These future input assumptions are provided to VLC by the State of Victoria, as part of its standard Reference Case transport modelling assumptions that are used on all transportation projects.
Whether induced demand has been adequately accounted for
Some of the submissions raised concerns about whether induced demand had been adequately catered for in the modelling. In particular, there were concerns that the land use impacts of the project had not been allowed for in the forecasting.
Zenith: Sophisticated Toll Choice Modelling VLC Predictions and Actual Traffic Volumes on Australian Toll Roads
Toll Road Actual Volume Winning Bid Forecast Zenith Forecast
Cross City Tunnel,Sydney
32,500 90,000(+275%)
30,000(-10%)
Lane Cove Tunnel, Sydney
57,000 ~115,000(+200%)
62,000(+9%)
Clem 7,Brisbane
26,000 109,000(+420%)
34,000(+30%)
Airport Link, Brisbane
53,300 195,000(365%)
54,000(+1%)
Clem 7 (2010)
Cross City Tunnel (2005)
Lane Cove Tunnel (2007)
Airport Link (2012)

Transport Modelling for West Gate Tunnel Project
Report by Tim Veitch
31
The traffic modelling outputs included in the EES are based on a static land use that does not reflect any land use impacts of the Project.
However, during the West Gate Tunnel Business Case, SGS was engaged to assess the likely land use impacts of the Project in 2031. The SGS Report1 indicated that population and employment in the inner west of Melbourne would increase by around 1% to 2% as a result of the West Gate Tunnel Project in 2031. These changes appear plausible to me given that this project primarily upgrades road capacity within an existing corridor (i.e. the West Gate Freeway corridor), rather than opening up a new corridor for development. As part of the Business Case, VLC undertook a sensitivity test using the induced land use scenario provided by SGS, and found that the traffic impacts were generally similar to the land use impacts (e.g. generally an increase of 1% to 2% in the study area).
Reasonableness of the forecast change in car use per capita
At a high level, the two key determinants of future traffic growth are:
• Future population growth • Changes in car use per capita
As described above, the population forecasts used by VLC were based on the State of Victoria’s Reference Case transport modelling assumptions.
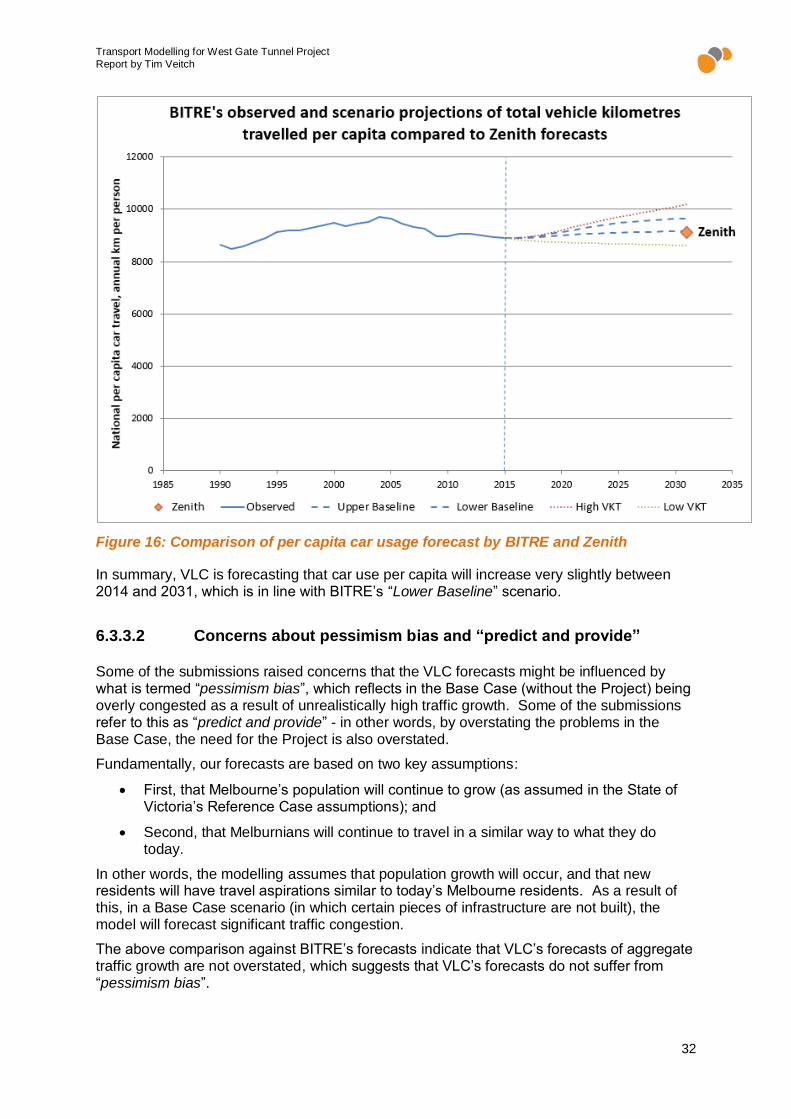
As a sensibility check of the second key determinant (i.e. changes in car use per capita), we compared the Zenith model’s forecast change in car use per capita (measured in terms of car kilometres travelled per person) in Melbourne, against a range of forecasts produced by the Federal Government agency responsible for forecasting car use - the Bureau of Infrastructure, Transport and Regional Economics (BITRE). The result is shown in Figure 16 below.
1 Available here: http://economicdevelopment.vic.gov.au/__data/assets/pdf_file/0004/1237279/Western-Distributor-Attachment-M-Land-Use-Report.pdf
Transport Modelling for West Gate Tunnel Project
Report by Tim Veitch
32
Figure 16: Comparison of per capita car usage forecast by BITRE and Zenith
In summary, VLC is forecasting that car use per capita will increase very slightly between 2014 and 2031, which is in line with BITRE’s “Lower Baseline” scenario.
6.3.3.2 Concerns about pessimism bias and “predict and provide”
Some of the submissions raised concerns that the VLC forecasts might be influenced by what is termed “pessimism bias”, which reflects in the Base Case (without the Project) being overly congested as a result of unrealistically high traffic growth. Some of the submissions refer to this as “predict and provide” - in other words, by overstating the problems in the Base Case, the need for the Project is also overstated.
Fundamentally, our forecasts are based on two key assumptions:
• First, that Melbourne’s population will continue to grow (as assumed in the State of Victoria’s Reference Case assumptions); and
• Second, that Melburnians will continue to travel in a similar way to what they do today.
In other words, the modelling assumes that population growth will occur, and that new residents will have travel aspirations similar to today’s Melbourne residents. As a result of this, in a Base Case scenario (in which certain pieces of infrastructure are not built), the model will forecast significant traffic congestion.
The above comparison against BITRE’s forecasts indicate that VLC’s forecasts of aggregate traffic growth are not overstated, which suggests that VLC’s forecasts do not suffer from “pessimism bias”.

Transport Modelling for West Gate Tunnel Project
Report by Tim Veitch
33
6.3.3.3 Concerns over forecast public transport usage to and from
certain areas being too high or low
One of the submissions raised a concern that VLC’s forecast of public transport mode share in the west (as a fraction of all motorised trips) was the same in both the Base and Project cases - at 13%. We understand that the concern was that the percentage was expected to be different in the Project Case compared to the Base Case.
I have reviewed the relevant statistic, and identified that it relates to the forecast public transport mode share for Melbourne’s ‘western suburbs’, which includes all of the Local Government Authorities (LGAs) shown in Figure 17 below. It can be seen that the area is quite large, and extends well beyond the immediate vicinity of the Project. This explains why the impact of the project on the public transport mode share to the western suburbs appears not to be material – i.e. the western suburbs includes a large area well beyond the area impacted by the project.
Figure 17: The area referred to as "Western Suburbs"
To further check the result in question, I have also reviewed the model outputs in more detail. I have identified that the model does forecast a drop in rail patronage from the west as a result of the Project. The forecasts indicate a reduction in rail passenger loads east of Footscray station of about 2,000 passengers per day (which is 0.5% of rail passengers at that location in 2031). This is in line with the ‘induced demand’ analysis above, which indicated that the Project is expected to cause a small shift in demand from public transport to car, which increases demand for the Project by around 2%.
Transport Modelling for West Gate Tunnel Project
Report by Tim Veitch
34
This analysis indicates that the Project does have an impact on public transport mode shares in the west. It is just a small impact when expressed as a percentage of all public transport usage in the western suburbs.
6.3.3.4 Consistency between the EES and Business Case
Some of the submissions raised concerns that the reported travel time savings of the Project were inconsistently reported in the West Gate Tunnel EES compared to the Business Case.
Travel speed outputs of VLC’s Zenith model were one input to the relevant travel time saving calculations. I understand that the primary reason for the difference in reported travel time savings is that one document reported two way time savings (i.e. for a return journey), while one document reported one way time savings.
7. Response to IAC Questions and Further Information
Request
Response to Request 21(a)
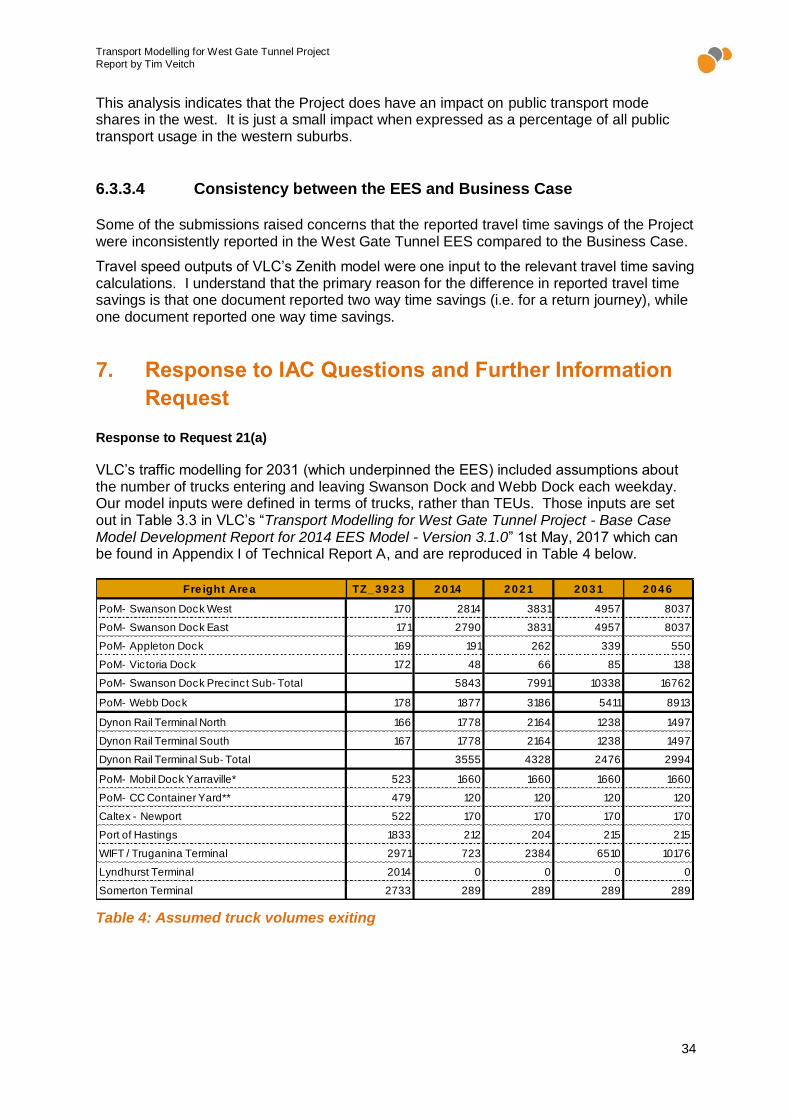
VLC’s traffic modelling for 2031 (which underpinned the EES) included assumptions about the number of trucks entering and leaving Swanson Dock and Webb Dock each weekday. Our model inputs were defined in terms of trucks, rather than TEUs. Those inputs are set out in Table 3.3 in VLC’s “Transport Modelling for West Gate Tunnel Project - Base Case Model Development Report for 2014 EES Model - Version 3.1.0” 1st May, 2017 which can be found in Appendix I of Technical Report A, and are reproduced in Table 4 below.
Table 4: Assumed truck volumes exiting
Fre ight Are a TZ_ 3 9 2 3 2 0 14 2 0 2 1 2 0 3 1 2 0 4 6
PoM- Swanson Dock West 170 2814 3831 4957 8037
PoM- Swanson Dock East 171 2790 3831 4957 8037
PoM- Appleton Dock 169 191 262 339 550
PoM- Victoria Dock 172 48 66 85 138
PoM- Swanson Dock Precinct Sub- Total 5843 7991 10338 16762
PoM- Webb Dock 178 1877 3186 5411 8913
Dynon Rail Terminal North 166 1778 2164 1238 1497
Dynon Rail Terminal South 167 1778 2164 1238 1497
Dynon Rail Terminal Sub- Total 3555 4328 2476 2994
PoM- Mobil Dock Yarraville* 523 1660 1660 1660 1660
PoM- CC Container Yard** 479 120 120 120 120
Caltex - Newport 522 170 170 170 170
Port of Hastings 1833 212 204 215 215
WIFT / Truganina Terminal 2971 723 2384 6510 10176
Lyndhurst Terminal 2014 0 0 0 0
Somerton Terminal 2733 289 289 289 289

Transport Modelling for West Gate Tunnel Project
Report by Tim Veitch
35
Response to Request 21(b) As stated in Section 6.3.1.9 above, it was assumed that Interstate rail freight shifts from Dynon to the Western Intermodal Freight Terminal (WIFT) in 2032, therefore WIFT first appears in the 2046 scenario (and not in the 2031 scenario included in the EES). This assumption was based on the State of Victoria’s Reference Case transport modelling assumptions. Response to Request 21(d) The State of Victoria’s Reference Case transport modelling assumptions, which are the basis for our modelling, assume that Port of Melbourne (PoM) remains the only container port in Victoria through to 2046. Response to Request 21(e) I understand that Swanson Dock and chemical storage facilities are assumed to remain on Coode Island.
Other Requests There are some additional requests in the IAC's Preliminary Matters and Further Information Request dated 18 July which I expect to depend on modelling outputs provided by VLC. Those requests are numbered 6, 18 and 19. I understand that those requests will be responded to by other experts, using VLC’s outputs as inputs to their work.

Transport Modelling for West Gate Tunnel Project
Report by Tim Veitch
36
Declaration
I have made all the inquiries that I believe are desirable and appropriate and that no matters of significance which I regard as relevant have to my knowledge been withheld from the Inquiry and Advisory Committee.
........................................................................... Signed
Date: 1 August 2017
Transport Modelling for West Gate Tunnel Project
Report by Tim Veitch
37
Appendix A - Matters Raised by PPV Guide to Expert
Evidence
(a) the name and address of the expert;
Timothy Robert Veitch;
62/53 Vernon Terrace
Teneriffe, QLD, 4005.
(b) the expert's qualifications and experience;
(i) The author of this report, Tim Veitch has 15 years of experience in the transport planning and travel forecasting/modelling industry (including toll road forecasting);
(ii) In his 15 years of experience working in this industry:
(A) He has spent 8 years of his career working as VLC’s Technical Director. In this role, Tim was heavily involved either as a traffic forecaster, or as a technical advisor, in many of VLC’s transport planning and traffic forecasting projects;
(B) He has spent 2.5 years of his career working as VLC’s Chief Executive Officer;
(C) He has led the development and application of sophisticated toll road forecasting models in Brisbane, Sydney and Melbourne;
(D) He has been heavily involved in the preparation of traffic and revenue forecasts for both Government and the private sector in both greenfield and brownfield projects for the following toll roads in Australia:
East Link, CityLink, and East West Link toll roads in Melbourne; and
The Clem7 tunnel, Legacy Way, Gateway Motorway and Logan Motorway in Brisbane;
(E) He has been heavily involved in the on-going development of multi-modal travel demand forecasting models for all of Australia’s mainland capital cities, including models with a proven toll road forecasting capability.
(iii) A more detailed summary of Tim’s experience is set out in Appendix B.
(c) a statement identifying the expert's area of expertise to make the report;

Transport Modelling for West Gate Tunnel Project
Report by Tim Veitch
38
(i) VLC’s work for this project involved the development and application of multi-modal travel demand forecasting model, so as to assess the potential strategic impacts of the Project;
(ii) Tim is an industry leading expert in the development and application of such models. He is the lead architect and developer of the Zenith model of Victoria, which was used by VLC on this project;
(iii) Tim has significant experience in the transport modelling of major projects in Victoria, having been heavily involved in:
(A) EastLink;
(B) CityLink Material Adverse Effects related to Wurundjeri Way;
(C) East West Link;
(D) Melbourne Metro;
(E) Geelong Bypass; and
(F) The Eddington East-West Link Needs Assessment.
(d) a statement identifying all other significant contributors to the report and where necessary outlining their expertise;
(i) In preparing this report, I was assisted by the following VLC staff:
(A) Mike Veitch – Project Director – Qualification: Master of Science (Transportation Engineering), University of Leeds, 1972; Bachelor of Engineering (Civil), University of Leeds, 1970;
(B) Aaron Alaimo – Project Manager – Qualifications: Bachelor of Engineering (Civil), University of Melbourne 1997; and
(C) Louisa Sorrentino – Senior Transport Modeller – Qualification: Bachelor of Engineering (Civil), University of Melbourne 2012.
(e) all instructions that define the scope of the report (original and supplementary and whether in writing or oral);
(i) I received a written letter of instruction from Clayton Utz on the 6th of July, 2017. That letter is attached as Appendix C;
(ii) At a meeting with Clayton Utz on the 27th of July, I received the following oral instructions:
(A) To include in my report a summary of VLC’s role in the EES, including our interactions with other members of the Project Team; and
(B) To include in my report a description of the Project as it is coded within VLC’s modelling.
(f) the identity of the person who carried out any tests or experiments upon which the expert relied in making this report and the qualifications of that person;

Transport Modelling for West Gate Tunnel Project
Report by Tim Veitch
39
(i) In preparing this report, I relied upon traffic modelling and analysis prepared by the VLC Project Team during the preparation of the EES. The traffic modelling and analysis were prepared by the following VLC staff:
(A) Aaron Alaimo – Project Manager – Qualifications: Bachelor of Engineering (Civil), University of Melbourne 1997;
(B) Louisa Sorrentino – Senior Transport Modeller – Qualifications: Bachelor of Engineering (Civil), University of Melbourne 2012; and
(C) Lawrence Leung – Transport Modeller – Qualifications: MEng(Mechatronics) – University of Melbourne, 2014; DipInform – University of Melbourne, 2012; BSc – University of Melbourne, 2012.
(g) a statement setting out the key assumptions made in preparing the report;
(i) In preparing this report, I have assumed that all of the submissions relevant to my area of expertise have been allocated to me. I am referring here to the submissions listed in Section 6.1 of this report.
(h) a statement setting out any questions falling outside the expert's expertise and also a statement indicating whether the report is incomplete or inaccurate in any respect.
(i) The scope of my expertise in relation to the EES is limited to the preparation of traffic modelling outputs, reflecting the strategic level transportation impacts of the Project in 2031;
(ii) In order to prepare those traffic modelling outputs, my team and I have relied upon inputs from the Project Team, including:
(A) The State of Victoria’s Reference Case transport modelling assumptions (which define future population / employment assumptions, future transportation network assumptions, etc.); and
(B) The definition of the Project as specified by the Project Team in conjunction with VicRoads and other Technical Advisors (e.g. road geometry, configuration, speed limits, etc.).
(iii) The following are outside my area of expertise:
(A) Detailed traffic impacts of the Project (e.g. the impact of the Project on the performance of individual road sections or intersections or particular public transport routes); and
(B) The rationale behind particular input assumptions taken from the State of Victoria’s Reference Case transport modelling assumptions, or received from other members of the Project Team (e.g. the definition of the Project).
(iv) To the best of my knowledge, nothing in this report is incomplete or inaccurate.
Transport Modelling for West Gate Tunnel Project
Report by Tim Veitch
40
Appendix B - Tim Veitch’s Curriculum Vitae
Position: Chief Executive Officer | Veitch Lister Consulting
Qualifications: B.Science (Mathematics) & B.Commerce (Finance) – The University of Queensland, 2004
Summary of experience
Tim is the Chief Executive Officer of Veitch Lister Consulting and leads the model development team. He has 14 years’ experience in the development of sophisticated four-step transport models and the software within which they operate and is a recognised industry leader in this field in Australia. Tim’s primary area of expertise is the development and application of strategic transportation models, being responsible for the development of Zenith, a multi-modal transportation modelling system which has been implemented in eight Australian cities / regions. These models are used extensively in the planning of many of Australia’s largest transport infrastructure projects. During his career, Tim has also been heavily involved in transport modelling applications. He has played key leadership roles in the transport modelling for numerous toll roads, metro rail systems, and strategic planning studies, including the EastLink toll road, East West Link and Western Distributor (Melbourne); as well as Sydney Metro and Melbourne Metro. Tim’s expertise in both the development and application of transportation models makes him unique within the industry, and allows him to develop bespoke modelling systems to analyse real-world transport problems. Examples include the development of innovative toll choice models, public transport crowding models and capacity constrained station parking models. Tim is also the author of public transport assignment software which is sold as part of the Dutch transport modelling software package OmniTRANS, and is used extensively in the Netherlands.
Relevant Project Experience
Expert Witness
• BrisConnections Proceedings, PPB Advisory (2014-present)
Expert Witness - Tim is involved as an Expert Witness in proceedings related to the failed Airport Link toll road in Brisbane. Tim prepared a joint Expert Report with Mike Veitch.
• Rivercity Motorways Litigation, Korda Mentha (2013-14)
Lead Assistant to the Expert Witness - Tim was the lead assistant to Mike Veitch in his role as Expert Witness in proceedings related to the failed Clem7 toll road in Brisbane. Tim was heavily involved in analysing the traffic models which were used to produce traffic forecasts for Clem7, and for preparing data which was input to the Expert Report.
Toll Road Forecasting

Transport Modelling for West Gate Tunnel Project
Report by Tim Veitch
41
• Legacy Way, Queensland Motorways Limited (2013-2014)
Expert Technical Advisor - Tim was heavily involved as an expert technical advisor in VLC’s preparation of investment grade traffic and revenue forecasts for Queensland Motorways Limited (QML). Those forecasts were relied upon by QML to support its successful purchase of the Legacy Way Tunnel from the Brisbane City Council.
• East West Link, Linking Melbourne Authority, VIC (2013-14)
Lead Traffic Forecaster - Tim was VLC’s lead traffic forecaster during the Victorian Government’s East West Link Needs Assessment study which proposed a major new toll road in inner Melbourne (the East West Link). In 2013/14, Tim was heavily involved as an expert technical advisor in VLC’s preparation of updated traffic forecasts for East West Link to support the Victorian Government’s East West Link Business Case.
• Long Term Traffic and Toll Revenue Forecasting, Queensland Motorways Limited (2013)
Expert Technical Advisor - Tim was heavily involved in the preparation of investment grade traffic forecasts for two existing toll roads in Brisbane, being the Gateway Motorway and Logan Motorway. Those forecasts were relied upon by QML as part of its debt refinancing.
• Clem7 tollway demand and business advisory, Queensland Motorways Limited (2010)
Lead Model Developer - Tim refined VLC’s traffic model of Brisbane to more accurately forecast demand for the soon to be built Clem7 tunnel. The resulting traffic model was used to produce traffic forecasts for QML.
• Melbourne CityLink MAE, Melbourne CityLink Authority (2009)
Lead Transport Modeller - Tim undertook modelling to estimate the impact of Wurundjeri Way on the future toll revenue of the CityLink toll road. This modelling was used to assess the material adverse effects claim by Transurban against the State of Victoria. Tim also reviewed and reported on the transport modelling conducted by Transurban as part of the case.
• EastLink, Southern and Eastern Integrated Transport Authority, VIC (2003-2004)
Lead Traffic Forecaster & Model Developer - Tim was the lead traffic forecaster in VLC’s preparation of traffic and revenue forecasts for the EastLink toll road in Melbourne. EastLink was successfully opened in 2008. As part of the project, Tim developed an entirely new toll road forecasting model, which has since been successfully applied to produce forecasts for toll roads around Australia (including all of those listed above). Tim was also heavily involved in auditing the traffic forecasts prepared by bidders.
• Lane Cove Tunnel Traffic Forecast Audit (2004)
Transport Modelling for West Gate Tunnel Project
Report by Tim Veitch
42
Transport Modeller - Tim played a supporting role in Mike Veitch’s audit of the traffic forecasts (and traffic modelling) of one of the bidders for the Lane Cove Tunnel in Sydney.
Public Transport Demand Forecasting
• Melbourne Metro Business Case, PT Division of DOT (Victoria) (2010-12)
Lead Modeller - Tim led VLC’s transport modelling for the Melbourne Metro Business Case. The outputs produced were used to plan and design the proposed Melbourne Metro rail tunnel and stations. As part of this project, Tim made significant upgrades to the Zenith transportation model, including, for the first time, behavioural responses to over-crowding on public transport services.
• Cross River Rail pre-feasibility, Queensland Transport (2009-10)
Expert Technical Advisor - Tim was heavily involved as an expert technical advisor in VLC’s transport modelling for the Cross River Rail pre-feasibility study.
• Sydney Metro Business Case, Sydney Metro Authority (2008-09)
Lead Modeller - Tim led VLC’s transport modelling for the Sydney Metro Business Case. The outputs produced were used to plan and design the proposed Sydney Metro rail tunnel.
Transportation planning
• East-West Link needs assessment, DOT Victoria (Eddington Report) (2008)
Lead Modeller - Tim led VLC’s transport modelling for the landmark planning study “East-West Link Needs Assessment” in Melbourne, which was led by Sir Rod Eddington, and led to the further planning of the East West Link tunnel and Melbourne Metro projects.
Transport Model Development
• Development of Public Transport Crowding Model, PTD Division of DOT (Victoria) (2010)
Lead Model Developer - Tim developed and implemented a new methodology for modelling public transport crowding. This method is unique in that it explicitly separates seated and standing passengers and considers their behavioural responses separately. The resulting model was used to plan, design and evaluate the proposed Melbourne Metro rail tunnel.
• Development of Toll Choice Model, SEITA (Victoria) (2003-04)
Lead Model Developer - Tim developed and implemented a new methodology for modelling the demand for toll roads. This method is unique in that automatically enumerates a logical set of tolled alternatives, which allows competition between toll roads to be explicitly modelled in a straight forward manner. The model Tim developed has been successfully applied to produce accurate traffic forecasts for

Transport Modelling for West Gate Tunnel Project
Report by Tim Veitch
43
numerous toll roads around Australia, including EastLink, Cross City Tunnel, Lane Cove Tunnel, Clem7 tunnel, Airport Link tunnel, Go Between Bridge and Legacy Way.
Publications and Conference Papers
• Veitch, T, Paech, M & Potesil, T 2012, ‘The Case for Government Buying Back of Toll Roads’, AITPM Annual National Conference 2012, AITPM, Sydney.
• Veitch, T, Alaimo, A & Walker, L 2013, ‘Demand forecasting for toll roads: an approach to more accurately forecasting traffic volumes’, 36th Australasian Transport Research Forum, ATRF, Brisbane.
• Veitch, T, Partridge, J & Walker, L 2013, ‘Estimating the costs of overcrowding on Melbourne’s rail system’, 36th Australasian Transport Research Forum, ATRF, Brisbane.
• Potesil, T, Oelrichs, C & Veitch, T 2013, ‘Rivers as barriers to mobility in Australian cities’, 36th Australasian Transport Research Forum, ATRF, Brisbane.
• Shobeirinejad, M, Veitch, T, Smart, J, Sipe, N & Burke, M 2013, ‘Destination choice decisions of retail travellers: results from discrete choice modelling in Brisbane’, 36th Australasian Transport Research Forum, ATRF, Brisbane.
• Veitch, T, Paech, M & Eaton, J 2013, ‘What’s missing from Australian Household Travel Surveys? - Off Peak Travel!’, 36th Australasian Transport Research Forum, ATRF, Brisbane.
• Veitch, T 2013, ‘A capacity constrained model of park and ride demands’, AITPM Annual National Conference 2013, AITPM, Perth.
• Brands, T, de Romph,E, Veitch,T & Cook,J 2013, ‘Modelling Public Transport Route Choice, with Multiple Access and Egress modes’, 41st European Transport Conference, ETC, Frankfurt, Germany.

Transport Modelling for West Gate Tunnel Project
Report by Tim Veitch
44
Appendix C - Detailed definition of the Project in VLC’s
modelling
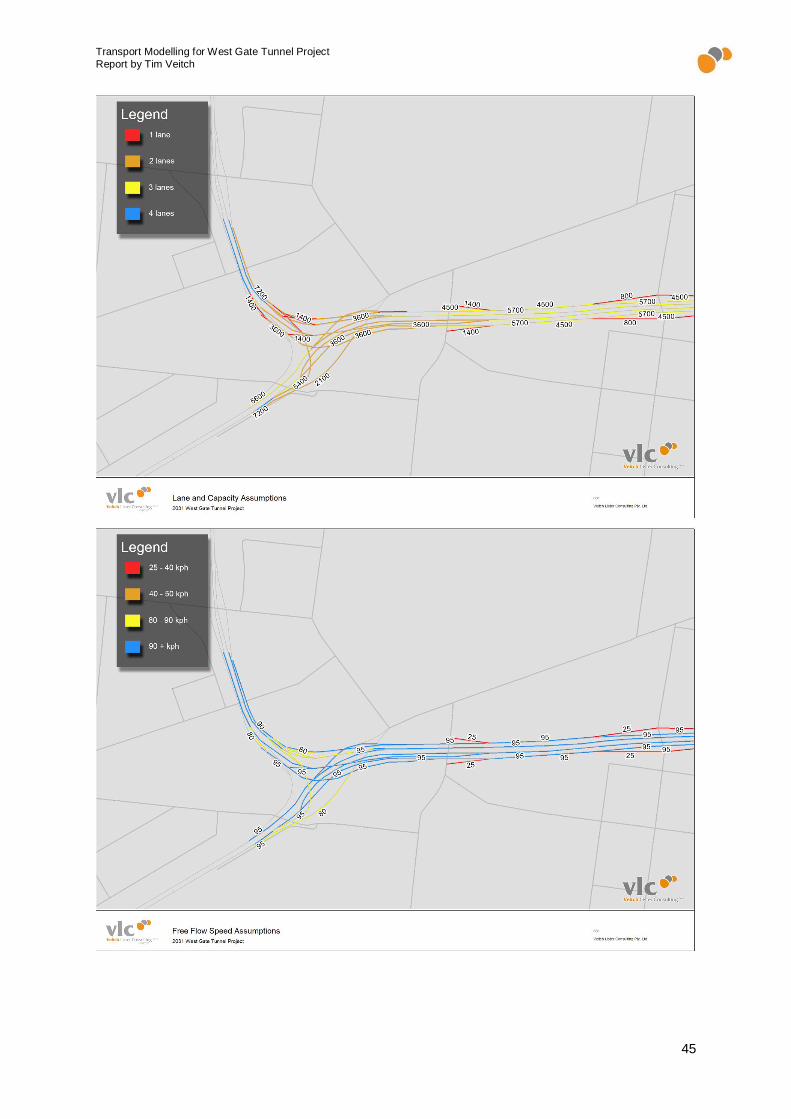
Transport Modelling for West Gate Tunnel Project
Report by Tim Veitch
45

Transport Modelling for West Gate Tunnel Project
Report by Tim Veitch
46

Transport Modelling for West Gate Tunnel Project
Report by Tim Veitch
47
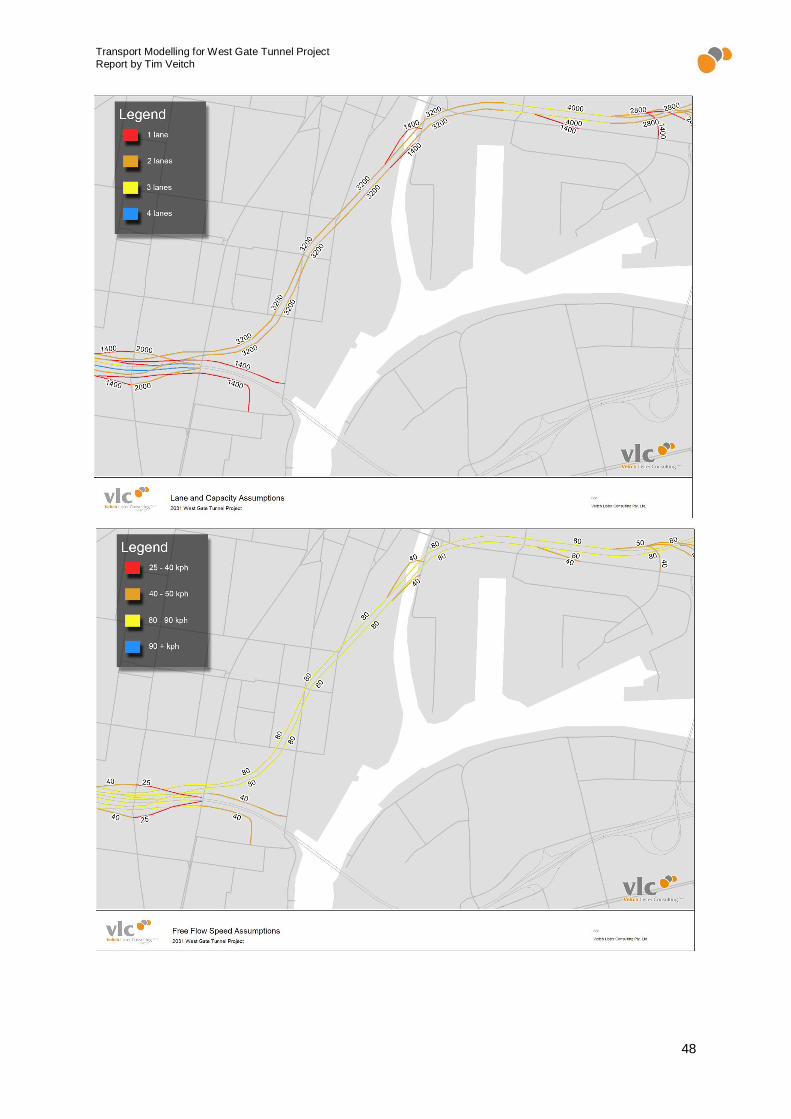
Transport Modelling for West Gate Tunnel Project
Report by Tim Veitch
48
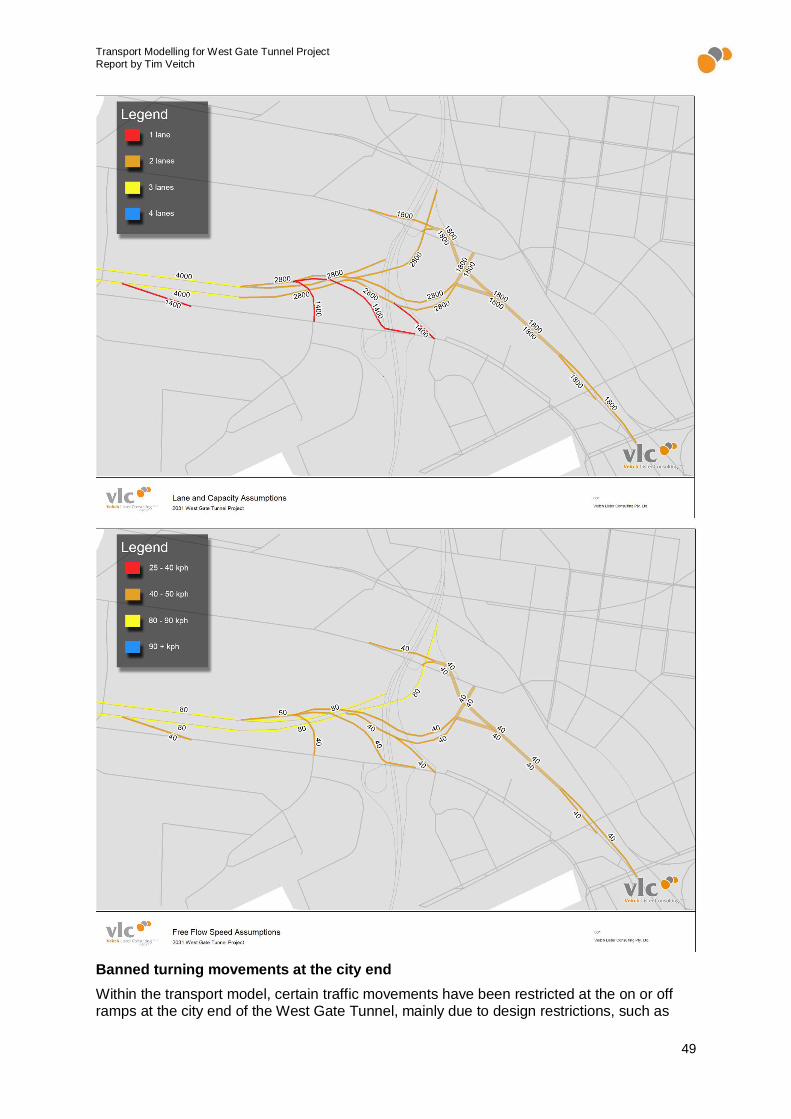
Transport Modelling for West Gate Tunnel Project
Report by Tim Veitch
49
Banned turning movements at the city end
Within the transport model, certain traffic movements have been restricted at the on or off ramps at the city end of the West Gate Tunnel, mainly due to design restrictions, such as

Transport Modelling for West Gate Tunnel Project
Report by Tim Veitch
50
traffic islands and road duplications. The “banned” movements are shown in the figure below.
Project Toll Locations
The transport model includes toll gantries at the following locations:
Heavy Commercial Vehicles
• West Gate Freeway (Main Line and Collector Distributor) between Grieve Parade and Millers Road
• West Gate Freeway (Main Line and Collector Distributor) between Millers Road and Williamstown Road / Melbourne Road
Cars and light commercial vehicles
• Hyde Street / Simcock Avenue on and off ramps • West Gate Tunnel • City Access off ramps (AM peak only)
The modelled toll gantry points are shown in the figure below.
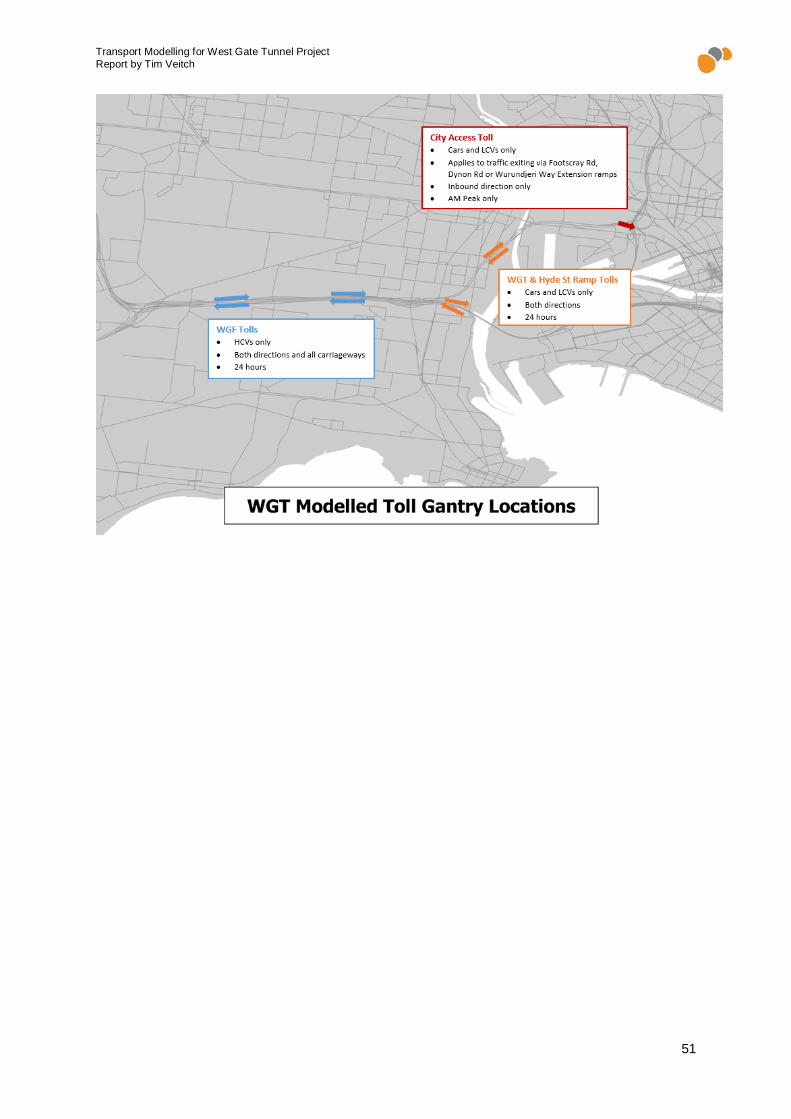
Transport Modelling for West Gate Tunnel Project
Report by Tim Veitch
51

Transport Modelling for West Gate Tunnel Project
Report by Tim Veitch
52
Appendix D - Letter of Instruction