REPORT BIOGAS
19
2019 REPORT BIOGAS
Transcript of REPORT BIOGAS
2019
REPORTBIOGAS
© 2019 Bioenergy EuropeAll rights reserved. No part of this publication may be reproduced, distributed, or transmitted in any form or by any means, including photocopying, recording, or other electronic or mechanical methods, without the prior written permission of the publisher. For permission requests, write to the publisher, addressed “Attention: Permission use Bioenergy Europe Statistical Report” at the address below, except in the case of brief quotations embodied in critical reviews and certain other non-commercial uses permitted by copyright law.
Bioenergy Europe
Place du Champ de Mars 2A1050 BrusselsT : +32 2 318 40 [email protected] www.bioenergyeurope.org
Supported by
AuthorsCristina Calderón (lead author)Martin Colla (author)Jean-Marc Jossart (content & technical guidance)Nathalie Hemeleers, Anna Martin (policy guidance)Nino Aveni (promotion)Claudio Caferri (visuals)
Contributor

TABLE OF CONTENTSCONTENTS
Index1. Biogas in Europe ............................................................................................... 8 2. Biomethane in Europe................................................................................... 14 3. Annexes ............................................................................................................. 17
List of Figures Figure 1 Evolution of the Gross Inland Energy Consumption of Biogas in EU28 (in ktoe) ....................................................... 8 Figure 2 Biogas Gross Inland Energy Consumption by End-use in 2017 in EU28 (in ktoe and %) ......................................... 8 Figure 3 Evolution of the Number of Biogas Plants in Europe ....................................................................................................... 10 Figure 4 Number of Biogas Plants in EU28 Countries in 2017 (n° of plants) (separated scale for Germany and Italy)..10 Figure 5 Distribution of Biogas Plants by feedstock in Europe in 2017 (number of plants) .............................................. ....12 Figure 6 Feedstock Use for Biogas Production in European Countries (excluding landfill - expressed as a mass percentage) ..................................................................................................................................................................................... 12 Figure 7 Evolution of the Number of Biomethane Plants in Europe.......................................................................................... .....14 Figure 8 Distribution of Biomethane Plants by Feedstock Type in 2017 for some European Countries .......................... 15 Figure 9 Evolution of the Production of Biomethane in Europe (in ktoe) .................................................................................. ...15 Figure 10 Production of Biomethane in European Countries in 2017 (in ktoe) ......................................................................... 16
List of Tables Table 1 Gross Final Energy Consumption from Biogas by End-use in EU28 Member States in 2017 (in ktoe) ............... 9 Table 2 Primary Energy Production of Biogas by Type in EU28 in 2017 and 2020 NREAPs Targets (in ktoe ........................11 Table 3 Country Codes ................................................................................................................................................................................ 17 Table 4 Symbols and Abbreviations ....................................................................................................................................................... 17 Table 5 Decimal Prefixes ............................................................................................................................................................................ 18 Table 6 General Conversion Factor for Energy .................................................................................................................................... 18
European Bioenergy Outlook 2019 | Biogas / 3

Every year since its debut release in 2007, Bioenergy Europe’s Statistical Report has provided an in-depth overview of the bioenergy sector in the EU-28 Member States.
Bioenergy Europe’s Statistical Report has been enriched each year with new figures and information, collecting unique data on the developments of the European bioenergy market from a growing number of international contributors.
Bioenergy Europe is therefore able to develop a detailed report that helps industry leaders, decision makers, investors and all bioenergy professionals to understand the situation of bioenergy in Europe.
With more than 150 graphs and figures, readers of Bioenergy Europe´s Statistical Report can get accurate and up-to-date information on the EU-28 energy system such as the final energy consumption of biomass for heat and electricity, the number of biogas plants in Europe, the consumption and trade of pellets, the production capacity of biofuels and other key information to help break down and clarify the complexity of a sector in constant evolution.
In 2017, the Report was rewarded by the European Association Awards for being the “best Provision of Industry Information and Intelligence”, a recognition after a decade of collective work.
20072010
2011
2012
2013
2014
2015
FIRSTSTATISTICAL REPORT
2009
+ EPC EUROPEAN WOOD PELLET MARKET OVERVIEW+ EXPERTS’ VIEWS+ 3000 DOWNLOADS158 PAGES
+ PELLET CHAPTER108 PAGES
+ STATISTICS ON ENplus®+ 2700 DOWNLOADS124 PAGES
+ SOCIO-ECONOMICINDICATORS+2600 DOWNLOADS
+ ANALYSIS ON THE NATIONAL
RENEWABLE ENERGY ACTION
PLANS
108 PAGES
89 PAGES
+ STATISTICS ON WOOD CHIPS CONSUMPTION+ 200 PAGES REPORT ON BIOENERGY SUPPORT SCHEMES IN EUROPE+ KEY FINDINGS REPORT +3500 DOWNLOADS
+ CHAPTER ON ENVIRONMENTAL IMPACT OF BIOENERGY+ PROJECTIONS ON BIOHEAT AND BIOELECTRICITY + AWARED AS “THE BEST PROVISION OF INDUSTRY INFORMATION AND INTELLIGENCE” BY THE EUROPEAN ASSOCIATION AWARD+4.000 DOWNLOADS300 PAGES
2016
2017
+UPDATED INFORMATION ON BIOELECTRICITY AND BIOHEAT MARKET AND SUPPORT SCHEMES IN ALL EU28 MS+ A SEPARATE REPORT ON ENplus®
2019REPORT AVAILABLE TO THE PUBLIC, FREE OF CHARGE. EMPHASIS ON PROVIDING TRANSPARENT DATA AND SHARING KNOWLEDGE TO SUPPORT ANY PRIVATE AND PUBLIC INITIATIVE PROMOTING BIOENERGY.300 PAGES
2018
STATISTICAL REPORT
TIMELINE
/ European Bioenergy Outlook 2019 | Biogas4
ABOUT
OUR ACTIVITIES
A N ET WO R K O FB I O E N E R G Y E U R O P E
INTERNATIONAL BIOMASS
TORREFACTION COUNCIL
A N ET WO R K O FB I O E N E R G Y E U R O P E
Bioenergy Europe carries a wide range of activities aimed at supporting its members by informing them about latest EU and national policy developments, and by voicing their concerns to EU and other authorities. These include advocacy activities in key policy areas as well as the organisation of dedicated working groups acting as platforms where members can discuss common issues and exchange information on the state of play of bioenergy.
There are currently 7 active working groups:
• Agrobiomass & Energy Crops• Biopower & CHP• Competitiveness• Domestic Heating• Sustainability• Pellets• Wood ChIps
In addition, Bioenergy Europe conceives and deploys targeted publications and communication campaigns to inform and educate about the potential of bioenergy for a decarbonised Europe.
Most notably, the association has several years of experience in data collection on the evolution of the bioenergy market and produce unique and tailored analyses along the year.
Thanks to the experience and authority acquired over the last 19 years, Bioenergy Europe successfully established two international certification schemes to guarantee high quality standard for fuels.
Bioenergy Europe is also the umbrella organisation of the European Pellet Council (EPC) and the International Biomass Torrefaction Council (IBTC). These networks have been created thanks to the dynamics of Bioenergy Europe members. Today, these networks bring together bioenergy experts and company representatives from all over Europe.
The European Pellet Council (EPC) is an umbrella organisation of Bioenergy Europe founded in 2010, representing the interests of the European wood pellet sector. Its members are national pellet associations or related organisations from 18 countries.
The EPC is a platform for the pellet sector to discuss the issues related to the transition from a niche product to a major energy commodity. These issues include the standardisation and certification of pellet quality, safety, security of supply, education and training, and the quality of pellet-using devices.
EPC is managing the ENplus® quality certification.
www.pelletcouncil.euwww.enplus-pellets.eu
The International Biomass Torrefaction Council (IBTC) is an umbrella organisation of Bioenergy Europe launched in 2012 and aims to building the first platform for companies having common interests in the development of torrefied Biomass markets. Currently, the IBTC initiative is supported by more than 23 companies active worldwide.
IBTC’s objective is to promote the use of torrefied biomass as an energy carrier and to assist the development of the torrefaction industry. In this respect, IBTC’s key activities are to undertake studies or projects, and to commonly voice its members’ concerns to third parties to help to overcome barriers of market deployment.
www.ibtc.bioenergyeurope.org
European Bioenergy Outlook 2019 | Biogas / 5

ACADEMIA
BIOENERGY EUROPE is the common voice of the bioenergy sector with the aim to develop a sustainable bioenergy market based on fair business conditions.
BIOENERGY EUROPE is a non-profit Brussels-based international organisation founded in 1990 which brings together national associations and companies from all over Europe – thus representing more than 4000 indirect members, including mainly companies and research centers.
www.bioenergyeurope.org
ASSOCIATIONS
ABOUT
BIOENERGY EUROPE
/ European Bioenergy Outlook 2019 | Biogas6

Members as of August 2019.
ABOUT
BIOENERGY EUROPE
Companies
7European Bioenergy Outlook 2019 | Biogas / 7

1. Biogas in Europe
* Mainly the biogas consumed as energy for support operations in biogas gasification plants (535 ktoe)** Distribution losses = 66 ktoeSource: Eurostat
16.826
0
2.000
4.000
6.000
8.000
10.000
12.000
14.000
16.000
18.000
13.18778,4%
1.4348,5%
5593,3%
5373,2%
4993,0%
3912,3%
1500,9%69
0,4%
Transformation input - for heat & electricity generation
Final energy consumption - commercial and public services
Energy use within the energy sector*
Final energy consumption - agriculture and forestry
Final energy consumption - industry sector
Final energy consumption - households
Final energy consumption - transport sector
Final energy consumption - not elsewhere specified &distribution losses**
/ European Bioenergy Outlook 2019 | Biogas8
The gross inland energy consumption of biogas has increased tremendously since 1990 and has been multiplied by a factor of 25. Over time this upward trend has demonstrated the strength and resilience that lies within the national biogas market. This increase was supported by the fast development of advanced technologies, resulting in higher plant efficiency, cheaper digesters as well as the cheaper upgrading units used for the conversion of raw biogas to biomethane of a natural gas grade.
However, In 2017 figures showed that biogas represented only 1% of the total gross inland energy consumption
within the EU28 Member States with 12% of the bioenergy used across the EU being that of biogas. These statistics
highlight that the overall use of biogas equated to around 4% in comparison to that of natural gas consumption. In
light of this, it is clear that there is still the possibility for a large increase of biogas usage and a real need to promote
this bioenergy as one of the reliable solutions for a low-carbon energy transition.
Figure 1 Evolution of the Gross Inland Energy Consumption of Biogas in EU28 (in ktoe)
Source: Eurostat
Figure 2 Biogas Gross Inland Energy Consumption by End-use in 2017 in EU28 (in ktoe and %)

Gross Final Energy
Consumption
Gross Electricity Generation
Direct used - Final Consumption
(industry, household, commercial etc.)
Gross Heat Generation Transport
EU28 9.199 5.452 2.864 734 150 Growth rate (2016-2017) 2% 1% 3% 8% 14%
AT 107 54 49 4 0,3 BE 184 81 94 9 0 BG 30 19 8 3 0 CY 10 4 4 1 0 CZ 403 227 158 17 0 DE 4.632 2.913 1.466 215 38 DK 230 59 96 75 0,3 EE 12 4 8 1 0 EL 44 26 18 0 0 ES 134 81 53 0 0 FI 81 35 25 21 0,3 FR 513 180 271 62 0 HR 35 27 0 8 0 HU 49 29 18 2 0 IE 27 17 10 0 0 IT 981 714 41 226 0 LT 21 11 8 2 0 LU 13 6 5 2 0 LV 67 35 8 24 0 MT 2 1 1 0 0 NL 193 79 108 6 0 PL 198 94 83 21 0 PT 33 25 8 0 0 RO 16 6 5 5 0 SE 269 1 147 10 111 SI 18 11 1 5 0 SK 96 51 32 13 0 UK 954 664 290 0 0
European Bioenergy Outlook 2019 | Biogas / 9
Depending on the process and feedstock considered, it is estimated that greenhouse gas (GHG) emission savings
due to the use of biogas can reach more than 200% per unit of energy compared to fossil fuel. In fact, in 2017 the
savings of GHG emissions due to biogas was estimated to 61 Mt CO2eq, which is roughly the equivalent of the
annual emission of Bulgaria and representing 1,3% of the annual EU28 GHG emissions in 2017. These figures
demonstrate the importance and potential of biogas as a contributor to achieve the EU GHG reduction targets.
Almost one third of biogas consumption is directly used within different sectors (commercial and services,
agricultural, industrial and residential). Germany, Italy, as well as the United Kingdom are the leaders in biogas
production within Europe. These three countries consume respectively 50%, 10,7% and 10,4% of the gross final
energy consumption of biogas within Europe.
Table 1 Gross Final Energy Consumption from Biogas by End-use in EU28 Member States in 2017 (in ktoe)
Source: Eurostat

Figure 3 Evolution of the Number of Biogas Plants in Europe
*EU28 + Switzerland + Norway + SerbiaSource: EBA
The biogas sector is expanding and has experienced many improvements in the last decade in terms of efficiency (physical and economic) due to research and innovation. Germany is the European leader in biogas even though there is a lull in recent years in this country (regarding the implementation of new biogas plants) mainly due to changes in the national support scheme (EEG). On their side, the United Kingdom and France have continued to increase the amount of new plants in operation.
Figure 4 Number of Biogas Plants in EU28 Countries in 2017 (n° of plants) (separated scale for Germany and Italy)
Source: EBA
6.227
10.508
12.397
13.81214.661
16.83417.439 17.432 17.783
0
2.000
4.000
6.000
8.000
10.000
12.000
14.000
16.000
18.000
20.000
2009 2010 2011 2012 2013 2014 2015 2016 2017
10.971
1.655
742
613574
423
308268
204 198 186 179144
96 8164 56
37 36 30 29 26 26 18 13 11 11
0
100
200
300
400
500
600
700
800
0
2.000
4.000
6.000
8.000
10.000
12.000
DE IT FR UK CZ AT PL NL ES SE BE SK DK FI HU PT LV EL LT LU IE HR SI EE CY BG RO
/ European Bioenergy Outlook 2019 | Biogas10

Six countries have currently achieved their biogas target for 2020 under the ‘National Renewable Energy Action Plans’ (NREAPs) those countries being Austria, Germany, Italy, Portugal, Sweden as well as the United Kingdom. Landfill and sewage gas accounts for around 24% of total biogas production while most of the biogas is produced from anaerobic fermentation of agricultural feedstock.
Table 2 Primary Energy Production of Biogas by Type in EU28 Member States in 2017 and 2020 NREAPs Targets (in ktoe)
Total Biogas Landfill gas Sewage sludge
gas
Other biogas from anaerobic fermentation
Biogas from thermal
processes
NREAPs targets
EU28 16.826 2.596 1.387 12.629 214 20.820 Growth Rate (2016-2017) 0% -3% 1% 1% 34% /
AT 246 2 15 229 n.a. 162 BE 224 20 25 174 5 418 BG 47 n.a. 3 44 n.a. 111 CY 12 n.a. 1 11 n.a. 35 CZ 608 23 43 541 n.a. 902 DE 7.845 132 460 7.252 n.a. 7.748 DK 389 5 26 235 123 807 EE 13 9 3 n.a. n.a. 0 EL 107 69 16 22 n.a. 220 ES 261 150 65 23 24 761 FI 125 21 16 31 56 137 FR 899 311 27 561 n.a. 1.562 HR 64 5 3 55 n.a. 0 HU 92 15 29 48 n.a. 222 IE 55 38 9 7 n.a. 117 IT 1.898 350 54 1.488 6 1.796 LT 32 5 7 20 n.a. 160 LU 20 0 2 19 n.a. 51 LV 93 8 2 83 n.a. 201 MT 2 n.a. n.a. 2 n.a. 0 NL 321 17 58 246 n.a. 1.485 PL 281 48 115 118 n.a. 1.520 PT 85 73 3 9 n.a. 50 RO 18 n.a. n.a. 18 n.a. 233 SE 178 5 79 95 n.a. 26 SI 26 2 2 22 n.a. 90 SK 152 10 12 130 n.a. 282 UK 2.733 1.277 312 1.144 n.a. 1.724
Source: Eurostat
European Bioenergy Outlook 2019 | Biogas / 11
Thermal processes represent gasification or pyrolysis of biomass as wood residues to produce biogas and in 2017
accounted for around 1,3% of the biogas production.

Figure 5 Distribution of Biogas Plants by feedstock in Europe* in 2017 (number of plants)
*EU28 + Switzerland + Norway + SerbiaSource: EBA
In Europe, up to 70% of the feedstocks used for biogas production come from the agricultural sector such as energy crops, manure, as well as agricultural residues. The utilisation of agricultural residues such as manure is particularly important in countries such as Denmark, France and Italy. This underlying growth in synergies between animal farming and biogas provide a profitable manure management solution. Energy crops such as Maize, Silphium or Sorghum are largely used in Germany and Austria. The organic waste (municipal – included in figure 5 in “other”, or industrial – from food and beverage industry) still has the potential to be developed for use in biogas production as it is currently underrepresented.
Figure 6 Feedstock Use for Biogas Production in European Countries (excluding landfill - expressed as a mass percentage)
Source: EBA
Agriculture12.72171%
Sewage2.85416%
Landfill1.3748%
Other6884%Unknown
1361%
0%
10%
20%
30%
40%
50%
60%
70%
80%
90%
100%
2014 2015 2017 2017 2017 2015 2017 2015 2017 2017 2014 2014 2017 2015 2017 2017
AT BE CY DE DK ES FI FR DE HU IT LV PL PT SE UK
Energy crops Agricultural residues Biowaste, municipal waste
Industrial (food and beverage) Sewage Other waste fraction
/ European Bioenergy Outlook 2019 | Biogas12

Move your business forward with improved
fuel flexibility
A multifuel boiler gives you the flexibility to choose the most economic
fuel based on availability and price. Valmet’s HYBEX and CYMIC boilers,
CFB gasifiers and flue gas cleaning ensure high efficiency and reliability
with low emissions – even with the most challenging fuel combinations.
Our advanced services and automation solutions improve the reliability
and performance of your processes. Read more at valmet.com/energy

2. Biomethane in Europe
Biomethane is defined as methane produced from biomass, with properties close to natural gas. The initial product is raw biogas which is purified (upgraded) to reach a high methane content (usually >96%) which can then be used in the gas grid or as a fuel for transport. The number of biomethane plants has nearly tripled from 2011 to 2017 showing the fast development of this sector.
Figure 7 Evolution of the Number of Biomethane Plants in Europe*
*EU28 + Switzerland + NorwaySource: EBA
In 2017, 18 new biomethane plants were constructed in France and before the end of 2018, 23 additional plants were installed, reaching a total of 67 biomethane plants. France has the highest growth rate for biomethane plants due to favourable policy conditions for biomethane production. The country is attempting to reach 1.000 biomethane plants injecting its gas into the national gas grid by 2020. To achieve this target, an incentive scheme has been put in place to support biomethane production.
In Belgium the biomethane sector is starting to gain traction with the first plant coming into fruition in 2018.
With the right incentives, biomethane is a commercially viable fuel: it can rely on existing natural gas infrastructure
and it contributes to reaching European climate targets by reduced CO2 emissions and improved air quality.
187
232
282
367
456497
540
0
100
200
300
400
500
600
2011 2012 2013 2014 2015 2016 2017
/ European Bioenergy Outlook 2019 | Biogas14

Figure 8 Distribution of Biomethane Plants by Feedstock Type in 2017 for some European Countries
Source: EBA
Figure 9 Evolution of the Production of Biomethane in Europe* (in ktoe)
*EU28 + Switzerland + NorwaySource: EBA
In 2017, the biomethane produced (1.664 ktoe) was equivalent to 0,42% of the natural gas consumed in Europe.
65
196
800
995 1.057
1.484
1.664
-
200
400
600
800
1.000
1.200
1.400
1.600
1.800
2011 2012 2013 2014 2015 2016 2017
0%
10%
20%
30%
40%
50%
60%
70%
80%
90%
100%
AT DE DK ES FI FR HU IT LU NL SE UK
Energy crops Agricultural residues Biowaste, municipal waste
Industrial (food and beverage) Sewage Landfill
Unknown
European Bioenergy Outlook 2019 | Biogas / 15

Figure 10 Production of Biomethane in European Countries in 2017 (in ktoe)
Source: EBA
Additionally, Belgium, Estonia as well as Ireland reported their first biomethane production plants in 2018.
838
355
114 10177
5834 26 26 13 9 5 5 2
0
100
200
300
400
500
600
700
800
900
DE UK SE NL DK FR NO CH IT AT FI ES HU LU
/ European Bioenergy Outlook 2019 | Biogas16
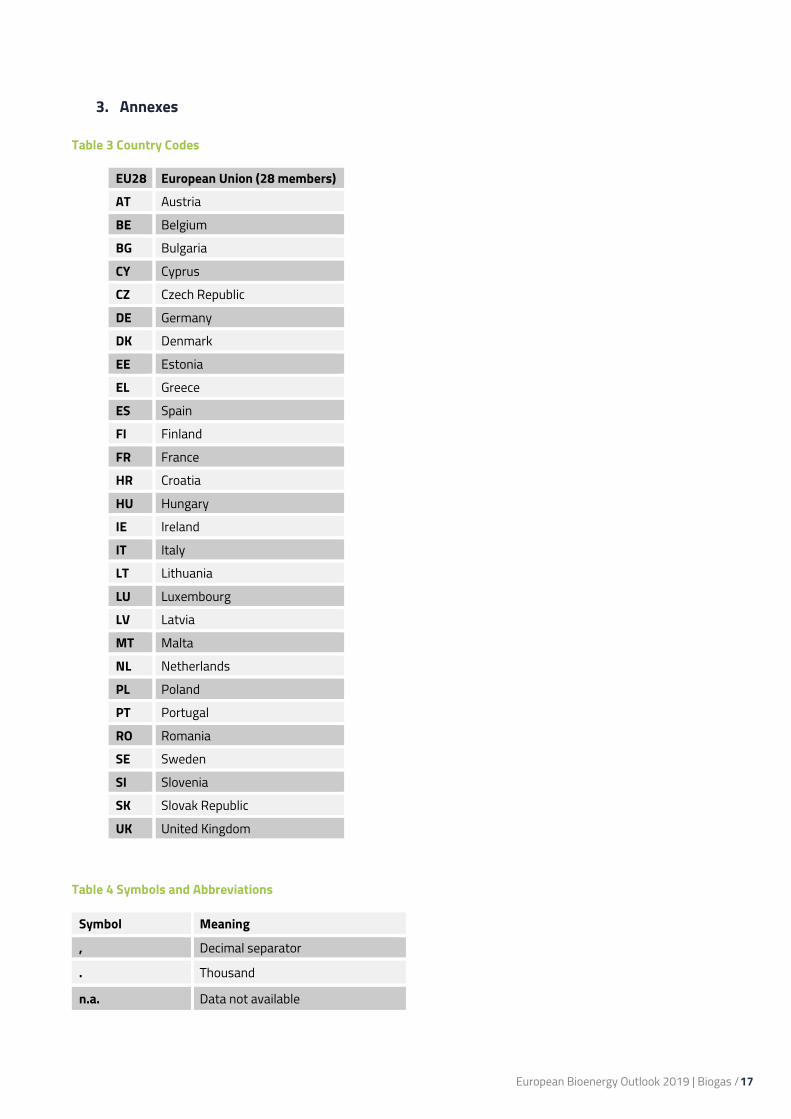
3. Annexes
Table 3 Country Codes
EU28 European Union (28 members) AT Austria BE Belgium BG Bulgaria CY Cyprus CZ Czech Republic DE Germany DK Denmark EE Estonia EL Greece ES Spain FI Finland FR France HR Croatia HU Hungary IE Ireland IT Italy LT Lithuania LU Luxembourg LV Latvia MT Malta NL Netherlands PL Poland PT Portugal RO Romania SE Sweden SI Slovenia SK Slovak Republic UK United Kingdom
Table 4 Symbols and Abbreviations
Symbol Meaning , Decimal separator . Thousand
n.a. Data not available
European Bioenergy Outlook 2019 | Biogas / 17

Table 5 Decimal Prefixes
101 Deca (da) 10-1 Deci (d) 10² Hecto (h) 10-2 Centi (c) 10³ Kilo (k) 10-3 Milli (m) 106 Mega (M) 10-6 Micro (μ) 109 Giga (G) 10-9 Nano (n) 1012 Tera (T) 10-12 Pico (p) 1015 Peta (P) 10-15 Femto (f) 1018 Exa (E) 10-18 Atto (a)
Table 6 General Conversion Factor for Energy
to from
1 MJ 1kWh 1 kg oe Mcal
1 MJ 1 0,278 0,024 0,239 1 kWh 3,6 1 0,086 0,86 1 kg oe 41,868 11,63 1 10 1 Mcal 4,187 1,163 0,1 1
/ European Bioenergy Outlook 2019 | Biogas18

Bioenergy EuropePlace du Champ de Mars 2A1050 BrusselsT : +32 2 318 40 [email protected] www.bioenergyeurope.org
Valmet is the leading global developer and supplier of process technologies, automation and services for the pulp, paper and energy
industries. Valmet's net sales in 2018 were approximately EUR 3.3 billion.
Valmet's strong technology offering includes pulp mills, tissue, board and paper production lines, as well as power plants for bioenergy production.
Valmet’s advanced services and automation solutions improve the reliability and performance of customers' processes and enhance the
effective utilization of raw materials and energy.
13,000 professionals around the world work close to the customers and are committed to moving their performance forward.
www.valmet.com
Supported by
Want to become a sponsor?Contact us.