Renewable Energy & Industry Lebanon
93
RENEWABLE ENERGY AND INDUSTRY PROMOTING INDUSTRY AND JOB CREATION FOR LEBANON A UNDP-CEDRO PUBLICATION OCTOBER 2015 Empowered lives. Resilient nations. This project is funded by the European Union
-
Upload
mario-elia-khater -
Category
Documents
-
view
202 -
download
3
Transcript of Renewable Energy & Industry Lebanon

RENEWABLE ENERGY AND INDUSTRYPROMOTING INDUSTRY AND JOB CREATION FOR LEBANON
A UNDP-CEDRO PUBLICATIONOCTOBER 2015
Empowered lives.Resilient nations.
This project is funded by the European Union

1
This study is implemented by the UNDP-CEDRO Project; Phase 3 and 4
This project is funded by the European Union CEDRO phase 4 (2014–2016) is funded by the European Union
CEDRO phase 3 (2010–2014) was funded by the Agencia Española de Cooperación Internacional Para El Desarrollo (Spanish International Cooperation Agency for Development) AECID through the Lebanon Recovery Fund (LRF)

2
Acknowledgement
The UNDP-CEDRO Project would like to thank both the Government of Spain and the European Union for the donation of funds that enabled the CEDRO project from its first three phases to its current forth phase. This study has been funded through both these kind contributions.
Copyright © UNDP / CEDRO – 2015
Reproduction is authorized provided the source is acknowledged and provided reproduction is not sold. The United Nations Development Programme (UNDP) is the UN’s principle provider of development, advice advocacy and grant support. With 131 country offices, it has long enjoyed the trust and confidence of government and NGOs in many parts of the developing as well as the developed world. It is typically regarded as a partner rather than as an adversary, and its commitment to universal presence proved especially useful in post – conflict situation and with states that have been otherwise isolated from international community. For further information
United Nations Development Programme, www.undp.org.lb <http://www.undp.org.lb> CEDRO, www.cedro-undp.org <http://www.cedro-undp.org> Note: The information contained within this document has been developed within a specific scope, and might be updated in the future.
Disclaimer
The contents of this document are the sole responsibility of its authors, and do not necessarily reflect the opinion of the United Nations Development Programme, who will not accept any liability derived from its use.

3
Table of Contents
Table figures ...........................................................................................................................................................................................................................8
Table of tables ........................................................................................................................................................................................................................9
Abbreviations .......................................................................................................................................................................................................................11
Executive Summary .............................................................................................................................................................................................................13
1. Introduction ..............................................................................................................................................................................................................14
2. Lebanon’s RE Landscape ...................................................................................................................................................................................................15
2.1 RE Capacity in Arab Countries ........................................................................................................................................................................15
2.2 RE Potential in Lebanon .................................................................................................................................................................................16
2.3 RE limitations ................................................................................................................................................................................................20
2.4 Value Chains of RES .......................................................................................................................................................................................20
2.5 Key Actors in Lebanon’s Renewable Energy Landscape ..................................................................................................................................22
2.6 National RE Initiatives ...................................................................................................................................................................................22
2.6.1 NEEAP ......................................................................................................................................................................................................22
2.6.2 NEEREA ....................................................................................................................................................................................................22
2.6.3 FITs in the MENA region and NET Metering in Lebanon ............................................................................................................................23
2.7 RE related Standards .....................................................................................................................................................................................23
2.7.1 RE Systems standards ..............................................................................................................................................................................23
2.7.2 Standards applied by Lebanese companies ..............................................................................................................................................24
2.7.3 Construction Standards ............................................................................................................................................................................24
2.8 Training, Higher Education, and Research in RES ...........................................................................................................................................24
2.8.1 Academic Activity in RE ............................................................................................................................................................................25
2.8.2 University programs and courses .............................................................................................................................................................25
2.8.3 Curricula plans .........................................................................................................................................................................................25
2.8.4 Graduates ................................................................................................................................................................................................26
2.8.5 RE research ..............................................................................................................................................................................................26
2.8.6 Collaboration among academia and private and public sectors ...............................................................................................................26
2.8.7 Know-how and Skills ...............................................................................................................................................................................26
2.9 Import and Domestic Production of RE Components and Systems .................................................................................................................27
2.9.1 RES Availability in Lebanon ......................................................................................................................................................................27
2.9.2 Developments in Corporate RES Activities ................................................................................................................................................27

4
2.9.3 Manufacturing Inputs and Machines .......................................................................................................................................................28
2.9.4 RES Importer and Manufacturer Workforce ..............................................................................................................................................28
2.9.5 RES Workforce Training ............................................................................................................................................................................28
2.9.6 Workforce Recruitment ............................................................................................................................................................................29
2.9.7 Cost Structure ..........................................................................................................................................................................................29
2.9.8 Turnover and Factors of Production ..........................................................................................................................................................29
2.9.9 Profitability ..............................................................................................................................................................................................30
2.9.10 Client Profile ......................................................................................................................................................................................30
2.9.11 Demand for RES .................................................................................................................................................................................30
2.9.12 Growth Expectations ..........................................................................................................................................................................31
3. RES Prospects for Lebanon’s Industrial Sector ...................................................................................................................................................................31
3.1 RES Assembly and Manufacture ....................................................................................................................................................................31
3.1.1 S-curve of Technology Adoption ..............................................................................................................................................................32
3.2 Obstacles and Challenges to the Implementation of RES ...............................................................................................................................32
3.2.1 Subsidized conventional fuel ...................................................................................................................................................................33
3.2.2 Cost and Pricing of RE Technology ............................................................................................................................................................33
3.2.3 Government Policy...................................................................................................................................................................................34
3.2.4 Regulatory Framework ............................................................................................................................................................................34
3.2.5 Lack of awareness ....................................................................................................................................................................................35
3.3 Labor Market Implications .............................................................................................................................................................................36
3.4 Economic Simulations ...................................................................................................................................................................................36
3.4.1 Available Financing ..........................................................................................................................................................................................36
3.4.2 Current Economic Contribution ................................................................................................................................................................36
3.4.3 Scenarios and Assumptions .....................................................................................................................................................................37
4. Recommendations ...........................................................................................................................................................................................................40
4.1 Summary of Recommended Measures ..........................................................................................................................................................40
4.2 Financial Measures ........................................................................................................................................................................................41
4.2.1 Customs ...................................................................................................................................................................................................41
4.2.2 Electricity Rates .......................................................................................................................................................................................41
4.2.3 FIT ............................................................................................................................................................................................................41
4.3 Legal Measures ..............................................................................................................................................................................................41

5
4.3.1 Regulation of RES imports .......................................................................................................................................................................42
4.3.2 Building Code Reform ..............................................................................................................................................................................42
4.3.3 RE law ......................................................................................................................................................................................................42
4.4 Educational Measures ....................................................................................................................................................................................42
4.4.1 Interaction between universities and industry ........................................................................................................................................42
4.4.2 Public Awareness .....................................................................................................................................................................................42
5. Conclusion ........................................................................................................................................................................................................................43
Annex A - System Composition, Components, and Value Chains ..........................................................................................................................................44
Value Chain of a Solar Water Heater System ..............................................................................................................................................................44
General .....................................................................................................................................................................................................................44
Value Chain ...............................................................................................................................................................................................................44
Market Dynamics and Key Actors in the Supply Chain ...............................................................................................................................................45
Residential Applications ...........................................................................................................................................................................................45
Types of SWH ............................................................................................................................................................................................................45
Anatomy of a SWH Evacuated Tube Collector ............................................................................................................................................................46
Anatomy of a Flat-Plate SWH Collector .....................................................................................................................................................................46
Manufacturing and Component Values .....................................................................................................................................................................47
Systems Integrators ..................................................................................................................................................................................................48
Worldwide Perspective .............................................................................................................................................................................................48
Value Chain of a Photovoltaic (PV) system ......................................................................................................................................................................48
General .....................................................................................................................................................................................................................48
Value Chain ...............................................................................................................................................................................................................48
From Sand to Solar Panels: The Making of PV Modules .............................................................................................................................................49
Wafering ...................................................................................................................................................................................................................49
Production of Solar Cells ...........................................................................................................................................................................................50
Assembly of Solar Cells into Modules ........................................................................................................................................................................50
Electrical Components ..............................................................................................................................................................................................50
Mounting ..................................................................................................................................................................................................................51
Worldwide Perspective .............................................................................................................................................................................................53
Value Chain of a CSP System ...........................................................................................................................................................................................53
General .....................................................................................................................................................................................................................53

6
Various CSP technologies ..........................................................................................................................................................................................53
CSP Value Chain in a nutshell ....................................................................................................................................................................................53
Project Development ................................................................................................................................................................................................53
Materials ...................................................................................................................................................................................................................53
Mirror Manufacturing ...............................................................................................................................................................................................54
Worldwide Perspective .............................................................................................................................................................................................54
Value Chain of a Small-Scale Wind Systems ....................................................................................................................................................................55
General .....................................................................................................................................................................................................................55
Value Chain ...............................................................................................................................................................................................................55
Manufacturing Components of a Wind Energy System ..............................................................................................................................................55
Blades .......................................................................................................................................................................................................................55
Towers ......................................................................................................................................................................................................................55
Nacelle ......................................................................................................................................................................................................................55
Value Chain of a Large-Scale Wind Farm .........................................................................................................................................................................56
General .....................................................................................................................................................................................................................56
Manufacturing Components of a Wind Energy System ..............................................................................................................................................57
Value Chain Opportunities other than Manufacturing ..............................................................................................................................................57
Operations and maintenance during the life cycle of the wind farm .........................................................................................................................57
Project Development Phase ......................................................................................................................................................................................58
Worldwide Perspective .............................................................................................................................................................................................58
Value Chain of a Small Scale Bioenergy System ..............................................................................................................................................................58
General .....................................................................................................................................................................................................................58
Biomass Fuel .............................................................................................................................................................................................................58
Anatomy of a Small-Scale Bioenergy System ............................................................................................................................................................59
Biomass Boiler ..........................................................................................................................................................................................................59
Components .............................................................................................................................................................................................................59
Worldwide Perspective .............................................................................................................................................................................................59
Value Chain of a Large-Scale Bioenergy System .............................................................................................................................................................59
General .....................................................................................................................................................................................................................59
Reducing Uncertainties .............................................................................................................................................................................................60
Value Chain of a CHP Biomass Project .............................................................................................................................................................................60

7
Boilers ......................................................................................................................................................................................................................61
Worldwide Perspective .............................................................................................................................................................................................61
Value Chain of a Large Hydro System ..............................................................................................................................................................................61
General .....................................................................................................................................................................................................................61
Advantages and Disadvantages ................................................................................................................................................................................62
Principle of Operation ...............................................................................................................................................................................................62
Hydroelectric Turbine-Generator ...............................................................................................................................................................................62
Project Considerations ..............................................................................................................................................................................................63
Worldwide Perspective .............................................................................................................................................................................................63
Value Chain of a Pico-Hydro System ...............................................................................................................................................................................63
General .....................................................................................................................................................................................................................63
Portable Pico-hydro system ......................................................................................................................................................................................63
Worldwide Perspective .............................................................................................................................................................................................63
Value Chain of a Heat Pump ...........................................................................................................................................................................................64
General .....................................................................................................................................................................................................................64
Types ........................................................................................................................................................................................................................64
Closed-Loop Systems ................................................................................................................................................................................................64
Components .............................................................................................................................................................................................................64
Worldwide Perspective .............................................................................................................................................................................................64
Annex B - Introduction of the Key actors in the RE Landscape ..............................................................................................................................................66
Association of Lebanese Industries (ALI) ...................................................................................................................................................................66
The Lebanese Association for Energy Saving and For Environment (ALMEE) .............................................................................................................66
Industrial Research Institute (IRI) .............................................................................................................................................................................66
Lebanon Green Building Council (LGBC) ....................................................................................................................................................................66
The Lebanese Standards Institution (LIBNOR) ...........................................................................................................................................................67
Lebanese Solar Energy Society (LSES) .......................................................................................................................................................................67
United Nations Industrial Development Organization (UNIDO) .................................................................................................................................67
Annex C - Interview Methodology ........................................................................................................................................................................................68
Annex D - RES University Courses and Programs ..................................................................................................................................................................69
Annex E - Number of University Graduates from RES Courses and Programs ........................................................................................................................72
Annex F - Types and Prices of Locally-Manufactured and Imported RES and Components ....................................................................................................73

8
Annex G - RES Manufacturing Inputs and their Origins ........................................................................................................................................................86
Annex H - Tariffs on RES and Parts ........................................................................................................................................................................................88
Bibliography ........................................................................................................................................................................................................................89
Table figures
Figure 1.1: RE targets in RCREEE countries. P.E. = Primary Energy. Data from RCREEE (2012) ...............................................................................................14
Figure 2.1: Central estimate power density map of the Republic of Lebanon at 80 m above ground level ............................................................................17
Figure 2.2: Percentage & interviewed RES importers ...........................................................................................................................................................27
Figure 2.3: RES importers labor profile (base: 26) ................................................................................................................................................................28
Figure 2.4: RES manufacturers labor profile (base: 10) .........................................................................................................................................................28
Figure 2.5: Local RES demand ..............................................................................................................................................................................................31
Figure 3.1: Lebanon’s s-curve for RES private market adoptions ...........................................................................................................................................32
Figure 3.2: Levelized cost for various energy sources (Source: CAPEX ranges are based on reports by the International Renewable Energy Agency (IRENA, 2012) and experts’ estimates; oil price ranges are based on forecasts of the International Energy Agency (IEA, 2014)) .......................................................34
Figure 3.3: Proposed structure of the electricity sector based on Law 462 and the Regulations of the Higher Council of Privatization with the Required Modification for the Potential FIT (Data from Beheshti (2010) ............................................................................................................................................ 35
Figure A-1: SWH value chain ................................................................................................................................................................................................44
Figure A-2: Primary solar collector types ..............................................................................................................................................................................45
Figure A-3: Thermosiphon Principle (left) and Pump circulated system (right) ....................................................................................................................46
Figure A-4: SWH Evacuated Tube Collector ...........................................................................................................................................................................46
Figure A-5: A Flat Plate Type Collector—Cross Section ........................................................................................................................................................47
Figure A-6: Production chain of a PV system ........................................................................................................................................................................48
FigureA-7: The Czochralski Method ......................................................................................................................................................................................49
Figure A-8: The manufacturing of wafers .............................................................................................................................................................................50
Figure A-9: Manufacturing solar cells ...................................................................................................................................................................................50
Figure A-10: CSP value chain ................................................................................................................................................................................................53
Figure A-11: Glass based CSP categories...............................................................................................................................................................................54
Figure A-12: PVB-laminated mirror. (source: Guardian Industries Corp., Science and Technology Center) ............................................................................54
Figure A-13: Value chain diagram for small, wind systems ...................................................................................................................................................55
Figure A-14: Wind turbine nacelle ........................................................................................................................................................................................56
Figure A-15: Value chain for a large wind farm .....................................................................................................................................................................57
Figure A-16: Biomass to heat flow diagram .........................................................................................................................................................................59

9
Figure A-17: Biomass boiler .................................................................................................................................................................................................59
Figure A-18: Large-scale biomass supply chain management ..............................................................................................................................................60
Figure A-19: Large-scale biomass supply chain enhancement .............................................................................................................................................60
Figure A-20: Biomass CHP ....................................................................................................................................................................................................61
Figure A-21: Schematic of typical large-scale hydropower plant ..........................................................................................................................................62
Figure A-22: Structure of a hydro generator (source: US Amry Corps of Engineers) ..............................................................................................................62
Figure A-23: Pico-hydro generator (Source: LIGENHOLE Technology) ...................................................................................................................................63
Figure A-24: Various types of geothermal heat pumps .........................................................................................................................................................64
Table of tables
Table 2.1: RE installed Capacity in MW and Percentage Contribution to Total Electricity Generation in Arab countries (2014) (source: ESCWA, 2014) .........15
Table 2.2: MENA Hydroelectric Installed Capacity and Production ........................................................................................................................................16
Table 2.3: Solar Data for Lebanon .........................................................................................................................................................................................16
Table 2.4: Long - term monthly variation of windiness ........................................................................................................................................................16
Table 2.5: Precipitation Levels (mm/y) .................................................................................................................................................................................18
Table 2.6: Solid Waste Generation per Mohafaza ..................................................................................................................................................................19
Table 2.7: Value Chain Prioritization Assessment Matrix .......................................................................................................................................................21
Table 2.8: RES Quality Standards ..........................................................................................................................................................................................24
Table 2.9: University Programs with RES Components ..........................................................................................................................................................25
Table 2.10: RES Graduates Currently Required and Available ................................................................................................................................................26
Table 2.11: Machinery in RES Manufacturing .......................................................................................................................................................................28
Table 2.12: Employees Working on RES ................................................................................................................................................................................28
Table 2.13: Import Cost Structure in RES (as percentage of value of goods)..........................................................................................................................29
Table 2.14: Turnover of RES sales ..........................................................................................................................................................................................29
Table 2.15: Production and Non-production Costs in RES Manufacturing .............................................................................................................................29
Table 2.16: Use of Labor in the RES Market ...........................................................................................................................................................................29
Table 2.17: Profit Margins in RES ..........................................................................................................................................................................................30
Table 2.18: Growth rates in RES Importing and Manufacturing ............................................................................................................................................31
Table 3.1: Employment Factors ............................................................................................................................................................................................36
Table 3.2: Current RES Importing and Manufacturing Contribution to GDP .........................................................................................................................36
Table 3.3: Current RES Importing and Manufacturing Contribution to the Labor Market .....................................................................................................36

10
Table 3.4: Current RES Generation Capacity, Market, and Labor ...........................................................................................................................................37
Table 3.5: Power Generation Capacity in 2020 (MW) ...........................................................................................................................................................37
Table 3.6: RE Generation Capacity Targets and Simulation for 2020 .....................................................................................................................................38
Table 3.7: 2020 Simulation of RES Importing and Manufacturing Contribution to the Economy .........................................................................................38
Table 3.8: 2020 Simulation of Employment in RES Importing and Manufacturing ..............................................................................................................38
Table 3.9: RES Graduates Required and Available in 2020 ....................................................................................................................................................39
Table 3.10: Power Generation Capacity in 2030 (MW) .........................................................................................................................................................39
Table 3.11: RE Generation Capacity Simulation for 2030 .....................................................................................................................................................39
Table 3.12: 2030 Simulation of RES Importing and Manufacturing Contribution to the Economy .......................................................................................39
Table 3.13: 2030 Simulation of Employment in RES Importing and Manufacturing ............................................................................................................40
Table 3.14: RES Graduates Required and Available in 2030 ..................................................................................................................................................40
Table 4.1: Recommended Measures to Develop RES Import and Manufacture .....................................................................................................................40
Table 4.2: Country SWOT-analysis for the RES Sector ............................................................................................................................................................43
Table A-1: flat plate SWH collector components ...................................................................................................................................................................46
Table A-2: SWH Components ................................................................................................................................................................................................47
Table A-3: Anatomy of a PV Passive Tracker ..........................................................................................................................................................................51
Table C-1: Companies Interviewed ......................................................................................................................................................................................68
Table D-1: RES University Courses and Programs ..................................................................................................................................................................69
Table E-1: Number of University Graduates from RES Courses and Programs ........................................................................................................................72
Table F-1: Manufacturers RES and Components Produced and Sold .....................................................................................................................................73
Table F-2: Manufacturer Product Prices ................................................................................................................................................................................74
Table F-3: SWH Importing ....................................................................................................................................................................................................76
Table F-4: PV Importing .......................................................................................................................................................................................................80
Table F-5: Wind RES Importing .............................................................................................................................................................................................84
Table F-6: Hydro RES Importing ............................................................................................................................................................................................85
Table F-7: Heat Pumps RES Importing ..................................................................................................................................................................................85
Table F-8: Bioenergy RES Importing .....................................................................................................................................................................................85
Table G-1: RES Manufacturing Inputs ...................................................................................................................................................................................86
Table H-1: Tariffs on RES and Parts .......................................................................................................................................................................................88

11
Abbreviations
A Ampèreac alternating currentALI Association of Lebanese IndustrialistsALMEE Lebanese Association for Energy Saving and EnvironmentAT AustriaAU AustraliaAUB American University of Beirutavg averageBAU Beirut Arab UniversityBDL Banque du Liban (Central Bank of Lebanon)BIAT Business Incubation Association in TripoliBOT Build–Operate–TransferBR BrazilBREEAM Building Research Establishment Environmental Assessment
MethodBT Technical BaccalaureateCA Canada°C Degree CelsiusCCIAMBL Chamber of Commerce, Industry and Agriculture of Beirut
and Mount LebanonCDM Clean Development Mechanism CDR Council for Development and ReconstructionCHP Combined Heat PowerCH SwitzerlandCEDRO Country Energy Efficiency and Renewable Energy
Demonstration Project for the Recovery of LebanonCN ChinaCOM Council of Ministers CO2 Carbon dioxideCSP Concentrated Solar PowerCTF Clean Technology Fund of the World BankCZ Czech Republic also Czochralski Methodd Daydc direct currentDE GermanyDNI Direct Normal IrradianceEDL Electricité du Liban, National Electricity CompanyEE Energy EfficiencyEFTA European Free Trade AssociationEN European NormsES SpainESCO Energy Services CompanyESCWA United Nations Economic and Social Commission for Western
AsiaEU European UnionEUR euroFIT feed-in-tariffFR Franceg gramGB Grand Britain; United KingdomGCC Gulf Cooperation CouncilGDP Gross Domestic ProductGEE Green Energy ElectronicsGEF Global Environment FacilityGHP geothermal heat pumpGOL Government of LebanonGR GreeceGWe Gigawatts electric
GWh Gigawatt hourh hourshp horsepowerHTF heat transfer fluidIEC International Electrotechnical CommissionIN IndiaIPP Independent Power ProducersIRENA International Renewable Energy AgencyIRI Industrial Research instituteIRR Internal Rate of Return ISO International Organization for StandardizationIT ItalyJ jouleJO JordanJP Japankm kilometerkm² square kilometerkW kilowattkWe kilowatt electrickWh kilowatt-hourkWp kilowatt peak L literLAU Lebanese American Universitylb. poundLB LebanonLBP Lebanese poundLCEC Lebanese Center for Energy ConservationLED light emitting diodeLEED Leadership in Energy and Environmental DesignLEC Levelized electricity cost LGBC Lebanese Green Building CouncilLIBNOR Liban Normes; Lebanese Standards InstitutionLRF Lebanon Recovery FundLSES Lebanese Solar Energy SocietyLT Technical LicenseLU Lebanese Universitym meterm² square meterm3 cubic metermax maximumMENA Middle East and North Africa Regionmin minimumMJ MegajouleMm3 Million cubic meterMOA Ministry of AgricultureMOE Ministry of EnvironmentMOET Ministry of Economy and TradeMOEW Ministry of Energy and WaterMOF Ministry of FinanceMOI Ministry of IndustryMOPWT Ministry of Public Works and TransportMW MegawattMSW Municipal Solid WasteMWe Megawatt electricMWp Megawatt-peakn/a not applicablen.d. no dataNDU Notre Dame University

12
NEEAP National Energy Efficiency Action PlanNEERA National Energy Efficiency and Renewable Energy AccountNGO Non-Governmental OrganizationNL Norme Libanaise (Lebanese Norm)no. numberNSWMP National Solid Waste Management PlanOEM Original Equipment ManufacturersPCBs Polychlorinated Biphenyls Ph.D. doctor of philosophyPPES Policy Paper for the Electricity SectorPT PortugalPV Photovoltaic R&D research and developmentRCREEE Regional Center for Renewable Energy and Energy EfficiencyRE Renewable EnergyRES Renewable Energy SystemROHS Restriction of Hazardous Substancess secondSHAAMS Strategic Hub for the Analysis and Acceleration of the Mediterranean Solar EnergySHAMCI Solar Heating Arab Mark and Certification InitiativeSMEs Small and Medium EnterprisesSWH Solar Water HeaterSWOT strengths, weaknesses, opportunities, and threatsTS Higher Technician DiplomaTOR Terms of ReferenceTR TurkeyUAE United Arab Emirates UNDP United Nations Development ProgrammeUNFCCC United Nations Framework Convention on Climate ChangeUNIDO United Nations Industrial Development OrganizationUS United StatesUSD US dollarUSEK Université Saint-Esprit de KaslikUSJ Université Saint JosephUV ultravioletV voltVAT value-added taxW wattWP Watt-peakWTE Waste-to-EnergyWTO World Trade OrganizationWWTP Wastewater Treatment Planty yearZA South Africa

13
The renewable energy (RE) sector is growing rapidly. The fast-paced development of RE technologies is leading to increased efficiency and affordability. More countries are assessing the potential to maximize use of their renewable resources, and these assessments are leading to high adoption rates of renewable energy systems (RES) worldwide. There is also a growing awareness that the increasing energy needs of global development must be addressed with resources other than fossil fuels, the usefulness of which is impaired by unpredictable pricing, limits to availability, and the threat of climate change.
Lebanon, which imports most of its energy needs in the form of fossil fuels, to date, has scarcely benefited from its RE resources, particularly solar and wind. RE consumption represents currently less than 1% of total Lebanese energy consumption. Hydropower, Lebanon’s most used RE source, relies on ageing infrastructure that produces only a fraction of its nominal capacity and is in need of a major rehabilitation. In the June 2010 Policy Paper for the Electricity Sector (PPES), adopted by the Council of Ministers (COM), the Ministry of Energy and Water (MOEW) committed to launching, supporting and reinforcing all public, private and individual initiatives to adopt the utilization of renewable energies to reach 12% of electric and thermal supply by 2020. For the installation of new RE power generation capacity, MOEW target has been set at 115–165 megawatts (MW), including 40 MW of new hydropower, 60–100 MW of wind power, and 15–25 MW of energy from waste.
Some steps have already been taken towards these aims. On the technical side, Electricité du Liban (EDL), the National Electricity Company now uses net metering, the measurable exchange of electricity between an RE generator and Lebanon’s electric grid. Complementary financial support measures were adopted by Banque du Liban (BDL) (Central Bank of Lebanon) in collaboration with MOEW and LCEC through the National Energy Efficiency and Renewable Energy Account (NEEREA), an initiative that offers low-interest loans for any type of energy efficiency (EE) or RE project. This mechanism has been the main driver behind the rapid development of the solar water heater market in Lebanon.
Increased demand for thermal solar systems by households, private and public institutions, prompted by NEEREA, has led to the diversification of existing businesses and the creation of new ones. As of 2014, at least 130 Lebanese companies are active in RES development—17 manufacturers and the remainder importers, assemblers, and installers.
For physical compatibility and economic reasons, the best national opportunity for RES lies in solar technology. Following the success of solar water heaters (SWHs), the photovoltaic (PV)1 market is expected to grow rapidly in the near future,
1 PV technology is a means of generating electricity directly from sunlight through solar cells containing materials that are stimulated by the solar energy to produce a flow of electrons.
particularly for electric utility, commercial, and cooperative-scale applications. In the future, technological improvements and declining PV module prices will help make PV systems more affordable at the household level.
Use of small- and large-scale wind systems is also promising, though limited by the need for suitable locations. Biomass boilers have not been widely adopted yet, but could be successful as a cost effective heating alternative. Another promising bioenergy option is the production of energy from municipal solid waste (MSW) and wastewater. Such systems could help alleviate the current waste management crisis. At a local level, these RES are in the demonstration stage of market adoption. To encourage market penetration, creation of additional development policies, similar to NEEREA, will be necessary.
The global shift in energy production methods is providing business opportunities in the manufacture, assembly, and installation of RES. The RE industry employs approximately 6.5 million people worldwide (IRENA, 2014) and has become a feature of national industrial development plans in some countries (REN21, 2013). Lebanese production of RES could have positive technological spillover effects on other sectors and open up the possibility of high added-value exports.
The international development of RES production, especially for wind energy technology, shows that substantial national demand is key to the development of a local RES manufacturing industry. This can be a challenge in a small market. For the Lebanese wind power industry to become viable, the Government of Lebanon (GOL) would need to adopt a supportive role. A more developed Lebanese RE market would have positive implications for the Lebanese labor market, as RES are more labor-intensive than fossil fuel supply systems. Among all the RES under consideration for the Lebanese market, a focus on PV systems would be especially beneficial as PV creates the highest number of jobs.
Policy remains a major determinant of RE investments and is at the center of the recommendations made by RES industrialists and importers. Suggested policies include adjusting electricity rates to reflect real production cost and adopting a feed-in tariff (FIT), making the large majority of RES cost-competitive. Companies also signaled a need for the GOL to develop new RES regulations and enforce existing ones, to protect licensed importers and distinguish compliant producers. Reforming the building code to mandate the integration of RES into new construction sites would also contribute to market stimulation. Finally, the Ministry of Energy and Water (MOEW) needs to take the lead in increasing public awareness about RE uses and benefits on the individual and national levels.
Executive Summary
14
1. Introduction
The EU has pledged to meet 20% of its gross final consumption of energy from RE sources by 2020, allocating various shares for each of the 27 EU member states to reach this target.
China has adopted a target whereby 26% of its total energy supply in 2030 will come from RE sources (IRENA, 2014). India plans to increase its renewable energy capacity to 175GW by 2022, “100GW of Photovoltaic capacity, 60GW of wind power, 10GW of biomass and 5GW of hydro” (Nagarejan, G. 2015).
In the MENA region, there are various levels of commitment to RE, with the highest in North Africa. Algeria’s national goal is to meet 6% of its energy demand from RE by 2015, including 200 MW wind, 170 MW solar thermal, 5.1 MW solar PV, plus 450 MW of cogeneration. In February 2008, Egypt’s Supreme Council of Energy approved a plan for the country to produce 20% of its electric power from renewable sources by 2020. Egypt even created a ministry specifically dedicated for RE (UAE, IRENA and REN21, 2013).
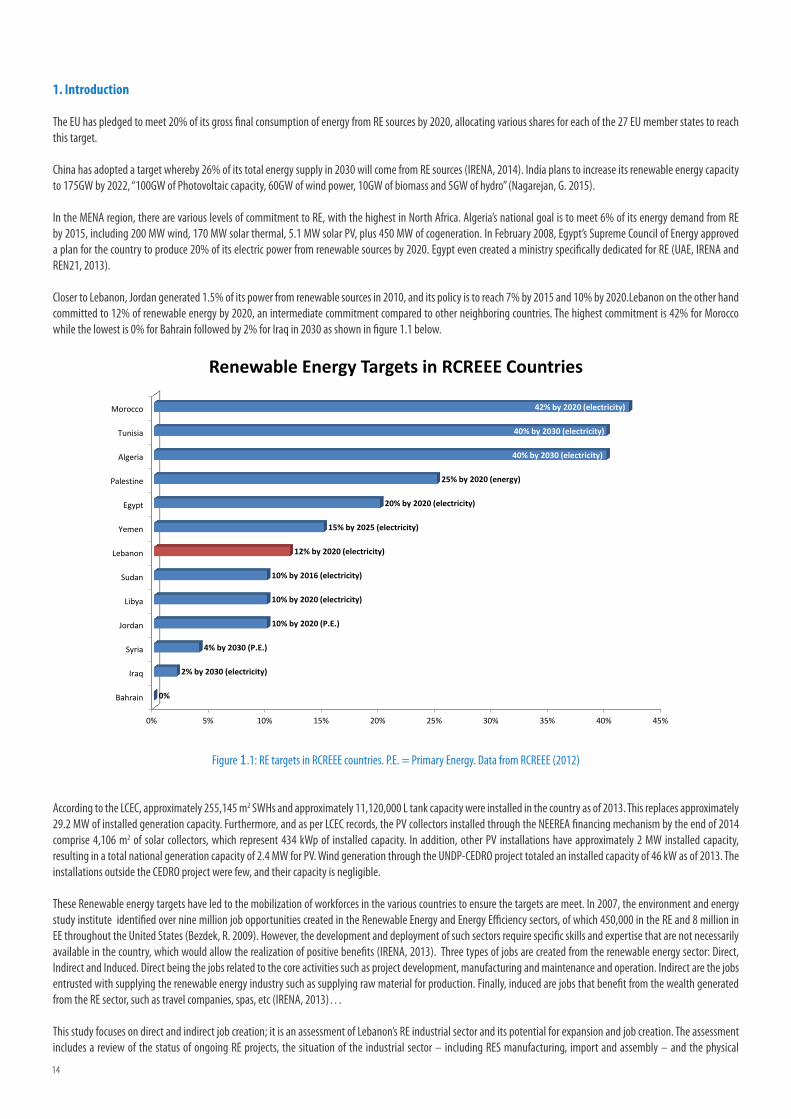
Closer to Lebanon, Jordan generated 1.5% of its power from renewable sources in 2010, and its policy is to reach 7% by 2015 and 10% by 2020.Lebanon on the other hand committed to 12% of renewable energy by 2020, an intermediate commitment compared to other neighboring countries. The highest commitment is 42% for Morocco while the lowest is 0% for Bahrain followed by 2% for Iraq in 2030 as shown in figure 1.1 below.
0% 5% 10% 15% 20% 25% 30% 35% 40% 45%
Bahrain
Iraq
Syria
Jordan
Libya
Sudan
Lebanon
Yemen
Egypt
Palestine
Algeria
Tunisia
Morocco
0%
2% by 2030 (electricity)
4% by 2030 (P.E.)
10% by 2020 (P.E.)
10% by 2020 (electricity)
10% by 2016 (electricity)
12% by 2020 (electricity)
15% by 2025 (electricity)
20% by 2020 (electricity)
25% by 2020 (energy)
40% by 2030 (electricity)
40% by 2030 (electricity)
42% by 2020 (electricity)
Renewable Energy Targets in RCREEE Countries
Figure 1.1: RE targets in RCREEE countries. P.E. = Primary Energy. Data from RCREEE (2012)
According to the LCEC, approximately 255,145 m2 SWHs and approximately 11,120,000 L tank capacity were installed in the country as of 2013. This replaces approximately 29.2 MW of installed generation capacity. Furthermore, and as per LCEC records, the PV collectors installed through the NEEREA financing mechanism by the end of 2014 comprise 4,106 m2 of solar collectors, which represent 434 kWp of installed capacity. In addition, other PV installations have approximately 2 MW installed capacity, resulting in a total national generation capacity of 2.4 MW for PV. Wind generation through the UNDP-CEDRO project totaled an installed capacity of 46 kW as of 2013. The installations outside the CEDRO project were few, and their capacity is negligible.
These Renewable energy targets have led to the mobilization of workforces in the various countries to ensure the targets are meet. In 2007, the environment and energy study institute identified over nine million job opportunities created in the Renewable Energy and Energy Efficiency sectors, of which 450,000 in the RE and 8 million in EE throughout the United States (Bezdek, R. 2009). However, the development and deployment of such sectors require specific skills and expertise that are not necessarily available in the country, which would allow the realization of positive benefits (IRENA, 2013). Three types of jobs are created from the renewable energy sector: Direct, Indirect and Induced. Direct being the jobs related to the core activities such as project development, manufacturing and maintenance and operation. Indirect are the jobs entrusted with supplying the renewable energy industry such as supplying raw material for production. Finally, induced are jobs that benefit from the wealth generated from the RE sector, such as travel companies, spas, etc (IRENA, 2013)…
This study focuses on direct and indirect job creation; it is an assessment of Lebanon’s RE industrial sector and its potential for expansion and job creation. The assessment includes a review of the status of ongoing RE projects, the situation of the industrial sector – including RES manufacturing, import and assembly – and the physical
1. Introduction

15
and economic feasibility of implementing future RE projects locally. The study further evaluates the outlook of the sector, taking into account the existing industrial infrastructure, labor force, production expansion interests, and Lebanon’s competitive advantages for RE development.
The study evaluates the ability of all national and international supporting entities in promoting the growth of the sector, and addresses some of the challenges they face, such as legal and institutional obstacles. Based on the current available data on the RES importing and manufacturing sector, and the prospects of the different RES, the study assesses the economic feasibility of reaching the government’s set target of 12% and 20% RE mix by 2020 and 2030 respectively.
Final recommendations are based on the review of Lebanese initiatives, international examples, and feedback of all stakeholders— interviewed market participants and local universities. The recommendations take into account RE and EE policies set by the GOL and the requirements of the World Trade Organization (WTO).
2. Lebanon’s RE Landscape
2.1 RE Capacity in Arab Countries
Table 2.1 provides an overview of each Arab country’s RE usage—excluding hydro energy, detailed further down—in terms of the size of installed capacity. It demonstrates the dominant position of Morocco in wind and PV generation capacity; Algeria in CSP generation capacity.
Table 2.1: RE installed Capacity in MW and Percentage Contribution to Total Electricity Generation in Arab countries (2014) (source: ESCWA, 2014)
Country Wind PV CSP Biomass & Waste Total RE
MW MW MW MW MW
Morocco 787 15 20 0 822
Egypt 550 15 20 0 585
Tunisia 214 4 0 0 218
Sudan 0 2 0 55 57
Algeria 10 7.1 25 0 42.1
Jordan 1.45 1.6 0 4 7.05
Bahrain 0.5 5 0 0 5.5
Libya 0 5 0 0 5
Iraq 0 3.5 0 0 3.5
Syria 0.15 2 0 0 2.15
Lebanon 0.5 1 0 0.5 2
Yemen 0 1.5 0 0 1.5
Palestine 0 1 0 0 1
SWHs have achieved varying degrees of market penetration across the Arab region. They are most successful in the residential and commercial sectors in Egypt, Jordan, Morocco, and Palestine, and used mostly in Arab countries that have few or no hydrocarbon resources. SWH subsidies are now common in several Arab countries, including Egypt and Tunisia.
The MENA region has among the world’s best conditions for CSP: abundant sunshine, low precipitation, and plenty of unused flat land close to road networks and transmission grids. It is also close to Europe, where green electricity is much valued. However, high initial capital costs remain a significant issue for adoption of CSP technology. For the MENA region, grid-connected wind installations at a commercial scale were present in Egypt (550 MW) and Morocco (290 MW) by the end of 2012. Stand-alone wind units are in use for smaller applications in Tunisia (154 MW), Iran (91 MW), Ethiopia (52 MW), and Cape Verde (24 MW) (Arab Forum for Environment and Development (AFED) 2011). This represented only 0.4% of the global 282,587 MW of installed wind power capacity.
Despite the low penetration of wind power, the MENA region has some potential for large-scale wind farms, especially along the relatively sparsely populated coasts of Egypt, Mauritania, Morocco, and Saudi Arabia. Average wind speeds of 8–11 meter/second (m/s) in the Gulf of Suez in Egypt have been recorded (Alghoul, M.A. et al., 2007), making this location a suitable site for power generation from wind. New projects are under construction in Ethiopia, Jordan, Kenya, Morocco, and Saudi Arabia, and if the political situation in Egypt stabilizes, its ambitious plans for 7,000 MW of wind power by 2020 can be achieved. Overall, over 8 GW of new wind capacity is expected to be installed in the MENA region, bringing total capacity close to 10 GW.
The hydropower industry is among the most mature RE industries with one of the highest efficacy rates in terms of energy production. However, because of the huge size and adverse effects of hydropower projects as well as the amount of capital investment that is essential for such installations, hydropower is often exempted from the list of RE sources. Table 2.2 summarizes the MENA hydroelectric installed capacity and production.

16
Table 2.2: MENA Hydroelectric Installed Capacity and Production
CountryMW installed
capacityYearly production
(GWh)
Iran 7,500 18,000
Egypt 2,800 14,000
Morocco 1,500 1,318
Syria 1,500 4,000
Iraq 2,225 500
Lebanon 282 911
Algeria 280 226
Sources: World Energy Council (2009). CEDRO Hydropower (2013).
2.2 RE Potential in Lebanon
Lebanon has several competitive advantages that will facilitate the development of a RE industry. The first of these is the compatibility with the physical requirements for RES to perform well. Solar radiation is the most abundant, but wind, water, and some biological resources are available, despite restraining factors such as limited availability of land and space.
Solar radiationLebanon has >300 d/y of sunshine. That is 3,000 sunny hours annually with an average solar radiation between 2.8–8.42 kWh/day/m2. The solar data is shown in Table 2.3.
Table 2.3: Solar Data for Lebanon
Month
GHI
(KWh /m2)
DNI
(KWh /m2) Temperature (˚C)
Jan 95 139 4.6
Feb 105 123 4.9
Mar 174 202 7.7
Apr 205 218 11.9
May 246 262 16
Jun 260 288 19.4
Jul 261 288 21.3
Aug 237 266 21.2
Sep 193 230 19.2
Oct 149 192 15.9
Nov 105 156 10.6
Dec 87 136 6.7
Year 2119 2501 13.3
This solar potential should be sufficient to cover at least 80% of domestic and collective demand of hot water. The high frequency of sunny days and the moderate temperature fluctuations allow PV systems to operate at full capacity. Moreover, many areas have direct normal irradiance (DNI)2 of over 2,100 kWh/m2/y(2), which is ideal for CSP. For example, Hermel has a DNI of 2,445 kWh/m2/y(2), more than Seville in Spain.
Wind
The seasonal windiness of Lebanon has been determined while developing the wind atlas of Lebanon, normalized values for each month have been derived as follows:
Table 2.4: Long - term monthly variation of windiness
Month Windiness (%)
January 104.4
February 113.2
March 110.0
April 109.8
May 102.8
June 102.0
July 103.4
August 93.4
September 91.1
October 86.2
November 86.9
December 97.1
Annual 100.0
The values show that the windiest months are February and March, while the fall months (October and November) represent the least windy ones.
Wind maps have been developed taking environmental, social and geographical constraints into consideration. The northern regions of Akkar are the most appropriate in terms of wind availability, with wind speed ranging between 6.5 and up to 9.5 m/s Above Ground Level in regions such as Al Qubbayat.
An inter-annual variability of wind speed of 7% is assumed in all other countries surrounding the Mediterranean, and is considered a reasonable starting assumption for Lebanon. On average, the wind speed is higher during the day than at night. The difference between the wind speeds observed at night and during the day is reduced during the winter months and at higher altitudes. Any uncertainty in the wind speed values is amplified in the power density maps as shown in Figure 2.1.
2 DNI is the amount of solar radiation received per unit area by a surface that is always held perpendicular, or normal, to the rays that come in a straight line from the direction of the sun at its current position in the sky. Typically, the amount of irradiance annually received by a surface can be maximized by keeping it normal to incoming radiation. This quantity is of particular interest to concentrating solar thermal installations and installations that track the position of the sun.

17
Figure 2.1: Central estimate power density map of the Republic of Lebanon at 80 m above ground levelSource: UNDP–CEDRO National Wind Atlas (2011).
Wind power is generally absent below cut-in wind speeds of approximately 4 m/s; the wind turbines are shut down in storm conditions when wind speeds are above 25 m/s due to safety concerns; and are subject to large changes in energy output between these two conditions. These uncertainties in predicting power availability will pose a challenge when integrating wind power into the power grid.
A wind speed of ≥6.5 m/s at 80 m above ground level is considered necessary for a viable wind farm. An installation density of 8 MW/km2 is also needed. Based on these assumptions, the potential onshore wind power capacity of Lebanon is 6.1 GW, but due to the uncertainty in wind speed data and its sensitivity to perturbations, this is an approximate figure.
Wind conditions also affect CSP solar fields, which are not designed to operate in wind conditions of more than 8.3–19.4 m/s, depending on the technology; consequently, high-wind sites limit the performance potential of the facilities. Moreover, wind forces dictate the collector structural design.

18
Water resources
Lakes and Rivers
Lebanon has 17 perennial and 23 seasonal streams and rivers and over 2,000 springs with a flow of approximately 1,000 Mm3. The combined length of the rivers is approximately 730 km. The only permanent lake is the Qaraaoun Lake., while a seasonal lake, which is fed by springs, appears near Yammunah on the eastern slopes of the Lebanon Mountains; source of river based hydropower.
Precipitation
The topography of the national territories results in a wide distribution of precipitation. As a result, five climatic zones can be distinguished: the coastal strip, the low and middle altitudes of Mount Lebanon, and the west, central and north Bekaa. The coastal area and the western side of the Lebanon mountain range exhibit maritime characteristics, while the climate of the eastern side is more continental.
Yearly precipitation, which is shown in Table 2.5, generates an average annual flow of 8,600 Mm3. About half of the precipitation is lost through evapotranspiration. Additional losses include surface water flows of approximately 8% of the precipitation to neighboring countries and groundwater seepage of approximately 12%. This leaves approximately 2,600 Mm3 of potentially available water, approximately 2,000 Mm3 of which the MOE deems exploitable.
Table 2.5: Precipitation Levels (mm/y)
Area Yearly average min max
Beirut 892 393 1,600
North 1,055 425 1,890
Mount Lebanon 1,210 421 3,010
South 933 342 2,139
Bekaa 705 80 2,374
Lebanon 787 80 3,010
Source: Lebanon’s Second National Communication to the UNFCCC, MOE, (2011).
Approximately three million cubic meters of the average yearly precipitation is in the form of snow, and the Mount Lebanon mountain range is covered for approximately three months each year, with the snowpack reaching its peak in March. As snowmelt infiltrates the limestone and discharges at several karst springs, approximately two-thirds of the precipitation is derived from snowfall rather than from rain. Water from melting snow contributes approximately 40%–50% of the discharge of coastal rivers, indicating the essential role snow plays in replenishing the national water resources.
Climate change is likely to reduce the total volume of water resources in Lebanon by 6%–8% for an increase of one degree Celsius average yearly temperature. The forecasted 10%–20% decrease in precipitation by 2040, together with the one to three degree Celsius increase in temperature, leading to higher evapo-transpiration, will eventually lead to a decrease in river flows, which will reduce the hydropower generation potential. Regardless of climate change impacts, a decline in annual renewable water resources is projected, resulting in a water deficit by 2015.
Non-river based hydropower resources
Generally, a hydropower potential estimated to be 8–15 MW is available from non-river resources, a potential largely untapped. From the cooling systems of power plants onshore, to irrigation networks, water networks, and WWTPs, at least 5 MW (with an annual output of 27.4 M kWh) of additional clean, renewable power has been identified by CEDRO. Approximately 54% of this identified hydropower potential comes from currently established thermal power plants, 34% from irrigation systems, and 12% from drinking water systems.
Thermal power plants offer the most favorable sites as they combine high production with existing infrastructure and staff, as well as a grid connection. Approximately 3.4 MW of energy can be generated from water dumped back into the Mediterranean. The main advantage of this power source over other natural sources of hydropower is that the turbines can operate at a capacity factor of >80% because they keep generating energy as long as the power plant is operational. These turbines can be installed during the ongoing rehabilitation of the coastal power plants.
Several irrigation channels have been identified as having a cumulative hydropower generation capacity of 1.27 MW. In irrigation systems, the main criterion considered for assessing the available hydro-potential is the operating time – usually inversely proportional to the irrigation period. In most cases, the available hydropower potential can only be exploited during periods of non-irrigation.
Drinking water systems across Lebanon have a power-generation capacity of 408 kW. However, current distribution pipelines have high friction due to their small diameter at relatively high flow, resulting in reduced energy production.
The hydropower capacity factor is highest in thermal power plants (80%), followed by drinking water systems (50%), and irrigation systems (25%). Due to the small flow

19
and head, existing water treatment plants do not have significant potential for power generation. However, some of them are still under construction or review, providing an opportunity for more investigation into hydropower potential, and the possibility to carry out any necessary adjustments on the plant design of the treatment to integrate hydropower plants.
Aquifers
Groundwater is a vital resource in the country, and is intensively exploited for domestic and irrigation purposes. An estimated 705 Mm3 are pumped from aquifers each year through wells that belong to the National Water Authorities or private entities. The groundwater that can be found under most of the national territory is relatively cool at approximately 12°C –15° C. These temperatures are too low for electricity generation, but provide a viable option for geothermal cooling systems, especially during the summer months, where the need for such systems reaches its peaks.
Jurassic aquifers, of appropriate depth for power generation have been identified in four areas: Akkar, Bekaa, Kaoukaba and Kfar Syr; with measured temperatures above 80˚C at a 4,000m depth. In particular, areas in Akkar with water temperatures up to 70° C, as well as areas in the Bekaa valley, and Koukaba and Kfar Syr in the South with temperatures of approximately 35°C and 31°C respectively (The National Geothermal Resource Assessment of Lebanon, 2014).
Water quality issues
Local water sources have a high mineral content, which leaves lime scale deposits on water containers and pipes and affects the performance of water boilers. In the SWH industry, this necessitates the installation of anti-scale bars inside the inner water tank to prevent the accumulation of lime.
Scaling is also an issue for geothermal applications, but can be minimized by keeping the whole system under pressure. Inhibitors can also be put in the water to prevent lime scale, but this might cause pollution of the corresponding aquifer. A high degree of salinity of the water, would imply the need for desalination, rendering these geothermal applications more expensive.
Bioenergy resources
Lebanon has a relatively abundant availability of bioenergy resources since approximately one third of its land is arable. Combustion of waste, wood and agricultural residues from cereal grains, fruit trees or olive trees for power and heat production are possible for the entire country. These feedstock resources are available across all regions, although they predominate in Beirut, North Lebanon, Mount Lebanon, and the Bekaa.
Although Lebanon has little forest cover, it has significant other sources of biomass, namely municipal solid waste (MSW). As shown in Table 2.6, Lebanon produces approximately 5,000 tons of MSW/d, approximately 60% of which is organic material. Prior to the impact of the Syrian refugee influx, The National Bioenergy Strategy for Lebanon estimated that the production of waste increases by 1.65% annually.
Table 2.6: Solid Waste Generation per Mohafaza
Mohafaza Daily tonnage (Tons) Percentage
Beirut and Mount Lebanon 2,600 51
South Lebanon and Nabatiyeh 900 18
North Lebanon 900 18
Bekaa 650 13
Total 5,050 100
Source: Date from SweepNet (2012).
MSW generation per capita varies from approximately 0.85 kg/person/d (k/p/d) in rural areas to approximately 0.95 to 1.2 kg/p/d in urban areas, mainly the Beirut region and part of Mount Lebanon. The nationwide average is estimated to be 1.05 kg/p/d assuming a weighted average between urban and rural areas.
The biomass fraction from MSW is an important energy resource that can be used in WTE plants. The methane produced from landfills can be recovered and combusted in stationary generators for the production of electricity and heat. This option is feasible in nearby densely populated areas. Beirut offers the largest potential for this type of project, followed by North Lebanon and Bekaa regions. According to the MOE, nationwide, an estimated 51% of all MSW is landfilled, 32% is dumped, and the remaining 17% is recovered through sorting, recycling, and composting. Landfilling, which takes place in three locations—Naameh, Bsalim, and Zahle—has been difficult and controversial. In Naameh, the site has expanded well beyond its initial design capacity and faces stiff public opposition. In Zahle, the site is relatively secluded, but consumes prime agricultural lands that constitute precious natural resources in the Bekaa. Lebanon is too small to accommodate other large-scale landfills. Based on the The National Bioenergy Strategy for Lebanon, 2012, the biomass fraction of municipal waste can produce up to 301 GWh of electricity, which could result in a total installed capacity of up to 38 MW. If other fractions are also exploited in WTE plants, their capacity plants could reach 70 MW. If a more ambitious waste management master plan is pursued, biogas generation from sewer and farm waste decomposition has the potential of offsetting 2.8% of the total electric needs.
Biogas production from anaerobic digestion of sewage sludge and from slaughterhouse waste is also interesting. The net heating value also referred to as calorific value of sewage sludge at 40% of dry matter is estimated at 3 Megajoules (MJ)/kg. On this basis, the National strategy projects the energy production potential from the 10 largest
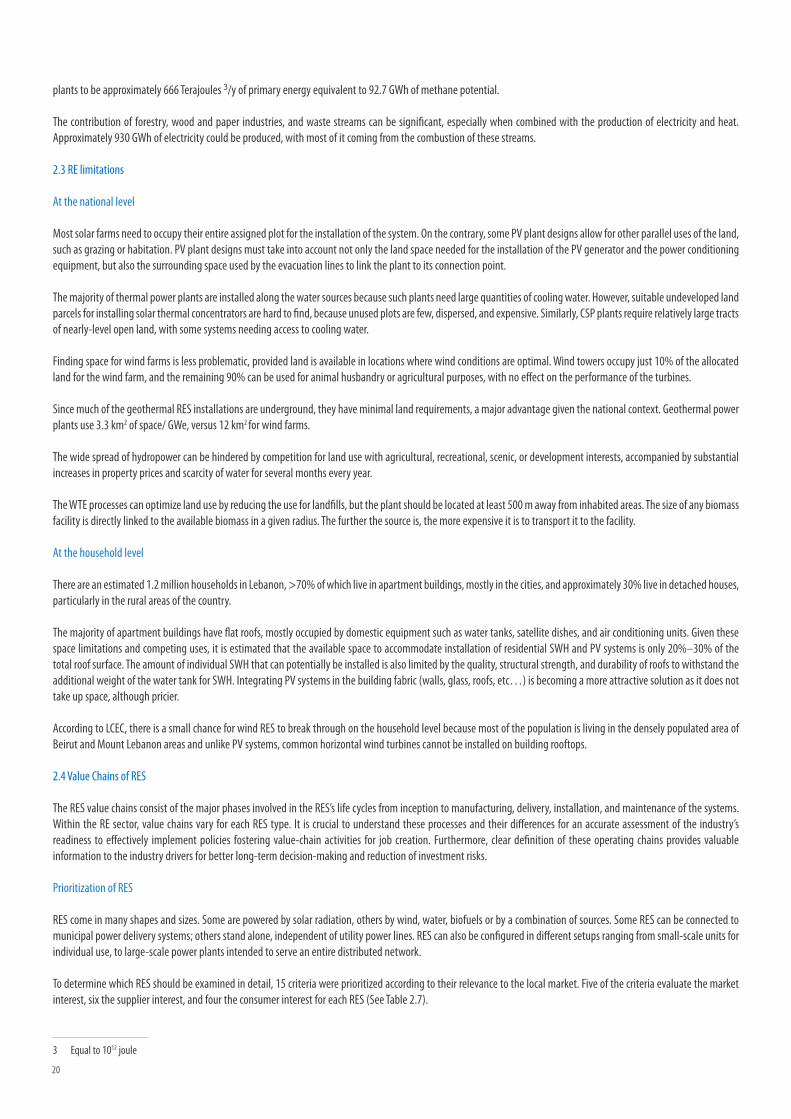
20
plants to be approximately 666 Terajoules 3/y of primary energy equivalent to 92.7 GWh of methane potential.
The contribution of forestry, wood and paper industries, and waste streams can be significant, especially when combined with the production of electricity and heat. Approximately 930 GWh of electricity could be produced, with most of it coming from the combustion of these streams.
2.3 RE limitations
At the national level
Most solar farms need to occupy their entire assigned plot for the installation of the system. On the contrary, some PV plant designs allow for other parallel uses of the land, such as grazing or habitation. PV plant designs must take into account not only the land space needed for the installation of the PV generator and the power conditioning equipment, but also the surrounding space used by the evacuation lines to link the plant to its connection point.
The majority of thermal power plants are installed along the water sources because such plants need large quantities of cooling water. However, suitable undeveloped land parcels for installing solar thermal concentrators are hard to find, because unused plots are few, dispersed, and expensive. Similarly, CSP plants require relatively large tracts of nearly-level open land, with some systems needing access to cooling water.
Finding space for wind farms is less problematic, provided land is available in locations where wind conditions are optimal. Wind towers occupy just 10% of the allocated land for the wind farm, and the remaining 90% can be used for animal husbandry or agricultural purposes, with no effect on the performance of the turbines.
Since much of the geothermal RES installations are underground, they have minimal land requirements, a major advantage given the national context. Geothermal power plants use 3.3 km2 of space/ GWe, versus 12 km2 for wind farms.
The wide spread of hydropower can be hindered by competition for land use with agricultural, recreational, scenic, or development interests, accompanied by substantial increases in property prices and scarcity of water for several months every year.
The WTE processes can optimize land use by reducing the use for landfills, but the plant should be located at least 500 m away from inhabited areas. The size of any biomass facility is directly linked to the available biomass in a given radius. The further the source is, the more expensive it is to transport it to the facility.
At the household level
There are an estimated 1.2 million households in Lebanon, >70% of which live in apartment buildings, mostly in the cities, and approximately 30% live in detached houses, particularly in the rural areas of the country.
The majority of apartment buildings have flat roofs, mostly occupied by domestic equipment such as water tanks, satellite dishes, and air conditioning units. Given these space limitations and competing uses, it is estimated that the available space to accommodate installation of residential SWH and PV systems is only 20%–30% of the total roof surface. The amount of individual SWH that can potentially be installed is also limited by the quality, structural strength, and durability of roofs to withstand the additional weight of the water tank for SWH. Integrating PV systems in the building fabric (walls, glass, roofs, etc…) is becoming a more attractive solution as it does not take up space, although pricier.
According to LCEC, there is a small chance for wind RES to break through on the household level because most of the population is living in the densely populated area of Beirut and Mount Lebanon areas and unlike PV systems, common horizontal wind turbines cannot be installed on building rooftops.
2.4 Value Chains of RES
The RES value chains consist of the major phases involved in the RES’s life cycles from inception to manufacturing, delivery, installation, and maintenance of the systems. Within the RE sector, value chains vary for each RES type. It is crucial to understand these processes and their differences for an accurate assessment of the industry’s readiness to effectively implement policies fostering value‐chain activities for job creation. Furthermore, clear definition of these operating chains provides valuable information to the industry drivers for better long-term decision-making and reduction of investment risks.
Prioritization of RES
RES come in many shapes and sizes. Some are powered by solar radiation, others by wind, water, biofuels or by a combination of sources. Some RES can be connected to municipal power delivery systems; others stand alone, independent of utility power lines. RES can also be configured in different setups ranging from small-scale units for individual use, to large-scale power plants intended to serve an entire distributed network.
To determine which RES should be examined in detail, 15 criteria were prioritized according to their relevance to the local market. Five of the criteria evaluate the market interest, six the supplier interest, and four the consumer interest for each RES (See Table 2.7).
3 Equal to 1012 joule

21
Table 2.7: Value Chain Prioritization Assessment Matrix
Evaluation criteria Solar power Wind power Bioenergy Hydropower Heat pumps
10= Very true
1=Very untrue
SWH Solar
PVSolar CSP
Small-scale
(micro-wind)
Large-scale (wind farm)
Small scale
Large scale
Pico hydro
Small hydro
Large Hydro
Water source
Ground source
Market interest (M)
M1There are current applications of the RES existing in local market
10 8 4 6 3 4 3 3 3 7 2 2
M2There is a high demand for private application of the RES
10 6 3 6 3 6 5 3 3 2 2 2
M3
Private application is government-subsidized, or if there is only governmental and institutional demand for the RES, it has potential for a large market share
10 10 2 10 6 4 6 2 2 6 2 2
M4The Lebanese importers and manufacturers have shown a good interest in tapping into the RES
10 8 5 8 6 7 5 5 4 3 3 3
M5Application of this RES in countries with similar climate is very high
10 8 6 6 10 6 8 4 4 10 4 4
Supplier interest(S)
S1The local manufacturers are capable of meeting the RES technical requirements
10 10 4 8 8 10 4 8 8 8 6 6
S2Most or many components of the RES may be locally manufactured
10 8 5 7 7 10 6 8 7 8 7 7
S3The system may be manufactured with local resources
4 4 2 4 4 8 4 4 4 4 6 6
S4The local climate is compatible with the RES requirements
10 10 10 6 7 10 10 4 6 8 4 6
S5The RES is easily applicable for individual consumers
10 8 2 6 2 8 2 6 4 2 6 6
S6The RES space requirements are easy to meet
10 7 2 6 4 8 6 8 6 4 6 8
Consumer interest (C)
C1 Levelized cost of the RES is low 8 6 2 6 8 10 10 6 6 6 4 4
C2Maintenance of the RES is readily available (skills) and not often required (reliable) and cheap
10 7 6 4 4 7 7 6 6 6 6 6
C3The RES has a good return on investment
6 8 4 4 4 6 8 4 4 8 10 10
C4 The RES has a good life expectancy 6 8 6 6 6 7 6 6 6 6 6 6
Total score 134 116 63 93 82 111 90 77 73 88 74 78
Primary 110 - 150 Secondary 80 -109 Tertiary 15 - 79
RES that received a cumulative score between 110 and 150 or better in the prioritization assessment matrix were considered most suitable for the local market. This primary group includes SWHs, solar PV, and small-scale bioenergy. These RES already have a local market or stand a good implementation chance, and present an immediate opportunity. In the solar sector in particular, Lebanon has the potential to become a regional technology hub as components as well as entire RES are already being produced. Accordingly, where possible (since some designs are proprietary to certain system manufacturers), detailed value chains were developed for these primary RES to determine the key factors in their supply and manufacturing cycles.

22
The secondary group, achieving a cumulative score between 80 and 109, comprises small- and large-scale wind systems, large-scale bioenergy, and large hydro RES. These RES present a considerable opportunity but require more government involvement due to low private demand or in the latter three cases to their utility-scale characteristic.
The third or tertiary group, which consists of CSP, pico- and small-hydro, and heat pumps, are RES with fewer prospects of succeeding in the local market because the physical or climatic conditions are not ideal given their implementation, their levelized cost is too high or the return on investment is too low. These RES scored between 63 and 78.
2.5 Key Actors in Lebanon’s Renewable Energy Landscape
The renewable energy sector requires equal commitment and involvement from public and private sectors as well as organizations and academics. The establishment and development of such sector is “fundamentally a choice, not a foregone conclusion given technology and economic trends” (REN21, 2013). In this context, market studies, social acceptability, supporting policies, technological research, demonstration projects, industrial readiness, financial incentives and risk and resilience ought to be developed and evaluated. Roadmaps and frameworks are developed by national bodies setting up the country’s commitment and plan for the sector.
In the Lebanese case, and considering the difficult situations of instability and unrest, several stakeholders are involved in setting up and continuously pushing this sector forward. The United Nations Development Programme in close coordination with the Ministry of Energy and Water (MOEW) through various international grants, have established several projects to assist the government in paving the way for renewables, kick starting the market and providing the appropriate frameworks and incentives. Projects include, but are not limited to:
The Lebanese Center for Energy Conservation (LCEC); LCEC established in 2002 through a GEF fund and aimed at supporting the GOL in developing and implementing national strategies promoting efficient and rational uses of energy and the use of RE by consumers.
The Country Energy Efficiency and Renewable Energy Demonstration Project for the Recovery Of Lebanon (CEDRO); CEDRO was established in 2007 by means of a fund from the Spanish Government through the Lebanon Recovery Fund. CEDRO’s aim is to complement the reform strategy of Lebanon’s power sector and to support its greening and reconstruction activities. The greening process involves the implementation and activation of end-use EE and RE applications (with a focus on RE for public hospitals and schools, street lighting, SWH, wind turbines, PV systems, and EE).
In parallel, as demand for renewables was established, the private sector followed. Companies started venturing into renewable energy products, creating demand for knowledge and expertise. Soon after, the academic sector, industries lead by the United Nations Industrial Development Organization (UNIDO) and (Association of Lebanese Industries) ALI and organizations such as: Lebanese Association for Energy Saving and for Environment (ALMEE), Lebanese Solar Energy Society (LSES) and Lebanon Green Building Council (LGBC) joined in. The demand growth prompted industries to venture into assembling and even manufacturing of some parts, this called for the establishment of testing facilities and the engagement of the Industrial Research Institute (IRI) and the development of National Standards through the Lebanese Standards Institute (LIBNOR). These various institutions are collaborating on implementing demonstrational projects, establishing a framework for promoting renewable energy, working on incentives and policies for the development of the national market share of renewables as well as offering RES training programs to state employees and entrepreneurs. Annex B details the roles
of each of the above mentioned institutions.
2.6 National RE Initiatives
2.6.1 NEEAP
NEEAP is the first comprehensive strategy in EE and RE to be adopted in Lebanon. The plan was developed by LCEC, approved by MOEW in December 2010, and adopted by the Council of Ministers (COM) in November 2011. NEEAP includes 14 initiatives—4 in EE, 6 in RE sectors, and 4 in finance, legal, and awareness-raising areas— and covers the period ranging from 2011 to2015. NEEAP calls for the adoption of an energy conservation law, the banning of incandescent lamps, the development of financing mechanisms for EE projects, and the development of renewable sources of energy. NEEAP identified five key RE technologies—wind, hydro, solar thermal, PV, and bioenergy. Other lower priority sources were identified and include geothermal and wave energy.
By increasing decentralized power generation from RE sources, NEEAP aims to support residential and commercial use of wind energy and PV systems and achieve an installed capacity of 50–100 MW by 2015 equivalent to yearly electricity savings of 131–263 gigawatt hours GWh/y.
In hydropower, the plan aims to rehabilitate existing power plants to improve their performance by an additional 20–30 MW and generate approximately 10 MW of additional power through construction of two new hydropower plants. NEEAP also conceives the installation of an additional set of hydropower units at Richmaya power plant with a capacity of 3 MW and the promotion of micro-hydro and supporting small-scale projects.
2.6.2 NEEREA
In 2011, BDL launched NEEREA to support the financing of EE and RE projects across Lebanon through commercial banks. Projects could include solar power, liquid or solid waste treatment, recycling, ecotourism, or the construction of green buildings that conform to Leadership in Energy and Environmental Design (LEED) standards.
NEEREA is a joint effort between the Central Bank, MOEW, MOF, UNDP, the European Union (EU), and LCEC, with a EUR 12 million (USD 15 million) grant from EU. The initiative designed to redefine the market and strengthen trust through a sustainable financing scheme and reliable quality control of products and contracting activities.
The Central Bank approved the first NEEREA EE project in May 2011. Credit terms for new projects include a maximum 10-year credit period plus a six-month to four-year grace period. NEEREA covers loans, made by any Lebanese commercial bank, with 0.6% interest rate, in addition to a grant amount released after implementation of the project.
The financial incentive systems supported by NEEREA through BDL are based upon two types of mechanisms tailored to different categories of customers that intend to purchase and install SWH.
The first incentive system is for individual SWH and provided to end-use customers. It includes a credit for 80% of the SWH value, a 0% interest rate, and a five-year loan period. Additionally, a grant of USD 200 is allocated to the first 7,500 individual SWH installed that pass the IRI specification and quality test (detailed in section 2.7 RE Standards on RE Standards). To date, USD 260 million out of USD 350 million worth of projects (collective SWH, GREEN Real Estate and PV systems) have been approved; the rest is still ongoing (pending approvals). The second financing mechanism is for solar water heating facilities in high-occupancy buildings, such as hospitals, hotels, or schools. BDL, with EU support, offers a grant through

23
participating banks to subsidize loans with maturities of up to 10 years for projects not exceeding 1.5 billion Lebanese pounds (LBP) (USD 1 million).
2.6.3 FITs in the MENA region and NET Metering in Lebanon
A RE support scheme was introduced in Turkey in 2005 based on FITs and additional investment incentives. Following the amendment of the law in 2010, the FIT was set at USD 0.073/kWh (EUR 0.057) for wind power for a period of 10 years, with a bonus for using locally manufactured components of USD 0.006–0.013 (EUR 0.005–0.01) for 5 years. Such a system could be an example for Lebanon to emulate. Wind power producers are also free to sell to the national power pool or engage in bilateral agreements.
Iran launched its FIT in 2009. Jordan, Palestine, and Syria introduced FITs for RE in 2012, but not many projects have been deployed yet. Among the current policies, FITs have been adopted for almost all commercial RE technologies except for geothermal and hydro.
In Algeria and Egypt, FITs are currently under development. In Algeria, this will be a second attempt to introduce FITs. In 2004, through Executive Decree 04-92, Algeria introduced technology-specific price premiums for electricity produced from renewable sources. The incentive scheme envisaged paying a premium to RE ranging from 5% to 300% above electricity market prices. However, this initiative has failed to attract any investments in RE, and, until now, no private projects have been deployed (decree 04-92). This result might be explained by a few important factors. Primarily, the Algerian average price of electricity in 2011 was USD 0.055 for residential customers and USD 0.0 44 for industrial customers. The second important factor is the structure of the Algerian FIT, which appears to be modeled after the original German Renewable Energy Law system, later adopted by Spain. The tariff is set as a percentage of the retail price, with hydro set at 100%, CSP and waste at 200%, and wind and non-CSP solar at 300% of the retail price. However, the policy lacked a clear definition of market electricity upon which the calculation of price premiums was based. The third factor is the maximum capacity eligible for tariff payment, which was set at 50 MW. The Algerian power market operator sets electricity prices, so prospective developers need to weigh the risks associated with an artificially set price acting as the benchmark for their FIT payments. Based on private developers’ response, or lack thereof, the value proposition seems to be unattractive. The Algerian case illustrates the complexity of designing an effective FIT policy.
In Lebanon, the policy paper drafted by the Ministry of Energy and Water dated back to 2010 explains “The legal framework for privatization, liberalization and unbundling of the sector (law 462) exists but is not applied. In parallel, the law implemented by decree 16878/1964 and 4517/1972 which gives EDL exclusive authority in the generation, transmission, and distribution areas is still being applied” (MOEW, 2010). In other words, EDL is the sole entity allowed to provide electricity in exchange for money, making any incentive scheme in line with the widely applied FiT not legally applicable in Lebanon. In a presentation in 2011 Mr. Hayek, Director General of the Lebanese Utility Company (EDL), introduced the Net Metering system that was established in support of “[…] all public, private, and individual initiatives to adopt the utilization of renewable energies to reach 12% of electric and thermal supply […]” (Hayek, 2011). The Net Metering scheme allows users (residential, commercial and industrial) to feed into the grid the locally produced renewable electricity through a bi-directional meter. The user is billed for its NET consumption every 2-months billing period for one year. At the end of the year, any positive credit is compensated by a certificate and reset for the New Year.
2.7 RE related Standards
LIBNOR, the Lebanese Standards Institution, is the sole public authority that issues,
publishes, and amends Lebanese standards ranging from agro- food, chemical, construction, mechanical, electro technical and electromechanical sectors. LIBNOR aims to harmonize Lebanese standards with international, European, or other regional standards, but also considers national characteristics and takes into account input of all local stakeholders. Lebanese standards cover measurements procedures, conventions, symbols, analysis and testing methodologies, codes of practice for technical work and technical rules and codes for buildings.
LIBNOR has two categories of standards: voluntary standards, which are not automatically monitored; and mandatory standards, enacted by decrees and monitored by the relevant ministries. LIBNOR has an information center where all the international and regional standards are available to exporters and importers. It is the job of the Ministry of Economy and Trade (MOET) to monitor all the standards available in the local market. Furthermore, LIBNOR audits local companies for the quality of their products; samples randomly taken and tested at the industrial research institue (IRI) laboratories. In addition, IRI is tasked with the sample testing of imported RES products, which are collected by customs officials. This testing scheme is mandatory for SWH systems and optional for the remainder RES. The control scheme is reinforced by the Customer Protection Department.
2.7.1 RE Systems standards
Lebanon has accepted the solar systems-related standards approved by the European Committee for Standardization including BS EN ISO 9488 2000, which cover general requirements, test methods, and performance characterization of stores for solar heating systems; DD ENV 12977 1 2001, DD ENV 12977 2 2001, and DD ENV 12977 3 2001 which address custom-built thermal solar systems and components.
LIBNOR SWH standards, which are similar to European standards, came out in 2007 and became mandatory in 2010. In October 2010, LCEC launched a qualification campaign offering eligible companies the chance to benefit from any MOEW initiative within the national plan framework for promoting SWH. Qualification was based on two criteria according to European Norms (EN 12975/6): (1) Eligibility of the company (70% of total qualification score) and (2) Performance and eligibility of the products offered by the company (30% of total score). In September 2014, in a presentation by the LCEC at the Beirut Energy Forum (BEF), it was announced that 43 out of 106 companies filling the LCEC survey have been qualified.
A testing facility for locally manufactured and imported SWH entitled ‘SWH testing facility’, established by LCEC in cooperation with IRI, through the Helenic Aid (Greek Fund) has been operational since 2011. IRI examines the SWH to ensure their compliance to Lebanese standards. By decree, all importers, manufacturers, and assemblers have to go through IRI for SWH, but not for PV assembly.
Through IRI, Lebanon is participating in the Solar Heating Arab Mark and Certification Initiative (SHAMCI) scheme developed by RCREEE, which aims to unify the standards for solar thermal products and services across the Arab countries. The project – inspired by the European certification scheme Solar Keymark – promotes adopting standard quality measures, accreditation systems, and quality labels across the region. To date, Jordan, Tunisia, and Egypt have shown interest in implementing SHAMCI at the national level. The initiative implies that each country should have an accredited testing laboratory and inspection bodies to allow for the transfer of solar heating parts across the participating countries. In Lebanon, IRI’s laboratory is still pending approval and accreditation.
To help distinguish Lebanese manufacturers from other producers, LIBNOR established a fee based conformity mark testing as per law 23-07-1962 which would ensure the sustainability and quality of Lebanese certified products. Compliant manufacturers would continuously need to maintain quality levels to meet international standards. This conformity mark is mentioned as a conformity

24
assessment procedure in the WTO technical barriers to trade agreement. This testing procedure aims at improving the quality of local products, increasing the customer’s confidence and eventually familiarizing the manufacturers with the international standards requirements and ensures their products conformity, enabling exports to EU.
In addition, LIBNOR offers fee-based auditing and product testing services to manufacturers. It identifies weaknesses in quality management processes and provides recommendations for improvement. LIBNOR also tests samples of final products through IRI to check for non-conformity problems based on national standard requirements closely correlated to EU standards, and issues its final report based on its factory audit and on IRI’s report. LIBNOR charges an average annual fee of LBP 3 million (USD 2,000). In addition, manufacturers pay a variable sum of up to LBP 3 million (USD 2,000) for testing and auditing fees. Therefore, the conformity mark costs manufacturers an approximate yearly fee of LBP 6 million (USD 4,000).
The LIBNOR norm for PV systems is adapted from the International Electrotechnical Commission (IEC), an international organization that regulates standards for all fields of electrotechnology. The Lebanese standard for PV was created in 2003 and is not yet mandatory.
2.7.2 Standards applied by Lebanese companies
Most of the RES manufacturers and importers interviewed for this report produce or trade systems and components that conform to a mix of local, regional, and international standards (see Table 2.8). LIBNOR ensures that all SWH are certified and compliant with international standards. However, two local manufacturers reported their non-conformity to any particular standards; one of them suggesting that maintaining SWH tank zinc percentages within a range of 150–280 grams (g)/m2 is enough to ensure their quality. The interview methodology is detailed in Annex C – Interview Methodology.
Table 2.8: RES Quality Standards
Company type
RES type Standards
Manufacture SWH
IRI (Norme Libanaise NL 12975-1)
European (EN 12975-2, EN 1297576, NEN 5128, NPR 7976, Din 4753, CE certified)
ISO 9000, ISO 9001, ISO 9806-1-2
Solar Keymark
US certificates (Global American Technology Award)
Import
SWH panels and tanks
IRI (Norme Libanaise NLEN 12975)
European CE, ISO, ROHS, and TÜV)
Solar Keymark
Solar Rating & Certification Corporation North American Board Certified Energy Practitioners
PV
IRI
European (IEC 61/215)
TÜV Nord factory inspection
Wind turbines
European (CE, ISO, and TÜV)
Bioenergy European (not specified)
Note: EN (European norm), ISO (International Organization for Standardization), IEC (International Electrotechnical Commission).
2.7.3 Construction Standards
Several international green building rating and certification systems are being introduced in Lebanon. Main ones include the British Building Research Establishment Environmental Assessment Method (BREEAM) and the American LEED systems. A national ranking system termed ARZ was designed by the Lebanon Green Building Council (LGBC), which provides certification for existing commercial buildings. LCEC has launched an energy audit support program resulting in >100 energy audits with qualified energy services and energy audit companies. In addition, IRI created the CEDRE certification system, which targets buildings under construction. According to CEDRE the developer holds the responsibility of conducting the energy audit rather than the certifying body.
Many Lebanese municipalities “have taken lead in the enforcement of installing SWH in all new buildings” (El Khoury, P. 2013). The current challenge resides in updating the building code to include mandatory SWH installations. Because thermal standards constitute over a third of the rating system, there is discussion about making them mandatory for all buildings nationwide.
Other countries with a climate similar to Lebanon’s have already implemented such measures. Hawaii, and Spain legally require the installation of SWH in all or at least a fraction of new homes. Algeria, Egypt, Jordan, and Tunisia enforce thermal standards or EE building codes. Similarly, other Arab countries—namely, Morocco, Palestine, and Syria—are in the process of revising their building codes to include thermal standards or have already introduced voluntary standards.
2.8 Training, Higher Education, and Research in RES
Training programs play a crucial role in developing solar-thermal markets, especially for larger systems used by commercial and public institutions. According to IRI, training is critical for proper and safe installation of solar panels on roofs. LCEC has been offering training programs in solar-thermal RES construction and installation since 2006. In April 2012, the Global Environment Facility (GEF) and LCEC held a workshop on integrating SWH systems installations in new construction projects.
In early 2009, CEDRO organized workshops focused on how to design and install SWH systems. In parallel, the United Nations Economic and Social Commission for Western Asia (ESCWA) launched technical workshops for small manufacturing businesses aimed at learning methods for manufacturing and testing of SWH systems according to Lebanese quality standards. Additionally, IRI, the Lebanese Solar Energy Society (LSES), and ESCWA held a total of six training sessions for the manufacture of flat-plate-SWH systems. ESCWA lead the initiative, IRI supported the training, and LSES supplied the trainers and the information booklets. Furthermore, Schneider established the Energy University, an online platform where professional can take free courses on energy and other related fields at their convenience.
Throughout 2011, LCEC also conducted a series of training seminars to raise awareness on wind energy potential as well as build technical expertise for the design and operation of wind RES in residential and commercial sectors. Attendees included primarily engineers, technicians, developers and bankers.
On the other hand, the RE sector depends heavily on research and development (R&D) for advancements in materials, technology, and implementation. A number of local universities own such research capabilities and are collaborating with government agencies, multilateral organizations, and – to a lesser extent – with industrial companies. The universities have started offering RES courses and majors over the last few years, and are looking to expand their programs.

25
2.8.1 Academic Activity in RE
For Lebanon to act not simply as a technology user, research and academic institutions need to support a strong RE sector. To this end, the French company Transénergie and LCEC with direct support from IRI and UNDP and financing from the French Ministry of Economy and Finance launched the Educational and Demonstration Platform for Renewable Energies in early 2014. This joint initiative is aimed at RES researchers, educational institutions, university students, and professionals to foster a strong RE base.
2.8.2 University programs and courses
Two RES graduate programs are already running or are planned in Lebanese universities. One is the master’s program in RE offered as part of a joint graduate program between the faculties of engineering of the Université Saint-Joseph (USJ) and the Lebanese University (LU). The other, launched in January 2015 and classes started in February 2015 is a professional graduate degree in RE (green technologies) offered jointly by the Lebanese American University (LAU) , the American University of Beirut (AUB) and the American University in Cairo (AUC) co-financed by the European Union Tempus grant and the Munib and Angela Masri Institute of Energy and Natural Resources.
In addition, these universities and others in the country have integrated RES courses in their undergraduate- and graduate-level electrical, mechanical or civil engineering programs (see Table 2. 9). Annex D - RES University Courses and Programs contains details on these courses and programs.
Table 2.9: University Programs with RES Components
University Educational programLaunch year of the RES program or
courseNo. of course attendees/y
USJ
Master of renewable energy
Joint graduate program between USJ and LU2011 25
Bachelor of electrical engineering 2010 30 - 35
LU
Bachelor of electrical engineering 2006 30 - 40
Bachelor of mechanical engineering 2006 30 - 40
Bachelor of civil engineering 2006 40 - 60
BAUBachelor of mechanical engineering 2010 90
Bachelor of electrical engineering 2010 35
USEKMaster of electrical engineering 2010 26 - 32
Master of mechanical engineering 2011 30 - 40
LAU
Bachelor of electrical engineering 2011 30
PRO-GREEN professional or graduate diploma in green technologies
Joint graduate program between the LAU and AUBLaunched in 2015 24
AUB Master of mechanical engineering in applied energy 2007 30
Ph.D. or master of engineering in electrical and computer engineering
n.d. 30 - 40
NDU Bachelor of mechanical engineering n.d. 30
Notes: BAU (Beirut Arab University), NDU (Notre Dame University), n.d. (no data), USEK(Université Saint-Esprit de Kaslik)
Local university professors in charge of teaching RES courses usually have a doctor of philosophy degree (Ph.D.) in electrical, mechanical, civil, environmental or chemical engineering or biology. For the most part, these degrees are not offered in Lebanese universities, and faculty members are Ph.D. graduates of universities in France, the United States, Canada, Russia or the United Kingdom.
2.8.3 Curricula plans
Most Lebanese universities intend to expand their RES-related course offerings. USJ is planning new courses on smart grids, micro grids, and hybrid systems in the electrical engineering programs. NDU will be offering a new course entitled “Introduction to Renewable Energy” for its Electrical and Mechanical Engineering programs. LU will be introducing solar, wind and bioenergy courses in its Electrical and Mechanical Engineering programs, and courses on EE and green buildings in the Civil Engineering major.
At LAU, a feasibility study for offering undergraduate courses in environmental sustainability – such as environmental sciences, engineering, and design – is in progress in order to develop green content for the university’s educational and research programs. Whereas Environmental Engineering courses have been included in graduate programs and offered as minors. LAU also aims to introduce green topics and courses into existing curricula in the School of Engineering, School of Architecture and Design, the Business School, and the Department of Natural Sciences.

26
BAU is not specific about its plans for introducing new RE courses, but plans to focus on wind energy, PV cells, and bioenergy. The university is also working on offering a new specialization pertaining to RES integration within the Mechanical Engineering Department.
At USEK, the Department of Engineering added courses on solar, wind, and bioenergy. Environmental sustainability courses will also be introduced, and related research programs initiated. Moreover, USEK is considering the introduction of a specific academic program for RE; five students are enrolled in this program, but no one has graduated yet.
2.8.4 Graduates
Approximately 350 students graduate from RE programs or courses each year in Lebanon. An estimated 1,800 students have graduated from an RE program or course since the launch of the RE specifications approximately 13 years ago in the Lebanese University or as early as 1 year in LAU (see Annex E - Number of University Graduates from RES Courses and Programs for detailed graduate estimates). The amount of graduates largely covers local RES companies’ current and future needs for professional personnel, even when considering the highest projected rate of expansion of the sector not accounting for the immigration rate.
An unspecified number of RE program graduates work in the RE field, some as employees of the MOEW. Many graduates prefer to work abroad in the construction industry, or to travel to Europe or the US to further specialize in RES.
2.8.5 RE research
All interviewed universities have carried out research in the RE area. USJ has conducted advanced academic research on topics including distributed generation systems with high penetration of RE sources, power quality in distributed power systems, EE management and optimization, green buildings, optimal control of power systems, and geothermal energy, with publications in the environmental and sustainable development fields, such as “Air quality in Beirut: measurements, results and perspective”, “air pollution and transportation in Beirut” or “Emissions of air pollutants from road transport in Lebanon and other countries in the Middle East region”. LU has carried out academic projects pertaining to waste management and the use of waste and other types of natural resources, such as solar, to produce energy. LU researchers have also explored the connectivity of PV solar systems and combined systems to the Lebanese grid such as: Energy status in Lebanon and electricity generation reform plan based on cost and pollution optimization. Researchers at USEK have studied ways to increase the lifespan of PV through control and surveillance in addition to research on wind, solar, and bioenergy, specifically from municipal waste. LAU and AUB have published several academic papers concerning RE in Lebanon, especially PV and wind energy. They also conducted a hydropower feasibility study for MOEW. Their particular interest lays in the field of RE economics, mainly EE and energy costs, such as “The dynamics of energy policy in Lebanon when research, politics, and policy fail to intersect”, “Assessing water quality management options in the Upper Litani Basin, Lebanon, using an integrated GIS-based decision support system”.
2.8.6 Collaboration among academia and private and public sectors
Most local universities have been collaborating with industrial companies, government institutions, international organizations or NGOs. USJ has worked with the Phoenix-Indevco industrial group on academic projects, internships, and workshops involving steam engines, hydropower, and PV systems. USJ has also collaborated with ALMEE in organizing international conferences on various types of RES. Similarly, LU has organized internships and mentorships with Indevco and Arcenciel, an NGO that “act for the people with difficulties for the sustainable development of society”.
USEK has collaborated with the Ministry of Environment (MOE) and UNDP for acquiring technical support for equipment and systems. LAU has cooperated with the Swedish Research Council on academic and professional research and with the EU Tempus Program to fund the Joint Professional PRO-GREEN Programme in conjunction with AUB and AUC (American University in Cairo). In addition, LAU Electrical and Computer Engineering department has worked on some common projects with European partners, mainly the University of Applied Sciences in Esslingen, Germany, to help develop understanding of fuel cell car systems, including hydrogen-refueling infrastructure.
BAU has provided consultancy services for the EU in collaboration with the Ministry of Agriculture (MOA) as part of the European neighborhood project index (I): Green energy for green companies. NDU has completed NEEAP projects for the EU with the collaboration of MOEW and LCEC. The university is currently working on a technical and academic collaboration project for the use of gas from waste to produce energy.
Balamand University is completing the Forest Management: Inventory Development and Management Plan for two forests in Lebanon in collaboration with the CEDRO project.
Though cooperative efforts among local universities and public and private entities are commendable, more efforts could be made—especially in working with manufacturers on the development of local RES applications. The human resources required for innovation in this sector are certainly available.
In a project dedicated for the academic sector, cooperation with scientific and technical associations in Lebanon, IRI and LSES launched, on December 11, 2012, Ecotruck. It is a mobile laboratory that tours schools and universities nationwide to educate students on RE technologies.
Another initiative of the kind, an LGBC initiative funded by the Makhzoumi foundation “the green demonstration room”, aimed at educating students about the concepts of green buildings, sustainability, energy efficiency, water conservation as well as other related environmental issues.
2.8.7 Know-how and Skills
The amount of university graduates with RES qualifications theoretically covers the local corporate requirements for professional staff. As shown in Table 2.10, there are 1,500 RES graduates—more than the amount of graduates required to work in the current RES professional labor force. The interviews with RES manufacturers and importers showed that their professional staff usually has a bachelor’s degree or more advanced degrees in RES or related fields. Nevertheless, domestic companies are often facing difficulties in recruiting professional staff as they are unable to pay competitive salaries.
Table 2.10: RES Graduates Currently Required and Available
RES labor force
% of professional staffRES graduates
required
Importers 1,921 13 250
Manufacturers 306 9 28
Total 2,227 277
Current pool of RES graduates 1,800
Excess of RES graduates 1,523
Manufacturers and importers are having greater difficulty finding workers with a lower level of expertise, namely skilled workers and technicians, which constitute the bulk of their respective workforces. There is a global shortage of such workers, and the problem is even more acute in Lebanon, where the relatively small industrial base has not created a significant pool of trained workers who could be

27
shifted to such tasks. RES are relatively recent in the local market so there is a general lack of experience and knowledge of RES, which forces the companies to invest significant amounts of time and money in employee training.
Skilled employees and technicians tend to gain their experience entirely through their job, but industrialists believe that a reinforcement of vocational RES training at local technical and secondary schools would be helpful. Emigration of professional staff and skilled workers to better paying countries remains a major obstacle for RES industry owners.
2.9 Import and Domestic Production of RE Components and Systems
RES corporate activity has grown quickly over the past couple of years. For example, the number of SWH companies registered at LCEC increased from 25 in 2005 to >130 by the end of 2011. Moreover, the UNDP-CEDRO project reported that 29 companies submitted expressions of interest (EOI) announced end of 2013 to take part in the forthcoming hybrid PV – diesel implementations scheduled for 2015/16. The submitted proposals were evaluated based on a set of criteria (background, consulting capacity and sector experience), and 17 companies where shortlisted.
RES import and assembly activity is much more developed than manufacturing. There are an estimated 113 trading companies dealing with RES components, compared to approximately 17 manufacturers. To gather information on the availability and sourcing of RES in the local market, InfoPro conducted interviews with 10 manufacturers and 26 importers of RES (see Annex C – Interview Methodology for more details on the interview methodology).
2.9.1 RES Availability in Lebanon
InfoPro interview results show that all of the manufacturers are active in the production and trade of RES and maintenance services, but only half of them exclusively work with RES. In comparison, only a third of importers rely exclusively on RES. Several importers trade not only in RES but also in electrical SWH, LED lamps, conventional heating systems, air conditioners, and information and communication systems – among other electronic, electric or industrial products. Apart from general maintenance services, some traders also offer one or several of the following services: telecom, lighting services, EE energy audits, implementation, consultancy, or mechanical engineering services. A few importers are also involved in or planning to start RES manufacturing.
For both types of companies, RES-related work consists of import, sales, assembly, maintenance, and installation. Three of ten manufacturers and 9 of 26 importers sell whole RES, while the rest also sell RES components. Among the 10 interviewed RES manufacturers, 8 are active in SWH only, 1 produces SWH and concentrated solar power (CSP) concentrators and generators, and 1 produces wind power towers and PV inverters and controllers. As shown in Figure 2. 2, importers deal with a greater variety of RE systems, though most are active in SWH and/or PV systems. Details on the types and prices of RE systems and components that are manufactured locally or imported are available in Annex F - Types and Prices of Locally-Manufactured and Imported RES and Components.
Figure 2.2: Percentage of interviewed RES importers
2.9.2 Developments in Corporate RES Activities
There have been some changes in the direction of RES activity, especially among importers. According to the InfoPro interview results, one company ended its SWH imports in 2010 because the local market was getting too crowded with SWH dealers; high-quality equipment could not compete with cheaper low-quality Chinese products, and the business stopped being profitable. Another company recently had to halt their SWH imports because of a decision to reduce their stock and cut losses. Another company reported a 30% decline in their 2013 SWH turnover rate relative to the previous year, but said that they will keep importing SWH for now, while a different distributor stopped importing PV systems in 2011.

28
In a more positive development, some traders have gone from importing whole RES to outsourcing only certain components, such as vacuum tubes, PV panels or water tanks, since the remaining RES components are manufactured locally. One trader stopped the import of SWH and PV systems in 2009 and switched to buying RE components and systems from local manufacturing companies.
A single manufacturer among the interviewees has not manufactured solar collectors since 2003 for financial reasons; his production costs were too high and it was more economical to import the collectors. Another industrialist explained that his company had already passed through three phases in the solar collector manufacturing process; first his company produced solar collectors made from aluminum, then from copper, and finally from titanium in an attempt to improve performance. Another company switched from making galvanized steel water tanks to porcelain water tanks.
2.9.3 Manufacturing Inputs and Machines
Many of the raw materials needed to manufacture RES components, such as steel, copper, polyurethane, and powder paint, are sourced locally. Some additional items required for assembling a complete RES, such as panels, vacuum tubes, pipes, and some electrical and sanitary accessories can also be found in the local market, but many components come from abroad. Details on RES manufacturing inputs and origins are available in Annex G - RES Manufacturing Inputs and their Origins.
As shown in Table 2. 11, the machines used in the RES manufacturing process are often quite old, and a few have outlived the ordinary machine life cycle. In most cases, the RES manufacturing process is semi-automated; only one company uses full automation. Two of the interviewed manufacturers use a manual process.
Table 2.11: Machinery in RES Manufacturing
Age of the machines (y) Life cycle of the machines (y)
min max avg min max
1 27 13 5 >20
2.9.4 RES Importer and Manufacturer Workforce
Local RES companies are mostly small enterprises with a small number of full-time employees; they hire upon demand, depending on the workload. For both importers and manufacturers, the average number of employees is below 20 (see Table 2. 12).
Table 2.12: Employees Working on RES
Company typeMin no. of employees
Max no. of employees
Avg no. of employees
Import 2 80 17
Manufacture 6 56 18
As seen in Figure 2. 3 and Figure 2. 4, the importer workforce is composed largely of technicians that work with a smaller sales team, while the manufacturer workforce is composed largely of skilled machinists, with unskilled workers. In addition, both importing and manufacturing activities require a maximum of 30% senior experts for technical support.
Throughout this report, machine operators are referred to as skilled workers, whereas unskilled workers are employees that perform minor tasks that do not require any knowledge or skills and generally characterized by low education levels and low wages.
Figure 2.3: RES importers labor profile (base: 26)
Figure 2.4: RES manufacturers labor profile (base: 10)
Staff employed by interviewed companies, work 35 hours/week minimum, 56 hours/week maximum, and 45 hours/week on average. Most interviewed manufacturers employ Lebanese workers, along with Syrians, Palestinians or other foreigners. One manufacturer indicated that his managers and professional staff are Lebanese, his skilled workers are Egyptian, Indian, and Syrian, and his unskilled workers are Syrian.
2.9.5 RES Workforce Training
Importers
The majority of technicians employed, including the foremen/supervisors, have a diploma from a local secondary or technical school—a technical baccalaureate (BT), a higher technician diploma (TS), or a technical license (LT). Some sales and professional staff are also technical school graduates, but most are business or marketing graduates, or engineers with diplomas from local universities. Managers usually hold degrees in mechanical, industrial, electrical, environmental or civil engineering or business degrees from American, Lebanese or European universities in Lebanon. In addition, some candidates hold additional certifications such as the LEED GA ( green associate) which allows individuals to have a documented, updated understanding of the latest green buildings principles and practices and project management professional, a certification that provides individuals with educational and competency tools to lead and direct projects. .
Importers indicated that their employees have full knowledge of RES installation and assembly; technicians fully knowledgeable of RES integration and contracting and professional staff fully knowledgeable about everything related to RES. Several dealers reported holding in-house training sessions coordinated by the company’s RES experts. In one company, the general manager, an engineer, trains the technicians. Two other trading companies send their professional staff abroad to attend training sessions in China and Germany. In most cases, employees, especially technicians, gained their experience entirely through their job.

29
Manufacturers
Manufacturers indicated that their skilled workers usually graduated from secondary school, technical school or university and tend to have welding certificates from the TÜV welding institute, or a technical (BT/TS/LT) or secondary school diploma. The professional staff is mostly composed of engineers with a degree (bachelor, master or Ph.D.) from American, French or Lebanese universities in Lebanon. While the managers have generally achieved a bachelor’s or master’s degree in business with accounting, finance, marketing, or engineering, after studying in Lebanon or abroad.
The education level and the position of the various employee categories directly reflect their depth of knowledge about the RES manufacturing process. Unskilled workers have a medium knowledge of the manufacturing method, and no necessary knowledge about the assembly or installation of the systems. Skilled workers have medium to full knowledge of RES manufacturing, assembly and installation. Professional staff has full knowledge of everything related to RES. In most cases, the employees’ acquired their knowledge entirely on the job, except for the skilled workers with relative educational degrees who were taught the basis of the manufacturing or machine operating, same for professional employees. Managers most often have full knowledge of all aspects of RES.
2.9.6 Workforce Recruitment
Both importers and manufacturers suffer from the brain drain Lebanon is experiencing and from a lack of sufficiently qualified staff. Importers seem to have the greatest trouble recruiting qualified staff; nearly half of the 26 interviewed import companies reported recruitment problems. Temporary hires are common, especially among technicians. The normal turnover for technicians is three months. Importers reported finding supervisory and skilled electrical or mechanical technician position the most difficult to fill. There is a general shortage of skilled personnel, who prefers to work in the Gulf Cooperation Council (GCC) region for higher salaries. Some companies also reported a shortage of good talent on the sales side.
Recruitment is less of a challenge for manufacturers, only 10% of whom indicated facing recruitment difficulties. Unskilled workers recruitment is immediate as opposed to a lengthier process required for the skilled workers positions. As with importers, uncompetitive salaries make skilled manufacturing workers difficult to find; leading to a growing challenge for manufacturers to find professionals with sufficient RES-related knowledge, specifically in the manufacturing process of RES installation and assembly. Manufacturers find that they have to train their workforce before assigning them fieldwork.
2.9.7 Cost Structure
As shown in Table 2. 13, the import cost structure varies widely among RES types and companies. One importer reported paying 5% in customs fees for PV systems, and another reported no customs fee for PV panels but 5% on inverters and batteries for PV systems. Yet another manufacturer reported paying 5% customs for solar panels for SWH but 10% customs for other SWH components. The customs and Value Added Tax (VAT) duties on various RES and parts are included in Annex H - Tariffs on RES and Parts. Furthermore, shipping costs tend to vary based on the transport type (sea being the most common, air or high speed services such as DHL), while clearance is product and quantity dependent.
Table 2.13: Import Cost Structure in RES (as percentage of value of goods)
Company Type RES Type
Customs
VAT (%)
Clearance and Shipping
min (%)
max. (%)
avg (%)
min (%)
max (%)
avg (%)
Import
SWH 5 15 7 10 10 24 15
PV 0 15 7 10 6 24 12
Wind turbine
5 15 8 10 5 20 13
Biomass stove
5 15 10 10 10 20 15
Manufacture SWH 2 10 5 10 5 15 10
2.9.8 Turnover and Factors of Production
Turnover data is limited. Of those interviewed 11 of 26 importers and 4 of 10 manufacturers did not want to disclose their turnover figures. However, they were forthcoming about the importance of RES to their business—of those interviewed 9 of 26 importers and 4 of 10 manufacturers specified that their entire turnover comes from RES (see Table 2. 14).
Table 2.14: Turnover of RES sales
Company type
Annual turnover (thousand USD ’)
RES part of turnover (%)
min max avg min max avg
Import 15 7,000 1,141 1< 100 58
Manufacturer 100 3,500 1,508 30 100 74
Manufacturers were less prone to disclosing cost information than turnover data. Interviewees that divulged estimates of the proportion of production and non-production costs to total costs were rare. Production costs, which cover raw materials and machines, make up 70% of total costs on average, while non-production costs, which include labor and other manufacturing costs, represent the remaining 30%. This shows that RES manufacturing is a capital-intensive business (see Table 2. 15).
Table 2.15: Production and Non-production Costs in RES Manufacturing
Production cost (as % of total cost)
Non-production cost (as % of total cost)
min max avg min max avg
50 86 70 14 50 30
When comparing the ratio of labor force to turnover of importers and manufacturers (see Table 2. 16), it is apparent that manufacturers recruit 84% less employees than importers for a sort of similar turnover amount. This result is predictable since RES import, sales and installation is more labor-intensive than RES production, especially since manufacturing tends to be more semiautomatic production than manual processes.
Table 2.16: Use of Labor in the RES Market
RES market
(million USD ’) RES labor forceLabor or turnover
ratio
Import 74,781 1,921 0.026
Manufacture 18,971 306 0.016
Total 93,752 2,227 0.024

30
2.9.9 Profitability
RES have widely variable profit margins. On average, SWH rank first (see Table 2. 17). One RES importer only bids for large-scale projects that require a minimum power generation of 10 kW because one large-scale project is financially equivalent to 20 small projects. Another indicated that the profit margin for large bids is 10%, while for retail sales the margin varies between 10% and 15%. Apart from the quality and quantity of systems sold, the profit margin also depends on cost factors such as transportation and installation.
Several solar RES importers pursue a zero-stock policy because the price fluctuations of these systems lead to the depreciation of their stock value. Moreover, the prices of solar panels and batteries are often negatively correlated—when solar panels become cheaper due to technology advancements, batteries become more expensive.
Table 2.17: Profit Margins in RES
Company typeRES type
min profit margin (%)
max profit margin (%)
avg profit margin (%)
Import
SWH 10 50 22
PV 5 40 20
Wind turbines
15 2520
Manufacture SWH 5 45 25
Because of the intensive competition and increasing number of players in the Lebanese SWH market, several importers were forced to reduce their profit margins in order to maintain market share. The profit margin for one importer has declined from 20% to 10% on all RES. The importer believes this is better for clients who will pay lower prices for RES. Another viewed the shrinking margins as a threat to the sustainability of the overall sector, making it difficult for companies that focus on RES trading to survive.
2.9.10 Client Profile
An RES importer’s clientele is very diverse. It comprises Lebanese individuals, especially for residential systems, but also regional corporations including industrialists and construction companies, farmers, international organizations, NGOs, religious institutions, municipalities and other government institutions for multiuser systems. One importer plans to start doing business with the public sector. Another reported that he was working on the new Strategic Hub for the Analysis and Acceleration of the Mediterranean Solar Energy (SHAAMS) project with the Chamber of Commerce Industry and Agriculture of Beirut and Mount Lebanon (CCIABML) targeting RES in schools (details on the project are in Current and Planned RE projects). Foreign clients are mostly based in the Middle East and North Africa Region (MENA), but also in the EU, USA, India and Africa. One importer indicated future plan to relocate outside national borders.
Manufacturers’ clients mostly include national and regional corporations, including RES contractors and construction companies. Some producers cooperate with national government authorities, industrialists, multilateral organizations, NGOs, associations, and religious institutions, as well as Lebanese households and individuals. International customers are located in Eqypt, France, Sudan and the rest of Africa, the United Arab Emirates, and the USA.
2.9.11 Demand for RES
Both manufacturers and importers were generally of the opinion that Lebanon has a positive environment for RES. Local consumers are motivated to adopt RES measures given that the national electricity provider covers up to 12 hours a day
outside of the administrative capital Beirut. End users have to resort to private owned diesel generators to cover the blackout hours and bills for private power generation are too high.
Solar Water Heater Market
The only RES where the national market is well developed is SWH. The estimated market value for SWH reached USD 18.13 million in 2011, and varied between USD 25 and 30 million in 2012. As of 2011, the SWH market was mostly composed of open vacuum tubes with 59.5% of the overall market estimated at 7,202 systems. Flat plate collectors ranked second with 3,236 systems or 35% of the market, and a minor share for batch systems with 0.4%. Due to their higher durability, InfoPro’s RES company interviews found that SWH systems using flat-plate solar collectors sell better than those using vacuum tubes.
European SWH are the most expensive but available in the Lebanese market, especially Dutch, French, and Italian products. Greek, Lebanese, and Turkish products have a lower price range. Chinese products have the most competitive prices. These cheaper systems are generally still more sellable than expensive systems, but at the expense of quality. The life span of low-quality Chinese SWH is 7–8 years, while the life span of European systems can reach 30 years.
The conducted interviews revealed that SWH systems with tanks of 200–300 liters (L) are more in demand than systems with smaller tanks. This is because the size requested depends mostly on the number of family members, with every person requiring 50 L of water a day. The needed and available space for the installation of the system is also a consideration. Because they tend to last longer, SWH systems comprising porcelain enamel tanks and titanium solar collectors are more popular than systems comprising galvanized steel tanks and copper solar collectors.
Solar thermal
Several subsidized load programs have been launched to stimulate the demand for RES, mainly for SWH, namely: “Solar Heater Loan” with BLF, “BDL Green Loan” with Credit Libanais, “a solar Water heater for every engineer”. Contractors are progressively integrating RES in new buildings, and developers are abiding by new legislation that obliges them to incorporate RES in construction projects. However, not all residents can afford to switch to in-home RES. Lebanese residents lack sufficient knowledge and awareness about RES in general, although awareness and social acceptance is increasing. Awareness can be seasonal; the survey showed that SWH high-sales season is from April until October.
PV systems
As shown in Figure 2. 5, the perception is that solar technologies have the biggest potential because of the high number of sunny days nationally. Of all RES, SWH systems are the highest in demand—the technology is mature, accessible, affordable, and well known. By comparison, PV is a new and relatively more expensive technology that suffers from a lack of incentives and awareness. The issues related to the relatively short life cycle of batteries threaten the efficiency of PV systems in general. However, Lebanon’s power generation problems could be alleviated by large-scale PV systems. PV systems are also applicable in the agricultural and industrial sectors, but represent a challenge to the residential sector given the presence of blackouts and the requirement for battery storage.
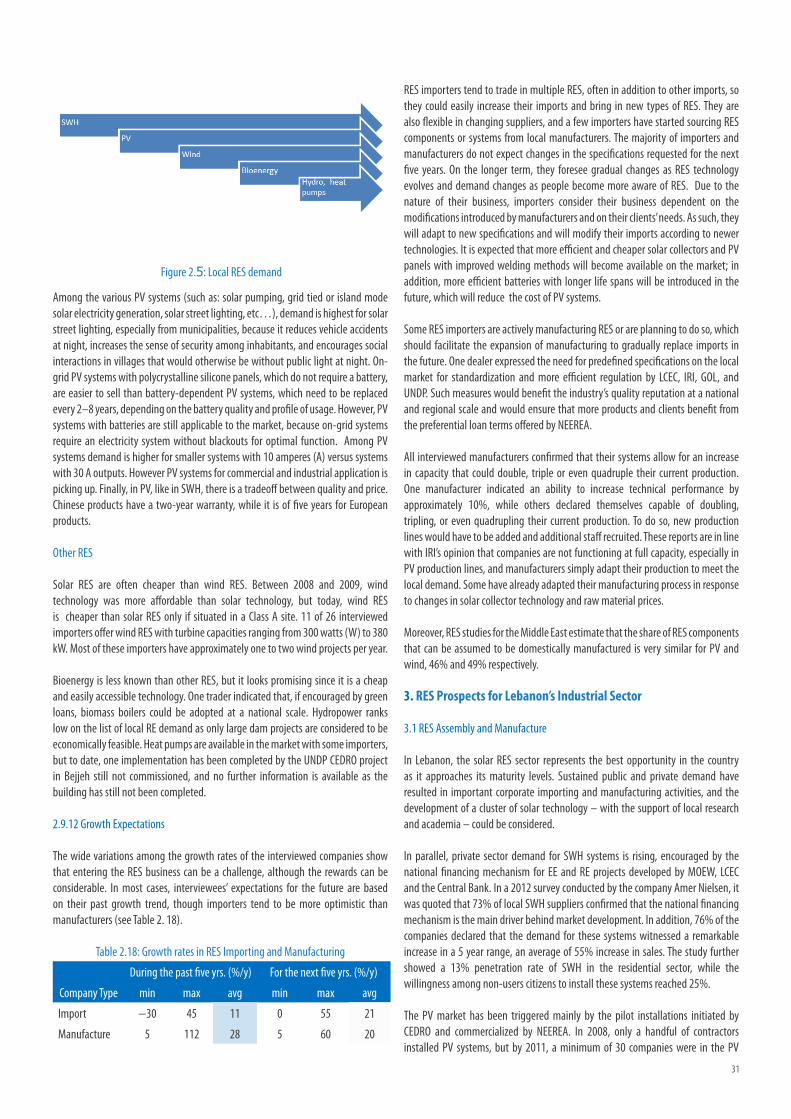
31
Figure 2.5: Local RES demand
Among the various PV systems (such as: solar pumping, grid tied or island mode solar electricity generation, solar street lighting, etc…), demand is highest for solar street lighting, especially from municipalities, because it reduces vehicle accidents at night, increases the sense of security among inhabitants, and encourages social interactions in villages that would otherwise be without public light at night. On-grid PV systems with polycrystalline silicone panels, which do not require a battery, are easier to sell than battery-dependent PV systems, which need to be replaced every 2–8 years, depending on the battery quality and profile of usage. However, PV systems with batteries are still applicable to the market, because on-grid systems require an electricity system without blackouts for optimal function. Among PV systems demand is higher for smaller systems with 10 amperes (A) versus systems with 30 A outputs. However PV systems for commercial and industrial application is picking up. Finally, in PV, like in SWH, there is a tradeoff between quality and price. Chinese products have a two-year warranty, while it is of five years for European products.
Other RES
Solar RES are often cheaper than wind RES. Between 2008 and 2009, wind technology was more affordable than solar technology, but today, wind RES is cheaper than solar RES only if situated in a Class A site. 11 of 26 interviewed importers offer wind RES with turbine capacities ranging from 300 watts (W) to 380 kW. Most of these importers have approximately one to two wind projects per year.
Bioenergy is less known than other RES, but it looks promising since it is a cheap and easily accessible technology. One trader indicated that, if encouraged by green loans, biomass boilers could be adopted at a national scale. Hydropower ranks low on the list of local RE demand as only large dam projects are considered to be economically feasible. Heat pumps are available in the market with some importers, but to date, one implementation has been completed by the UNDP CEDRO project in Bejjeh still not commissioned, and no further information is available as the building has still not been completed.
2.9.12 Growth Expectations
The wide variations among the growth rates of the interviewed companies show that entering the RES business can be a challenge, although the rewards can be considerable. In most cases, interviewees’ expectations for the future are based on their past growth trend, though importers tend to be more optimistic than manufacturers (see Table 2. 18).
Table 2.18: Growth rates in RES Importing and Manufacturing
Company Type
During the past five yrs. (%/y) For the next five yrs. (%/y)
min max avg min max avg
Import −30 45 11 0 55 21
Manufacture 5 112 28 5 60 20
RES importers tend to trade in multiple RES, often in addition to other imports, so they could easily increase their imports and bring in new types of RES. They are also flexible in changing suppliers, and a few importers have started sourcing RES components or systems from local manufacturers. The majority of importers and manufacturers do not expect changes in the specifications requested for the next five years. On the longer term, they foresee gradual changes as RES technology evolves and demand changes as people become more aware of RES. Due to the nature of their business, importers consider their business dependent on the modifications introduced by manufacturers and on their clients’ needs. As such, they will adapt to new specifications and will modify their imports according to newer technologies. It is expected that more efficient and cheaper solar collectors and PV panels with improved welding methods will become available on the market; in addition, more efficient batteries with longer life spans will be introduced in the future, which will reduce the cost of PV systems.
Some RES importers are actively manufacturing RES or are planning to do so, which should facilitate the expansion of manufacturing to gradually replace imports in the future. One dealer expressed the need for predefined specifications on the local market for standardization and more efficient regulation by LCEC, IRI, GOL, and UNDP. Such measures would benefit the industry’s quality reputation at a national and regional scale and would ensure that more products and clients benefit from the preferential loan terms offered by NEEREA.
All interviewed manufacturers confirmed that their systems allow for an increase in capacity that could double, triple or even quadruple their current production. One manufacturer indicated an ability to increase technical performance by approximately 10%, while others declared themselves capable of doubling, tripling, or even quadrupling their current production. To do so, new production lines would have to be added and additional staff recruited. These reports are in line with IRI’s opinion that companies are not functioning at full capacity, especially in PV production lines, and manufacturers simply adapt their production to meet the local demand. Some have already adapted their manufacturing process in response to changes in solar collector technology and raw material prices.
Moreover, RES studies for the Middle East estimate that the share of RES components that can be assumed to be domestically manufactured is very similar for PV and wind, 46% and 49% respectively.
3. RES Prospects for Lebanon’s Industrial Sector
3.1 RES Assembly and Manufacture
In Lebanon, the solar RES sector represents the best opportunity in the country as it approaches its maturity levels. Sustained public and private demand have resulted in important corporate importing and manufacturing activities, and the development of a cluster of solar technology – with the support of local research and academia – could be considered.
In parallel, private sector demand for SWH systems is rising, encouraged by the national financing mechanism for EE and RE projects developed by MOEW, LCEC and the Central Bank. In a 2012 survey conducted by the company Amer Nielsen, it was quoted that 73% of local SWH suppliers confirmed that the national financing mechanism is the main driver behind market development. In addition, 76% of the companies declared that the demand for these systems witnessed a remarkable increase in a 5 year range, an average of 55% increase in sales. The study further showed a 13% penetration rate of SWH in the residential sector, while the willingness among non-users citizens to install these systems reached 25%.
The PV market has been triggered mainly by the pilot installations initiated by CEDRO and commercialized by NEEREA. In 2008, only a handful of contractors installed PV systems, but by 2011, a minimum of 30 companies were in the PV

32
business, whereas, to date 86 companies are involved. According to IRI, PV systems are the second easiest RE system to implement after SWH as the manufacturing technology is accessible and cost-efficient. IRI believes there is strong potential for market growth for PV systems, especially outside of the Beirut area, where municipalities are particularly supportive and have enforced such installations for new buildings. According to ALI, PV investments with net metering have a pay-back period of approximately six years, making it very interesting for industrialists to start investing in this branch of RES.
Finally, the wind market in Lebanon is still quasi non-existent. Indeed, to be economically viable for local manufacturers, a minimal demand threshold should be reached because the size and the cost of the wind power equipment are considerable. Based on a 12 country (Denmark, Germany, Spain, Netherlands, USA, Canada, UK, Australia, India, Japan, Brazil and China) case study report published in 2005, it is estimated that a minimum annual demand of 150–200 MW for three or more years is crucial to developing a nascent local manufacturing industry, while a more capable and aggressive local industry is likely to require a minimum of 500 MW/y . The critical mass of production is more difficult to achieve in smaller economies like Lebanon, which will slow down the emergence of a full-fledged RES wind manufacturing industry. The evolution of the international wind market is a good example to learn from regarding the importance of the national market demand for local manufacturers. A sizable and dependable market first encourages local companies to invest in new production lines, and also drives international companies to invest in local subsidiaries. This has been particularly obvious in China, Denmark, Germany, India, Spain and the US; where wind turbine exporters usually got their start in their home country markets.
Because the deployment of any RE technology requires high up-front capital costs, which make-up approximately 80% of total lifetime costs (values differ for various RE technologies), industrial investors need to be confident that they will see a return on their investment over the project’s lifetime. A continuous flow of projects – which cannot be guaranteed by the public sector alone – in future years, is a major requirement for incentivizing initial investments by RE support industries.
3.1.1 S-curve of Technology Adoption
According to the market S-curve of technology adoption, a technology generally starts in the research arena. It is then introduced into the market by pilot projects that demonstrate its application, followed by commercializing policies, which can be accompanied by government incentives. In this supported commercial stage, where the slope of the S-curve is the steepest, market development policies such as financing mechanisms or feed-in-tariffs (FIT) are needed to encourage diffusion of the new product.
Innovations tend to move slowly into niche markets, and then mushroom into the mainstream, with supply- and demand-side factors jointly influencing the rate of diffusion. The chart in Figure 3. 1 plots the stage of private market adoption of the various RES that have single-family, high-occupancy or industrial applications. Market penetration and competitiveness increase over time until the technology is economically viable on its own without support.
0%
10%
20%
30%
40%
50%
60%
70%
80%
90%
100%
Lebanon's S-Curve for RES Private Market Adoption
SWH
PV
Wind
Bio
Research
Demonstration
Maturity
Supported Commercialization
Penetration
CSP Hydro
Time
Heat Pump
Figure 3.1: Lebanon’s S-curve for RES private market adoption
3.2 Obstacles and Challenges to the Implementation of RES
The development of a RES industry will benefit from the preexisting industrial base, which comprises the electronic, electric, cable, glass, steel, aluminum, piping, storage tank, and plastic industries. Local manufacturers have already started making RES components or entire RES. Indeed, the flexibility of manufacturing companies is an important factor that will facilitate the expansion of the RES industry. Most of the interviewed companies confirmed their readiness to increase their production. Manufacturers are also quick to adapt their manufacturing processes or switch from one raw material to another to keep up with technological developments or to deliver more competitive products.
According to IRI and ALI, solar power heater systems can be easily produced by the domestic industry. The manufacturing process involves several welding processes, but does not require advanced technology. The SWH tanks are external so they have to be adapted to withstand adverse weather conditions, and be more robust than ordinary water tanks. Such tanks could be incorporated into pipelines of companies that produce the regular ones. Moreover, metal structure manufacturers can adapt their production tools to make different forms of RES supports.

33
The local production of PV panels is also possible. The same industrialists that are producing SWH can produce PV systems, even though it is a different technology. However, industrialists do not foresee a large production of PV panels locally in the short term, as they remain cheaper to import. Electrical elements like inverters, which are found in many other applications, can also be produced locally.
In wind technology, the local industry has the capability to manufacture the structure and the column, and assemble the gearbox. However, the fans require a more advanced technology that incorporates carbon fiber and cannot be produced by existing factories. Similarly, the local industry has not progressed sufficiently to be able to fabricate the mirrors that are at the core of CSP technology.
The interviewed industrialists indicated that they are using a semi-automated manufacturing process, usually with a mix of old and new machines. For some, an infrastructure upgrade is required, but the RES manufacturing process seems to suffer primarily from lack of raw material availability rather than from missing technology. For instance, while aluminum or steel for PV frames and SWHs structures is easy to access, the silicon needed to make wafers is not readily available. Other common problems that the interviewed RES manufacturers reported included grid outages and high electricity cost. The high price of raw material in general and hydrocarbon in particular, corporate taxes and labor-related issues were also mentioned.
Most of the RES are experiencing annual capital cost reductions brought about by progress ratios (experience curves) which will further benefit their economic performances. Progress ratios and experience curves indicate cost reductions experienced for increases in global capacity due to learning-by-doing and implementing economies of scale.
The extra costs of integrating variable RE such as wind into the power grid are negligible when RE is below 20% of the total energy mix, as is the case in Lebanon. These additional costs are mostly due to additional system balancing reserve requirements, meaning the rapid short-term adjustments needed to balance fluctuations. Other sources of extra costs are system margin requirements or the ability to meet peak demand, and efficiency losses in conventional plants. Given the national demand-supply deficit, the issue of integrating RE sources to the grid will be financially beneficial because the entire newly generated capacity will be used to meet demand without impacting conventional plants. On the other hand, problems will arise because integrating utility-scale installations – such as wind and solar farms and hydropower plants - will add unprecedented levels of stress to a grid designed for conventional energy sources.
Because RE sources challenge most conventional energy sources (excluding hydro power), increasing their use is often an uneven process. The barriers that hinder RE expansion vary from economic, technical, and political. Lebanon, as an oil importer in a region of oil exporters, has its own set of challenges. How to overcome these challenges is discussed in the recommendations section.
3.2.1 Subsidized conventional fuel
For several decades, conventional energies have burdened governments in developed and developing countries with heavy subsidies. In 2008, the International Energy Agency estimated that eliminating fossil fuel subsidies would result in a 10% reduction in global greenhouse gas emissions by 2050.
In the Arab region, energy subsidies are high for oil exporting and importing nations. Subsidies constitute >20% of governments’ expenditures on average (Energy Sector Management Assistance Program (ESMAP) 2009). All countries in the region subsidize fossil fuel products, and most subsidize electricity, from any source. Competing against such high subsidies is a challenge for alternative sources of energy.
In Lebanon, the national energy bill has grown quickly over the last decade, especially in recent years; in 2011, it reached USD 5,264,000,000 due to increased petroleum prices worldwide. The value of fuel imports accounted for 22% of total imports in 2011, compared to 20% in 2010.
The heavily subsidized cost of fossil fuel-based electricity makes it difficult for any other source of energy to enter the market competitively. The external costs of fossil fuel use, such as environmental degradation and negative public health outcomes—in comparison with clean energy technologies— are being ignored.
3.2.2 Cost and Pricing of RE Technology
Consumers are usually more conscious of the initial payment for a product than its full cost over time. A comparison of the investment needed for generation of electricity from various energy sources demonstrates a lower initial cost per kW for fossil fuel sources than for RE sources. High initial capital costs remain a significant issue, especially for the adoption of CSP technology. Still, the RE cost can decline as delivery continues and technology matures. For instance, this has already occurred in PV technology.
Cost and pricing are the chief obstacles for a RE company. However, if the environmental impact of conventional, non-renewable fuel sources could be accounted for in their final price through a mechanism such as an ecological tax, then RE would prevail in the competition against conventional energy sources. The performance of the SWH market, which was enabled by a state-subsidized financing mechanism, can serve as a model for the future of other RE branches.
The cost of power production via RES is the result of two parameters: the type of technology and the resource availability. For some RES, such as horizontal wind turbines, the technology is mature lowering its production cost. Increased solar radiation and wind speed, results in higher electricity generation per unit, and lower production costs. The potential economic benefits of RES can be valued through the levelized cost indicator.

34
Figure 3.2: Levelized cost for various energy sources (Source: CAPEX ranges are based on reports by the International Renewable Energy Agency (IRENA, 2012) and experts’ estimates; oil price ranges are based on forecasts of the International Energy Agency (IEA, 2014))
Figure 3.2 shows ranges of levelized costs for various energy sources. The cost at which the RES have to compete is the state electricity selling tariff of USD 0.094/ kWh (LBP 141/kWh) which is constant since 2006. This tariff is based on an outdated oil price of USD 25/barrel, and has not been adjusted for the increase in national oil price or inflation. Privately owned small-generation systems charge an average of USD 0.18/kWh to end consumers (El-Fadel, 2009).
3.2.3 Government Policy
While developing countries most often highlight technical barriers and immature technologies as the main obstacles to the expansion of RE, in Lebanon, a robust policy investigation indicates otherwise, mainly law 462. Technology improvement is just one element of RE development. PV technology has undergone a revolution in efficiency, and RE technology is being developed worldwide.
The main difference between countries that are involved in RE and those that are not is the existence of government policies to support RE technology. Countries with more advanced policies are those with a greater share of RE in their primary energy generation. In Lebanon, Law 462 initiates a platform for an energy revolution based on two major points: the establishment of a regulatory authority and the recognition of independent power producers (IPP). Although it is an essential step toward the renovation of the electricity sector, this policy is not sufficient. The absence of a more comprehensive and practical law is a major obstacle to the local development of RE.
International agreements
In 2004, Lebanon and the European Free Trade Association (EFTA) signed a free trade agreement. EFTA granted market access on industrial goods in early 2005, while Lebanon started progressively reducing the tariff on industrial products in 2008 and will continue to do so until 2015. The agreement covers trade in industrial goods and processed agricultural products, as well as investment and government procurement. Lebanon’s Euro-Mediterranean Partnership agreement came into force in April 2006. The agreement provides for reciprocal free trade on the majority of industrial goods.
Lebanon is seeking to accede to the WTO, where it gained observer status in 1999. Member countries of the WTO are required under the Agreement on Technical Barriers to Trade to report to the WTO all proposed technical regulations that could affect trade with other Member countries. According to LIBNOR, giving subsidies or certain rights to local producers is not prohibited under WTO rules; however, it should not be done at the expense of the importers’ interests.
International conventions and treaties are an important element as they are at the top of the national legislative hierarchy, taking precedence over the Constitution. Laws issuing from Parliament, COM decisions, and decisions by specific ministers rank lower.
3.2.4 Regulatory Framework
The next step after setting a policy is to have a well-designed regulatory system to deal with the legal framework. Some countries have launched RE policies through their parliament, but the policy needs a practical regulator to enforce. Iran, for instance, issued a Feed-In Law in 2008. The law passed the parliament and was administered through the Ministry of Power. However, the absence of a proper regulatory framework prevented potential projects from being enforced. By mid- 2009, projects equal to 3,000 MW were proposed to the Iranian Ministry of Power, but the Ministry rejected them due to the lack of a regulatory structure.
In Lebanon, Law 462 defines the role of a regulatory electricity authority, but it has not yet been implemented. Consequently, there is no authority in place to study RE applications. In the absence of a codified legal framework, investors may not choose to invest in RE facilities as no real government-brokered, financial incentives are offered.

35
The electricity law does not allow direct private sector involvement in energy production; however, it does not prohibit leasing power generated by private firms. EDL can therefore not unilaterally take the decision of adopting a FIT, but it can—and did—take the decision to adopt net metering. In general, the Cabinet’s approval is needed to launch any project involving energy production.
Law 462 was adopted in 2002 in an attempt to reform the electricity sector and allow for private power generation. Law 462 recognizes IPP as participants in electricity generation. However, to this day, the law remains ineffective because the electricity regulator responsible for granting generation licenses to IPP has never been established. As a result, the electricity sector remains in a legal vacuum, where up to 30% of its power is supplied by unofficial, private, standalone generating units, which are often highly inefficient.
As illustrated in Figure 3.3 below, several amendments have been introduced to Law 462 to allow for future expansions, and for the penetration of RE technologies. The amended law is expected to make provisions for a FIT for cogeneration, and should call for the introduction of a transition period during which the corporatization of EDL will take place. To date, Ministerial officials have completed the revision of Law 462, approved by COM, and ratified by the Parliament, however it has got to be implemented. Implementing Law 462 or introducing a new RE law is the only legal avenue that could allow the private sector to take part in RE production.
Figure 3.3: Proposed structure of the electricity sector based on Law 462 and the Regulations of the Higher Council of Privatization with the Required Modification for the Potential FIT (Data from Beheshti (2010). Related sectors are in a similar situation; For instance, there is no single, empowered regulatory body responsible for the solid waste sector, since the municipalities are entrusted with SW management, and no proper regulation is in effect for the operation of waste incineration facilities.
3.2.5 Lack of awareness
Neither Lebanon’s general population nor its elites are well informed about the potential that RE sources hold in supporting their country. Based on a report published by the SHAAMS project, the public is little aware of the importance of energy conservation and the real meaning of sustainable development, in spite of the active role of (mostly environmental) NGOs in this domain.
Misinformation or a lack of information hinders the expansion of RE and should be set as one of the main goals of the regulatory authorities. The lack of visible installations and familiarity with RE technologies can lead to the misperception that RE poses a greater technical risk than conventional energy sources. The absence of skills and information may increase perceived uncertainties and interfere with policy decision-making. For instance, bank and insurance systems would hardly support any project that is unfamiliar to their experts.
The 1998 education reforms incorporated environmental studies, including climate change, into science, civic, and geography courses throughout the academic years. Later on, local universities incorporated RE courses and programs into their curricula. Due to those efforts, a study published in 2010 showed that the only RE technology that people can commonly observe is the SWH.
The growing popularity of SWH systems owes much to the awareness campaigns conducted by LCEC and the activities of IRI. Having an effective public relations plan for RE resources in the country requires close collaboration among several organizations and ministries. This cooperation will be fundamental to the future establishment of an electricity regulatory authority. In the meantime, as the recognized expert bodies nationwide, LCEC and IRI could play a crucial role in raising awareness.

36
3.3 Labor Market Implications
Multiple studies indicate that the RE sector generates more jobs than fossil-fuel-based energy because more people are needed especially at the construction, manufacturing, and installation stage; less so in operation and maintenance, partly because fuel input management is not necessary, with the exception of the bioenergy sector.
A recent study in Spain (European Renewable Energy Council, 2010) found that the RE industry generates between 1.8 and 4 times more jobs/MW installed than conventional sources. This is because RE supply is more labor-intensive than traditional fossil-fuel-based supply, per MW and per dollar. Among the various RES, solar PV technologies require the biggest number or workers to manufacture and install (See Table 3.1).
Jobs created by the RE sector can also be safer, in terms of potential health risks, compared to employment within the fossil fuel energy sector, ensuring longer-term employment periods and increased human capital.
Table 3.1: Employment Factors
Type of Energy
Manufacturing, construction, installation
(person years/MW)
Operation & maintenance, fuel processing (jobs/
MW)
Fuel (jobs/MW)
Solar thermal
10.0 0.3 n/a
Solar PV 38.4 0.4 n/a
Hydro 11.3 0.2 n/a
Wind 15.0 0.4 n/a
Biomass 4.3 3.1 200
Geothermal 6.4 0.7 n/a
Coal 7.7 0.1 regional
Natural gas 1.5 0.05 50
Multiplier for CHP
n.d. 1.3 n/a
Source: Data from European Renewable Energy Council (2010).
Small-scale RE technologies tend to be labor intensive in the manufacturing and installation phases. Large-scale electricity technologies with high upfront investments are capital intensive, whether renewable or conventional. An important issue that arises is the timing and duration of job positions; there is a key distinction between the construction and installation phases, which require temporary workers, whereas the job length of workers assigned for the long-term operation, maintenance and fuel processing depends on the durability of the relevant plant. Over time, as economies of scale increase and RE technologies mature, increasing capacity factors through technological advances, the amount of jobs relative to installed capacity will decrease.
3.4 Economic Simulations
3.4.1 Available Financing
The interviewed companies were asked if they receive any support or subsidy from any government body, international organization or NGO in general. Half of the interviewed manufacturers confirmed that they receive such support, usually in the form of a preferential loan due to their RES manufacturing activity. These are Kafalat loans with interest rates ranging from 1.5%–4%. A producer mentioned
that theoretically, the Kafalat loan is a 0% interest rate loan, but in practice, this is not the case. One manufacturer received a green loan with a 0.6% interest rate over a 10-year period under the NEEREA program. Two manufacturers also indicated that they benefit indirectly from the financial facilities that are given to their clients. One manufacturing company is working on a project that consists of producing solar PV panels operating on a grid-connected system that will be partially or totally funded through the NEEREA mechanism.
Financial banking is more elusive for importers. Only 3 of the 36 that were interviewed confirmed that they benefit from support. One of these received technical support and consultancy services from CEDRO and technical support from LCEC. Another was granted materials worth USD 40,000 from the Environmental Fund for Lebanon of the German Society for International Cooperation in 2010 for a PV installation project in his workshop. The third trader received unspecified capital financing under NEEREA. Although there is generally no support available for RES importers, some recognized that their clients, who are RES end-users, do receive financial support through the loans subsidized by the Central Bank.
3.4.2 Current Economic Contribution
The company interviews showed that approximately 130 local firms are active in RES, approximately 17 of which manufacture and the remainder of which import, assemble, and install the systems. The total size of the RES market (see Table 3.2) is estimated using the average annual turnover and the average RES-derived turnover. The estimated gross domestic product (GDP) in 2013 was USD 4,359,000,000, of which the RES market constituted less than a quarter percent. Importer turnover accounts for 80% of the RES market with the remaining 20% contributed by manufacturers.
Table 3.2: Current RES Importing and Manufacturing Contribution to GDP
No. of companies
Avg annual
turnover
(USD ’000)
Avg RES art of
turnover (%)
RES market
(USD ’000)
Share of total
RES market
(%)
Share of GDP
(%)
Importers 113 1,141 58 74,781 80 0.17
Manufacturers 17 1,508 74 18,971 20 0.04
Total 130 n/a n/a 93,752 100 0.22
n/a = not applicable
The total RES workforce was estimated using the average number of RES employees (See Table 3.3). The total number of employees aged 15 years and above is approximately 1,118,000, as per the 2007 figures of the Central Administration for Statistics. The fraction of the national labor force that works in RES is similar to the percentage of the RES market in total GDP.
Table 3.3: Current RES Importing and Manufacturing Contribution to the Labor Market
No. of companies
Avg No.
Estimated RES labor
force
Share of
total RES
labor force (%)
Share of total national labor
force (%)
Importers 113 17 1,921 86 0.17
Manufacturers 17 18 306 14 0.03
Total 130 n/a 2,227 100 0.20

37
3.4.3 Scenarios and Assumptions
MOEW is working on three scenarios: the optimistic, the realistic, and the pessimistic. Scenarios include three different blends of RE, depending on the political, financial, and energy supply situations of the Lebanese network. Each scenario will contain 12% RE, but overall generation capacity will vary.
The projections to 2020 and 2030 are made using the current generation capacity, company turnover, and RES workforce (See Table 3.4). The hydropower generation capacity is not considered in the calculation of market turnover per MW and labor per MW ratios since the great majority of hydro systems was installed in the 1930s, 1950s, and 1960s, and current importation and manufacturing activity concerns mainly SWH and PV.
Table 3.4: Current RES Generation Capacity, Market, and Labor
RES Generation capacity (MW)
Generation capacity
(% of total)RES Market (USD
’000)
RES Market/MW
(USD ’000/MW)
Person years/
MWRES Labor
Force Labor/ MW
Hydropower 274.0 n.d. n.d. n.d. n.d. n.d. n.d.
SWH 29.2 91 n.d. n.d. 10.0 1,657 56.8
PV 2.4 8 n.d. n.d. 38.4 531 218.2
Wind power 0.5 1 n.d. n.d. 15.0 39 85.2
Total 32.1 100 93,752 2,925 n.d. 2,227 69.5
Sources: Data for hydropower from Khoury (2012). Data for other RES from LCEC. Data for RES employment factors including person years/MW for construction, manufacturing, and installation from European Renewable Energy Council(2010).
The different RES show large variations in employment numbers, with PV ranking on top of the job creation list and bioenergy ranking last. To accurately estimate the number of workers in each RES, the total workforce employed across all RES branches is weighted by the individual RES employment factors (as estimated by Greenpeace), as well as the share of each RES in the total installed generation capacity.
Apart from economic growth through corporate productivity and job creation, an increase in RE sources provides a hedge against conventional fuel price fluctuations and increases the security of power supply. It also reduces CO2 emissions and the associated pollution and health costs. These factors, which make RE more valuable, are not included in the economic simulation.
Historical evolutions of different technologies show that learning curves result in decreased production costs overtime if output is doubled. In addition, as more RES are produced locally and manufacturing moves up the value chain, more value is added in production. Since RES adoption is still at the initial stage in Lebanon, it is too soon to include the learning effect and its impact on moving up the supply value chain in the projections for 2020 and 2030.
12% RE by 2020
Based on data provided by the 2010 PPES, the demand for electricity was approximately 2,400 MW, while the actual supply was approximately 1,500 MW. An engineering assumption states that the increase in demand—and consequently in supply—is approximately 6%/y. Accordingly, the total electricity production capacity by 2020 should be 6,700 MW, as shown in Table 3.5. To reach 12% of this target, RE production should provide a total capacity of 804 MW, if we assume that 12% is for capacity share and not power. This would correspond to the realist scenario, while the pessimist scenario would be 20% below that figure and the optimist scenario 20% above it.
Table 3.5: Power Generation Capacity in 2020 (MW)
Scenario Pessimistic Realistic Optimistic
Generation capacity 5,360 6,700 8,040
12% RE 643 804 965
Source: Data from Khoury (2012).
A review of the different RE technologies as of May 2012 showed that the total production capacity in RE could add up to 1,270 MW by 2020, which is approximately 19% of the entire expected production capacity, higher than the set target of 12% (Table 3.6). The share of each RE in reaching that total capacity is used to determine the capacity necessary to arrive at the 12% goal. The generation capacity that needs to be added to the current base is the highest for wind and the lowest for hydropower, where considerable capacity is already installed.

38
Table 3.6: RE Generation Capacity Targets and Simulation for 2020
RES Potential generation capacity
(MW) % of total
Generation capacity to achieve 12% RE mix (MW)
Generation capacity to be added to current base (MW)
Pessimistic scenario
Realistic scenario Optimistic scenario
Pessimistic scenario
Realistic scenario Optimistic scenario
SWH 120 9 61 76 91 32 47 62
PV 150 12 76 95 114 74 93 112
Wind power 400 31 203 253 304 202 253 303
Hydropower 400 31 203 253 304 0 0 30
Bioenergy 200 16 101 127 152 101 127 152
Total 1,270 100 643 804 965 409 519 659
Source: Data from Khoury (2012).
To estimate the size of the RES import and manufacturing market in 2020, the generation capacity that needs to be added in each scenario is multiplied by the current market size per installed MW (Table 3. 7). In the realistic scenario, the market size in terms of company turnover would be approximately USD 1.5 billion, approximately 16 times the current size of the market.
Table 3.7: 2020 Simulation of RES Importing and Manufacturing Contribution to the Economy
Scenario Pessimistic Realistic Optimistic
Generation capacity to be added to current base (MW) 409 519 659
Current RES market per MW (USD ’000/MW) 2,925
Projected RES market (USD ’000) 1,195,009 1,517,200 1,926,768
The ratio of the number of local workers required to manufacture and install 1 MW generation capacity is estimated for each RE by weighing the current local labor per MW ratio using the Greenpeace employment factor ratios. As shown in Table 3.8, most of the workforce will be required for wind, because of the low current installed capacity, and PV, due to high number of jobs needed per MW installed. In a realistic scenario, over 45,000 new workers would be needed in 2020, approximately 20 times the current RES workforce.
Table 3.8: 2020 Simulation of Employment in RES Importing and Manufacturing
RESRES employment factors
Generation capacity to be added to current base (MW)
Labor required
Person years/MW
Labor/ MWPessimistic
scenarioRealistic scenario
Optimistic scenario
Pessimistic scenario
Realistic scenario
Optimistic scenario
SWH 10.0 56.8 32 47 62 1,796 2,660 3,523
PV 38.4 218.2 74 93 112 16,044 20,187 24,331
Wind power 15.0 85.2 202 253 303 17,226 21,543 25,859
Hydropower 11.3 64.2 0 0 30 0 0 1,918
Bioenergy 4.3 24.4 101 127 152 2,475 3,093 3,712
Total 409 519 659 37,541 47,483 59,343
Existing RES labor force 2,227
Total additional labor required 35,314 45,256 57,116
Source: Data for RES employment factors (person years/MW for construction, manufacturing, and installation) from European Renewable Energy Council (2010).
Using an existing labor pool of 1,800 alumni from local universities with basic RES knowledge, and adding approximately 350 graduates each year, a total of 4,250 graduates should be available by 2020 (Table 3.9). The number of yearly graduates might grow more quickly since universities are adding RES courses and specializations. However, this growth might be more than offset by the brain drain phenomenon, which sets in immediately following graduation. Under any scenario, whether pessimistic, realistic, or optimistic, the number of graduates required in 2020 to fill the professional staff positions at manufacturers and importers will be insufficient.

39
Table 3.9: RES Graduates Required and Available in 2020
Share of total current RES labor (%)
Percentage of professional staff
RES graduates required
Pessimistic scenario
Realistic scenario Optimistic scenario
Importers 86 13 4,210 5,325 6,655
Manufacturers 14 9 464 587 734
Total 100 4,674 5,912 7,388
Pool of RES graduates in 2020 4,250
Shortfall in RES graduates 424 1,662 3,138
20% RE by 2030
Keeping the assumption that yearly growth in electricity demand and corresponding supply is 6%, the capacity of RE generation would have to be approximately 2,400 MW by 2030 under a realistic scenario (Table 3.10).
Table 3.10: Power Generation Capacity in 2030 (MW)
Scenario Pessimistic Realistic Optimistic
Generation capacity 9,600 12,000 14,400
20% RE 1,920 2,400 2,880
Source: “12 percent renewable energy by 2020: mission possible,” in The Daily Star, Pierre El Khoury, LCEC Director, May 28, 2012
The share of each RE in the total production capacity that is used to determine the capacity necessary to reach the 20% goal is the same as the ones used for the 2020 projection. The generation capacity that needs to be added to the current base, as shown in Table 3.11, is again the highest for wind, but in the 2030 estimates, SWH ranks lowest
Table 3.11: RE Generation Capacity Simulation for 2030
RES % of total
Generation capacity to achieve 20% RE mix (MW) Generation capacity to be added to current base (MW)
Pessimistic scenario
Realistic scenario
Optimistic scenario
Pessimistic scenario Realistic scenario Optimistic scenario
SWH 9 181 227 272 152 198 243
PV 12 227 283 340 224 281 338
Wind power 31 605 756 907 604 755 907
Hydropower 31 605 756 907 331 482 633
Bioenergy 16 302 378 454 302 378 454
Total 100 1,920 2,400 2,880 1,614 2,094 2,574
To estimate the size of the RES import and manufacturing market in 2030, the generation capacity that needs to be added for each scenario is multiplied by the current market size per installed MW (Table 3. 12). In the realistic scenario, the market size in terms of company turnover would be over USD 6 billion, 65 times the size of the current market.
Table 3.12: 2030 Simulation of RES Importing and Manufacturing Contribution to the Economy
Scenario Pessimistic Realistic Optimistic
Generation capacity to be added to current base (MW)
1,614 2,094 2,574
Current RES market per MW (USD ’000/MW) 2,925
Projected RES market (USD ’000) 4,720,632 6,124,583 7,528,534
By 2030, a developing RES market could generate employment opportunities in RE, ranging from highly skilled positions in R&D to technical jobs in manufacturing and assembly. The ratio of the number of local workers required to manufacture and install 1 MW generation capacity that is used to project the number of workers required is the same as for 2020.
As shown in Table 3.13, most of the workforce will be required for wind and PV, followed by hydropower. In a realistic scenario, in 2020 close to 175,000 new workers would be needed, almost 80 times the current RES workforce.

40
Table 3.13: 2030 Simulation of Employment in RES Importing and Manufacturing
RESRES employment factors
Generation capacity to be added to current base (MW) Additional labor required
Person y./MW
Labor/ MW
Pessimistic scenario
Realistic scenario
Optimistic scenario
Pessimistic scenario
Realistic scenario
Optimistic scenario
SWH 10.0 56.8 152 198 243 8,651 11,228 13,805
PV 38.4 218.2 224 281 338 48,946 61,315 73,684
Wind power 15.0 85.2 604 755 907 51,499 64,384 77,269
Hydropower 11.3 64.2 331 482 633 21,234 30,940 40,647
Bioenergy 4.3 24.4 302 378 454 7,387 9,234 11,081
Total 1,614 2,094 2,574 137,717 177,101 216,485
Existing RES labor force 2,227
Additional labor required 135,490 174,874 214,258
A total of 7,750 graduates should be available by 2030, but that number will be insufficient under any scenario, resulting in an important shortfall of qualified personnel (Table 3.14). In the realistic scenario, the required amount of professionals is nearly three times the number of available graduates.
Table 3.14: RES Graduates Required and Available in 2030
Share of total current RES labor (%)
Percentage of professional staff
RES graduates required
Pessimistic scenario
Realistic scenario
Optimistic scenario
Importers 86 13 15,443 19,860 24,276
Manufacturers 14 9 1,703 2,190 2,677
Total 100 17,146 22,050 26,953
Pool of RES graduates in 2030 7,750
Shortfall in RES graduates 9,396 14,300 19,203
4. Recommendations
4.1 Summary of Recommended Measures
In Lebanon, as elsewhere, policy remains the single most important driver for RE investments. The measures recommended by participating RES stakeholders, companies, and universities to encourage the development of the domestic RES sector are mostly policy-focused, geared toward building on Lebanon’s strengths and capitalizing on RE opportunities, while improving weak spots and mitigating threats (Table 4. 1).
Table 4.1: Recommended Measures to Develop RES Import and Manufacture
Type of measure Measure Actors Beneficiaries
Educational
Increase interaction among universities and industry
ALI, RES manufacturers, universities RES manufacturers, Universities
Introduction to RES in vocational and technical schools
Ministry of Education Students, RES importers and manufacturers
Promoting public awareness LCEC, Ministry of Education, MOEW, General public, all RE stakeholders
Financial
Lower customs on RES and components GOL All RE stakeholders, end users
Fiscal incentives GOL, MOI RES manufacturers
Gradual adjustment of the price of electricity EDL, GOL, MOEW EDL, all RE stakeholders
Adoption of a feed-in tariff EDL, GOL, MOEW EDL, all RE stakeholders
Legal
Regulation of RES import market IRI, LCEC, MOEW, MOI All RE stakeholders, end users
Certification of local RES producers IRI, LCEC, MOEW RES manufacturers
Reform buildings code to make the integration of RES mandatory
Urban Planning Authority, Order of Engineers & Architects
RES importers and manufacturers, building sector, end users
Update Law 462 or introduce a new RE law GOL, MOEW, Parliament All RE stakeholders
All RE stakeholders = RES importers and manufacturers and private RE producers

41
Support should initially focus on enhancing the manufacturing of low-tech components and basic services for which the market barriers are relatively low and no large investments are required. These include mounting structures, civil works, and assembly of a PV or wind plant.
The operating companies are primarily involved in residential and commercial sales and installations, manufacturing of RES or RES components. Other companies work on utility-scale RE projects, such as wind and PV farms, MSW incineration or landfill and WWTP biogas through anaerobic digestion.
As long as the main RES components are imported, growing RES adoption will have a low impact on local manufacturing. Only experience in construction and project organization will increase. In this case, an adaptation of international production standards and techniques to existing industries should be targeted to achieve a supply of quality components produced locally (mounting structures, piping, cables, electronic equipment), and a wide range of related services.
An increase in market demand would stimulate local production, hence increasing its share up to 70% of the project’s total value, mainly in SWH. In the advanced scenario, policy actions should strongly support innovations and the development of intellectual property rights in the field of RES components to allow investors to profit from first mover advantages and to develop technologies specifically tailored for Mediterranean conditions. The proximity to other emerging markets should provide further motivation toward strong exportation strategies. Thus, a favorable environment for the production of a wide range of RES components is achievable.
4.2 Financial Measures
The recommended financial measures to encourage RES market growth include reducing the customs charges on RES and their components, introducing tax incentives for the RES industry, adjusting electricity prices, and adopting a FIT support program.
4.2.1 Customs
Reduced customs on imported RES and their components would benefit end users and all RE stakeholders, which include RES importers and manufacturers as well as private RE producers. To the extent allowed by WTO rules, customs duties are adjustable to favor the import of RES components over the import of entire RES to create a favorable market for firms aiming to manufacture or assemble RES domestically. Manufacturers also asked for lower custom fees on the raw materials they use as inputs in RES production. Speeding up the customs process would also be beneficial, especially to trading companies who import RE systems or components. Some of them cited customs and clearance issues as an obstacle to their operations.
Fiscal incentives
RES manufacturers indicated that the government should offer them more financial incentives as they are usually obliged to invest a part of their capital to purchase industrial land for building their factories, leading to higher production and leasing costs and lower net benefits.
There are several fiscal incentive options. They include tax exemptions on property such as land or manufacturing plants used for RES production. They could also entail production tax credits, which provide the investor with an annual income tax credit based on the amount of money invested or the annual amount of electricity generated. Such measures would allow for the partial or full deduction of RE investments from tax obligations.
Another way to provide incentives to the local RES industry is through corporate tax
deductions applicable to the purchase or production of RES, or a reduction of the VAT or sales tax on RES. Such measures, (a type of ‘green’ credit), in addition to the already successful NEEREA, could further boost local RES demand. Tax reductions could also increase the international competitiveness of domestic RES products. Moreover, GOL could provide export credit assistance in the form of low-interest loans to complement the current Kafalat program.
4.2.2 Electricity Rates
To bridge the gap between the LEC and the subsidized cost of electricity, reassessment of the existing tariffs is necessary. The price of electricity has to reflect its real production cost. This adjustment has to be gradual to avoid public opposition, and should correlate with improved performance in power delivery to reduce generation costs. Additionally, as an immediate action, corporate interviewees mentioned the necessity for EDL to improve its bill collection rates to ensure that (1) the deficit is covered, and (2) all residents are paying their dues, possibly motivating them to switch to RES.
Several countries have implemented programs that allow electricity consumers to purchase green electricity at a premium cost to support the higher cost of renewable power and encourage investments in new RE projects. This might be a possibility at a later stage.
4.2.3 FIT
Beyond soft policies such as net metering, stronger and more successful policies such as FITs need to be introduced. These consist of financial transfers for every kWh generated or exported by the RE system to the grid. FITs are the most widely used policy in the world for accelerating RE deployment, accounting for a greater share of RE development than either tax incentives or renewable portfolio standard policies.
The FIT system sets a price that is guaranteed over a certain period of time at which power producers can sell renewable electricity into the grid. These purchase agreements are structured with contracts typically ranging from 10 to 25 years. The level of the feed‐in subsidy should be set against the levelized cost of the RE technology, including a degression rate and annual reviews. Because RE generation is not affected by fluctuations in fuel prices, a FIT has the potential to improve the financial attractiveness of a RE investment compared to a conventional-fuel-based alternative.
The arguments in favor of a FIT system include the ability to offer a secure and stable market for investors with lower transaction costs. The guaranteed contract terms enable project developers to finance a larger proportion of the project with debt financing, as opposed to equity, which reduces the cost of capital. Costs and development benefits are distributed equitably across geographic areas. Additionally, FITs encourage technologies at early to late stages of maturity and, as such, can stimulate the growth of local industry and job creation.
According to ALI, a FIT rate with a 10-year guarantee to buy electricity is necessary to have a breakthrough in RE system adoption. However, according to an MOEW consultant, the implementation of a FIT and the adjustment of electricity prices are only possible when uninterrupted power supply is assured.
The government could directly solicit long-term power purchase agreements with RE power developers, reducing some of the uncertainties in investing in RE projects in an unstable policy environment. Public-private partnerships for the production of RE are worth encouraging.
4.3 Legal Measures
Recommended legal measures to strengthen the local RES industry include the

42
regulation of RES import market, certification of local RES producers, reform of the buildings code to make the integration of RES mandatory, implementing Law 462.
4.3.1 Regulation of RES imports
Importers assert large disparities in the quality and prices of the RES products that are entering the market. They believe that the market needs to be more regulated. The GOL should intervene to protect licensed importers from non-qualified importers who bring low-quality products, thus completely hindering the competition process. This will also help make the products of local manufacturers more competitive.
Certification of local RES products
A national certification and testing program that meets international standards can promote the quality and credibility of an emerging company’s RES by building consumer confidence in an otherwise unfamiliar product.
Some local manufacturers indicated that they would welcome certification of their products. This will be achieved through Lebanon’s participation in the regional SHAMSI scheme for the unification of standards for solar thermal products and services.
4.3.2 Building Code Reform
The current challenge is in updating the building code to include mandatory SWH installations. There is a discussion over making thermal standards mandatory for all buildings across the country, because they constitute over a third of the rating system. This would be in line with developments in other countries with a similar climate. It would be especially important for the use of geothermal heating and cooling systems.
The next step would be local content requirements. Policies that mandate the use of locally manufactured technology – often by requiring a minimum percentage of local content for RES installed in some or all projects within a country – force companies interested in selling to a domestic market to look for ways to shift their manufacturing base to that country or to outsource components used in their RES to domestic companies. Local content and manufacturing can also be encouraged without being mandated through the use of incentives that award developers selecting locally-made RES with low-interest loans for project financing, or provide RES companies that relocate their manufacturing facilities locally with preferential tax incentives.
4.3.3 RE law
The electricity law does not allow direct private sector involvement in energy production, although it does not prohibit leasing power generated by private firms.
The establishment of the regulatory authority planned under Law 426 should be accelerated to allow for granting electricity generation licenses to IPP. The Oil and Gas Committee put in place for the regulation of the hydrocarbon sector, shows that this is possible.
At a higher policy level, the introduction of mandatory RE targets should be considered. This type of indirect policy requires that a fixed percentage of electricity in a given portfolio be generated by RE and be custom-tailored to specific domestic markets depending on market structure and local resource availability.
4.4 Educational Measures
The recommended educational measures include increasing the interaction
between universities and industry, introducing RES in technical schools curricula, and promoting public awareness.
4.4.1 Interaction between universities and industry
The RE courses and specializations offered at local universities do not fully cover the expected requirements of domestic importers and manufacturers in 2020 in terms of graduates to be hired as professionals. By 2030, the gap will have widened further, so a stronger expansion of RES courses and programs will be necessary in the medium term (2 – 5 years). In the immediate future, universities should consider a drive to make the existing courses offered more attractive or even make RES courses mandatory for the various engineering programs.
A fundamental problem in the local labor market is the emigration of promising graduates to better paying countries, often resulting in a lack of expertise within local companies. Strengthening cooperation among local universities and industry might help to alleviate this issue. Internship programs, corporate-sponsored or corporate-guided theses, and joint research or applied engineering projects might put students in closer proximity to their potential employers. Today, academia works more closely with government or multilateral agencies than with the local industrial sector.
RES manufacturers have much to gain from a closer collaboration with universities to develop certified products that can compete internationally. Sustained public RES research support can be crucial to the success of a domestic RES industry, particularly when R&D among private RES firms and public institutions is efficiently coordinated.
4.4.2 Public Awareness
Importers and manufacturers recommend that the government promote public awareness regarding RES, especially among young people, as this would strengthen the entire RE market. Customer education measures would also result in more informed buying decisions on the customer-end, and will force RES industries to provide the best RES products and services possible, benefitting the industry as a whole, on the national and regional scale.
Therefore, a strengths, weaknesses, opportunities, and threats (SWOT) analysis for the RES sector, is summarized in Table 4.2. The SWOT analysis shows that one of Lebanon’s strengths is the high level of education of the domestic workforce. Local universities include RES in their curricula and plan to expand their course offerings in this area. However, secondary and technical schools lag behind in RES training, resulting in a shortage of skills at the technician and worker level. In addition, brain drain is preventing local industrialists from hiring the best professionals and skilled workers (see sections 2.8 and 2.9).
According to ALI, Lebanon has the potential to become a solar technology hub because of the growth in the electromechanical sector, in addition to the electric, steel, aluminum, and plastics industries, which constitute the various parts of the solar components. The existing industrial base is already using semi-automated manufacturing processes to produce RES components or entire systems and is poised to expand its production. That is why SWH and solar PV systems are at the top of the list of priorities, and their value chains are detailed in Annex G.
A liberal economy and favorable foreign direct investment policies should also be advantageous for expanding RES manufacturing capabilities. The RES financing scheme and subsidy for end-users as well as the government’s engagement in pilot projects and commitment to a RE target have sent the right signals to the market. However, additional policies need to be adapted to kick-start the RES sector.

43
Table 4.2: Country SWOT-analysis for the RES Sector
Strengths Weaknesses
Liberal economy Small size of the domestic market
Favorable foreign direct investment policies
Lack of incentive scheme, such as a FIT
Skilled workforce Limited industrial capabilities
Research capabilities at local universities
Political and security risks deter investment
Lack of regulatory framework
Existing electronic, electric, steel, aluminum, and plastic industries
Opportunities Threats
Government target for 12% RE by 2020 (expected targets are set to be put beyond 2020)
Lack of clarity on the government’s purchase price of electricity produced by RES
SWH market has taken off Lack of reform in the electricity sector
PV pilot project Beirut Solar Snake underway (and other such projects may take off)
Government paralysis due to political instability
Wind farm tender underway (although not managed by regulatory body)
Competition from foreign suppliers
Hydropower refurbishment and construction of new dams underway
Solid waste sector reform higher on the agenda
New national wastewater strategy
5. Conclusion
Lebanon has shown commitment for RE through the announcement of the 12% RE mix by 2020 goal, the development of its net metering policy, and announcing bids (request for proposals) for the first wind farm and solar farm projects. However, the current power sector structure blocks investments in RES. Subsidies for conventional power sources act as an automatic brake on the private sector’s development of RE sources. Because the independent regulatory authority required to be created under law 462 does not yet exist, power generation licenses for private developers cannot be issued. This stands as a main obstacle to the development of private RE production. It also slows down the development of a domestic RES industry, as public demand is insufficient to reach the critical mass warranting local production of RES.
The RES that are the most suitable for the local market are SWH, solar PV systems, and small-scale bioenergy. They present the most immediate opportunities because: (1) they can be implemented in the local climatic conditions at a low cost, (2) there is consumer interest in adopting them, and (3) there is supplier interest in producing or importing them. In the future, small- large-scale wind systems, large-scale bioenergy, and large hydro also show good prospects. However, they require
more government involvement due to their utility scale and lower private demand.
The demonstration installations in public buildings financed by CEDRO have been, and continue to be, important in promoting and expanding the small decentralized RE market in Lebanon. Along with the promotion of the adoption of RES in the private sector, it will contribute to the market expansion towards a size that, among other beneficial outcomes, will encourage entrepreneurs to enter the RE business and thereby facilitate the required supply chain development to serve both the public and private sectors.
Greater manufacturing activity will benefit the economy as a whole. Although manufacturing accounts for less than 10% of the national GDP, the industrial sector has been able to keep growing, despite the dire security situation, political turmoil, and economic downturn. It is more shock-resistant than other sectors and can therefore act as a buffer for the economy in times of strife.
The latest Energy [R]evolution report from Greenpeace anticipates that, given political support and well-designed policy instruments, 95% of the electricity produced in the Middle East by 2050 could come from RE sources, with new renewables—mainly wind, solar thermal energy, and PV—contributing approximately 90% of electricity generation. The installed capacity of RE technologies will grow from the current 10 GW to 556 GW in 2050. By then, renewables could meet 83% of the region’s demand for heating and cooling.

44
Annex A System Composition, Components, and Value Chains
Value Chain of a Solar Water Heater System
General
SWH systems use solar energy to heat water. Most SWH systems have two main parts: a solar collector and a storage tank. The collector is mounted on the roof and is used to capture the heat from the sun and transfer that heat to the storage tank, which holds the hot water. The tank can simply be a modified ordinary water heater tank, but it is usually larger and very well insulated. Systems that use fluids other than water (such as propylene glycol or ethylene glycol) usually heat the water by passing it through a coil of tubing in the tank, which is full of hot fluid.
There are several types of SWH systems for individual use: direct (open loop) or indirect (closed-loop) systems; passive or active systems (using Thermosiphon systems or circulation pumps respectively); and flat type collector or evacuated tube collector. SWH systems are available in any combination of these variations and are used to provide water-based heating solutions to residential, commercial, and industrial customers.
Value Chain
The value chain of the most common types of SWH systems comprises the components that are particular to SWH systems and not components, such as storage tanks, used by other industries.
• A value chain for a solar hot water system has to encompass the following:
• Manufacture of system components
• System assembly and integration
• Whole sale distribution
• Sales and installation
• After sale service and maintenance
A Value Chain Diagram is shown in Figure A-1
Figure A-1: SWH value chain

45
Market Dynamics and Key Actors in the Supply Chain
As with other industries, suppliers in the SWH market are chosen based on existing partnerships and established relationships. Installers and system integrators tend to work with a limited number of previously tested suppliers with whom they have established relations. Systems in the SWH industry are not standardized and system components are not easily interchangeable between the different models and brands. This lack of SWH market standardization has led to a fragmentation in the supply chain. Purchasing decisions are usually made based on existing relationships with manufacturer’s representatives.
System cost reduction is an important factor in pushing the SWH supply chain forward and may be attributed to various factors such as:
• Preassembled systems that reduce installation costs.
• Larger systems that benefit from economies of scale.
• Higher production volume of some components that brings down respective unit costs. Since many SWH system components are shared with the general water heating and plumbing industry, increasing the production volume of these components by the SWH market demand is likely to minimally impact the manufacturing cost.
Residential Applications
In residential applications, most SWH systems are passive. Residential SWH use one of the two main solar collector types—flat plate and evacuated tube (see Figure A-2). Flat-plate collectors may be either glazed or unglazed. Glazed products have a dark absorber plate under a glass or plastic cover. Unglazed collectors also have a dark absorber plate, but lack an enclosure or cover. Evacuated-tube solar collectors use parallel rows of transparent glass tubes with vacuum inside, to minimize heat losses.
Flat-plate collector
A flat-plate collector contains a dark absorber inside an insulated, weatherproofed box, under a transparent or translucent cover. The cover, or glazing, is used to minimize the amount of heat escaping, while still allowing sufficient sunlight to pass through and reach the absorber. This is the most prevalent type of solar thermal collector for water heating systems for domestic use.
Evacuated-tube collector
An evacuated-tube collector is made up of rows of parallel, transparent glass tubes. There are many different configurations used in evacuated-tube design, but generally each tube consists of a glass outer tube with an absorber inside of the tube. Some models have a second, inner glass tube. A vacuum within, or between, the tubes inhibits heat loss, making this type of solar thermal collector less restricted by ambient temperatures.
Figure A-2: Primary solar collector types
Types of SWH
There are two fundamental types of SWH systems: Thermosiphon (passive) and Pump Circulated (active). Both types of SWHs mount on roofs or walls and consist of a storage tank and a solar collector. Solar storage tanks must be well insulated to retain heat. Cold water inlets channel the water towards the heat collector, allowing its heating by the solar energy. Hot water is then channeled to the tank, ready for collection via the connected outlet.
In an active SWH system, the storage tank is mounted below the level of the collector and a circulating pump moves water or the heat transfer fluid (HTF) between the tank and the collectors. In a passive SWH system, the storage tank is horizontally mounted immediately above the solar collectors on the roof and water dynamics are governed by the thermosiphon principle—when water warms up, it becomes less dense and naturally rises to a container while colder water sinks down towards the bottom (See Figure A-3).

46
Figure A-3: Thermosiphon Principle (left) and Pump circulated system (right)
Anatomy of a SWH Evacuated Tube Collector
The evacuated tubes used in a SWH collector typically have a double wall and the area between the inner and outer layers of the wall are evacuated (a vacuum). This acts like a thermos to keep heat from escaping into the atmosphere.
The evacuated tubes are glass tubes manufactured from strengthened borosilicate glass. The tubes have a double outer layer. The outermost layer is fully transparent to allow solar energy to pass through entirely without any obstructions. The inner layer is treated with a selective optical coating which drives energy absorption without reflection. The inner and outer layers are fused at high temperatures at the end, leaving an empty space between the inner and outer layers. All air is pumped out of the space between the inner and outer layers causing the thermos effect that stops conductive and convective transfer of heat. Heat loss is further reduced by the low emissivity nature of the type of glass used; the anatomy is shown in figure A-4 below.
Figure A-4: SWH Evacuated Tube Collector
Anatomy of a Flat-Plate SWH CollectorThe table here after provides a description of the various components that constitute a flat plate solar water heater.
Table A-1: flat plate SWH collector components
Glazing Low-iron tempered glass, exclusively using tempered glass with a total solar energy transmission of 90%
Collector frame Extruded aluminum frame and battens with electrostatic bronze plate finish
InsulationPolyisocyanurate foam board insulation foil-faced, glass fiber- reinforced, rigid board sheathing: 1–1/4” in (3.25 cm) the, bed / ¾” in (2 cm) the sidewalls
Mounting hardwareTested to wind load conditions of 315 km/h, mounting possibilities include: Pitched roof, flat roof, ground, balcony, and facade mounting
Gasket grommetsUV durable EPDM (Ethylene Propylene Diene Monomer), U-channel gasket with molded corners to prohibit water penetration, extruded silicone grommet with 1-1/8” bore
Corner bracket Architectural aluminum angles inside with aircraft-grade pin grip rivets
FastenersAluminum rivets secure the back-sheet, batten screws shall be 18-8 SS, 10-24 x 3/8” (1cm), hex head screws, and black oxide coated
Back sheet Type 3105-H14, 0.5 mm stucco embossed aluminum sheet (bronze) pop-riveted to aluminum frame

47
For flat plate solar water heaters, the absorber plate is of 100% absorptivity with a coating with very high absorptivity level and low emissivity level in order to capture the highest fraction of sun radiation and hence heat the water; a cross section is shown here after for better visualization. Figure A- 5 shows a cross-section of a flat-plate type collector and its components.
LOW IRON GLASS90% ABSORPTION
LASER WELDED ABSORBER PLATE
SURFACE ABSORBERCOATING
COMPRESSION GLASSSUPPORT AND GASKET
ALUMINUM FRAME
THERMAL FOAMINSULATION
BACKSHEET
Figure A-5: A Flat Plate Type Collector—Cross Section
Manufacturing and Component Values
SWH systems share many components with conventional water heating systems. Therefore, when evaluating the potential value added by manufacturers who consider making SWH components, the ones that have the highest added value are those specific to SWH use. A list of components is listed in Table A-2
Table A-2: SWH Components
Component Details Value added
Assembly - pump stations •Requiresbrazing,plasticmoldingandassembly
•Pre-packagedsystemswillhelptolowertheinstallationcostofSWHsystemsHigh
Solar thermal collector Unique to the SWH industry High
Collector frame •Simpledesignandmanufacture
•MadebythecollectormanufacturerHigh
Collector mounts/racks •Simpledesignandmanufacture
•Somedesignsarecustom-madebylargeinstallersormadebythecollectormanufacturerHigh
Specialty SWH water storage tank
•Manufacturingrequiresvarioustoolssuchas,cylinderformingandweldingmachinewithadequateprecision and quality, hydraulic press for forming superior and inferior caps, automated cutting and final formation procedure of the caps
•Currentlymadeforthegeneralhotwatermarket,someSWHapplicationsmayrequiredualheatexchangers
•AdvanceddesignsusedintheEUmarketmayenterthelocalmarket
Medium
Expansion tankCurrently made on a large scale for the general hot water industry, however bladders need to be made more durable for the SWH industry
Medium
Drain back tank Made for the solar water heating market Medium
Pump motor flanges •Simpledesignandmanufacturing
•CurrentlymadeforthegeneralhotwaterindustryLow
Hydronic valves Currently made on a large scale for the general hot water industry Low
Air elimination valve Currently made on a large scale for the general hot water industry Low
Piping Currently made on a large scale for the general plumbing industry Low
Pipe fittings Currently made on a large scale for the general plumbing industry Low
Temperature gauges Currently made on a large scale for the general hot water industry Low
Pressure gauges Currently made on a large scale for the general hot water industry Low
Insulation Currently made on a large scale for the general hot water industry Low
Separators Currently made on a large scale for the general hot water industry Low
Thermal mixing valves Currently made on a large scale for the general hot water industry Low
Source: Data from Navigant Consulting, Solar Water Heating Supply Chain Market Analysis.

48
Systems Integrators
The key players in the solar thermal industry are small- and medium-sized enterprises, including manufacturing workshops.
Many of the SWH companies are integrated companies or involved in other activities. For instance, solar thermal industry actors are usually companies that perform more than one activity in the SWH value chain. Services may include activities such as project feasibility studies, design, planning, detailed project implementation, commissioning, providing customized solutions to customers with specific demands (banks, institutions, telecom, etc.), installation, distribution, and maintenance.
Worldwide Perspective
Rural areas in some countries have no access to electricity or natural gas for water heating, so SWH systems are among the few options available for domestic hot water. In India, the total installed collector area of SWH was 5.8 million m2 as of March 2012. Measured against a baseline of 2.55 million m2 as of March 2009, it doubled in three years. In Morocco, the PROMASOL project has increased the installed capacity of SWH in commercial facilities from approximately 35,000 m2 of solar panels in 1998 to >240,000 m2 in 2008, and the number of companies importing and/or manufacturing SWH from approximately 5 to over 40. The program is projected to create approximately 13,000 new jobs by 2020 (fullflow solar and solar direct, 2014).
Value Chain of a Photovoltaic (PV) system
General
The energy radiated from the sun is approximately 1,000 W/m2 at sea level at the equator at noon. As long as the sun is shining, PV modules can continuously supply solar power. PV is a solid-state technology that converts solar radiation directly into electrical power without any pollutants. PV systems are made from silicon, similar to semiconductors. Through a process called doping, the silicon is separated into two distinct layers, called negative (n-type) and positive (p-type.) The n-type has an excess of electrons, and the p-type has vacancies or missing electrons. The two layers are separated by an n-p junction.
Light passes through the thin n-silicon layer and hits the p-silicon layer where it is absorbed. The light photons displace the electrons in the p layer. Some of these displaced electrons acquire sufficient energy to pass through the n-p junction to the n layer. A potential then develops between the two layers, creating the possibility of making a current flow by connecting wires and a load.
Value Chain
The major links in a value chain of a PV system, from the production of silicon from sand to the assembly of a complete electrical energy generating system, are shown in the block diagram in Figure A-6. A PV system has many parts including modules, mounts, inverter(s), and electrical components. The PV value chain tracks all distinct processes required to build and put to use a PV system.
Figure A- 6: Production chain of a PV system
Each part of a PV system requires energy to be produced. Manufacturing the PV modules requires over 90% of the energy used for the entire system.
The process involves transforming sand to raw silicon followed by a purification step. When an acceptable level of purity is reached, the silicon is transformed into ingots through a melting and casting process. During the wavering processes, the ingots are sawed into thin silicon wafers. These wafers are processed into solar cells, which are subsequently assembled, connected and laminated to form solar modules. Electrical components are integrated into the system, which is then ready for installation and electricity generation.

49
From Sand to Solar Panels: The Making of PV Modules
Silicon is an element abundantly available in nature in the form of sand. However, before silicon is cut into thin wafers, it has to be purified to improve its photo-effect properties. The purity levels of silicon needed to make solar cells are lower than those required for chip applications. Silicon for PV application is typically divided into three categories that make three types of PV panels: Monocrystalline PV cells, Polycrystalline PV cells, and thin-film PV cells.
Monocrystalline PV cells are usually manufactured from monocrystalline ingots that are made through a process known as the Czochralski (CZ) method (See Figure A-7). In this method, a “seed” silicon crystal is dipped into purified molten silicon and slowly raised out of the pot. Once raised, the molten silicon cools and solidifies into a single cylindrical crystal around and beneath the seed crystal. This process is referred to as ‘Pulling’ an ingot. Thin slices—approximately 200 microns (0.008”) thick—are cut from the ingot. An anti-reflection coating is then added along with a wire grid to collect the electrons. PV cells are formed. To create a module, several cells are laid out and joined together. Next, the module is given a protective backing in the form of a glass covering and finally framed with an aluminum profile.
FigureA- 7: The Czochralski Method
The process of melting polysilicon into ingots and subsequently cutting them into wafers is an intermediate step between polysilicon production and cell manufacturing. The process is more technically sensitive than most other in the SWH value chain and may be realized by specialized companies that are specialized. Furthermore, purifying and growing the monocrystalline Silicon consumes a considerable amount of energy making it less desirable than the Polycrystalline method. It would be accurate to assess that the higher cost of mono-crystalline silicon ingots has led to a more frequent use of multi-crystalline ingots as the starting material for solar cell production.
Polycrystalline PV cells are generally made using a casting process, where molten silicon is poured into a square mold and left to solidify. This process creates many crystals within an ingot. As with the single-crystal process, the ingot is sliced into thin square wafers to produce PV cells. Once the cells are created, the manufacturing procedure is the same as for monocrystalline modules. A multi-crystalline PV module can be identified by its varied, glittering crystal surface, compared to very uniform-looking single-crystal silicon cells.
Polycrystalline PV modules require less energy to produce than CZ-produced monocrystalline PV modules, partly because the cooling process for the cast ingot uses less energy. The energy payback times for multicrystalline PV systems are approximately 15% less than for monocrystalline PV systems. The production is also simpler and cheaper; however, the efficiency of solar cells made of this material tends to be lower than with mono-crystalline ingots.
The most common method for manufacturing multi-crystalline ingots is the silicon casting and the Bridgman method, named after Harvard physicist Percy Bridgman. It is used for growing single crystal ingots, but can be used for solidifying polycrystalline ingots as well. The method involves heating polycrystalline material above its melting point and slowly cooling it from one end of its container, where a seed crystal is located. A single crystal of the same crystallographic orientation as the seed material is grown on the seed and is progressively formed along the length of the container. The process can be carried out in a horizontal or vertical geometry. The Bridgman method is a popular way of producing certain semiconductor crystals such as gallium arsenide, for which the CZ Process is more difficult.
Thin-film PV modules use a deposition process, in which different layers of the PV cell are sprayed directly onto a substrate. Since there are no individual crystals to break, this substrate can be flexible and virtually any shape or size. The PV cells are completed after all the layers of the semiconductor material have been applied to the substrate by scribing the entire module into individual cells with lasers. Thin-film modules use a transparent conducting oxide (also applied as a layer in the deposition process) for electrical contacts, instead of an unbendable metal grid as crystalline cells.
Wafering
In the following production step, the ingot is cut into thin slices called “wafers” in a process called “wafering” (see Figure A-8). The resulting wafers constitute the raw material for the actual solar cell production. The multi-crystalline silicon ingot is cut by a wire saw into blocks that are then further cut into wafers. Between the individual process steps, the surface of the material is refined and cleaned several times.
For the mono-crystalline ingots, this block step is not required; they are instead directly cut into wafers. The processing of square instead of circular solar cells into solar modules increases the utilization of the available module area.
The resulting material following these cutting steps forms the silicon wafers that are characterized by thickness of 160-220μm. Ingot sawing into wafers is therefore associated with a high material loss of approximately 50%.

50
Figure A-8: The manufacturing of wafers
Production of Solar CellsPoly- and mono-crystalline wafers of different dimensions (125x125 mm or 156x156 mm, with a thickness of 160-220 μm) are the starting material for solar cell production. An overview of the different process steps is shown in Figure A-9 .
Figure A-9: Manufacturing solar cells
Prior to the first production step, the wafers are inspected for quality issues, and potential sawing defects are removed through etching in a wet bench. In the next step, phosphor is diffused into the silicon Phosphoryl Chloride (POCL), followed by the isolation of the edges in a subsequent wet bench process. An anti-reflex layer is then applied to maximize sun absorption. During the metallization step, electric contacts are printed on the solar cell (both front and back side), which goes through a final baking step in a specialized oven. Electrical power capacity and optical quality are finally measured to allow for accurate classification of the cells.
Assembly of Solar Cells into Modules
To ensure the availability of the appropriate voltages and outputs for different applications, single solar cells are interconnected to form larger units. Cells connected in series have a higher voltage, while ones connected in parallel produce more electric current. The interconnected solar cells are usually embedded in transparent Ethyl-Vinyl-Acetate, fitted with an aluminum or stainless steel frame and covered with transparent glass on the front side.
Electrical Components
To get the renewable power into a functioning format, a combination of electrical system components is added. These include cables/wires, fuses, batteries, controllers, inverters, switches, disconnecters, meters and others. Systems designed to deliver alternating current (ac), such as grid-connected applications, require an inverter to convert the direct current (dc) from the solar modules to ac. Grid-connected inverters must supply ac electricity in sinusoidal form -synchronized to the grid frequency - limit feed in voltage to that of the grid and disconnect from the grid if voltage is turned off. Islanding inverters are only required to produce regulated voltages and frequencies in a sinusoidal wave shape. A solar inverter may connect to a string of solar panels.
A list of the electrical system components for a PV system includes:
• Adhesives
• Batteries

51
• Cables
• Charge controllers
• Combiner boxes
• Connectors
• Disconnects
• Enclosures
• Grounding hardware
• Inverters
• Lightning and surge protection
• Monitoring devices
• Other essential system and associated components
• Over-current protection
• Stainless fastening hardware
For electrical safety reasons, circuit breakers are provided both on the ac and dc side to allow maintenance. AC output may be connected to the public grid through an electricity meter.
Mounting
PV modules are assembled into arrays on various types of mounting systems, which may be classified as ground mount, roof mount or pole mount. For solar parks, a large rack is mounted on the ground, and the modules mounted on the rack. For buildings, many different racks have been devised for pitched roofs. For flat roofs, racks, bins and building-integrated solutions are used. Solar panel racks mounted on top of poles can be stationary or moving, as detailed in the section on trackers below. Side-of-pole mounts are suitable for situations where a pole has something else mounted at its top, such as a light fixture or an antenna. Pole mounting raises what would otherwise be a ground-mounted array above weed shadows and livestock, and may satisfy electrical code requirements regarding inaccessibility of exposed wiring. Pole mounted panels are open to more cooling air on their underside, which increases performance. A multiplicity of pole top racks can be formed into a parking carport or other shade structure. A rack that does not follow the sun from left to right may allow vertical seasonal adjustment.
A solar tracker tilts a solar panel throughout the day to aim it at the sunlight (see Table A-3). Depending on the type of tracking system, the panel is either aimed directly at the sun or the brightest area of a partly clouded sky. Trackers greatly enhance early morning and late afternoon performance, increasing the total amount of power produced by a system by approximately 20%–25% for a single axis tracker and approximately 30% or more for a dual axis tracker.
Table A-3: Anatomy of a PV Passive Tracker
Component Details Value added*
Principle of operation
To maximize production, tracking systems keep PV modules facing the sun. A single-axis tracker follows the daily movements of the sun from east to west. A dual-axis tracker changes its tilt to keep the modules truly perpendicular to the sun’s rays all year long. A passive tracker is moved by the shifting weight of the liquid refrigerant from the east or west canisters through the copper transfer tube located at the south side of the assembly. The aluminum “shadow plates” shade the canister closest to the sun. The other canister grows warmer and shifts the weight to the cooler canister, tilting the PV module until it points exactly at the sun and shades the canisters equally.
n/a
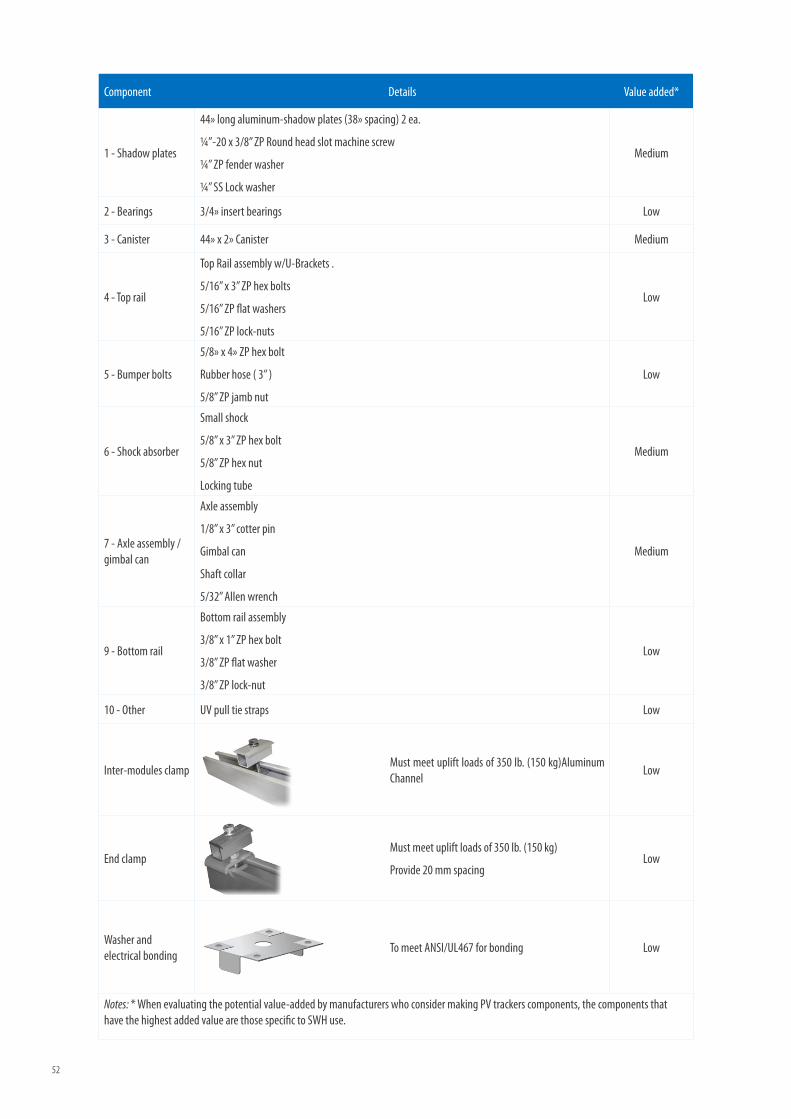
52
Component Details Value added*
1 - Shadow plates
44» long aluminum-shadow plates (38» spacing) 2 ea.
¼”-20 x 3/8” ZP Round head slot machine screw
¼” ZP fender washer
¼” SS Lock washer
Medium
2 - Bearings 3/4» insert bearings Low
3 - Canister 44» x 2» Canister Medium
4 - Top rail
Top Rail assembly w/U-Brackets .
5/16” x 3” ZP hex bolts
5/16” ZP flat washers
5/16” ZP lock-nuts
Low
5 - Bumper bolts
5/8» x 4» ZP hex bolt
Rubber hose ( 3” )
5/8” ZP jamb nut
Low
6 - Shock absorber
Small shock
5/8” x 3” ZP hex bolt
5/8” ZP hex nut
Locking tube
Medium
7 - Axle assembly / gimbal can
Axle assembly
1/8” x 3” cotter pin
Gimbal can
Shaft collar
5/32” Allen wrench
Medium
9 - Bottom rail
Bottom rail assembly
3/8” x 1” ZP hex bolt
3/8” ZP flat washer
3/8” ZP lock-nut
Low
10 - Other UV pull tie straps Low
Inter-modules clamp
Must meet uplift loads of 350 lb. (150 kg)Aluminum Channel
Low
End clamp
Must meet uplift loads of 350 lb. (150 kg)
Provide 20 mm spacingLow
Washer and electrical bonding
To meet ANSI/UL467 for bonding Low
Notes: * When evaluating the potential value-added by manufacturers who consider making PV trackers components, the components that have the highest added value are those specific to SWH use.

53
Worldwide Perspective
The rural electrification program in Morocco sought to provide PV solar electricity to a total of 34,400 villages inhabited by approximately 12 million people living in rural areas between 1995 and 2007. Because of the increased costs in connecting rural households to the electricity grid, grid extension is not feasible and individual PV solar home systems were the best choice.
In June 2010, Jordan’s Qawar Energy announced the launch of its USD 400 million Shams Maan project, a 100 MW solar PV project for the Maan Development Area (MDA) industrial park. The MDA aims to create a solar hub in Jordan for training, R&D, and attracting solar technology firms and investors. The high-profile plant will use between 360,000 to two million PV or concentrated PV panels and will produce approximately 168 GWh/y. The project covers 2 million/m2 in the southern part of Jordan.
In Saudi Arabia, the King Abdullah Petroleum Studies and Research Center awarded the construction of a 3 MW-peak (MWp) PV system and Aramco awarded a 10 MWp shade mounted PV plant located in Dhahran. Meanwhile, in Bahrain, the national Oil and Gas Authority is developing a project to install a 20 MW grid-connected solar PV system (Knieriem, H, Green Rhino Energy and Zomeworks Corporation).
Value Chain of a CSP System
General
CSP, sometimes referred to as Concentrated Solar Thermal Power, constitutes a clean and reliable source of energy. CSP technology is based on an array of mirrors or optical lenses that concentrates sunlight and converts it to usable energy in the form of electricity. Concentrated sunlight is first converted to heat to drive a steam turbine coupled with a generator that rotates to produce electricity.
Various CSP technologies
There are four common types of concentrating technology: (1) parabolic trough, (2) concentrating linear Fresnel reflector, (3) dish Sterling, and (4) solar power tower.
The Parabolic Trough system is the most common system used today. Parabolic trough technology uses parabolic reflectors to concentrate sunlight into a receiver pipe conveniently positioned in the reflector’s focal line. The receiver heats a liquid, which generates steam. The steam turbine rotates a generator to produce electric power. To optimize the efficiency of the system, the collector rotates in harmony with the sun’s movement using a tracking system.
Linear Fresnel reflector technology works much like the parabolic trough system, except that it uses flat mirrors that reflect the sun onto water-filled pipes that generate steam. A major difference between the Linear Fresnel technology and other CSP technologies is that the long mirrors used in Linear Fresnel reflect sunlight onto a single horizontal tubular receiver, whereas other CSPs require multiple receivers. Linear Fresnel reflectors are also less space consuming, and the long mirrors produce higher temperatures resulting in improved efficiency.
In a Tower system, sunlight is concentrated by flat mirrors to a central tower mounted receiver where the thermal energy is transferred to the HTF. The HTF is heated to a very high temperature and runs the turbine to create electricity. This energy is then passed onto a thermal storage system for immediate power conversion. Major components in such a system include the controllers, the receiver, the storage system, the heat exchanger and the thermal engine. Some systems use a thermal salt storage in molten state to provide electricity when the sun is down.
A Dish/Stirling system—also referred to as a Parabolic Dish System—uses
parabolic reflectors to direct the sunlight toward a receiver placed at the reflector’s focal point. The focused sunlight is converted to thermal energy that heats the HTF that can either be transported to a central generator for conversion to electricity, or generate power in the receiver itself. A tracking system allows a two-axis rotation in the X and Y directions resulting in better conversion efficiency when compared to other solar collector systems. The dish is coupled with a Stirling engine, and a steam engine is occasionally used.
CSP Value Chain in a nutshell
Relatively speaking, CSP is a new and evolving industry. The functional roles and players vary continuously depending on projects, choice of technology, and geographical location. The CSP value chain may be broken down into four main processes, namely: project development, raw material acquisition, components manufacturing, and operation of the CSP plant. R&D is an integral part of the product, and distribution stages of the value chain. Much of the R&D, plant development, manufacturing, plant design, installation and operation, are conducted by a single company or by closely related companies. There is therefore significant vertical integration across the five stages of the value chain. A typical value chain diagram for a CSP System is shown in Figure A-10.
Figure A-10: CSP value chain
Project Development
The project development phase of a CSP plant starts out with feasibility studies, site selection, and financial studies. Technical specifications and project requirements are then developed and issued. Detailed design elements are performed at later stages to fulfill the general design intent. Finally, the financial resources are determined and secured for the project.
Materials
CSP plant construction requires commodity-type materials such as steel and concrete, leading many companies to contract the manufacturing of the non-patented components. The major materials in the CSP value chain are steel, concrete, Silica, PVC, plastic, brass, synthetic oil, copper, aluminum, and molten

54
salt. A CSP plant is composed of four major systems: the collector, steam generator, heat storage, and central control. The collector system components vary depending on the type of CSP plant. In addition to the components listed in the illustration above, CSP technology uses many other elements covered within conventional technologies that are associated with generating electricity. These include gas boilers, condensers, and cooling towers, among others. These components constitute a necessary part of the production process for any CSP plant and are considered as part of the value chain.
Mirror Manufacturing
Reflector mirrors are a core component of the CSP system. Several designs are available and are usually proprietary to the mirror manufacturers. Currently, the glass-based CSP mirrors can be grouped into two categories as shown in Figure A-11: (1) single layer monolithic mirrors and (2) multilayer laminated mirrors. Monolithic mirrors, as depicted in Sub-figure 1 of Figure A-11, can be flat or heat-bent before silvering, and the backing paint serves as the protective layer for silver and/or copper metals. For laminated mirrors, as depicted in Sub- figure 2 of Figure A-11, the front glass can be flat, cold bent or heat-bent. The backing plate is then laminated to the silvered front plate as a protective layer. The laminated designs ensure better reflectivity and durability.
Adhesive
Backing Plate
Mounting Pad Mounting Pad
Figure 1 - Monolithic Mirrors Figure 2 - Laminated Mirrors
Thick Low Iron2nd Surface Mirror
Thick Low Iron2nd Surface Mirror
MultilayerProtectiveCoating
Adhesive
Backing Plate
Mounting Pad Mounting Pad
Figure 1 - Monolithic Mirrors Figure 2 - Laminated Mirrors
Thick Low Iron2nd Surface Mirror
Thick Low Iron2nd Surface Mirror
MultilayerProtectiveCoating
Figure A-11: Glass based CSP categories
In the design shown in Figure A-12, the mirror is made with a thin front glass and a thicker backing glass laminated with polyvinyl butyral film in between. For curved mirrors, a thin solar glass and a thicker backing glass are bent together at elevated temperatures to reach the required curvature.
After cooling, the resulting glass plates maintain their shape bypassing the need of extra boundary conditions. The thin glass is then separated from the backing glass
and coated with silver and copper layers for the required reflectivity.
Lastly, the reflective front glass and the backing glass are laminated with polyvinyl
butyral through an autoclave process for optimum adhesion and edge seal. In the case of flat laminated mirrors, the bending process step is omitted.
Figure A-12: PVB-laminated mirror. (source: Guardian Industries Corp., Science and Technology Center)
Worldwide Perspective
A group of companies from the EU has founded the DESERTEC Industrial Initiative, which aims to generate up to 550 GW of electricity over the next 40 years, installations that will initially be located in Algeria, Egypt, Libya, Morocco, and Tunisia, and later on in the region stretching from Turkey through Jordan to Saudi Arabia. The World Bank’s Clean Technology Fund announced an initial USD 5.5 billion in funding for the initiative in December 2009. The generated power will be used to meet local demand, and to export to Europe, through high-voltage direct current cables laid under the Mediterranean Sea.
Another important initiative is the Mediterranean Solar Plan, designed to develop 20 GW of renewable electricity capacity by 2020 in the Southern Mediterranean, and to build the necessary infrastructures for electricity interconnection with Europe.
The “MENA CSP scale-up” Investment Plan, supported by the World Bank and the African Development Bank, is intended to strategically utilize concessional financing from the Clean Technology Fund (CTF) to accelerate global adoption of the technology in the region. It was endorsed by the CTF Trust Fund Committee in December 2009, and will support expansion programs in Algeria, Egypt, Jordan, Morocco, and Tunisia. The Plan is conceived as a transformational program, leading to the installation of at least 5 GW of CSP capacity in MENA by 2020, based on the initial 1.2 GW triggered by the Plan. The first projects are expected to initiate commercial operations by 2014, and to supply primarily, domestic markets in MENA countries. The CTF has set aside USD 750 million to cover 10% of the investment costs of CSP plants in the MENA (AFDB, 2012).
In November 2009, Morocco announced a USD 9 billion solar program for the installation of 2 GW of solar capacity, through a combination of PV and CSP systems, to provide 20% of the country’s electricity by 2020. In 2010, Morocco commissioned its first integrated solar combined cycle power project, the 470 MW plant at Ain Beni Mathar, which will have a 20 MWe solar component. The installation features an 180,000 m² two parabolic solar field comprising 224 parabolic solar collector assemblies in 56 loops.

55
Northern Algeria is home to the world’s second integrated solar combined cycle plant. The EUR 320 million (USD 369 million) 150 MWe Hassi R’Mel Project is being built on behalf of New Energy Algeria. The project adjoins an existing Sonel gaz power station at Tilghemt. The solar installation works in conjunction with two 42 MW gas turbines and an 80 MW steam turbine.
Egypt’s first large-scale solar development is 90 km south of Cairo at Kuraymat. The solar component of the integrated solar combined cycle plant consists of almost 2,000 parabolic trough collectors covering 130,000 m² at the 150 MW solar farm. The plant’s location gives access to the grid and natural gas pipelines, as well as to water from the Nile.
In UAE, the carbon-neutral city Masdar appointed in June 2010 a consortium between Total and Abengoa Solar to own, build and operate what is expected to be the world’s largest CSP plant, Shams 1. The project covers an area of 2.5 km², with a capacity of approximately 100 MW. Its solar field consists of 768 parabolic trough collectors. The project is registered under the UN CDM.
Value Chain of a Small-Scale Wind Systems
General
Small-scale wind turbines have been useful for various electricity needs at the household level. In remote villages and farm communities, it is used in a configuration that couples wind generation with an energy storage system such as a battery bank. With the availability of the power utility back-metering schemes, small-scale wind turbines may be connected to feed excess power to the local provider network.
There are significant advantages to small over large-scale wind turbines; the design of a small-scale wind turbine system is more elementary and less costly, and more importantly, the wind path, the size of the turbines and wind power collection are less of a consideration for researcher.
Value Chain
A small wind generator value chain is less elaborate than a large-scale wind farm (discussed in the next section) and consists of raw material supply, system components manufacture, and final installation at the end user’s site. A typical value chain diagram for a small-scale wind system is shown in Figure A-13
Figure A-13: Value chain diagram for small, wind systems
Manufacturing Components of a Wind Energy SystemWind turbines are usually built by original equipment manufacturers that either make products solely for the wind energy market or for wind and non-wind energy-related markets. The three major components of a wind turbine are the blades, tower, and nacelle.
Blades
The blades are an important part of the turbine and constitute the component that provides the propelling mechanism to create a rotational motion. A wind turbine blade is designed to ‘catch’ the wind and transpose its forces to the turbine’s main shaft in the nacelle. The concept behind the force creation is based on the fact that the blade is shaped in a way so as to alter the air flow and create pressure differences along the surfaces in the stream of air. The pressure difference is used by transforming the wind forces to lift and drag forces, which are proportional to several factors. These include the blade’s angle of attack in relation to the wind, the wind speed, the blade’s size, the tower’s height, among others.
Modern turbine blades are made of fiberglass or aluminum to minimize their weight and lessen their loading forces on the tower. Blades may be >100 feet long in some models, depending on the targeted performance. Blade size is dependent on the climate where the turbine will be installed and varies based on the strength of the winds. When winds are consistently strong, smaller blades are required.
The blade shape must be carefully chosen with respect to the application and the wind turbine model. A pre-designed model may be picked from one of the various airfoils developed by the National Advisory Committee for Aeronautics (NACA) between 1915 and 1958 as the predecessor to the National Aeronautics and Space Administration (NASA). Alternatively, various computer programs are available to design and simulate the response of new airfoil models.
Towers
The function of a wind turbine tower is to raise the nacelle to a high position to optimize its wind harvesting functions and to gain advantage of the higher wind speed. Moreover, blades are placed above obstructions that may cause turbulence, which tends to increase fatigue loads.
Therefore, the tower must be built strong and firm, yet flexible and elastic enough as to withstand lateral forces, vibrations, and all type of wind loads that may be experienced over the life of the system.
Towers consist of several steel segments placed atop one another. They are usually planned at a certain height depending on the geographical location and wind expectations; higher wind tower benefit from better wind. Towers closer to the ground are not only slower, but also more turbulent.
Nacelle
The brain of the wind turbine is the nacelle, a rectangular box resting atop the tower and containing the turbine’s gears, generator, and other mechanical components. The nacelle also contains many highly sophisticated electronic components that allow the turbine to monitor changes in wind speed and direction. These components can direct the wind turbine to turn on and off or change direction automatically to safely and efficiently harness power from the wind. Figure A- 14 represents the nacelle and its components.
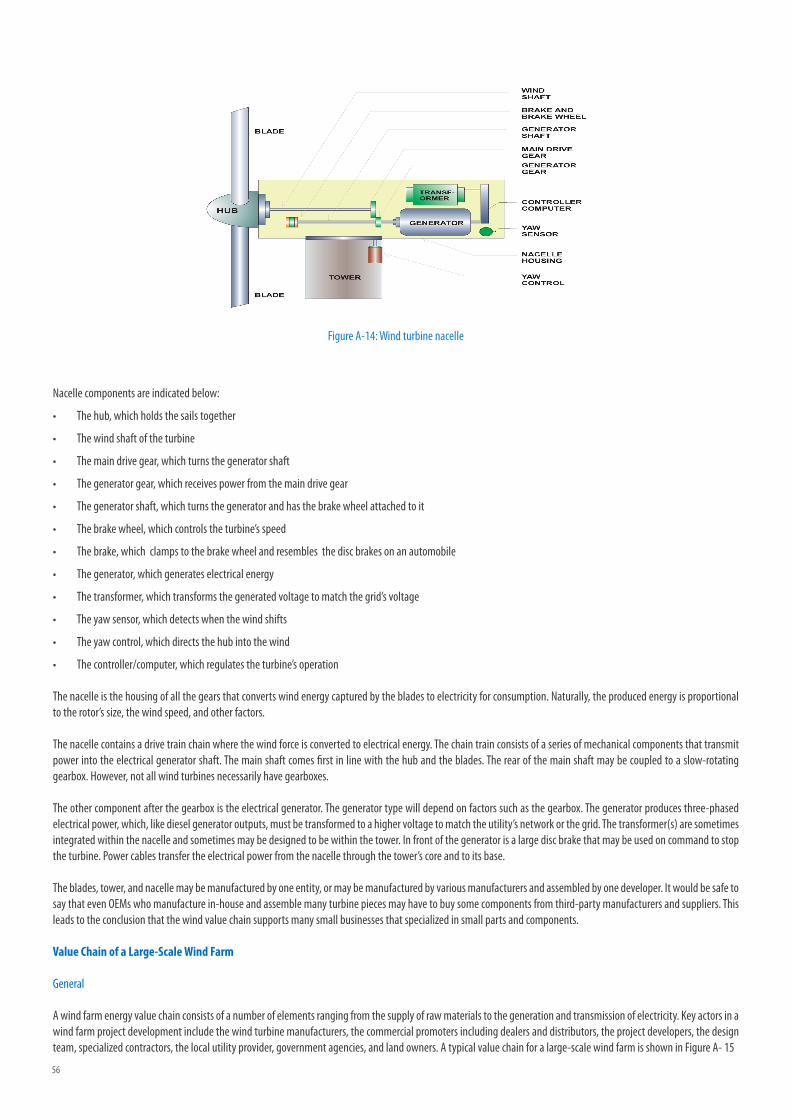
56
Figure A-14: Wind turbine nacelle
Nacelle components are indicated below:
• The hub, which holds the sails together
• The wind shaft of the turbine
• The main drive gear, which turns the generator shaft
• The generator gear, which receives power from the main drive gear
• The generator shaft, which turns the generator and has the brake wheel attached to it
• The brake wheel, which controls the turbine’s speed
• The brake, which clamps to the brake wheel and resembles the disc brakes on an automobile
• The generator, which generates electrical energy
• The transformer, which transforms the generated voltage to match the grid’s voltage
• The yaw sensor, which detects when the wind shifts
• The yaw control, which directs the hub into the wind
• The controller/computer, which regulates the turbine’s operation
The nacelle is the housing of all the gears that converts wind energy captured by the blades to electricity for consumption. Naturally, the produced energy is proportional to the rotor’s size, the wind speed, and other factors.
The nacelle contains a drive train chain where the wind force is converted to electrical energy. The chain train consists of a series of mechanical components that transmit power into the electrical generator shaft. The main shaft comes first in line with the hub and the blades. The rear of the main shaft may be coupled to a slow-rotating gearbox. However, not all wind turbines necessarily have gearboxes.
The other component after the gearbox is the electrical generator. The generator type will depend on factors such as the gearbox. The generator produces three-phased electrical power, which, like diesel generator outputs, must be transformed to a higher voltage to match the utility’s network or the grid. The transformer(s) are sometimes integrated within the nacelle and sometimes may be designed to be within the tower. In front of the generator is a large disc brake that may be used on command to stop the turbine. Power cables transfer the electrical power from the nacelle through the tower’s core and to its base.
The blades, tower, and nacelle may be manufactured by one entity, or may be manufactured by various manufacturers and assembled by one developer. It would be safe to say that even OEMs who manufacture in-house and assemble many turbine pieces may have to buy some components from third-party manufacturers and suppliers. This leads to the conclusion that the wind value chain supports many small businesses that specialized in small parts and components.
Value Chain of a Large-Scale Wind Farm
General
A wind farm energy value chain consists of a number of elements ranging from the supply of raw materials to the generation and transmission of electricity. Key actors in a wind farm project development include the wind turbine manufacturers, the commercial promoters including dealers and distributors, the project developers, the design team, specialized contractors, the local utility provider, government agencies, and land owners. A typical value chain for a large-scale wind farm is shown in Figure A- 15

57
Figure A-15: Value chain for a large wind farm
Manufacturing Components of a Wind Energy System
The manufacture of the main components in a large-scale wind farm specific to the wind RES industry is not much different from the one described above in the Small-Scale Wind System Value Chain.
Other components that are part of a large-scale wind farm, such as electrical energy transformation and distribution gear, will not be described in this report, because these components are common to other industries and would not constitute added manufacturing opportunities to the market. Benefits other than manufacturing are described below.
Value Chain Opportunities other than Manufacturing
While manufacturing opportunities are the most prominent in the wind energy industry, a range of service opportunities is available as well for large-scale setups.
Broadly, the services opportunities could be categorized into:
• Feasibility studies and project development
• Geotechnical studies and services
• Logistics support for the potential wind farm
• Construction opportunities
Operations and maintenance during the life cycle of the wind farm
Because of the complexity of developing a wind farm, many occupations and services are involved in the value chain. Lawyers, financial modelers, and permit preparers will be required to take care of the legal and financial aspects, and deal with local regulations. Land purchasing agents are necessary to arrange leasing or purchasing contracts for the wind farmland location. Engineering studies must ensure that the site is adequate for the wind farm project.
Several activities occur simultaneously in a wind farm project development. Due to the complexity and size of large wind turbines, the manufacturing process cannot wait till the completion of site development. Rather, it starts as soon as a site is identified, all the necessary permits are obtained and the financing is planned. The foundations, which consist of concrete and steel, must also be complete before the installation of the turbines is initiated.
Another challenge facing developers is the transportation of the turbine components to the worksite. Many wind farms are located in remote locations far from turbine manufacturers. Because of the extremely large size of these components, specially designed trucks are necessary to transport them to worksites. Some development companies handle their own transportation and logistics issues, whereas others hire trucking companies that specialize in hauling large equipment.
Once the land is purchased or leased, the foundations are built, and the turbine parts have arrived onsite, the turbines are ready to be erected. Development and construction companies usually use a combination of specialized employees and local contractors. Under the supervision of more experienced wind-industry workers, local construction firms help build the access roads and the turbines’ underlying foundations – made of reinforced concrete. Skilled crane operators stack the tower segments atop one another before adding the nacelle and blades to the top of the turbine.
When planning the wind farm, the owner will enter into a contract –known as a power purchase agreement – with the utility company. Each wind turbine functions as

58
its own power plant, and the energy it produces is gathered into substations for later conversion into usable electricity. Electricians are necessary to build the plant’s electricity distribution system and to connect the turbines to the power grid.
Project Development Phase
Site Selection
The conception stage of a wind farm project starts out by identifying areas that may offer the adequate field conditions for such purposes. This translates into selecting an adequate site for the wind farm project. This is done by taking into account several critical factors including wind characteristics and variability, availability of land, social, geographical and environmental suitability (such as local bird and bat populations), and financial feasibility. Structural practicality is also a consideration, as the ground has to support the weight—often in excess of 1,000 tons—of turbine structures. Additionally, in-depth investigations must be undertaken into the specific wind conditions present at each site.
Design
During this phase, mechanical and electrical systems are designed, and the entire system, from the wind turbine to the point of connection to the energy grid, is planned, designed and decided. The required infrastructure is also considered and put in place. Furthermore, the development team will plan beforehand the maintenance of the farm by providing operating and maintenance (O&M) manuals and procedures. The management of the construction phase is planned as well as the ongoing environmental monitoring during construction. Commissioning and decommissioning of the wind farm is also planned during this phase.
Construction Phase
All necessary machinery, electrical components and mechanical parts, including the wind turbines and all associated infrastructure, are installed, set up and connected during construction. Given that the construction phase of a wind farm is recognized as potentially being the most disrupting phase of development, construction strictly adheres to the processes laid out in the projects’ environmental study, so that any negative impact on the environment, communities and landowners can be mitigated. These disruptions are temporary however, and will cease once construction is completed.
Following construction and directly prior to the operational phase is a period known as “commissioning”, whereby all systems, infrastructure and equipment are thoroughly tested for efficiency and correct functioning. Once commissioning has been successfully completed, the wind farm may be launched.
Operation and Maintenance Phase
During the operational phase of the wind farm, it is crucial to perform scheduled and ongoing control, maintenance and monitoring activities to ensure the smooth running of the project and to limit downtime. The wind farm must be monitored on a daily basis, and routine maintenance work must be undertaken. However, this continuous monitoring does not require a sizable staff by any means. Energy companies employ monitors, either locally or remotely, to observe energy flows, equipment status, alarm signals to streamline technical information to their maintenance team that can respond to any situation that needs intervention. During operation, a follow-up environmental study is also required to verify that the impact of the project remains within the parameters of the initial environmental study.
As noted above, the tasks related to the conception, planning, manufacturing, and operating of a wind farm require a considerable number of people. All wind farms
employ local workers, which boosts the community’s economy. Remote monitoring of wind turbines allows for a cost-effective way to ensure that the turbines are generating power most efficiently. Each of these workers along the supply chain contributes to making wind a viable source of energy in a community.
Worldwide Perspective
By the end of 2011, a total of 238 GW of wind power capacity existed across the world, up from 6.1 GW in 1996. Over the period from the end of 2006 and up to the end of 2011, annual growth rates of cumulative wind power capacity averaged 26%.
Value Chain of a Small Scale Bioenergy System
General
Biomass energy includes all forms of organic waste and byproducts that are incinerated to produce energy. Biomass energy technology for small-scale systems holds tremendous opportunities for offsetting local energy needs. Rural communities and businesses may benefit from this technology by developing value-added uses for material derived from the forest for instance. When small scale biomass systems become available, they will provide a reliable and efficient source of heat and power, using both agricultural and forest residues.
Promoters of biomass energy cite numerous benefits such as improved air quality, reduced erosion and the reduction of chemical fertilizers, pesticides and herbicides. The CO2 released when energy is generated from biomass is balanced by that absorbed during the fuels production and that is why it is considered to be carbon neutral by advocates of bioenergy systems, albeit this assessment is not shared by opponents of bioenergy systems. In all cases, bioenergy systems potentially offer a better carbon balance in the provision of energy when compared to other forms of conventional energy sources like oil and diesel.
Biomass Fuel
Unlike fossil fuel, biomass is organic material of recent origin that is mostly derived from plants and is either used directly by combustion or indirectly by converting it to one form of biofuel through various methods that are either thermal, chemical, or biochemical. Examples of biofuels extracted from biomass material are: methane gas, ethanol, biodiesel, wood pellets, etc.
Wood is the most commonly used biomass energy source. It is collected from forest residues, yard clippings, wood chips and even municipal solid waste. Other biomass material is derived from industrial, commercial, domestic or agricultural products. Thus, biofuels fall into two main categories. Wood biomass includes forest products, untreated wood products, energy crops, any plant based products from dead trees, dry branches, garden waste, mills wood chips, sawmill dust, among others. Non-wood biomass includes animal waste, industrial and biodegradable municipal products from food processing and high energy crops, sugar cane, maize.
Biomass is the largest energy source for fuel after coal, oil, and natural gas. It is of no surprise that this type of fuel potential makes its way to heat applications through multiple routes of configurations and applications. Various biomass to fuel to heat pathways are shown in Figure A- 16.
Biofuel production quantity and type are driven by market demand, which is based on the type of application. For instance, in small-scale domestic applications of biomass boilers, the fuel usually takes the form of wood pellets, wood chips, and wood logs.

59
Figure A-16: Biomass to heat flow diagram
Anatomy of a Small-Scale Bioenergy System
Small modular biomass systems help supply electricity to rural areas and businesses. These systems use locally available biomass fuels such as wood, crop waste, animal manures, and landfill gas. Small systems rated at 5 MW can provide heat and power where needed. Some units are portable and easily pluggable for immediate delivery of power. Small modular biomass systems typically consist of a fuel processor and an electric generator. Efficiency and the flexibility to use more than one fuel appeal to many users. Simplicity of operation means that they need no special skills for the operation of the units.
Furthermore, successful commercialization of small modular biomass systems completes the development of a biomass industry that covers all ranges of expected power applications, including small systems for distributed applications and/or individual power needs, CHP systems for industrial applications, and gasification for utility-scale power generation.
In the following section, small systems in the form of the much used biomass boilers are examined in more detail.
Biomass Boiler
A biomass boiler (Figure A- 17) runs on wood fuel such as wood pellet, wood chip or log and can be used for heating space and water. In a biomass boiler there is a storage area where the wood fuel is kept and then the actual boiler where the fuel is ignited. The wood fuel is automatically fed into the boiler from the storage area and is then ignited by an auto start. The temperature is controlled via an electronic thermostat.
Figure A-17: Biomass boiler
Components
Skilled individuals are needed to manufacture, maintain and operate residential biomass boiler systems machinery. A biomass boiler manufacturing facility may employ dozens of individuals, including engineers, human resource professionals, laborers, and maintenance workers. Smaller biomass projects have a smaller economic impact per unit sold, although they have the potential to sell more units of this manufactured product and may affect the economy in the consideration of scale.
Components of a biomass boiler are:
• Biomass combustion
• Blower
• Burner components
• Burner management system
• Electrical components
• Fuel compartment housing and (pellet hopper)
• Gauges
• Heat exchanger
• Ignition system
• Insulation material
• Thermostat
• Valves
Worldwide Perspective
All over the world, more and more applications of biomass boilers are being noted. In Sweden, 80% of the boilers run on biomass, which is the highest rate of use in Europe. In countries such as Germany, Finland, and Norway, approximately 40% of boilers run on biomass. Bioenergy sources meet on average 6.7% of the EU-27s energy consumption (The National Bioenergy Assessment, 2012). In some EU-member countries, bioenergy represents between 5% (Greece, Hungary, Spain) and 15% (Austria, Denmark, Portugal) of total energy consumption, while it represents up to 25% of the total energy consumption of countries such as Finland and Sweden.
In the MENA region, the potential of biomass energy is largely untapped. Traditionally, biomass has been widely used in rural areas for domestic energy generation, especially in Egypt, Jordan, and Yemen. Many MENA countries have varied and high animal species. The livestock sector, in particular sheep, goats, and camels, plays an important role in the national economy of the respective countries. In addition, the region has witnessed very rapid growth in the poultry sector. The biogas potential from animal manure can be harnessed at small- and community scale. In addition, since most of the region is arid or semi-arid, biomass energy potential is mainly contributed not by agricultural residues, but by municipal solid and liquid waste.
Value Chain of a Large-Scale Bioenergy System
General
There are common features among the various large-scale RES projects. However, large-scale projects that use biomass fuels are more complex and require more planning. The complexity arises from the variety of sources, conversion technologies and final uses of biomass. Biofuel is derived from various sources and may be in the form of solid, liquid, or gas. Biofuel has to undergo several stages of pretreatment, purification, compaction, and transformation from one state to another before its final use.

60
The supply chain management of a large-scale biomass project entails many key parameters that at times are difficult to predict. The value chain starts at biomass resource harvesting and includes biomass collection, processing, storage and transportation, to the final use as a source of energy. A major issue associated with large-scale biomass projects lies in the fact that resources are voluminous and their supply availability may be affected by various factors. Therefore, these resources require more carefully planned logistics, work force, and storage infrastructure than any other renewable fuel. Figure A- 18 displays a simplified block diagram illustrating a typical large-scale bio-energy value chain.
Figure A-18: Large-scale biomass supply chain management
Reducing Uncertainties
To mitigate the problems that are associated with biomass fuel, a mechanism should be devised to stabilize the value chain by regulating the resources. This can be done by considering the following (Figure A-19):
• Assuring a reliable and consistent supply chain for the project developers
• Proximity of the project to the resources plant site
• Quality assurance of the resources
• Promoting and widening markets for the resource providers
• Minimizing intermediaries and simplifying the value chain as much as possible to increase value for both the producers and the buyers
• Scheduled pick-up and drop off of resources
• Proper fuel preparation with the latest technologies available
• Competitive prices for fuel and the produced energy
• Incentives and assistance to the producers of crop to better manage their value chains
Figure A-19: Large-scale biomass supply chain enhancement
Value Chain of a CHP Biomass Project
Biomass is converted into energy in the biomass power plants. The organic waste may have come from factories, farms or municipalities that participate in collecting homeowners’ yard waste. The waste is then burned at the biomass power plant in a furnace. The heat from the incineration boils water in an adjacent boiler and the steam then turns turbines and power generators creating energy. The most used technology for using biomass in power generation involves its combustion in a boiler for the production of high-pressure steam.
A more efficient technology that uses a boiler is CHP—also known as cogeneration—which uses a specific configuration of a power plant set up to generate electrical power and to make use of the heat that is generated in the process. Conventional power plants do not convert all of their thermal energy into electricity. A considerable

61
amount of the energy is produced and wasted in the form of heat. In a CHP plant, the ‘would-be-wasted’ heat is captured through heat exchangers and transferred to the end-user through various components thus, enhancing the efficiency of the system to approximately 80% as opposed to 35% in a conventional power plant. This eventually leads to both energy and cost savings.
CHP biomass power plants generate electricity and heat by means of heat exchangers and a turbine among other components. Some of the components that may be found in the value chain are:
Boilers
• Combustion technology
• Conveying systems
• Disposal of byproducts (ash)
• Emission reduction systems
• Fuel storage
• Plant control
• Transport
The steam turbine, which is at the heart of the value chain (see Figure G-20), converts the thermal energy produced by the biomass combustion into electrical energy. There are many possibilities to modify CHP processes to optimize the efficiency and to achieve the best possible fit with a specific production process, for example using a steam turbine plant with condensation operation or condensation removal. Below is a diagram of the value chain of a biomass CHP.
Figure A-20: Biomass CHP
Worldwide Perspective
The generation of electricity from biomass is a tested process, with many hundreds of applications around the world. The Northern European countries are probably the leading users of biomass as a source of heat and electricity.
Municipal solid wastes represent the best source of biomass in Middle Eastern countries. The gross urban waste generation in the Middle East is estimated at over 150 million tons annually. Bahrain, Kuwait, Qatar, Saudia Arabia and United Arab Emirates rank in the top 10 worldwide in terms of per capita solid waste generation. The growth of hotels, restaurants, and cafeterias in the region has resulted in the generation of large quantities of food waste. Food waste is the third largest component of generated waste by weight, and it mostly ends up rotting in landfills.
Great quantities of sewage sludge are produced on a daily basis in the Middle East. On an average, the rate of wastewater generation is 80–200 L/p/d, and sewage output is rising by 25% every year. The French WTE technology company Degrémont designed and built anaerobic digesters in WWTPs in Gabal el Asfar, located in Cairo, Egypt. It treats a capacity of 500,000 m3 of water/d. Actual sludge production to be digested is 147 tons dry solids/d. With this quantity of sludge, biogas production ranges between 45,000 and 49,000 Nm3/d. The plant’s five CHP engines produce 77,350 kWh of electricity/d using biogas. This amount represents half of the electricity required to operate the entire WWTP.
Value Chain of a Large Hydro System
General
Large-scale hydroelectric plants have been used for a long time as a reliable means of generating energy (see Figure A- 21 for a typical schematic). This is especially true in countries that are rich in water resources.

62
Figure A-21: Schematic of typical large-scale hydropower plant
Advantages and Disadvantages Large scale hydropower plants can disrupt fish migration in rivers, displace both wildlife and people and cause significant environmental disruption. Damming interrupts the flow of rivers and can harm local ecosystems, and building large dams and reservoirs often involves displacing people and wildlife.
However, this disruption caused by the dams may be balanced against the many benefits provided by these large-scale renewable systems. For example, many dam projects have helped prevent flooding that would otherwise have caused damage to the neighboring farms and homes.
Since hydroelectric power gets its energy from falling, flowing, or tidally moving water, production of electrical energy has no direct waste and no emission of greenhouse gases or pollutants due to the absence of combustion. The silt buildup that the dam of a hydroelectric plant may be subject to is minimal compared to pollution free power generation delivered in the many years of energy production.
Principle of Operation
Large hydroelectric plants are based on the principle of using kinetic energy that is usually available in water masses such as elevated lakes and rivers. The water is directed in an engineered pathway to drive a turbine by the sheer force of gravity. The structures of these hydropower plants are simple and consist of a water reservoir on one hand and a turbine or generator on the other hand. The flow from the water reservoir to the turbine is controlled by an intake valve. Usually the intake area has a series of screens to filter out dirt and sediment so these materials do not damage the turbine. The water flows from the reservoir to the turbine through a water channel. The blades of the turbine are positioned so as to take optimal advantage of the energy of the water flowing through the penstock. Once the water has passed through the turbine blades the water is then released into a stream or river.
Hydroelectric Turbine-Generator
Similar to other electrical generators, a hydroelectric turbine/generator (see Figure A- 22) produces electricity on the principle of electrical induction. When a wire or a set of wires (coil) are moved through a magnetic field, an electric current is produced. The mass of water is gravity-channeled through the turbine blade, ensuring continuous rotation of the wire. The generated power passes through transformers to increase the resulting voltage.
A large metal shaft is at the central part of the generator. At the bottom end of the shaft are series of blades, similar to a giant propeller. The water from the dam is directed into the blades through a group of slots called wicket gates. The wicket gates are designed to reduce turbulence created by the incoming water. At the top end of the generator shaft is the rotor assembly or series of wire coils. As the shaft turns the wires through a magnetic field, an electrical current is created.
Figure A-22: Structure of a hydro generator (source: US Amry Corps of Engineers)

63
Project ConsiderationsA few parameters have to be taken into consideration when planning a large-scale hydroelectric system. They include:
• Water head level—The vertical drop of water and the resulting force have to be sufficient for the minimum head pressure required
• Flow level at the turbine
• Pipe network—All piping needed within the plant has to be evaluated
• Powerhouse cost—The power house is the heart of the plant with the turbine, generator, transformers, distribution gear, and other components
• Proximity to existing power lines network—an assessment is needed to determine the required transmission lines needed to deliver the hydroelectricity to the grid.
Worldwide Perspective
Approximately 20% of the world’s electricity is generated from hydroelectric sources, making it the most widely used form of RES. Approximately 970 GW of hydropower capacity were operational globally as of 2012, over half of which are in Brazil, Canada, China, Russia, and the United States. Canada for instance gets 70% of its electricity from hydroelectric plants, using its abundance of streams and rivers. Even in the generally water-poor MENA region, the best-developed non-fossil form of electric power production is hydropower.
Value Chain of a Pico-Hydro System
General
As discussed in the previous section on large hydro systems, hydroelectricity is created from the energy potential that is intrinsic to masses of water in elevated places and tends to naturally move downward (back to the sea) by force of gravity. Once moving, the energy becomes kinetic and may be used to rotate a turbine coupled with a generator to produce electricity.
Pico-hydro power systems leverage this energy from water dynamics through the use of small water turbines with generators. Pico-hydro is a term used for hydroelectric power generation of 5 kW or less. It is useful in small, remote communities that require a limited amount of electrical power. Even smaller turbines of 200o–300W may power a single home in a developing country with a low drop of water of a few meters. Unlike large and small hydroelectric plants, pico-hydro systems do not need a water reservoir or dam, but rather pipes divert some of the flow, which drops down a gradient and through the turbine before being released back into the stream.
Portable Pico-hydro system
A portable micro-hydro system (see Figure A- 23) is used to generate electrical power in areas that are not connected to the grid of a utility company. It is considered as a stand-alone solution. In most cases, the application includes a small storage means for the generated power. This mode of operation allows the temporary provision of power, which is a multiple of the continuous output of the system.
The construction of a portable micro-hydro power plant may be simple and robust. Parts of this system are the intake from stream or river piping (the penstock), the water turbine, the electrical generator, an electronic controller, and the electrical distribution system.
The generator is driven by a Pelton wheel on a common shaft. The impeller consists of an aluminum hub and abrasion-resistant buckets made of a special plastic made of polyamide with 30% fiber glass. The synchronous generator is permanently
agitated, brushless and has lifelong lubricated bearings. Given this property, the generator requires hardly any maintenance and is highly efficient.
The housing made of cast aluminum has a collet. This allows the connection without further fastening to a plastic socket or a concrete pipe. There are three jets that can be controlled to allow a flexible adjustment to various water quantities. A manual jet needle adjustment may be added to limit the water quantity.
A power-point-tracker charge controller is used to search for the best working point of the turbine, where the water speed is ideal related to net head. These turbine systems can be adapted to various water quantities and heads and therefore have a wide range of applications.
In place of a charge controller, a regeneration-capable mains inverter can be used to feed the produced energy directly into the public grid. In this case, the generator voltage has to be adjusted to the inverter.
Figure A-23: Pico-hydro generator (Source: LIGENHOLE Technology)
Worldwide Perspective
Small hydropower is a practical method for rural electrification. In China, according to the policy of “self-construction, self-management and self-consumption”, a rural population of 300 million has enjoyed electrification through small hydropower systems. In the MENA region, these RES are not widespread, mostly because the water sources appropriate for this technology are rare.

64
Value Chain of a Heat Pump
General
Geothermal heat pumps (GHPs)—sometimes referred to as Geo-Exchange—are earth-coupled, ground-source, or water-source heat pumps that work on the principle of providing heating by extracting heat from a source (ground, water, or air) and transferring that heat into a space or building. Used since the middle of the twentieth century, GHPs use the constant temperature of the earth as the exchange medium instead of the outside air temperature. Heat can be extracted from a source even it appears to be cold. Efficiency of the system depends, however, on the heat content of the source. A ground source heat pump uses the top layer of the earth’s crust as a source of heat, thus taking advantage of its seasonally moderated temperature.
In the summer, there would be a reversed process—the heat pump extracts heat from the conditioned space and transfers that it to the ground (or water) where it would be absorbed—thus cooling the space. It should be noted that transferring heat to a cooler space takes less energy than bringing heat out of a space.
Types
GHP systems can be either water source or ground source in a closed-loop circuit or in an open-loop circuit (see Figure A- 24). Additionally, there are variations where the loop is installed horizontally, vertically, or in a slinky architecture. All these options are selected in any combination to suit the particular climate and site conditions of the project or application. Figure A-24 shows the most common configurations of GHPs that are currently used.
Figure A-24: Various types of geothermal heat pumps
Closed-Loop Systems
Closed-loop systems have gained in popularity due to their ease of application. These systems involve the installation of sealed-loop piping through which a liquid solution is circulated to a heat exchange.
In a closed-loop system, the primary refrigerant loop is contained in the appliance cabinet where it exchanges heat with a secondary water loop that is buried
underground. The secondary loop is typically made of high-density polyethylene pipe and contains a mixture of water and anti-freeze. Monopropylene glycol has the least damaging potential when it might leak into the ground, and is therefore the only allowed anti-freeze in ground sources in an increasing number of countries. After leaving the internal heat exchanger, the water flows through the secondary loop outside the building to exchange heat with the ground before returning. The secondary loop is placed in the ground below the frost line where the temperature is more stable or preferably submerged in a body of water if available. The pipes can be installed either horizontally or vertically in the ground or in a pond or lake.
When buried in the ground, the compaction of the soil around the pipe is critical to ensure efficient heat transfer between the pipe and the ground. Overlapping the piping in a ‘slinky’ configuration reduces the efficiency of the heat exchanger but may be a necessary tradeoff to take advantage of available space.
For installations where the land area is not available, vertical boreholes are used and the pipe is installed in the vertical boreholes or wells. The vertical pipes are connected in parallel to make the flow loops essentially equal. Grout is used in the boreholes to ensure good heat transfer between the pipe and the ground.
Closed-loop systems need a heat exchanger between the refrigerant loop and the water loop, and pumps in both loops. Some manufacturers have a separate ground loop fluid pump pack, while some integrate the pumping and valving elements within the heat pump. Expansion tanks and pressure relief valves may be installed on the heated fluid side. Closed-loop systems have lower efficiency than direct exchange systems, so they require longer and larger pipe to be placed in the ground, increasing excavation costs.
Closed-loop tubing can be installed horizontally as a loop field in trenches or vertically as a series of long U-shapes in wells (see Figure A- 24). The size of the loop field depends on the soil type and moisture content, the average ground temperature and the heat loss and or gain characteristics of the building being conditioned. A rough approximation of the initial soil temperature is the average daily temperature for the region.
Some open-loop systems use the water from a body of water, such as a lake, pond, or well. Open-loop systems have disadvantages such as limited water supply and pipe clogging. In either application, the piping is used to transfer the heat.
Components
Ground-source heating systems generally require three main components: the heat exchanger (ground loop), a heat pump (condensing unit) and a distribution system such as air ducts or in-floor tubing.
The heat exchanger or loop is simply a length of tubing placed underground and used to transfer the heat from the ground to the heat pump. The heat pump concentrates the heat using a condensing unit. In the winter, that heat is transferred to the distribution system and released through the building’s air ducting systems or in-floor hot water (hydronic) heating system. The process can be reversed for cooling.
A water-antifreeze mixture is used as the transfer medium between the heat source and heat pump. The heat pump concentrates the heat and disperses it into the home. Household air is never in direct contact with the heat source, be it air, soil or water.
Worldwide Perspective
Heat pumps that extract energy from shallow sources at 10°C to 20°C are being used in 43 countries for space heating and cooling. Home heating is the fastest-

65
growing geothermal energy application, with a global annual growth rate of 20% in 2012. Space heating constitutes 60% of the worldwide use of geothermal RES. In Switzerland for example, one out of three new residential buildings has such a system, and the market is not subsidized by the government.
In 75 countries, geothermal sources from 30°C to 150°C are used for district heating, greenhouses, fisheries, mineral recovery, industrial process heating and spas. Sources with temperatures from 150°C to 300°C are being used by 26 countries for electricity production, with a total global capacity of 11.4 GW in 2012. Electricity generation represents approximately one fifth of the global use of geothermal energy.
Geothermal applications are rarely found in the Middle East and North Africa. High-temperature (up to 200°C) geothermal potential is limited as there are few geologically active zones close to volcanoes or fault zones in the region. These are likely to be restricted to the area running from Suez through the Red Sea toward Africa’s Great Rift Valley along the coasts of Egypt, Saudi Arabia, and Yemen. Turkey also has a good potential due to volcanic activity in the area.
Low-temperature (60°C–120°C) resources are more widespread, but are more difficult and expensive to exploit for electricity generation. However, the hot water they produce can be used for various other purposes, such as heating, domestic hot water, and cooling via absorption chillers. In the MENA area, low-temperature resources are found in Iran. Oman, the United Arab Emirates.

66
Annex B Introduction of the Key actors in the RE Landscape
The renewable energy sector requires several key actors that would lobby and push forward any research, implementation, support scheme, etc… In Lebanon, those key actors are represented by several organizations; their respective activities and roles in advancing the sector are detailed here after.
Association of Lebanese Industries (ALI)
The Association of the Lebanese Industrialists was established in 1942 as the main national association of the manufacturing companies available in Lebanon. It is the official representation and reporter of the industries when dealing with public entities such as the Lebanese Parliament, the Government, the Trade Unions, etc… ALI is involved in economic and social topics affecting the business in Lebanon; furthermore it assists in creating a favorable environment for industrial investments, job creation, growth and development.
In the environment and energy sectors, ALI has been working on several projects and collaborations to provide its members all possible opportunities for a sustainable development and greener production.
ALI has created an Environment and Energy department and the green help desk to support the industries and provide technical assistance. In 2008, it has mobilized funds from GIZ in collaboration with the CDR to implement the “Cleaner Production Options for the Chemical Sector in Lebanon” project. The association provides a list of ISO 14001 certifying bodies and announces the certified industries. ALI is in constant coordination with the Central Bank “to safeguard the national currency in order to ensure the basis for sustained social and economic growth” and raising awareness and assisting in environmental loans.
The Lebanese Association for Energy Saving and For Environment (ALMEE)
The group was established 2 decades ago, and is more commonly known for its French acronym (Associaltion Libanaise pour la Maitrise de l’Energie et pour l’Environment); it is a “non – political and non-profit association”. The association was created with a mandate to assist in the management of energy related topics and its associated economic and policies. ALMEE works with “local, regional and international partners – from governments and multilateral institutions of civil society and the private sector – to buttress calls for more sustainable policies and practices related to energy and environment”.
ALMEE has been involved in several initiatives feeding into the energy and environment sectors, such as the development of a rating system for new built “GRASS”, in addition to collaborating on several EU projects, to name a few: CLEANERTEC, where ALMEE implemented pilot projects, assisted in developing policies and raising awareness. RESSOL, which aims at engaging the beneficiaries “in high quality research and, thus impacting on the national energy efficiency and renewable policies”. Other initiatives are in progress in cooperation with organizations such as UNIDO, UNDP, ADEME (Agence de l’Environnement et de la Maîtrise de l’Energie), Euopean Bureau of Environment, etc…
Industrial Research Institute (IRI)
The institute was established in 1953 as a Lebanese institution for scientific research, testing and analysis as well as industrial research. The institute is a not – for – profit organization as of 1955, directly linked to the Ministry of Industry but with financial and administrative autonomy. The institute’s mandate covers research relevant to establishing new industries, providing international scientific level in testing and analyzing quality of locally produced equipment, etc…
Furthermore, the institute provides technical support to industries and academic bodies through its permanent body of experts, the available dedicated laboratories with specialized equipment in several fields. In addition to the institute, housed at the Lebanese University in Hadath has an extensive library with scientific and technical publications. IRI is the “sole notified Conformity Assessment Body in Lebanon”.
Part of cooperation with the UNIDO, MOE and the EU, the Lebanese Cleaner Production Center (LCPC) was established “to secure sustained support and innovation to the manufacturing industry”. Last, but not least, the institute is able of issuing technical standards and coordinates closely with the Lebanese Standard Institution (LIBNOR) on national standards and specifications. In 2011, the Euro – Lebanese Center for Industrial Modernization (ELCIM) was established with a mission to better the production process in Lebanese enterprises.
Lebanon Green Building Council (LGBC)
The LGBC was founded in 2009 as a not – for – profit organization affiliated to the World Green Building Council (WGBC). As per the WGBC procedure, LGBC gained its member status in 2014 after completing a number of initiatives such as awareness raising, participating in international events, workshops, and exhibitions. The council was created to promote and support “the sustainable building industry”. Through its varied committees (technical, awareness, events, membership, etc…) the council aims at promoting and raising awareness at the various available green rating schemes (LEED, BREEAM, ARZ). In addition, LGBC works to identify, develop and promote solutions the complete stages of building construction to achieve sustainability and ensure its environmental friendly status. For instance, fact sheets are developed
67
identifying singular elements in building construction, detailing their importance and their sustainable features.
Furthermore, the council with the coordination of IFP has developed the Lebanese rating system ARZ for existing commercial buildings. The ARZ system is tailor made for the Lebanese climate and social background, it aims at ensuring the current available building stock is in fact up to required standards.
In coordination with their mandate, the council is coordinating closely with the order of engineers and the Ministry of Works to update and review the new construction law, taking into consideration the inclusion of residential renewable energy systems and energy efficiency measures.
The Lebanese Standards Institution (LIBNOR)
LIBNOR is a public institution established in 1962, affiliated to the Ministry of Industry and aiming at preparing, publishing and amending national standards. It is the sole agency allowed to grant the Lebanese Conformity mark NL. LIBNOR has a technical committee composed of various stakeholders that set the “dimensions, conventions, symbols and the definition of products quality, as well as the methods of testing and analysis”. LIBNOR is a member of international organization representing Lebanon, such as the International Organization for Standardization (ISO). In Lebanon, standards are voluntary unless for health and safety reasons it is rendered mandatory through a decree by the Council of Ministers.
The Institution works on promoting the standards and offers “training programs and conformity assessment schemes”.
LIBNOR has been actively working on several standards related to renewable energy, energy efficiency and environment and is part of several international work packages for international standards on footprint. LIBNOR has already worked on solar water heater standards; works on photovoltaic standards are ongoing. Furthermore, a labelling scheme have been drafted in close collaboration by various stakeholders in the field, the document is still under review and pending approval.
Lebanese Solar Energy Society (LSES)
The LSES was established in 1980 by a group of engineers highly involved in solar energy applications. The society aimed at contributing to the ongoing research, promoting and raising awareness on solar energy related topics and contributes through educational and demonstration projects. LSES is affiliated to the International Solar Energy Society (ISES) in the United States and actively participates in its board meetings.
The society is present in major conferences and exhibitions through its members and contributes to raising awareness to issues that would stimulate the renewable energy market in Lebanon whether through the organization of dedicated conference on “Net Metering in Practice” for the young professionals and experts in the field or through their presence moderating sessions at conferences such as the Beirut Energy Forum. A particular project for the LSES in collaboration with IRI under the patronage of the Ministry of Energy and Water and the Ministry of Industry, the EcoTruck; the truck was equipped by renewable energy systems such as solar panels, micro – wind turbine, etc… aiming at demonstrating their performance to Lebanese students. The truck completed several site visits to schools, universities and other education institutions to spread awareness.
LSES through its committees provides support to students and professionals wanting to delve more into the renewable energy potential in Lebanon.
United Nations Industrial Development Organization (UNIDO)
UNIDO is the United Nation’s specialized for industrial development; it aims to “promote and accelerate inclusive and sustainable industrial development in developing countries and economies in transition”. The mandate is achieved through various categories of services, whether in the form of “technical cooperation, analytical and policy advisory services, standard setting and compliance and a convening function for knowledge transfer and networking”.
UNIDO was established in 1966 when the UN general assembly passed resolution 2152 (XXI) and Mr. Ibrahim Helmi Abdel – Rahman from Egypt was nominated as Secretary – General. UNIDO aimed at promoting and fast-tracking the industrialization of developing countries. The current role and functions of UNIDO have been set and adopted in 1997 “to better respond to the changing global economic environment”.
Assistance is provided in economic, capacity building and energy and environment fields. Energy is a cornerstone for poverty reduction and sustainable development whether in its production or consumption patterns. to this end, UNIDO acts as a “leading provider of services for improved industrial energy efficiency and sustainability”, it therefore provides assistance institutions in implementing measures to reduce the energy cost burden and hence enhance productivity, an initiative that feeds into three of the identified MDGs (Millennium Development Goals), eradicate extreme poverty and hunger through job creation and competitiveness, ensure environmental protection through the various measures and develop a global partnership for development through the exchanges.

68
Annex C Interview Methodology
Following a review of all available national and international documentation on RES, in-depth one – on – one interviews were conducted with numerous stakeholders involved in the RE process. Interviewees represented UNIDO (Nada Sabra), Lebanese government agencies including, IRI (Imad Hajj Chehade, Mohammad Hajjar), MOE (Vahakn Kabakian), MOEW (Joseph El Assaad), and MOI (Dany Gedeon, Charles El Abboud), and NGOs including: ALI, LCEC, the Lebanese Association for Energy Saving & for Environment, LIBNOR, and many universities. These interviews helped identify projects underway, the different types of support available, and the potential for RES in Lebanon.
Next, a mapping exercise was conducted to identify businesses involved in the assembly, manufacture, and import of RES. Once identified, InfoPro conducted face to face interviews of 10 RES manufacturers and 26 companies that import and assemble RES (see Table C- 1)
Table C-1: Companies Interviewed
Manufacturers Importers
Electro Mechanic Est. Alecico
Ghaddar Trade and Industry Asaco
Itani Company for Industry and Trade Climapure Technology
Mawared and Construction Co. (Kypros) Contra International
Phoenix Energy Dawtec
Saad-El-Deen General Trade Est. DK Energy Systems
Smartec Technologies Earth Technologies
Sun Island Eco Friendly Limited
Sunshine Company EKT Katranji
Tofaily Solar Energy Elements Sun & Wind
Green Arms Lebanon
Green Dot
Green Energy
Habash Electrical and Hybrid Technologies
LEBECO
Mecha Basics Industries
Midware Data Systems (Ecosys division)
MUST (By to perfection)
National Energy Consultants
Nature Énergie
Panoramic Solar
Site Technology
Solar World (Kanaan Trading)
Solarnet
Soltech Lebanon (Solar & Energy Saving Products)
Tabbara General Company
The in-depth interviews with business stakeholders assessed the supply and demand of RES, the availability of labor with expertise in RES, and available infrastructure.
InfoPro’s RE and economic experts conducted a review of all RES and their economic feasibility then compared the current situation against what is needed across all RES facets.Following a review of this report by UNDP-CEDRO, InfoPro (the consultant), in coordination with UNDP-CEDRO, scheduled another round of meetings with the various stakeholders to inform them of the study results on RES feasibility and the needed measures. The stakeholders informed the consultant of their current and potential capabilities in supplying the requirements. The final selection of RES to be recommended as per their potential was based on the feedback of all stakeholders.
The consultant wrote this final report to highlight the technical, economic, and legal aspects that should be considered for the study of the RE sector and provide recommendations for its growth in Lebanon.

69
Annex D RES University Courses and Programs
Table D-1: RES University Courses and Programs
UniversityGraduate (G)/
undergraduate (U) program
Courses Educational program
AUB G • Renewable Energy Potential, Technology, and Utilization in Buildings
• RES
• Laboratory for Renewable Energy in Buildings
• Energy Audit Lab
• Solar Energy
• Heat pumps
• Solar Electricity
• Numerical Methods in Energy Technology
Master of mechanical engineering in applied energy
U • Solar Energy
• Energy Economic and Policy
• Solar Electricity
• Power System Planning
• Environmental Issues of Energy Systems
• Energy Audit Lab
• RES
Ph.D. or master of engineering in electrical and computer engineering
BAU U • Solar Energy
• Renewable Energy (including nuclear energy)
• Solar Power Stations
Bachelor of mechanical Engineering
• Power Electronics II
• (including solar energy)
•Wind Energy (electric drives)
Bachelor of electrical engineering
LAU U Renewable Energy Resources (technical elective) Bachelor of electrical engineering
G • Green Economy, Policies and Law
• Green Technologies System Approach to Sustainability and Management
• Solar Radiation and Solar Electricity Using PV Technology
•Wind Energy: Wind Turbines and Wind Farms and Siting
• Energy Storage Technologies
• Solar Thermal Energy Conversion
• Biofuels
•Waves, Tidal, and Hydro Renewable -Energy
• Energy Efficiency in Buildings ---Evaluation and Design
• Energy Efficiency in Agriculture Evaluation and Design
• Hybrid Renewable Energy Lab
• Energy Systems & Sustainable Environments

70
UniversityGraduate (G)/
undergraduate (U) program
Courses Educational program
LAU G •Waste to Energy Processes and Technologies
• Renewable Energy Projects Evaluation and Market Analysis
• Energy Audit Lab
• Low-Energy Architecture and Passive Building Design
• Sustainable Building Materials
• Renewable Energy Systems and Energy Efficiency in Buildings
•Moisture and Control of Humidity in Buildings
• Construction and Demolition Management
•Modular Building Construction
• Green Building Basics and Building Rating Practices
• Sustainable Restoration of Existing Building
• Building Physics Lab
• HVAC Systems for Energy Efficient Acclimatization
• Building Management Systems (BMS)
• Heat Pumps and Innovative Methods to Improve Performance with Direct Applications
• HVAC Lab
• Building Energy System Modeling
• Instrumentation
•Water Essentials
• Smart Irrigation
•Water Treatment
•Wastewater Treatment
•Wastewater Treatment Plant Design
•Water Networks Design
•Wastewater Networks Design
• Sludge Treatment
• Basic operations of Wastewater Treatment Plants
•Water Resources Planning and Management
• Desalination
• Sustainable Water Management
• Life Cycle Assessment
• Energy Conversion & Storage
• Energy Systems Integration
• Research skills development - General
• Innovation and Knowledge Transfer I: Entrepreneurs
• Innovation and Knowledge Transfer I: Concept to commercialization
• Global Sustainable Business Management
• Cost-Benefit Analysis
• Project Management, Risk Management and Planning
PRO-GREEN
professional / graduate diploma in green technologies
Joint or dual professional graduate diploma in green technologies between the School of Engineering (LAU) and the Faculty of Engineering and Architecture and the Munib and Angela Masri Institute of Energy and Natural resources (AUB)

71
UniversityGraduate (G)/
undergraduate (U) program
Courses Educational program
LU U • Power Electronics
• Networking and power networks
• RES-related academic projects
Bachelor of electrical engineering
• Thermal Conversion
• RES-related academic projects
Bachelor of mechanical Engineering
LU (Branch I)
U • Green Buildings
• Energy Management
Bachelor of civil engineering
NDU U • Solar Energy
• Thermodynamics
• Energy Conversion systems (including wind energy, geothermal, solar energy, hydraulic, fuel cells, etc.)
• Capstone courses (Final project)
• Thermal Lab
Bachelor of mechanical engineering
USEK G • Renewable Energy
• - Lab (Renewable Energy)
Master of electrical engineering
• Biomass
•Wind Energy
• Solar Energy
Master of mechanical engineering
USJ G • Energy Efficiency
•Wind Energy
• Hydropower
• Solar Energy
• Bioenergy
• Energy Storage
• Renewable Energy Porjects Evaluation
• Renewable Energy Seminars
• Distributed Generation Systems
• Advanced Power Electronics
• Thermal and thermodynamic conversion systems
•Modeling and optimization of thermal systems
• Low energy buildings
• Green Buildings
Master in renewable energy
Joint or dual graduate program between USJ and LU
U Human Energy (technical elective) Bachelor of electrical engineering

72
Annex ENumber of University Graduates from RES Courses and Programs
Table E-1:Number of University Graduates from RES Courses and Programs
University Educational program No. of graduates/y No. of graduates since launch
USJ
Master in renewable energy
Joint graduate program between USJ & LU23 36
Bachelor of electrical engineering 30 - 35 90 -105
AUB
Master of mechanical engineering in applied energy 25 150
Ph.D. or master of engineering in electrical and computer engineering n.d. n.d.
BAUBachelor of mechanical engineering 90 270
Bachelor of electrical engineering 35 100–110
LAU
Bachelor of electrical engineering 29 29
PRO-GREEN professional/graduate diploma in green technologies
Joint graduate program between LAU and AUB24
0 launched in Feb 2015
LU
Bachelor of electrical engineering23 - 35 250 - 300
Bachelor of mechanical engineering 23 - 35 250 - 300
Bachelor of civil engineering30 - 55 400 - 500
NDU Bachelor of mechanical engineering n.d. n.d.
USEKMaster of electrical engineering 20 - 30 >80
Master of mechanical engineering 12 20
Approximate Total 350 1,800

73
Annex F Types and Prices of Locally-Manufactured
and Imported RES and ComponentsTable F-1: Manufacturers RES and Components Produced and Sold
Manufacturer name
RESRES components
Current annual No. of produced items
Max annual number of produced items
No. of items sold/yNo. of items sold
since the launch of the company
Electro mechanic Est.
SWH TanksTanks = <200 units
Tanks = 3,650 units/y (equivalent to 10 tanks/d max)
Tanks = <200 units/yTanks = >1,000 tanksSWH Stands
Ghaddar Trade and Industry
SWH (Thermosiphon) Tanks Tanks = 420 units/y (sold as components or integrated in whole systems)
Tanks = 600 units/y (sold as components or integrated in whole systems)
Tanks = 420 units/yTanks = >5,000 tanks
SWH (Thermosiphon) Stands
Itani Company for Industry and Trade
SWH (whole system) n/a n/a n/a Tanks and whole systems = >3,600 units/y
Tanks and whole systems = >14,000 units
SWH (Thermosiphon) TanksTanks = 3,600 units Tanks = 7,800 units
SWH (split systems) Tanks
Mawared and Construction Co. (Kypros)
SWH Tanks Tanks = 2,200 units/y Tanks = 4,400 units/yTanks = 2,200 units per units
Tanks = >30,000 units
Phoenix Energy
SWH (whole system)
n/aSWH (whole system) = 5 systems/d or 1,500 systems/y
SWH (whole system)(×2) = 10 systems/d or 3,000 systems/y
SWH (whole system) = 350 systems/y
SWH (whole system) = >2,000 systems
CSPConcentrator and Generator
n/a n/a n/a n/a
Saad-El-Deen General Trade Est.
SWH TanksTanks = 2,000 units Tanks = 4,000 units
Tanks = 1,200 to 2,000 units/y
Do not knowSWH Solar panels
Smartec Technologies
Solar PVInverters
Inverters = >300 unitsInverters = >1,000 units (at full capacity)
Inverters = >300 units+/y
Inverters = >4,000 units+ (LB and abroad)
Solar PV Controllers Controllers = 100 unitsControllers = >1,000 units (at full capacity)
Controllers = 100 units/y
Controllers = 200 units
Wind power Tower n/a n/a n/a n/a
Sun IslandSWH Tanks Tanks = 360–480 units Tanks = 660–960 units
Tanks = 360 - 480 units
Tanks = >4,000 units
SWH Stands Stands = 840 unitsStands = Up to 2,000 units (if required)
Stands = 840 unitsStands = >5,000 units
Sunshine Company
SWH (whole system) n/a
n.d. n.d.
SWH (whole systems) = 200 systems/y
n.d.SWH Tanks
n/aSWH Solar collector
Tofaily Solar Energy
SWH (Thermosiphon) Tanks Tanks = 8,030 units (equivalent to 20–25 tanks/ d)
Tanks = >30,000 units (equivalent to 100 tanks/d).
n.d. n.d.SWH (split systems) Tanks
Notes: d (day), n/a (not applicable),n.d.(no data), y (year)

74
Table F-2: Manufacturer Product Prices
Manufacturer name RES RES components Prices (USD)
Electro mechanic est. SWH (whole system) Tanks Whole system: SWH (tank = 150 L) = 500(1)
Whole system: SWH (tank = 200 L) = 650(1)
Whole system: SWH (tank = 250 L) = 850(1)
Whole system: SWH (tank = 300 L) = 950(1)
Ghaddar Trade and Industry SWH (whole system)
Model 1.1 (Thermosiphon SWH - SF100/1): Open loop system, 100 L including one mirror (93×193) = 780(2) Model 1.2 (Thermosiphon SWH - SF100/1): Close loop system, 100 L including one mirror (93×193) = 870(2)
Model 1.3 (Thermosiphon SWH - SF200/2): Open loop system, 200 L including two mirrors (93×193) = 1,190(2) Model 1.4 (Thermosiphon SWH - SF200/2): Close loop system, 200 L including two mirrors (93×193) = 1,300(2) Model 1.5 (Thermosiphon SWH - SF200/2): Open loop system + Heat exchanger, 200 L including two mirrors (93×193) = 1,250(2) Model 1.6 (Thermosiphon SWH - SF200/2): Close loop system + Heat exchanger, 200 L including two mirrors (93×193) = 1,370(2)
Model 1.7 (Thermosiphon SWH - SF300/2): Open loop system, 300 L including two mirrors (93×193) = 1290(2) Model 1.8 (Thermosiphon SWH - SF300/2): Close loop system, 300 L including 2 mirrors (93×193) = 1420(2) Model 1.9 (Thermosiphon SWH - SF300/2): Open loop system + Heat exchanger, 300 L including two mirrors (93×193) = 1370(2) Model 1.10 (Thermosiphon SWH - SF300/2): Close loop system + Heat exchanger, 300 L including two mirrors (93×193) = 1500(2)
Model 1.11 (Thermosiphon SWH - SF300/3): Open loop system, 300 L including three mirrors (93×193) = 1620(2) Model 1.12 (Thermosiphon SWH - SF300/3): Close loop system, 300 L including three mirrors (93×193) = 1750(2) Model 1.13 (Thermosiphon SWH - SF300/3): Open loop system + Heat exchanger, 300 L including three mirrors (93×193) = 1680(2) Model 1.14 (Thermosiphon SWH - SF300/3): Close loop system + Heat exchanger, 300 L including three mirrors (93×193) = 1830(2)
Model 1.15 (Thermosiphon SWH - SFS150/1): Close loop system, 150 L including one mirror - Selective Blue (125×200) = 1100(2) Model 1.16 (Thermosiphon SWH - SFS150/1): Close loop system + Heat exchanger, 150 L including one mirror - Selective Blue (125×200) = 1150(2)
Model 1.17 (Thermosiphon SWH - SFS200/1): Close loop system, 200 L including one mirror - Selective Blue (125×200) = 1200(2) Model 1.18 (Thermosiphon SWH - SFS200/1): Close loop system + Heat exchanger, 200 L including one mirror - Selective Blue (125×200) = 1250(2)
Model 1.19 (Thermosiphon SWH - SFS300/2): Close loop system, 300 L including two mirrors - Selective Blue (125×200) = 1750(2) Model 1.20 (Thermosiphon SWH - SFS300/2): Close loop system + Heat exchanger, 300 L including two mirrors - Selective Blue (125×200) = 1830(2)

75
Manufacturer name RES RES components Prices (USD)
Ghaddar Trade and Industry SWH (Thermosiphon) Tanks Model 1.1 (HDW: 100–300 L) = 225–400(2)
Model 1.2 (HDW: 100–300 L) = 240–460(2)
Model 1.3 (HDW: 100–300 L) = 255–460(2)
Model 1.4 (HDW: 100–300 L) = 270–520(2)
Model 2.1 (VDWHE: 100–300 L) = 290–495(2)
Model 2.2 (VDWHE: 100–300 L) = 295–555(2)
Model 2.3 (VDWHE: 100–300 L) = 325–570(2)
Model 2.4 (VDWHE: 100–300 L) = 340–630(2)
Model 3.1 (HDWHE: 100–300 L) = 265–480(2)
Model 3.2 (HDWHE: 100–300 L) = 280–540(2)
Model 3.3 (HDWHE: 100–300 L) = 310–555(2)
Model 3.4 (HDWHE: 100–300 L) = 325–615(2)
Itani Company for Industry and Trade
SWH (Thermosiphon) Tanks Model 1 (SHSD = 150–300 L) = 300–450
Model 2 (SHSDH = 150–300 L) = 350–575
SWH (split systems) Model 1 (SVDH = 150–500 L) = 375–1,150
Model 2 (SVOH = 150–500 L) = 300–1,000.
Model 3 (SHDH = 150–400 L) = 350–1,000
Mawared and Construction Co. (Kypros)
SWH (whole system) Tanks Whole system:
Model 1 (tank = 200 L) = 800–1,600 (The price changes based on the type of solar collector-tank size combination) Model 2 (tank = 300 L) = 1,100–1,900 (The price changes based on the type of solar collector-tank combination)
Solar collectors
Stands
Phoenix Energy SWH (whole system) n/a Whole system: Model (Solior FL150 T SWH) = 1600(3)
Saad-El-Deen General Trade Est. SWH Tanks Tanks: SWH (tanks: 150–300 L) = 150–500
Smartec Technologies Solar PV Solar PV Price (Model 1: iPS 3700-24) = 650
Inverters Price (Model 2: iPS 7000-48) = 1,500
Price (Model 3: iPS 1600-12) = 350
Price (Model 4: iPS 1600-24) = 350
Controllers Price (Model 1: 12V) = 40 Price (Model 2: 24V) = 80 Price (Model 3: 48V) = 220
Sun Island SWH (whole system) Tanks Whole systems (Thermosiphon SWH): SWH (tank = 200 L) = 800–900 (systems with vacuum tubes) SWH (tank = 200 L) = 1,500–1,700 (systems with flat plates)
Tanks Whole systems (Thermosiphon SWH): SWH (tank = 300 L) = 1,100–1,300 (SWH systems with vacuum tubes) SWH (tank = 300 L) = 2,000–2,200 (SWH systems with flat plates)
SWH Stands Stands = 125–175
Sunshine Company SWH (whole system) n/a Whole system: SWH (tank size = 200 L) = 1,500 SWH (tank size = 300 L) = 2,500
SWH Tanks
SWH Tanks
SWH Solar collectors
SWH Solar collector

76
Manufacturer name RES RES components Prices (USD)
Tofaily Solar Energy SWH (whole system) n/a Whole systems (Thermosiphon SWH - Residential use): *In general, these prices apply to both models of Thermosiphon SWH SWH (tank = 150 L; S 304† ) = 450 SWH (tank = 180 L; S 304†) = 550 SWH (tank = 200 L; S 304†) = 650 SWH (tank = 250 L; S 304†) = 650 SWH (tank = 280 L; S 304†) = 850 SWH (tank = 300 L; S 304†) = 900 SWH (tank = 150 L; S 304‡) = 550 SWH (tank = 180 L; S 304‡) = 650 SWH (tank = 200 L; S 304‡) = 750 SWH (tank = 250 L; S 304‡) = 900 SWH (tank = 280 L; S 304‡) = 950 SWH (tank = 300 L; S 304‡) = 1000 SWH (tank = 150 L; 316L§) = 700 SWH (tank = 180 L; 316L§) = 800 SWH (tank = 200 L; 316L§) = 900 SWH (tank = 250 L; 316L§) = 1100 SWH (tank = 280 L; 316L§) = 1200 SWH (tank = 300 L; 316L§) = 1250
SWH (Thermosiphon) Tanks
SWH (Thermosiphon) Tanks
Notes: *(?), † (three-year warranty), ‡ (five-year warranty), § (seven-year warranty), (1): (incl. installation), (2): (excl. VAT), (3): (excl. installation)
Table F-3: SWH Importing
Importer name
SWH components
Specification Brands Origin No. sold//yNo. sold since
company launch
Prices (USD)
Alecico Model (whole system): Thermosiphon
n/a n/a n.d. n.d. Whole systems (Thermosiphon): (100 L) = 650; (500 L) = 2,000Vacuum
tubesThermosiphon = 100–500 L
Sunshine CN
Tanks Sunshine CN
Tanks n/a n/a
Climapure Technology
Model 1 (Whole system): Pressurized systems Model 2 (Whole system): Non pressurized systems
n/a n/a 120-150 systems
> 400 systems *Model 2: Non-pressurized systems (150 L) = 1,000 *Model 1: Pressurized systems (150 L) = 1,400 *Model 2: Non-pressurized systems (210 L) = 1,200 *Model 1: Pressurized systems (210 L) = n.d. *Model 2: Non-pressurized systems (250 L) = 1,350 *Model 1: Pressurized systems (250 L) = 1,800 *Model 2: Non-pressurized systems (300 L) = 1,500 *Model 1: Pressurized systems (300 L) = 2,200
Tanks Model 1: 150 L Suntask CN
Model 2: 210 L
Model 3: 250 L
Model 4: 300 L
Vacuum Tubes n.d.
Magnesium Anode
Magnesium anode = n.d.

77
Importer name
SWH components
Specification Brands Origin No. sold//yNo. sold since
company launch
Prices (USD)
Contra International
Model 1: (shole system): Theromodynamic (Énergie) Model 2: (Whole system): Conventional
Contra International
CN and ES
(Whole systems) = 100–150 projects
(Whole systems) = n.d.
Model 1 (Thermodynamic systems) = 1,600–1,800 € (equivalent to USD 1,454 – 1,636). Model 2 (conventional systems) (1) Pressurized systems = 800–1,100 (3) Non pressurized systems = 300–500 NB. These prices apply to a 200 l tank size.
Dawtec
Tanks
Thermosiphon Deema series: 6 models (n.d.n.d.).
Kodsan TR 40 big projects n/a Thermosiphon Deema series (200–300 L) = 1,600–1,800.
Vacuum tubes Kuzeysan TR
Flat plate collector
Maximus GR
Pergola Vacuum tubes
Vacuum tubes = n.d. Kuzeysan TR Pergolas = 15 systems
Pergola = 300/m2
DK Energy Systems
Tanks and vacuum tubes
Model 1 (Whole system): Non-pressurized = 90–360 L
DK energy systems
CN (Model 1, 2, 3, and 4) = 70–90 systems
(Model 1, 2, 3, and 4) = 330 systems
Model 1 (Whole system): (non-pressurized; 90–360 L) = 275–760(1)
Model 2 (Whole system): Pressurized = 150–300 L
Model 2 (Whole system): (pressurized—150–300 L) = 645–1290(1)
Model 3 (Whole system): Fully pressurized = 200–400 L
Model 3 (Whole system): (fully pressurized—200–400 L) = 1153–1683(1)
Model 4 (whole system): Split systems = 300–500 L
n.d.
Earth Technologies
Model 1: Thermosiphon (Open system: non pressurized) Model 2: Forced-circulation systems (Closed system: pressurized).
(own system): Earth technology
n/a 150–250 systems
n.d. (Model 1 = 200 L) = 1,600 (Model 2 = 300 L) = 2,300
Tanks Model 1: 200 L Model 2: 300 L
TR
Panels (Standard sizes for residential use mainly)
Eco Friendly Limited
Model 1 (Whole system): Thermosiphon (non-pressurized) Model 2 (Whole system): Forced-circulation (pressurized).
n/a CN 36–48 systems/y (3–4 systems/m)
> 100 systems: at first, 3–4 systems//y. Now, 3–4 systems/m
(200–300 L) = 2,000 (including installation cost)
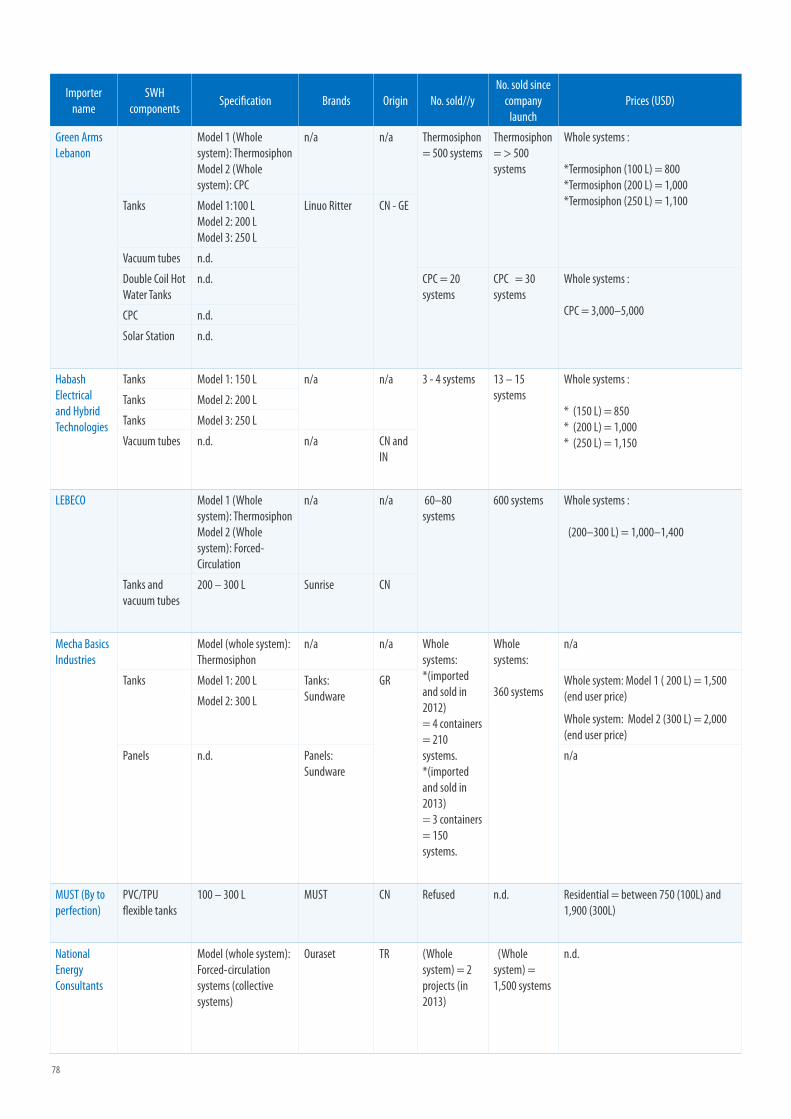
78
Importer name
SWH components
Specification Brands Origin No. sold//yNo. sold since
company launch
Prices (USD)
Green Arms Lebanon
Model 1 (Whole system): Thermosiphon Model 2 (Whole system): CPC
n/a n/a Thermosiphon = 500 systems
Thermosiphon = > 500 systems
Whole systems : *Termosiphon (100 L) = 800 *Termosiphon (200 L) = 1,000 *Termosiphon (250 L) = 1,100Tanks Model 1:100 L
Model 2: 200 L Model 3: 250 L
Linuo Ritter CN - GE
Vacuum tubes n.d.
Double Coil Hot Water Tanks
n.d. CPC = 20 systems
CPC = 30 systems
Whole systems : CPC = 3,000–5,000CPC n.d.
Solar Station n.d.
Habash Electrical and Hybrid Technologies
Tanks Model 1: 150 L n/a n/a 3 - 4 systems 13 – 15 systems
Whole systems : * (150 L) = 850 * (200 L) = 1,000 * (250 L) = 1,150
Tanks Model 2: 200 L
Tanks Model 3: 250 L
Vacuum tubes n.d. n/a CN and IN
LEBECO Model 1 (Whole system): Thermosiphon Model 2 (Whole system): Forced-Circulation
n/a n/a 60–80 systems
600 systems Whole systems : (200–300 L) = 1,000–1,400
Tanks and vacuum tubes
200 – 300 L Sunrise CN
Mecha Basics Industries
Model (whole system): Thermosiphon
n/a n/a Whole systems: *(imported and sold in 2012) = 4 containers = 210 systems. *(imported and sold in 2013) = 3 containers = 150 systems.
Whole systems: 360 systems
n/a
Tanks Model 1: 200 L Tanks: Sundware
GR Whole system: Model 1 ( 200 L) = 1,500 (end user price)
Whole system: Model 2 (300 L) = 2,000 (end user price)
Model 2: 300 L
Panels n.d. Panels: Sundware
n/a
MUST (By to perfection)
PVC/TPU flexible tanks
100 – 300 L MUST CN Refused n.d. Residential = between 750 (100L) and 1,900 (300L)
National Energy Consultants
Model (whole system): Forced-circulation systems (collective systems)
Ouraset TR (Whole system) = 2 projects (in 2013)
(Whole system) = 1,500 systems
n.d.

79
Importer name
SWH components
Specification Brands Origin No. sold//yNo. sold since
company launch
Prices (USD)
Nature Énergie
Model 1 (Whole system): Thermosiphon Model 2 (Whole system): Forced-Circulation
n/a n/a SWH and PV = 10 big projects and 50 small projects
SWH and PV (projects) = 40 big projects and 200 small projects
*Thermosiphon (200 L) = 700 (vacuum tubes, CN) and 1,500 (including two mirrors selective collector, Turkish or Greek) *Thermosiphon (300 L) = In between 2,300 and 2,500. *Forced-circulation (variable capacities) = n.d.
Tanks Model 1: Thermosiphon (tank size) = 200 L ModeL 2: Thermosiphon (tank size) = 300 l
Kodsan TR
Solar Collectors Model 1: = Flat Turkish collector Model 2: = Flat Greek collector
*Ouraset (TR) *Soley (GR)
TR and GR
Controllers n.d. Resol GE
Vacuum Tubes n.d. Linuo Ritter GE and CN
Solar World (Kanaan Trading)
Model 1 (Whole system): Thermosiphon systems Model 2 (Whole system): Forced-circulation systems
Solar World GE, CN,TR
>500 systems > 30,000 systems
(300 L) = >3000
Tanks four models/sizes (n.d.) Kodsan TR (tank size) = 300 L
Panels threemodels/capacities (n.d.)
E-Stek and Riposol
TR and GE
(PV panels) = 1,300–2,600;
Vacuum tubes 4–5 models (n.d.) Sky solar CN (Vacuum tubes) = 500–2,000
Solarnet Panels 7 models (n.d.). Sunrain (CN), Ouraset (TR) Phoenix (GE)
CN, TR, GE
200 small projects and 10 big projects. Two different markets: residential (small projects) and non-residential/collective/commercial (big projects).
n.d. Whole systems: (100 to 500 l) = 1,000–3,000 (residential use); (above 500 l) = 10,000–300,000 (collective use)
Tanks 200 to 300 l (residential use)
500 L, & 1,000–2,000 L (commercial use)
*Phoenix (GE) *No brand name (LB)
GE
Controllers n.d. Resol (GE) and Full gauge (BR)
GE, BR
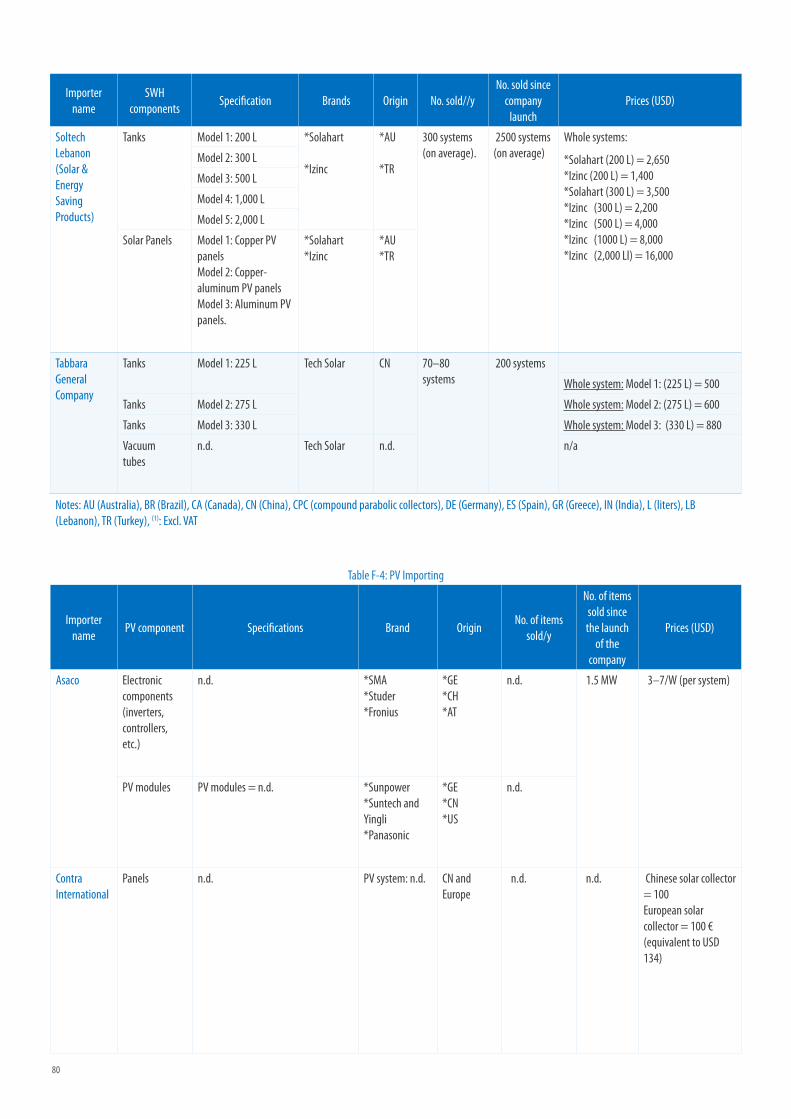
80
Importer name
SWH components
Specification Brands Origin No. sold//yNo. sold since
company launch
Prices (USD)
Soltech Lebanon (Solar & Energy Saving Products)
Tanks Model 1: 200 L *Solahart *Izinc
*AU *TR
300 systems (on average).
2500 systems (on average)
Whole systems:
*Solahart (200 L) = 2,650 *Izinc (200 L) = 1,400 *Solahart (300 L) = 3,500 *Izinc (300 L) = 2,200 *Izinc (500 L) = 4,000 *Izinc (1000 L) = 8,000 *Izinc (2,000 Ll) = 16,000
Model 2: 300 L
Model 3: 500 L
Model 4: 1,000 L
Model 5: 2,000 L
Solar Panels Model 1: Copper PV panels Model 2: Copper-aluminum PV panels Model 3: Aluminum PV panels.
*Solahart *Izinc
*AU *TR
Tabbara General Company
Tanks Model 1: 225 L Tech Solar CN 70–80 systems
200 systems
Whole system: Model 1: (225 L) = 500
Tanks Model 2: 275 L Whole system: Model 2: (275 L) = 600
Tanks Model 3: 330 L Whole system: Model 3: (330 L) = 880
Vacuum tubes
n.d. Tech Solar n.d. n/a
Notes: AU (Australia), BR (Brazil), CA (Canada), CN (China), CPC (compound parabolic collectors), DE (Germany), ES (Spain), GR (Greece), IN (India), L (liters), LB (Lebanon), TR (Turkey), (1): Excl. VAT
Table F-4: PV Importing
Importer name
PV component Specifications Brand OriginNo. of items
sold/y
No. of items sold since the launch
of the company
Prices (USD)
Asaco Electronic components (inverters, controllers, etc.)
n.d. *SMA *Studer *Fronius
*GE *CH *AT
n.d. 1.5 MW 3–7/W (per system)
PV modules PV modules = n.d. *Sunpower *Suntech and Yingli *Panasonic
*GE *CN *US
n.d.
Contra International
Panels n.d. PV system: n.d. CN and Europe
n.d. n.d. Chinese solar collector = 100 European solar collector = 100 € (equivalent to USD 134)

81
Importer name
PV component Specifications Brand OriginNo. of items
sold/y
No. of items sold since the launch
of the company
Prices (USD)
Dawtec Pergola Vacuum tubes
Vacuum tubes = n.d. Kuzeysan TR Pergolas = 15 systems
n/a Pergola = 300/m2
PV panels PV system (whole system) = 1,000 W Xyhe CN 7–8 projects (residential and/or commerical applications)
*PV panel (250 w) = 415 *PV system (street lighting) = 2,000 (60 W capacity) *PV system (residential/power generation) = 3–4 per W (on grid systems).
Inverters Power - one
Controllers OutBack
DK Energy Systems
Panels, converters, inverters & batteries
Model (PV_systems) = 1–10 A DK energy systems
CN 0 0 *PV_systems (panel-converter-inverter) = 700–800 (1 ampere) *PV_systems (panel-converter-inverter) = 6,000 (5 A) *PV_systems (panel-converter-inverter) = 8,000–9,000 (10 A)
Earth Techno-logies
Panels *PV_panels: 20 models (n.d.). Panels: Trina solar & Jinco solar (European brands)
CN *Solar_PV = 35–50 systems *PV_street lighting = 1,000–1,500 systems.
n.d. *PV_solar systems (number of kW per hour) = 1,000–10 million. *PV_street lighting systems = 1,500–2,500.
Inverters Inverters: Power-one (exclusive distributors)
GE and IT
Controllers Controllers: Outback
US
Batteries n.d. n.d.

82
Importer name
PV component Specifications Brand OriginNo. of items
sold/y
No. of items sold since the launch
of the company
Prices (USD)
Eco Friendly Limited
Panels PV system (capacity): 200–5,000 w Sunpower, Bosch, and Conergy (GE); M Prime (PT) and various Chinese brands
GE, Portugal and CN
3–4 systems > 10 systems (on average)
6 per W (including batteries, etc.)
Inverters SMA (GE), Power-one (US), and Studer (Swiss)
GE, US and CH
Chargers SMA (GE), OutBack, and Flexmax (US)
GE and US
Batteries Powertech (locally supplied, but from South Africa)
ZA
EKT Katranji Solar panels & other components
*PV panels: 45, 60, 90, and 120 w (= 12 V). *PV panels: 290 w (= 24 V)
*PV panels: Panasonic. *Other components: CN (n.d.).
US and CN 50 systems (Residential application)
200 systems
PV panels (depends on capacity) = 100–800
Elements Sun & Wind
PV_thermal Panel + inverter
n.d. Refer to technical catalogue (elements sun & wind)
Refer to catalogue (Elements Sun & Wind)
All RES = 25 projects
n.d. PV thermal systems (multiple usage, mainly residential) = 5000.
Solar_PV (Whole system)
Agricultural application: Model 1 (PV system): Fuji electric system Model 2 (PV system): PV pumping system Refer to technical sheet (Elements Sun & Wind).
*SMA and REFUsol (GE) *Philadelphia solar (JO)
*GE *JO
Project (Solar PV pumping systems - Agriculture) = 50,000–1 million
Inverters *SMA, REFUsol *Fuji electric *Philadelphia solar
*GE *JA *JO
Combiner box *URIARTE SAFYBOX (ES) *Solariti (CZ)
*ES *CZ
Green Dot Panels Model 1 = Mono-crystalline Model 2 = Polycrystalline (mainly)
*Morning star and Outback (US) *SMA (GE) *Brand name (n.d.) (CN).
*US *GE *CN
RES (all types) = 20–30 projects
PV and hybrid systems = 100–200 projects
Whole systems: *PV_solar systems (1 kW) = 2,000–2,500; *PV_street lighting systems (1 kW) = 1,500–2,500.
Inverters n.d.
Controllers

83
Importer name
PV component Specifications Brand OriginNo. of items
sold/y
No. of items sold since the launch
of the company
Prices (USD)
Green Energy Inverters (capacity): 1–10 KVA Green Energy Electronics (GEE)
CN 500 MW/y 750 MW/y
Whole systems: *Small PV system (20–30 A) = 1,000/ A *Big PV system (above 30 A) = 600–800/A
Solar controllers
(capacity): 40, 50, 65, and 80 A GEE
Gel Batteries (capacity): 150, 200, 300, and 400 A (= 2 and 12 V systems).
GEE
Special cables (accessories)
TÜV cables n/a
PV panels Model 1: Mono-crystalline Model 2: Polycrystalline
n/a
Controllers Model 1: PWM Model 2: MPPT
n/a
Habash Electrical and Hybrid Technologies
PV_panels Model 1: Mono-crystalline silicone panels Model: Polycrystalline silicone panels
Philadelphia solar
JO 20–30 systems
“ 75 systems
* 950/A (residential applications) * 800–900 /A (commercial applications)
Inverters (capacity): 2–10 KVA Outback and W7 US and CN
Controllers (chargers)
Model 1 = 24 V Model 2 = 48 V Model 3 = 240 V
Outback and Morning Star
US and CN
LEBECO PV_systems (Whole)
PV system (capacity) = 5–10 A Ferolli IT 2–3 systems 10 systems PV system (5–10A) = 8,000–12,000
Midware Data Systems (Ecosys division)
PV_panels Model 1: Mono-crystalline silicone panels Model 2: Polycrystalline silicone panels Model 3: Thin films
(Capacity): 2–100 kW
(Output): 2–60 A
Model 1: 2 V Model 2: 20 V
PV panels: *Kyocera *Trina solar
Inverters and Regulators: *Steca *Kaco
Batteries: Enersys
*GE *CN
GE
GB and FR
200 kW
> 300 kW 2 per W
Inverters
Regulators
Batteries
Monitoring & logging devices
n.d.
MUST (By to perfection)
Panels, inverters controllers, batteries
PV system (capacity) = 10–150 Kilovolt-amperes (KVA)
MUST *JA (Panels) *CN (Inverters + Controllers) *IN (Batteries)
n.d. n.d. In between 5,000 (10 KVA) and 300,000 (150 KVA)
National Energy Consultants
Panels Model (PV panels): Polycrystalline silicone panels
n.d. CN PV (Street lighting) = 1 project
PV system (Street lighting) = 400 systems
n.d.
Inverters n.d. *Studer *Silcutor
*CH and GE *ES
Batteries n/a GR
Nature Énergie
Inverters PV system (capacities) = 75–300 w SMA GE SWH and PV = 10 big projects & 50 small projects
SWH and PV (projects) = 40 big projects & 200 small projects
*PV system (20A unsteady capacity) = Up to 15,000. *Price (per W) = 1–3
Batteries n/a CN

84
Importer name
PV component Specifications Brand OriginNo. of items
sold/y
No. of items sold since the launch
of the company
Prices (USD)
Panoramic Solar
Panels Model 1 (capacity) = 240w Model 2: (capacity) = 250w
Panels: *QS solar *Yingli *J A solar.
CN *Solar_PV (in 2011) = 1 system *Solar_PV (in 2012) = 5 systems *Solar_PV (in 2013) = 20 systems
26 systems Solar panels (240w) = 280–310.
Inverters n.d. Inverters: *Infinisolar *Kaco *Selectronic.
*CN *GE *AU
Inverters: *(infinisolar, Chinese) = 2,800 *Kaco (GE) = 3,000–8,000 *Selectronic (AU) = 5,000–20,000
Batteries Batteries: *Vision *Hoppecke *Rolls.
CN AU (mainly) GE and GB
Gel_Batteries (price) = 600 (12 V) Gel_Batteries (price) = 1,500 (2 V)
Solarnet Inverters PV_inverters = 3 models (n.d.). Studer (CH), Fronius (AT), and SMA (GE).
CH, AT, GE 1 project (Because we are new in th business and on the market).
n.d. *PV system (residential) = 10.000; *PV system (industrial) = >50,000;
PV modules Model 1 (PV modules): Monocrystalline silicone panels Model 2 (PV modules): Polycrystalline silicone panels.
Solar Innova (ES and CN).
ES and CN
Batteries n.d. Ritar (CN) and Hoppecke (GE).
CN and GE
Notes: A (ampere), AT (Austria), AU (Australia) CH (Switzerland), CN (China), CZ (Czech Republic), ES (Spain), FR (France), GB (United Kingdom), GE (Germany), IT (Italy), JO (Jordan), JP (Japan), kW (kilowatt), KVA (Kilovolt-ampere), W (watt), TR (Turkey), US (United States), ZA (South Africa)
Table F-5: Wind RES Importing
Company nameWind RES components
Specifications / capacity
Country of origin
No. of items sold/yNo. of items sold since the launch of the company
Prices (USD)
Asaco *TurbinesWind turbines = 1–380 kW (biggest system in LB)
US n.d.Total capacity of
300–400 kW
Price changes based on whether we are operating on an on/off grid
system
Contra International n.d. n.d.Europe and
CNn.d. n.d. n.d.
Dawtec *TurbinesTurbines (capacity)
= 300 W to 10 kWNL
1–2 projects
(residential)n/a 1,000–16,000
Eco Friendly Limited*Turbines
*AccessoriesTurbines (capacity) = 1 –4 kW
US1 system every 2
years1–2 systems 1 –4 kW = 3,000–12,000
EKT Katranji * Wind Mills
Model 1: 12 V = 500 W
Model 2: 24 V = 1 kW
Model 3: 48 V = 2 kW
CN5 systems
(residential)15 systems 500 W to 2 kW = 1,400–2,900
Green Dot
*Blades
*Controllers
*Inverters
*Towers
Vertical axis wind turbines
US and CN n.d.
PV and hybrid systems
= 100–200 projects
n.d.

85
Company nameWind RES components
Specifications / capacity
Country of origin
No. of items sold/yNo. of items sold since the launch of the company
Prices (USD)
LEBECO *TurbinesTurbines (capacity) = 6 kW
CN 1 system 10 systems 6 kW = 6,000
MUST (By to perfection)
*Turbines *Blades
*BatteriesWind power (capacity) = 1–100 kW
US n.d. n.d.50,000 - 270,000
(excluding installation)
Nature Énergie n.d. Wind power = 1 kW CN n.d. n.d. 1kW = 1,500 (residential)
Site Technology n.d.
Solarnet*Turbines *Controllers
Turbines (capacity) = 3–20 kW
US 1 project n.d. residential = 6,000
Notes: CN (China), LB (Lebanon), kW (kilowatt), NL (The Netherlands), US (United States), W (watt)
Table F-6: Hydro RES Importing
Importer nameHydro RES components
Specifications Country of originNo. of items
sold/y
No. of items sold since the launch of
the companyPrices (USD)
Asaco Micro turbinesThe specifications change based on the nature of the project site.
*CA *US *GB
n.d.1 project with the UNDP (= 15 kW)
4-5 per W (per system)
Notes: CA (Canada), GB (United Kingdom), US (United States)
Table F-7: Heat Pumps RES Importing
Importer name Specifications Brands Country of origin No. of items sold/yNo. of items sold since the
launch of the companyPrices (USD)
Contra International
Model 1 = Circulating pumps Model 2 = Pressure pumps
* 1/6 to 4 horse power * 40% less energy consuming
n.d. n.d. n.d. n.d. n.d.
National Energy Consultants
Geothermal SIAT FR, imported via Khater Engineering
1 project 1 project in Bejje n.d.
Table F-8: Bioenergy RES Importing
Importer name
RES components SpecificationsCountry of
originNo. of items
sold/yNo. of items sold since the
launch of the companyPrices (USD)
Solarnet * Biomass (wood stoves, CO)
*MCZ Pellet boilers
*Pellets stoves and Pellets fuel
7-8 models (n.d.) IT 3-4 mainly small projects
n.d. 2,000-4,000 € (equivalent to USD 2,674 - 5,348)
Notes: n.d. (no data)

86
Annex G RES Manufacturing Inputs and their Origins
Table G-1: RES Manufacturing Inputs
Company name RES Items needed in RES manufacturing and their origin Items or components that are imported or purchased locally to assemble a complete RES
Electro mechanic Est.
SWH *Galvanized steel = local (Bitar co.) *Lead shields = local (Zeenni, Sultan and Demerjian Steel)
Purchased locally: *Vacuum tubes (Wissam Daw - Dawtec) *Pipes (Unidentified source) *Resistance (Hijazi)
Ghaddar Trade and Industry
SWH *Anti-freeze = Imported
*Galvanized and low carbon steel = local (Sultan, Zeenni, and Damco steel) *Polyurethane = local (Wissam Hakim co.) *Powder paint = local (Chemico-Comtech) *Other accessories (sanitary) = local (Georges Khoury)
Imported: *Water tanks (TR/GR) *Connections (accessories) (TR/GR) *Solar collectors (TR/GR) *Magnesium anodes (Unidentified source)
Itani Company for Industry and Trade
SWH *Porcelain (powder) = imported (GE) *Steel (black steel) = local (Damco steel & Zeenni steel) *Polyurethane foam (thermal insulation) = local (Hakim co.)
Imported: *Solar collectors (AT) *Magnesium anodes (GE) *Pipes, heating elements, solar stations (for split systems) & plastic covers (IT)
Mawared and Construction Co. (Kypros)
SWH *Copper = imported *Aluminum frame = imported *Aluminum sheets = imported *Polyurethane = imported *Porcelain (powder) = imported
*Glass = imported
*Galvanized and cold roll steel = local (Zeenni steel)
Imported: *Resistances and Magnesium anodes (US / GE / CN / GR / TR)
Phoenix Energy SWH *Stainless steel sheets -444- = imported (GE and NL) *Steel cubes = imported (GE and NL) *Reflexion/absorption material sheets = imported (GE and NL)
Imported: *Plexi glass sheets (GE and NL)
Saad-El-Deen General Trade Est.
SWH *Powder electrostatic = imported *Enamel powder = imported *ARC powder coatings = imported
*Galvanized flat and cold flat steel = local (Zeenni, Sultan and Attar steel) *Foam = local (Hakim co.) *Glass = local (Unidentified source)
Imported: Vacuum tubes (CN)
Smartec Technologies
SWH *Combiner box = imported
*Electric board computerized = imported
*Chassis and AC = local (Stunch machinery)
Imported: *Solar panels (BE) *Batteries (US) *On grid inverters (GE)
Wind n/a Imported: *Wind generators & turbines (Taiwan)

87
Company name RES Items needed in RES manufacturing and their origin Items or components that are imported or purchased locally to assemble a complete RES
Sun Island SWH *Galvanized sheets = local (Antranik Baljian, and Zeenni steel). *Polyurethane = local (Mahmoud Mle’ib).
Imported: *Vacuum tubes (CN) *Flat plates (GE and TR) *Tanks (GE and TR)
Purchased locally: * Copper pipes (Emaco)
Sunshine Company
SWH *Steel = local (Damco steel, Mousawi steel & Zeenni steel)
*Copper = local (Najjar co.)
Imported: *Pipes (CN) Purchased locally: *Panels (Arakji and Ghoul) *Pipes (Yared)
Tofaily Solar Energy
SWH *Stainless rolls = local *Accessories = local
Imported: *Vacuum tubes (CN) *Magnesium anodes (CN) *Stainless steel tanks (SUS-2B & 316L-2B) (CN)

88
Annex H Tariffs on RES and Parts
Table H-1: Tariffs on RES and Parts
Tariff No. Description Duty Tax Base Rate (%) Unit
8419.10 Instantaneous or storage water heaters, non-electric :
8419.11 Instantaneous gas water heaters Customs Value 5 No.
VAT Value+Duty 10
8419.19 Other (312) (313) (322) (323) Customs Value 5 No.
VAT Value+Duty 10
8402 Steam or other vapour generating boilers (other than central heating hot water boilers capable also of producing low pressure); super-heated water boilers.
8402.11 Watertube boilers with a steam production exceeding 45 t per hour Customs Value 0
VAT Value+Duty 10
8402.12 Watertube boilers with a steam production not exceeding 45 t per hour (321) (322) (323) Customs Value 5
VAT Value+Duty 10
8402.19 Other vapour generating boilers, including hybrid boilers (321) (322) (323) Customs Value 5
VAT Value+Duty 10
8402.20 Super-heated water boilers (321) (322) (323) Customs Value 5
VAT Value+Duty 10
8402.90 Parts (321) (322) (323) Customs Value 5
VAT Value+Duty 10
8403.10 Boilers (321) (322) (323) Customs Value 5 No.
VAT Value+Duty 10
8403.90 Parts (321) (322) (323) Customs Value 5
VAT Value+Duty 10
8419.10 Instantaneous or storage water heaters, non-electric :
8419.11 Instantaneous gas water heaters Customs Value 5 No.
VAT Value+Duty 10
8419.19 Other (312) (313) (322) (323) Customs Value 5 No.
VAT Value+Duty 10
8502.30 Other generating sets :
8502.31 Wind-powered Customs Value 0 No.
VAT Value+Duty 10
8502.39 Other Customs Value 0 No.
VAT Value+Duty 10
8541.40 Photosensitive semiconductor devices, including PV cells whether or not assembled in modules or made up into panels; light emitting diodes
Customs Value 0 No.
VAT Value+Duty 10
Source: www.customs.gov.lb/customs/tariffs/national/tariff1.asp

89
BibliographyAlghoul, M.A., Sulaiman, M.Y., Azmi, B.Z. and Abd Wahab, M. (2007) Wind Energy Potential of Jordan. Published in International Energy Jouranl, volume 8, pp. 71-78
Ammoun, B. The National CDM Project for Solar Energy. Green Future Lebanon, 2011.
Arab Forum for Environment and Development. Arab Environment Green Economy. 2011.
Bassil, G. Policy Paper for the Electricity Sector. Ministry of Energy and Water. 2010.
Beheshti, H. Exploring Renewable Energy Policy in Lebanon: Feed-in Tariff as a Policy Tool in the Electricity Sector. 2010.
Biomass Thermal Energy Council. (n.d.) Biomass and Rural Economies. Available at: http://www.biomassthermal.org/resource/PDFs/Fact%20Sheet%205.pdf Bowen, A. “Green Growth, Green Jobs and Labor Markets.” Policy Research Working Paper 5990. World Bank Sustainable Development Network Office of the Chief Economist. 2012.
Cameron, L. “Employment in Renewables: A Literature Review and Case Study.” ECN Policy Studies, June 21, 2013.
Carbon Trust. Small Scale Wind Energy: Technical Report. Retrieved 29 August 2010. Available at: http://www.carbontrust.com/media/85174/small-scale-wind-energy-technical-report.pdf. 2008.
Center for Resource Solutions. A Review of International Experience with Policies to Promote Wind Power Industry Development. 2005.
Central Bank of Lebanon. Environmental Loans—Circular 236 Framework. 2011.
Country Energy Efficiency and Renewable Energy Demonstration Project for the Recovery of Lebanon (CEDRO). Hydropower in Lebanon: History and Prospects. 2013.
Country Energy Efficiency and Renewable Energy Demonstration Project for the Recovery of Lebanon (CEDRO). Photovoltaic Plants in Lebanon. 2013.
Country Energy Efficiency and Renewable Energy Demonstration Project for the Recovery of Lebanon. National Bioenergy Strategy for Lebanon. 2012.
Country Energy Efficiency and Renewable Energy Demonstration Project for the Recovery of Lebanon. Saving Energy. “List of Beneficiaries from CEDRO’s Project.” Issue no. 5. 2010.
Chehab, E. The Economic Implications of Renewable Energy (RE) in Lebanon: Achieving the 12% target by 2020, presentation UNDP, 19 December 2010
Council for Development and Reconstruction. Solid Waste Progress Report. 2009.
Dii GmbH. The Economic Impacts of Desert Power. 2013.
Dodge, D. M. Part 2 – 20th Century Developments; First Use of Wind for Large-Scale Generation of Electricity. Published in the illustrated history of wind power development. TelosNet Web Development.
El-Fadel, R.H., Hammond, G.P., Harajli, H.A., Jones, C.I., Kabakian, V.K., and Winnett, A.B. The Lebanese Electricity System in the Context of Sustainable Development, Energy Policy. 2009.
El Koury, P. 12 percent renewable energy by 2020: mission possible, published in the Daily star Lebanon. Available at: http://www.dailystar.com.lb/Business/Lebanon/2012/May-28/174805-12-percent-renewable-energy-by-2020-mission-possible.ashx. 2012.
El Khoury, P. Results of Lebanon’s National Energy Efficiency and Renewable Energy Action (NEEREA). Lebanese Center for Energy Conservation, 2013.
El Khoury, P. The Solar Water Heaters Market from 2009 to 2013 and the Way Beyond. Beirut Energy Forum, September 2013.
El Khoury, P. “12 Percent Renewable Energy by 2020: Mission Possible.” The Daily Star, May 28, 2012.
Energy Sector Management Assistance Programme (ESMAP). Middle East and North Africa Region Assessment of the Local Manufacturing Potential for Concentrated Solar Power (CSP) Projects. 2011.

90
ESCWA. Regional Coordination Mechanism (RCM) - Issue Brief for the Arab Sustainable Development Report. 2015.
European Commission. Draft Joint Employment Report from the Commission and the Council. 2015.
European Renewable Energy Council and Greenpeace. Energy [R]evolution. 2010.
European Small Hydropower Association. Small Hydropower for Developing Countries. 2012.
Fullflowsolar. Available at: http://www.fullflowsolar.com/purproducts. 2014
Global Environment Facility. Lebanon and the GEF. 2012.
Global Environment Facility. “Project Identification Form for Small Decentralized Renewable Energy Power Generation in Lebanon.” 2012.
Global Wind Energy Council. Global Wind Report. 2013.
Global Wind Energy Council. Global Wind Report. 2012.
Goyal, S. Rational for Biomass Supply Chain. Available at: http://www.bioenergyconsult.com/biomass-supply-chain/. 18 March 2015
Green Rhino Energy. Available at: http://www.greenrhinoenergy.com/solar/technologies/pv_manufacturing.php. 2014
Hamilton, J. and Liming, D. Careers in Wind Energy available at: http://www.bls.gov/green/wind_energy/. 2010
Harajli, H. The Role of the UNDP-CEDRO Project in Developing Lebanon’s Energy Efficiency and Renewable Energy Market.2011.
Hayek, K. (29 September 2011). Distributed Renewable Energy Generation in Lebanon and the Net – Metering Opportunity. Presented at the Beirut Energy Forum. 2011
Houri, A. Biomass: A diversity of solutions. Available at: http://www.cedro-undp.org/content/uploads/Publication/141009092209449~Exchange%205.pdf. March 2013
Industrial Research institute. Annual Report. 2012.
InfoPro. Oil and Gas Handbook. 2014.
InfoPro. The Green Business Handbook. 2012.
International Energy Agency. Technology Roadmap, Concentrating Solar Power. 2010.
International Labor Organization. Promoting Decent Work in a Green Economy. 2011.
International Labor Organization. Skills and Occupational Needs in Renewable Energy. 2011.
International Renewable Energy Agency. Renewable Energy Jobs & Access. 2012.
International Energy Agency, Organization of Petroleum Exporting Countries, Organization for Economic Co-operation and Development, and World Bank. Analysis of the Scope of Energy Subsidies and Suggestions for the G-20 Initiative. n.d.
IRENA. Renewable Energy Prospects: China. November 2014
IRENA. Renewable Energy and Jobs – Annual Review 2014. May 2014
Janajreh, I. Turning Waste Problems into Sustainable Fuels. Masdar Institute of Science and Technology, United Arab Emirates. 2013.
Khoday, K. Sustainable Development & Green Economy in the Arab Region. 2011.
Knierirem, H. (n.d.). Everything You Need to Know About Photovoltaics without Being an Engineer. Available at: http://www.glumac.com/Default.aspx?PageID=1901330&A=SearchResult&SearchID=7799948&ObjectID=1901330&ObjectType=1
Kraidy, A. Solar Heaters Arab Mark and Certification Initiative. Regional Center for Renewable Energy and Energy Efficiency and Solar Heating Arab Mark and Certification Initiative. 2013.

91
Lebanon’s First National Survey Study of The Solar Water Heaters Market, UNDP/GEF, 2014
Lebanese Association for Energy Saving and Environment. The Thermal Insulation Market in Lebanon. 2011.
Lebanese Association for Energy Saving and Environment. The Solar Thermal Market in Lebanon. 2010.
Lebanese Association for Energy Saving and Environment. State of the Energy in Lebanon. 2006.
Lebanese Center for Energy Conservation. The Residential Solar Water Heaters Market in Lebanon in 2011. 2012.
Lebanese Center for Energy Conservation, and World Bank. Large Scale Solar Water Heater Market Development Program in Lebanon, 2011.
Lebanese Center for Energy Conservation. The National Energy Efficiency Action Plan for Lebanon 2011–2015. 2011.
Lebanese Center for Energy Conservation. Report on the Solar Thermal Market in Lebanon. 2008.
Lebanese Center for Energy Conservation. Report on the Solar Thermal Market in Lebanon. 2006.
Lebanese Center for Cleaner Production. Annual Report. 2010.
Lebanese Solar Energy Society. Solar Thermal Systems Survey for the Lebanese Market. 2006.
MEED Insights. MENA Renewable Energy Report 2013.
Ministry of Environment. Lebanon Technology Needs Assessment for Climate Change. 2012.
Ministry of Environment. Lebanon’s Second National Communication to the UNFCCC. 2011.
Ministry of Environment. “Solid Waste.” In State and Trends of the Lebanese Environment. 2010.
MOEW Policy Paper for the Electricity Sector, Ministry of Energy and Water, 2010.
Molina, M.G. and Alvarez, J.M.G. (June 14, 2011). Technical and Regulatory Exigencies for Grid Connection of Wind Generation IN Wind Farm - Technical Regulations, Potential Estimation and Siting Assessment.
Nagarajian, G. (March 2015). India to Quadruple Renewable Capacity to 175 Gigawatts by 2022. Published in Renewable Energy World.
Nuwayhid, R. Y., Abou Said,R. and Taha, M.H. Thermoelectrically-complemented Photovoltaics in Rural Lebanon. 2011.
Mediterranean Energy Observatory. Solar Thermal in the Mediterranean Region: Solar Thermal Action Plan. 2012.
Paige, A. How to Build a Wind Turbine. Available at: http://www.ehow.com/info_8025884_components-wind-turbine.html#ixzz2kPlAWjbf. n.d.
RCREEE. Renewable Energy Country Profile. 2012
Regional Center for Renewable Energy and Energy Efficiency. Existing CDM Potential and Perspectives for Carbon Finance in RCREEE Member States Beyond 2012. 2011.
Regional Center for Renewable Energy and Energy Efficiency. Provision of Technical Support/Services for an Economical, Technological and Environmental Impact Assessment of National Regulations and Incentives for Renewable Energy and Energy Efficiency Policies for Energy Efficiency and Renewable Energy in the RCREEE Group of Countries. 2010.
Regional Center for Renewable Energy and Energy Efficiency. Provision of Technical Support/Services for an Economical, Technological and Environmental Impact Assessment of National Regulations and Incentives for Renewable Energy and Energy Efficiency Policies for Energy Efficiency and Renewable Energy in the RCREEE Group of Countries. 2009.
REN21. Renewables 2013 – Global Status Report. 2013
REN21. Renewables 2014 – Global Status Report. 2014
Renewable Energy, Regional Center for Renewable Energy and Energy Efficiency. Arab Future Energy Index. 2013.
Renewable UK. Skiavalls Manifesto: Skills Policy Recommendations from the Wind and Marine Energy Industries. n.d.

92
Rahal, Mohammed. World Bank 2011, referring to an interview with the Minister of Environment, L’Orient-Le Jour. June 2010.
SAGIT energy Ventures. available at: http://www.sagitenergy.co.za/. 2014
Solar Direct. Available at: http://www.solardirect.com/swh/aet/swhparts/swhparts.htm. 2014
SolarMED atlas. Available at: http://www.solar-med-atlas.org/solarmed-atlas/map.htm#c=30.675715,13.798828&t=ghi. 2015
Status and Potentials of Renewable Energy Technologies in Lebanon and the Region (Egypt, Jordan, Palestine, Syria). Compiled by Green Line Association. 2007.
“Sun Sets on Oil for Gulf Power Generation,” Bloomberg New Energy Finance. January 19, 2011.
SweepNet. Country Report on the Solid Waste Management in Lebanon. 2012.
SweepNet. Country Report on the Solid Waste Management in Lebanon. 2010.
United Arab Emirates, International Renewable Energy Agency, and Renewable Energy Policy Network for the 21st Century. MENA Renewables Status Report 2013.
United Nations Development Programme. The National Bioenergy Strategy for Lebanon. 2012.
United Nations Development Programme–Country Energy Efficiency and Renewable Energy Demonstration Project for the Recovery of Lebanon. The National Geothermal Resource Assessment of Lebanon. 2014.
United Nations Development Programme–Country Energy Efficiency and Renewable Energy Demonstration Project for the Recovery of Lebanon. Hydropower from Non-River Sources: The Potential in Lebanon. 2013.
United Nations Development Programme–Country Energy Efficiency and Renewable Energy Demonstration Project for the Recovery of Lebanon. Concentrated Solar Power for Lebanon: A Techno-Economic Assessment. 2012.
United Nations Development Programme–Country Energy Efficiency and Renewable Energy Demonstration Project for the Recovery of Lebanon. Environmental Impact Assessment for Wind Farm Developments: A Guideline Report. 2012.
United Nations Development Programme–Country Energy Efficiency and Renewable Energy Demonstration Project for the Recovery of Lebanon. The National Wind Atlas for Lebanon. 2011.
United Nations Development Programme–Country Energy Efficiency and Renewable Energy Demonstration Project for the Recovery of Lebanon. “The Recommendations for a Wind Atlas of Lebanon.” Issue no. 4. 2011.
United Nations Development Programme–Country Energy Efficiency and Renewable Energy Demonstration Project for the Recovery of Lebanon. Hermel Governmental Hospital Starts a Solar Water Heating Trend. 2010.
United Nations Development Programme–Country Energy Efficiency and Renewable Energy Demonstration Project for the Recovery of Lebanon. Lebanon: Solar Power Helps Schools, Hospitals. n.d.
United Nations Economic and Social Commission for Western Asia. Green Financing for the Arab Region: Background Paper, Economic and Social Commission for Western Asia. 2011.
United Nations Environment Program. Financing Renewable Energy in Developing Countries. 2012.
United Nations Environment Program, International Labor Organization, International Organization for Employers, and International Trade Union Confederation. Green Jobs: Towards Decent Work in a Sustainable, Low-Carbon World. 2008.
World Bank Sustainable Development Department Middle East and North Africa Region. Republic of Lebanon Country Environmental Analysis. 2011.
World Bank 2011, referring to an interview with the Minister of Environment, Mohammed Rahal, in L’Orient-Le Jour, June 2010.)
Zomeworks Corportaion. Available at: http://www.zomeworks.com/. 2014