Relationships between outgoing longwave radiation and ... · Relationships between outgoing...
19
Vol.:(0123456789) 1 3 Clim Dyn DOI 10.1007/s00382-016-3501-0 Relationships between outgoing longwave radiation and diabatic heating in reanalyses Kai Zhang 1 · William J. Randel 2 · Rong Fu 1,3 Received: 11 July 2016 / Accepted: 16 December 2016 © Springer-Verlag Berlin Heidelberg 2016 to upper troposphere. The compensating effects in LW and SW radiation are largely linked to variations in cloud frac- tion and water content (vapor, liquid and ice). These radia- tive balances in reanalyses are in agreement with idealized calculations using a column radiative transfer model. The overall relationships between OLR and diabatic heating are robust among the different reanalyses, although there are differences in radiative tendencies in the tropics due to large differences of cloud water and ice content among the reanalyses. These calculations provide a simple statistical method to quantify variations in diabatic heating linked to transient deep convection in the climate system. Keywords Diabatic heating · Outgoing longwave radiation · Reanalyses · Cloud · Longwave · Shortwave 1 Introduction Diabatic heating is a key driver of the atmospheric circula- tion and the global climate system. Diabatic heating origi- nates from latent heating and radiative processes, and these separate components are linked with many aspects of the physical climate system. For example, large-scale mois- ture convergence and condensation, associated with latent heat release, are responsible for developing convective sys- tems. Organized deep convection in the tropics is linked to variations in diabatic heating, which in turn drives circu- lations on large- and small-scales, including climatologi- cal monsoon structures, Hoskins and Rodwell (1995); El Nino Southern Oscillation (ENSO), Nigam et al. (2000); Madden–Julian Oscillation (MJO), Li et al. (2009)and mes- oscale convective complexes, Houze (1989). Convection has strong and complex interactions with radiative heat- ing due to diversity of cloud formations and convective Abstract This study investigates relationships between daily variability in National Oceanographic and Atmos- pheric Administration (NOAA) outgoing longwave radia- tion (OLR), as a proxy for deep convection, and the global diabatic heat budget derived from reanalysis data sets. Results are evaluated based on data from ECMWF Reanal- ysis (ERA-Interim), Japanese 55-year Reanalysis (JRA-55) and Modern-Era Retrospective Analysis for Research and Applications (MERRA2). The diabatic heating is sepa- rated into components linked to ‘physics’ (mainly latent heat fluxes), plus longwave (LW) and shortwave (SW) radiative tendencies. Transient variability in deep convec- tion is highly correlated with diabatic heating throughout the troposphere and stratosphere. Correlation patterns and composite analyses show that enhanced deep convection (lower OLR) is linked to amplified heating in the tropical troposphere and in the mid-latitude storm tracks, tied to latent heat release. Enhanced convection is also linked to radiative cooling in the lower stratosphere, due to weaker upwelling LW from lower altitudes. Enhanced transient deep convection increases LW and decreases SW radiation in the lower troposphere, with opposite effects in the mid Electronic supplementary material The online version of this article (doi:10.1007/s00382-016-3501-0) contains supplementary material, which is available to authorized users. * Kai Zhang [email protected] 1 Jackson School of Geosciences, The University of Texas at Austin, Austin, TX, USA 2 National Center for Atmospheric Research, Boulder, CO, USA 3 Dept. of Atmospheric & Oceanic Sciences, University of California, Los Angeles, CA, USA
Transcript of Relationships between outgoing longwave radiation and ... · Relationships between outgoing...

Vol.:(0123456789)1 3
Clim Dyn
DOI 10.1007/s00382-016-3501-0
Relationships between outgoing longwave radiation and diabatic
heating in reanalyses
Kai Zhang1 · William J. Randel2 · Rong Fu1,3
Received: 11 July 2016 / Accepted: 16 December 2016
© Springer-Verlag Berlin Heidelberg 2016
to upper troposphere. The compensating effects in LW and
SW radiation are largely linked to variations in cloud frac-
tion and water content (vapor, liquid and ice). These radia-
tive balances in reanalyses are in agreement with idealized
calculations using a column radiative transfer model. The
overall relationships between OLR and diabatic heating
are robust among the different reanalyses, although there
are differences in radiative tendencies in the tropics due to
large differences of cloud water and ice content among the
reanalyses. These calculations provide a simple statistical
method to quantify variations in diabatic heating linked to
transient deep convection in the climate system.
Keywords Diabatic heating · Outgoing longwave
radiation · Reanalyses · Cloud · Longwave · Shortwave
1 Introduction
Diabatic heating is a key driver of the atmospheric circula-
tion and the global climate system. Diabatic heating origi-
nates from latent heating and radiative processes, and these
separate components are linked with many aspects of the
physical climate system. For example, large-scale mois-
ture convergence and condensation, associated with latent
heat release, are responsible for developing convective sys-
tems. Organized deep convection in the tropics is linked to
variations in diabatic heating, which in turn drives circu-
lations on large- and small-scales, including climatologi-
cal monsoon structures, Hoskins and Rodwell (1995); El
Nino Southern Oscillation (ENSO), Nigam et al. (2000);
Madden–Julian Oscillation (MJO), Li et al. (2009)and mes-
oscale convective complexes, Houze (1989). Convection
has strong and complex interactions with radiative heat-
ing due to diversity of cloud formations and convective
Abstract This study investigates relationships between
daily variability in National Oceanographic and Atmos-
pheric Administration (NOAA) outgoing longwave radia-
tion (OLR), as a proxy for deep convection, and the global
diabatic heat budget derived from reanalysis data sets.
Results are evaluated based on data from ECMWF Reanal-
ysis (ERA-Interim), Japanese 55-year Reanalysis (JRA-55)
and Modern-Era Retrospective Analysis for Research and
Applications (MERRA2). The diabatic heating is sepa-
rated into components linked to ‘physics’ (mainly latent
heat fluxes), plus longwave (LW) and shortwave (SW)
radiative tendencies. Transient variability in deep convec-
tion is highly correlated with diabatic heating throughout
the troposphere and stratosphere. Correlation patterns and
composite analyses show that enhanced deep convection
(lower OLR) is linked to amplified heating in the tropical
troposphere and in the mid-latitude storm tracks, tied to
latent heat release. Enhanced convection is also linked to
radiative cooling in the lower stratosphere, due to weaker
upwelling LW from lower altitudes. Enhanced transient
deep convection increases LW and decreases SW radiation
in the lower troposphere, with opposite effects in the mid
Electronic supplementary material The online version of this
article (doi:10.1007/s00382-016-3501-0) contains supplementary
material, which is available to authorized users.
* Kai Zhang
1 Jackson School of Geosciences, The University of Texas
at Austin, Austin, TX, USA
2 National Center for Atmospheric Research, Boulder, CO,
USA
3 Dept. of Atmospheric & Oceanic Sciences, University
of California, Los Angeles, CA, USA
K. Zhang et al.
1 3
behavior. A large amount of research has focused on quan-
tifying diabatic heating associated with deep convection
(e.g., Ling and Zhang 2013 and references therein) and
developing corresponding parameterizations for large-scale
numerical models (Bretherton 2007). A further use of dia-
batic heating rates is to drive vertical circulations in dia-
batic Lagrangian trajectory models; such calculations have
been shown to be much less dispersive than corresponding
kinematic calculations (based on diagnosed vertical winds)
(e.g., Ploeger et al. 2010). Many studies have utilized dia-
batic heating rates to drive Lagrangian trajectory models
to study the circulation and transport of different tracers,
finding reasonable agreement with observations (Schoe-
berl et al. 2012, 2013; Wang et al. 2014, 2015; Zhang et al.
2016). Such work has prompted detailed studies of diaba-
tic heating rates from reanalysis data sets (e.g., Fueglistaler
et al. 2009; Wright and Fueglistaler 2013). However, such
analyses are typically focused on time average statistics,
and there has been less emphasis on quantifying and com-
paring transient variability.
Deep convection in the atmosphere is complex and dif-
ficult to quantify in full detail. One common approach is to
evaluate the space–time behavior of deep convection based
on satellite measurements of Outgoing Longwave Radia-
tion (OLR) (Ohring and Gruber 1983). Since June 1974,
the operational National Oceanographic and Atmospheric
Administration (NOAA) polar-orbiting satellites have pro-
vided OLR estimates from the window channel measure-
ments of the Advanced Very High Resolution Radiometer
(AVHRR) (Gruber and Krueger 1984; Gruber and Win-
ston 1978; Liebmann and Smith 1996). In the tropics and
mid-latitudes, variability of OLR is primarily linked to
high-altitude clouds and deep convection and exhibits cor-
respondingly complex behavior. Gridded OLR datasets,
because of their continuous spatial and temporal coverage,
have often been used to infer changes in the amount and
height of clouds, intensity of precipitation and associated
latent heating (e.g., Hu and Fu 2007; Park et al. 2007; Ran-
del et al. 2015; Xie and Arkin 1998).
Convection in the atmosphere is linked to latent and tur-
bulent heat fluxes linked with vertical diffusion, along with
radiative processes [absorption of shortwave (SW) solar
radiation and absorption/emission of longwave (LW) ther-
mal radiation]. However, the links are complicated due to a
high degree of transience and the broad spectrum of cloud
and convective behavior. Diabatic heating rates including
radiative and physical components, are difficult to measure
directly. Modern meteorological reanalyses are widely used
to derive the diabatic heat budgets. Comparisons of the heat
budgets among reanalyses have typically focused on the time
average behavior, revealing some important differences, espe-
cially in the upper troposphere—lower stratosphere (UTLS)
(Wright and Fueglistaler 2013). Fueglistaler et al. (2009)
have compared the ERA-Interim diabatic heat budget with
that of the older ERA-40 and found an overall better perfor-
mance of ERA-Interim. Ling and Zhang (2013) have exam-
ined the diabatic heat budgets of three recent global reanaly-
ses focused on levels in the troposphere, and found general
agreements compared with results derived from available
sounding observations based on wind and temperature fields,
especially over the extratropics, where large-scale condensa-
tion dominates the rainfall processes.
In this paper we focus on quantifying transient variabil-
ity of diabatic heating in reanalysis data products associated
with observed fluctuations in convection, as identified in
daily gridded OLR data. We use the OLR as a proxy of deep
convection and cirrus/anvil clouds (in the tropics and middle
latitudes), and quantify its correlations with daily variability
in the separate diabatic heating rates, which are output as part
of the meteorological reanalyses. We focus on the detailed
results from ERA-Interim, but also include comparisons with
JRA-55 and MERRA2. We separate the diabatic heating into
components linked to ‘physics’ (mainly latent heating) and
radiative (LW and SW) heating rates. In addition to global
correlations, we use composites with respect to OLR to eval-
uate transient diabatic heating linked to moderate to extreme
deep convection, with focus on the tropics and midlatitude
storm tracks. We furthermore explore the variability in radia-
tive fluxes using comparisons with an idealized column radi-
ative transfer model, in order to explain the physical mecha-
nisms behind the behavior derived from reanalysis data.
2 Data and methodology
Our analyses focus on diabatic heating fields derived from
reanalyses. The total diabatic heating can be separated into
physical and radiative components:
The radiation term can in turn be separated into two
components, as longwave (LW) and shortwave (SW) radia-
tive heating:
therefore
The radiation term can also be broken into clear-sky and
cloud radiative heating:
Qtotal = Qphysics + Qradiation
Qradiation = QLW + QSW,
Qtotal = Qphysics + QLW + QSW.
Qradiation = Qclear + Qcloud =
(
QLW_clear + QSW_clear
)
+
(
QLW_cloud + QSW_cloud
)
.

Relationships between outgoing longwave radiation and diabatic heating in reanalyses
1 3
Fig. 1 Example time series at
grid point (0°, 150°E) during
year 2003 for a QSW; b QLW; c
Qphysics at 300 hPa and d OLR.
Note the different vertical scales
in a–c

K. Zhang et al.
1 3
The separate clear and cloud radiative terms are pro-
vided in the reanalyses, and these can be used to quantify
cloud radiative effects.
In the following, we will compare the global behavior
of diabatic heating with daily gridded OLR data. We quan-
tify the variabilities of the separate diabatic heating com-
ponents (Qtotal, Qphysics, Qradiation, QLW and QSW) and their
correlation with OLR, and examine detailed vertical struc-
tures based on composited values. The clear-sky and cloud
radiative heating are also used to identify the effects of
cloud on radiative heating. We focus on results based on
ERA-Interim diabatic heating rates, and include the results
from JRA-55 and MERRA2 reanalyses in the supplemen-
tary materials.
ERA-Interim is a reanalysis spanning from 1979 to pre-
sent (Dee et al. 2011). Output of the reanalyses includes
total diabatic heating, plus separate components due
to longwave (LW) and shortwave (SW) radiative heat-
ing. Heating rates due to physical processes (‘physics’)
are not provided directly but can be derived as a differ-
ence between the total heating and radiative components.
The physics heating term in the ERA-Interim is due to
latent heating (primarily moist physics) and heating asso-
ciated with turbulent mixing (Fueglistaler et al. 2009):
Qphysics = Qlatent + Qturbulent. Since these two separate com-
ponents are not provided in ERA-Interim, we cannot quan-
tify their individual behaviors. An example of time series
of OLR and several components of heating at one spe-
cific grid point (0°, 150°E) during 1 year (2003) is shown
in Fig. 1. OLR shows large day-to-day variations, linked
to transient deep convection and high clouds (low OLR)
at this location. Note that extreme convection in the deep
tropics is associated with OLR <180 W/m2. There are large
corresponding daily variations in Qphysics, QLW and QSW in
Fig. 1, which are correlated with OLR and with each other
(note that QLW and QSW are often anti-correlated, which is
typical, as shown below). Our analyses are aimed at quan-
tifying the relationships among these variables over the
globe, including their detailed vertical structure.
MERRA2 reanalysis has been produced by NASA’s
Global Modeling and Assimilation Office (GMAO) of
NASA based on the Goddard Earth Observing System,
version 5 (GEOS-5) (Rienecker et al. 2011), covering the
satellite era (1980–present). MERRA-2 is the newest rea-
nalysis product updated from MERRA reanalysis (Bosi-
lovich et al. 2015). The development of MERRA2 includes
assimilating additional observations and improving the
data assimilation model and observing system (Molod
et al. 2015). MERRA2’s diabatic heating includes compo-
nents of heating due to LW radiation, SW radiation, moist
physics, turbulent mixing, gravity wave drag, and friction
(which we combine into a total physics term).
The Japanese 55-year reanalysis (JRA-55) is the second
Japanese global atmospheric reanalysis conducted by the
Fig. 2 Left panels are annual averaged a OLR and b vertically averaged Qtotal between 200 and 700 hPa in ERA-Interim. Right panels c, d show
variance maps for their respective anomalies. Note that the color bar is reversed in a

Relationships between outgoing longwave radiation and diabatic heating in reanalyses
1 3
Japan Meteorological Agency (JMA), covering the period
of 1979–present (Kobayashi et al. 2015). The JRA-55 pro-
vides heating rates due to LW radiation, SW radiation,
convection, large-scale condensation and vertical diffusion
(which we combine into a total physics term).
NOAA interpolated OLR daily gridded analyses are
obtained from NOAA-Cooperative Institute for Research in
Environmental Sciences Climate Diagnosis Center (http://
www.cdc.noaa.gov/). The OLR flux is estimated from IR
window channel brightness temperatures based on a non-
linear regression in comparisons to broadband earth radia-
tion budget observations (Ohring et al. 1984) for day and
night separately. The total OLR flux for a month is obtained
by averaging all nighttime and daytime estimates within the
Fig. 3 Zonal mean diabatic heating averaged over the period of 1979–2013 for a Qtotal; b Qradiation; c Qphysics; d QLW; e QSW in ERA-Interim. The
black dashed lines denote the tropopause

K. Zhang et al.
1 3
period. We have regridded the daily reanalysis heating rates
onto the same horizontal grid (2.5° × 2.5°) as OLR data.
The correlation calculations are based on daily anomalies
in the period of 1979–2013, which are derived by subtract-
ing 35-year averaged seasonal cycle from the original time
series at each grid point (for both OLR and the individual
diabatic heating rates).
We note that OLR is also a diagnostic provided by
the different reanalyses. We choose to use the observed
(NOAA) OLR product in this work, in order to link our
results to other studies based on observed OLR, and to
have a common reference (transfer standard) among rea-
nalyses. Very similar overall results are found using rea-
nalysis OLR.
Fig. 4 Total variance of anomalies of a Qradiation; b Qphysics as a function of latitude and pressure in ERA-Interim. Note the logarithmic color
scale. The black dashed lines denote the tropopause
Fig. 5 Scatter plot of daily
Qphysics at 400 hPa and OLR
in the tropical western Pacific
(within the box shown below
in Fig. 10). The black dots
represent the composite mean
and the vertical black lines
represent the standard deviation
intervals of Qphysics at different
OLR levels

Relationships between outgoing longwave radiation and diabatic heating in reanalyses
1 3
3 Results
3.1 Annual average and variability of OLR
and diabatic heating
The annual averages of OLR and vertically averaged Qtotal
between 200 and 700 hPa during 1979–2013 are shown in
Fig. 2a, b. Persistent deep convection in the tropics is asso-
ciated with time average low OLR and positive Qtotal. The
global patterns show that while low OLR is an indicator of
strong convection in tropics, it does not necessarily imply
deep convection over high latitudes (Fig. 1a), where the
low values are largely due to the cold surface and atmos-
pheric temperatures. In contrast, the time average Qtotal
Fig. 6 Zonal average of correlations between OLR and anomalies of
a Qtotal; b Qradiation; c Qphysics; d QLW and e QSW in ERA-Interim. The
correlations are calculated at each latitude/longitude grid point and
then zonally averaged. The sense of the color scale is that enhanced
convection is linked to diabatic heating (red) or cooling (blue). The
black dashed lines denote the tropopause

K. Zhang et al.
1 3
distribution captures the deep convection over tropics, and
also convective patterns over the storm track regions in the
mid-latitudes. Maps of the variances of (deseasonalized)
OLR and Qtotal (Fig. 2c, d) show consistent spatial patterns,
with largest variability over tropical convective regions and
storm tracks in the mid-latitudes, and smallest variability
over the polar regions. Note that Qtotal shows relatively
stronger variability than OLR over the storm track regions.
The annual and zonal averages of diabatic heating
profiles for each component based on ERA-Interim are
shown in Fig. 3 (profiles based on JRA-55 and MERRA2
are shown in Fig. S1 in the supplementary materials).
In the troposphere, the time average balance is primar-
ily between heating from Qphysics and net radiative cool-
ing; the total diabatic heating shows a net heating in
tropics and mid-latitudes and cooling in subtropics
(Fig. 3a), which is presumably balanced by circulation
effects. Maximum tropospheric heating is associated with
strong latent heat release by convection in the tropics
and storm tracks (over ~ 30°–60°N/S, Fig. 3c). The net
radiative cooling in the troposphere is a balance of LW
cooling and (weaker) SW warming. In the stratosphere,
the total diabatic heat budget is dominated by the radia-
tive component (Fig. 3b), with heating in the tropics and
cooling in the extratropics (balanced by the mean over-
turning Brewer–Dobson circulation, BDC). The LW
radiative component in Fig. 3d shows cooling through-
out the troposphere and stratosphere, except for heating
in the tropical tropopause layer (TTL), which is linked to
the low temperatures (below radiative equilibrium) main-
tained by the mean upward BDC. The SW radiative ten-
dencies show a global heating with greatest values in the
stratosphere (due to ozone absorption) and lower-middle
troposphere (due to water vapor and cloud absorption),
weakening from tropics to high latitudes, corresponding
to the distribution of incoming solar radiation and water
vapor content. In the troposphere and the extratropical
stratosphere, LW cooling exceeds SW heating, while in
the tropical stratosphere SW heating is larger than LW
cooling. In the TTL, both LW and SW radiative com-
ponents contribute heating, consistent with Gettelman
et al. (2004). The combination of LW and SW compo-
nents gives the time average radiative heating pattern in
Fig. 3b.
Fig. 7 Maps showing local correlations between OLR anomalies and a QLW, b QSW, c cloud fraction, and d cloud ice water content at 150 hPa

Relationships between outgoing longwave radiation and diabatic heating in reanalyses
1 3
Maps of the temporal variances of diabatic heating for
radiative (Qradiation) and physical components (Qphysics) are
shown in Fig. 4, showing zonal averages of variances cal-
culated at each longitude. In the troposphere, the variability
of the total diabatic heating is dominated by the physical
component in Fig. 4b, with maxima associated with tropical
convection and storm tracks (as seen in Fig. 3c). There is
also large variance in Qradiation near the surface. In the strat-
osphere the variability of the total diabatic heating is domi-
nated by the radiative component (Fig. 4a), primarily from
the LW radiative heating (tied to temperature variations).
There are relative stratospheric variance maxima over the
equator for both Qradiation and Qphysics, linked to temperature
and wind shear (turbulence) anomalies associated with the
stratospheric quasi-biennial oscillation (QBO).
3.2 Correlations between OLR and diabatic heating
Our analyses use OLR as a proxy for convective activity,
and we anticipate close statistical relationships with dia-
batic heating (although the overall variations are complex
in all fields). To illustrate this variability, Fig. 5 shows the
statistical distribution of Qphysics at 400 hPa vs. OLR, for
sampling in the tropical western Pacific (within the box
shown below in Fig. 10). The main part of the distribution
shows a clear relationship between low OLR and enhanced
Qphysics, and this behavior is quantified by the binned val-
ues of Qphysics indicated in Fig. 5. Such average relation-
ships between Q and OLR are the focus of our analyses,
although there is also a rich spectrum of variability not
simply related to OLR. In addition, Fig. 5 shows a broad
Fig. 8 Zonal average of correlations between OLR and anomalies of
a QLW_clear; b QSW_clear; c QLW_cloud and d QSW_cloud in ERA-Interim.
The sense of the color scale is that enhanced convection is linked
to diabatic heating (red) or cooling (blue). The black dashed lines
denote the tropopause

K. Zhang et al.
1 3
distribution in both Qphysics and OLR, with (infrequent)
occurrence of high Qphysics (>15 K/day) and very low OLR
(<160 W/m2).
The correlation patterns between OLR and diabatic
heating anomalies of each component are shown in Fig. 6
(zonal means of correlations calculated at each longitude).
Red shading indicates negative correlation, such that inten-
sified convection (lower OLR) is associated with enhanced
heating; likewise, blue shading indicates cooling with
enhanced convection.
The overall patterns of correlations for Qtotal (Fig. 6a)
show that enhanced convection is linked to diabatic heat-
ing throughout the troposphere and cooling in the lower
stratosphere. The tropospheric warming is primarily tied
to correlation with physics terms (Fig. 6c; mainly latent
heating). The net radiative response in the troposphere
is a balance of LW and SW effects (shown separately in
Fig. 6d, e). Enhanced convection is tied to relative SW
cooling (reduced warming) near the surface, together
with warming throughout the rest of the troposphere, due
to cloud and water effects on SW radiation (e.g., Fung
and Ramaswamy 1999). Conversely, transient convection
produces relative LW warming (weaker cooling) at low
levels (below ~5 km) and enhanced cooling in the upper
troposphere, especially over middle latitudes. There is a
weaker correlation with QLW in the tropical upper tropo-
sphere compared to midlatitudes. In the troposphere, the
LW variations dominate over SW, so that correlations
for the net radiative heating (Fig. 6b) are similar to LW
alone. As shown below, much of the coherent variations
in tropospheric SW and LW fluxes linked to convection
can be explained by associated variations in cloud frac-
tion and cloud water and ice content. Enhanced con-
vection tends to warm the TTL (~100–150 hPa), pri-
marily from QSW (and a weak contribution from QLW),
although this is a detail that is specific to ERA-Interim
(as discussed below). The local behaviors of these cor-
relations (at 150 hPa) are shown in Fig. 7, together with
corresponding correlations with cloud fraction and cloud
ice water content. Figure 7 shows that in the TTL the
response of QSW to deep convection is closely linked with
the behaviors of cloud fraction and ice content.
The net response of the stratosphere to increased con-
vection is radiative cooling (Fig. 6a, b). Deep convection
increases SW heating in the stratosphere (Fig. 6e), due to
increases in reflected SW from high clouds, and absorp-
tion by stratospheric ozone. However, enhanced convec-
tion causes stronger stratosphere LW cooling (Fig. 6d),
due to weaker LW tropospheric emission in situations of
high cloud (e.g., Fueglistaler and Fu 2006; Hartmann et al.
2001). The LW component dominates over the SW, so that
the total radiative effect is cooling (Fig. 6b). The strongest
LW stratospheric correlation patterns occur over lower lati-
tudes (~30°N–S), with a slight minimum over the equator.
The correlation patterns between OLR and the separate
clear-sky and cloud radiative heating anomalies of QLW and
QSW are shown in Fig. 8. The overall relationships between
OLR and radiative heating in Fig. 6d, e are mostly due to
cloud radiative effects (Fig. 8c, d), with corresponding
large variability in OLR. The effects of cloud properties on
radiative heating will be further studied in Sect. 3.4. Clear-
sky QLW shows weak OLR correlations (Fig. 8a), indicating
cooling in the upper troposphere and heating in the lower
troposphere linked with lower OLR. This behavior mainly
occurs for relatively high values of OLR over clear regions
(not tied to deep convection), and is primarily linked to var-
iations in atmospheric water vapor in these regions. There
are not significant correlations between OLR and clear-sky
QSW.
Almost all of the correlation patterns seen in Fig. 6,
based on ERA-Interim data, are similar to results based on
JRA-55 and MERRA2 reanalyses (Figure S2), except for
some detailed differences in the radiative responses in the
tropics. These are described below.
Fig. 9 Maps showing correlations between OLR anomalies and a
Qtotal at 500 hPa and b QLW at 300 hPa

Relationships between outgoing longwave radiation and diabatic heating in reanalyses
1 3
Fig. 10 Diabatic heating profiles composited according to co-located
OLR values for b Qtotal; c Qradiation; d Qphysics; e QLW; and f QSW. a
The selected region over western Pacific (10oS–10oN, 120o–180oE)
for composite analysis. Binned OLR values vary from the category of
280–300 (dashed black line hereafter) to 140–160 (black line hereaf-
ter) W/m2. Note that the scales of x-axis in b and d are different from
those in c, e, f. Red curve in a is the probability density distribution
of OLR in this region

K. Zhang et al.
1 3
The spatial patterns of the correlation between OLR and
Qtotal anomalies in the troposphere (500 hPa) is shown in
Fig. 9a. The strongest negative correlations for Qtotal occur
over the tropics and storm track regions in the mid-latitudes
(especially over the oceans), related to the latent heating
(moist physics) from convection. Minimum correlations
occur only over regions that are devoid of deep convection,
to the west of the continents in the subtropics. The corre-
lations between OLR and QLW in the upper troposphere
(300 hPa) are highlighted in Fig. 9b, showing strongest
response over the mid-latitude oceanic regions. This behav-
ior is tied to convection-related water content and cloud
variations, which have a strong LW cooling effect.
3.3 Composite diabatic heating based on OLR values
To quantify the response of diabatic heating to OLR
changes over different regions in more detail, we show
diabatic heating profiles from ERA-Interim composited
for different values of co-located OLR (corresponding to
varying altitude of cloud top and intensity of convection).
We simply bin the diabatic heating in localized regions for
various OLR values in 20 W/m2 bins, spanning from below
160 W/m2 (extreme deep convection) to above 280 W/m2
(no convection), e.g. see Fig. 5. These composites quan-
tify the magnitude and vertical profile of the diabatic heat-
ing variations tied to convection. We focus on two exam-
ples, over the western Pacific (tropical convective region,
Fig. 10) and northwestern Pacific (mid-latitude storm track
region, Fig. 12).
Over the western Pacific, enhanced convection is linked
to latent heat response with a broad vertical scale spanning
~700−200 hPa, with a maximum near 400 hPa (Fig. 10d).
This behavior is similar to previous estimates of diabatic
heating in deep convection, e.g. Ling and Zhang (2013),
and references therein. The heating amplitude for strong-
est convection (OLR <180 W/m2) is ~6 K/day in the mid-
dle troposphere (Fig. 10d), although individual peaks can
be substantially stronger (Figs. 1, 5). Variations in Qradiation
(Fig. 10c) show that enhanced convection is tied to stronger
warming near 150 hPa, mainly as a result of increased
QSW, and decreased cooling near 700 hPa, due to QLW. The
variations in QLW and QSW with respect to OLR are a con-
volution of clear sky and cloud effects; clear-sky QLW is
dominated by variations in water vapor and cloudy QLW by
liquid water and ice (as shown below).
Comparisons of these results among the reanalyses show
similar patterns and magnitudes for Qphysics in the tropics
(c.f. Figs. 10 and S3), but with some interesting systematic
differences in maximum amplitude. Figure 11 compares the
composited values of Qphysics near the tropical maximum
(400 hPa) versus OLR for the three reanalyses, showing
systematically stronger heating for the most intense convec-
tion (OLR <200 W/m2) for MERRA2, followed by JRA55
and ERA-Interim. The differences are relatively large for
the most intense convection. Conversely, MERRA2 shows
smaller heating rates for higher OLR values. These differ-
ences might be expected to influence the transient thermo-
dynamic balances in the respective reanalyses.
Composited variations in diabatic heating rates over
the northwestern Pacific storm track are shown in Fig. 12.
Heating from Qphysics (Fig. 12d) peaks in the middle trop-
osphere, centered slightly lower than the corresponding
maximum in the tropics (Fig. 10d), with somewhat smaller
maximum values. Very similar behavior is seen with
MERRA and JRA-55 statistics (Fig. S4). Changes in QLW
and QSW show dipole patterns in the vertical between the
lower and upper troposphere, with compensating effects
between SW and LW components; the net result is stronger
cooling in the upper troposphere and weaker cooling in the
lower troposphere for enhanced convection (Fig. 12c). The
clear influence of deep convection on stratospheric LW
cooling is also evident in Fig. 12e.
3.4 Convective effects on water content, clouds
and radiation response
As shown in Fig. 8c, d, he coherent variations of QLW and
QSW response to deep convection seen in the above statis-
tics can be understood to a large degree as a response to
corresponding changes in cloud fraction and water and
ice content. We evaluate this behavior by quantifying the
related cloud variations in the reanalyses tied to convection,
and then studying the corresponding radiative effects based
on a column radiation model.
Variations in convection are strongly correlated with the
vertical distributions of cloud fraction, liquid and ice water
Fig. 11 Variations of tropical diabatic heating from Qphysics from the
three reanalyses, binned as a function of OLR. These results are from
the Western Pacific, using values at 400 hPa (near the altitude maxi-
mum in Qphysics)

Relationships between outgoing longwave radiation and diabatic heating in reanalyses
1 3
content over tropics and middle latitudes. This behavior is
expected, simply from the cloud formation and condensa-
tion processes in convective systems. The calculated cor-
relations between OLR and ERA-Interim cloud fields are
shown in Fig. 13, for statistics at 500 hPa (cloud fraction
and ice water content) and 700 hPa (cloud liquid water
content). There are strong correlations between OLR and
cloud behavior (as expected), and these figures emphasize
variability in the mid-latitude oceanic storm track regions.
Corresponding variations in cloud fraction and ice water
content at 150 hPa were shown in Fig. 8c, d, emphasizing
similar strong relationships with convection in the tropics.
Figure 14 shows composited cloud vertical profiles
as a function of OLR for the western Pacific and storm
Fig. 12 Diabatic heating vertical profiles composited according to co-located OLR over the northwestern Pacific (30°–50°N, 120°–180°E).
Details are the same as in Fig. 10

K. Zhang et al.
1 3
track regions. Over the western Pacific, the response of
cloud fraction maximizes near 150 hPa (Fig. 14a; see also
Fig. 8c), corresponding to intense deep convection in this
region. This pattern occurs higher than the response over
the storm track region, which maximizes near 400 hPa
(Fig. 14b). The cloud liquid water content profiles show
double peaks at 500 and 850 hPa over the western Pacific.
The magnitude of the response is stronger over the storm
track region. The composited cloud ice water content
peaks at similar level (~400 hPa) over the two regions, but
extends to higher altitudes over the western Pacific.
The radiative responses to these variations in cloud
behavior are evaluated using an accurate column radiative
transfer model (RRTM) (Iacono et al. 2000; Mlawer et al.
1997). RRTM was developed by Mlawer et al. (1997) and
provided by the Atmospheric and Environmental Research
Inc. It utilizes the correlated-k approach to calculate fluxes
and heating rates efficiently and accurately. We use the
respective vertical profiles of climatological mean tempera-
ture and water vapor as input to the RRTM, and test the
responses to variations in cloud fraction, plus liquid and
ice water content, as derived in Fig. 14. Both diurnal and
annual cycles have been averaged in the calculation of SW
heating rates. The effective radii of ice crystals and liquid
droplets are set to 45 and 15 µm, respectively. We note that
the vertical profiles of the SW heating rates in the RRTM
are sensitive to the parameters of ice crystal and liquid
droplet sizes.
Figure 15 shows variations in QLW and QSW output from
the RRTM as a response to the cloud variations in the
western Pacific and storm-track region shown in Fig. 14.
The results can be compared with the reanalysis sensitivi-
ties shown in Figs. 10e, f and 12e, f. The results over the
storm track region show out-of-phase variations in QLW the
upper and lower troposphere, and compensating changes
in QSW, very similar to the behavior derived from the rea-
nalysis data in Fig. 12e, f. Variations in cloud fraction
and liquid water content are the most important contribu-
tors to this behavior. The RRTM results over the western
Pacific show similar vertical profiles and sensitivities to
the ERA-Interim statistics in Fig. 10e, f, although the vari-
ations in QSW in the upper troposphere are much smaller
in RRTM. Note that the LW heating rates in the tropical
upper troposphere show less sensitivity to cloud varia-
tions than those in the storm track region (in both RRTM
and ERA-Interim); this behavior gives rise to the tropical
upper tropospheric minimum in QLW correlations seen in
Fig. 6d. Overall there is reasonable quantitative agreement
with the RRTM calculations, demonstrating that variations
in cloud fraction and water and ice content are key factors
influencing the tropospheric radiative heating balances tied
to convection.
There are substantial differences in the tropical QLW
and QSW responses to convection in the tropics among
the reanalyses, which are reflected in the correlation
and composite patterns. Vertical profiles of compos-
ited QLW and QSW for the western Pacific from JRA-55
and MERRA2 are shown in Fig. 16 (for comparison to
the ERA-Interim results in Fig. 10e, f). JRA-55 is simi-
lar to ERA-Interim, while MERRA2 shows more com-
plex vertical structure for QLW and larger sensitivity to
Fig. 13 Correlations between OLR and cloud fraction at 500 hPa
(top panel), cloud liquid water content at 700 hPa (middle panel), and
cloud ice water content at 500 hPa (bottom panel) in ERA-Interim

Relationships between outgoing longwave radiation and diabatic heating in reanalyses
1 3
deep convection for QSW in the upper troposphere. These
sensitivities probably reflect large differences in corre-
sponding cloud water and ice content between the rea-
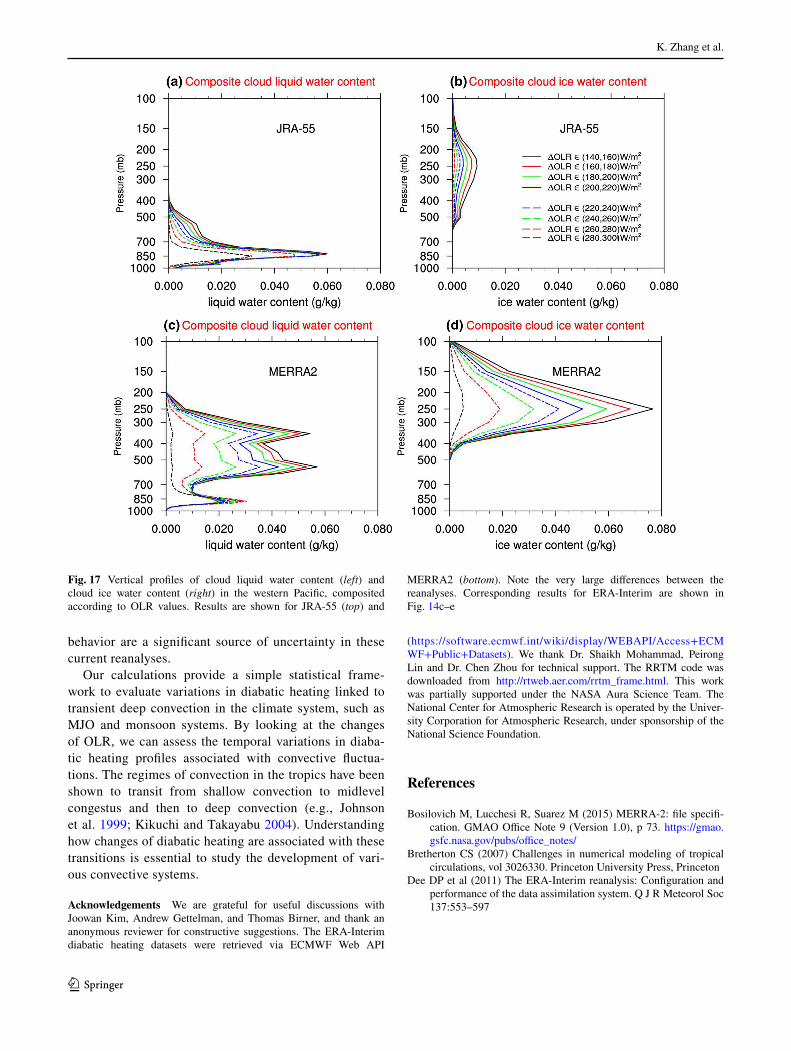
nalyses, as shown in Fig. 17. The cloud liquid water con-
tent profiles for JRA-55 show a single peak at ~800 hPa,
and three peaks at ~350, 600 and 850 hPa in MERRA2;
MERRA2 has much larger water content above 500 hPa
than either JRA-55 or ERA-Interim. The cloud ice con-
tent is also very different, with approximately an order
of magnitude difference between JRA-55 and MERRA2
(Fig. 17), with ERA-Interim values between the two
(Fig. 14e). These large differences in cloud water and ice
content are probably the main cause of the very differ-
ent tropical radiative heating rates among the reanalyses
(Fig. 16). Similar comparisons in the storm track region
do not show such large differences, but rather overall
agreement in cloud statistics and radiative responses.
4 Conclusions and discussion
We have used the ERA-Interim reanalyses to investigate
the variability of diabatic heating and its relationships
with transient deep convection (using OLR as a proxy for
Fig. 14 Vertical profiles of cloud fraction (top panel), cloud liquid water content (middle panel) and cloud ice water content (bottom panel)
composited according to co-located OLR, for statistics in the western Pacific (left panel) and storm track (right panel) regions

K. Zhang et al.
1 3
observed convection). We propose this as a simple sta-
tistical method to investigate the coherent behavior in
diabatic heating profiles associated with highly variable
and complex changes in deep convection. Although most
of the illustrated results are based on ERA-Interim rea-
nalysis, we derive similar results based on JRA-55 and
MERRA2 reanalysis. While there are differences in the
time average diabatic heating rates among different rea-
nalyses (e.g., Ling and Zhang 2013; Wright and Fueg-
listaler 2013), we find that the overall statistical links
between observed OLR and diabatic heating rates are not
strongly dependent on which reanalysis is used (aside
from the radiative tendencies in the tropics).
In the troposphere, the dominant variability of diabatic
heating is tied to latent heating, which is parameterized in
large-scale models. Our analyses find strong correlations
between latent heating and OLR over the tropics and storm
track regions, which is reasonable and consistent with pre-
vious analyses (e.g., Ling and Zhang 2013). Composited
values show that the magnitude of tropical diabatic heat-
ing linked to the strongest convection is somewhat dif-
ferent among the reanalyses (Fig. 11). In the stratosphere
diabatic heating is dominated by the radiative components,
and we find enhanced LW radiative cooling tied to tropo-
spheric convection. This relationship in the stratosphere is
consistent with the study of Norton (2001), who showed
anticorrelation between upper tropospheric cloud cover and
lower stratospheric heating rates in ECMWF data, which
was interpreted as a consequence of the reduced LW heat-
ing in the lower stratosphere in the presence of high clouds.
A similar result was found by Fueglistaler and Fu (2006),
based on detailed radiative heating calculations at tropical
locations. Our study quantifies these relationships in global
reanalysis data sets, and highlights how convection and
Fig. 15 Heating rate variations derived from the RRTM column radiation model, incorporating the observed cloud changes in Fig. 14. Results
are shown for the western Pacific (top panels) and storm track regions (bottom panels), including LW (left) and SW (right) heating rates

Relationships between outgoing longwave radiation and diabatic heating in reanalyses
1 3
clouds systematically influence diabatic heat budgets in the
stratosphere.
Convective influences on vertical profiles of the radia-
tive heating rates in ERA-Interim diagnosed here are con-
sistent with Yang et al. (2010), who calculate cloud radia-
tive heating in the tropical UTLS within 30°N–S based
on a detailed radiative transfer model along with observa-
tions of atmospheric composition and clouds (including
thin cirrus). Their calculations indicate that the impact of
clouds on net radiative heating has transitions from posi-
tive below 100 hPa to negative above 100 hPa, consistent
with our Figs. 6b and 10c. They furthermore showed that
the LW cloud influence is positive below ~165 hPa and
negative above ~165 hPa, consistent with our Fig. 6d. In
addition, our results show that the response of radiative
heat in the extratropics is rather different, with net cooling
in both upper troposphere and stratosphere due to enhanced
convection.
The physical component in this study also includes the
parameterized turbulent mixing, known as vertical diffusion
heating rates. While we have not isolated this term, it is
generally about an order of magnitude smaller than the
other components, although local variations can be as large
as fluctuations of the radiative components (Flannaghan
and Fueglistaler 2011). Because this is a highly parameter-
ized and uncertain term in large-scale models, how it varies
and responds to convection are still poorly understood.
Our analyses quantify systematic changes in QLW
and QSW in the troposphere tied to deep convection, and
comparisons with an idealized column radiation model
suggest these variations are mainly a response to cloud
fraction, water and ice content associated with deep con-
vection. Results in the storm track are very similar among
the reanalyses. However, in the tropics there are very
large differences in analyzed cloud water and ice content
(Fig. 17), and these are in turn reflected in substantial
differences in (cloudy) radiative heating rates (Fig. 16).
The discrepancies in the tropical UTLS among the rea-
nalyses were also pointed out by Wright and Fueglistaler
(2013). These large differences in analyzed tropical cloud
Fig. 16 Vertical profiles of QLW (left) and QSW (right) in the western Pacific, composited according to OLR values. Results are shown for JRA-
55 (top) and MERRA2 (bottom). Corresponding results for ERA-Interim are shown in Fig. 10e, f
K. Zhang et al.
1 3
behavior are a significant source of uncertainty in these
current reanalyses.
Our calculations provide a simple statistical frame-
work to evaluate variations in diabatic heating linked to
transient deep convection in the climate system, such as
MJO and monsoon systems. By looking at the changes
of OLR, we can assess the temporal variations in diaba-
tic heating profiles associated with convective fluctua-
tions. The regimes of convection in the tropics have been
shown to transit from shallow convection to midlevel
congestus and then to deep convection (e.g., Johnson
et al. 1999; Kikuchi and Takayabu 2004). Understanding
how changes of diabatic heating are associated with these
transitions is essential to study the development of vari-
ous convective systems.
Acknowledgements We are grateful for useful discussions with
Joowan Kim, Andrew Gettelman, and Thomas Birner, and thank an
anonymous reviewer for constructive suggestions. The ERA-Interim
diabatic heating datasets were retrieved via ECMWF Web API
(https://software.ecmwf.int/wiki/display/WEBAPI/Access+ECM
WF+Public+Datasets). We thank Dr. Shaikh Mohammad, Peirong
Lin and Dr. Chen Zhou for technical support. The RRTM code was
downloaded from http://rtweb.aer.com/rrtm_frame.html. This work
was partially supported under the NASA Aura Science Team. The
National Center for Atmospheric Research is operated by the Univer-
sity Corporation for Atmospheric Research, under sponsorship of the
National Science Foundation.
References
Bosilovich M, Lucchesi R, Suarez M (2015) MERRA-2: file specifi-
cation. GMAO Office Note 9 (Version 1.0), p 73. https://gmao.
gsfc.nasa.gov/pubs/office_notes/
Bretherton CS (2007) Challenges in numerical modeling of tropical
circulations, vol 3026330. Princeton University Press, Princeton
Dee DP et al (2011) The ERA-Interim reanalysis: Configuration and
performance of the data assimilation system. Q J R Meteorol Soc
137:553–597
Fig. 17 Vertical profiles of cloud liquid water content (left) and
cloud ice water content (right) in the western Pacific, composited
according to OLR values. Results are shown for JRA-55 (top) and
MERRA2 (bottom). Note the very large differences between the
reanalyses. Corresponding results for ERA-Interim are shown in
Fig. 14c–e
Relationships between outgoing longwave radiation and diabatic heating in reanalyses
1 3
Flannaghan T, Fueglistaler S (2011) Kelvin waves and shear-flow
turbulent mixing in the TTL in (re-) analysis data. Geophys Res
Lett 38:L02801
Fueglistaler S, Fu Q (2006) Impact of clouds on radiative heating
rates in the tropical lower stratosphere. J Geophys Res Atmos
111:D23202
Fueglistaler S, Legras B, Beljaars A, Morcrette JJ, Simmons A,
Tompkins A, Uppala S (2009) The diabatic heat budget of the
upper troposphere and lower/mid stratosphere in ECMWF rea-
nalyses. Q J R Meteorol Soc 135:21–37
Fung K, Ramaswamy V (1999) On shortwave radiation absorption in
overcast atmospheres. J Geophys Res: Atmos 104:22233–22241
Gettelman A et al (2004) Radiation balance of the tropical tropopause
layer. J Geophys Res Atmos 109:D07103
Gruber A, Krueger AF (1984) The status of the NOAA outgoing
longwave radiation data set. Bull Am Meteorol Soc 65:958–962
Gruber A, Winston JS (1978) Earth-atmosphere radiative heating
based on NOAA scanning radiometer measurements. Bull Am
Meteorol Soc 59:1570–1573
Hartmann DL, Holton JR, Fu Q (2001) The heat balance of the tropi-
cal tropopause, cirrus, and stratospheric dehydration. Geophys
Res Lett 28:1969–1972. doi:10.1029/2000gl012833
Hoskins BJ, Rodwell MJ (1995) A model of the Asian summer mon-
soon. Part I: the global scale. J Atmos Sci 52:1329–1340
Houze RA (1989) Observed structure of mesoscale convective sys-
tems and implications for large-scale heating. Q J R Meteorol
Soc 115:425–461
Hu Y, Fu Q (2007) Observed poleward expansion of the Hadley circu-
lation since 1979. Atmos Chem Phys 7:5229–5236
Iacono MJ, Mlawer EJ, Clough SA, Morcrette J-J (2000) Impact of
an improved longwave radiation model, RRTM, on the energy
budget and thermodynamic properties of the NCAR community
climate model, CCM3. J Geophys Res 105:14873–14890
Johnson RH, Rickenbach TM, Rutledge SA, Ciesielski PE, Schubert
WH (1999) Trimodal characteristics of tropical convection. J
Clim 12(8):2397–2418
Kikuchi K, Takayabu YN (2004) The development of organized con-
vection associated with the MJO during TOGA COARE IOP:
trimodal characteristics. Geophys Res Lett 31(10)
Kobayashi S et al (2015) The JRA-55 reanalysis: general specifica-
tions and basic characteristics. J Meteorol Soc Jpn 93:5–48
Li C, Jia X, Ling J, Zhou W, Zhang C (2009) Sensitivity of MJO sim-
ulations to diabatic heating profiles. Clim Dyn 32:167–187
Liebmann B, Smith CA (1996) Description of a complete (interpo-
lated) outgoing longwave radiation dataset. Bull Am Meteor Soc
77:1275–1277
Ling J, Zhang C (2013) Diabatic heating profiles in recent global rea-
nalyses. J Clim 26:3307–3325
Mlawer EJ, Taubman SJ, Brown PD, Iacono MJ, Clough SA (1997)
Radiative transfer for inhomogeneous atmospheres: RRTM, a
validated correlated-k model for the longwave. J Geophys Res
Atmos 102:16663–16682
Molod A, Takacs L, Suarez M, Bacmeister J (2015) Development of
the GEOS-5 atmospheric general circulation model: evolution
from MERRA to MERRA2. Geosci Model Dev 8:1339–1356
Nigam S, Chung C, DeWeaver E (2000) ENSO diabatic heating in
ECMWF and NCEP-NCAR reanalyses, and NCAR CCM3 simu-
lation. J Clim 13:3152–3171
Norton W (2001) Longwave heating of the tropical lower strato-
sphere. Geophys Res Lett 28:3653–3656
Ohring G, Gruber A (1983) Satellite radiation observations and cli-
mate theory. Adv Geophys 25:237
Ohring G, Gruber A, Ellingson R (1984) Satellite determinations of
the relationship between total longwave radiation flux and infra-
red window radiance. J Clim Appl Meteorol 23(3):416–425
Park M, Randel WJ, Gettelman A, Massie ST, Jiang JH (2007) Trans-
port above the Asian summer monsoon anticyclone inferred from
aura microwave limb sounder tracers. J Geophys Res Atmos
112:D16309
Ploeger F, Konopka P, Günther G, Grooß JU, Müller R (2010) Impact
of the vertical velocity scheme on modeling transport in the trop-
ical tropopause layer. J Geophys Res Atmos 115:D03301
Randel WJ, Zhang K, Fu R (2015) What controls stratospheric water
vapor in the NH summer monsoon regions? J Geophys Res
Atmos 120(15):7988–8001
Rienecker MM et al (2011) MERRA: NASA’s modern-era retrospec-
tive analysis for research and applications. J Clim 24:3624–3648
Schoeberl MR, Dessler AE, Wang T (2012) Simulation of strato-
spheric water vapor and trends using three reanalyses. Atmos
Chem Phys 12:6475–6487
Schoeberl MR, Dessler A, Wang T (2013) Modeling upper tropo-
spheric and lower stratospheric water vapor anomalies. Atmos
Chem Phys 13:7783–7793
Wang T, Randel WJ, Dessler AE, Schoeberl MR, Kinnison DE (2014)
Trajectory model simulations of ozone (O3) and carbon monox-
ide (CO) in the lower stratosphere. Atmos Chem Phys 14:7135–
7147. doi:10.5194/acp-14-7135-2014
Wang T, Dessler AE, Schoeberl MR, Randel WJ, Kim JE (2015) The
impact of temperature vertical structure on trajectory modeling
of stratospheric water vapor. Atmos Chem Phys 15:3517–3526.
doi:10.5194/acp-15-3517-2015
Wright J, Fueglistaler S (2013) Large differences in reanalyses of dia-
batic heating in the tropical upper troposphere and lower strato-
sphere. Atmos Chem Phys 13:9565–9576
Xie P, Arkin PA (1998) Global monthly precipitation estimates
from satellite-observed outgoing longwave radiation. J Clim
11:137–164
Yang Q, Fu Q, Hu Y (2010) Radiative impacts of clouds in the tropi-
cal tropopause layer. J Geophys Res Atmos 115:D00H12
Zhang K, Fu R, Wang T, Liu Y (2016) Impact of geographic varia-
tions of the convective and dehydration center on stratospheric
water vapor over the Asian monsoon region. Atmos Chem Phys
16:7825–7835. doi:10.5194/acp-16-7825-2016

![November 2019 Geography Higher level and standard level ... PAST PAPERS...Longwave/outgoing radiation [1] is absorbed by greenhouse gases [1], heating up the atmosphere [1]. (b) Explain](https://static.fdocuments.us/doc/165x107/605476a90aa60a4f0178695a/november-2019-geography-higher-level-and-standard-level-past-papers-longwaveoutgoing.jpg)