Regulation and Risk Shuffling in Bank Securities …...Regulation and Risk Shuffling in Bank...
44
This paper presents preliminary findings and is being distributed to economists and other interested readers solely to stimulate discussion and elicit comments. The views expressed in this paper are those of the authors and do not necessarily reflect the position of the Federal Reserve Bank of New York or the Federal Reserve System. Any errors or omissions are the responsibility of the authors. Federal Reserve Bank of New York Staff Reports Regulation and Risk Shuffling in Bank Securities Portfolios Andreas Fuster James Vickery Staff Report No. 851 June 2018
Transcript of Regulation and Risk Shuffling in Bank Securities …...Regulation and Risk Shuffling in Bank...

This paper presents preliminary findings and is being distributed to economists
and other interested readers solely to stimulate discussion and elicit comments.
The views expressed in this paper are those of the authors and do not necessarily
reflect the position of the Federal Reserve Bank of New York or the Federal
Reserve System. Any errors or omissions are the responsibility of the authors.
Federal Reserve Bank of New York
Staff Reports
Regulation and Risk Shuffling in
Bank Securities Portfolios
Andreas Fuster
James Vickery
Staff Report No. 851
June 2018

Regulation and Risk Shuffling in Bank Securities Portfolios
Andreas Fuster and James Vickery
Federal Reserve Bank of New York Staff Reports, no. 851
June 2018
JEL classification: G21, G23, G28
Abstract
Bank capital requirements are based on a mix of market values and book values. We investigate
the effects of a policy change that ties regulatory capital to the market value of the “available-for-
sale" investment securities portfolio for some banking organizations. Our analysis is based on
security-level data on individual bank portfolios matched to bond characteristics. We find little
clear evidence that banks respond by reducing the riskiness of their securities portfolios, although
there is some evidence of a greater use of derivatives to hedge securities exposures. Instead,
banks respond by reclassifying securities to mitigate the effects of the policy change. This shift is
most pronounced for securities with high levels of interest rate risk.
Key words: bank, securities, available-for-sale, capital regulation, fair value accounting
_________________
Vickery: Federal Reserve Bank of New York (email: [email protected]). Fuster: Swiss National Bank (email: [email protected]). The authors thank Sarah Gertler and Samantha Zeller for outstanding research assistance. They also thank Hao Wu and Michael Moise for comments and advice on institutional details. Fuster was employed at the Federal Reserve Bank of New York while most of this work was completed. The views expressed in this paper are those of the authors and do not necessarily reflect the position of the Federal Reserve Bank of New York, the Federal Reserve System, or the Swiss National Bank. To view the authors’ disclosure statements, visit https://www.newyorkfed.org/research/staff_reports/sr851.html.

1. Introduction
Bank capital regulation is often criticized for relying on accrual accounting data which may not re-
flect the current economic value of bank assets and liabilities (e.g., see Haldane, 2012, and Calomiris
and Nissim, 2014). Examining recent events, critics note that regulatory capital ratios for many
banks declined only marginally during the 2007-09 financial crisis, despite a collapse in the market
value of bank equity, and point to the insolvency of several prominent financial institutions which
had apparently healthy capital ratios at the time of their failure. For example, Lehman Brothers
had a tier 1 regulatory capital ratio of 11.6% days prior to its bankruptcy, well above the regulatory
minimum.1
Motivated by these concerns, there has been a trend over time towards greater use of fair value
accounting for bank capital regulation, as well as for financial reporting more generally (e.g., Laux
and Leuz, 2009). However, we have only an incomplete understanding of how the use of fair values
for regulation affects the incentives and behavior of financial institutions. The goal of this paper is
to shed light on these issues by studying the effects of a recent policy change which ties regulatory
capital directly to the market value of bank securities portfolios.
Specifically, we study the removal of the accumulated other comprehensive income (AOCI)
filter for investment securities classified as “available for sale.” AOCI is an accounting item which
reflects accumulated unrealized changes in the fair value of securities held for investment purposes.
Historically, these unrealized gains and losses are not counted towards bank regulatory capital.
However, as part of the implementation of the Basel III capital accord, this AOCI filter was removed
for a set of the largest US banking organizations.2,3 For these banks, fluctuations in securities market
values now flow through directly to regulatory capital. The filter has been removed according to
a step function, with the percentage of AOCI counted towards regulatory capital set at 20% in
calendar year 2014, rising by 20% per year until full phase-out of the filter for affected banks in
1See e.g. https://economix.blogs.nytimes.com/2010/04/01/capital-requirements-are-not-enough/.2Specifically, the filter was removed for banking organizations subject to the Advanced Approaches Basel regu-
latory framework, as well as to other banking organizations which elected to include AOCI in capital. See Section 2for more details.
3Although we sometimes refer to the firms we study as “banks” as shorthand, our analysis focuses on consolidatedbanking organizations at the level of the high-holder bank holding company (BHC), inclusive of nonbank subsidiaries.
1
2018.
The regulatory capital volatility induced by the removal of the AOCI filter creates a challenge for
bank risk management. For example, an article in Risk magazine highlights its impact in the wake
of the Brexit vote in the United Kingdom: “In the first few frantic hours after markets opened on
June 24, the primary concern for some treasurers was how their so-called available-for-sale (AFS)
portfolio, where liquidity buffers are held, was going to look at the end of the day ... The Brexit vote
was the first time treasurers had to manage the impact of AFS volatility on regulatory capital”.4
The goal of this paper is to study how banks respond to the AOCI filter removal, which effectively
means the AFS portfolio is now marked-to-market for regulatory capital purposes.
We examine two main questions. First, does the removal of the AOCI filter lead to lower risk-
taking in bank investment securities portfolios? We may expect banks to de-risk because the policy
change makes regulatory capital more sensitive to fluctuations in asset values. If banks are averse
to this volatility (e.g., because it requires them to hold a larger precautionary equity capital buffer),
then a natural response would be to shift to less risk-sensitive securities (e.g., bonds with shorter
duration), or to make greater use of derivatives to hedge the portfolio risk. Second, do banks take
steps to reclassify securities or otherwise shift the composition of assets in ways which minimize
the effect of the removal of the AOCI filter, but do not substantively reduce “fundamental” bank
risk?
Our analysis is based on detailed security-level data reported in bank holding companies FR
Y-14Q filings, a quarterly regulatory collection which supports the Federal Reserve supervisory
stress tests. The data include information on the book and market value of different securities
owned, the security type, CUSIP identifier, and the classification of the security (available-for-sale
or held-to-maturity). These data are merged by security identifier to information on characteristics
such as coupon, duration and credit rating. We also conduct additional analysis and cross-validate
our results using publicly available BHC regulatory filings, which report aggregate information
about the size and composition of BHC securities portfolios.
We find little clear evidence of a significant reduction in the riskiness of the assets held in the
4See https://www.risk.net/derivatives/2463893/brexit-gives-banks-taste-life-without-afs-bond-filters.
2

securities portfolio in response to the removal of the AOCI filter. We primarily study interest
rate risk, which is likely to be the most important source of volatility in asset values given the
concentration of agency MBS and Treasury securities, as well as other long-duration bonds, in
bank portfolios. Our empirical strategy focuses on examining changes in risk within security types
with a common risk weight (i.e. considering the average duration of agency MBS or of Treasury
securities). This is important to help disentangle the effect of tying capital to the fair value of the
securities portfolio from other post-crisis changes in bank regulation. Using data over 2011-2017,
we find no evidence that the removal of the AOCI filter leads to lower duration of the agency MBS
or Treasury portfolio. We also do not find evidence of a decline in the average yield of either type
of securities holdings. Looking across all security types, which we can only do for a shorter period
(2015:Q4-2017:Q2), we do find a significant decrease in security duration for AOCI banks, although
their total duration risk exposure does not decrease over the same period.
We do find some evidence, however, of increased use of derivatives to hedge securities expo-
sures, based on security-level data on qualifying accounting hedges reported in the FR Y-14Q. The
likelihood of hedging a particular bond exposure is between 4 and 16 percentage points higher for
banks not subject to the AOCI filter, depending on the specification.
Quantitatively more importantly, we find evidence that treated banks respond by actively
reshuffling their portfolios, and in particular classifying risky securities as “held to maturity” (HTM)
rather than available for sale (AFS). The use of detailed security-level data allow us to control in
a precise way for security characteristics – most finely by including both BHC fixed effects and a
vector of CUSIP-by-calendar quarter fixed effects in our specifications. This is an important fea-
ture of our analysis, since it allows us to isolate the effects of the accounting classification decision
for a given security from changes in the composition in investment securities portfolios which was
occurring during this period. In these specifications, our preferred point estimates suggest that a
security is 20 percentage points more likely to be classified as HTM rather than AFS if owned by
a BHC subject to the AOCI rule (measured on a fully phased-in basis), or 38 percentage points
measured on a weighted basis. For both agency MBS and Treasury securities, we find that these
effects are concentrated among bonds with higher duration.
3

Although reclassifying securities in this way reduces the volatility of regulatory capital, it does
not mitigate the fundamental risks of the assets being held. Given that there are obstacles to
selling securities classified as held-to-maturity, such reclassification may in some circumstances
even increase risk, to the extent that it reduces the liquidity of the bank’s assets during periods
of stress. We also find some weak suggestive evidence that banks shift their residential mortgage
investments towards investments in whole loans rather than mortgage-backed securities. Again,
this may heighten rather than reduce risk, given that whole loans are exposed to credit risk while
mortgage bonds are generally in the form of agency securities which have a guarantee against
default. However, holding whole loans reduces regulatory capital volatility since such loans are not
marked-to-market.
Our results highlight that banks will actively reshuffle the composition of their asset portfolios
when an asset has a different regulatory treatment depending on where it is held on the balance
sheet. Such reshuffling will mask the effects of changes in regulatory capital measurement, and may
have other unintended consequences which affect financial stability.
1.1 Related literature
Our analysis is most closely related to an emerging literature studying the effects of the removal
of the AOCI regulatory capital filter. The three most closely related papers we are aware of
are Chircop and Novotny-Farkas (2016), Kim et al. (2017) and Hamilton (2018). Chircop and
Novotny-Farkas (2016) conduct an event study approach around announcement dates related to
the AOCI rule, finding evidence that bank stock returns reacted negatively to news that the rule
was becoming more likely to go into effect. This result is consistent with the view that the AOCI
rule represented a tightening of regulation for affected banks. Kim et al. (2017) find evidence of
a reduction in securities portfolio risk due to the AOCI rule (in contrast to our results). Kim
et al. (2017) and Hamilton (2018), like us, find evidence of a shift from AFS to HTM within BHC
securities portfolios.
Unlike this set of papers, our analysis is able to more directly measure the types of risks
embedded in bank securities portfolios based on the characteristics of individual securities, and
4

control finely for security characteristics when examining shifts in securities classification. This can
matter importantly for the empirical analysis. For example Kim et al. (2017) find evidence of a
shift to zero-risk-weight securities (consisting of Treasury securities and other direct obligations of
the Federal government), which they interpret as a reduction in risk. However, we show that in
fact, Treasury securities have among the longest duration of any of the security types held in bank
portfolios, and thus have very significant exposure to interest rate risk. Furthermore, measuring
interest rate risk directly, we find no evidence that the removal of the AOCI filter was associated
with a reduction in duration within asset class. Conversely, these other papers study a number
of aspects of bank responses to the removal of the AOCI filter which we do not consider—for
example, Kim et al. (2017) study effects of the removal of the AOCI filter on repo market activity
and mortgage market lending.
This paper is also related to other research studying the interaction between accounting and
regulatory capital rules. For example, Ellul et al. (2015) find evidence from the insurance industry
that when capital regulations are based on historical cost accounting, banks engage in “gains
trading” by selling securities which have appreciated in value, thereby realizing the gains in fair
values on these positions and selectively boosting net income. In fact, discouraging gains trading
was a key motivation among banking regulators for removing the AOCI filter in the first place.
Although Ellul et al. (2015) study a different research question to us, and focus on insurers rather
than banks, their work is quite closely related in the sense that it uses security-level data to study
how the interaction of accounting standards and capital rules affects securities holdings and trading
by financial institutions.
The evidence in this paper is also related to the broader debate about fair value accounting for
financial institutions (e.g., see Laux and Leuz, 2009).5 We note that the setting we study involves
a change in capital regulation which is not due to or accompanied by a corresponding change in
accounting standards. All banks are required to account for securities in the same way, both before
and after the introduction of the AOCI rule. What has changed is whether or not AOCI is counted
5This literature seeks to understand the costs and benefits of fair-value accounting and whether fair-value ac-counting reduces financial stability and contributes to fire sales, or was a contributing factor in the 2007-09 financialcrisis.
5

towards regulatory capital. However, our results are related for example to research by Barth et al.
(1995) which finds that the use of fair value accounting is associated with more volatility in earnings
and accounting equity, and more frequent breaches of regulatory capital requirements.
Banks are among the largest investors in fixed income securities, and an additional contribution
of our research is to present new stylized facts about the characteristics of bank securities holdings
and trends in these investments over time. This paper is thus related to research on why banks
hold securities. For instance, Hanson et al. (2015) argue that banks are “patient” fixed income
investors willing to hold relatively illiquid but higher yielding assets because of the sticky nature
of retail deposits. Hanson and Stein (2015) present evidence from Call report data that banks are
yield-oriented investors who invest in long-term securities when the yield curve is steep. These
papers highlight other determinants of bank security holdings, which in general we will control for
or dummy out (e.g., we will absorb time series variation in the shape of the yield curve by including
a vector of time dummies).
Finally, our research is related to the literature on the design of bank capital requirements and
the costs and benefits of using accounting values to determine minimum capital requirements. For
further discussion see Berger et al. (1995), Calomiris and Nissim (2014) and references therein.
2. Background and Institutional Details
2.1 Securities accounting
Under Financial Accounting Standard (FAS) 115, securities holdings are classified in three cate-
gories: “trading” securities that are bought and held principally for the purpose of selling in the
near term; “held to maturity” securities consisting of debt securities that the firm has the positive
intent and ability to hold until maturity; and “available for sale” securities not captured by either
of the above definitions, which the bank may retain for long periods but that may also be sold.6
Trading securities are accounted for at fair value. Held to maturity securities are accounted for at
amortized cost. The accounting treatment of available for sale securities follows an intermediate
6For more details, see Financial Accounting Standards Board (2010). Note that this study focuses on securitiesheld for investment purposes and classified as either HTM or AFS, rather than for securities held for trading.
6

approach, in which unrealized changes in fair value do not affect net income, but contribute to a
balance sheet item called accumulated other comprehensive income (AOCI). Changes in the fair
value of AFS securities will thus correspondingly lead to changes in book equity.7
Accounting standards discourage firms from selling or reclassifying any significant quantity of
securities classified as held-to-maturity—in particular, under the “tainting rule”, any firm doing so
will subsequently be prohibited from classifying any financial asset as held to maturity for a period
of two years after the occurrence of the event. Bank regulatory guidance also indicates that sales
or reclassifications of securities classified as HTM should be “rare.”8
2.2 The AOCI filter
In 1995, shortly after FAS 115 became effective, U.S. banking regulators introduced an “AOCI
filter”, which excluded balances recorded in AOCI from regulatory capital. The apparent motivation
for this decision was to reduce instability in regulatory capital. The AOCI filter was subsequently
removed under the international Basel III capital framework agreed upon in 2012. The decision to
remove the AOCI filter attracted significant comment from banks and industry groups, which argued
that the proposed policy change would increase the volatility of regulatory capital, discourage banks
from investing in risky fixed-income securities and force banks to maintain higher capital ratios as a
buffer against volatility (see for example Clearing House Association, 2011 and American Bankers
Association, 2012; see also Kim et al., 2017 for additional discussion and references).
In the final rule issued in July 2013 to implement Basel III in the United States, the AOCI filter
on regulatory capital was ultimately removed only for the largest banking organizations subject
to the Advanced Approaches Basel regulatory framework (see Board of Governors of the Federal
Reserve System, 2013), as well as to any non-advanced approaches firm which elected to include
AOCI in capital. The advanced approaches framework applies to large and/or internationally active
7Under the accounting standard, firms also record “other than temporary impairments” (OTTI) associated withpersistent reductions in the value of AFS or HTM fixed income securities value, generally associated with an adversecredit event related to the obligor. We note that there was an earlier 2009 accounting rule change governing theconditions under which an OTTI should be recognized (e.g., see https://www.occ.treas.gov/news-issuances/
bulletins/2009/bulletin-2009-11.html). This change is not directly related to our paper, however, and predatesour sample period.
8See https://www.occ.treas.gov/publications/publications-by-type/other-publications-reports/
baas.pdf.
7

banking organizations—generally those with at least $250 billion in total consolidated assets or at
least $10 billion in total on-balance sheet foreign exposure—and includes the depository subsidiaries
of those firms. Non advanced-approaches banks were given a one-time option to elect to opt out of
including AOCI in regulatory capital. Almost all firms elected to take up this option. The final rule
also phased in removal of the AOCI filter, with the percentage of AOCI counted towards regulatory
capital set at 20% in calendar year 2014, rising by 20% per year until full phase in at 100% in 2018.
2.3 Other regulatory changes
The removal of the AOCI filter on investment securities has occurred as part of a broader set
of banking regulatory reforms implemented since the 2007-09 financial crisis. Most notably, the
United States has (i) switched from Basel I to Basel III capital requirements, including changes
in risk-based capital requirements, an increase in the leverage ratio, and the introduction of a
supplementary leverage ratio, (ii) implemented supervisory stress testing via the comprehensive
capital analysis and review (CCAR) as an additional constraint on capital distributions by large
banking organizations, and (iii) introduced liquidity requirements via the liquidity coverage ratio
(LCR).
A challenge for empirical research on regulation is therefore to disentangle the effects of indi-
vidual regulatory changes from one other. In our analysis of portfolio risk and hedging, we address
these concerns by focusing on an analysis of changes in risk within a class of securities which have
the same regulatory capital risk weights and LCR weights. In particular, we examine changes in
risk within U.S. Treasury portfolios and within agency MBS portfolios. The introduction of the
LCR, or the higher leverage ratio, will induce shifts in investments across security types, but do
not directly affect the relative regulatory “cost” of holding a riskier vs less risky bond within a
security type (e.g., a long-duration Treasury security rather than a short-duration security—both
of which have the same (zero) risk weight and are counted as level 1 assets for purposes of the
leverage ratio).9 Similarly, we also examine the classification of securities as HTM or AFS finely,
9The higher leverage ratio, if binding, would induce banks to increase their holdings of assets with high riskweights, compared to otherwise similar banks bound by risk-based capital requirements. Similarly, the LCR inducesbanks to shift away from asset types which do not qualify as high-quality liquid assets.
8

generally by including a fixed effect for each security. We also focus our analysis on large bank
organizations all of which are subject to enhanced bank supervision and supervisory stress testing,
to minimize concerns that these exercises could change bank risk-taking incentives.
3. Sample and Data
Our empirical analysis focuses on large U.S. banking organizations with more than $50 billion in
total assets.10 We focus on this sample because smaller banks are likely to be a less appropriate
comparison group relative to the set of advanced approaches firms for which the removal of the AOCI
filter was mandatory. Aside from any inherent differences in the business model of smaller banks,
since the passage of the Dodd-Frank Act, BHCs larger than $50 billion in assets have been subject
to enhanced supervision, including annual supervisory stress tests as part of the comprehensive
capital analysis and review (CCAR) conducted by the Federal Reserve. This heightened supervisory
oversight may lead to changes in behavior unrelated to the removal of the AOCI filter. This sample
also corresponds to the set of firms for which we have security-level data.
3.1 Bank-level summary statistics
Table 1 summarizes the characteristics of our sample of banking organizations based on public
FR Y-9C data. The sample period for these summary statistics is 2010:Q1 to 2017:Q4. Securities
portfolios are an important asset class for this sample, comprising 17% of total assets for the average
bank, and 27% of assets for the bank at the 90th percentile of the distribution. A high fraction of
these securities are classified as available-for-sale (AFS), although as we will show, the fraction of
securities classified as held-to-maturity (HTM) increases sharply over the sample period.11
Table 1 also summarizes the composition of bank investment securities portfolios. The largest
10Nearly all the firms in our sample are commercial bank holding companies (BHCs). In recent quarters thesample also includes a set of intermediate holding companies (IHCs) of large foreign banking organizations, whenthose IHCs exceed $50 billion in total assets. In this paper we refer to this group of BHCs and IHCs as either bankingorganizations, or simply banks.
11Note that these statistics exclude securities held for trading purposes rather than for investment. Most firms inour sample do not have significant trading portfolios, although these are important for a a few of the largest firmswith large investment bank subsidiaries. Securities classified as trading assets are marked-to-market for regulatorycapital purposes throughout the sample period.
9

category, making up nearly half of the overall portfolio on average, is agency mortgage-backed
securities (MBS), representing interests in securitized pools of mortgages which are guaranteed
against default by Fannie Mae, Freddie Mac or Ginnie Mae. Agency passthrough MBS account for
29% of securities holdings, and agency collateralized mortgage obligations (representing structured
bonds backed by agency passthrough pools) make up another 20%. Other significant asset classes
include U.S. Treasury securities (10% share), U.S. government agency debt (8%), asset backed
securities (7%), municipal and state debt (6%) and foreign debt securities (6%).
The table also presents summary statistics for other bank controls included in our specifications,
such as asset size, profitability as measured by return on assets, capitalization as measured by the
tier 1 risk-based capital ratio, and balance sheet composition. The table also reports information
about the number of banks in the sample.
3.2 Security-level data
The bulk of our empirical analysis is based on CUSIP-level data on the bonds and other securities
underlying these aggregated statistics. These security-level data are drawn from Schedule B.1 of
the FR Y-14Q, a quarterly regulatory collection which supports the Federal Reserve’s supervisory
stress tests, and is filed by BHCs with at least $50 billion in consolidated assets. We also make
use of a closely related Y-14Q schedule that collects information on which investment securities
have qualified accounting hedges (“B.3”).12 The Y-14Q securities data are available from 2010:Q3
onwards, and in this paper draft we use FR Y-14Q data through 2017:Q2 (although the data
continue to be collected on an ongoing basis). We also augment our sample with data from an earlier
collection of security level data for a smaller number of firms collected by the Federal Reserve Bank
of New York starting in 2009:Q2; these earlier data are not part of our main statistical analysis,
however.
Figure 1 shows the number of banks reporting securities-level data, distinguishing between those
which now include AOCI in regulatory capital and those which do not. Except for one firm, this
corresponds to the set of advanced approaches banking organizations. The sample size increases
12See https://www.federalreserve.gov/reportforms/forms/FR_Y-14Q20140930_i.pdf for further informationon these and other FR Y-14 schedules.
10

over time. From 2009-11, the securities data are available only for a small number of firms. The
sample expands in 2011 to support the introduction of the Comprensive Capital Analysis and
Review (CCAR). The sample expands again in 2013, due to the later entry of a set of smaller
BHCs into the CCAR.13 Given the expansion of the number of BHCs which contribute to the
security-level sample over time, and the timing of the removal of the AOCI filter, our analysis of
the security-level data begins in 2011:Q3.
Table 2 summarizes information from the security-level data regarding the types of securities
held, pooling the data from 2011:Q3 to 2017:Q2, where in total about 3.7 million entries were
recorded. As in the Y-9C data, by far the largest asset class, both in terms of number of observations
and dollar share, are agency mortgage-backed securities (MBS). In terms of number of observations,
the next largest asset classes are municipal bonds and corporate bonds, though in terms of dollar
value, US Treasury and agency debt as well as (non-US) sovereign bonds are larger. Combined,
these five asset classes account for over 86 percent of observations (and 80 percent in terms of dollar
value).
For each security, banks are asked to report the security identifier (CUSIP), a description of
the security, the USD amount of their exposure (in terms of face value, amortized cost, and market
value), the purchase date, the accounting intent—HTM or AFS—and whether any other-than-
temporary impairment (OTTI) has been taken.
Based on the CUSIP identifier for each security, we are then able to merge in additional infor-
mation on the securities from vendor sources, such as the coupon and maturity of debt securities,
measures of their interest rate sensitivity (duration), or their credit rating.14
While we are limited in our ability to backfill all these variables for the historical data, coverage
for most of them is almost complete for the most recent quarters (starting in 2015:Q4). Of particular
interest for us as a measure of interest rate risk is the effective duration of different securities, drawn
from an industry-leading financial analytics vendor. Table 3 shows that municipal bonds tend to
have the highest effective duration, ahead of agency MBS and Treasury and agency bonds. This is
13This phase-in provision applied to 11 smaller bank holding companies, which were only required to begin com-plying with the full requirements of the supervisory stress tests in the 2014 stress testing cycle.
14CUSIPs are not available for all observations: about 9% are missing, of which about half are for sovereign bonds.
11

true even though agency MBS have much longer contractual remaining maturity—but due to the
free prepayment option embedded in U.S. fixed-rate mortgages, many homeowners are expected to
return their outstanding debt much sooner.
The table also reports a valuation measure, namely the ratio of reported fair value to face value,
which again tends to be highest for municipal bonds (though they also feature the largest standard
deviations). Coupon rates tend to be highest for corporate bonds and lowest for Treasury/Agency
bonds. We are able to observe the fraction of bonds for which there is a qualified accounting hedge.
This fraction is close to zero for agency MBS, though more than 10% for corporate bonds, municipal
and sovereign bonds.
In the next section, we will study how interest rate risk taking varies across banks subject and
not subject to the progressive removal of the AOCI filter. We have more limited coverage of the
duration of individual securities prior to 2015:Q4. However, for Treasury securities and agency
MBS we are able to impute these durations quite accurately, based on remaining maturity, coupon,
and (for agency MBS) origination vintage. Further details are provided in the Internet Appendix.
The Internet Appendix also describes our efforts to verify that aggregated values from the
security-level data “roll up” to information reported in BHC FR Y-14Q reports. The appendix
documents that the security-level data is comprehensive, in that the summed up values of the
security holdings match the Y-9C values closely.
4. Effects on portfolio risk
In this section, we test our first hypothesis, namely that affected banks respond to the phase-in of
the AOCI rule by reducing the level of risk in their securities portfolio. In our analysis to date we
focus on the level of interest rate risk, that is, the average duration of banks’ securities portfolios
for individual asset types, as well as overall (pooling across both AFS and HTM securities).
We proceed in two steps. First, we focus on the recent data since 2015:Q4 for which we have
duration measures for each of the main security types identified in the previous section, namely
agency MBS, Treasury/agency bonds, corporate bonds, municipal bonds, and sovereign bonds. We
start by measuring average duration by BHC across all of those assets, and test whether BHCs
12

subject to the removal of the AOCI filter (“AOCI banks”) have lower average duration (or risk
exposure, defined as duration times face value divided by total assets). We also test whether over
the time period for which we have this data there is any de-risking for AOCI banks.
Since the above analysis only covers a relatively short time period after the AOCI rule has
already been mostly phased in (2015:Q4 to 2017:Q2), it cannot conclusively be used to examine
whether the introduction of the AOCI rule in 2013 had dynamic effects on the riskiness of the
affected banks’ securities portfolio. To test this, we instead focus on two asset classes for which we
can impute duration measures going back to 2011 relatively well, namely US Treasuries and agency
MBS. As discussed earlier, looking within each of these asset classes also means that we do not
need to worry about effects of other concurrent regulatory changes (such as the Liquidity Coverage
Ratio or the Supplementary Leverage Ratio) which may have differentially affected different banks’
incentive to shift the composition of their portfolios from one asset class to another.
In most of our analyses, the key coefficient of interest is an interaction of an indicator variable
that equals one for banks affected by the removal of the AOCI filter (“AOCI banks”) interacted
with a step function that captures the gradual phase-in of the new rule. This step function is at 0
through the end of 2013, then increases by 0.2 in Q1 of each year (thus reaching 1 in 2018:Q1). This
specification assumes that banks adjust gradually to the AOCI filter removal, in proportion with
the percentage of AOCI counted towards regulatory capital. If instead banks acted by reducing
their portfolio risk or reshuffling securities prior to the phase-in (which is possible given that the
rule started being discussed as part of Basel III deliberations in December 2010; see Chircop and
Novotny-Farkas 2016 for a timeline), this might bias our estimated coefficients. There could be
downward bias if the adjustment took place prior to 2014; however, there could instead be upward
bias if most of the adjustment to the AOCI rule took place early in the phase-in period, e.g. in
2014, when our “phase-in” variable only takes a value of 0.2. However, at least when it comes
to re-classification of securities from AFS to HTM, we will see later (Figure 3) that there is little
evidence of anticipation effects prior to 2014, and that the effects of the new rule have occurred
gradually since then.
13

4.1 Cross-sectional analysis of duration: pooled securities portfolio
First we establish some stylized facts about the level and changes in overall duration. In the first
two columns of Table 4, we test whether, since 2015:Q4, banks subject to the removal of the AOCI
filter have lower average interest rate risk in their securities portfolio. Specifically we estimate the
following regression:
Riskb,t = α+ γt + β · AOCI bankb + εb,t. (1)
where Riskb,t is interest rate risk of bank b at time t, measured in two ways: (i) as the average
duration (weighted by current face value of a security) across the five main asset classes; or (ii)
multiplying this duration by the total face value of the securities holdings, divided by the banks’
total assets. We call this second measure the “Total Risk Exposure.” The regressions also include
quarter fixed effects, γt.
The table indicates that there are no significant cross-sectional differences in average interest
rate risk taking between AOCI banks vs. non-AOCI banks. The average duration is slightly lower,
although the total risk exposure is somewhat higher. However, these differences are quantitatively
small and the coefficients are not precisely estimated.
In columns (3) and (4), we test whether AOCI banks have been reducing the overall duration
of their securities portfolio as the rule is being progressively phased in (i.e. as a greater percentage
of AOCI is being included in regulatory capital). To do so, we interact the AOCI bank dummy
with time (at quarterly frequency), now including bank fixed effects (αb):
Riskb,t = αb + γt + δ · AOCI bankb × t+ εb,t. (2)
The negative coefficient in column (3) indicates that from late 2015 to mid-2017, there is indeed a
relative downward trend in average duration in AOCI banks’ securities portfolios. The coefficient
of -0.09, significant at the 5% level, implies that the affected AOCI banks reduced the average
duration at an annual rate of about 10% of the average (= 4 ∗ 0.09/3.68). However, as discussed
above, this is not a particularly sharp test of the causal effect of the removal of the AOCI filter,
since total duration could be affected by a range of regulatory changes during this period—for
14

example a rotational shift into high-quality liquid assets to satisfy the liquidity converage ratio.
(The time period studied is also fairly short, and does not include any of the ”pre” period before
the AOCI rule is announced and implementation begins). Furthermore, in column (4), where we
use total risk exposure, the coefficient is close to zero and not statistically significant.
In sum, this initial analysis does not reveal large differences in the absolute level of duration
between AOCI and non-AOCI banks. It does show some evidence of a recent reduction in average
duration among AOCI banks, although their total duration risk exposure has not been significantly
decreasing.
4.2 Duration in Treasury and agency MBS portfolios: longer sample
We now turn to an analysis over a longer sample period of the evolution of interest rate risk
exposure for the two most important asset classes in bank securities portfolios, namely agency
MBS and Treasury debt. For those asset classes, we are able to extend the sample back to 2011 by
imputing duration measures (see Internet Appendix for details of how this is done).15
Similar to the previous subsection, we then regress either average duration or total risk exposure
in that asset class on the AOCI-bank dummy, but now interacted with our measure of the phase-in
of the new rule including AOCI in regulatory capital:
Riskb,t = αb + γt + δ · AOCI bankb × phase-int + εb,t. (3)
Table 5 presents the results. As discussed earlier, these results are based on looking within
each of these asset classes, which have a common risk weight—helping to identify the effect of the
removal of the AOCI filter from other regulatory changes during this period.16 We see that the
point estimates of the estimated effects of AOCI on the duration of AOCI banks’ MBS and Treasury
portfolios is negative, consistent with some risk reduction, but far from statistically significant
15Note that for agency MBS we only retain standard pass-through securities, meaning we drop collateralizedmortgage obligations and similarly “complex” structured securities for which imputing duration is more challenging.Pass-through MBS account for about 60% of the face value of banks’ MBS holdings.
16One exception to this general point is that within agency MBS, Ginnie Mae securities are treated differently forthe liquidity coverage ratio than agency MBS issued by Fannie Mae and Freddie Mac, suggesting we may wish toconsider these two subtypes of agency MBS separately. We plan to address this in the next draft of this paper.
15

(columns 1 and 3).17
We note in contrast that the total risk exposure of AOCI banks to these two asset classes in
fact increased, and significantly so for Treasuries. This increase in total exposure to Treasury secu-
rities likely reflects the effects of other regulations introduced around the same time—in particular
the Liquidity Coverage Ratio (LCR) which required advanced approaches firms to increase their
holdings of liquid assets.
4.3 MBS and Treasury yields
As an alternative measure of risk-taking, and to complement to the above analysis on duration, we
examine differential trends in the average yield on Treasury securities and MBS, measured as the
annualized ratio of interest income to the book value of securities held. These can be measured
directly using FR Y-9C data. Securities with higher yields will in general be exposed to greater
risk. This will be in the form of interest rate risk in the case of Treasury securities and interest rate
risk and prepayment risk in the case of agency MBS. For other types of securities such as corporate
bonds, yields will also reflect credit risk and liquidity risk.18 We note however that there are also
limitations of examining yield as a measure of risk—for example it will be misleading in the case
of zero coupon bonds (such as principal-only collateralized mortgage obligations).
Results are shown in Table 6. Conditioning on entity and time fixed effects, as in our earlier
specifications (and in specifications (2), (4) and (6), a set of bank characteristics), we find a negative
point estimate on the coefficient on AOCI bank × phase-in, implying that banks including AOCI
in capital are on average shifting towards less risky securities. The effect is 22-59 basis points for
Treasury securities and 2-17bp for MBS. However, none of these coefficients are close to statistically
significant.
17The point estimate in column (3) is large in magnitude, but very imprecisely estimated, due to some largeidiosyncratic movements at a small number of firms. The timing of these idiosyncratic movements also does not alignparticularly well with the phase-in of the new rule.
18For our security-level data we find that yield is significantly positively correlated with duration, as expected.
16
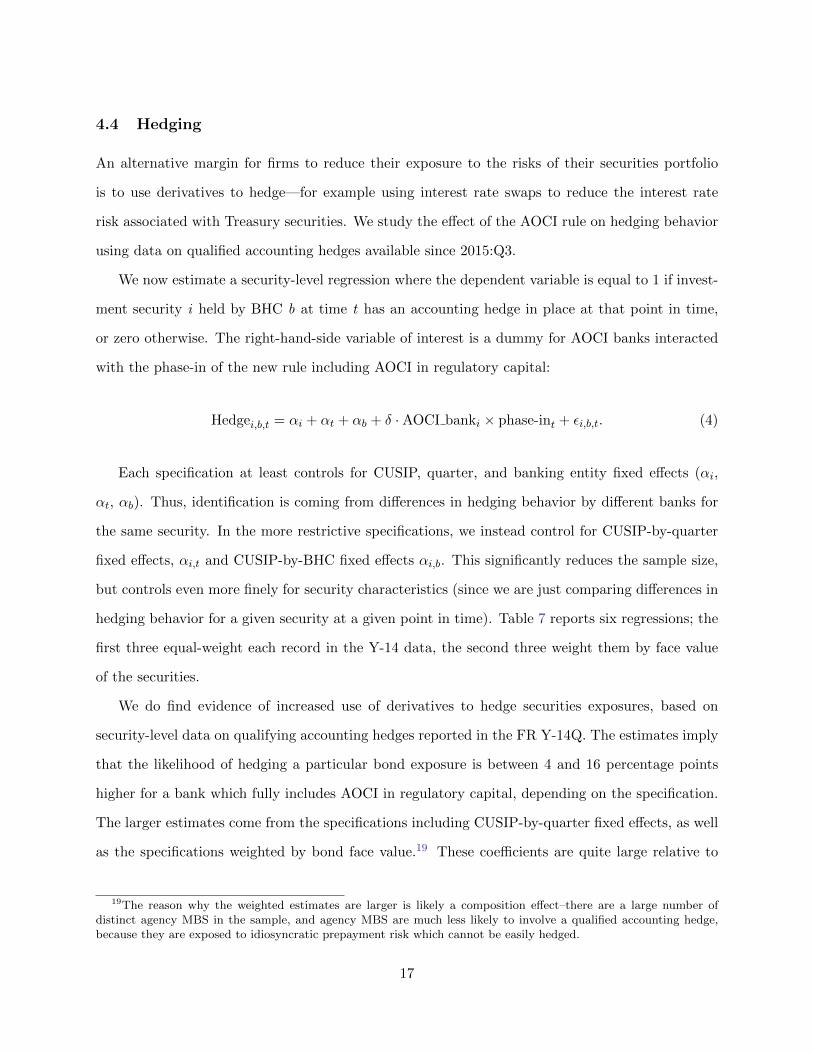
4.4 Hedging
An alternative margin for firms to reduce their exposure to the risks of their securities portfolio
is to use derivatives to hedge—for example using interest rate swaps to reduce the interest rate
risk associated with Treasury securities. We study the effect of the AOCI rule on hedging behavior
using data on qualified accounting hedges available since 2015:Q3.
We now estimate a security-level regression where the dependent variable is equal to 1 if invest-
ment security i held by BHC b at time t has an accounting hedge in place at that point in time,
or zero otherwise. The right-hand-side variable of interest is a dummy for AOCI banks interacted
with the phase-in of the new rule including AOCI in regulatory capital:
Hedgei,b,t = αi + αt + αb + δ · AOCI banki × phase-int + εi,b,t. (4)
Each specification at least controls for CUSIP, quarter, and banking entity fixed effects (αi,
αt, αb). Thus, identification is coming from differences in hedging behavior by different banks for
the same security. In the more restrictive specifications, we instead control for CUSIP-by-quarter
fixed effects, αi,t and CUSIP-by-BHC fixed effects αi,b. This significantly reduces the sample size,
but controls even more finely for security characteristics (since we are just comparing differences in
hedging behavior for a given security at a given point in time). Table 7 reports six regressions; the
first three equal-weight each record in the Y-14 data, the second three weight them by face value
of the securities.
We do find evidence of increased use of derivatives to hedge securities exposures, based on
security-level data on qualifying accounting hedges reported in the FR Y-14Q. The estimates imply
that the likelihood of hedging a particular bond exposure is between 4 and 16 percentage points
higher for a bank which fully includes AOCI in regulatory capital, depending on the specification.
The larger estimates come from the specifications including CUSIP-by-quarter fixed effects, as well
as the specifications weighted by bond face value.19 These coefficients are quite large relative to
19The reason why the weighted estimates are larger is likely a composition effect–there are a large number ofdistinct agency MBS in the sample, and agency MBS are much less likely to involve a qualified accounting hedge,because they are exposed to idiosyncratic prepayment risk which cannot be easily hedged.
17

the sample average of the likelihood of a hedge, which is 5-6 percent for the weighted regressions
and 2 percent for the unweighted regressions. Some caution should be exercised in extrapolating
the magnitude of the largest estimates to the entire sample, since they are based only on the subset
of securities which are held by multiple banks and for which there is cross-sectional variation in
hedging behavior at a given point in time. The hedging data are also available over only a short
time period which does not include the period prior to the phase-in of the AOCI rule.
5. Risk shuffling
We now examine other margins of adjustment in response to tying bank capital to the market
value of the AFS securities portfolio via the removal of the AOCI filter. In particular we examine
whether firms classify a greater proportion of securities as “held to maturity.” Since HTM securities
are measured at historic cost for all firms, classifying securities in this way provides a mechanism
for banks to mitigate the impact of the removal of the AOCI filter without reducing the level of
risk or income on their securities portfolio.
5.1 Held to maturity: Portfolio-level results
Before turning to our regression analysis, Figure 3 plots the share of securities classified as held-
to-maturity, splitting the bank sample by whether they are subject to the removal of the AOCI
filter or not. We see a parallel increase in the fraction of HTM for both groups during 2012 and
2013 — however the trend sharply diverges from the start of 2014 onwards, once the AOCI rule
begins coming into effect. From then onwards there is a continued upward trend in the HTM share
for “AOCI banks” including AOCI in regulatory capital, but in contrast the ratio is flat for the
non-AOCI bank group.
This graphical evidence supports the argument that the AOCI rule induces substitution by
banks into HTM, partially insulating regulatory capital from the volatility associated with move-
ments in security fair value. The shape of this differential trend (which appears in 2014 and rises
fairly linearly thereafter) also supports our choice to specify the “post” period in terms of the
percentage of AOCI counted towards regulatory capital.
18

Closely related to this graphical evidence, we now estimate the following bank-level panel re-
gression model using Y-9C data:
%HTMb,t = αb + γt + δ · AOCI bankb × phase-int + Γ ·Xb,t + εb,t. (5)
The dependent variable “% HTM” is defined as the percentage of investment securities for BHC
b at time t which are classified as HTM (between 0 and 100). The key right-hand-side variable of
interest is AOCI bank × phase-in, which measures the fraction of AOCI counted towards regula-
tory capital for the BHC. All our specifications include BHC fixed effects and time fixed effects by
quarter. This ensures that our estimates are identified only based on within-firm variation in the
composition of the securities portfolio as the AOCI filter is progressively removed over time. We
then estimate various different specifications controlling for other combinations of BHC character-
istics, Xb,t. Results are shown in Table 8. Standard errors are clustered by BHC.
Consistent with the graphical evidence, the results suggest that AOCI banks classify a greater
percentage of their investment securities portfolios as held-to-maturity as the AOCI rule is phased
in. The interpretation of the coefficient is that the full removal of the filter increases the share of
securities held as HTM by 17 to 20 percentage points, depending on the specification. The estimated
coefficient of interest is not very sensitive to the the inclusion or exclusion of BHC characteristics
(perhaps unsurprisingly given that we already include BHC fixed effects).
Our results here are consistent with other concurrent work on the AOCI filter, in particular
Kim et al. (2017) and Hamilton (2018), which also finds a shift in securities portfolio composition
towards HTM among banks subject to the new rule. However, a limitation of our analysis so far is
that with Y-9C data, we are not able to control in a fine way for the characteristics of the securities
held, which may also be changing as the AOCI filter is removed, or be evolving for other reasons
during this sample period (e.g., the introduction of the liquidity coverage ratio). To address this
limitation, we turn to an analysis based on security-level Y-14Q data.
19

5.2 Held to maturity: Security-level results
We now estimate a security-level regression where the dependent variable is equal to 1 if investment
security i held by BHC b at time t is classifed as HTM at that point in time, or zero if classified as
AFS. As before, the key right-hand-side variable of interest is a dummy for AOCI banks interacted
with the phase-in of the new rule:
HTMi,b,t = αi + αt + αb + δ · AOCI banki × phase-int + εi,b,t. (6)
As in the earlier security-level hedging regressions, we always control at least for CUSIP, quarter,
and BHC fixed effects (αi, αt, αb). In the more restrictive specifications, we instead control for
CUSIP-by-quarter fixed effects, αi,t and CUSIP-by-BHC fixed effects αi,b. Table 9 reports six
regressions; the first three equal-weight each record in the Y-14 data, the second three weight them
by face value of the securities.
Columns (1) and (4) test whether the Y-9C results above were somehow driven by different
banks holding different securities that are more or less “suitable” for HTM status. Columns (2)
and (5) add CUSIP-by-quarter fixed effects, meaning that we look within the same security in the
same quarter and test whether AOCI banks became more likely to classify the security as HTM as
the AOCI phase-in progresses. Columns (3) and (6) further add CUSIP-by-BHC fixed effects, in
order to test whether AOCI banks disproportionately change the intent of a fixed CUSIP in their
portfolio from AFS to HTM over the course of the phase-in.
We see that the coefficient on the AOCI dummy interacted with the phase-in measure is positive
in all columns, meaning that banks subject to the removal of the AOCI filter become dispropor-
tionately more likely to hold a fixed CUSIP as HTM as the rule phase-in progresses. They are
largest in columns (2) and (5), which look within CUSIP-quarter.20 Thus, the shift to HTM holds
even when just comparing the same security held by different BHCs at the same point in time. If
anything, the weighted coefficient in column (5) of 0.34 is actually larger than the portfolio-level
results from Table 8.
20Using CUSIP×Quarter fixed effects reduces the number of observations by more than half, since only CUSIPsthat are held by more than one bank in a given quarter are included in the regression.
20
In columns (3) and (6), which additionally control for CUSIP-by-BHC fixed effects, coefficients
are positive (meaning there is some re-classification of fixed securities occurring), but not nearly as
large as in the immediately prior two columns. This means that most of the trend towards HTM
shares comes from the “extensive margin” (securities being added to portfolio or sold from it),
rather than the reclassification of securities already held in the portfolio. As in the earlier columns,
results are larger when observations are value-weighted.
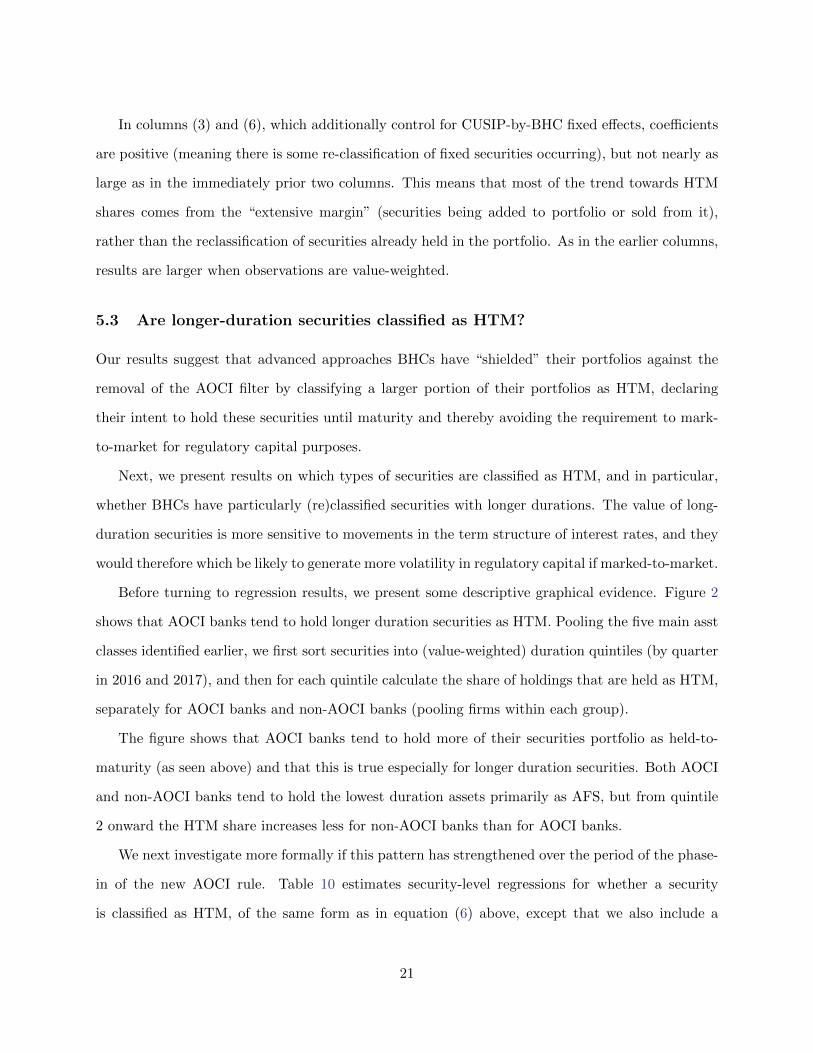
5.3 Are longer-duration securities classified as HTM?
Our results suggest that advanced approaches BHCs have “shielded” their portfolios against the
removal of the AOCI filter by classifying a larger portion of their portfolios as HTM, declaring
their intent to hold these securities until maturity and thereby avoiding the requirement to mark-
to-market for regulatory capital purposes.
Next, we present results on which types of securities are classified as HTM, and in particular,
whether BHCs have particularly (re)classified securities with longer durations. The value of long-
duration securities is more sensitive to movements in the term structure of interest rates, and they
would therefore which be likely to generate more volatility in regulatory capital if marked-to-market.
Before turning to regression results, we present some descriptive graphical evidence. Figure 2
shows that AOCI banks tend to hold longer duration securities as HTM. Pooling the five main asst
classes identified earlier, we first sort securities into (value-weighted) duration quintiles (by quarter
in 2016 and 2017), and then for each quintile calculate the share of holdings that are held as HTM,
separately for AOCI banks and non-AOCI banks (pooling firms within each group).
The figure shows that AOCI banks tend to hold more of their securities portfolio as held-to-
maturity (as seen above) and that this is true especially for longer duration securities. Both AOCI
and non-AOCI banks tend to hold the lowest duration assets primarily as AFS, but from quintile
2 onward the HTM share increases less for non-AOCI banks than for AOCI banks.
We next investigate more formally if this pattern has strengthened over the period of the phase-
in of the new AOCI rule. Table 10 estimates security-level regressions for whether a security
is classified as HTM, of the same form as in equation (6) above, except that we also include a
21

triple interaction term for AOCI bank × phase-in × above-median duration. The coefficient on
this variable measures whether the trend towards HTM is more pronounced for bonds with longer
duration.21 We include CUSIP×quarter and bank fixed effects, as in columns (2) and (5) of Table 9.
The triple interaction term is positive, at least marginally statistically significant, and also
quantitatively large (it is generally at least as large as the single interaction on AOCI bank ×
phase-in). Consistent with the graphical evidence, this suggests that the trend towards HTM is
heavily concentrated in bonds with a high level of interest rate risk.
5.4 Which banks? Which security types?
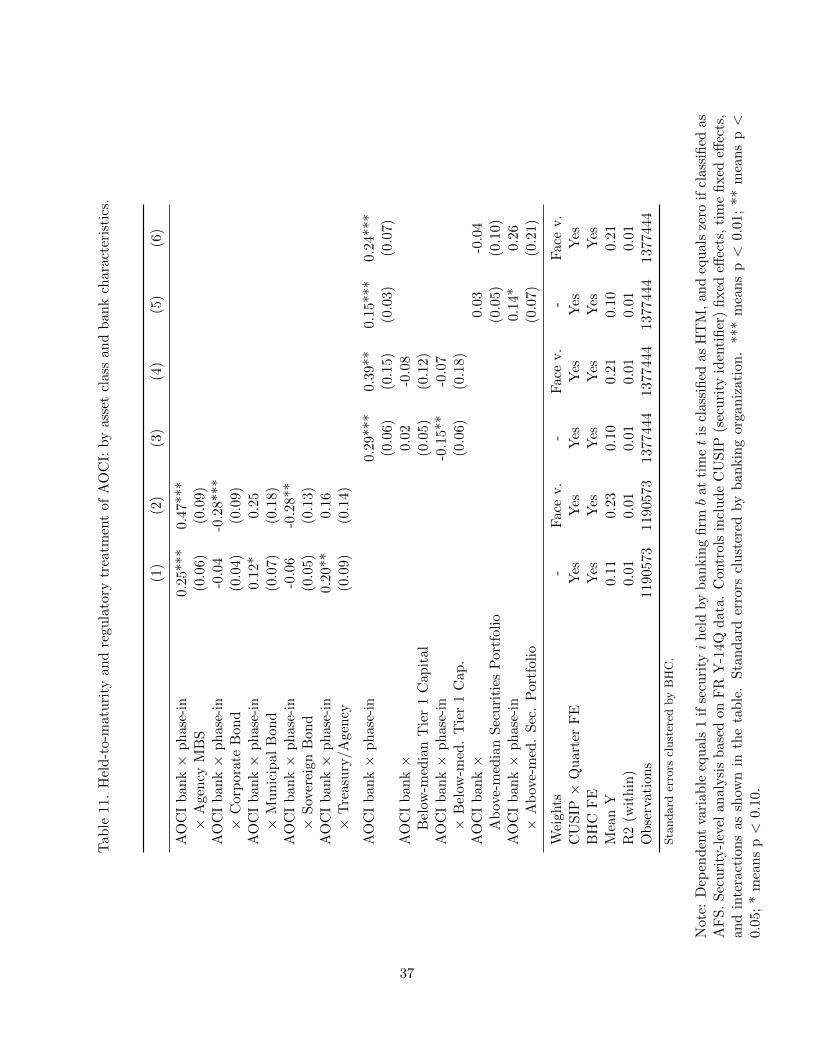
Augmenting this evidence, in Table 11 we present additional evidence about which types of firms
and security types experience a more pronounced trend towards HTM. We note that the power
of some of these regressions is relatively low, in part due to the fact that we adopt a conservative
assumption of clustering standard errors by BHC.
Columns (1) and (2) present results interacting the variable of interest with security types. The
coefficients are largest for agency MBS and Treasury/agency securities, although the coefficients
are also positive for municipal bonds and sovereign bonds.
Columns (3) and (4) interact the AOCI bank × phase-in variable with an interaction term
for whether the BHC’s capital ratio is below median. Perhaps surprisingly, we find no evidence
that reclassification is more pronounced among firms with low capital ratios; if anything the op-
posite is true. There are a number of limitations here, however; for example we consider only one
type of minimum capital requirement and do not consider the role of stress tests in determining
firms’ “headroom” relative to minimum capital requirements. These preliminary results should
correspondingly be treated cautiously.
Finally, columns (5) and (6) interact AOCI bank × phase-in with a dummy for whether the firm
has an above-median sized investment securities portfolio, as a percent of total assets. One might
imagine that firms with very large securities portfolios may have particularly strong incentives to
reclassify securities, given the volatility induced by the removal of the AOCI filter. Directionally,
21The regression also includes all single interaction terms or partials them out by the inclusion of the relevantfixed effects.
22

we find that this is the case, although the statistical significance of the estimated coefficient is weak.
5.5 Loans versus securities
Another margin available to banks to mitigate the effect of the AOCI filter removal is to hold
fixed income assets in the form of whole loans instead of securities. We examine this margin in
the context of BHC mortgage portfolios. This seems like a natural setting, since it is extremely
common for BHCs originate mortgages and then switch them to MBS through the agency MBS
market (often these resulting MBS are still retained on balance sheet, as shown by the high overall
share of agency MBS in BHC securities portfolios).
We investigate this question using FR Y-9C data, using a panel regression model similar in
structure to Table 8. The dependent variable is “mortgage share” which is defined as the ratio of
residential mortgage assets as a percentage of residential mortgages and mortgage backed securities
owned by BHC b at time t.
Results are shown in Table 12. As before, our regressions control for both time and BHC fixed
effects, and the key coefficient of interest is on the interaction term AOCI bank × phase-in. This
coefficient is consistently positive, with a coefficient of about 0.1. This point estimate implies that
the fraction of mortgage investments held in the form of whole loans rather than securities increases
by about 10 percentage points under the full phase-in of the staggered removal of the AOCI filter.
However, the coefficient is at most marginally statistically significant.
6. Conclusions
Using detailed security-level data, we present new evidence on the effects of measuring regulatory
capital using market values rather than book values. We find only limited evidence that banks
respond to the policy change by reducing risk, although there is some evidence that the removal of
the AOCI filter induces banks to hedge more actively. Instead, banks reclassify securities to shield
their portfolios from the effects of the removal of the AOCI filter, particularly for securities with
high levels of interest rate risk. There is also some weak evidence of a shift towards holding whole
loans, which are not marked to market.
23

Reclassifying long-duration securities as “held-to-maturity” dampens the volatility of measured
regulatory capital, but does not in itself reduce the fundamental risk (e.g., interest rate risk or
prepayment risk) of the assets held by BHCs. In fact on some dimensions they may increase risk,
for example by making it more difficult for banking organizations to liquidate securities holdings
during periods of stress. Our results highlight the potentially unanticipated effects of treating
assets differently for regulatory purposes depending on where they are held on the balance sheets
of financial institutions.
24

References
American Bankers Association (2012): “Treatment of unrealized gains and losses under the
Basel III capital framework,” Comment letter.
Barth, M. E., W. R. Landsman, and J. M. Wahlen (1995): “Fair value accounting: Effects
on banks’ earnings volatility, regulatory capital, and value of contractual cash flows,” Journal of
Banking and Finance, 19, 577 – 605, the Role of Capital in Financial Institutions.
Berger, A. N., R. J. Herring, and G. P. Szego (1995): “The role of capital in financial
institutions,” Journal of Banking and Finance, 19, 393 – 430, the Role of Capital in Financial
Institutions.
Board of Governors of the Federal Reserve System (2013): “Federal Reserve Board
approves final rule to help ensure banks maintain strong capital positions,” Comment letter.
Calomiris, C. W. and D. Nissim (2014): “Crisis-related shifts in the market valuation of banking
activities,” Journal of Financial Intermediation, 23, 400 – 435.
Chircop, J. and Z. Novotny-Farkas (2016): “The economic consequences of extending the use
of fair value accounting in regulatory capital calculations,” Journal of Accounting and Economics,
62, 183 – 203, conference papers 2015.
Clearing House Association (2011): “Treatment of Unrealized Gains and Losses Under the
Basel III Capital Framework,” Comment letter.
Ellul, A., C. Jotikasthira, C. T. Lundblad, and Y. Wang (2015): “Is Historical Cost
Accounting a Panacea? Market Stress, Incentive Distortions, and Gains Trading,” The Journal
of Finance, 70, 2489–2538.
Financial Accounting Standards Board (2010): “Statement of Financial Accounting Stan-
dards No. 115: Accounting for Certain Investments in Debt and Equity Securities,” Original
Announcement As Amended.
25
Haldane, A. (2012): “The Dog and the Frisbee,” Speech at the Federal Reserve Bank of Kansas
City economic policy symposium on ‘The Changing Policy Landscape’.
Hamilton, D. (2018): “Fear of (Capital) Commitment: Strategic Accounting Classifications and
the Consequences for Fixed Income Dealer Inventories,” SSRN Working Paper.
Hanson, S., A. Shleifer, J. C. Stein, and R. W. Vishny (2015): “Banks as patient fixed-
income investors,” Journal of Financial Economics, 117, 449–469.
Hanson, S. G. and J. C. Stein (2015): “Monetary policy and long-term real rates,” Journal of
Financial Economics, 115, 429 – 448.
Kim, S., S. Kim, and S. G. Ryan (2017): “Economic Consequences of the AOCI Filter Removal
for Advanced Approaches Banks,” SSRN Working Paper.
Laux, C. and C. Leuz (2009): “The crisis of fair-value accounting: Making sense of the recent
debate,” Accounting, Organizations and Society, 34, 826 – 834.
26

Figures and Tables
Figure 1. Number of banking organizations in security-level sample over time
Note: Figure plots the number of banking organizations for which security level data are avail-
able at each point in time during sample period. “AOCI bank” refers to banking organizations
which now include AOCI in regulatory capital. FR Y-14Q data sample does not include a number
of intermediate holding companies (IHCs) which only recently began filing the FR Y-14Q schedule.
27
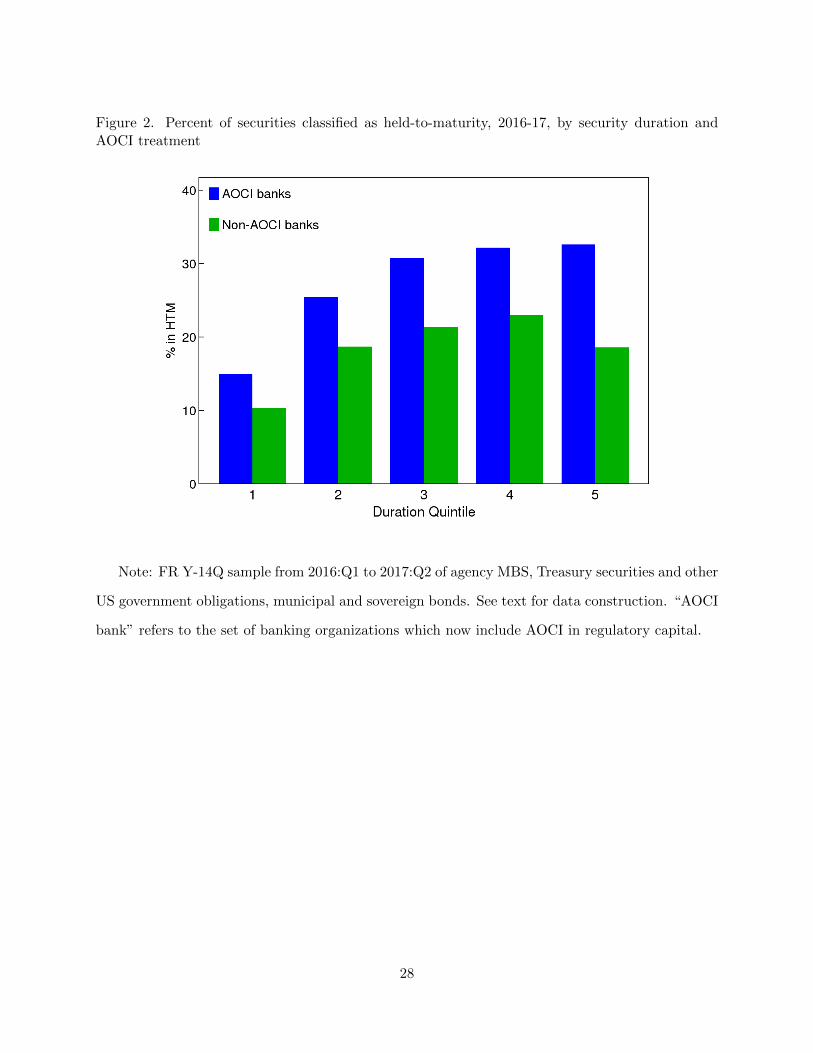
Figure 2. Percent of securities classified as held-to-maturity, 2016-17, by security duration andAOCI treatment
Note: FR Y-14Q sample from 2016:Q1 to 2017:Q2 of agency MBS, Treasury securities and other
US government obligations, municipal and sovereign bonds. See text for data construction. “AOCI
bank” refers to the set of banking organizations which now include AOCI in regulatory capital.
28

Figure 3. Percentage of investment securities classified as held-to-maturity
Note: Source is FR Y-9C. Data sample is the set of banking firms included in summary statis-
tics in Table 1 (see Internet Appendix for full list). “AOCI bank” refers to the set of banking
organizations which now include AOCI in regulatory capital. The transition to including AOCI in
regulatory capital begins in 2014:Q1.
29

Table 1. Summary statistics: FR Y-9C data sample
mean sd p10 p50 p90
Total Assets 411.66 620.51 60.72 150.04 1,488.06Total Risk-Weighted Assets 253.18 362.80 48.69 100.98 991.61Investment SecuritiesAvailable for sale, % assets 14.98 9.16 5.11 13.97 24.01Held to maturity, % assets 1.72 2.72 0.00 0.47 5.37Total investment securities, % assets 16.70 10.20 5.29 15.45 27.00Composition of securities, % of totalUS Treasury Securities 10.79 17.82 0.01 2.53 33.87US Government Agency Obligations 7.71 11.74 0.00 2.15 25.51US State and Municipal Debt 6.35 11.65 0.03 2.84 14.84Agency Pass-through MBS 29.07 24.21 2.81 24.76 66.47Agency CMOs 19.57 21.31 0.00 13.97 47.14Non-agency MBS 5.78 7.31 0.00 2.63 18.52Asset Backed Securities 7.44 8.87 0.00 4.20 22.62Other Domestic Debt Securities 3.42 5.01 0.00 1.64 7.90Foreign Debt Securities 6.20 9.66 0.00 0.97 20.92Equity Securities and Mutual Funds 3.34 9.93 0.04 0.75 6.53Bank Characteristics, % Total AssetsResidential Family Real Estate 13.44 8.97 0.02 14.00 25.17Commercial Real Estate 9.40 8.76 0.10 8.85 20.79Credit Cards 5.15 13.41 0.00 0.44 8.54Other Consumer Loans 6.20 6.64 0.20 4.57 14.03Other Loans 19.36 9.89 6.61 19.03 32.66Trading Assets 5.03 9.26 0.01 0.90 16.18Fed Funds Sold & Sec Purch to Resell 4.76 9.67 0.00 0.24 17.18Total Investment Securities 16.70 10.20 5.29 15.45 27.00Other Real Estate Owned 0.14 0.16 0.00 0.09 0.33Fixed Assets, Assets 0.85 0.46 0.30 0.76 1.62Inv in Unconsolidated Subsidiaries 0.36 0.56 0.00 0.19 0.93Inv in RE Ventures 0.14 0.26 0.00 0.00 0.44Intangible Assets 3.39 2.43 0.64 3.16 6.92Total Deposits 60 21 24 69 80Public [yes=1] 0.7599 0.4275 0.00 1.00 1.00Foreign [yes=1] 0.2401 0.4275 0.00 0.00 1.00Tier 1 risk-based capital ratio (%) 12.83 2.99 10.37 12.45 16.31Return on assets (annualized, %) 0.84 1.17 0.13 0.83 1.60
Number of Firms 42Number of Firms Including AOCI in reg. capital 19Total Number of Observations 1101
Note: Sample period is 2010:Q1 to 2017:Q4. Summary statistics based on FR Y-9C data, basedon commercial BHCs and IHCs with assets exceeding $50bn subject to supervisory stress testing.See Internet Appendix for full list of banking organizations in sample.
30

Table 2. Shares of different asset classes in FR Y-14Q securities data, 2011:Q3-2017:Q2.
Asset Class Observations (000s) Dollar Share (%) Obs. Share (%)
AGENCY MBS 2078 46.41 59.16US TREASURIES & AGENCIES 106 15.43 3.01SOVEREIGN BOND 152 8.27 4.34MUNICIPAL BOND 533 6.53 15.18CLO 33 3.37 0.94CORPORATE BOND 234 3.37 6.67CMBS 69 3.30 1.98FOREIGN RMBS 34 3.16 0.97DOMESTIC NON-AGENCY RMBS 104 2.73 2.95STUDENT LOAN ABS 28 1.93 0.81CREDIT CARD ABS 10 1.05 0.28COVERED BOND 7 1.03 0.19AUTO ABS 15 0.95 0.42OTHER ABS (EXCL HEL ABS) 15 0.88 0.44OTHER 9 0.50 0.25MUTUAL FUND 24 0.42 0.67AUCTION RATE SECURITIES 35 0.41 0.99CDO 5 0.15 0.13PREFERRED STOCK (EQUITY) 7 0.09 0.19COMMON STOCK (EQUITY) 15 0.03 0.44
Total 3705 100 100
Table 3. Descriptive statistics (mean and standard deviation) of key bond characteristics acrossmain asset classes, 2015:Q4-2017:Q2.
Agency Corporate Municipal Sovereign US Treasury/ TotalMBS Agency
Effective Duration (years) 3.95 3.26 7.29 2.69 4.06 4.07(1.90) (2.49) (3.68) (2.59) (2.44) (2.44)
Remaining Maturity (years) 24.15 4.82 17.79 3.26 4.88 17.14(7.15) (5.54) (8.54) (3.27) (4.30) (11.16)
Fair Value / Face Value 1.03 1.02 1.06 1.03 1.00 1.03(0.04) (0.08) (0.13) (0.08) (0.06) (0.06)
Coupon (%, annual) 2.45 3.39 2.78 2.19 1.52 2.25(1.48) (2.14) (2.28) (2.30) (0.80) (1.59)
Hedge (%) 0.01 0.23 0.16 0.17 0.12 0.07(0.11) (0.42) (0.37) (0.38) (0.32) (0.25)
31

Table 4. Average duration and total interest rate risk exposure, main asset classes, by regulatorytreatment of AOCI
(1) (2) (3) (4)Duration Total Risk Exposure Duration Total Risk Exposure
AOCI bank -0.03 0.07(0.34) (0.09)
AOCI bank × -0.09** -0.01time (0.04) (0.01)
Quarter FE Yes Yes Yes YesBHC FE No No Yes YesMean Y 3.68 0.57 3.68 0.57St.Dev.(Y) 1.02 0.25 1.02 0.25R2 (within) 0.00 0.02 0.09 0.02Observations 221 218 221 218
Note: Dependent variable is either weighted average duration or total risk exposure (durationscaled by firm size). “AOCI bank” is a dummy equal to 1 for banking organizations which nowinclude AOCI in regulatory capital. ‘Time” is a time trend measured in quarters. Sample periodis 2015:Q4-2017:Q2. Standard errors clustered by banking organization. *** means p < 0.01; **means p < 0.05; * means p < 0.10.
Table 5. Duration and interest rate risk exposure by regulatory treatment of AOCI: Agency MBSand Treasury securities
(1) (2) (3) (4)MBS Duration MBS Tot Risk Exposure Tsy Duration Tsy Tot Risk Exposure
AOCI bank × -0.09 0.04 -1.09 0.11***phase-in (0.22) (0.04) (1.32) (0.04)
Quarter FE Yes Yes Yes YesBHC FE Yes Yes Yes YesMean Y 3.25 0.14 3.58 0.07R2 (within) 0.00 0.01 0.01 0.10Observations 636 619 599 582
Note: Dependent variable is either weighted average duration or total risk exposure (duration scaledby firm size). “AOCI bank” is a dummy equal to 1 for firms which now include AOCI in regulatorycapital. “Phase-in” is a variable between 0 and 1 measuring the percent of AOCI included inregulatory capital for for AOCI banks in the relevant quarter. Sample period is 2011:Q3-2017:Q2.Standard errors clustered by banking organization. *** means p < 0.01; ** means p < 0.05; *means p < 0.10.
32

Table 6. Security yields and regulatory treatment of AOCI
(1) (2) (3) (4) (5) (6)Treasury yield MBS yield Other security yield
AOCI bank × -0.22 -0.59 -0.17 -0.02 -0.30 0.08phase-in (0.54) (0.48) (0.47) (0.52) (0.48) (0.62)
Time FE Yes Yes Yes Yes Yes YesEntity FE Yes Yes Yes Yes Yes YesStress test Yes Yes Yes Yes Yes YesAsset size No Yes No Yes No YesControls No Max No Max No MaxR2 0.03 0.09 0.24 0.30 0.05 0.10Observations 1101 1101 1101 1101 1101 1101
Note: Dependent variable is the book yield for the security type in question for bank b at time t,measured as annualized interest income as a percentage of accounting book value for investmentsecurities, constructed using FR Y-9C data. “AOCI bank” is a dummy equal to 1 for firms whichnow include AOCI in regulatory capital. “Phase-in” is a variable between 0 and 1 measuring thepercent of AOCI included in regulatory capital for AOCI banks in quarter t. Sample period is2010:Q1-2017:Q4. Specifications where asset size = “yes” include log(assets). Specifications wherecontrols = “max” include all bank characteristics summarized in Table 1. Standard errors clusteredby banking organization. *** means p < 0.01; ** means p < 0.05; * means p < 0.10.
33

Table 7. Hedging
(1) (2) (3) (4) (5) (6)
AOCI bank × 0.04* 0.09*** 0.07** 0.11*** 0.16** 0.08*phase-in (0.02) (0.03) (0.03) (0.03) (0.07) (0.04)
Weights - - - Face value Face v. Face v.CUSIP FE Yes No No Yes No NoQuarter FE Yes No No Yes No NoCUSIP × Quarter FE No Yes Yes No Yes YesBHC FE Yes Yes No Yes Yes NoCUSIP × BHC FE No No Yes No No YesMean Y 0.02 0.02 0.02 0.05 0.06 0.06R2 (within) 0.00 0.00 0.00 0.00 0.00 0.00Observations 1211542 535702 533685 1211542 535702 533685
Note: Dependent variable equals 1 if security i held by banking firm b at time t has a qualifiedaccounting hedge, and 0 otherwise. Security-level analysis based on FR Y-14Q data. “AOCI” is adummy equal to 1 for firms which switched to including AOCI in regulatory capital. firms whichnow include AOCI in regulatory capital. “Phase-in” is a variable between 0 and 1 measuring thepercent of AOCI included in regulatory capital for for AOCI banks in quarter t. Controls includeCUSIP (security identifier) fixed effects, time fixed effects, and interactions as shown in the table.Sample period is 2015:Q3-2017:Q2. Standard errors clustered by banking organization. *** meansp < 0.01; ** means p < 0.05; * means p < 0.10.
34
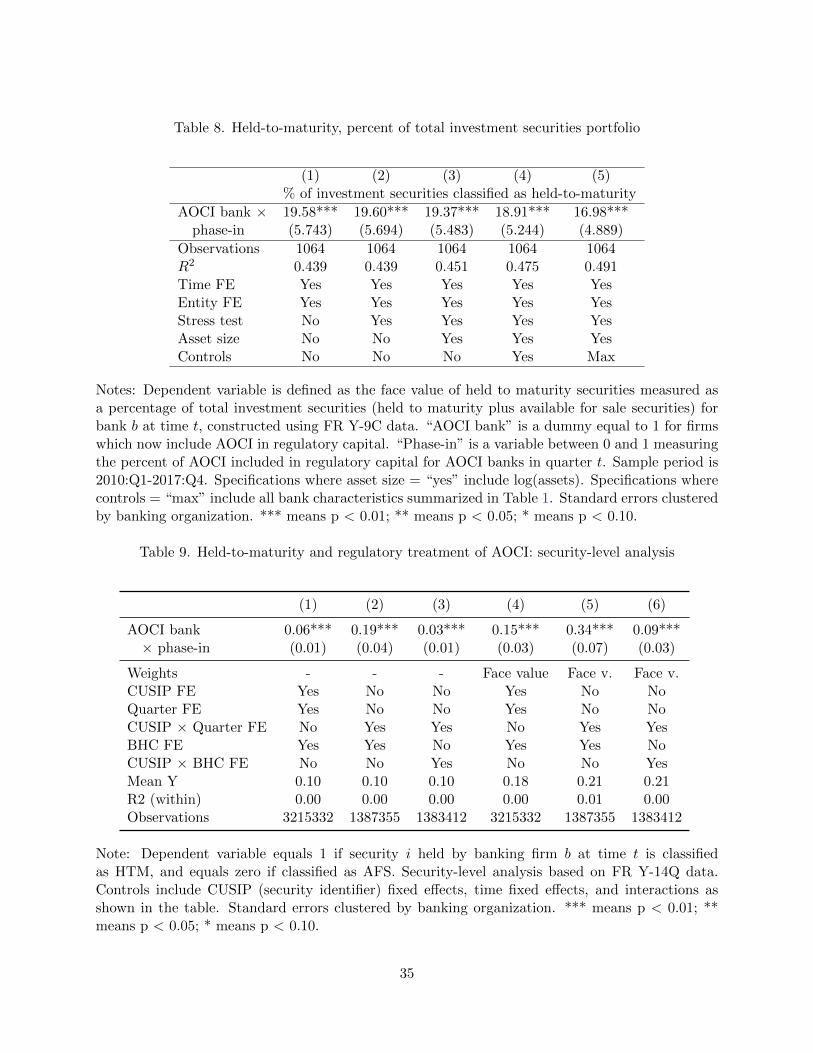
Table 8. Held-to-maturity, percent of total investment securities portfolio
(1) (2) (3) (4) (5)% of investment securities classified as held-to-maturity
AOCI bank × 19.58*** 19.60*** 19.37*** 18.91*** 16.98***phase-in (5.743) (5.694) (5.483) (5.244) (4.889)
Observations 1064 1064 1064 1064 1064R2 0.439 0.439 0.451 0.475 0.491Time FE Yes Yes Yes Yes YesEntity FE Yes Yes Yes Yes YesStress test No Yes Yes Yes YesAsset size No No Yes Yes YesControls No No No Yes Max
Notes: Dependent variable is defined as the face value of held to maturity securities measured asa percentage of total investment securities (held to maturity plus available for sale securities) forbank b at time t, constructed using FR Y-9C data. “AOCI bank” is a dummy equal to 1 for firmswhich now include AOCI in regulatory capital. “Phase-in” is a variable between 0 and 1 measuringthe percent of AOCI included in regulatory capital for AOCI banks in quarter t. Sample period is2010:Q1-2017:Q4. Specifications where asset size = “yes” include log(assets). Specifications wherecontrols = “max” include all bank characteristics summarized in Table 1. Standard errors clusteredby banking organization. *** means p < 0.01; ** means p < 0.05; * means p < 0.10.
Table 9. Held-to-maturity and regulatory treatment of AOCI: security-level analysis
(1) (2) (3) (4) (5) (6)
AOCI bank 0.06*** 0.19*** 0.03*** 0.15*** 0.34*** 0.09***× phase-in (0.01) (0.04) (0.01) (0.03) (0.07) (0.03)
Weights - - - Face value Face v. Face v.CUSIP FE Yes No No Yes No NoQuarter FE Yes No No Yes No NoCUSIP × Quarter FE No Yes Yes No Yes YesBHC FE Yes Yes No Yes Yes NoCUSIP × BHC FE No No Yes No No YesMean Y 0.10 0.10 0.10 0.18 0.21 0.21R2 (within) 0.00 0.00 0.00 0.00 0.01 0.00Observations 3215332 1387355 1383412 3215332 1387355 1383412
Note: Dependent variable equals 1 if security i held by banking firm b at time t is classifiedas HTM, and equals zero if classified as AFS. Security-level analysis based on FR Y-14Q data.Controls include CUSIP (security identifier) fixed effects, time fixed effects, and interactions asshown in the table. Standard errors clustered by banking organization. *** means p < 0.01; **means p < 0.05; * means p < 0.10.
35

Table 10. Held-to-maturity and regulatory treatment of AOCI: by effective duration
(1) (2) (3) (4)MBS MBS Tsy Tsy
AOCI bank × phase-in 0.12** 0.30*** 0.09 0.02(0.06) (0.09) (0.12) (0.11)
AOCI bank × phase-in 0.20** 0.22* 0.27* 0.29*× above-median duration (0.08) (0.12) (0.15) (0.15)
Weight - Face v. - Face v.CUSIP × Quarter FE Yes Yes Yes YesBHC FE Yes Yes Yes YesMean Y 0.12 0.34 0.21 0.17R2 (within) 0.00 0.01 0.01 0.01Observations 695357 695357 47666 47666
Note: Dependent variable equals 1 if security i held by banking firm b at time t is classifiedas HTM, and equals zero if classified as AFS. Security-level analysis based on FR Y-14Q data.Effective duration measures the sensitivity of security value to a given change in interest rates.Controls include CUSIP (security identifier) fixed effects, time fixed effects, and interactions asshown in the table. Standard errors clustered by banking organization. *** means p < 0.01; **means p < 0.05; * means p < 0.10.
36
Tab
le11.
Hel
d-t
o-m
atu
rity
and
regu
lato
rytr
eatm
ent
ofA
OC
I:by
asse
tcl
ass
an
db
ank
chara
cter
isti
cs.
(1)
(2)
(3)
(4)
(5)
(6)
AO
CI
ban
k×
ph
ase-
in0.
25**
*0.
47**
*×
Age
ncy
MB
S(0
.06)
(0.0
9)A
OC
Ib
ank×
ph
ase-
in-0
.04
-0.2
8***
×C
orp
orate
Bon
d(0
.04)
(0.0
9)A
OC
Ib
ank×
ph
ase-
in0.
12*
0.25
×M
un
icip
alB
ond
(0.0
7)(0
.18)
AO
CI
ban
k×
ph
ase-
in-0
.06
-0.2
8**
×S
over
eign
Bon
d(0
.05)
(0.1
3)A
OC
Ib
ank×
ph
ase-
in0.
20**
0.16
×T
reas
ury
/A
gen
cy(0
.09)
(0.1
4)
AO
CI
ban
k×
ph
ase-
in0.
29**
*0.
39**
0.1
5**
*0.2
4***
(0.0
6)(0
.15)
(0.0
3)
(0.0
7)
AO
CI
ban
k×
0.02
-0.0
8B
elow
-med
ian
Tie
r1
Cap
ital
(0.0
5)(0
.12)
AO
CI
ban
k×
ph
ase-
in-0
.15*
*-0
.07
×B
elow
-med
.T
ier
1C
ap.
(0.0
6)(0
.18)
AO
CI
bank×
0.0
3-0
.04
Ab
ove-
med
ian
Sec
uri
ties
Por
tfol
io(0
.05)
(0.1
0)
AO
CI
ban
k×
ph
ase-
in0.
14*
0.2
6×
Ab
ove-
med
.S
ec.
Port
foli
o(0
.07)
(0.2
1)
Wei
ghts
-F
ace
v.
-F
ace
v.
-F
ace
v.
CU
SIP
×Q
uart
erF
EY
esY
esY
esY
esY
esY
esB
HC
FE
Yes
Yes
Yes
Yes
Yes
Yes
Mea
nY
0.11
0.23
0.10
0.21
0.10
0.2
1R
2(w
ith
in)
0.01
0.01
0.01
0.01
0.01
0.0
1O
bse
rvat
ion
s11
9057
311
9057
313
7744
413
77444
137
7444
1377444
Sta
ndard
erro
rscl
ust
ered
by
BH
C.
Note
:D
epen
den
tva
riab
leeq
uals
1if
secu
rityi
hel
dby
ban
kin
gfi
rmb
atti
met
iscl
assi
fied
asH
TM
,an
deq
uals
zero
ifcl
ass
ified
as
AF
S.
Sec
uri
ty-l
evel
an
aly
sis
bas
edon
FR
Y-1
4Qd
ata.
Con
trol
sin
clu
de
CU
SIP
(sec
uri
tyid
enti
fier
)fi
xed
effec
ts,
tim
efi
xed
effec
ts,
and
inte
ract
ion
sas
show
nin
the
tab
le.
Sta
nd
ard
erro
rscl
ust
ered
by
ban
kin
gor
gan
izat
ion.
***
mea
ns
p<
0.0
1;
**
mea
ns
p<
0.0
5;
*m
ean
sp<
0.10.
37

Table 12. Substitution between MBS and whole mortgages
(1) (2) (3) (4) (5)
AOCI bank × phase-in 0.12 0.09 0.10 0.10 0.13*(0.08) (0.07) (0.08) (0.08) (0.07)
Time FE Yes Yes Yes Yes YesEntity FE Yes Yes Yes Yes YesStress test No Yes Yes Yes YesAsset size No No Yes Yes YesControls No No No Yes MaxR2 0.07 0.08 0.09 0.09 0.34Observations 1079 1079 1079 1079 1079
Notes: Dependent variable is defined as the book value of mortgages held in portfolio as wholeloans (measured as a percentage of mortgages plus available-for-sale MBS) for bank b at time t,constructed using FR Y-9C data. “AOCI bank” is a dummy equal to 1 for firms which now includeAOCI in regulatory capital. “Phase-in” is a variable between 0 and 1 measuring the percent ofAOCI included in regulatory capital for AOCI banks in quarter t. Sample period is 2010:Q1-2017:Q4. Specifications where asset size = “yes” include log(assets). Specifications where controls= “max” include all bank characteristics summarized in Table 1. Standard errors clustered bybanking organization. *** means p < 0.01; ** means p < 0.05; * means p < 0.10.
38
Internet Appendix for
“Regulation and Risk Shuffling in Bank Securities Portfolios”
Andreas Fuster and James Vickery
May 2018
1

A. BHCs in sample
Table A.1. List of BHCs in data sample: 2010-2017
Name First Last RSSDID AOCI Y14Q
BANCWEST CORP 2010q1 2016q1 1025608 0 0ZIONS BC 2010q1 2017q4 1027004 0 1DEUTSCHE BK TR CORP 2012q1 2016q2 1032473 1 0CIT GROUP 2010q1 2017q4 1036967 0 1M&T BK CORP 2010q1 2017q4 1037003 0 1JPMORGAN CHASE & CO 2010q1 2017q4 1039502 1 1KEYCORP 2010q1 2017q4 1068025 0 1HUNTINGTON BSHRS 2010q1 2017q4 1068191 0 1PNC FNCL SVC GROUP 2010q1 2017q4 1069778 1 1FIFTH THIRD BC 2010q1 2017q4 1070345 0 1BANK OF AMER CORP 2010q1 2017q4 1073757 1 1BB&T CORP 2010q1 2017q4 1074156 0 1BBVA COMPASS BSHRS 2010q1 2017q4 1078529 0 1STATE STREET CORP 2010q1 2017q4 1111435 1 1U S BC 2010q1 2017q4 1119794 1 1WELLS FARGO & CO 2010q1 2017q4 1120754 1 1SUNTRUST BK 2010q1 2017q4 1131787 0 1CITIZENS FNCL GRP 2010q1 2017q4 1132449 0 1NORTHERN TR CORP 2010q1 2017q4 1199611 1 1COMERICA 2010q1 2017q4 1199844 0 1BMO FNCL CORP 2010q1 2017q4 1245415 0 1TD BK US HC 2010q1 2015q2 1249196 1 0AMERICAN EXPRESS CO 2010q1 2017q4 1275216 1 1MUFG AMERS HOLDS CORP 2010q1 2017q4 1378434 0 1ALLY FNCL 2010q1 2017q4 1562859 0 1CREDIT SUISSE HOLD USA 2016q3 2017q4 1574834 1 0BNP PARIBAS USA 2016q3 2017q4 1575569 0 0CITIGROUP 2010q1 2017q4 1951350 1 1MORGAN STANLEY 2010q1 2017q4 2162966 1 1CAPITAL ONE FC 2010q1 2017q4 2277860 1 1GOLDMAN SACHS GROUP THE 2010q1 2017q4 2380443 1 1RBC USA HOLDCO CORP 2015q4 2017q4 3226762 0 0HSBC N AMER HOLDS 2010q1 2017q4 3232316 1 1REGIONS FC 2010q1 2017q4 3242838 0 1BANK OF NY MELLON CORP 2010q1 2017q4 3587146 1 1TD GRP US HOLDS LLC 2015q3 2017q4 3606542 1 1DISCOVER FS 2010q1 2017q4 3846375 0 1SANTANDER HOLDS USA 2012q1 2017q4 3981856 0 1SYNCHRONY FNCL 2015q4 2017q4 4504654 0 0UBS AMERS HOLD LLC 2016q3 2017q4 4846998 0 0BARCLAYS US LLC 2016q3 2017q4 5006575 1 0
2
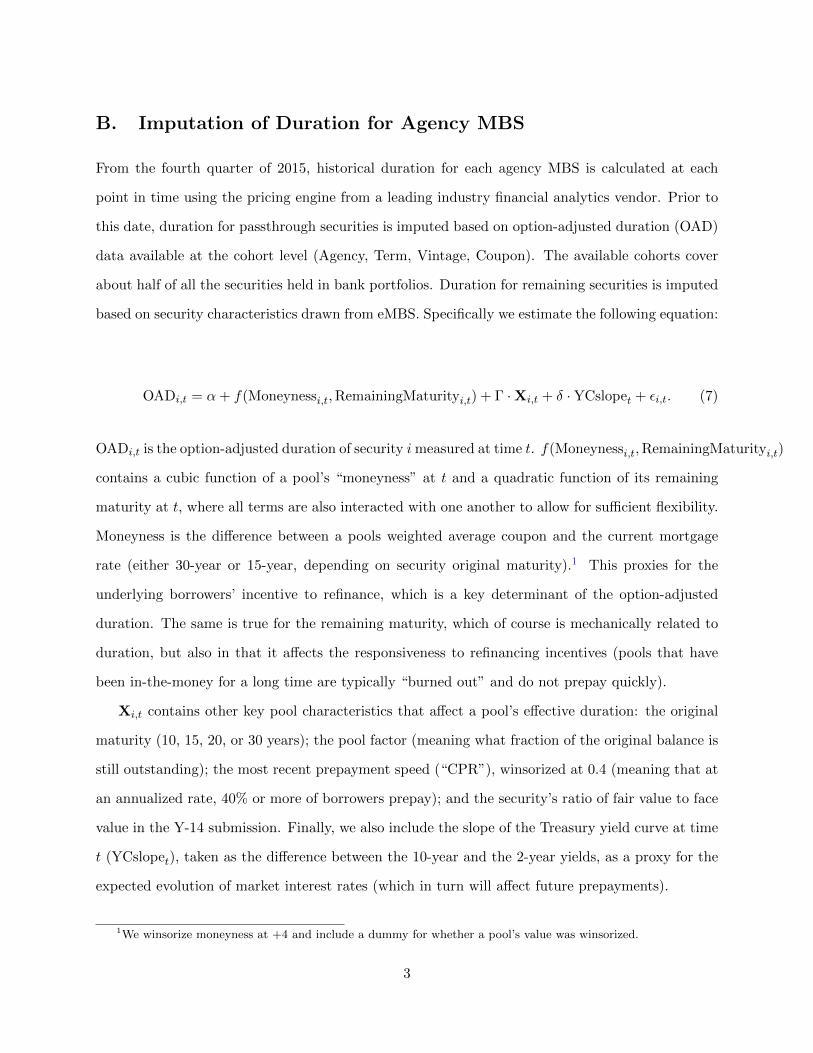
B. Imputation of Duration for Agency MBS
From the fourth quarter of 2015, historical duration for each agency MBS is calculated at each
point in time using the pricing engine from a leading industry financial analytics vendor. Prior to
this date, duration for passthrough securities is imputed based on option-adjusted duration (OAD)
data available at the cohort level (Agency, Term, Vintage, Coupon). The available cohorts cover
about half of all the securities held in bank portfolios. Duration for remaining securities is imputed
based on security characteristics drawn from eMBS. Specifically we estimate the following equation:
OADi,t = α+ f(Moneynessi,t,RemainingMaturityi,t) + Γ ·Xi,t + δ · YCslopet + εi,t. (7)
OADi,t is the option-adjusted duration of security imeasured at time t. f(Moneynessi,t,RemainingMaturityi,t)
contains a cubic function of a pool’s “moneyness” at t and a quadratic function of its remaining
maturity at t, where all terms are also interacted with one another to allow for sufficient flexibility.
Moneyness is the difference between a pools weighted average coupon and the current mortgage
rate (either 30-year or 15-year, depending on security original maturity).1 This proxies for the
underlying borrowers’ incentive to refinance, which is a key determinant of the option-adjusted
duration. The same is true for the remaining maturity, which of course is mechanically related to
duration, but also in that it affects the responsiveness to refinancing incentives (pools that have
been in-the-money for a long time are typically “burned out” and do not prepay quickly).
Xi,t contains other key pool characteristics that affect a pool’s effective duration: the original
maturity (10, 15, 20, or 30 years); the pool factor (meaning what fraction of the original balance is
still outstanding); the most recent prepayment speed (“CPR”), winsorized at 0.4 (meaning that at
an annualized rate, 40% or more of borrowers prepay); and the security’s ratio of fair value to face
value in the Y-14 submission. Finally, we also include the slope of the Treasury yield curve at time
t (YCslopet), taken as the difference between the 10-year and the 2-year yields, as a proxy for the
expected evolution of market interest rates (which in turn will affect future prepayments).
1We winsorize moneyness at +4 and include a dummy for whether a pool’s value was winsorized.
3
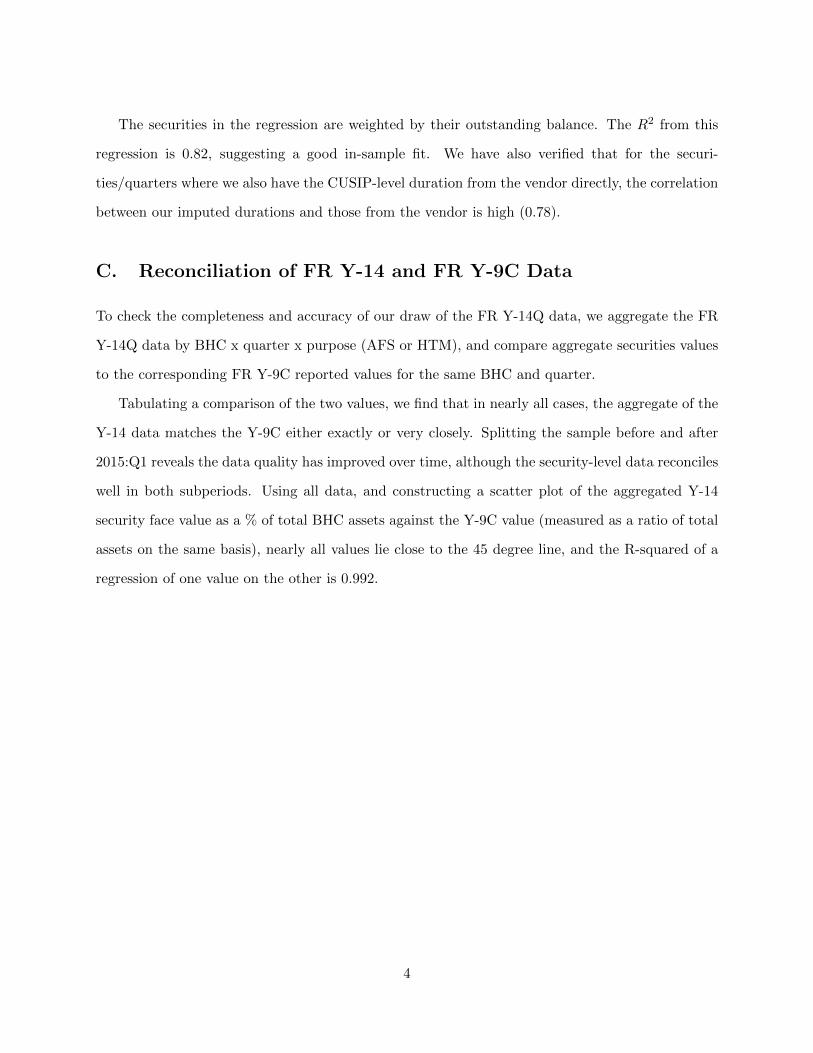
The securities in the regression are weighted by their outstanding balance. The R2 from this
regression is 0.82, suggesting a good in-sample fit. We have also verified that for the securi-
ties/quarters where we also have the CUSIP-level duration from the vendor directly, the correlation
between our imputed durations and those from the vendor is high (0.78).
C. Reconciliation of FR Y-14 and FR Y-9C Data
To check the completeness and accuracy of our draw of the FR Y-14Q data, we aggregate the FR
Y-14Q data by BHC x quarter x purpose (AFS or HTM), and compare aggregate securities values
to the corresponding FR Y-9C reported values for the same BHC and quarter.
Tabulating a comparison of the two values, we find that in nearly all cases, the aggregate of the
Y-14 data matches the Y-9C either exactly or very closely. Splitting the sample before and after
2015:Q1 reveals the data quality has improved over time, although the security-level data reconciles
well in both subperiods. Using all data, and constructing a scatter plot of the aggregated Y-14
security face value as a % of total BHC assets against the Y-9C value (measured as a ratio of total
assets on the same basis), nearly all values lie close to the 45 degree line, and the R-squared of a
regression of one value on the other is 0.992.
4