caterpillar Bank of America Securities Annual Investment Conference
19
MAKING PROGRESS POSSIBLE Caterpillar Mike DeWalt Director of Investor Relations
-
Upload
finance5 -
Category
Economy & Finance
-
view
411 -
download
1
Transcript of caterpillar Bank of America Securities Annual Investment Conference
MAKING PROGRESS POSSIBLE
Caterpillar
Mike DeWaltDirector of Investor Relations
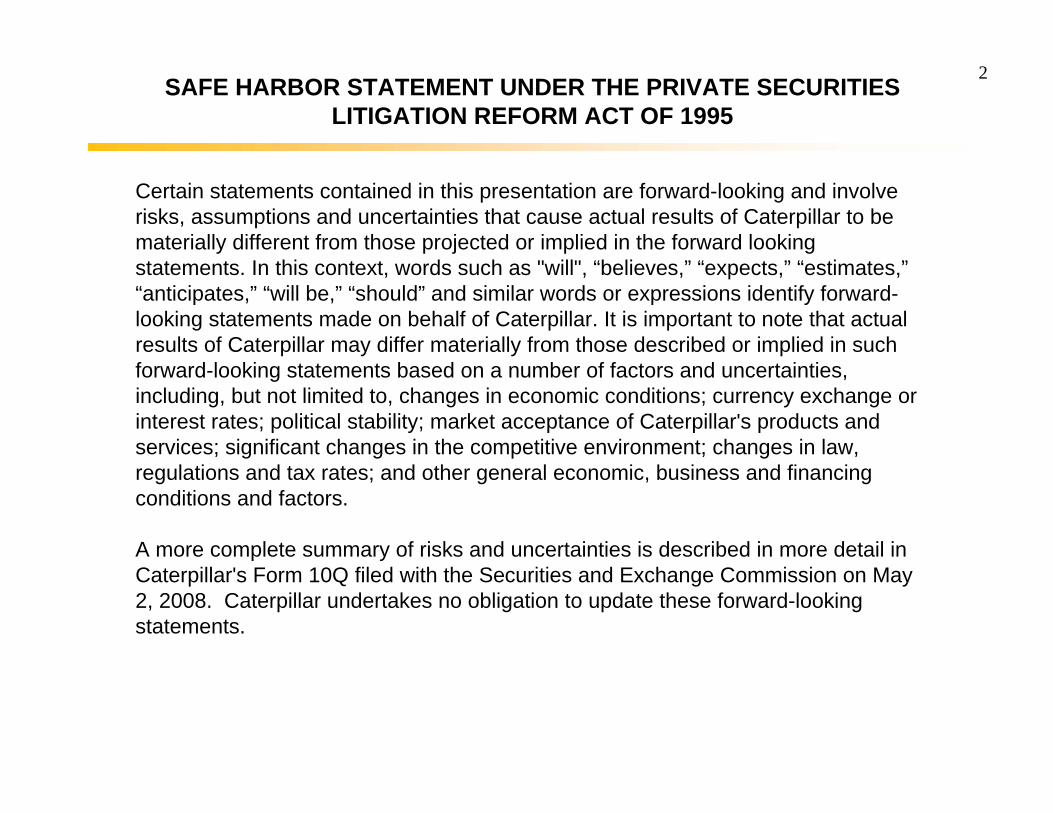
2SAFE HARBOR STATEMENT UNDER THE PRIVATE SECURITIES
LITIGATION REFORM ACT OF 1995
Certain statements contained in this presentation are forward-looking and involve risks, assumptions and uncertainties that cause actual results of Caterpillar to be materially different from those projected or implied in the forward looking statements. In this context, words such as "will", “believes,” “expects,” “estimates,”“anticipates,” “will be,” “should” and similar words or expressions identify forward-looking statements made on behalf of Caterpillar. It is important to note that actual results of Caterpillar may differ materially from those described or implied in such forward-looking statements based on a number of factors and uncertainties, including, but not limited to, changes in economic conditions; currency exchange or interest rates; political stability; market acceptance of Caterpillar's products and services; significant changes in the competitive environment; changes in law, regulations and tax rates; and other general economic, business and financing conditions and factors.
A more complete summary of risks and uncertainties is described in more detail in Caterpillar's Form 10Q filed with the Securities and Exchange Commission on May 2, 2008. Caterpillar undertakes no obligation to update these forward-looking statements.

3
Caterpillar Overview
Sales & Revenues$45B in 2007
Sales and Costs
7%
30%
63%Machines
Engines
Financial Products
4% 9%
31%56%
Material Costs
Factory Labor &
Overhead
SG & AR&D
Machinery & EnginesOperating Costs $37B in 2007
4
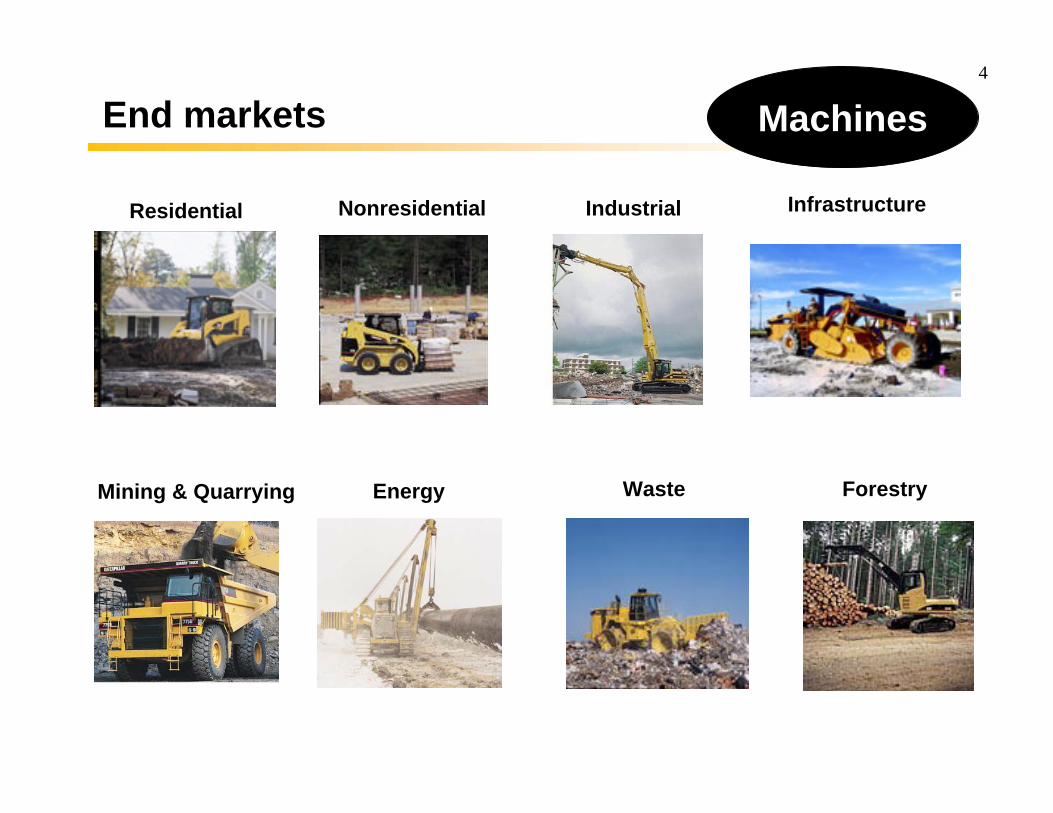
Nonresidential
EnergyMining & Quarrying
Infrastructure Residential Industrial
ForestryWaste
End markets Machines
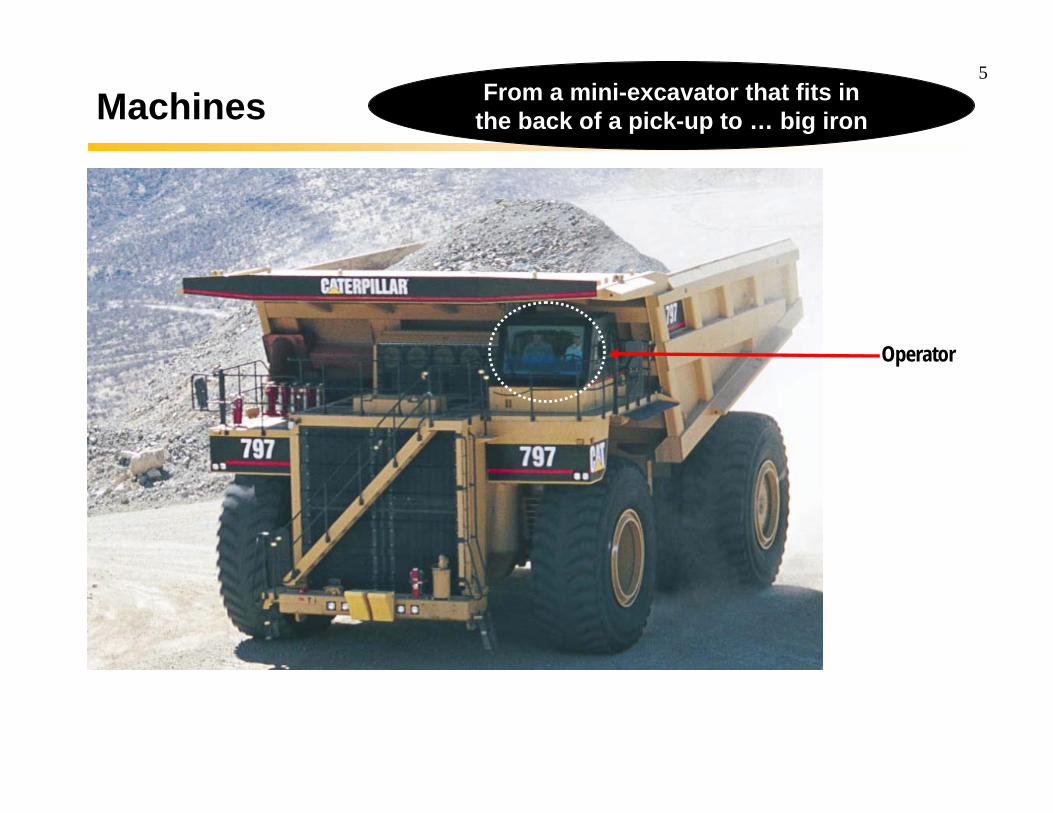
5From a mini-excavator that fits in
the back of a pick-up to … big ironMachines
Operator
6
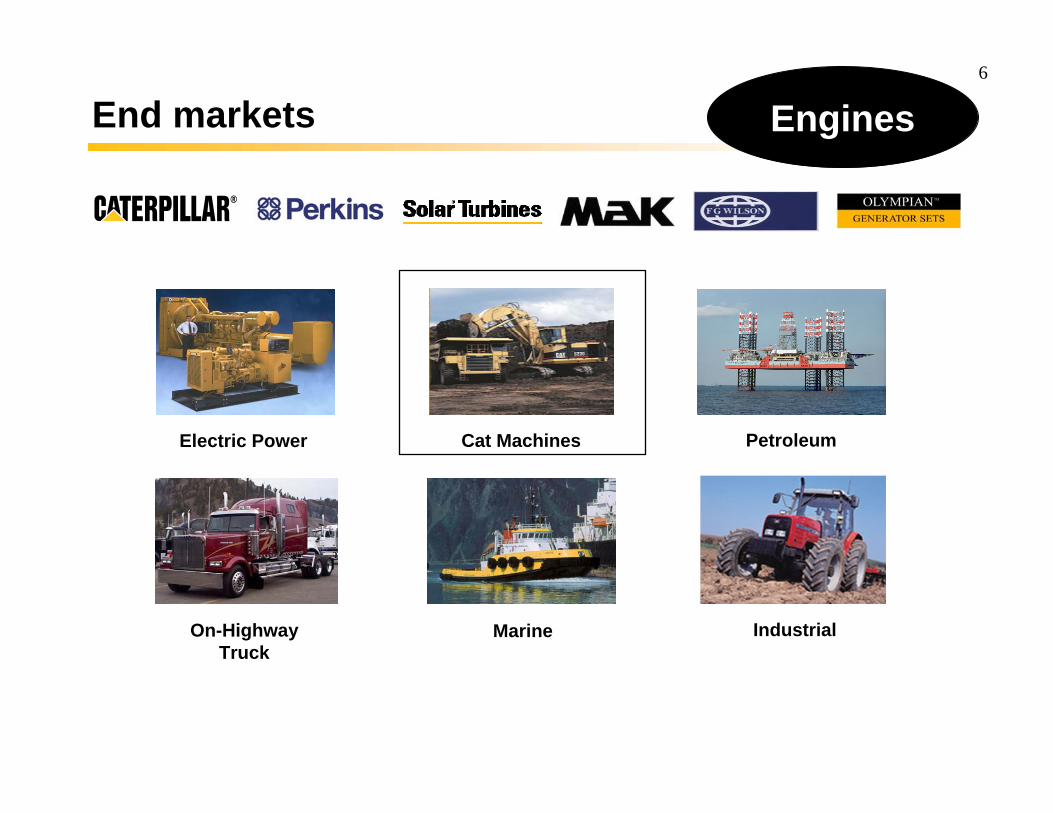
On-HighwayTruck
Marine Industrial
Cat Machines PetroleumElectric Power
End markets Engines
7
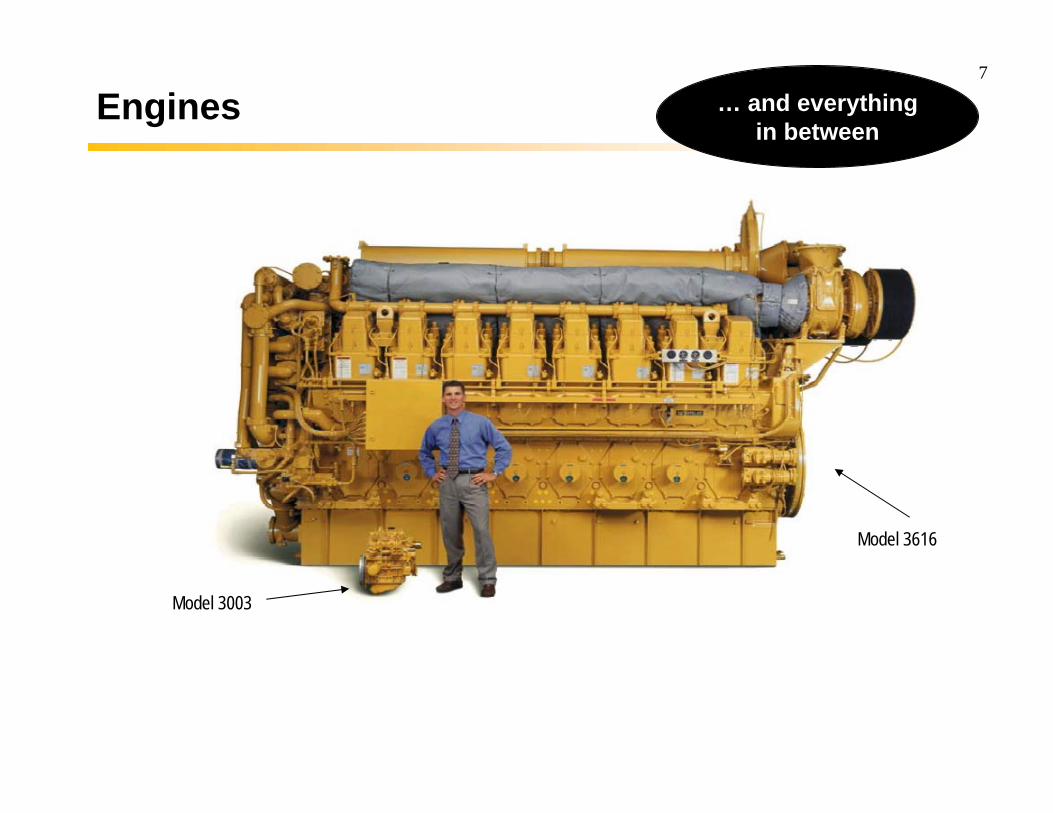
… and everything in between
Model 3003
Model 3616
Engines
8
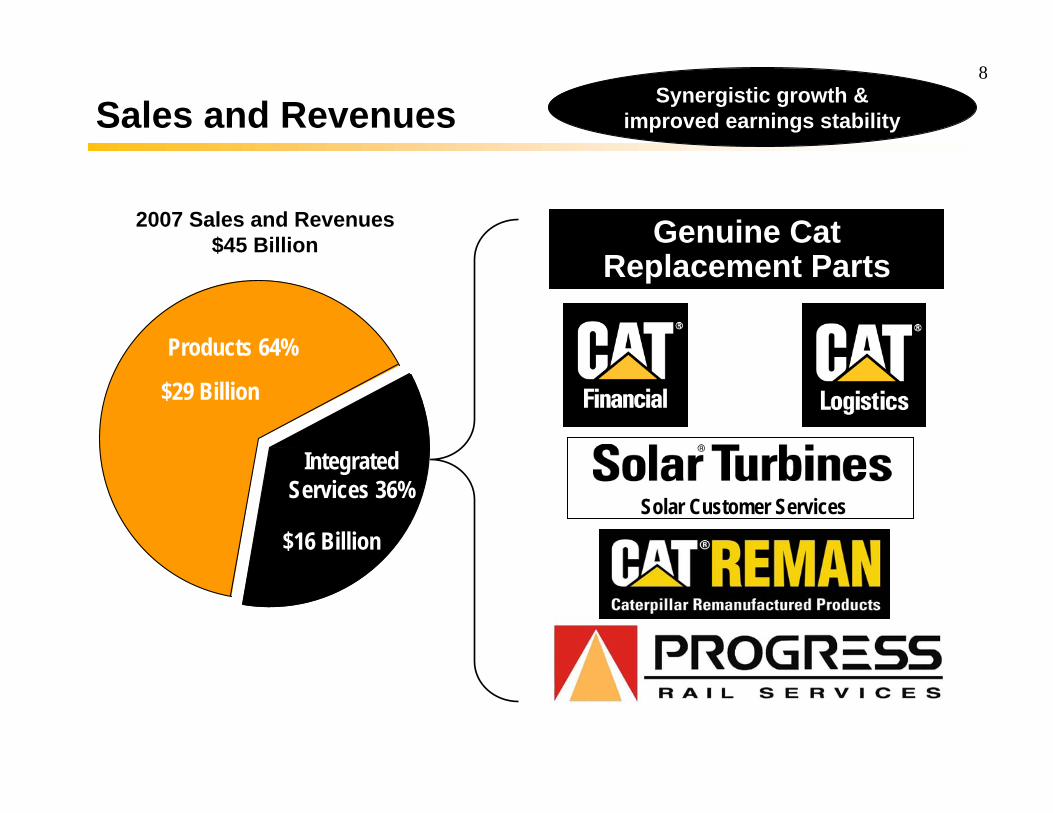
Sales and Revenues Synergistic growth & improved earnings stability
Products 64%
Integrated Services 36%
$29 Billion
$16 BillionSolar Customer Services
Genuine Cat Replacement Parts
2007 Sales and Revenues$45 Billion
9
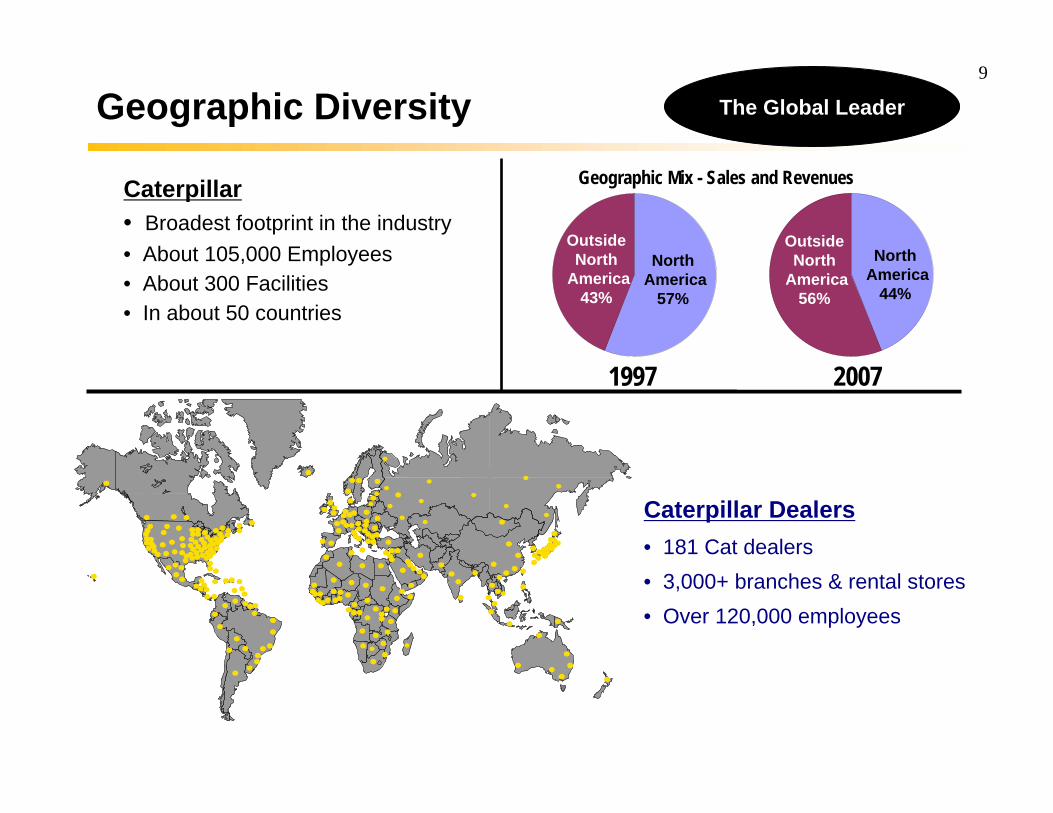
Geographic Diversity
Caterpillar Dealers• 181 Cat dealers• 3,000+ branches & rental stores• Over 120,000 employees
The Global Leader
2007 1997
Geographic Mix - Sales and RevenuesCaterpillar• Broadest footprint in the industry• About 105,000 Employees• About 300 Facilities • In about 50 countries
OutsideNorth
America43%
NorthAmerica
57%
OutsideNorth
America56%
NorthAmerica
44%
10
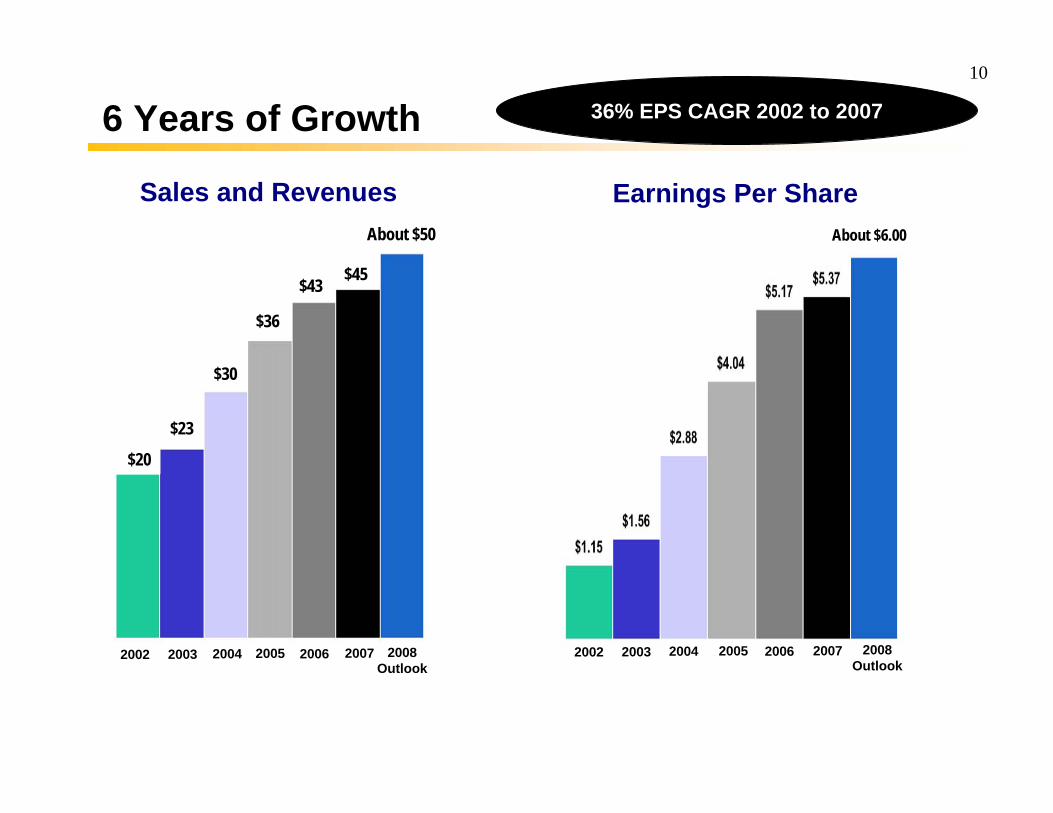
6 Years of Growth
2002 2003 2004 2005 2006 2007 2002 2003 2004 2005 2006 2007
Sales and Revenues Earnings Per Share
$45$43
$36
$30
36% EPS CAGR 2002 to 2007
$23
$20
About $50 About $6.00
2008Outlook
2008Outlook
11
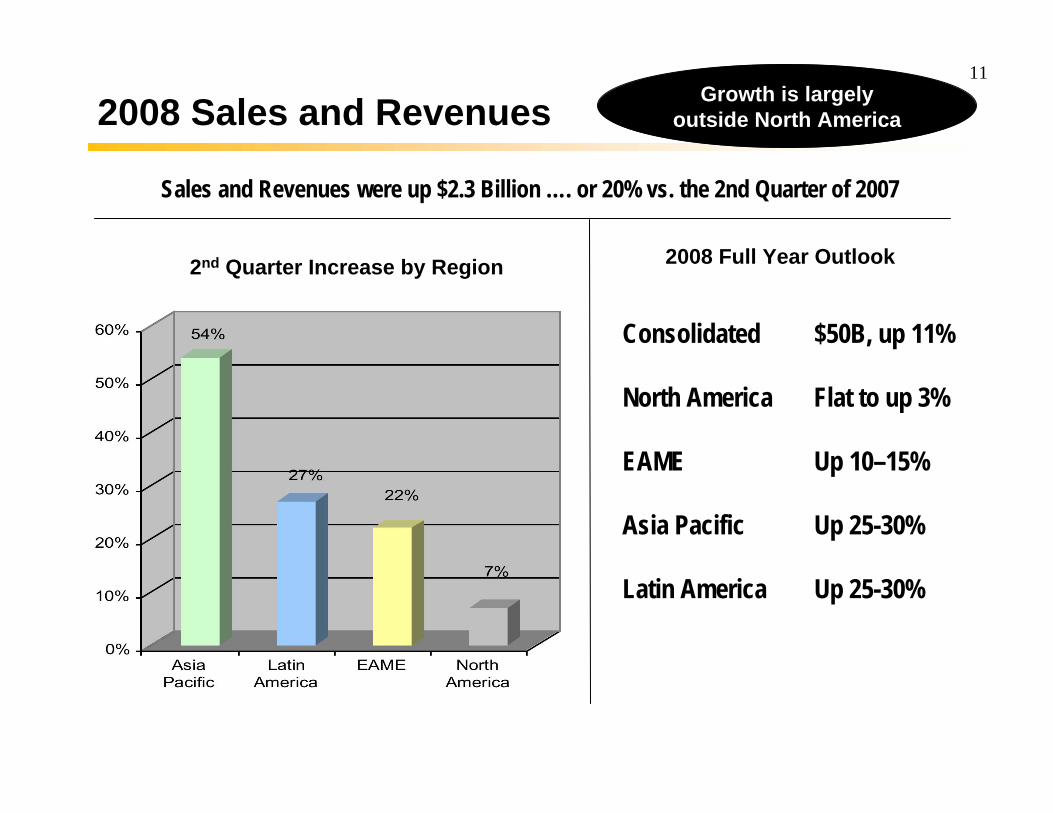
2008 Sales and Revenues
2nd Quarter Increase by Region
Growth is largely outside North America
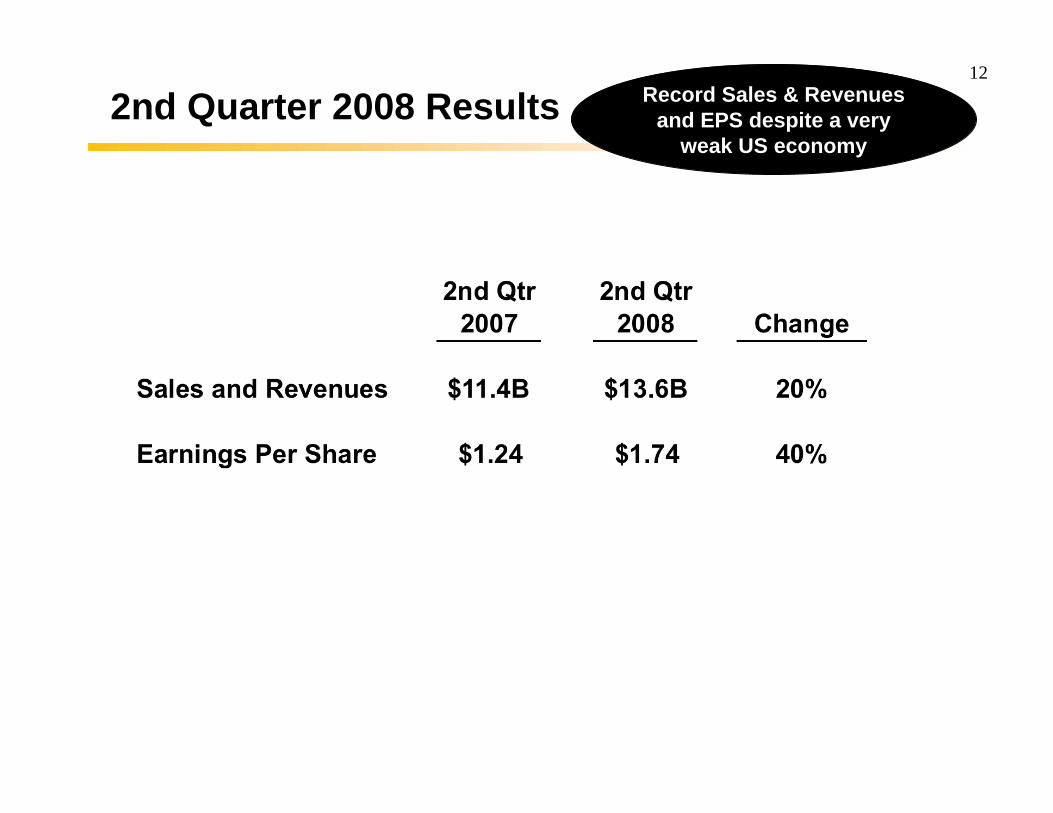
Sales and Revenues were up $2.3 Billion …. or 20% vs. the 2nd Quarter of 2007
Consolidated $50B, up 11%
North America Flat to up 3%
EAME Up 10–15%
Asia Pacific Up 25-30%
Latin America Up 25-30%
2008 Full Year Outlook
12
2nd Quarter 2008 Results Record Sales & Revenues and EPS despite a very
weak US economy
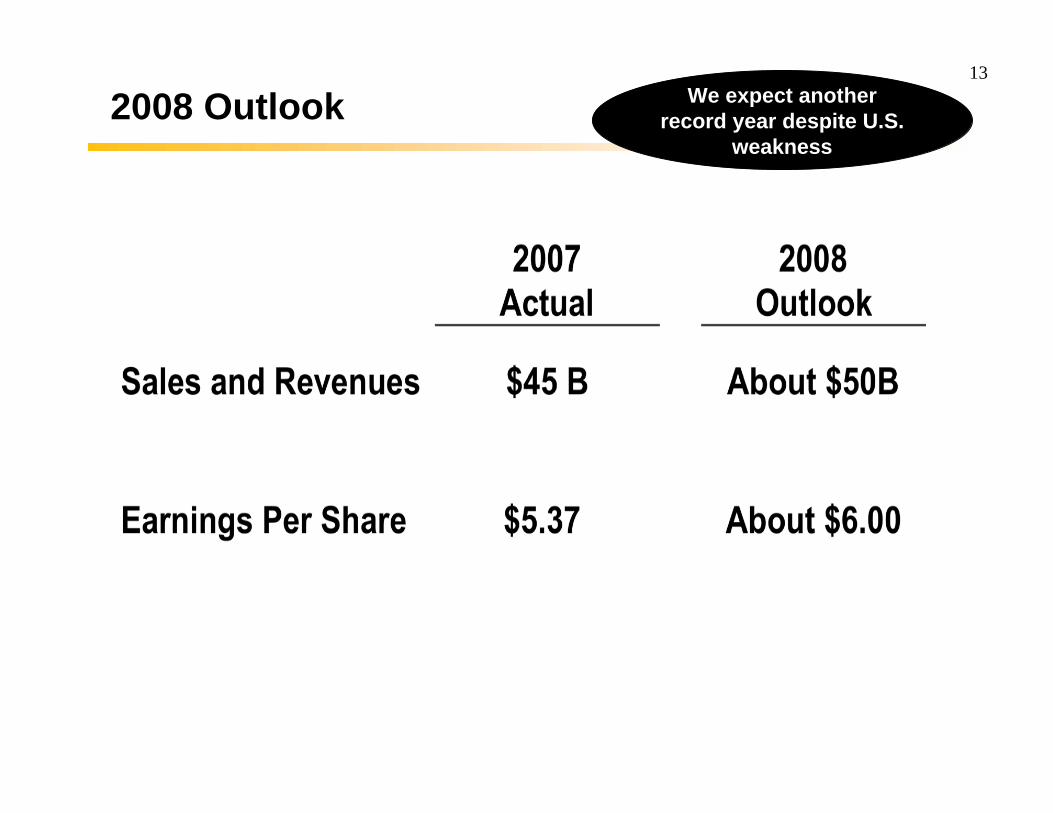
13We expect another
record year despite U.S. weakness
2008 Outlook

14
Key Longer-term Trends Long-term Positive for Caterpillar
We expect continued strong growth in worldwide infrastructure
spending over the next decade
Significant growth in the developing world … and they have the money!
Significant need to improve and rebuild infrastructure in the developed world … after years of under investment

1515
Mining & Energy
• Growing demand, particularly from the developing world• Prolonged underinvestment in the 80’s and 90’s
A Very Positive Future
1616
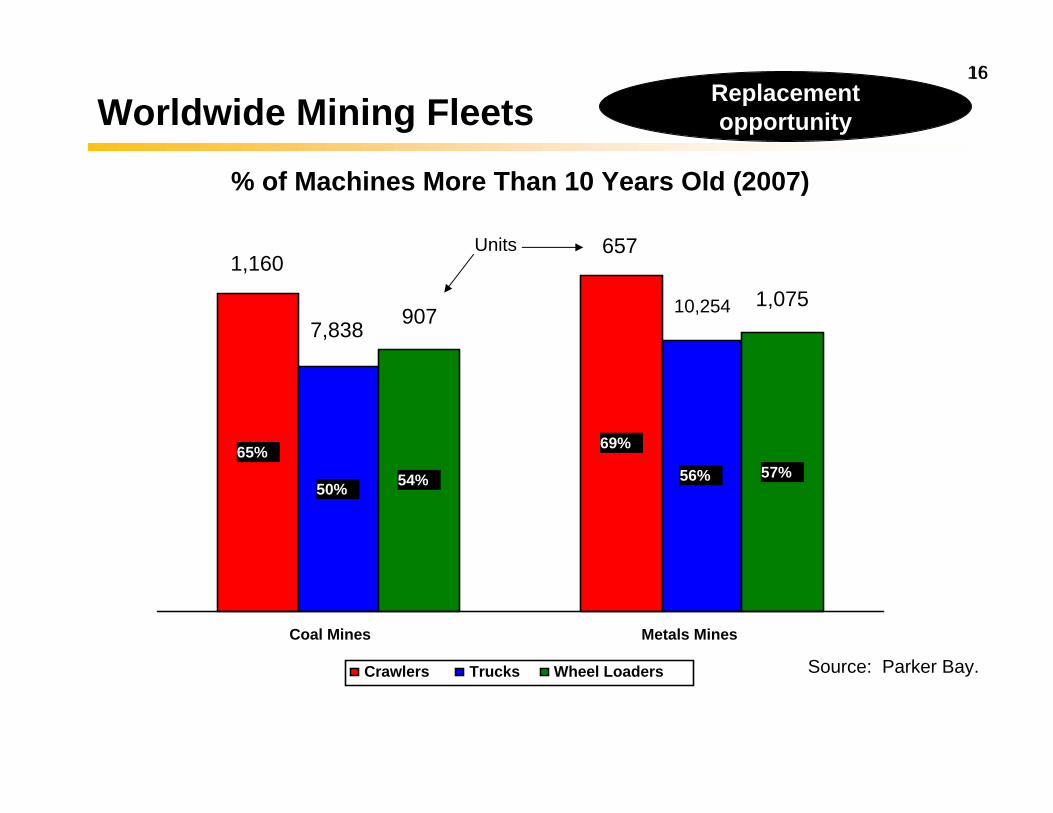
Worldwide Mining Fleets
Source: Parker Bay.
65% 69%
50%56%54% 57%
Coal Mines Metals Mines
Crawlers Trucks Wheel Loaders
1,160
7,838 907
657
10,254 1,075
% of Machines More Than 10 Years Old (2007)
Replacement opportunity
Units
17
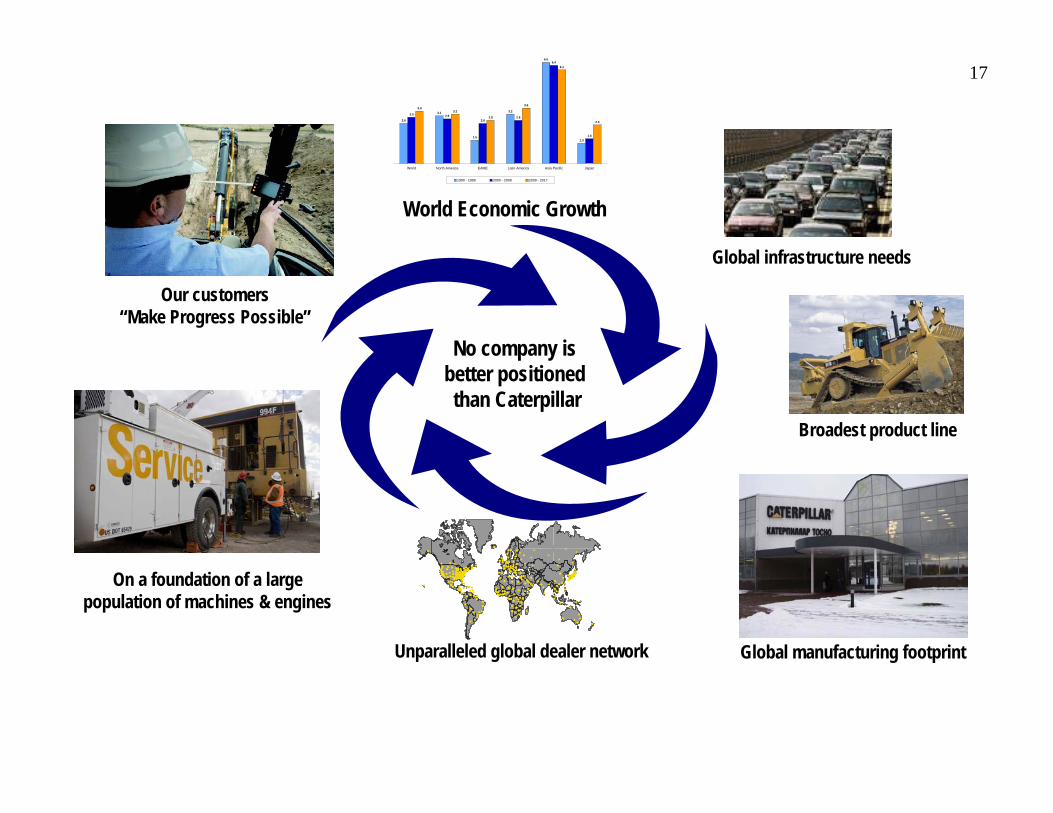
2.6
3.1
1.5
3.2
6.6
1.3
3.0 2.92.6
2.8
6.4
1.6
3.43.2
2.8
3.6
6.1
2.5
World North America EAME Latin America Asia Pacific Japan
1990 - 1999 2000 - 2008 2009 - 2017
World Economic Growth
Global infrastructure needs
Broadest product line
Global manufacturing footprintUnparalleled global dealer network
On a foundation of a large population of machines & engines
Our customers “Make Progress Possible”
No company is better positioned than Caterpillar

18
Valuation We are in an unusual position
• S&P 500 average PE is elevated
• Cat’s PE is 10-11 … at the low end of our historic range.
Profits have fallen faster than stock prices … as usual for an economic downturn
Low PE at Cat usually reflects a peak. Current situation is:
• US machine sales to end users are in the 3rd year of significant decline.
• European sales to users declining
• Asia, Africa, Middle East, CIS, Latin America are very strong
• Energy and Mining strong worldwide

Questions?