Regional Summit on Pediatric Home Asthma Interventions€¦ · Regional Summit on Pediatric Home...
104
0 Regional Summit on Pediatric Home Asthma Interventions Green & Healthy Homes Initiative (GHHI) Baltimore Ruth Ann Norton January 17, 2014 Baltimore, Maryland
Transcript of Regional Summit on Pediatric Home Asthma Interventions€¦ · Regional Summit on Pediatric Home...

0
Regional Summit on Pediatric
Home Asthma Interventions
Green & Healthy Homes Initiative (GHHI) Baltimore
Ruth Ann Norton
January 17, 2014
Baltimore, Maryland

HU
D
DO
E
HH
S
Trea
sury
Lea
d
CS
BG
LIHE
AP
WA
P
EE
CB
G
EE
RE
Lea
d
Me
dica
re
Me
dica
id
CD
FI
Fed
Loa
n B
an
k B
oa
rd
IAQ
DO
LE
TA
Gre
en
Job
s
WIA
Ph
ilan
thro
py
State
Priva
te
How Most Residents Experience Housing Intervention Programs

2
Interventions
$
The Results
How Residents Experience
the GHHI Model
Efficient delivery of investment and services for improved health, economic and social outcomes through healthier, energy
efficient and safe homes
GHHI

3
When Healthy Homes Program Started - 2000
Who Program Targets - Asthma diagnosed children ages 2-14 in Baltimore City; priority on children with prior asthma related ED visit or hospitalization; Family income ≤80% AMI
Type of Housing - Low income owner occupied and rental homes in Baltimore City; Typically row homes constructed prior to 1950
Units Completed - 1,660 families enrolled and 1,480 Healthy Homes interventions completed by the program to date using tiered intervention strategy and in-house GHHI Baltimore Hazard Reduction Team
GHHI Baltimore Healthy Homes Program Model

4
GHHI Baltimore - Single Portal Intake and Shared Data Platform “No Wrong Door”
Primary Referral Sources - MCOs, Health Care Providers, Health Department, GHHI Baltimore Partners
Single Portal Intake and Shared Data Platform
• Eliminates fractured service delivery – delivers maximum response
• Creates efficiencies and improves access to “care”
• One time enrollment and eligibility determination
• Eliminates missed opportunities
• Allows priority on making homes and families whole

5
Environmental Assessment & Resident Education Together
• Environmental Assessor-Energy Auditor (HHS/BPI)
o Conduct pre-intervention environmental assessments
o Conduct energy audits
o Develop comprehensive scopes of work for properties
o Conduct post intervention assessments and audits
• Community Environmental Health Educator (CHES/AE-C)o Conduct asthma/HH resident education during assessment
o Coordinate pre and post client health surveys
o Review asthma action plan with the client
o Coordinate referrals and follow-up client services
o Distribute HEPA-Vacuum and indoor allergen reduction kit
o Post remediation education and follow-up with HCP

6
Asthma Trigger Reduction
• Mold and Moisture
• Extreme Heat and Cold
• Cockroaches
• Mice and Rats
• Dust Mites
• Chemical Odors
• Tobacco Smoke
• Poor IAQ
6
Healthy Homes Intervention Strategyo Reduce Asthma Triggers in the Homeo Address Health & Safety Hazards

7
GHHI Healthy Homes Interventions
• Installation of mattress and pillow covers
• Integrated Pest Management - Gel Baits, Boric Acid,
Glue Traps, Reducing Entry Points, Cleaning, & Behavioral Change (Clutter)
• Mold remediation
• Venting kitchen, bathroom, and dryer; furnace filter replacement
• Removal or steam cleaning of carpets
• Austin Air filtering system installed in child’s bedroom (HHD)
• Air conditioners and dehumidifiers
• Provision of a HEPA-vacuum and indoor allergen reduction cleaning kit to the client
• Injury prevention measures including: installation of smoke alarm (with 10 year
lithium battery), carbon monoxide alarm, cabinet locks, electrical outlet covers, etc.
• Integrated, leverage funded GHHI weatherization and energy efficiency
intervention using cross trained workers

8
Outcomes - Asthma Impact
200 Units Completed – 136 Initial 6 Month Post Intervention Surveys Completed to Date (Evaluation ongoing through 12 months post intervention)
● 88% increase in participants reporting that their child didn’t have to work harder to breathe
● 60% reduction in total number of asthma related client hospitalizations in participant pool post intervention
● 50% increase in participants never having to visit the doctor’s office due to asthma episodes
● 55% increase in participants reporting their child’s asthma as well controlled
● 62% increase in participants reporting asthma-related perfect attendance for their child (0 school absences due to asthma episodes)
● 88% increase in participants reporting never having to miss a day of work due to their child’s asthma episodes

9
Outcomes - Smith Family - 5004 Alhambra Ave (Homeowner)
• Family of four with a son who has severe asthma• History of repeated asthma episodes resulting in hospitalizations on average of three times per year since birth (Average stay 1 week each time)
Triggers: Asthma triggers (rodents, dust mites, excessive moisture, VOCs, poor weatherization, poor IAQ)
GHHI Intervention Cost: $8,826Non-GHHI Process: $10,615 (Net projected savings of $1,879)Program Funding: HUD OHHLHC, MEA, CDBG, CSBG, Foundations
Results: Son was not hospitalized due to asthma triggers in the home in the 12 months following the intervention, resulting in savings of avoided medical costs of $48,300 in first year alone
• Allergens and lead hazards remediated• Home weatherized and annual energy cost savings of $721• Son is playing sports and performing well in school

10
Cost/Economic OutcomesAsthma Costs in Baltimore City
• Average cost of asthma related ED Visit in Baltimore: $820
• Average cost of asthma hospitalization in Baltimore: $7,506
Average Healthy Homes Intervention Cost Per Family
Tier I: $662 Tier II: $1,820 Tier II (w/lead hazard reduction): $7,947
Cost-Savings Based on Reduced Tertiary Costs (ED visits,
hospitalizations)
• Examples: $53,000; $48,300; $48,000 in medical cost savings (12 months post intervention for prior high medical utilizers)
• HUD Healthy Homes Technical Studies Grant (partnership with UMBC Hilltop Institute to analyze pre and post medical cost savings; comparative evaluation of program clients with Medicaid control group using CMS data; comparative analysis of varying Healthy Homes intervention levels)

11
Outcomes - Impact and Benefits of GHHI
• Unit production is underway with over 4,600 GHHI units completed and 3,000 units in pipeline - initial goal was 3,500 units
• Corporate, philanthropic, and private resources have committed over $62 million to support local GHHI efforts
�Health and Safety Benefits - 67% reduction in asthma episodes –increasing school attendance, lowering missed work days for parents, and reducing medical costs
�Energy Consumption reductions ($404/year per home)
�Government Program cost savings (up to 20 to 25%)
�Creation of a Single Portal of Intake and Comprehensive Assessment saving work days for clients and generating cost efficiencies
�Reduction in Lead, Healthy Homes, WAP and other program deferrals

12
GHHI Baltimore Leverage Funding Sources
• HUD Healthy Homes Demonstration and Production Grants(not long term sustainable funding source)
• Community Development Block Grant Program (CDBG)• Community Service Block Grant Program (CSBG)• Consumer Investment Funds (PSC)• Foundation Funding (Annie E. Casey Foundation, Open Society Foundation, Osprey Foundation, Constellation Energy Foundation)
• Baltimore City Housing Rehabilitation Program • GHHI Partners (Rebuilding Together)• DOE Weatherization Innovation Pilot Program Grant• DOE Weatherization Assistance Program/MEA Programs(DOE 11-6 Policy Guidance/ASHRAE Ventilation Standards)
• HUD Lead Hazard Reduction Demonstration Grant/Maryland DHCD Rehabilitation and Lead Programs

13
Challenges and Opportunities – Payment Models• Currently no standard set of HH measures and approved costs for Healthy Homes services – Now working on an Medicaid/ACA guidance manual
• Reimbursement traditionally only for licensed clinical providers – Change to Medicaid went into effect Jan 1, 2014, allowing services recommended by licensed health providers, but carried out by others, to be reimbursed
• Developing Maryland Healthy Homes Medicaid Pilot Project for asthma
• Demonstrate how GHHI model more cost effectively delivers services and interventions that not only benefit client but also reduce medical costs (asthma, household injury) for government/MCOs/private insurers
• Health Impact Bonds – e.g. Fresno, $3 million investment for 1100 asthma patients, caused 30% reduction in ED visits, 50% reduction in hospital stays
• Hospital Community Benefit Investments - can encompass “physical improvements and housing” and “environmental improvements”
• Education Funding Connections - Costs school districts $29 per child per school absence (14 million asthma related school absences annually) – In GHHI HHTS, linking housing interventions with school attendance rates

Reducing Asthma Disparities:Baltimore’s Successful Replication Effort
Pat McLaine, RN, DrPH, MPHKate Scott, RN, MPHMadeleine Shea, PhD
January 17, 2014

Childhood Asthma Disparities in Baltimore
• Asthma Prevalence - 20071
– 20% of children <18 years old– 28% of high-school students in Baltimore City
• Asthma ED Rates, <18 yrs - 20092
– Black = 360.2 / 10,000 – White = 136.1 / 10,000
• Asthma Hospitalization Rates, < 18 yrs - 20092
– Black = 50.7 / 10,000 – White = 25.4 / 10,000
1Centers for Disease Control. 2007 Youth Risk Behavior Survey. Available at http://www.cdc.gov/HealthyYouth/yrbs/index.htm.
2Maryland BRFSS, 2000-2009; Maryland HSCRC 2009;

0.0
50.0
100.0
150.0
200.0
250.0
300.0
350.0
Ra
te (
pe
r 1
0,0
00
po
pu
lati
po
n)
2010 Asthma ED Visit Rates
By Race and Maryland County
County Baseline Black/African American White (non-Hispanic)Data : Maryland Health Services Cost Review Commission (HSCRC) 2010

Other Disparities in Baltimore
• Children living in poverty 1– 29.4% - Baltimore– 11.3% - Maryland– 20.7% - US– 62% of Baltimore’s children live below 200% of the poverty line
• Smoking - 20082
– 28% Baltimore City residents– 36% of households earning less than $25K/yr
• Housing – Old: 58.5% built before 19503
– Poor condition: 24% with leaky roofs4
– Mice/rats – 37.2%5
– Cockroaches – 16.2%5
1 http://www.city-data.com/poverty/poverty-Baltimore-Maryland.html.;2 Baltimore City Health Disparities Report Card
3 American Community Survey - 20104 Breysse, P et al, Environmental Research, Vol 98 (2), 2005
5 2009 Baltimore City Community Health Survey

Reducing Asthma Disparities (RAD)Program Model
• Target Population:
– 4-18 year olds with moderate to severe asthma
– Attending Baltimore City Public Schools
– 236 enrolled, 128 completing 1-year visit
• Program operation: May 2008 – March 2012
• Translation of Seattle-King County’s model– CHWs providing most visits– Community/Public Health Nurse (RN) providing
coordination and oversight– 6 home visits over 6 months + one year follow-up

Program Model - continued• Program elements:
– Medication and technique review– Identification of asthma triggers– Trigger reduction education– Coordination with providers
• Goals :• Reduce
– asthma symptoms – use of urgent health services– exposure to asthma triggers
• Improve– family knowledge and skill to manage child’s asthma– communication between families and providers– provider knowledge of the home environment

Data, Data, Data!
• Data collection:– Interview and Home Environmental Assessment– Completed at enrollment and one-yr evaluation
• Encounter form assessment on all visits: • Reported symptoms• Coordination of care• Medications and technique• Protocols addressed• Problems identified and solutions • Goals and next visit date and time

Basic Demographics at Baseline - 1
Baltimore (PH Program)
• Completed = 128
• Av. Child age = 8.8
• Males = 57.8%
• Race/Ethnicity:
– 3.1% White
– 94.5% African American
– 0.0% Vietnamese
– 0.8% Other Asian
– 0.8% Hispanic
– 0.8% Other
• Family size = 4.4
• # with asthma = 2
Seattle – 1999-2000 (RCT)
• Completed = 214
• Av. Child age = 7.4
• Males = 58.7%
• Race/Ethnicity:
– 16.8% white
– 29.9% African American
– 28.8% Vietnamese
– 7.5% Other Asian
– 17.3% Hispanic
– 4.7% Other

Basic Demographics at Baseline - 2
Baltimore PH Program
• Caregiver Education:– < High School = 29.5%
– HS Grad – 41.0%
– Some College – 24.6%
– College Grad – 4.9%
• Renting = 79.0%
• Ped Asthma CQOL = 5.5
• Pet in home = 38.3%
• Roaches = 51.6%
• Rodents = 67.2%
• Caregiver smokes = 30.5
Seattle 1999-2000 (RCT)
• Caregiver Education:– < High School = 39.3%
– HS Grad – 26.6%
– Some College – 26.2%
– College Grad – 7.9%
• Renting = 82.2%
• Ped Asthma CQOL = 4.3
• Pet in home = 22.9%
• Roaches = 17.8%
• Rodents = 1.9%
• Caregiver smokes = 23.4%

Baltimore - Reported Changes
Measure Baseline % Follow-up %
Asthma Action Plan (AAP)
Family has AAP 33.6 72.7
School has AAP 18.0 48.4
Other caregiver has AAP 12.5 23.4
Caregiver used plan 10.2 32.0
Uses spacers most/all time 68.0 77.9

Baltimore – Reported Changes
Measure Baseline % Follow-up %
Child has peak flow meter 23.8 72.8
Used PFM during last attack 20.8 37.7
System for changing meds -most of the time
12.4 28.0
In last year:Child’s asthma is better 37.9 76.2
Child’s asthma is worse 26.6 3.2

Pediatric Asthma Caregiver Quality of Life
Measure Baseline
Mean (95% CI)
Follow-up
Mean (95% CI)
Overall score 5.45 (5.22-5.68) 6.47 (6.30-6.64)
Activity Domain 5.34 (5.06-5.61) 6.42 (6.21-6.62)
Emotional Domain 5.49 (5.25-5.73) 6.49 (6.32-6.66)
Children aged 7-17 only
Overall score 5.67 (5.38-5.96) 6.57 (6.33-6.80)
Activity Domain 5.57 (5.22-5.91) 6.55 (6.30-6.81)
Emotional Domain 5.70 (5.40-6.00) 6.56 (6.33-6.80)

Environmental Exposures
Measure Baseline % Follow-up %
Pets in the home 38.3 37.8
Cockroaches – last 3 mos 51.6 40.2
Mice/rats – last 3 mos 67.2 55.9
Cigarettes per day 8.1 8.8
Days smoked/month 24.7 28.9
Smoking inside:Always/mostly inside 42.2 26.3
Rarely/never inside 28.9 34.2

Pests in the Home
Measure Mean Score (95%CI) Baseline
Mean Score (95%CI)Follow-up
Presence in 3 rooms
Cockroaches (total score 0-6)
1.26 (0.95-1.57) 0.65 (0.46-0.83)*
Mice (total score 0-9)
2.89 (2.43-3.35) 1.32 (1.03-1.62)*
Total Seen in 3 rooms
Mice 3.39 (2.57-4.20) 1.93 (1.31-2.55)*
Rats 0.13 (0.02-0.23) 0.06 (-0.16-0.13)

Provider Communication
Measure Baseline% all the time
Follow-up % all the time
Treated you with respect 74.8 79.6
Listened to you 70.1 78.0
Explained so you understood 63.0 75.6
Told you when to return 76.4 84.3
Spent enough time 64.6 77.2
Tried to manage asthma 52.0 71.4
Asked if you had questions 69.1 79.4
You asked question 56.7 76.8
Understood what you said 62.7 77.0
Total Score (95% CI)* 39.1 (38.0-40.3) 42.0 (41.0-42.9)

Self Efficacy
MEASURE Baseline% very sure
Follow-up% very sure
Know how well child’s asthma under control 42.5 83.6
Can detect early signs asthma is worse 63.0 90.6
Can keep child from coughing/wheezing 28.4 71.9
Can keep symptoms from getting worse 53.2 78.1
Know when to use reliever medication 74.0 93.7
Child can take meds as prescribed 85.0 94.5
Know what to do if asthma is worse 86.6 96.1
Can ID things that set off asthma 50.0 85.2
Can ID things that set off asthma outside 50.4 82.0
Can get questions answered by doctor 75.6 94.5
Can understand what doctor tells you 82.7 94.5
You can take care of child’s asthma 73.2 93.8
Mean self efficacy score (total)* 17.4 13.6

Mean Reported Changes in Symptoms
Mean # events/last 14 days Baseline Follow-up Change
Days with symptoms 3.5 1.8 ↓1.7 days*
Days with activity limitations 2.9 0.8 ↓ 2.0 days*
Nights with symptoms 3.5 1.6 ↓ 1.9 days*
Days used rescue meds 4.6 2.1 ↓ 2.6 days*
Days used controller meds 9.0 9.8 ↑ 1.3 days
Reported ED visits (last yr) 2.52 1.47 ↓ 1.0 visit*
Reported hospitalizations (last yr)
0.46 0.28 ↓0.22 visit**
*p<0.0001; **p=0.032

*p=<0.0001
Reported ED Visits and Hospitalizations
• 22 fewer hospitalizations**– # Hospital stays at baseline = 56– # Hospital stays at follow-up= 34– Average asthma hospitalization cost: $7,866
• 129 fewer ED visits*– # ED Visits at baseline = 310– # ED Visits at follow-up = 181 – Average asthma ED visit cost : $772
Change in mean number of ED visits - ↓ 1.0 visit*Change in mean number of hospitalizations - ↓ 0.22 visit**
**p=0.023

Total RAD Program Costs = $1,386.14/case
• SUPPLIES AND EQUIPMENT (Variable Cost) = $291.95/case– IPM Kit– Green Cleaning Kit– Bedding Encasements– Equipment - mat, trash can, vacuum, air filter (1/3 of homes)
• ANNUAL OVERHEAD COSTS (Fixed Cost) = $176.79/case– Rent/utilities– Office supplies– Transportation– Parking stickers– Asthma educational materials
• PERSONNEL COSTS (includes fringe) $917.40/case– Scheduling/visit coordination: 4 hours– Community Health Worker: 30 hours– RN supervision: 6 hours

Cost Savings Analysis
Comparison: 1yr before to 1yr after enrollment
• Costs averted (hospitalizations & ED visits)
– $272,640 ($2,217/child)
• Home visiting program costs
– $170,478 ($1,386/child)
• Potential cost-savings for third-party payers
– $102,162 ($831/child)

Challenges and Opportunities
• RAD funding ended 2012 – program not currently funded
• Met with stakeholders to discuss results
– Findings met with interest
– No additional funding secured
• Baltimore City Health Department offers shorter program to interested families who have a child with asthma

Thank you!
• Brandi Sanders, Carla Hardy, and Tyra Pierce,
Community Health Workers
• Melissa Luke, Referral Coordinator
• Carol Kawecki, RN and Dottie Freeman, RN, Program Mangers
• Ida Ganao, Data Manager
• Pat Breysse, PhD and Greg Diette, MD,
co-investigators
• Deborah Greenberg, MA, Research Analyst
• Centers for Disease Control and Prevention

Questions?

Community Asthma Prevention
Closing the Circle of Care
Program:
Tyra Bryant-Stephens, MD, Director and Founder of the Community Asthma Prevention Program of Philadelphia
The Children’s Hospital of Philadelphia

CAPP History
• Founded in 1997
• Premise: Despite medical advancements,
children in West Philadelphia urban primary
care practice continued to go to the ED and
hospital for asthma exacerbations
• Clearly a gap existed between medical
management and self-management behavior

Goals of CAPP
• To increase asthma knowledge and improve asthma self-management behavior
• To improve quality of life for children with asthma
• To equip members of the community to become neighborhood asthma experts
• To promote asthma-safe home and school/child care environments;
• To reduce burden of asthma on disparate populations

Target Populations
• West, Southwest,
South, and North
Philadelphia
• Urban, poor,
predominately
African-American
and Latino
communities

CAPP’s Outreach from 1997- present

CAPP Building Blocks
Community Partnerships
Research Advocacy
Optimized Asthma Care
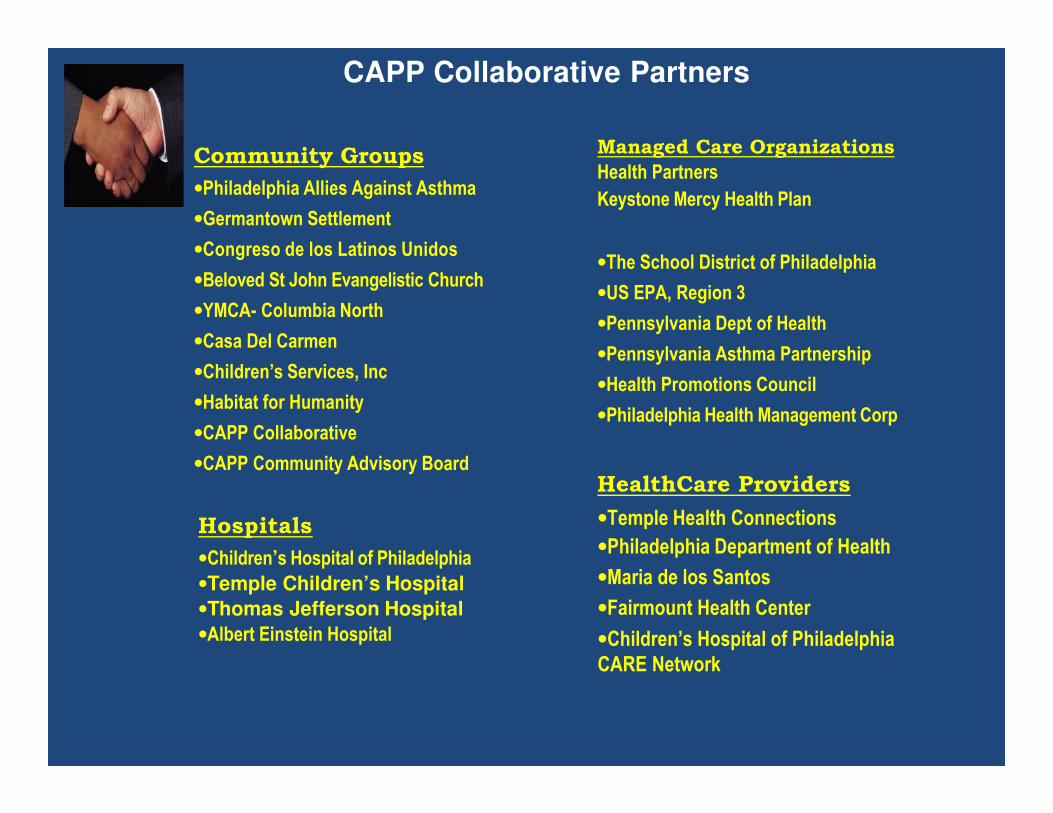
CAPP Collaborative Partners
Community Groups
•Philadelphia Allies Against Asthma
•Germantown Settlement
•Congreso de los Latinos Unidos
•Beloved St John Evangelistic Church
•YMCA- Columbia North
•Casa Del Carmen
•Children’s Services, Inc
•Habitat for Humanity
•CAPP Collaborative
•CAPP Community Advisory Board
Managed Care Organizations
Health Partners
Keystone Mercy Health Plan
•The School District of Philadelphia
•US EPA, Region 3
•Pennsylvania Dept of Health
•Pennsylvania Asthma Partnership
•Health Promotions Council
•Philadelphia Health Management Corp
HealthCare Providers
Hospitals
•Children’s Hospital of Philadelphia
•Temple Children’s Hospital
•Thomas Jefferson Hospital
•Albert Einstein Hospital
•Temple Health Connections
•Philadelphia Department of Health
•Maria de los Santos
•Fairmount Health Center
•Children’s Hospital of Philadelphia
CARE Network

Home Visits added. Classes and and Train-the-Trainer are implemented
CAPP is founded by Dr. T. Bryant-Stephens in response to high incidence of asthma ED visits in her practice.
Merck Childhood Asthma Network Funds school, home and community interventions
Community Advisory Board established Controlling Asthma
in American Cities project
implemented over
five years
Door-to-door and school screenings
CAPP receives NIEHS EJ award for West Philadelphia
NCI funds research on
SHS reduction counseling in primary
care
EPA funds EMR PCP education
1997 1998 1999 2000 2001 2002 2003 2005 2006 2007 2009 2010 2012 2014
strategies include community education,, and training community leaders
MCAN funds Asthma Health Navigator Program
Smoking Cessation Counseling added to CAPP.
PADOH funds Health Homes Project CAPP expands
Home Visits program in West. South, & Southwest Philadelphia (EPA). Classes, PCP Training
and School Interventions.
CAPP Collaborative is formed. The four-prong approach includes: Home Visits, Communi

Types of Community-Based
Interventions over 14 years
• Community asthma self-management education
• Individual home asthma self-management education
• Home environmental remediation• Primary provider education
• School professional education
• School student education
• School screening
• Door-to-door screening
• Community evaluation
• Asthma navigators

Home Environmental I nterventions for Children
with Asthma �CAPP delivers environmental interventions in
homes by:
– Training CHWs recruited from the community to deliver in-home evidence-based asthma
education and environmental mitigation
– Reviewing symptom diaries with patients to help better manage asthma
– Promoting self-management of environmental exposures by demonstrating medication use,
asthma devices, trigger avoidance techniques,
reviewing AAPs and connecting families to
resources

Evidence-based Home Environmental and Education for
Children with Asthma Coordinated through:
+Referrals from CHOP’s patient database,community primary care providers and school
nurses to identify high-risk children
+Closely spaced interventional home visits initiallythen at least monthly visits for one year
+Evaluation of improved ability to self-manageasthma, visual assessments of the home
environment and tracking health care utilization
for enrolled children
+Feedback to clinical providers

Home Environmental Intervention
Methods
+Assessment of child’s bedroom and general livingareas
+General asthma education provided includingAAP, proper use of devices and medication
+Parents taught how to make simpleenvironmental interventions in child’s bedroomand general living area
+Supplies given to facilitate interventions
+Inspection of rooms at f/u visits
+Education reinforced at each visit with teach back

Changes made from intervention
–Mattress and Pillow Covers Used
–Clothing and toys placed in rubber bins
–Tile replaced worn carpet
After Befor
e

CHW Training
Weekly meetings
Monthly booster session
Independent Visits with monthly-
quarterly supervisor evaluation
Initial didactic and protocol
training
trained home visitor Buddy visits with
Field training by supervisor or senior
home visitor

Training Community Health Workers
• Overview of CAPP and specific project
• Basic Asthma Knowledge
• Skill building-asthma devices
• Teaching Techniques
• Mock teaching from Lesson Plans
• Scenarios encountered in the Home
• Protocol for project

CHW
Ongoing Training and Monitoring
1)Monthly data meetings
2)Demonstration of lesson for peer review
3)On-site observation
4)buddy visits
5)independent visits
6) monthly booster sessions

Evaluation

CAPP Logic Model for Home Visits
Activities Initial
Outputs
Short-Term
outcomes
Long Term
Outcomes
• Train CHWs to
deliver home-
based asthma
education,
environmental
home
assessments
and trigger
mitigation
• Number of children
with poorly
controlled asthma
receive home
educational and
environmental
mitigation visits
• Number of children
with AAPs that
include trigger
identification
•Improved self-
management of
medications
and home
environment
•Reduced
exposure to
environmental
triggers
• Increase in
QOL as
measured by
increased
symptom free
days
• Reduced ED
visits and
hospitalizations

Status Home Environmenta l and
Education Interventions
• Six home visitors trained. Most retained for at
least 5 years.
• Over 2000 families participated in Home Visit
Program
• Average retention for 6 month projects- 95%
• Average retention for 12 month projects-87%

Home Asthma Ed
Environmental Intervention
ucation and
Demographics of Home Visit Families n=339 children, n=256 families
Mean
Age 7.4 years, ± 4.2
Sex 54.0% male
Race 85.8% African American
Ethnicity 8.8% Hispanic

Home Asthma Education and
Environmental Intervention Outcomes
Paired Analysis n=208 Baseline 12 month p-value
ED visits last 12 months 2.04(±1.43) 1.04(±2.1 <0.05
Hospitalizations last 12 months .90(±2.11) 0.39(±1.0 <0.05
Missed school for any reason 7.13(±11.47) 6.13
(±7.97)
0.49
Missed school for asthma 5.85
(±10.46)
4.02
(±6.44)
<0.05

Home Asthma Education and
Environmental Intervention Outcomes
Paired Analysis n=208 Baseline 12 month p-value
# of days using rescue meds 3.72 2.18 <0.05 (±4.58) (±3.55)
# of days with symptoms 3.17(±4.25 1.71(±2.92 <0.05 ) )
# nights with symptoms 2.82 1.44 <0.05
(±4.22) (±3.29)
# of days child slowed down 2.90 1.00 <0.05
because of asthma (±4.83) (±2.13)

Home Asthma Ed ucation and
Environmental Intervention Outcomes
In Past Year:
1 0.92
Trips to ED
0.8 0.83
0.6
0.4
0.2
Inpatient Stays
0.5 0.38
1.47
1.2
0
Baseline 6 months 12 months
1.11
1.6
1.4

Home Asthma Ed ucation and Environmental
Intervention Severity Change
4
3.5
3
2.5
2
D a
y s
1.5
In Past Two Weeks:
1
0.5
3.71
3.22 3.16
2.74 2.67 2.48 2.12
1.83
1.06 1.32 0.940.57
0
Baseline 6 months 12 months
Used Rescue Meds Days of Symptoms
Nights of symptoms Slow down play

Lessons Learned Lessons Learned
• CHW’s are skilled and effective recruiters for the
project
• CHW’s can build valued supportive relationships
with caregivers
– Establish boundaries for CHW’s and clients
– Educate CHW’s about legal ramifications
– Important to recruit CHW’s who have some
experience in building relationships with clients

Lessons Learned Lessons Learned
• Data collection has to be monitored closely
–Review essential data elements consistently
–Create script for CHW’s when asking questions
–Have CHW’s monitor each other at monthly/weekly meetings
–Do random chart checks
–Create punch list for data entry clerk
• Expectations must always be inspected

Challenges
• Infrastructure
• Field supervision
• Data Collection
• Safety challenges
• Monitoring/Documentation of Daily Activities
• Sustainability
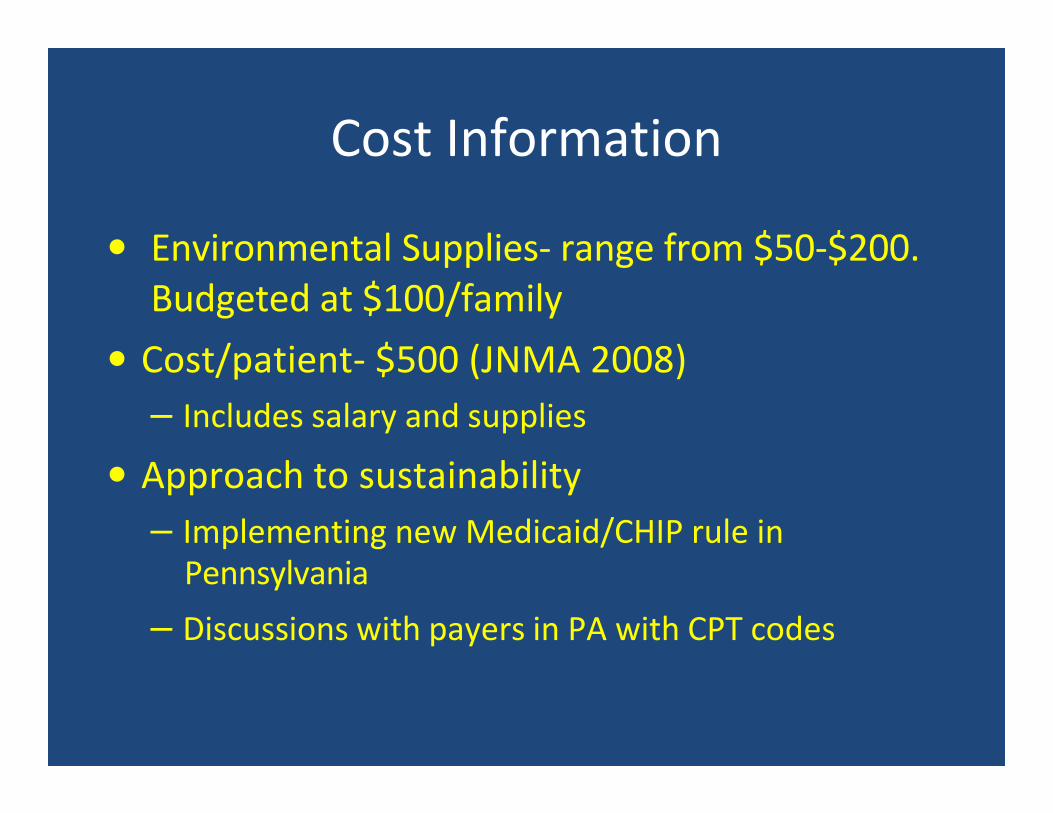
Cost Information
• Environmental Supplies- range from $50-$200.
Budgeted at $100/family
• Cost/patient- $500 (JNMA 2008)
– Includes salary and supplies
• Approach to sustainability
– Implementing new Medicaid/CHIP rule in Pennsylvania
– Discussions with payers in PA with CPT codes

Questions?

District of ColumbiaHealthy Homes Partnership
_______________Pierre Erville, Associate Director
Lead and Healthy Housing Division
January 17, 2014

Scope of Problem
� 30% of District children live in poverty1
• Highest rates in Wards 7 and 8
� 17% of District children live with asthma2
• Causes > 350 annual child hospitalizations2
• Leading cause of ED visits2
• Primary reason for school absences2
• Highest prevalence in Wards 7 and 8 (~25%)
1 US Census Data, 2012; 2 DC Department of Health
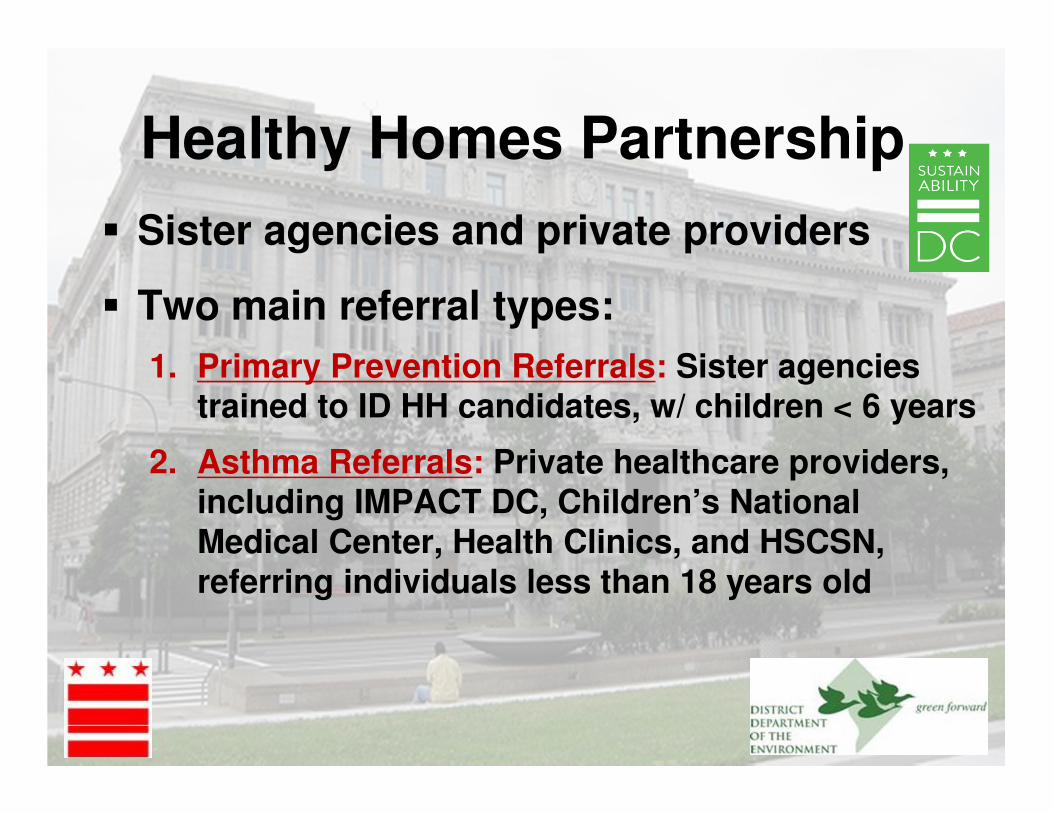
Healthy Homes Partnership
� Sister agencies and private providers
� Two main referral types:
1. Primary Prevention Referrals: Sister agencies trained to ID HH candidates, w/ children < 6 years
2. Asthma Referrals: Private healthcare providers, including IMPACT DC, Children’s National Medical Center, Health Clinics, and HSCSN, referring individuals less than 18 years old

About Our Referrals
� Majority of asthma referrals reside in Wards 7 and 8
� Half the asthma referrals live in either subsidized or public housing
� Indoor asthma triggers typically found: pests, mold, dust, env’l smoke

HEALTHY HOMES Case Management TimelineHH Case Management Timeline
Initial Contact
Initial Visit
Complete CAP/TAR
CLOSECASE
Pre-Visit Activities Response
Enter Data
ClientCAP Call
Frequent Contact With Client Throughout
+ 2 + 9 + 11 + 16 + 23 + 37 + 51 + 120 + 210 + 300
Months1 2 4 7 10
Complete action within # working days in white circle
Evaluate Hazard Remediation ASAP
12
Mail TAR
Client Call
Client Call
Final Visit
Referral Assigned
We’ll Go Into These
�Pre-test�ACT #1�LIHEAP
App
�Post-test�ACT #2�Supp.
�ACT #3�Supp.
� ACT #4� Supp.� Final
Eval.

Initial Visit + Office Work
� Certified Healthy Homes (HH) Specialist conducts home assessment with Energy Program Auditor (oversees LIHEAP app)
� Specialist administers Asthma Control Test (ACT) and pre-test re HH basics; provides customized HH education / supplies; creates Technical Assistance Report and Care Plan

Technical Assistance Report

Technical Assistance Report
Attach:
Photos (date stamped, with captions including Room and Hazard ID #)
Property Schematic showing each Room ID #
Care Plan

Program Approach Re: Property Owner
• Initial approach as consultant
• Provide TA & grant info / Oversee interventions
• If needed, as enforcement agent
• Referral to Code Enforcement partner
• And potentially, as protector of tenant rights
• Referral to Office of Tenant Advocate (partner)

Public / Subsidized Housing
� Public/subsidized housing cases trigger communication with Housing Authority
� Case managers oversee ongoing follow-up with Housing Authority (HA) as needed
� Result: greater HA awareness of impact of HH issues and how to address them

Case Management
� Real-time communication with PCP
� Quarterly administration of ACT
� Multiple home visits, w/calls to landlord
� Referrals to support services
� Real-time tracking of case status
� Ongoing data collection

Ongoing Evaluation
� Comprehensive/continuous data analysis
• Real-time QA/QC
� Enables identification of data gaps and opportunities for increased efficiency
• Program economic impact
� Recently launched ACT supplemental form
• Tracking trends
� E.g., improved asthma control (ACT #1 - ACT #4)

Challenges/Opportunities
� Challenges:
• Some cases lost to follow-up
• Some referrals unwilling to participate
� Opportunities:
• Systemic changes in HA prop. maint. norms
• Significant reduction in asthma triggers
• Improved health for asthma patients
• Reduction of health disparities

Client Families w/ Mayor & DDOE Director

Client Testimonial
http://www.youtube.com/watch?v=sDWvcjM_C2s&feature=youtu.be

Multnomah County Healthy Homes
and Families Programs
Investing in Best Practices
Kim Tierney, Program Supervisor, Healthy Homes and Families
Multnomah County Environmental Health,
Portland, Oregon
January 14, 2014

Healthy Homes and Families Programs
• 2005 HUD Demonstration Grant - Healthy Homes Asthma Program - 6 month nursing case management program serving low income children with Asthma
• 2009 Asthma Inspection and Referral Program (AIR)2009 – One time visit by EHS with report to families and referring providers – General Fund
• 2009 Housing Code/ Rental Inspections-General Fund
• 2010 HUD Healthy Homes Demo Grant – CAIR – serving children with asthma and other environmentally caused health conditions
• Lead Poisoning Prevention Program – City/State Grants

CAIR Program
• The CAIR Program was a three year HUD funded Healthy Homes Demonstration program designed to assist low income families with children experiencing health issues related to living in substandard housing conditions.

How was CAIR Unique?
• Out-stationed staff at Community Agencies
• Web based referral and data system
• Partners to provide home repair
• Partners to provide medical homes
• Broader health issues than just asthma
• Team case management through web
• Expanded interventions – Air Quality, Safety, Hazards


Create Sustainable Funding for Healthy Homes Interventions
Goal: Amend the State Health Plan to
provide Targeted Case Management reimbursement for Healthy Homes and opportunities for other Health Departments to provide this service

Media Engagement
Getting your message out to decision makers and the public.
“New Program Highlights Household Asthma Triggers”
PORTLAND, OR 2006-08-10 The Multnomah County Health Department has started a new program to raise awareness about asthma and to help struggling families.
Asthma is becoming increasingly common in the U.S. It's a disease that leaves people wheezing and panting for breath. Those who live in cities are at higher risk, but asthma is growing even faster among minority populations, who often live in older homes and closer to large industrial areas.
Maribel Correa, who moved to the U.S. from Colombia 7 years ago, lives in Northeast Portland with her husband and four kids. Her two youngest have had problems with asthma. Last spring one got sick with a cold.
"It started to fill up his throat and she went to the hospital and they said he had bronchitis, and it had never happened before and she got scared," translates Correa's 11-year-old daughter, Melissa. "They gave her some medicine to give to the kids and in three days it got worse and so she took him to the hospital." Correa says eventually they found out it wasn't bronchitis - it was asthma. Doctors told her that her son's respiration was half the level it should be.

Public
Engagement
Building
awareness
and support

Direct Advocacy
Educating and influencing decision makers on public policy.

Key steps to sustainable funding
• Research national efforts
• Measure outcomes
• Communicate Return on Investment (ROI)
• Convene and enlist support from:
– Directors of Managed Care Plans
– Politicians
– Champion within Medicaid Program
• Identify key steps to implementing Targeted Case Management

Key steps to sustainable funding
• Develop a plan and timeline and coordinate monthly meetings with DMAP staff.
• Submit a State Plan Amendment (SPA) waiver to Center for Medicaid Services
• Implement immediate time study
• Analyze policy to determine billable activities
• Negotiate rate with DMAP
• Begin TCM!

Targeted Case Management (TCM) Implementation
• Develop TCM Chart Forms/Standards
• Develop Billing System
• Develop Workflow
• Quarterly Time Studies
• Evaluate Program
• Audit Charting
• Revise Productivity down
• Revise Costs upward
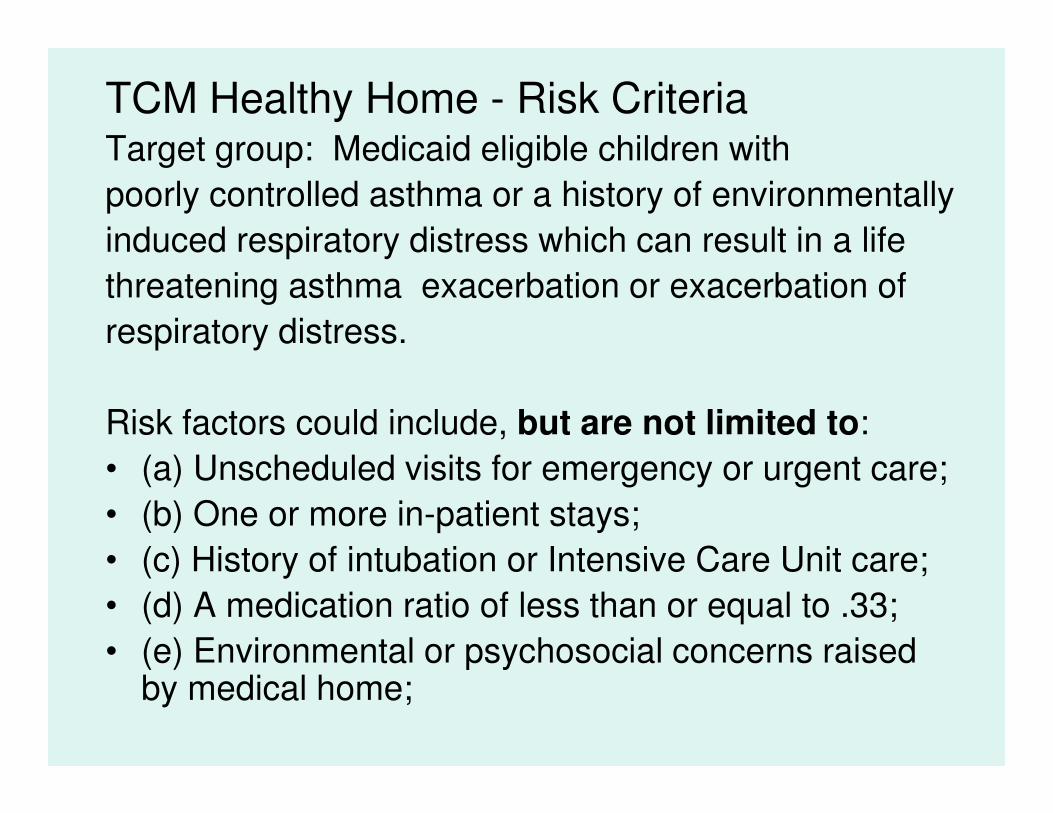
TCM Healthy Home - Risk Criteria Target group: Medicaid eligible children with
poorly controlled asthma or a history of environmentally
induced respiratory distress which can result in a life
threatening asthma exacerbation or exacerbation of
respiratory distress.
Risk factors could include, but are not limited to:
• (a) Unscheduled visits for emergency or urgent care;
• (b) One or more in-patient stays;
• (c) History of intubation or Intensive Care Unit care;
• (d) A medication ratio of less than or equal to .33;
• (e) Environmental or psychosocial concerns raised by medical home;

TCM Healthy Home – Description of services
Comprehensive assessment of individual needs:• Taking client history;
• Evaluation of the extent and nature of recipient’s needs (medical, social, educational, housing, environmental, including assessment for risk of lead exposure and existence of second hand smoke and other specified asthma triggers and irritants, and other services) and completing related documentation;
• Gathering information from other sources to complete assessment
Development of specific care plan
Monitoring and follow-up activities
Linking/Referral, etc
Reassessment

TCM Healthy Home –Provider Requirements
The case manager must be a licensed Registered Nurse, registered Environmental Health Specialist, Asthma Educator certified by the National Asthma Education and Prevention Program, Community Health Worker certified in the Stanford Chronic Disease Self-Management Program, or worker working under the supervision of a licensed Registered Nurse or a registered Environmental Health Specialist.

Demonstrate Return on InvestmentCollect Data
• Emergency Room Visits
• Hospitalization
• Medication Ratio
• Change in Environmental Scores
• ACT or TRACK Scores
• Quality of Life questions
• Work or School Days lost

Lessons Learned
Resources for Home Repair CDBG
Medical Homes
Community Partners
Program Income
Underestimating the need
Out-stationed Staff
Difference between CAIR / Healthy Homes

Challenges
• New Technology
• Data Base development
• Enrollment
• Partner timelines
• Community Health Worker scope
• Charting
• Caseload Management
• Landlord Tenant Issues

ER Visits (Closed Cases)
• Healthy Homes – Asthma• 61 clients total• 56% No Change• 5 % Increased• 39% Decreased• 2.5 visits saved in 6
months• 5 visits saved per client/
per year X cost of ER visit
• 122 visits saved over 2 yrs
• CAIR –Asthma and other conditions
• 149 clients total• 70% No Change• 7 % Increased• 22 % Decreased• 2 visits saved in 6 months• 4 visits saved per client/
per year X cost of ER visit
• 132 visits saved over 2 yrs

ACT Score Changes
Healthy Homes
• 83% of Cases showed an increase in ACT score
• Average ACT score change was 6.1 for all clients.
• Average ACT score change was 7.8 for all clients whose ACT score improved
CAIR
• 71% of Cases showed an increase in ACT score
• Average ACT score change was 3.7 for all clients.
• Average ACT score change was 6 for all clients whose ACT score improved

CAIR HH OR (CAIR) CI
1. How would you rate the health of
your family 100% 132% 2.3 [0.9-6.1]
2. Housing as the source of illness -93% -85% 13.8 [2.9-64.5]
3. Emergency room visits for household
in the last 6 months (self reported) -59% -29% 2.1 [0.8-5.0]
4. Average number of visits in last 6
months -2.5 -1.9 1.79 [0.7-4.1]
5. Household members had access to
health care 61% 0% 7.5 [3.5-16.4]
6. Comfort with Landlord -56% -29% 2.7 [1.1-6.1]
OR is from logistic regression model predicting final scores from program type, controlling for pre scores.
Percents are relative changes from baseline.
In all cases, CAIR has superior results, with Questions 2, 4, and 5 being statistically significant
Qualitative Questions

Questions and feedback:
Kim Harris Tierney
503 988 3663 x 22850
http://web.multco.us/health/healthy-housing