Regional Seismic Hazard Posed by the Mentawai Segment of ... · Mentawai segment is the megathrust...
19
Regional Seismic Hazard Posed by the Mentawai Segment of the Sumatran Megathrust by Kusnowidjaja Megawati and Tso-Chien Pan Abstract Several lines of evidence have indicated that the Mentawai segment of the Sumatran megathrust is very likely to rupture within the next few decades. The present study is to investigate seismic hazard and risk levels at major cities in Sumatra, Java, Singapore, and the Malay Peninsula caused by the potential giant earthquakes. Three scenarios are considered. The first one is an M w 8.6 earthquake rupturing the 280 km segment that has been locked since 1797; in the second scenario, rupture oc- curs along a 600 km segment covering the combined rupture areas of the 1797 and 1833 historical events, producing an M w 9.0 earthquake; and the third scenario has the same rupture area as the second scenario but with doubled slip amplitude, resulting in an M w 9.2 earthquake. Simulation results indicate that ground motions produced by the hypothetical scenarios are strong enough to cause yielding to medium- and high- rise buildings in many major cities in Sumatra. It is vital to ensure that the overall strength, stiffness, and integrity of the structures are maintained throughout the entire duration of shaking. However, the ductile detailing in current practice is formulated based on an assumption that ground motions would last from 20 to 40 sec. This has not been tested for longer durations of 3–5 min, expected from giant earthquakes. In Singapore and Kuala Lumpur, only medium- and high-rise buildings, especially those located on soft-soil sites, are at risk. Given that seismic design has not been required in either city, and thus the resulting structures are relatively brittle, it is crucial to inves- tigate their performance under moderate-amplitude, long-duration, ground motions. The present study also points out that shifting the response spectrum toward a longer period range becomes significant for sites located far from potential seismic sources, which should be carefully considered in formulation of future seismic codes. Introduction The Sunda arc, extending over 5600 km from the Anda- man islands in the northwest to the Banda arc in the east, was formed by the convergence between the subducting Indian– Australian plate and the overriding southeastern Eurasian plate. The Sumatran megathrust of the Sunda arc lies 250 km off the western coast of Sumatra island (Fig. 1), with both the Sumatra and Java islands lying on the Eurasian plate. The convergence is nearly orthogonal to the trench axis south of Java, but it is highly oblique southwest of Sumatra. Based on velocity vectors derived from the regional Global Posi- tioning System (GPS) data, the pole of rotation for the rela- tive motion between the two plates is in East Africa, about 50° W of Sumatra (Larson et al., 1997; Prawirodirdjo et al., 2000). Northern Sumatra is closer to this pole than southern Sumatra; thus, the orientation and magnitude of the relative- motion vector vary significantly along the Sumatran portion of the plate boundary, as shown in Figure 1. Slip vectors of moderate earthquakes along this subduction zone were found to be nearly perpendicular to the strike of the plate boundary (McCaffrey, 1991, 1992). Most of the strike-slip component of the oblique convergence between the Indian–Australian plate and the Eurasian plate southwest of Sumatra is accom- modated by right-lateral slip along the trench-parallel Suma- tran fault, lying roughly 250 km northeast of the trench (Fitch, 1972; McCaffrey, 1991, 1992; Sieh and Natawidjaja, 2000). Therefore, the slip along the subduction zone itself has relatively small strike-parallel components. Five giant earthquakes (M w ≥ 8:0) have occurred along the Sumatran megathrust in the last 250 years, releasing the strain accumulated by the convergence between the two tec- tonic plates. The rupture zones of these earthquakes are de- picted in Figure 1. The earliest of these historical events was that of February 1797 (Newcomb and McCann, 1987; Nata- widjaja et al., 2006). The earthquake had an M w of 8.7 and ruptured the 370 km segment from 1° S to about 4° S (Na- tawidjaja et al., 2006). This was followed by the giant earth- quake of 1833 (M w 9.0), which ruptured a 500 km long segment south of Siberut island, and another one in 1861 566 Bulletin of the Seismological Society of America, Vol. 99, No. 2A, pp. 566–584, April 2009, doi: 10.1785/0120080109
Transcript of Regional Seismic Hazard Posed by the Mentawai Segment of ... · Mentawai segment is the megathrust...
Regional Seismic Hazard Posed by the Mentawai Segment
of the Sumatran Megathrust
by Kusnowidjaja Megawati and Tso-Chien Pan
Abstract Several lines of evidence have indicated that the Mentawai segment ofthe Sumatran megathrust is very likely to rupture within the next few decades. Thepresent study is to investigate seismic hazard and risk levels at major cities in Sumatra,Java, Singapore, and the Malay Peninsula caused by the potential giant earthquakes.Three scenarios are considered. The first one is an Mw 8.6 earthquake rupturing the280 km segment that has been locked since 1797; in the second scenario, rupture oc-curs along a 600 km segment covering the combined rupture areas of the 1797 and1833 historical events, producing anMw 9.0 earthquake; and the third scenario has thesame rupture area as the second scenario but with doubled slip amplitude, resulting inan Mw 9.2 earthquake. Simulation results indicate that ground motions produced bythe hypothetical scenarios are strong enough to cause yielding to medium- and high-rise buildings in many major cities in Sumatra. It is vital to ensure that the overallstrength, stiffness, and integrity of the structures are maintained throughout the entireduration of shaking. However, the ductile detailing in current practice is formulatedbased on an assumption that ground motions would last from 20 to 40 sec. This hasnot been tested for longer durations of 3–5 min, expected from giant earthquakes. InSingapore and Kuala Lumpur, only medium- and high-rise buildings, especially thoselocated on soft-soil sites, are at risk. Given that seismic design has not been required ineither city, and thus the resulting structures are relatively brittle, it is crucial to inves-tigate their performance under moderate-amplitude, long-duration, ground motions.The present study also points out that shifting the response spectrum toward a longerperiod range becomes significant for sites located far from potential seismic sources,which should be carefully considered in formulation of future seismic codes.
Introduction
The Sunda arc, extending over 5600 km from the Anda-man islands in the northwest to the Banda arc in the east, wasformed by the convergence between the subducting Indian–Australian plate and the overriding southeastern Eurasianplate. The Sumatran megathrust of the Sunda arc lies 250 kmoff the western coast of Sumatra island (Fig. 1), with both theSumatra and Java islands lying on the Eurasian plate. Theconvergence is nearly orthogonal to the trench axis southof Java, but it is highly oblique southwest of Sumatra. Basedon velocity vectors derived from the regional Global Posi-tioning System (GPS) data, the pole of rotation for the rela-tive motion between the two plates is in East Africa, about50° W of Sumatra (Larson et al., 1997; Prawirodirdjo et al.,2000). Northern Sumatra is closer to this pole than southernSumatra; thus, the orientation and magnitude of the relative-motion vector vary significantly along the Sumatran portionof the plate boundary, as shown in Figure 1. Slip vectors ofmoderate earthquakes along this subduction zone were foundto be nearly perpendicular to the strike of the plate boundary
(McCaffrey, 1991, 1992). Most of the strike-slip componentof the oblique convergence between the Indian–Australianplate and the Eurasian plate southwest of Sumatra is accom-modated by right-lateral slip along the trench-parallel Suma-tran fault, lying roughly 250 km northeast of the trench(Fitch, 1972; McCaffrey, 1991, 1992; Sieh and Natawidjaja,2000). Therefore, the slip along the subduction zone itselfhas relatively small strike-parallel components.
Five giant earthquakes (Mw ≥8:0) have occurred alongthe Sumatran megathrust in the last 250 years, releasing thestrain accumulated by the convergence between the two tec-tonic plates. The rupture zones of these earthquakes are de-picted in Figure 1. The earliest of these historical events wasthat of February 1797 (Newcomb and McCann, 1987; Nata-widjaja et al., 2006). The earthquake had an Mw of 8.7 andruptured the 370 km segment from 1° S to about 4° S (Na-tawidjaja et al., 2006). This was followed by the giant earth-quake of 1833 (Mw 9.0), which ruptured a 500 km longsegment south of Siberut island, and another one in 1861
566
Bulletin of the Seismological Society of America, Vol. 99, No. 2A, pp. 566–584, April 2009, doi: 10.1785/0120080109

(Mw 8.5) rupturing a 270 km long segment beneath Niasisland (Newcomb and McCann, 1987; Zachariasen et al.,1999; Natawidjaja et al., 2006). Since 1861, no giant earth-quake with Mw ≥8:0 had occurred along the Sumatranmegathrust until 26 December 2004, when the Mw 9.15Aceh-Andaman earthquake happened (Ammon et al., 2005;Lay et al., 2005; Subarya et al., 2006; Chlieh et al., 2007).This was shortly followed by the Mw 8.6 Nias-Simeulueearthquake on 28 March 2005 (Briggs et al., 2006; Koncaet al., 2007), which has a rupture zone coincident with thatof the 1861 event.
The ruptures of the 2004 and 2005 events have releaseda significant portion of the strain accumulated along themegathrust north of the equator, making it unlikely for giantearthquakes to occur again in this segment of the megathrustin the near future. The situation is very different south of1° S. The megathrust has not ruptured under Siberut islandsince 1797, and the segment between 2° S and 5° S has notruptured since 1833. Zachariasen et al. (1999) indicate thatevents similar to the 1833 earthquake might occur aboutevery 265 yr on average, but the December 2004 and March2005 earthquakes have increased the stress within the Men-
90 93 96 99 102 105 108 111-12
-9
-6
-3
0
3
6
9
12
Scenarios B & C
Scenario A
13 Sep 2007 03:35:2612 Sep 2007 23:49:01
12 Sep 2007 11:10:26
1833
1797
BtNi
Sm
SPNP
SbSp
En
Jakarta
Bengkulu
Padang
28 Mar 2005 &1861
26D
ec2004
Sumatran
Fault Malay Peninsula52 mm/yr(N10oE)
57 mm/yr
Palembang
Pekanbaru
Penang
Singapore
Latit
ude
(o )
Medan
Longitude (o)
EurasianPlate
Indian-AustralianPlate
60 mm/yr(N17oE)
500 km0
Sumatra
Java
Kuala Lumpur
Figure 1. Tectonic setting of the Sumatran megathrust. The rupture areas of the five giant earthquakes with Mw ≥8 are shown by thelightly shaded areas, whereas the asperities are shaded more darkly. The nine major cities in the region are marked by the squares. The islandsoff the western coast of Sumatra are (from north to south): Sm, Simeulue island; Ni, Nias island; Bt, Batu island; Sb, Siberut island; Sp,Sipora island; NP, North Pagai island; SP, South Pagai island; En, Enggano island. The Mentawai islands comprise the four main islands ofSiberut, Sipora, North Pagai, and South Pagai. The rupture planes of scenarios A, B, and C are shown by the rectangles along the Mentawaiislands. The epicenters of the southern Sumatran subduction earthquakes, occurring on 12 and 13 September 2007, are depicted by the threecircles on the Mentawai islands.
Regional Seismic Hazard Posed by the Mentawai Segment of the Sumatran Megathrust 567

tawai segment of the megathrust (Nalbant et al., 2005). TheMentawai segment is the megathrust beneath the Mentawaiislands, comprising four main islands of Siberut, Sipora,North Pagai, and South Pagai. Several lines of evidence out-lined in the following discussion further point to the fact thatthe rupture of this segment is very likely in the near future.
Between about 0.7° S and 2.1° S, the interseismic strainaccumulated along this segment of the megathrust has ap-proached or exceeded the levels relieved in 1797 and 1833.This is evidenced by the lack of vintage 1797 and 1833 coralheads in the intertidal zone, which demonstrates that theinterseismic submergence has now nearly equaled the coseis-mic emergence that accompanied those earthquakes (Nata-widjaja et al., 2006). Coral microatolls of the Mentawaiislands (Natawidjaja et al., 2007) show that subsidence atrates from about 2 to 14 mm=yr has predominated on theislands over the past five decades. This long-lived and rapidsubsidence indicates that the megathrust beneath the islandsis currently locked and the hanging-wall block, of which theislands are a part, is being carried down with the subductingplate. South of about 2° S, the 1833 microatolls still protrudeabove the lowest tides, indicating that strain accumulationsince 1833 has not compensated the emergence during the1833 event. Therefore, the deficit of strain relief beneaththe Siberut island is greater than that beneath the Siporaand Pagai islands (Natawidjaja et al., 2006). However, thewhole segment under the Mentawai islands has been lockedsince 1833 and has accumulated potential slip of about 10 m,making failure along the whole segment plausible. This is inline with the observed 1797 and 1833 couplet events.
The main objective of the present research is to assessthe seismic hazard levels from future rupture of the Menta-wai segment at major cities in Sumatra, Java, the Malay Pe-ninsula, and Singapore. This extends the work previouslycarried out by Megawati and Pan (2002), in which theground-motion intensity in Singapore due to the rupture ofthe 1833 event was estimated. The present research is mo-tivated by the fact that the detailed rupture models of the1797 and 1833 earthquakes have been revealed (Natawidjajaet al., 2006) and the locking condition of the subduction in-terface along the Mentawai segment has been constrainedfrom recent geodetic and paleogeodetic measurements(Chlieh et al., 2008). This new information allows a betterconstrain on the credible future rupture scenarios along the
Mentawai segment. The ground motions from this futuregiant earthquake may affect the whole region within twoor three fault lengths, including countries where seismic-resistant design is not currently required by law. Understand-ing the limitations of the current design practices is thereforenecessary to assess the potential hazard and to mitigate therisk to the regional communities. This article highlights prob-lems in current design codes with respect to long-durationground motions produced by giant earthquakes.
Validation of the Simulation Method Used
The regional seismic hazard is to be estimated based onsynthetic seismograms. Because the present study intends toassess the ground-motion intensities from giant earthquakes(Mw ≥8:0), it is important that the simulation method used iscapable of reproducing the actual recorded data from earth-quakes of similar magnitude. The ground motions recordedin Singapore from the two giant earthquakes in December2004 and March 2005 are used to validate the simulationmethod used.
Ground-Motion Simulation Method
The ground-motion simulation method used in the pres-ent study follows a kinematic method, in which the sourcerupture is represented using a finite-fault model. The faultplane is subdivided into several subfaults, and each subfaultis treated as a point source. The rupture starts at the hypo-center and propagates radially outward at a certain rupturevelocity, triggering each subfault as the rupture front passesits center. The ground motions at an observation point pro-duced by the ruptures of individual subfaults are summedwith time lags to account for rupture propagation on thefault plane.
The crustal structure representing the whole region ofSumatra and the Malay Peninsula is extracted from the globalcrustal model CRUST 2.0 (see the Data and Resources sec-tion), which is a 2° × 2° global model for the Earth’s crustbased on seismic refraction data published in the period of1948–1995. The one-dimensional structure is summarized inTable 1, where the properties of the structure are obtained bytaking the averages of the properties of all 2° × 2° grids cov-ering the region.
Table 1Regional Crustal Structure of Sumatra and the Malay Peninsula
Layer H (km) VP (km=sec) VS (km=sec). ρ (t=m3) QP QS
Upper crust 9.6 6.0 3.4 2.7 350 175Middle crust 9.5 6.6 3.7 2.9 500 250Lower crust 9.1 7.2 4.0 3.1 650 325Mantle ∞ 8.2 4.7 3.4 800 400
H is the layer thickness; VP is the P-wave velocity; VS is the S-wave velocity; ρis the mass density;QP is the quality factor of the P wave;QS is the quality factorof the S wave.
568 K. Megawati and T.-C. Pan
The Green’s function is based on synthetics derivedfrom an elastic wave-propagation model (Koketsu, 1985),which provides proper phasing of body and surface waves.The source time function of the slip on each subfault is ap-proximated by a ramp function with a source duration oftr � Ls=vr � td, where Ls is the length of the subfault,vr is the rupture velocity, and td is the rise time of the localdislocation. The rise time td is equal toDs=vd, in whichDs isthe slip amplitude and vd is the slip velocity. The sourceduration tr is to reflect the effects of rupture propagationwithin the subfault and the dislocation rise time.
Giant Sumatran Earthquakes Recorded in Singapore
The Meteorological Services Division of the NationalEnvironment Agency established a network of digital seis-mic stations in Singapore in September 1996. The networkcomprises one broadband Global Seismographic Network(GSN) station, four teleseismic stations, and two boreholearrays. The GSN station, situated on a rock-outcropped site,at the center of Singapore island, is equipped with a com-prehensive set of sensors to record ground tremors con-tinuously, whereas the other stations operate based on atriggering system.
From the establishment of the seismic array to June2006, 46 earthquakes with Mw ≥6:0 occurred along the Su-matran subduction zone, and the ground motions were re-corded by the GSN station in Singapore. Among these, onlytwo events had Mw >8:0, namely the 26 December 2004Aceh-Andaman earthquake (Mw 9.15) and the 28 March2005 Nias-Simeulue event (Mw 8.6). These two giant earth-quakes ruptured a combined 1900 km long portion of thefault boundary between the Indian–Australian plate andEurasian plate (Ammon et al., 2005; Briggs et al., 2006;Chlieh et al., 2007; Konca et al., 2007).
Trial Simulations of Giant Sumatran Earthquakes
Various source-rupture models of the two giant earth-quakes have been proposed by Ammon et al. (2005), Layet al. (2005), Walker et al. (2005), Briggs et al. (2006),Chlieh et al. (2007), and Konca et al. (2007). The slip modelsderived by Chlieh et al. (2007) and Konca et al. (2007) forthe December 2004 and the March 2005 earthquakes, respec-tively, are used here because the models are constrained bynear-field and far-field GPS data, vertical motion of coralreefs, as well as, teleseimic data. Simplified versions of thesesource models, given in figure 9 of Chlieh et al. (2007) andfigure 5d of Konca et al. (2007), are implemented in the ki-nematic ground-motion simulation model to validate its cap-ability to simulate large-magnitude, subduction earthquakes.
The December 2004 event ruptured a 1500 km segmentof the curved plate boundary from northern Sumatra (2° N) tothe Andaman islands (14° N), releasing a total moment of6:7–7:0 × 1022 N m (Mw 9.15). The largest slips occurredat the latitudes of 4° N, 7° N, and 9° N (Chlieh et al., 2007).The slip model of Chlieh et al. (2007) has three rupture
planes, but only the two southern ones (shown in Fig. 1)are considered in the present simulation, as the northern seg-ment beneath the Andaman islands has smaller slip of lessthan 5 m and is located relatively farther away from Singa-pore. The southern plane of the simplified rupture model,measuring 420 × 160 km, has a strike of N328°E and a dipangle of 12°, whereas the northern one, measuring 460×160 km, has a strike of N340°E and a dip angle of 15°.The high release of energy at 4° N is denoted by the 140 ×80 km asperity (darker shaded area in Fig. 1), whereas thepeaks at 7° N and 9° N form an extended asperity, measuring360 × 60 km, on the northern fault plane. The slip on theasperities is equal to 12.5 m, whereas the slip on the sur-rounding areas is 5 m. The rake angle is taken to be constant,at 110°. The two rupture planes are divided into smaller sub-faults of 20 × 20 km. The seismic energy released by theruptures of these two planes is equal to 4:79 × 1022 N m(Mw 9.06). The rupture starts at the hypocenter, indicatedby the star on the southern rupture plane, and propagatesnorthwestward at a velocity of 2:5 km=sec. The slip velocityis taken to be 0:4 m=sec.
The slip models of the March 2005 earthquake(Mw 8.6), inverted by Briggs et al. (2006) and Konca et al.(2007), involve an area of about 400 km along the strike and180 km downdip, with two asperities at a depth of about20 km beneath the Nias and Simeulue islands (Fig. 1). Slipon the asperities reaches about 9 m, whereas slip near thetrench is only about 3 m. The fault plane has a dip of 10°,and the rake angle is taken to be 90°. The rupture starts atthe hypocenter, shown by the star on the rupture plane andpropagates bilaterally at a speed of 2:4 km=sec. The slip ve-locity is taken to be 0:4 m=sec
The upper panels of Figures 2 and 3 show the grounddisplacements from the two earthquakes recorded at theGSN station in Singapore, in the north–south (NS), east–west(EW), and up–down (UD) directions. The simulated groundmotions are aligned in the second row of each figure. Bothamplitude and duration of the simulated ground motionsagree reasonably well with the respective recorded values.The slight mismatch in waveforms is to be expected becausethe actual rupture processes of the earthquakes are very com-plex (Briggs et al., 2006; Chlieh et al., 2007; Konca et al.2007), whereas the rupture models used in the simulationsare the simplified versions with two asperities.
Running trial simulations ensures that the methodologyand the one-dimensional regional crustal structure extractedfrom CRUST 2.0 (see the Data and Resources section) repro-duce, within reasonable estimates, the ground motions fromlarge-magnitude subduction earthquakes. The mismatch inwaveforms is acceptable in the view that large ruptures willarise from complex processes, and a slightly generic modelhas greater applicability for potential earthquakes. The gen-eral correlation between the simulated and the recordedwaveforms provides enough confidence that the simulationtechnique can be used for hazard assessment.
Regional Seismic Hazard Posed by the Mentawai Segment of the Sumatran Megathrust 569

Seismic Hazard from the Mentawai Segment
Future Rupture Scenarios
The Batu segment of the megathrust, from the equator toabout 0.7° S (Fig. 1), last ruptured in 1935, producing anMw 7.7 earthquake with slip of about 2.3 m over a 70×35 km patch (Rivera et al., 2002). A recent paleogeodeticstudy (Natawidjaja et al., 2004) shows that the megathrustis slipping aseismically both above and below this narrowpatch and that the 1935 patch has been slipping duringthe past century at about half the rate at which the plate ismoving. The accumulated strain, and hence stress, on theBatu segment are probably low, and thus it is likely to be anorthern barrier to the future rupture of the Mentawai seg-ment (Natawidjaja et al., 2006).
Geodetic measurements and paleogeodetic records of in-terseismic deformation along the Mentawai segment suggestthat the depth of the downdip end of the locked zone variesfrom about 40 to 55 km, and it has been locked for, at least,
the past 50 yr (Prawirodirdjo et al., 1997; Bock et al., 2003;Simoes et al., 2004). The dip angle of the subducting inter-face is about 5°–8° near the trench and increases gradually to15°–20° beneath the Mentawai islands and to 30° below thecoastline of Sumatra (Chlieh et al., 2008). In the presentstudy, three segments with increasing dip angles from 8° atthe trench to 18° beneath the Mentawai islands and 26° be-yond are adopted. The cross section of the subducting inter-face passing through Siberut island is shown in Figure 4 asthe dotted curve, in which the curved megathrust interface isinferred by Chlieh et al. (2008) using the locations of hypo-centers from the relocated International Seismological Cen-tre (ISC) catalog from 1964 to 1998 (Engdahl et al., 1998).The three-downdip-segment model has a total width of200 km, with its lowermost extent at 50 km.
Figure 1 shows a consistent strike of N320°E along thesubducting interface beneath the Mentawai islands.
Three future scenarios have been formulated, by varyingthe length of the segment rupturing and the amplitude of the
Figure 2. Ground displacements recorded at the GSN station in Singapore from the 26 December 2004 Aceh-Andaman earthquake(Mw 9.15), together with the simulated waveforms.
Figure 3. Ground displacements recorded at the GSN station in Singapore from the 28 March 2005 Nias-Simeulue earthquake (Mw 8.6),together with the simulated waveforms.
570 K. Megawati and T.-C. Pan

slip. Scenario A, shown in Figures 1 and 5, assumes thatthe 280 km long segment between 1° S and 3° S ruptures.This is a likely scenario, as the northern portion of the Men-tawai segment has been locked since 1797, and the interseis-mic submergence has equaled the coseismic emergence inthe 1797 and 1833 events. The convergence rate between theIndian–Australian plate and the Eurasian plate at this latitude
is about 57 mm=yr at an angle of N15°E. The trench-normal component of this convergence vector is equal to57 mm=yr × cos�35°� � 46:7 mm=yr. Thus, the potentialslip that has been accumulated since 1797 is equal to46:7 mm=yr for 210 yr or 9.8 m.
Using geodetic and paleogeodetic measurements,Chlieh et al. (2008) show the interseismic coupling on thesubducting interface from the equator to 6° S. Two low cou-pling areas beneath Batu island, at 0.7° S, and at the southernend of Sipora island, at 3° S, are used to demarcate the280 km long segment in scenario A. A single asperity is in-dicated by a patch with nearly 100% coupling beneathSiberut island (shaded in Fig. 5a). This has estimated slipof 10 m. The surrounding area, with lower coupling ratiosranging from 20% to 60%, has a slip value of 5 m. The slipalong the fault is assumed to arise purely from thrust faulting.This rupture scenario would produce an earthquake withMw 8.6. Two cases are considered: the rupture starts fromthe northern edge of the fault in case 1 and from the southernend in case 2.
The second scenario, scenario B, has a 600 km long rup-ture area, combining the rupture areas of the 1797 and 1833events. Microatoll observations imply that slip in 1797 didnot relieve all strain that had built up in the previous inter-seismic period, and slip in 1833 relieved more strain than
0 100 200 300 400
0
-50
-100
Siberut Sumatra
Distance from the trench (km)
Dep
th (k
m) 80
180
260100 km60 km 40 km
Sumatran Fault
Figure 4. Cross section of the subducting interface passingthrough Siberut island. The dip angle of the subducting interfaceis about 5°–8° near the trench and increases gradually to 15°–20°beneath the Siberut islands and to 30° below the coastline of Suma-tra. In the present study, three segments with increasing dip anglesfrom 8° at the trench to 18° beneath the Siberut island and 26° be-yond are adopted. The curved megathrust interface is inferred byChlieh et al. (2008) using the locations of hypocenters from therelocated ISC catalog from 1964 to 1998 (Engdahl et al., 1998).
0o
1o S
2o S
3o S
97o E 98o E 99o E 100o E 101o E
160 km
280 km
Case 1
Case 2
Scenario A
200 km
600 km
Case 1
Case 3
Case 2
97o E 98o E 99o E 100o E 101o E 102o E0o
1o S
2o S
3o S
4o S
5o S
Scenarios B and C(a) (b)
Figure 5. (a) Rupture model of scenario A having one asperity. The slip within the asperity is 10 m and that at the surrounding area is 5 m,producing an earthquake withMw 8.6. The slip over the fault is pure thrusting. The rupture starts from the northern edge of the fault in case 1and from the southern edge in case 2. (b) The rupture model of scenarios B and C. The 600 km long rupture plane covers the rupture areas ofthe 1797 and 1833 historical events combined. The model has two asperities with slip amplitudes of 10 m (scenario B) and 20 m (scenario C).The slip amplitudes in the surrounding area are 5 m (scenario B) and 10 m (scenario C). The rupture may start from the northern edge (case 1),the southern edge (case 2), or near the center (case 3). Scenario B produces an earthquake with Mw 9.0, whereas scenario C produces anMw 9.2 event.
Regional Seismic Hazard Posed by the Mentawai Segment of the Sumatran Megathrust 571

was accumulated in the years since 1797 (Natawidjaja et al.,2006). Therefore, it is plausible that the segment along theMentawai islands fails together in the future. Geodetic andpaleogeodetic measurements (Chlieh et al., 2008) indicatestrong coupling at a large patch south of Sipora island(shaded area in the south, Fig. 5b). Thus, scenario B is hy-pothesized to have two asperities with potential slip magni-tudes of 10 m. Slip in the surrounding area is assumed to be5 m. This rupture scenario would produce an earthquake withMw 9.0. The rupture may start from the northern edge (case1), the southern edge (case 2), or near the center (case 3).
The last scenario, scenario C, has a rupture area identicalto that of scenario B, but with 20 m of slip at the asperitiesand 10 m of slip in the surrounding fault area. This is quite anunlikely scenario as the potential slip accumulated over thepast 210 yr is on the order of 10 m. However, slip in thesouthern segment of the 1833 event (3.5° S–5° S) may havereached 18 m (Natawidjaja et al., 2006), indicating that thesegment relieved strain more than that accumulated in the
preceding interseismic period. Therefore, it is still plausibleto have slip of 20 m on the asperities. Scenario C, whichwould produce an earthquake with Mw 9.2, is put forwardas the worst-case scenario that might happen in this region.
The rupture areas of 280 × 160 km in scenario A and600 × 200 km in scenarios B and C are subdivided intosmaller subfaults of 20 × 20 km. The rupture front propa-gates radially from the hypocenter marked by the stars inFigure 5a,b with a constant velocity, vr, of 2:5 km=sec. Theslip velocity, vd, is fixed at 0:4 m=sec. These values for rup-ture velocity and slip velocity are constrained by rupture ki-nematics studies of the 2004 Aceh-Andaman earthquake(Ammon et al., 2005) and the 2005 Nias-Simeulue earth-quake (Konca et al., 2007).
Simulation Results
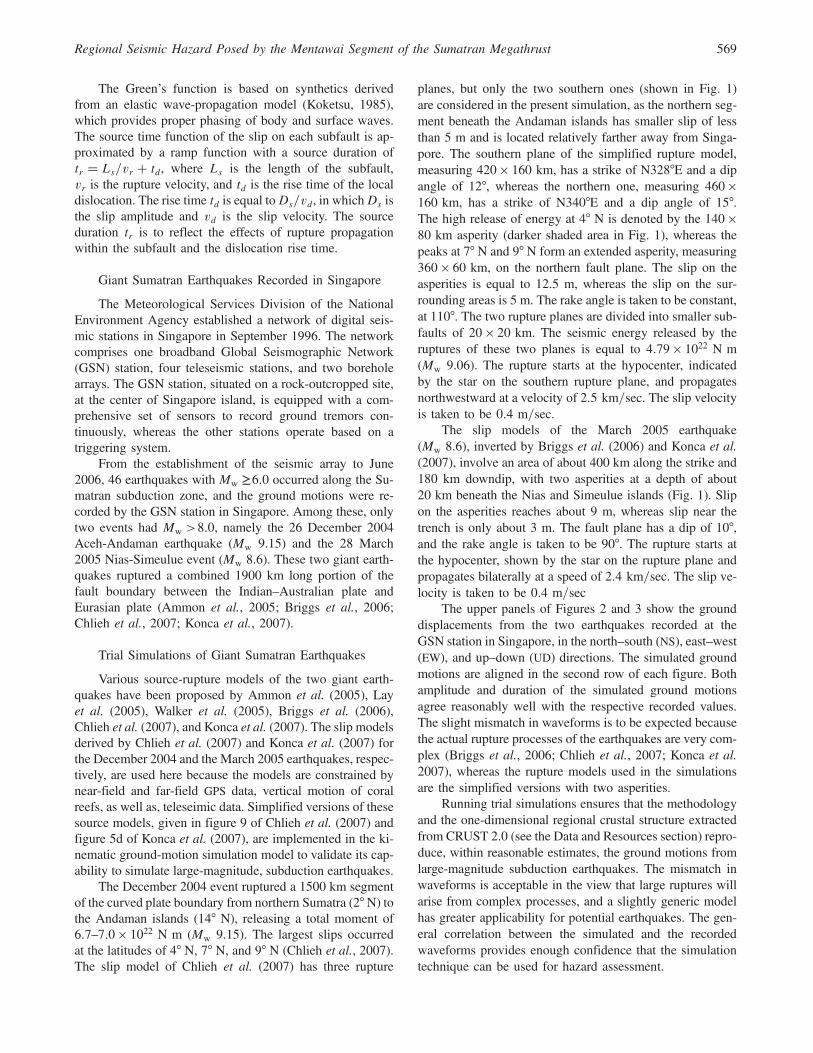
Figures 6–8 show the ground-motion accelerations sim-ulated at nine major cities in the region, namely Padang,Bengkulu, Pekanbaru, Palembang, Medan, Jakarta, Singa-
Figure 6. Horizontal ground-motion accelerations simulated at Padang (PDG), Bengkulu (BKL), Pekanbaru (PKB), Palembang (PLB),Medan (MDN), Jakarta (JKT), Singapore (SGP), Kuala Lumpur (KL), and Penang (PEN), for scenarios A, B, and C, in which the hypo-centers are located at the northern edge of the rupture plane (case 1). The horizontal ground motions at each station have been aligned in thestrike-parallel and strike-normal directions. The time axes for all traces are in the same scale given at the lower side of the figure, where thetime 0 sec refers to the time of the initiation of the rupture. The acceleration axis for each station is given on the left-hand side of the figure.The value shown at the beginning of each trace indicates the PGA.
572 K. Megawati and T.-C. Pan

pore, Kuala Lumpur, and Penang. The first six cities arewithin the territory of Indonesia, whereas Kuala Lumpurand Penang belong to Malaysia. These cities (Fig. 1) liewithin two fault lengths from the Mentawai segment and thusmay be affected by its rupture. Figure 6 presents the groundaccelerations for scenarios A, B, and C, where the respectivehypocenters are located at the northern edge of the ruptureplanes (case 1). Figures 7 and 8 show the ground accelera-tions for cases 2 and 3, respectively. The upper cutoff fre-quency of the simulation is 1.2 Hz. The horizontal groundmotions at each station have been aligned in the strike-parallel and strike-normal directions. The value shown at thebeginning of each trace indicates the peak ground accelera-tion (PGA) of the waveform. In general, the ground motionsin the strike-normal direction are larger than the correspond-ing strike-parallel components.
Comparing the ground motions resulting from case 1(Fig. 6) and case 2 (Fig. 7) for each scenario, it appears thatthe amplitude of the ground motion at a station increases,albeit not significantly, if the rupture propagates toward the
station. This is not the typical forward rupture directivity ef-fect observed in a strike-slip earthquake. Forward rupture di-rectivity effects occur when the rupture front propagatestoward the station and the direction of slip on the fault pointsto the station (Somerville et al., 1997; Megawati and Chand-ler, 2006). In both cases 1 and 2, the rupture front propagatesperpendicular to the slip vector. This pattern of rupture wouldgenerate forward directivity pulses confined along the Men-tawai islands if the hypocenter was located downdip and therupture front propagated updip, as was observed in the 1999Chi-Chi, Taiwan, earthquake (Aagaard et al., 2004).
Figures 6–8 show that the ground-motion amplitudesfrom scenario C (Mw 9.2) are marginally larger than the cor-responding amplitudes from scenario B (Mw 9.0).
Discussions
Potential Seismic Risk in Sumatra and West Java
According to the current Indonesian Seismic Code(SNI-1726-2002), the territory of Indonesia is divided into
Figure 7. Horizontal ground-motion accelerations simulated at Padang (PDG), Bengkulu (BKL), Pekanbaru (PKB), Palembang (PLB),Medan (MDN), Jakarta (JKT), Singapore (SGP), Kuala Lumpur (KL), and Penang (PEN), for scenarios A, B, and C, in which the hypo-centers are located at the southern edge of the rupture plane (case 2). The horizontal ground motions at each station have been aligned in thestrike-parallel and strike-normal directions. The time axes for all traces are in the same scale given at the lower side of the figure, where thetime 0 sec refers to the time of the initiation of the rupture. The acceleration axis for each station is given on the left-hand side of the figure.The value shown at the beginning of each trace indicates the PGA.
Regional Seismic Hazard Posed by the Mentawai Segment of the Sumatran Megathrust 573
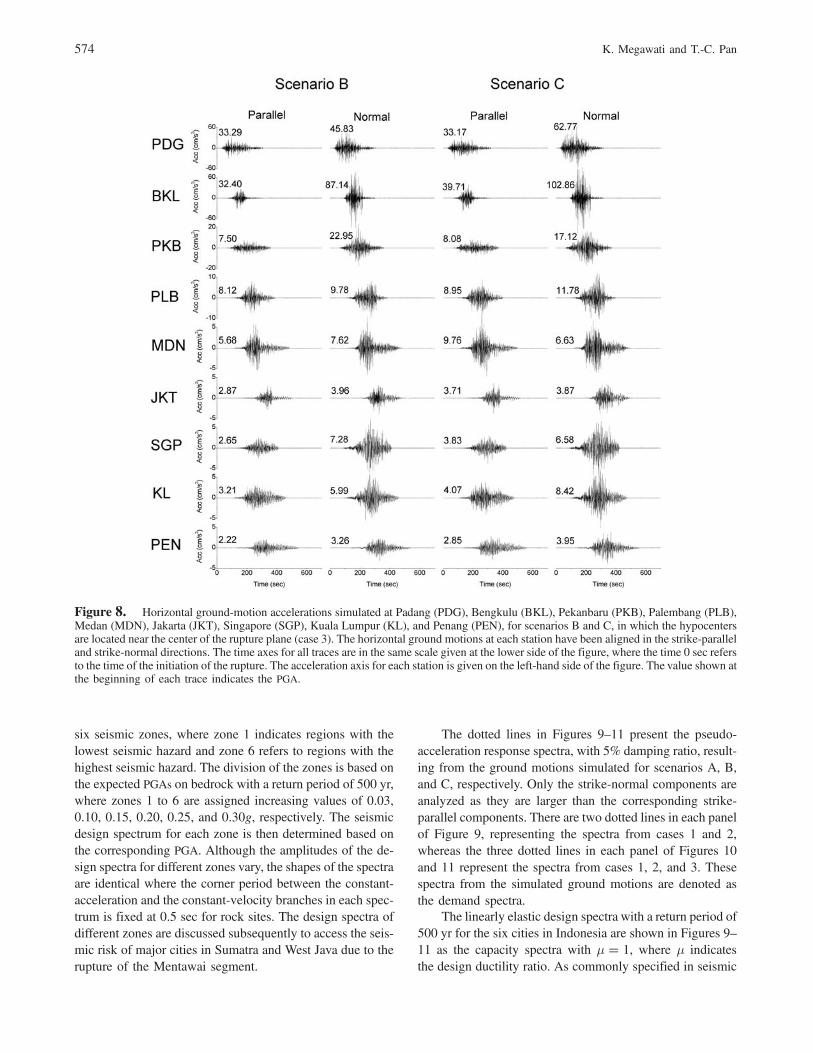
six seismic zones, where zone 1 indicates regions with thelowest seismic hazard and zone 6 refers to regions with thehighest seismic hazard. The division of the zones is based onthe expected PGAs on bedrock with a return period of 500 yr,where zones 1 to 6 are assigned increasing values of 0.03,0.10, 0.15, 0.20, 0.25, and 0.30g, respectively. The seismicdesign spectrum for each zone is then determined based onthe corresponding PGA. Although the amplitudes of the de-sign spectra for different zones vary, the shapes of the spectraare identical where the corner period between the constant-acceleration and the constant-velocity branches in each spec-trum is fixed at 0.5 sec for rock sites. The design spectra ofdifferent zones are discussed subsequently to access the seis-mic risk of major cities in Sumatra and West Java due to therupture of the Mentawai segment.
The dotted lines in Figures 9–11 present the pseudo-acceleration response spectra, with 5% damping ratio, result-ing from the ground motions simulated for scenarios A, B,and C, respectively. Only the strike-normal components areanalyzed as they are larger than the corresponding strike-parallel components. There are two dotted lines in each panelof Figure 9, representing the spectra from cases 1 and 2,whereas the three dotted lines in each panel of Figures 10and 11 represent the spectra from cases 1, 2, and 3. Thesespectra from the simulated ground motions are denoted asthe demand spectra.
The linearly elastic design spectra with a return period of500 yr for the six cities in Indonesia are shown in Figures 9–11 as the capacity spectra with μ � 1, where μ indicatesthe design ductility ratio. As commonly specified in seismic
Figure 8. Horizontal ground-motion accelerations simulated at Padang (PDG), Bengkulu (BKL), Pekanbaru (PKB), Palembang (PLB),Medan (MDN), Jakarta (JKT), Singapore (SGP), Kuala Lumpur (KL), and Penang (PEN), for scenarios B and C, in which the hypocentersare located near the center of the rupture plane (case 3). The horizontal ground motions at each station have been aligned in the strike-paralleland strike-normal directions. The time axes for all traces are in the same scale given at the lower side of the figure, where the time 0 sec refersto the time of the initiation of the rupture. The acceleration axis for each station is given on the left-hand side of the figure. The value shown atthe beginning of each trace indicates the PGA.
574 K. Megawati and T.-C. Pan

codes, it is not economical to design ordinary structures toremain linearly elastic during an earthquake with a long re-turn period of 500 yr. Structures may be allowed to yield inthis rare event, so that the required strength of the structurescan be reduced to a more economical level. Depending on thetypes of structural systems used, the allowable ductility ratiomay range from 4 to 8. The reduction of the required strength
should, however, be compensated by providing ductile de-tailing at the potential plastic hinges within the structure,so that the structure can behave in a ductile manner. In otherwords, the strength, stiffness, and integrity of the structureshould be maintained after yielding throughout the wholeduration of ground shaking. The corresponding design spec-tra with ductility ratios of 4 and 8 are shown in Figures 9–11.
Figure 9. Pseudoacceleration response spectra (5% damping ratio) resulting from the strike-normal components simulated at Padang(PDG), Bengkulu (BKL), Pekanbaru (PKB), Palembang (PLB), Medan (MDN), Jakarta (JKT), Singapore (SGP), Kuala Lumpur (KL), andPenang (PEN) for scenario A (cases 1 and 2). The respective design spectra with ductility ratios, μ, of 1 (linear), 4, and 8 are shown using thesolid lines.
Regional Seismic Hazard Posed by the Mentawai Segment of the Sumatran Megathrust 575
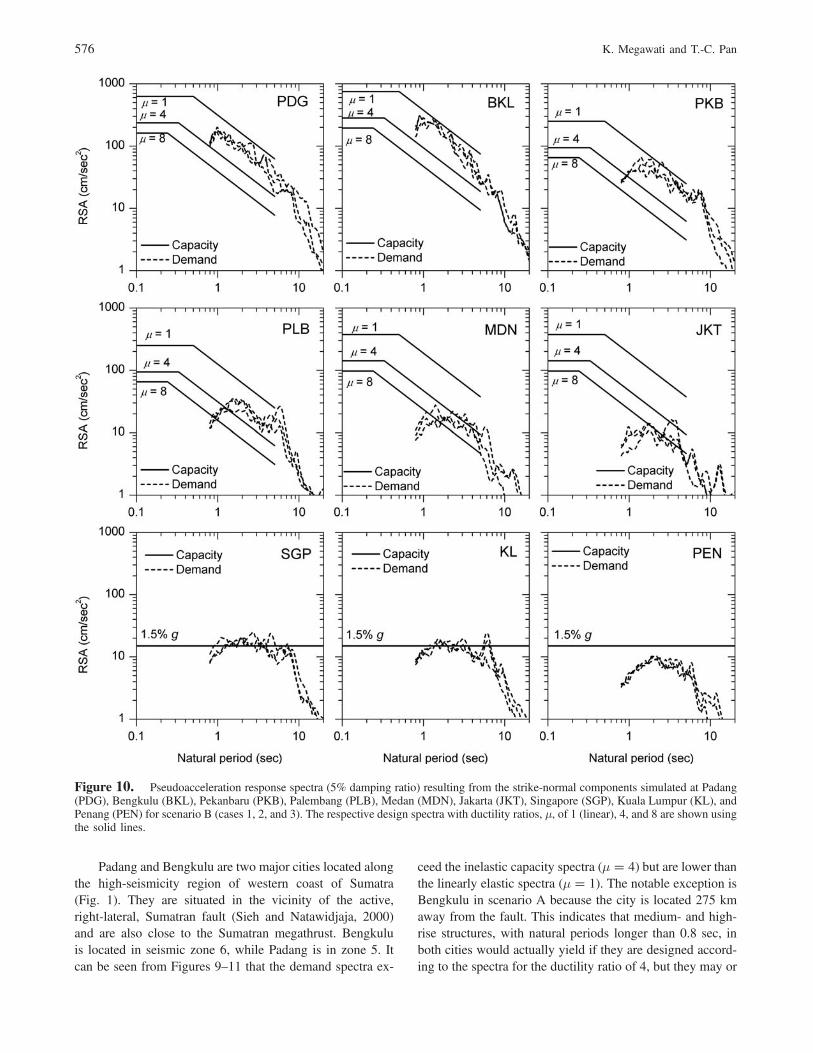
Padang and Bengkulu are two major cities located alongthe high-seismicity region of western coast of Sumatra(Fig. 1). They are situated in the vicinity of the active,right-lateral, Sumatran fault (Sieh and Natawidjaja, 2000)and are also close to the Sumatran megathrust. Bengkuluis located in seismic zone 6, while Padang is in zone 5. Itcan be seen from Figures 9–11 that the demand spectra ex-
ceed the inelastic capacity spectra (μ � 4) but are lower thanthe linearly elastic spectra (μ � 1). The notable exception isBengkulu in scenario A because the city is located 275 kmaway from the fault. This indicates that medium- and high-rise structures, with natural periods longer than 0.8 sec, inboth cities would actually yield if they are designed accord-ing to the spectra for the ductility ratio of 4, but they may or
Figure 10. Pseudoacceleration response spectra (5% damping ratio) resulting from the strike-normal components simulated at Padang(PDG), Bengkulu (BKL), Pekanbaru (PKB), Palembang (PLB), Medan (MDN), Jakarta (JKT), Singapore (SGP), Kuala Lumpur (KL), andPenang (PEN) for scenario B (cases 1, 2, and 3). The respective design spectra with ductility ratios, μ, of 1 (linear), 4, and 8 are shown usingthe solid lines.
576 K. Megawati and T.-C. Pan

may not collapse depending on the ductile behaviors of thestructures.
In structural engineering, yielding is usually unavoid-able to achieve economical designs to withstand future, rare,earthquakes but collapse of structures should be prevented.There are two measures to prevent collapse: first, the demandductility ratio should be smaller than the capacity to prevent
excessive lateral deformation, and, second, the structuresshould be able to maintain their overall strength, stiffness,and integrity after yielding, throughout the entire duration ofshaking, by providing ductile detailing at the potential plastichinges. The first requirement can be checked using the stan-dard iterative procedures, such as ATC-40 (Applied Technol-ogy Council [ATC], 1996). The second requirement is more
Figure 11. Pseudoacceleration response spectra (5% damping ratio) resulting from the strike-normal components simulated at Padang(PDG), Bengkulu (BKL), Pekanbaru (PKB), Palembang (PLB), Medan (MDN), Jakarta (JKT), Singapore (SGP), Kuala Lumpur (KL), andPenang (PEN) for scenario C (cases 1, 2, and 3). The respective design spectra with ductility ratios, μ, of 1 (linear), 4, and 8 are shown usingthe solid lines.
Regional Seismic Hazard Posed by the Mentawai Segment of the Sumatran Megathrust 577

critical in this case because the ductile detailing as specifiedin the current seismic codes was formulated based on labora-tory tests and mathematical modeling of structural compo-nents subjected to short-duration ground motions, usuallyrecorded during major and strong earthquakes (Mw 6:5–7:5).The typical durations of these ground motions are less than20 sec, and very few have durations up to 40 sec. Not manyexperiments, if any, have been carried out to investigatethe postyielding performance of structural components sub-jected to long-duration ground motions from giant earth-quakes with Mw ≈9. The ground-motion durations fromthis level of magnitude may last for about 3–5 min (Figs. 6–8). Therefore, if medium- and long-period structures inBengkulu and Padang could maintain the ductility capacityfor about 3–5 min, corresponding to 200–300 cycles ofvibration, they are likely to survive. If the ductile behaviorcannot be maintained beyond a few cycles of vibration anddisintegration at plastic hinges occurs, the structures maycollapse.
The seismic performance of short-period structures withnatural periods lower than 0.8 sec is not discussed herewithbecause this type of structure is more sensitive to the ruptureof the nearby Sumatran fault segments, which would producelarger high-frequency ground motions than would the farthersubduction earthquakes.
Jakarta and Medan (Fig. 1) are both located in zone 3,which is considered a moderate-seismicity zone. The capac-ity and demand spectra are compared in Figures 9–11. Itshows that the demand spectra barely exceed the capacityspectra (μ � 4). The amplitudes of ground motions gener-ated by the Mentawai earthquakes may be too weak to causeyielding to medium- and high-rise buildings in these cities.Therefore, the seismic risk posed by the Mentawai segmentto these two cities is relatively low, simply because they arelocated far from the rupture zone and the seismic design re-quirement is relatively high. Note that the main seismic threatto Medan comes from the nearby Sumatran fault and the sub-duction zone beneath Nias island, whereas Jakarta is morelikely to be affected by earthquakes in the subduction zonesouth of Java and the nearby faults in western Java.
Palembang and Pekanbaru are located in the low-seismicity region of eastern Sumatra (seismic zone 2) andthus have lower seismic design spectra than Jakarta or Me-dan. Because these two cities are located relatively closer tothe rupture zone than Jakarta or Medan, the potential seismicrisk to buildings in Palembang and Pekanbaru are higher(Figs. 9–11). It becomes obvious that the potential risk tomedium- and high-rise structures with natural periods T �0:8–3:0 sec in these low-seismicity cities is as high as thosein the high-seismicity cities of Bengkulu and Padang.
Potential Seismic Risk in Singaporeand the Malay Peninsula
Singapore is located 650 km away from the center of theMentawai rupture zone; thus, the resulting ground motions
are quite weak. Current building design code for structures inSingapore has been developed largely based on the BS 8110(British Standards Institution [BSI], 1997), which does nothave any provision for seismic loading. It does, however, re-quire that all buildings be capable of resisting a notional,ultimate lateral design load applied at each floor level simul-taneously for structural robustness. These static lateral loadsare equal to 1.5% of the characteristic dead weight of thestructure. The design wind load should not be taken as lessthan this value. Given the moderate design wind speed of30 m=sec in Singapore, the notional horizontal load is gen-erally greater than the wind loading for most medium-risebuildings. Thus, the notional lateral load is usually the gov-erning lateral load for design. The minimum capacity ofthe building can therefore be taken as constant at 1.5%g(15 cm=sec2) across the entire natural-period range, asshown in Figures 9–11.
For medium- and high-rise structures, with T �0:8–5:0 sec, on typical rock sites in Singapore, the demandspectra are slightly larger than the minimum capacity of1.5%g. However, it does not mean that buildings designedaccording to current regulations would collapse if hit bythe ground motions from the scenario earthquakes. Becauseof the overstrength of the construction materials, a structuredesigned against lateral loads equal to 1.5% of the weightof the structure would commonly have a yielding strengthlarger than the design value. Yet it must be noted that thereliance on the material overstrength as a defense line againstseismic excitation is debatable.
The lack of seismic-resistant requirements permitsbuildings to be designed and constructed with obvious irreg-ularities in horizontal and vertical configurations. Many resi-dential blocks have a long rectangular floor plan, where theelevator shafts and structural walls are placed unevenly atone end of the buildings. This may induce significant tor-sional effects when subjected to seismic ground motions.Many buildings are allowed to have large openings in thefirst story, which may result in a soft first story. These typesof design and construction practices increases the seismicrisk to the building stock in Singapore.
For high-rise structures of more than 30 stories(T ≥ 3:0 sec), wind design requirements typically supersedethe notional lateral load. Thus, the seismic risk to this type ofstructure is considered lower.
Kuala Lumpur, the capital city of Malaysia, is located ata similar distance from the Mentawai segment as Singaporeis. Therefore, the demand spectra in both cities are compar-able. The building code used in Malaysia is almost identicalto that used in Singapore, and the issues of seismic risk tobuildings in Singapore, discussed previously, is also relevantfor Kuala Lumpur.
Penang, another major city on the Malay Peninsula, islocated farther to the north, and thus, the demand spectra arerelatively lower than those in Singapore and Kuala Lumpur.The corresponding risk to the medium- and high-rise build-ings in this city is almost negligible.
578 K. Megawati and T.-C. Pan
Effects of Soft-Soil Amplification in Singapore
It should be noted that the demand spectra in Singaporeshown in Figures 9–11 are for rock sites. The central andsoutheastern parts of Singapore island are largely overlainby Quaternary marine clay deposits, and a significant portionof the southern coastal area is reclaimed land (Pitts, 1984).This soft-soil deposits can significantly amplify the weakbedrock motion, as confirmed by recent Sumatran earth-quakes where tremors were largely felt by residents of high-rise buildings in these areas and not in other areas with betterground conditions (Pan et al., 2001). Because seismic-resistant design is not required in Singapore, buildings onsoft-soil and rock sites are designed against the same lateralloads, resulting in buildings with the same seismic capacity.The seismic risk to structures on soft-soil sites is, therefore,higher than that on firm-soil or rock sites, simply because theseismic hazard level is higher at the soft-soil sites.
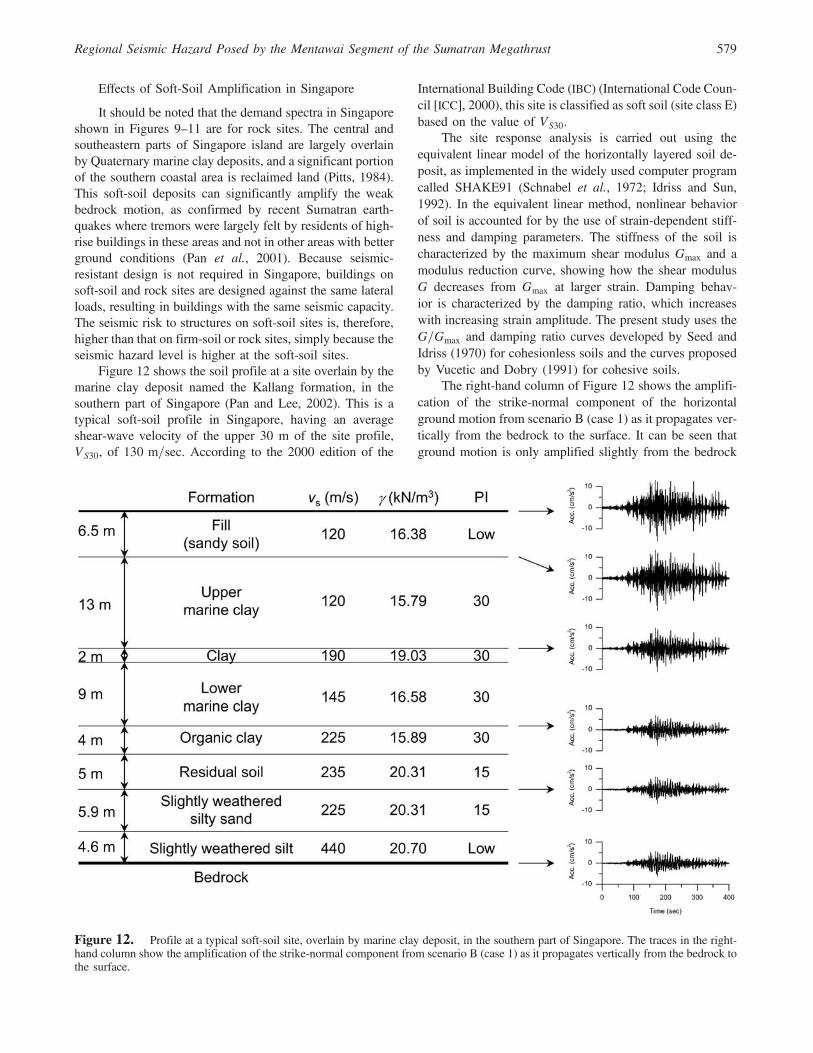
Figure 12 shows the soil profile at a site overlain by themarine clay deposit named the Kallang formation, in thesouthern part of Singapore (Pan and Lee, 2002). This is atypical soft-soil profile in Singapore, having an averageshear-wave velocity of the upper 30 m of the site profile,VS30, of 130 m=sec. According to the 2000 edition of the
International Building Code (IBC) (International Code Coun-cil [ICC], 2000), this site is classified as soft soil (site class E)based on the value of VS30.
The site response analysis is carried out using theequivalent linear model of the horizontally layered soil de-posit, as implemented in the widely used computer programcalled SHAKE91 (Schnabel et al., 1972; Idriss and Sun,1992). In the equivalent linear method, nonlinear behaviorof soil is accounted for by the use of strain-dependent stiff-ness and damping parameters. The stiffness of the soil ischaracterized by the maximum shear modulus Gmax and amodulus reduction curve, showing how the shear modulusG decreases from Gmax at larger strain. Damping behav-ior is characterized by the damping ratio, which increaseswith increasing strain amplitude. The present study uses theG=Gmax and damping ratio curves developed by Seed andIdriss (1970) for cohesionless soils and the curves proposedby Vucetic and Dobry (1991) for cohesive soils.
The right-hand column of Figure 12 shows the amplifi-cation of the strike-normal component of the horizontalground motion from scenario B (case 1) as it propagates ver-tically from the bedrock to the surface. It can be seen thatground motion is only amplified slightly from the bedrock
Figure 12. Profile at a typical soft-soil site, overlain by marine clay deposit, in the southern part of Singapore. The traces in the right-hand column show the amplification of the strike-normal component from scenario B (case 1) as it propagates vertically from the bedrock tothe surface.
Regional Seismic Hazard Posed by the Mentawai Segment of the Sumatran Megathrust 579

to the depth of 30.5 m, and the amplification becomes sig-nificant within the upper 30.5 m of the soil profile.
The response spectra (5% damping ratio) of the groundmotions at the three different levels, namely, the bedrock, thedepth of 30.5 m, and the surface, are compared in Figure 13a.It is obvious that the upper 30.5 m of the soil profile ampli-fies the ground motion significantly within the natural periodof 0.8–3 sec, whereas the spectral values beyond the naturalperiod of 3 sec are not amplified. The amplification factors,shown in Figure 13b, indicate that the spectral value at T �1:2 sec on the soft-soil site is 4.8 times larger than the cor-responding value on the hard-rock site. As a comparison, thespectral amplification factor between site E (soft soil) andsite A (hard rock) specified in the IBC 2000 (ICC, 2000)is equal to 4.4 for T ≥ 1 sec. These site effects bring themaximum value of the spectral acceleration response to80 cm=sec2 (� 8%g) at T � 1:2 sec. The natural-periodrange of 1.2–1.8 sec corresponds with the natural periodsof common medium- and high-rise residential and commer-cial buildings in Singapore.
The aforementioned findings indicate that medium- andhigh-rise structures founded on soft-soil sites in the centraland southeastern districts of the city have the highest seismicrisk with regard to potential rupture of the Mentawai seg-ment. Because seismic design has not been required and pro-viding ductile detailing is not mandatory in current buildingcode, buildings in Singapore have very limited inherent duc-tility capacity. Further investigations on the postyieldingbehaviors of nonseismically designed structures are essen-tial for assessing the seismic performance of this type ofbuildings.
Shape of Design Spectrum
Standard seismic design codes, such as the IBC 2000(ICC, 2000) and the Indonesian Seismic Code (SNI-1726-2002), specify the design base shear for buildings as
Vb � IC
RW;
where W is the total dead weight of the structure, R is thestrength reduction factor to account for ductility capacityand inelastic performance of structures, and I is the impor-tance factor, which is taken to be 1.0 for ordinary structures.The period-dependent seismic coefficient C depends on thelocation of the structure, which is characterized by the seis-mic hazard at the site and the local site condition. Thespectral shape of seismic coefficient C is governed bythe ordinates of the pseudoacceleration at short period,A�Tn � 0:2 sec�, and that at 1.0 sec, A�Tn � 1:0 sec�.Maps showing these two values of A are usually given inseismic codes.
The typical shape of a seismic design spectrum for arock site is shown by the solid line in Figure 14, wherethe corner period Tc indicates the intersection between theconstant-acceleration and constant-velocity branches of thespectrum. Because the constant-acceleration branch is de-fined by A�Tn � 0:2 sec� and the constant-velocity branchis determined by A�Tn � 1:0 sec�, the corner period Tc al-ways lies between 0.2 and 1.0 sec. The Tc values for rocksites typically range between 0.4 and 0.6 sec. This spectralshape was derived from statistical analyses of numerousground motions recorded near the epicenters, and thus, it
Figure 13. (a) Pseudoacceleration response spectra (5% damping ratio) of the ground motions at the three different levels, namely, thebedrock, the depth of�30:5 m, and the surface. (b) Spectral amplification factors between the surface and the bedrock and between the depthof 30.5 m and the bedrock.
580 K. Megawati and T.-C. Pan

is suitable for sites where the seismic hazards are controlledby near-field earthquakes.
Figures 9–11 have shown that the natural-period rangefor the constant-acceleration branch becomes longer as thedistance from the source to the station increases. Comparingthe response spectra in Padang and Singapore shows that therange increases from 0.8–1.5 to 1.5–3.5 sec. In both cases,the corner period Tc extends beyond 1.0 sec. This is under-standable because the high-frequency components of theground motions attenuate more rapidly with respect to dis-tance than do the low-frequency components. Therefore, atdistant stations the ground motions are likely to be domi-nated by low-frequency components. This fact implies thatthe shape of the design spectrum derived from near-fieldearthquakes, shown by the solid line in Figure 14, may notbe suitable for sites where the potential seismic hazard isdominated by large-magnitude, far-field, events because itmay underpredict the hazard at long-period range. Unfortu-nately, this spectral shape with Tc � 0:5 sec is currentlyused for the whole territory of Indonesia, regardless of thelocal seismicity. For example, the eastern coast of Sumatra(Fig. 1), where the seismic hazard is controlled by distantearthquakes along the Sumatran fault running along thewestern coast and the subduction zone off the western coast,is assigned the same design spectral shape as the high-seismicity western coast. The implications can be seen inFigures 9–11, where the potential risk to medium- and high-rise structures with T � 0:8–3:0 sec in the low-seismicitycities of Palembang and Pekanbaru are as high as those inthe high-seismicity cities of Bengkulu and Padang.
Building authorities in Singapore and Malaysia are cur-rently discussing the incorporation of earthquake-resistantdesign to existing building codes. It should be understoodthat the characteristics of ground motions in Singapore andthe Malay Peninsula are unique and not the same as those inhigh-seismicity regions. The shifting of the response spec-trum toward longer period range, as discussed previously,should be carefully taken into account in the formulationof future seismic codes.
Southern Sumatran Earthquakeson 12 and 13 September 2007
During the writing of this article, three significant earth-quakes occurred in the Mentawai segment on 12 and 13 Sep-tember 2007. The epicenters of the earthquakes are depictedin Figure 1. According to the Earthquake Center of the U.S.Geological Survey, the first event occurred on the twelfth, at11:10:26 UTC, with an Mw of 8.4, followed by an Mw 7.8earthquake at 23:49:01 UTC and an Mw 7.1 earthquake thefollowing day, at 03:35:26 UTC. Although the detailed rup-ture processes of these earthquakes are still being analyzedby the Tectonics Observatory of the California Institute ofTechnology, using near-field GPS data and observation of thevertical motion of coral reefs (K. Sieh, personal commun.,2007), initial solutions indicate that the Mw 8.4 event pro-duced between 1 and 4 m of slip on a 250 × 120 km patch.The Mw 7.8 event occurred at the downdip border of theMentawai segment and added to strain accumulating within
Seismic Coefficient C (g)in log scale
1.00.01 0.2 5.0Tn (sec)
in log scale0.08
A(Tn=0.2 sec)
A(Tn=1.0 sec)
sec)2.0()(:onAcceleratiConstant
== nn TATC
n
nn T
TATC sec)0.1()(
:VelocityConstant=
=
Tc
Engineering Interest
5.2sec)2.0( =
≈ nTAPGA
Far-fieldearthquakes
Near-fieldearthquakes
Figure 14. Comparison between the spectral design shapes appropriate for near-field and far-field earthquakes.
Regional Seismic Hazard Posed by the Mentawai Segment of the Sumatran Megathrust 581

the segment. The last event ofMw 7.1 may have involved 1 mof slip over a small area of 40 × 20 km.
These preliminary results show that the northern partof the Mentawai segment remains intact during these seriesof earthquakes and may have actually suffered an increase instrain from these events. Therefore, the validity of scenario Ain the present study is unaffected. The southern part ofthe Mentawai segment has accumulated potential slip of8.1 m since 1833 (174 yr × 46:7 mm=yr � 8126 mm).While a portion of the strain accumulated was released inthe Mw 8.4 event, this locked fault patch still has potentialslip of 4.1–7.1 m. Scenario B, with its projected slip value of5 m over the southern portion, remains a realistic model.
Conclusions
The 26 December 2004 Aceh-Andaman earthquake(Mw 9.15) and the 28 March 2005 Nias-Simeulue earthquake(Mw 8.6) released a significant portion of the strain accumu-lated along the Sumatran megathrust north of the equator;thus, there is no immediate danger of a repeating event onthe same segment of the megathrust. In contrast, the Menta-wai segment, south of 1° S, is very likely to rupture in thenear future, as evidence suggests that the interseismic strainaccumulated along this segment has approached that releasedin the historical events of 1797 and 1833. The recentMw 8.4southern Sumatran earthquake on 12 September 2007 mayhave released slip ranging from 1 to 4 m within the southernportion of the Mentawai segment, but it was only a fractionof the 8.1 m of potential slip accumulated since 1833. Threeearthquakes having Mw of 8.6, 9.0, and 9.2 have been pos-tulated as potential rupture scenarios within the Mentawaisegment. The two smaller scenarios are considered mostlikely scenarios in the future, whereas the largest scenariois put forward as the worst-case scenario. The analyses ofthese scenario earthquakes have revealed the following:
1. The ground motions produced by the scenario earth-quakes are strong enough to cause yielding to medium-rise structures in Padang, Bengkulu, Pekanbaru, andPalembang, which are major cities in Sumatra, each hav-ing a population of over half a million. Because structuresare designed to yield in such rare events, it is vital to en-sure that the overall strength, stiffness, and integrity ofthe structures can be maintained throughout the entireduration of shaking. The ductile detailing in the currentdesign code is formulated based on an assumption thattypical ground motions would last 20–40 sec and hasnot been tested against ground motions with durationas long as the 3–5 min expected from these giant earth-quakes. It is therefore important to carry out this type oftests to ensure the adequacy of the structural detailing.
2. Seismic risk to medium- and high-rise buildings in Pe-kanbaru and Palembang, which are located in a low-seismicity region of eastern Sumatra, is as high as the risk
in the high-seismicity cities of Padang and Bengkulu.This is due to the shortcoming in the current Indonesianseismic code where the same design spectral shape, hav-ing a corner period of 0.5 sec, is used for the wholeterritory of Indonesia regardless of local seismicity. Al-though this spectral shape is suitable for high-seismicityregions, where the seismic hazard is controlled by lo-cal, strong, earthquakes, it is not appropriate for low-seismicity regions, where the main seismic threat comesfrom distant earthquakes. Shifting of response spectrumtoward longer period range as the distance from the po-tential seismic source increases should be considered.
3. In Jakarta and Medan, the ground motion from the sce-nario earthquakes may not be strong enough to causeyielding to the buildings if designed according to the cur-rent building code. Instead of the Mentawai segment,Medan is more likely to be affected by the nearby Suma-tran fault and the subduction zone beneath Nias island,whereas Jakarta faces threat from earthquakes in the sub-duction zone south of Java and the nearby faults in west-ern Java.
4. In Singapore and Kuala Lumpur, only medium- and high-rise structures, especially those located on soft-soil sites,are at risk. Given that seismic design has not been re-quired in Singapore and Malaysia, and thus the resultingstructures are relatively brittle, it is crucial to investi-gate the performance of such structures under moderate-amplitude, long-duration, ground motions.
5. Shifting the response spectrum toward longer periodrange becomes significant for cities located far frompotential seismic sources, and it should be carefully con-sidered in the formulation of future seismic codes forSingapore and Malaysia.
Data and Resources
The ground motions recorded at the GSN station in Sin-gapore were provided by the Meteorological Services Divi-sion, National Environment Agency (NEA), Singapore. Thesame sets of data can also be obtained from Incorporated Re-search Institutions for Seismology (IRIS; www.iris.edu, lastaccessed January 2007). The soil profile shown in Figure 12was obtained from NEA. The global crustal model CRUST2.0 was obtained from the Institute of Geophysics and Plan-etary Physics, the University of California, San Diego, http://mahi.ucsd.edu/Gabi/rem.dir/crust/crust2.html (last accessedin January 2007).
Acknowledgments
The authors would like to thank Kerry Sieh of California Institute ofTechnology, who was on sabbatical at Nanyang Technological Universityfrom April to December 2007, for various discussions on constrainingthe future ruptures of the Mentawai segment and on the ruptures of the
582 K. Megawati and T.-C. Pan
12 and 13 September 2007 southern Sumatran subduction earthquakes. Theauthors have benefited from discussions with Hiroo Kanamori on the rupturevelocity and slip velocity of large-magnitude, subduction earthquakes.Felicia Shaw proofread the original manuscript.
References
Aagaard, B. T., J. F. Hall, and T. H. Heaton (2004). Effects of fault dip andslip rake angles on near-source ground motions: why directivity wasminimal in the 1999 Chi-Chi, Taiwan, earthquake, Bull. Seismol. Soc.Am. 94, 155–170.
Ammon, C. J., C. Ji, H. K. Thio, D. Robinson, S. D. Ni, V. Hjorleifsdottir,H. Kanamori, T. Lay, S. Das, D. Helmberger, G. Ichinose, J. Polet, andD. Wald (2005). Rupture process of the 2004 Sumatra-Andaman earth-quake, Science 308, 1133–1139.
Applied Technology Council (1996). ATC-40: Seismic Evaluation and Ret-rofit of Concrete Buildings, Redwood City, California.
Bock, Y., L. Prawirodirdjo, J. F. Genrich, C. W. Stevens, R. McCaffrey,C. Subarya, S. S. O. Puntodewo, and E. Calais (2003). Crustal mo-tion in Indonesia from Global Positioning System measurements,J. Geophys. Res. 108, no. B8, doi 10.1029/2001JB000324.
Briggs, R. W., K. Sieh, A. J. Meltzner, D. Natawidjaja, J. Galetzka, B. Su-wargadi, Y. J. Hsu, M. Simons, N. Hananto, I. Suprihanto, D. Prayudi,J. P. Avouac, L. Prawirodirdjo, and Y. Bock (2006). Deformation andslip along the Sunda megathrust in the great 2005 Nias-Simeulue earth-quake, Science 311, 1897–1901.
British Standards Institution (1997). Structural Use of Concrete, Part 1. Codeof Practice for Design and Construction, BS 8110, London.
Chlieh, M., J.-P. Avouac, V. Hjorleifsdottir, T.-R. A. Song, C. Ji, K. Sieh, A.Sladen, H. Hebert, L. Prawirodirdjo, Y. Bock, and J. Galetzka (2007).Coseismic slip and afterslip of the great Mw 9.15 Sumatra-Andamanearthquake of 2004, Bull. Seismol. Soc. Am. 97, S152–S173.
Chlieh, M., J.-P. Avouac, K. Sieh, D. H. Natawidjaja, and J. Galetzka (2008).Heterogeneous coupling on the Sumatra megathrust constrained fromgeodetic and paleogeodetic measurements, J. Geophys. Res. 113,B05305, doi 10.1029/2007JB004981.
Engdahl, E. R., R. van der Hilst, and R. Buland (1998). Global teleseismicearthquake relocation with improved travel times and procedures fordepth determination, Bull. Seismol. Soc. Am. 88, 722–743.
Fitch, T. J. (1972). Plate convergence, transcurrent faults, and internaldeformation adjacent to southeast Asia and the western Pacific, J.Geophys. Res. 77, 4432–4460.
Idriss, I. M., and J. I. Sun (1992). User’s Manual for SHAKE91, Center forGeotechnical Modeling, Department of Civil Engineering, Universityof California, Davis.
International Code Council (ICC) (2000). International Building Code(IBC) 2000.
Koketsu, K. (1985). The extended reflectivity method for synthetic near-field seismograms, J. Phys. Earth 33, 121–131.
Konca, A. O., V. Hjorleifsdottir, T.-R. A. Song, J.-P. Avouac, D. V. Helm-berger, C. Ji, K. Sieh, R. Briggs, and A. Meltzner (2007). Rupture ki-nematics of the 2005Mw 8.6 Nias-Simeulue earthquake from the jointinversion of seismic and geodetic data, Bull. Seismol. Soc. Am. 97,S307–S322.
Larson, K. M., J. T. Freymueller, and S. Philipson (1997). Global plate ve-locities from the Global Positioning System, J. Geophy. Res. 102,9961–9981.
Lay, T., H. Kanamori, C. J. Ammon, M. Nettles, S. N. Ward, R. C. Aster,S. L. Beck, S. L. Bilek, M. R. Brudzinski, R. Butler, H. R. DeShon,G. Ekstrom, K. Satake, and S. Sipkin (2005). The great Sumatra-Andaman earthquake of 26 December 2004, Science 308, 1127–1133.
McCaffrey, R. (1991). Slip vectors and stretching of the Sumatran fore arc,Geology 19, 881–884.
McCaffrey, R. (1992). Oblique plate convergence, slip vectors, and forearcdeformation, J. Geophys. Res. 97, 8905–8915.
Megawati, K., and A. M. Chandler (2006). Distant-earthquake simulationsconsidering source rupture propagation: refining the seismic hazard ofHong Kong, Earthq. Eng. Struct. Dyn. 35, 613–635.
Megawati, K., and T. C. Pan (2002). Prediction of the maximum credi-ble ground motion in Singapore due to a great Sumatran subductionearthquake: the worst-case scenario, Earthq. Eng. Struct. Dyn. 31,1501–1523.
Nalbant, S. S., S. Steacy, K. Sieh, D. Natawidjaja, and J. McCloskey (2005).Earthquake risk on the Sunda trench, Nature 435, 756–757.
Natawidjaja, D. H., K. Sieh, M. Chlieh, J. Galetzka, B. W. Suwargadi, H.Cheng, R. L. Edwards, J. P. Avouac, and S. N. Ward (2006). Sourceparameters of the great Sumatran megathrust earthquakes of 1797 and1833 inferred from coral microatolls, J. Geophys. Res. 111, B06403,doi 10.1029/2005JB004025.
Natawidjaja, D. H., K. Sieh, J. Galetzka, B. W. Suwargadi, H. Cheng,L. Edwards, and M. Chlieh (2007). Interseismic deformation abovethe Sunda Megathrust recorded in coral microatolls of the Mentawaiislands, West Sumatra, J. Geophys. Res. 112, B02404, doi 10.1029/2006JB004450.
Natawidjaja, D. H., K. Sieh, S. N. Ward, H. Cheng, R. L. Edwards, J. Ga-letzka, and B. W. Suwargadi (2004). Paleogeodetic records of seismicand aseismic subduction from central Sumatran microatolls, Indonesia,J. Geophys. Res. 109, B04306, doi 10.1029/2003JB002398.
Newcomb, K. R., and W. R. McCann (1987). Seismic history and seismo-tectonics of the Sunda arc, J. Geophys. Res. 92, 421–439.
Pan, T. C., and C. L. Lee (2002). Site response in Singapore to long-distanceSumatra earthquakes, Earthq. Spectra 18, 347–367.
Pan, T. C., K. Megawati, J. M. W. Brownjohn, and C. L. Lee (2001). TheBengkulu, southern Sumatra, earthquake of 4 June 2000 (Mw 7:7):another warning to remote metropolitan areas, Seism. Res. Lett. 72,171–185.
Pitts, J. (1984). A review of geology and engineering geology of Singapore,Q. J. Eng. Geol. 17, 93–101.
Prawirodirdjo, L., Y. Bock, J. F. Genrich, S. S. O. Puntodewo, J. Rais,C. Subarya, and S. Sutisna (2000). One century of tectonic deforma-tion along the Sumatran fault from triangulation and Global Position-ing System surveys, J. Geophys. Res. 105, 28343–28361.
Prawirodirdjo, L., Y. Bock, R. McCaffrey, J. Genrich, E. Calais, C. Stevens,S. S. O. Puntodewo, C. Subarya, J. Rais, P. Zwick, and Fauzi (1997).Geodetic observations of interseismic strain segmentation at the Su-matra subduction zone, Geophys. Res. Lett. 24, 2601–2604.
Rivera, L., K. Sieh, D. Helmberger, and D. Natawidjaja (2002). A compara-tive study of the Sumatran subduction-zone earthquakes of 1935 and1984, Bull. Seismol. Soc. Am. 92, 1721–1736.
Schnabel, P. B., J. Lysmer, and H. B. Seed (1972). SHAKE: a computerprogram for earthquake response analysis for horizontally layeredsites, Report Number UCB/EERC-72/12, Earthquake Engineering Re-search Center, University of California, Berkeley.
Seed, H. B., and I. M. Idriss (1970). Soil moduli and damping factorsfor dynamic response analysis, Report Number UCB/EERC-70/10,Earthquake Engineering Research Center, University of California,Berkeley.
Sieh, K., and D. Natawidjaja (2000). Neotectonics of the Sumatran fault,Indonesia, J. Geophys. Res. 105, 28295–28326.
Simoes, M., J. P. Avouac, R. Cattin, and P. Henry (2004). The Sumatra sub-duction zone: a case for a locked fault zone extending into the mantle,J. Geophys. Res. 109, B10402, doi 10.1029/2003JB002958.
Somerville, P. G., N. F. Smith, R. W. Graves, and N. A. Abrahamson (1997).Modification of empirical strong ground motion attenuation relationsto include the amplitude and duration effects of rupture directivity,Seism. Res. Lett. 68, 199–222.
Subarya, C., M. Chlieh, L. Prawirodirdjo, J. P. Avouac, Y. Bock, K. Sieh,A. J. Meltzner, D. H. Natawidjaja, and R. McCaffrey (2006). Plate-boundary deformation associated with the great Sumatra-Andamanearthquake, Nature 440, 46–51.
Vucetic, M., and R. Dobry (1991). Effect of soil plasticity on cyclic re-sponse, J. Geotech. Eng. Div. ASCE 111, 89–107.
Regional Seismic Hazard Posed by the Mentawai Segment of the Sumatran Megathrust 583

Walker, K. T., M. Ishii, and P. M. Shearer (2005). Rupture details of the28 March 2005 Sumatra Mw 8.6 earthquake imaged with teleseismicP waves, Geophys. Res. Lett. 32, L24303, 10.1029/2005GLO24395.
Zachariasen, J., K. Sieh, F. W. Taylor, R. L. Edwards, and W. S. Hantoro(1999). Submergence and uplift associated with the giant 1833 Su-matran subduction earthquake: evidence from coral microatolls, J.Geophys. Res. 104, 895–919.
School of Civil and Environmental EngineeringNanyang Technological UniversityBlock N1, 50 Nanyang Avenue, Singapore [email protected]
Manuscript received 25 October 2007
584 K. Megawati and T.-C. Pan