
Regional infill gravity survey in north-east Antrim ... · Regional infill gravity survey in...
26
British Geological Survey REGIONAL GEOPHYSICS RESEARCH GROUP Technical Report WK/91/2 Regional Geophysics Series Regional infill gravity survey in north-east Antrim, Northern Ireland J P Busby j Natural Environment Research Council
Transcript of Regional infill gravity survey in north-east Antrim ... · Regional infill gravity survey in...

British Geological Survey
REGIONAL GEOPHYSICS RESEARCH GROUP
Technical Report WK/91/2
Regional Geophysics Series
Regional infill gravity survey in north-eastAntrim, Northern Ireland
J P Busby
j NaturalEnvironmentResearchCouncil

This report has been generated from a scanned image of the document with any blank pages removed at the scanning stage. Please be aware that the pagination and scales of diagrams or maps in the resulting report may not appear as in the original

Cov~ illustraJion
250 m pixe! DTM of the survey area,viewed from the north-east
Bibliographic rejmme
BUSBY, J P. 1991. Regional inftllgravity survey in north-east Antrim,Northern Ireland. British GeologicalSurvey Technical Report WK/9112.
© NERC copyright 1991
nGS mox grid ll4
British Geological Survey
Natural Environment Research Council
Technical Report WK/91/2
Regional Geophysics Series
Regional infill gravity survey in northeast Antrim, Northern Ireland
J P Busby
Regional Geophysics Research Group
Keyworth, Nottingham British Geological Survey 1991
tlE~ m grid rct~ n:1
SUMMARY
An infill regional gravity survey was carried out in August - September
1990 over an upland region in north-east Antrim, Northern Ireland. The
purpose of the survey was to define the nature of a north-south striking
gravity anomaly which is located on the south-east margin of the Highland
Border Ridge.
A total of 107 gravity stations were collected both along roads and over
the hills. The revised Bouguer anomaly map shows that the gravity
gradient over the anomaly is broad, with a small low developed in the
north-east. A simple two-and-a-half dimensional gravity model
demonstrates that the gradient is due to a low angled contact between
denser Dalradian rocks to the north-west and Permo-Trias sediments to the
south-east.
CONTENTS
Page
1. INTRODUCTION 1
2. FIELD SURVEY PROCEDURES 2
3. DATA PROCESSING 4
4. PRESENTATION AND INTERPRETATION 7
5. CONCLUSIONS 9
6. ACKNOWLEDGEMENTS 9
REFERENCES 10

1. INTRODUCTION
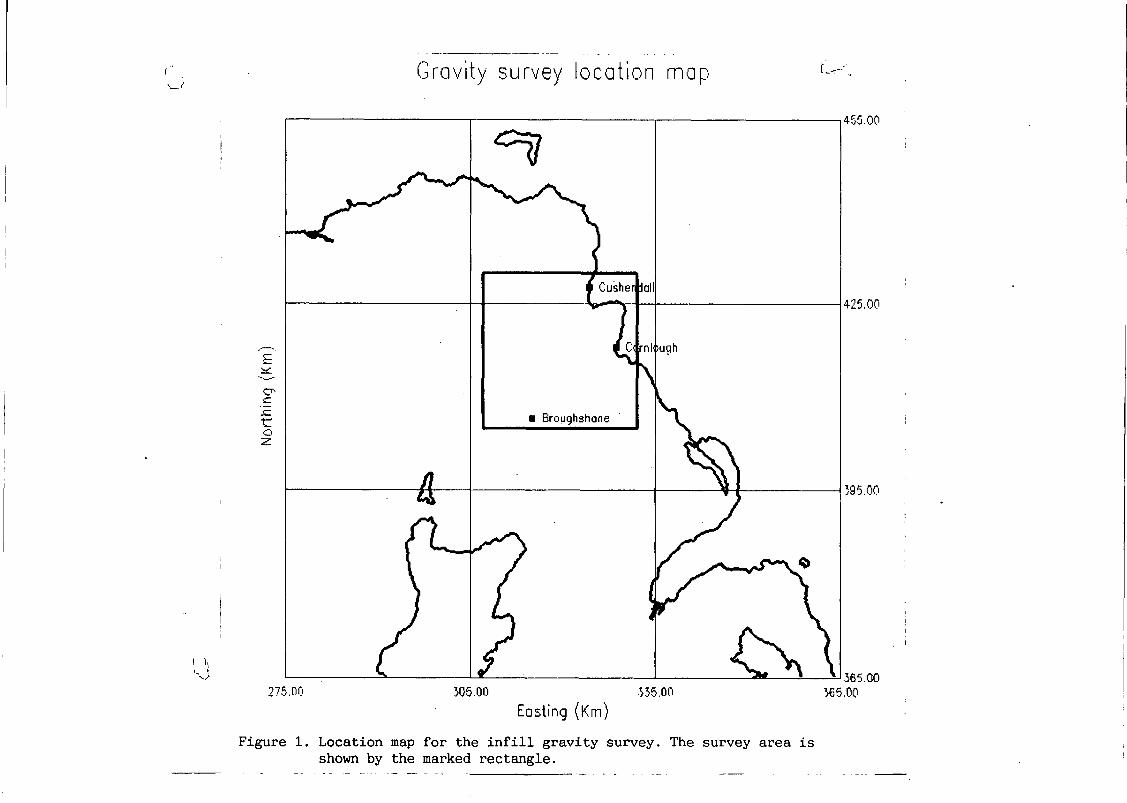
This report describes an infill regional gravity survey carried out over
an upland area in the north-east of Northern Ireland during August and
September 1990. The area of the survey is bounded approximately by the
villages of Cushendall, Carnlough and Broughshane and is shown in figure
1. This upland region is described as one of the last untracked areas of
Northern Ireland and as such is only accessable by foot.
The regional gravity survey of Northern Ireland carried out in 1959 and
1960 (Bullerwell, 1961) concentrated data collection along roads and
tracks where known heights were available from Ordnance Survey benchmarks
and spot heights. Untracked areas were therefore not covered by the
survey although eight data points, whose heights were estimated from the
nearest topographic contours, were collected in the area of this report.
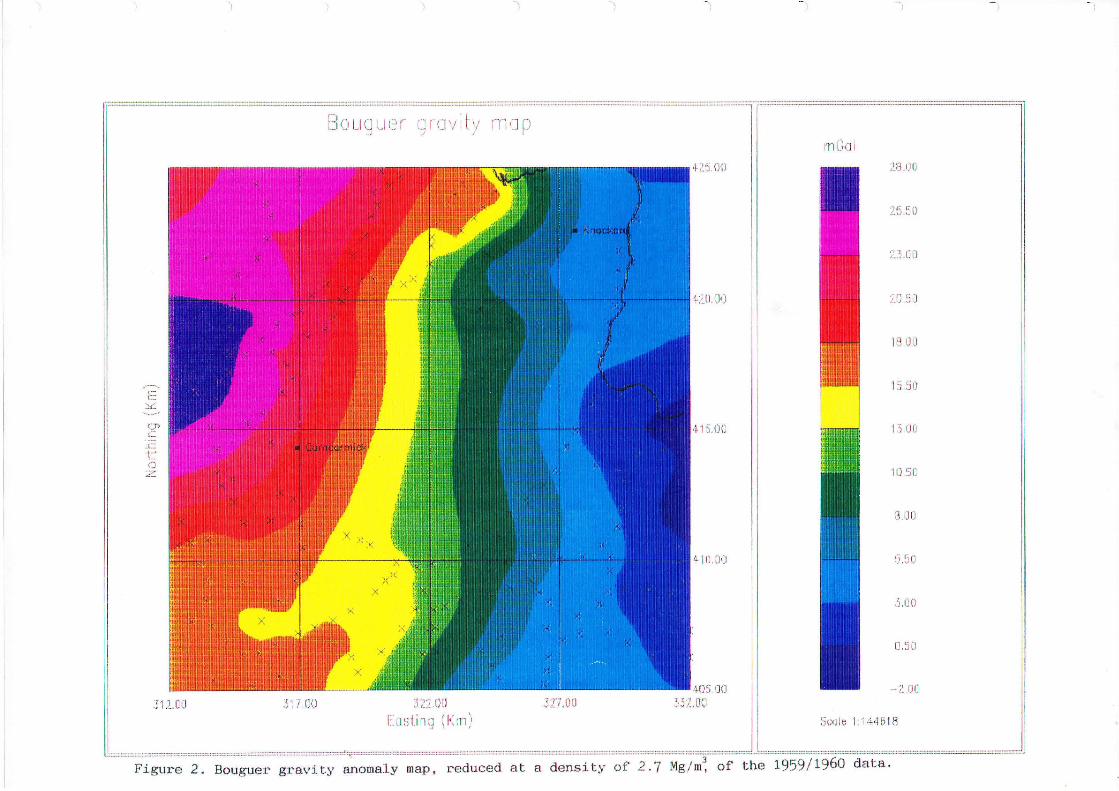
Figure 2 is a colour contour Bouguer anomaly map of the regional gravity
data with the data points indicated by a cross. It can be seen that there
is a large north-south striking gravity gradient across the region. To
the north-west are high values over the Highland Border Ridge and to the
south-east are low values over Permo-Trias sediments. The form of the
gravity gradient is not well controlled due to the lack of data over it.
This region is of interest because it marks a boundary between older
Dalradian rocks to the north and younger Permo-Trias to the south. It
has been proposed by Busby, 1990, that this gravity gradient may be
associated with other west-east striking gravity and magnetic lineations
to the west and may mark the line of the Highland Boundary Fault
extension into Northern Ireland. The infill gravity survey was therefore
undertaken in order to better define the form of the gravity gradient.
1 -
\-JGravity survey location mop t· -'-..--
i I , ,455.00
9
.}35.00
• Broughshane
}G5.00J ON I " '.)65.00
1 .... I r :~65.00
I n I I 'I I 1.}95.00
27S.00
I I I ~ I I 1425.00
0'cJ::toz
~.
E:::.:::
"---
I \" ~,j
Eosting (Km)
Figure 1. Location map for the infill gravity survey. The survey area isshown by the marked rectangle.
80uguer grovity mop
'I
mGal
E~'--~
0'c
.r:::t<.:l
Z
31.2.00 317,00 32200EClsting (Km)
327.00
4'25.00
4lU.OO
4-'15,00
4-10,00
4-QS 00352.00
1_8,00
25,50
2.300
2JJ,50
PlOD
15.50
13.00
1050
8,00
5,50
3,00
0,50
-200
Scale 1:14'1518
Figure 2. Bouguer gravity anomaly map. reduced at a density of 2·7

2. FIELD SURVEY PROCEDURES
When a gravity value is measured there are a number of factors which
influence the magnitude of the value. One of these is the density of the
underlying geology, but, since the force due to gravity follows an
inverse square law with distance, the main factor is the height above sea
level of the gravity station. This is taken into account in the
processing of the data when they are reduced to sea level, but it is
therefore necessary to know the height of the gravity station. For
regional gravity surveys the heights need to be known to an accuracy of
one metre. Due to the lack of bench marks and spot heights in the region
of the survey the necessary heights were obtained by topographic
surveying.
Topographic surveying procedure
The aim of the gravity survey was to obtain infill data to a station
density of approximately one per square kilometre. This therefore
required topographic surveying over long distances. This was accomplished
by using an electronic theodolite coupled to a an infra-red electronic
distance measuring (EDM) device. The required distance was obtained by
bouncing the infra-red beam off a reflective target back to the EDM. The
vertical angle from the theodolite to the target was read from the
theodolite which then gave a direct read-out of horizontal distance to
the target and height difference between the target and theodolite. The
heights of the target and theodolite were then measured to give the
height difference at ground level.
The equipment used was a WILD Tl000 electronic theodolite and a WILD
DI3000 Distomat EDM which can measure distances of up to six kilometres.
In order to obtain the co-ordinates of the gravity stations two surveying
procedures were used. The first was traversing which involves starting
from a known point and a known bearing and measuring the horizontal
clockwise angle between the bearing and a new point and the horizontal
2 -
-- --- -- ----

distance to the new point. This fixes the new points position to which
the theodolite is then moved. The horizontal clockwise angle from the
theodolites previous position to the next new point and the horizontal
distance to the next new point are then measured which fixes this point.
This procedure is repeated along the length of the traverse which ideally
terminates on a known point which then provides an estimate of the error.
For this survey three personnel were used, one leading and holding the
reflective target, the second operating the theodolite and EDM and the
third marking the previous positions of the theodolite with a ranging
rod. Surveyed positions to which it was required to return were marked
with a wooden stake, intermediate points were temporarily marked with a
bamboo cane. Whenever possible Ordnance Survey trig points were used as
the known points, two, Carncormick and Knockore, are within the bounds of
the survey (see figure 2).
With a network of wooden stakes in-place extra points were surveyed-in
with the second procedure, radiation. This involves setting up the
theodolite and EDM over a wooden stake, whose co-ordinates and height are
now known, and measuring the horizontal clockwise angle between a known
bearing and the extra point and the horizontal distance to the extra
point. The height difference was read directly from the electronic
theodolite. The known bearings were taken to trig points, other wooden
stakes or identifyable man made structures shown on the 1:10,000 map
sheets. Since the co-ordinates and height of each extra point are a
one-off measurement it is not possible to assess the error.
GraVity surveying procedure
The gravity measurements were taken with Lacoste and Romberg gravity
meter G280. This is a relative instrument which measures the difference
in gravity between points and not the absolute value of gravity. It is
therefore necessary to establish a base within the area whose absolute
value of gravity is known at which the gravity meter is read at the
beginning and end of each day. This base was established in a car park at
3 -

Cushendall. It's absolute value of gravity was measured by linking it to
two established bases on the shores of Lough Neagh. (A link involves
reading the gravity meter at the unknown base, then at the established
base and then at the unknown base. The two readings at the same base give
a measure of the instrumental drift for which the readings can then be
corrected.) The Lough Neagh bases were Antrim Marine and Toome (New)
which are reported in Tully, 1983. Two links were made to the bases which
resulted in an absolute value of gravity for the Cushendall base of;
G = 981 525.01 ± 0.01 mGal
On gravity surveying days base readings were taken at the beginning and
end of each day at the Cushendall base in order to give a measure of the
instrumental drift. Due to the inaccessability of the upland areas it was
impractical to return to the base during the day. Gravity measurements
were taken at the wooden stakes established by the traversing topographic
surveying and at the extra points which were surveyed in by the radiation
method at the same time as the gravity measurement. Topographic surveying
was impossible on days with low cloud and so some infill gravity stations
were established on the roads.
3. DATA PROCESSING
The survey was undertaken over a four week period, but a considerable
amount of time was lost to the weather during the first two weeks. As a
result a total of 107 gravity stations were measured, 69 on the hills and
38 on the roads.
Topographic surveying data processing
When surveying over long distances a number of corrections have to be
applied to the distance data before the calculation of heights and
co-ordinates. These are an atmospheric correction for the refraction of
4 -

----------- ------------------------- -------
the infra-red beam; a correction to reduce the measured distances to
those that would have been made at sea level and a map projection scale
factor correction to allow for the change in the scale factor from it's
value of 1.0 at the central meridian. (Note that the Irish grid is a
Transverse Mercator projection on the Airy spheroid.) Values were
calculated for each of these corrections and then combined into a single
parts per million error which was entered into the electronic theodolite.
The theodolite corrected measured distances before displaying the result
on the control panel.
Due to the inaccessability of the area only three points whose
co-ordinates and heights were known were included in the survey. From
these the maximum error in the co-ordinates was found to be three metres,
but since this is within the desired accuracy of ten metres no attempt
has been made to distribute this error. The error in the heights has been
distributed linearly resulting in the desired accuracy of one metre.
Gravity data processing
The gravity data were reduced to Bouguer anomaly values using
conventional procedures (see for example Telford et al., 1976). The
parameters used in the reduction were a free air gradient of 0.3086
mGal/m, a Bouguer constant of 0.041929 mGal/m and normal gravity
calculated from GRS67. The reduction density was 2.7 Mg/m~ Due to the
steep terrain the gravitational effect of the topography is likely to be
quite large for some stations. Some considerable effort was therefore
expended in performing terrain corrections, a description of which is
given below.
Rollin, 1990, has produced a computer program for performing terrain
corrections from a digital terrain model. The gravitational effect of
adjacent terrain is calculated as conical octants centred on the gravity
5 -

----------
station, near terrain as vertical prisms and far terrain using a vertical
line mass algorithm. For the zone beyond 20 Km from the gravity station
earth curvature is allowed for by using a dipping line mass algorithm.
Two digital terrain models (DTM's) were produced of the topography. The
first consisted of average height estimates in 250 sq. m units of the
Irish grid. The estimates for on-shore areas were made from the 1:10,000map sheets and marine areas from the Admiralty charts. The area covered
was between eastings 309 Km to 335 Km and northings 403 Km to 428 Km.
This resulted in a total of 10,400 height estimates. The 250 sq. m DTM is
shown in figure 3. The second DTM consisted of height estimates on a 1 Km
grid which covered the area between eastings 272 Km to 368 Km and
northings 367 Km to 468 Km. This grid of 9,696 points was produced from
6,097 height estimates. These were obtained from the land and marine
gravity data, the 250 sq. m DTM (averaged to 1 sq. Km), spot heights from
the 1:50,000 map sheets and the Admiralty charts. This DTM is shown in
figure 4.
The inner zone terrain corrections out to 3 Km from each gravity station
were made with the 250 sq. m DTM, except for 7 road stations which fell
outside of the DTM. Their inner zone terrain corrections were done out to
Hammer zone G (1.53 Km from the gravity station) with the chart method of
Turnbull, 1984. The outer zone terrain corrections for all of the
stations were carried out to Hammer zone N (32.667 Km from the gravity
station) using the 1 Km grid DTM. With the DTM's established the terrain
corrections for the 1959/1960 data within a rectangle defined by eastings
312 Km to 332 Km and northings 406 Km to 425 Km have been recalculated.
The result of subtracting the original from the new terrain correction
for each station is shown in table 1. It can be seen that most of the
original terrain corrections are less than the new, but not by very large
values. This is probably because the outer zone terrain corrections were
not done to the original data. However there are a few terrain
corrections which are markedly different and in which the original
correction is greater than the new. These occurr mainly in Glenariff and
6 -

250 ID pixel digital terrain modelm
--S:::.:::
QD
Cl.....~....,"'"o
Z
309.00
Figure 3.
316.00 321.00
Easting (Km)327.00 333.00
545.00
490.42
435.83
361.25
326.67
272.08
217.50
162.92
108.33
53.75
-0.83
-55.42
-110.00
Scale 1: 188000

One Km pixel digital terrain modelm
-,
---El:::0:::'-"
tl1l~.-
..cl..,Mo
Z
272.00
Figure 4.
296.00 320.00
Easting (Km)344.00
367.00368.00
519.00
455.93
392.86
329.79
266.72
203.65
140.58
77.51
14.4-4
-4-6.63
-111.70
-174.77
-237.84
Scale 1:700000

Table 1. Listing of the terrain corrections (TC) for the gravitystations within the rectangle eastings 312 Km to 332 Km andnorthings 406 Km to 425 Km. Original TC is from the 1959/1960survey, New TC has been calculated from the digital terrainmodels and Org.-new is the result of subtracting the two TC's.
Station Co-ordinates (km) Original New Org.-newNo. Easting Northing TC TC TC
U1 19A08 315.35 424.38 0.19 0.43 -0.24U1 19A09 315.74 423.65 0.32 0.52 -0.20U1 19A10 315.90 423.18 0.37 0.56 -0.19U1 19A11 315.77 422.28 0.49 0.94 -0.45U1 19B01 319.53 422.42 0·55 0.66 -0.11U1 19B02 319.83 424.07 1.11 1.23 -0.12U1 19B03 320.15 424.87 1.06 1.54 -0.48U1 19B08 320.03 423.59 1.17 1.06 0.11U1 19B09 320.47 424.33 1.47 1.86 -0.39U1 19B1O 320.90 424.68 1.63 2.00 -0.37U1 19B19 319.78 423.20 1.60 0.80 0.80U1 20A01 324.89 424.69 3.78 1.81 1.97U1 20A02 329.98 423.06 2.59 2.32 0.27U1 20A03 330.10 424.43 2.95 2.19 0.76U1 20A07 325.74 424.85 3.68 2.74 0.94U1 20A15 324.06 423.55 7.68 3.65 4.03U1 20A16 323·23 422.62 7.68 4.16 3·52U1 20A17 323.71 423.09 7.61 4.12 3.49U1 20A18 324.53 424.12 7.72 2.75 4.97U1 20A21 323.47 424.85 4.28 2.82 1.46U1 20A22 323.27 424.42 4.76 2.76 2.00U1 20A23 322.96 424.03 5.92 3.34 2.58U1 20A24 322.65 423.60 4.76 3.33 1.43U1 20A25 322.26 422.89 4.64 3.82 0.82Ut 20A26 322.10 422.36 4.58 4.48 0.10U1 20A29 329.47 422.62 3.49 2.67 0.82U1 23B12 312.16 416.95 0.16 0.34 -0.18U1 24A01 312.98 416.46 0.44 0.34 0.10U1 24A02 313.88 416.90 0.31 0.64 -0.33U1 24A03 313.84 416.15 0.60 0.35 0.25U1 24A04 314.24 417.25 0.29 0.58 -0.29U1 24A05 314.28 417.98 0.49 0.62 -0.13U1 24A06 314.33 418.90 0.70 0.75 -0.05U1 24A07 314.38 419.70 0.45 0.75 -0.30U1 24A08 314.64 420.95 0.47 0.67 -0.20U1 24A09 313.43 421.59 0.27 0.59 -0.32U1 24A10 315.40 421.58 1.11 0.94 0.17U1 24A11 314.49 420.13 0.48 0.73 -0.25U1 24A12 314.92 417.90 0.27 0.42 -0.15U1 24A13 315.53 418.49 0.15 0.41 -0.26U1 24A14 316.14 419.09 0.25 0.64 -0.39U1 24A15 316.76 419.47 0.46 0.89 -0.43U1 24A16 315.94 418.01 0.18 0.48 -0.30U1 24A17 316.52 417.53 0.34 0·52 -0.18Ut 24A18 316.76 417.01 0.45 0.59 -0.14U1 24A19 316.33 416.48 0.56 0.63 -0.07

Station Co-ordinates (km) Original New Org. -newNo. Easting Northing TC TC TC
Ul 24BOl 321.39 420.79 1. 72 1.91 -0.19Ul 24B02 321.01 420.58 0.53 1.23 -0.70Ul 24B03 320.50 420.63 0.35 0.93 -0.58Ul 24B04 319.85 420.79 0.22 0.64 -0.42Ul 24B05 319.36 420.73 0.13 0.62 -0.49Ul 24B06 318.80 420.40 0.12 0.56 -0.44Ul 24B07 318.63 419.94 0.10 0.42 -0.32Ul 24B08 318.04 420.60 0.28 0.84 -0.56Ul 24B09 318.31 419.35 0.11 0.39 -0.28Ul 24Bl0 317.97 418.87 0.38 0.45 -0.07Ul 24Bll 317.31 418.60 0.62 0.62 0.00Ul 24B12 319.05 421.66 0.27 0.74 -0.47Ul 24B13 317.05 419.60 0.38 0.91 -0.53Ul 24B14 317.48 420.19 0.40 1.02 -0.62Ul 25AOl 328.68 417 .00 1. 72 1.02 0·70U1 25A02 330.40 416.45 2.74 1.38 1.36Ul 25A03 329.35 416.39 2.08 1. 75 0.33Ul 25A04 328.61 417.78 1. 74 1.07 0.67Ul 25A05 328.83 418.52 1.67 1.08 0.59Ul 25A06 329.75 421.40 1.89 1.24 0.65Ul 25A07 329.29 421.84 2.00 2.07 -0.07Ul 25A08 329.26 421.13 1. 73 1.80 -0.07Ul 25A09 329.20 420.41 1.59 1.34 0.25U1 25Al0 329.13 419.77 1.56 1.17 0.39Ul 25All 328.90 419.14 1.61 1.11 0.50Ul 25A12 328.36 416.32 1. 76 1.20 0.56Ul 25A13 322.06 422.04 3.92 4.40 -0.48Ul 25A14 322.01 421.36 3.27 3.72 -0.45Ul 25A16 324.96 421.80 1.66 1.04 0.62Ul 25A21 325.11 419.15 0.97 0.58 0·39Ul 25A22 326.19 419.09 0.74 1.65 -0.91Ul 27B22 312·31 410.60 0.24 0.24 0.00U1 28AOl 313.13 409.88 0.33 0.35 -0.02U1 28A02 312.78 410.71 0.33 0.30 0.03Ul 28A03 312.46 411.50 0.31 0.27 0.04U1 28A04 313.99 412.89 0.27 0.42 -0.15Ul 28A05 313.84 413.36 0.29 0·35 -0.06Ul 28A06 313.82 414.27 0.38 0.39 -0.01Ul 28A07 313.60 415.13 0.24 0.26 -0.02Ul 28A08 314.97 415.26 0.43 0.50 -0.07Ul 28A09 315.89 414.53 0·50 1.25 -0.75Ul 28Al0 315.60 415.68 0.63 0.69 -0.06U1 28All 314.43 413.13 0.27 0.53 -0.26Ul 28A12 313.47 410.82 0.22 0.53 -0.31U1 28A13 314.86 411.43 0.27 0.33 -0.06U1 28A14 314.48 412.25 0.23 0.48 -0.25U1 28A15 315.89 411. 53 0.17 0.30 -0.13Ul 28A16 317.02 411.42 0.22 0.43 -0.21Ul 28A17 316.25 412.61 0.27 0.53 -0.26Ul 28A18 316.78 412.38 0.25 0.53 -0.28Ul 28A19 317.10 410.51 0.29 0.40 -0.11Ul 28A20 316.89 409.52 0.21 0.36 -0.15Ul 28BOl 317.80 411.06 0.33 0.35 -0.02

----------- -
Station Co-ordinates (km) Original New Org. -newNo. Easting Northing TC TC TC
Ul 28B02 318.81 410.97 0.29 0.34 -0.05Ul 28B03 319·32 410.78 0.36 0.39 -0.03Ul 28B04 319.70 410.62 0.42 0.42 0.00Ul 28B05 320.72 409.93 0.53 0.42 0.11Ul 28B06 320.59 409.47 0.53 0.36 0.17Ul 28B07 321.52 409.75 0.37 0.29 0.08Ul 28B08 322.05 409.88 0.44 0.34 0.10Ul 29AOl 323.34 409.89 0.20 0.27 -0.07Ul 29A02 324.29 409.96 0.07 0.22 -0.15Ul 29A03 324.89 409.92 0.14 0.20 -0.06Ul 29A04 325.98 410.14 0.09 0.16 -0.07Ul 29A05 326.97 410.02 0.08 0.22 -0.14Ul 29A06 323.47 410.56 0.27 0.34 -0.07Ul 29A07 324.21 411.12 0.23 0.32 -0.09Ul 29A08 325.08 411.78 0.20 0.30 -0.10Ul 29A09 325.68 412.28 0.11 0.22 -0.11Ul 29Al0 326.40 412.89 0.03 0.22 -0.19Ul 29All 326.81 413.43 0.09 0.29 -0.20Ul 29BOl 327.89 410.13 0.31 0.29 0.02Ul 29B02 328.61 410.57 0.06 0.26 -0.20Ul 29B03 328.95 410.13 0.16 0.35 -0.19Ul 29B04 329·21 411.28 0.41 0.45 -0.04Ul 29B05 329.40 411. 99 0.55 0.80 -0.25Ul 29B06 329.44 413.06 0.87 1.27 -0.40Ul 29B07 330.02 414.10 1.10 1.22 -0.12Ul 29B08 330.42 415.07 1.31 1.30 0.01Ul 29B09 328.38 413.64 0.27 0.51 -0.24Ul 29Bl0 327.64 414.98 0.77 0.98 -0.21Ul 29Bll 328.22 415.98 1. 73 1.32 0.41Ul 29B12 327.27 414.36 0.40 0.90 -0.50Ul 29B13 331.21 415.34 0.99 1.15 -0.16Ul 29B14 331.00 414.24 0.85 1.15 -0.30Ul 29B15 331.06 412.17 0.32 1.14 -0.82Ul 29B16 331.25 411. 56 0.09 0.89 -0.80Ul 29B17 331.52 410.55 0.32 0.57 -0.25Ul 29B18 331·57 409.99 0.23 0·50 -0.27Ul 33A06 315.42 406.44 0.23 0.21 0.02Ul 33A07 316.93 407.21 0.22 0.28 -0.06Ul 33A08 316.07 406.81 0.24 0.27 -0.03Ul 33A09 315.53 407.69 0.28 0.29 -0.01Ul 33Al0 316.19 408.50 0.29 0.32 -0.03Ul 33All 316.80 409.24 0.17 0.31 -0.14Ul 33A15 314.15 406.97 0.20 0.21 -0.01Ul 33A16 313.58 407.54 0.20 0.17 0.03Ul 33A17 313.40 408.53 0.18 0.20 -0.02Ul 33A18 313.45 409.24 0.20 0.25 -0.05Ul 33A19 314.79 409.14 0.27 0.41 -0.14Ul 33A20 312.84 407.71 0.13 0.13 0.00Ul 33A23 314.80 406.39 0.31 0.24 0.07Ul 33BOl 317.58 407.44 0.53 0.29 0.24Ul 33B02 318.28 407.72 0.51 0·31 0.20Ul 33B03 318.95 408.09 0.46 0.34 0.12Ul 33B04 319.91 408.82 0.36 0.30 0.06

---------------------------------------
Station Co-ordinates (km) Original New Org. -newNo. Easting Northing TC TC TC
Ul 33B05 320.29 409.24 0.36 0·32 0.04Ul 33B06 321.42 408.13 0.27 0.35 -0.08Ul 33B07 321.76 408.84 0.29 0.34 -0.05Ul 33B08 322.15 408.12 0.22 0.28 -0.06Ul 33B09 321.93 407.32 0.29 0.41 -0.12Ul 33Bl0 320.91 407.38 0.36 0.38 -0.02Ul 33B11 321. 71 406.38 0.27 0.62 -0.35Ul 33B12 320.12 406.50 0.30 0.32 -0.02U1 33B18 318.98 406.29 0·37 0.28 0.09U1 33B19 318.24 406.89 0.44 0.24 0.20Ul 34A01 326.56 408.40 0.07 0.29 -0.22Ul 34A02 326.21 408.77 0.07 0.26 -0.19Ul 34A03 325.89 409.22 0.04 0.23 -0.19Ul 34A04 325.09 408.95 0.04 0.18 -0.14Ul 34A05 324.24 408.70 0.13 0.20 -0.07Ul 34A06 323.17 408.48 0.23 0.25 -0.02Ul 34A07 322.57 408.25 0.31 0.28 0.03U1 34A08 322.22 407.43 0·37 0·37 0.00Ul 34A09 323.95 407.62 0.08 0.34 -0.26Ul 34Al0 324.74 407.08 0.07 0.28 -0.21U1 34A11 326.49 407.38 0.08 0.28 -0.20U1 34A12 322.25 406.50 0.27 0.67 -0.40Ul 34A13 323.97 406.51 0.10 0.43 -0·33Ul 34A20 326.55 406.24 0.14 0.30 -0.16U1 34BOl 327.11 406.90 0.19 0.32 -0.13Ul 34B02 327.76 407.17 0.18 0.37 -0.19Ul 34B03 327.67 407.84 0.26 0.29 -0.03Ul 34B05 330.53 406.33 0.18 0.60 -0.42Ul 34B06 329·59 406.82 0.44 0.52 -0.08Ul 34B07 328.87 407.22 0.09 0.44 -0.35Ul 34B08 328.52 408.31 0.21 0.36 -0.15Ul 34B09 328.85 408.79 0·31 0·51 -0.20Ul 34Bl0 328.94 409.57 0.26 0.37 -0.11Ul 34B11 329.49 408.93 0.25 0.45 -0.20Ul 34B12 330.41 408.90 0.11 0.64 -0.53Ul 34B13 331.28 408.74 0.24 0.55 -0.31Ul 34B14 331.78 409.19 0.15 0.68 -0.53Ul 34B15 331.97 406.24 0.14 0.48 -0.34Ul 35AOl 331.97 407.29 0.83 0.39 0.44

------------ -----
a plot of them superimposed on the topography is shown in figure 5. There
is clearly a strong correlation with topography which implies that the
original terrain correction is in error although the 250 sq. m DTM is
still a crude representation of the near terrain of these Glenariff
stations. With the new terrain corrections the correlation with
topography is removed and therefore this is the correction which has been
used for these data.
4. PRESENTATION AND INTERPRETATION
Of the eight data points taken over the upland region in the 1959/1960survey it was found that five of these stations did not fit the new data.
This is due to errors in the heights of these points and they have
therefore been removed.
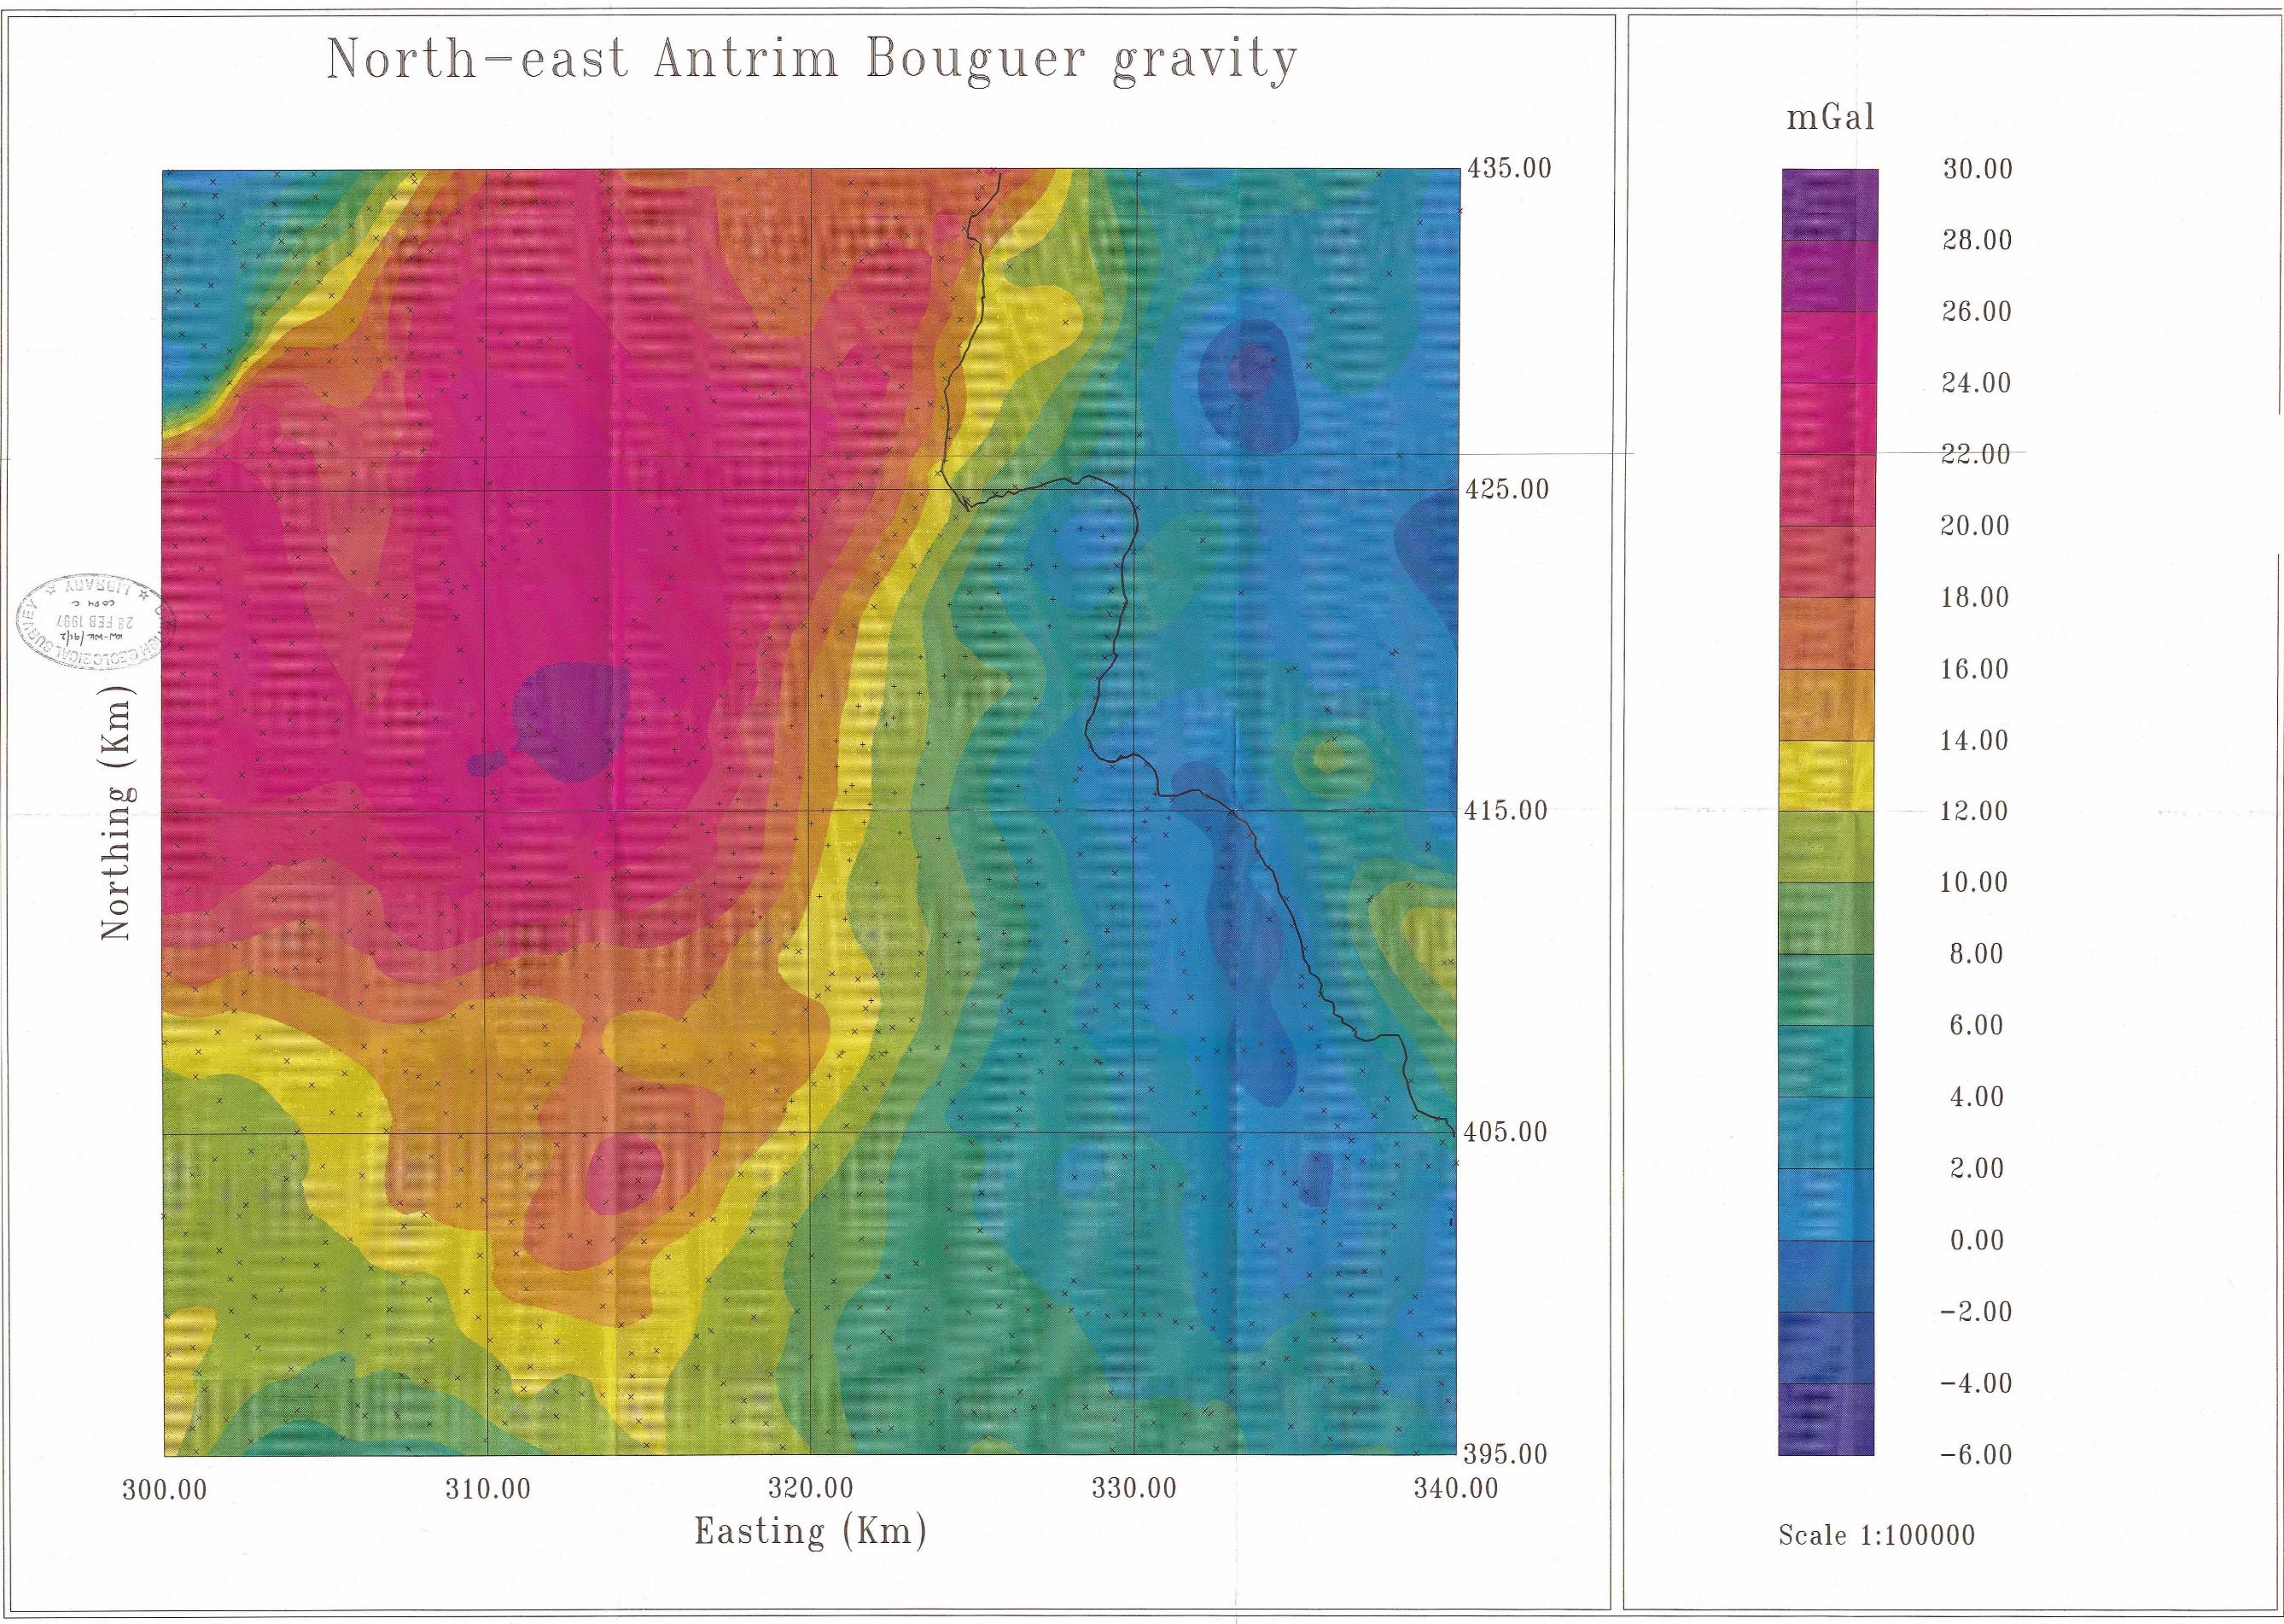
Bouguer anomaLy map
A revised Bouguer anomaly map, reduced with a density of 2.7 Mg/m~ has
been produced for the area and is shown as map 1. The data used for the
map are the new 1990 data, 1959/1960 data within the rectangle eastings
312 Km to 332 Km and northings 406 Km to 425 Km with terrain corrections
calculated from the digital terrain models and 1959/1960 data with the
original terrain corrections. The station positions of the 1959/1960 data
are indicated by diagonal crosses and the 1990 data by upright crosses.
It can be seen that the form of the gravity gradient has not changed. In
particular its strike direction is still north-south and the magnitude of
the gradient is the same. There have been a few small changes in the
anomalies and a low is developed in the region of the Knockore trig
point.
7 -

Terr ain correction differenc on opography
41 00, l.UO
25
III
~4~ 00
490 42
415 S3
~ 125
~L 61
ZlZ 08
21' 50
16292
IUS]]
~~ 75
-083
-~~ ~z
~ -' coo
I)C~I- I n4
07
06507
I
1\
0761_
Easting (Km)
--;---------------------,428.OC'
Figure 5. Terrain correction difference (original-new) superimposed on the topography.

~~----~----------
Databanking
The 1990 data have been added to the Northern Ireland gravity databank
which is maintained by Regional Geophysics. The terrain corrections for
the 1959/1960 data which have been recalculated using the digital terrain
models have replaced the old terrain corrections and the five stations
found to be in error have been removed.
Interpretation
The Cushendall fault is seen in outcrop to the north of Cushendall in the
Lower Old Red Sandstone. It's strike is correlated with the strike of the
gravity anomaly. The gravity anomaly may represent it's continuation
under the Antrim Lavas. The broad nature of the gravity anomaly indicates
that the contact between the Dalradian and Permo-Trias is not high
angled. This is in contrast to the contact between the northern edge of
the Highland Border Ridge and the Rathlin Trough which is steep. A two
and half dimensional gravity model over the anomaly is shown in figure 6.The gravity profile is taken from west to east along northing 415 Km,
starting from easting 300 Km and finishing on easting 340 Km. This is a
simple model in which an arbitrary constant regional of 16 mGal has been
removed from the observed profile. The regional represents deeper high
density crustal elements. In the model polygon 1 is Dalradian (density
2.8 Mg/m3), polygons 2, 4 and 6 are Permo-Trias (density 2.5 Mg/m3
),
polygon 3 is Palaeozoic sediments (density 2.6 Mg/m3) and polygon 5 is
Antrim Lava (density 2.7 Mg/m3). Due to the arbitrary nature of the
regional the depths to the base of the polygons cannot be taken as
significant. However the model does demonstrate the non-vertical nature
of the Dalradian and Permo-Trias contact beneath the Antrim Lavas.
8 -

___ • colc
-14.0
-2.0 -o..
-6,0 E
-10.0
2.0
10.0
018.0
60.--~K - f~r--- - ..... .,
-- - - -+ . - - - -~,- I
-.7' - + ~_. ----
~
~~ - -- ~ ~
!-
-"- ,
"-.... -- -
- - .........4 . - -
.........
"- - ...,.- - - - f-- '"'- V ~--
- r - ~ p~
-t-- _,?,
,0 50 10,0 1 .0 20.0 2 .0 3 0 3S 0 4 .0 4o
Distancekm
~
•o
Figure 6. A 2.5 dimensional gravity model along northing 415 Km.
-1.00
-2.00 ::~
•o
-3.00
-4.00
-5.00

5. CONCLUSIONS
The 1990 regional gravity survey has filled a gap in the regional
coverage over an upland area near Cushendall. It has proved the broad
nature of the north-south striking gravity gradient. Some errors were
found in the existing regional data and in the terrain corrections
applied to the existing data. The new data and the corrected data have
been added to the Northern Ireland gravity databank. These data show that
the contact between the Dalradian and the Permo-Trias is not high angled
as might be expected from a Caledonian strike slip fault.
6. ACKNOWLEDGEMENTS
The enthusiastic help in the field from Geoff Warke and William Smyth
from the Geological Survey of Northern Ireland is gratefully
acknowledged.
9 -

-_._--~~~-----------------
REFERENCES
Bullerwell W., 1961. The gravity map of Northern Ireland. Irish Nat. J.,
v. 11, pp. 254-257.
Busby J. P., 1990. The Highland Boundary Fault extension into Northern
Ireland: A geophysical review. Project Note PN/90/9, Regional
Geophysics, British Geological Survey.
Rollin K. E., 1990. Terrain corrections for gravity stations using a
digital terrain model. Technical report WK/89/8, Regional
Geophysics, British Geological Survey.
Telford W. M., Geldart L. P., Sheriff R. E. and Keys D. A., 1976. Applied
Geophysics, Cambridge University Press.
Tully M. C., 1983. Gravity survey of Lough Neagh. Final report on data
acquisition. Report No. UC/029, Marine Geophysics Research
Programme, British Geological Survey.
Turnbull G., 1984. GRITZ84 Gravity inner terrain zones 1984 (Casio
Basic). Computer Program Report No. 52, Regional Geophysics
Research Group, British Geological Survey.
- 10 -
x ..
x
x
x x x "
300.00
North =east Antrim Bouguer gravity
x x
x x x x
x Xx x x x x
310.00
x
x X :
x
x x
320.00
Easting (Km) 330.00
435.00
425.00
405.00
395.00 340.00
mGal 30.00
28.00
26.00
. 24.00
20.00
6.00
4.00
2.00
0.00
-2.00
-4.00
-6.00
Scale 1: 100000