REGIONAL AMT GEOPHYSICS RPT GRAHAM TP - Ontario · Minescape Exploration Inc. Government maps and...
38
41I06NE2001 2.19816 WATERS 010 "RF A n ^ ^ f- rt i 00, 1 9 baJ GEOSCIENCE ASSESSMENT Regional AMT Geophysics Report Graham Township Project Sudbury Mining Division r^ t ^ 9 ^ l Wallbridge Mining Company Limited 129 Fielding Road, Lively, Ontario P3Y 1L7 Prepared October 07, 1999 By: Mark Hall B. Se.
-
Upload
vuongtuyen -
Category
Documents
-
view
213 -
download
0
Transcript of REGIONAL AMT GEOPHYSICS RPT GRAHAM TP - Ontario · Minescape Exploration Inc. Government maps and...

41I06NE2001 2.19816 WATERS010"RF
A n ^ ̂ f- rti00, 1 9 baJ
GEOSCIENCE ASSESSMENT
Regional AMT Geophysics Report Graham Township Project
Sudbury Mining Division
r^ t^ 9 ^ l
Wallbridge Mining Company Limited 129 Fielding Road, Lively, Ontario P3Y 1L7
Prepared October 07, 1999 By: Mark Hall B. Se.

41I06NE2001 2.19816 WATERS 010C
Table of Contents
1. Introduction
2. Location and Access
3. Properties
4. History
5. Background
6. Observations
7. Conclusions
8. Figures ^,K fL~V
* r\ ^ ' O9. References ^ | r/

1. Introduction:
The Sudbury Mining camp is one of the most prolific producers of copper/nickel in the world. It is also produces by-product metals such as cobalt, platinum, palladium and gold. Accordingly the Sudbury area was selected as an excellent region for mineral exploration. The availability of land open to staking in Graham Township and its proximity to the Creighton Mine made it an attractive location to explore and test various exploration models. Offset, quartz diorite (QD) dykes on the south range of the Sudbury Impact Complex (SIC) are known to host world class Cu. Ni. deposits. The previous geologic mapping exercise identified certain several zones of Sudbury Breccia. These zones have the potential for hosting SIC type mineral deposits. Geo System Canada Inc. was contracted to perform an AMT survey to identify possible deep deposits coincident with the breccia zones identified by the 1998 mapping.
2. Location and Access
The property is situate in Graham Township, west of the town of Lively, Sudbury Mining Division. The East end of the grid crosses Hwy #144 in the area of the Archery Club road, about one kilometer south of the Creighton turn off, and is bounded on the South by Hwy. #17. The West end of the grid can be accessed by a trail going north from Hwy. #17, approximately 6.5 Km. west of the Hwy. #144 turn off.
3. Properties:
The survey covers mining claims S-1229749 - 63 incl. and privately held lands as follows, S1/2 of lot 11 Con IV, most of lot 11 Con m, lot 10 Con III A IV, lot 9 Con IV and the North 3/4 of Con III, lot 8 Con IV and the North 1/2 of Con III, lot 7 Con III, IV and the south 1/2 of Con V, lot 6 North 1/2 of Con III, Con IV and the South 1/2 of Con V, lot 5 North 1/2 of Con III, North 1/2 and South 1/4 of Con IV, Con V and the SE 1/4 of the Nl/2 of Con VI, lot 4 North 1/2 of Con III, Con IV, and the East 1/2 of Con V, lot 3 North 1/2 of Con IE, Con IV b V and the South 1/2 of Con VI, lot 2 Con South 1/2 of the South 1/2 and North 1/2 of Con IV, Con V and the South 1/2 of Con VI, lot l Con IV, West 1/2 of Con V and the South 1/2 of Con VI. It can be accessed via Hwy #17, Hwy. and Hwy. #144.

4. History:
Ministry records contain the following assessment records covering parts of the property:
Exploration Year
Mag Survey 1939Diamond Drilling 1944Prospecting 1946 Geologic Mapping and Mag 1952Diamond Drilling 1953Magnetometer Survey 1955-56Diamond Drilling 1955-56Mapping-E.M. 1957-59Geological mapping 1969-72Diamond Drilling 1969-72Magnetometer Survey 1969-72Geological Mapping 1968Diamond Drilling 1968-71Magnetometer Survey 1969Geologic Mapping 1999
Company
Hans LunbergNickel Belt Exploration Co. (6 holes 3704 ')D.W. AtchisonNew Alger MinesNew Alger MinesArcadia Nickel Corp. Ltd.Arcadia Nickel Corp. Ltd.Mogul Mining Co.Falconbridge Ltd.Falconbridge Ltd.Falconbridge Ltd.Palco Exploration Ltd.Palco Exploration Ltd.Palco Exploration Ltd.Minescape Exploration Inc.
Government maps and reports:GSC "(Barlow) 1907 GSC (Coleman) 1912 Preliminary geologic map P-0203 Colored geologic map 2119 GR 60 Denison - Waters Regional geologic map 2361 GDIF66 GSC airborne mag map 7067-G
5. Background:
The company originally set out to determine if the project area contained quartz diorite (QD) dykes with potential for sulphide deposits, or zones of breccia that might lead to such deposits. The 1998-99 mapping did not identify any significant sulfide occurrences or QD dykes, but did identify zones of Sudbury breccia. Accordingly, the company proceeded to test the more promising zones of breccia with an AMT survey.
6. Observations: See attached report by: GEOSYSTEM CANADA INC.
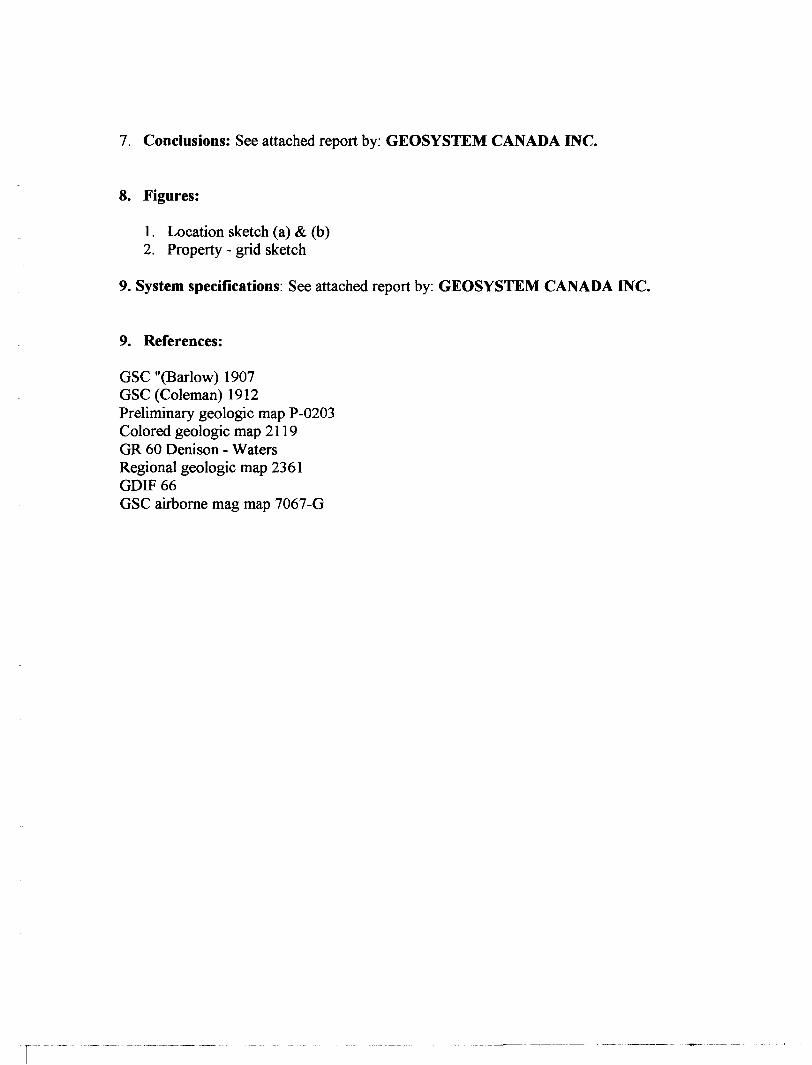
7 Conclusions: See attached report by: GEOSYSTEM CANADA INC.
8. Figures:
1. Location sketch (a) A (b)2. Property - grid sketch
9. System specifications: See attached report by: GEOSYSTEM CANADA INC.
9. References:
GSC "(Barlow) 1907 GSC (Coleman) 1912 Preliminary geologic map P-0203 Colored geologic map 2119 GR 60 Denison - Waters Regional geologic map 2361 GDIF66 GSC airborne mag map 7067-G

WALLBRIDGE MINING COMPANY LTD.
10007o WALLBRIDGE PROPERTY
PROPERTY OPTIONED BY WALLBRIDGE
129 Fielding Road Sudbury, Ontario

VAL L BRIDGE
LOCATION MAPWALLBRIDGEPROPERTY
O l 5KM

r
12^74-0-
IP2915QZ
1229762^

Wallbridge Mining Company Ltd. Graham East AMT Survey
GEOSYSTEM
AMT SURVEY, GRAHAM EAST, SUDBURY, ONTARIO.
OPERATIONAL REPORT
Volume 1/1
prepared for
WALLBRIDGE MINING COMPANY LIMITED
byGEOSYSTEM CANADA INC.
Toronto, Ontario.
September 1999
GRAHAM E op.doc

Wallbridge Mining Company Ltd. Graham East AMT Survey
CONTENTS1. INTRODUCTION...........................................................................................................!
1.1 SURVEY.DESION................................................................................................................^
2. DATA PROCESSING AND EDITING.......................................................................... 32.1 PROCESSING OVERVIEW......................................................................................................32.2 ROBUST PROCESSING..........................................................................................................3
3. DATA PRESENTATION............................................................................................... 43.1 DATA DESCRIPTION AND DIMENSIONALITY ..........................................................................43.2 STATIC SHIFT..................................................................................................................... 43.3 PSEUDO-SECTIONS............................................................................................................^
4. BIBLIOGRAPHY........................................................................................................... 5
Figures
Figure 1: Profile locations.................................................................................................................. 2Figure 2: Sounding N13017, located near the center of the eastern grid.............................................. 4
Appendicesl: Pseudo-section of Field Data II: Personnel and equipment
II-1: PersonnelII-2: EquipmentII-3: Data Format
PlatesPlate 1: Station and profile locations, scale 1:20 000.

Wallbridge Mining Company Ltd. Graham East AMT Survey
SUMMARY
Audio-magnetotelluric (AMT) measurements were collected at an average spacing of about 300m along 9 north-oriented lines, also spaced 300m apart, for a total of 62 stations (i.e ~15 line kilometers) in the Graham East area, Sudbury, in July-August, 1999. Data were recorded in the frequency range 0.5-20,000 Hz, using three 5-channel Metronix 24 bit ADU-06 acquisition systems, of which one was a fixed reference station. Each AMT measurement consisted of a perpendicular pair of 50m dipoles; two orthogonal magnetic field sensors, and one vertical magnetic field sensor. Robust processing resulted in generally good data quality within the survey area.Data were edited, rotated using (mostly) Torquil Smith decomposition, and static shifted. The results are shown as a series of pseudo-sections of apparent resistivity and phase for each of the TE and TM modes, in frequency-distance space.

Wallbridge Mining Company Ltd. Graham East AMT Survev
1. INTRODUCTIONThis report describes acquisition and processing procedures of the audio-frequency magnetotelluric (AMT) survey conducted in the Graham East area of the Sudbury Basin on behalf of Wallbridge. A total of 62 AMT stations were occupied, of which 7 had additional data collected during overnight runs.
LI Survey design480000 481000 482000 483000 484000 485000
5142000 -
5141000 -
5140000 -
5139000 .
5138000
M - 5142000
- 5141000
m rrNJ -
m en
m co - 5140000
.5139000
5138000
482000 483000 484000 485000480000 481000
Figure l: Profile locations.Coordinates are in meters on the UTM grid.
The survey was carried out using three 24-bit ADU-06 systems manufactured by Metronix GmbH of Braunschweig, Germany. Magnetic sensors were the BF-10 induction coils produced by Electro-Magnetic Instruments Inc. (EMI) of El Cerrito, California. Appendix II contains a description of the personnel and equipment used for the survey, along with a description of the data formats.Layout followed the normal MT axis convention, that is, a right-handed system with z positive downwards. Dipole lengths of 50 meters and a fixed acquisition azimuth of geographic north was used at all sites throughout the survey. Access to the grid was by 4WD vehicle as far as possible, and thence on foot. Due to the low system weight, the operator and 2 helpers were able to pack all of the necessary gear without difficulty.

Wallbridge Mining Company Ltd. Graham East AMT Survey
2. DATA PROCESSING AND EDITING
2.1 Processing overviewThe basic steps required to transform field time-series to usable data are as follows:
1. Automatic selection of coherent data segments (low noise) by comparison of the electric and magnetic fields;
2. Robust processing of the 150 most coherent data segments in each sample band,3. Merging of individual bands to form a complete sounding curve;4. Checking of calculated curves for geophysical plausibility.
Data were archived on CD ROM on a daily basis after the time series was transferred from the field computers to the processing computer. Time series were viewed with the Metronix visualization program QuickLook. Automatic coherency selection and robust processing were carried out using routines developed by Jim Larsen (Larsen and others, 1996). Data analysis, interpretation, and presentation were completed with Geosystem's interpretation software, WinGLink.
2.2 Robust processingRobust processing techniques were employed to improve data quality and reduce theeffects of noise bias. The method of Larsen and others (1996) was used to estimatesmooth magnetotelluric transfer functions (i.e. impedances) relating the electric andmagnetic field data.Data segments were automatically selected on the basis of electric and magnetic fieldcoherency, and used as input to the robust processing algorithm. The magnetic and electricfields are used in an iterative re-weighted method to determine the impedance tensor.During the iterations, the electric fields are corrected in both the frequency and timedomains, utilizing a smooth MT transfer function to estimate the electric field data fromthe magnetic fields. The total time required to robust process a single sounding wasapproximately 15 minutes.The program outputs data at 5 equi-spaced frequencies per decade (e.g. 12, 19, 30, 49,and 78 Hz). All of the soundings were processed using the robust algorithm.

Wallbridge Mining Company Ltd. Graham East AMT Survey
3. DATA PRESENTATION
3.1 Data description and dimensionalityThe AMT responses, at frequencies down to l Hz, are primarily two-dimensional, with three-dimensional effects superimposed in a few areas. Data were rotated to the average strike direction of 1050 prior to interpretation, decomposing the data into responses parallel and perpendicular to strike (the TE and TM modes respectively). At most stations, Plow is aligned along the strike direction and is therefore the TE mode. An example of this is shown in figure 2. In more 3-D areas, or where noise made the standard decomposition process unstable, the decomposition techniques of Torquil Smith and LaTorraca were utilized in an attempt to produce sounding curves similar to those of near-by sites.
ID4.
10J
102 .
180
90-
0-
-180-ID- io-2
Period (sec)
10" 10"
Figure 2: Sounding N13017, located near the center of the eastern grid. The higher of the two apparent resistivity curves at lOOHz is identified as the TM mode, the overall curve shapes at most sites in this prospect are similar.
3.2 Static shiftStatic shift, i.e. the frequency-independent shift of apparent resistivity curves, is caused by near-surface conductive inhomogeneities which distort the local electric fields (Groom and Bailey, 1989). Without external data, there is no unique way of resolving this effect. In the present survey area, large static shifts were observed at about 1507o of the sites, with maximum relative shifts (i.e. Ohigh compared with piow) of two decades. Impedance phase, which is proportional to the slope of the apparent resistivity curves, is nearly independent of static shift. Phase pseudo-sections were therefore used as a guide to static-shifting of the apparent resistivity curves. In general, piow was shifted to coincide with phigh at the high-frequency end of the curves.
3.3 Pseudo-sectionsPseudo-sections (in frequency/distance space) of observed apparent resistivity and phase are plotted for all lines used for inversion in Appendix I.

Wallbridge Mining Company Ltd. Graham East AMT Survey
4. BIBLIOGRAPHYLarsen. J., Mackie, R.L., Manzella, A., Fordelisi, A. and Rieven. S.
LaTorraca, G.A., Madden, T.R., and Korringa, J.
Mackie, R.L., and Rodi, W.
Mackie, R.L., and Madden, I.R.
Madden, T.R., and Mackie, R.L.
Torquil Smith, J.
Wannamaker. RE., Hohmann, G. W. and Ward, S.H.
Wight. D.E.
1996 Robust smooth magnetotelluric transfer functions: Geophys. J. Int. 124, 801-919.
1986 An analysis of the magnetotelluric impedance for three- dimensional conductivity structures. Geophysics, 51, 1819- 1829
1996 A nonlinear conjugate gradients algorithm for 2-D magnetotelluric inversion: Paper presented at fall meeting of the American Geophysical Union, San Francisco, California
1993 Three-dimensional magnetotelluric inversion using conjugate gradients: Geophys. J. Int., 115, 215-229
1989 3-D MT modeling and inversion: Proc. IEEE 77, 318-333.
1995 Understanding telluric distortion matrices: Geophys. J. Int., 122, 219-226.
1984 Magnetotelluric responses of 3-D bodies in layered earths: Geophysics 49 (9) 1517-1533.
1988 SEG MT/EMAP Data Interchange Standard, Revision 1.0: SEG, Oklahoma City. 91pp.

Wallbridge Mining Company Ltd. Graham East AMT Survey
APPENDIX I: PSEUDO SECTIONS OF FIELD DATA
Note: SOUTH is to the LEFT on all sections.

TE Apparent Resistivity
10
1000
Distance (m)
2000
Ohm.m
Degrees
l90
80
70
60
50
4030
20
10
Ohm.m
Degrees
Wallbridge Mining Company Ltd.
GRAHAM EAST AMT SURVEY
Pseudo-section Line E-1
Geosystem Canada Inc. 9/1999

TE Apparent Resistivity
TM Apparent ResistivityIU
-2
10' S- 10U
1000
Distance (m)
2000
Ohm.m
Degrees
Ohm.m
Degrees
Wallbridge Mining Company Ltd.
GRAHAM EAST AMT SURVEY
Pseudo-s act i on Line E-2
Geosystem Canada Inc 9/1999

10-3
IEo
g'
K N
Q
____ ̂ -. .
irr-p8
ir h-
3o'
ir i*-
Sz
IE8o TE
x r-oO)
. Apparen
10
TM Apparent ResistivityIU
1000
Distance (m)
2000
Ohm.m
Degrees
Ohm.m
Degrees
Wallbridge Mining Company Ltd.
GRAHAM EAST AMT SURVEY
Pseudo-section Line 6-3
Geosystem Canada Inc 9/1999

H*'LI
K
TE Apparent Resistivity
100006813 —4642 —•3162-
Ohm.m
Degrees
TM Apparent Resistivityiu
Ohm.m
Degrees
-1
10
1000
Distance (m)
2000
Wallbridge Mining Company Ltd.
GRAHAM EAST AMT SURVEY
Pseudo-section Line E-4
Geosystem Canada Inc. 9/1999

tt*—r-Sgt
o:T—to nM ol
[E1—
^
SNOl
o:P2o
1
o:T-i1^.
HS
1
KO
io1
(Too(O
TE App
____ . IU
10'
TM Apparent Resistivity
1000
Distance (m)2000
Ohm.m
Wallbridge Mining Company Ltd.
GRAHAM EAST AMT SURVEY
Pseudo-section Line E-5
Geosystem Canada Inc. 9/1999

10
-3
1000 2000
Distance (m)
Ohm. m
Degrees
Ohm.m
Degrees
Wallbridge Mining Company Ltd.
GRAHAM EAST AMT SURVEY
Pseudo-section Line W-1
Geosystem Canada Inc. 9/1999

10
1000
Distance (m)
TE Apparent ResistivityIU
-2
TM Apparent ResistivityIU
Ohm. m
Degrees
Ohm.m
Degrees
Wallbridge Mining Company Ltd.
GRAHAM EAST AMT SURVEY
Pseudo-section Line W-2
Geo system Canada Inc. 9/1999

T E Apparent Resistivity IU
-2
TM Apparent ResistivityIU
10
1000
Distance (m)
Ohm,m
Degrees
Ohm m
Degrees
Wallbridge Mining Company Ltd.
GRAHAM EAST AMT SURVEY
Pseudo-section Line W-3
Geosystem Canada Inc. 9/1999

10
TE Apparent Resistivity 1u
TM Apparent Resistivity 1u
1000
Distance (m)
Ohm.m
Degrees
Ohm. m
Degrees
Wallbridge Mining Company Ltd.
GRAHAM EAST AMT SURVEY
Pseudo-section Line W-4
Geosystem Canada Inc. 9/1999

Wallbridge Mining Company Ltd. Graham East AMT Survey
APPENDIX II: PERSONNEL AND EQUIPMENT
Appendix II-l: PersonnelParty Chief/interpretation ................. G. McNeiceInterpretation................................... M.D. Watts, G. McNeiceOperators.........................................T. Bochonko, G. ShieldsField Assistants ................................L. Patty, A. Beckett, A. Libbey-Lahaie, D. Seguin
Appendix 11-2: EquipmentADU-06 (data acquisition unit):
32 bit internal computer, two 24 bit A/D converter, 4096 sample/sec and 49Ksample7sec data rate, standard LAN connection for transfer to system computer.
GPS system:Motorola internal GPS receiver; clock precision 130ns to satellite reference; 8 parallel channels; L l 1575.42MHz; C/A code.
Magnetic Sensors, AMT:Hx,Hy EMIBF-10 (0. l to 10000 Hz). Sensitivity 0.15 V/nT Hz EMI BF-6 (l to 25000 Hz). Sensitivity 0.15 V/nT
Electric Sensors:4x25m dipoles, Shielded cables with Pb-PbCl porous pots
System computer:Ruggedized Pentium notebook PC Computer, with 32Mb RAM and 3.2 Gb hard disk.
Power Supply:ADU-06 12V 34 Ah sealed lead acid battery System computer 12V 12 Ah sealed lead acid battery
Environmental: Temperature:
ADU-06 -400C to +75 0C BF-6 -100C to *450C
Weights:ADU-06 5.0 kg BF-10 4.0kg BF-6 2.5 kg
GRAHAM E op.doc

Wallbridge Mining Company Ltd. Graham East AMT Survey
Appendix II-3: Data formats
Station names are defined by the survey grid, i.e station no. — (grid north)(grid east).
Original field data were archived in time-series files in a mixed binary format as written by the Metronix acquisition program GMS120b. All times series data is stored in a directory corresponding to the site name within a directory designated by the line number. Individual files within the directory follow the following convention.
ssscrrtb.ATS where:
sss ^ ADU06 serial numberc = ADU06 channel number ^ l.. 11=8)rr = Run number/ ^ channel type ^Ex, b^Ey, ^Hx, y^Hy, z^Hz)b = Sample rate (3=40960, b=4096, 0=64, r^2048 or 512 Hz)
EDI files:YyyXxx.EDl, defines an EDI file obtained by robust processing.
Where YyjFTiorthing Xxx= easting
Data were normally archived in the following formats:1. SEG-Electromagnetic Data Interchange (EDI) format containing all cross-powers;2. Binary files in Metronix GMS120b format containing acquisition information and time-series.
The SEG MT/EMAP Data Interchange Standard is described in Wight, 1988. Since this is an extremely lengthy standard (91 pages), the reader is referred to that document for details.
GRAHAM E.doc

Wallbridge Mining Company Ltd. Graham East AMT Survey
METRONK TIME SERIES: ATS FORMATByte
off-set1
3
59
13
17253335373839414749535761656973778185899397101105109
110
111113121129
130
131145157161173175177179
ADR
OOOH
002H
004H008H
OOCH
010H018H020H022H024H025h026h028H02EH030H034H038H03CH040H044H048H04CH050H054H058H05CH060H064H068H06CH
06DH
06EH070H078H080H
089H
082H090H09CHOAOHOACHOAEHOBOHOB2H
Byte
2
2
44
4
8822112624444444444444441
1
2881
1
14124122222
Type
INTEGER
INTEGER
LONGINTSINGLE
LONGINT
DOUBLEBYTE
INTEGERINTEGER
BYTEBYTECHARCHAR
INTEGERSINGLESINGLESINGLESINGLESINGLESINGLESINGLESINGLESINGLESINGLESINGLEBYTELONGLONGLONGCHAR
CHAR
INTEGERDOUBLEDOUBLE
CHAR
BYTE
BYTECHARCHARCHARCHARBYTE
INTEGERINTEGER
Name
Header LengthHeader VersionSamplesSample Freq.
LSBVReserved
Reserved
Info
Length of Header in Byte
Version Number of Header ( * 1 00 )4
Number of SamplesSample Frequency
Start Time of Measurement (in seconds since 1.1.70)LSB Unit in mV2ReservedSerial number of ADU06Serial number of ADB06 (ADC Board)Channel number (0...7)ReservedChannel Tvpe (Ex,Ev,Hx,Hy,Hz)Sensor Tvpe (MFS05, BF4...)Serial number of sensorxl coordinates of Dipole(m)viz2x2 coordinates of Dipole (m)v2z2e-field dipole length (m)Angle (O^north) (degrees ")Probe resistivity (ohm)DC offset voltage3 (mV)Internal gain amplification ( 1 or 30 )4ReservedLatitude (msec)Longitude (msec)Elevation (cm)Lat/Long Tvpe: ~U~ user defined, 'G" internal OPS clockType of additional coordinates: 'U" UTM "G" Gauss-KrugerReference medianX coordinateY coordinateGPS/CLK status: 'G' OPS locked 'C' CLK synchronized 'N' CLK not synchronizedApproximate accuracy of GPS/CLK: 9 means accuracy of 109ReservedSurvev header file nameType of measurement: MT or CSAMTLog file of system self testResult of self test 'OK' or 'NO'ReservedNumber of calibration frequencies in fileLength of frequency entry (32 byte)
GRAHAM E op.doc

Wallbridge Mining Company Ltd. Graham East AMT Survey
181183
18519320520922122522923324124524724925325727328930532133744951310251025102910331037104110451057
OB4HOB6H
OB8HOCOHOCCHODOHODCHOEOHOE4HOE8HOFOHOF4HOF6HOF8HOFCH100H110H120H130H140H150h1COH200H400H400H404H408H40ch410H414H420H
400H-Kn.l)*20H400^n*20H
22
812412444842244161616161611264
51232444441232324
Samples
INTEGERINTEGER
BYTECHARLONGCHARLONG
SINGLESINGLEBYTE
SINGLEINTEGERINTEGER
LONGBYTECHARCHARCHARCHARCHARCHARCHARCHAR
SINGLESINGLESINGLESINGLESINGLEBYTE
LONGINT
Version of calibration format (*100)Start address of calibration information in header (400H)ReservedFile name of ADU06 cal fileDate/time of calibrationFile name of sensor calibrationDate/time of calibrationPower-line freq. 1Power-line freq.2ReservedC S AMT transmitter frequencyCSAMT time series blockCSAMT stacksftlockCSAMT block lengthReservedClientContractorAreaSurvey IDOperatorReservedWeatherCommentsCalibration frequency 1FrequencyAmplitude, e-field (V) - h-field (nT/V)Phase (degrees)Accuracy of amplitude ("/o)Accuracy of phase (+I- degrees)ReservedCalibration frequency 2Calibration frequency nTime series data
GRAHAM E op.doc

O.1 30/00 THU 12:28 FAX 705 682 2144 LAAMANEN CONSTRI'CTinV
41I06NE2001 2.19816 WATERS 020
Wallbridge Mining Company Limited129 Fielding Road, Lively, Ontario P3Y 1L7
(705) 682-9297 Fax (705) 682-2144
Mr. Ron C Gashinski,Senior Manager, Mining Lands SectionGeoscience Assessment Office933 Ramsey Lake RoadSudbury, OnntarioP3E6B5
Re.: Submission Number: 2,19816
Dear Mr Gashinski,
RECEIVEDJAN 20 20GD
GEOSCIENCE ASSESSMENT ___ OfFICE
Thank you for your letter from January 7,2000 requesting further information on the report on the "AMT Survey, Trill Prospect, Sudbury, Ontario" compiled by Geosystem Canada Inc. of Toronto and submitted to your office for assessment credits. Following additional information hope&Jh/ will satisfy the requirements for the assessment report.
1. In reference to section 14flg of the Assessment Works Regulation: After processing of the field measurements, data on the pseudosections indicate that the lithology under the surveyed area has a moderate to high resistivity for shallow and moderate depth. At greater depth ^ 3000m) the survey produced very pronounced low resistivities and phase angles, They are caused by the limitations of the model used for the processing and are of little consequence because they occur beyond the level of mining and economic interest. One anomalous zone located on line W-1 at station 012036R is consisting of lower resistivitie and higher phase for the TE measurements at moderate depth. This could represent a zone of lower resistivity, which may represent a target of interest for further investigations.
2. Re.: Section 14h: Conclusion and recommendation: A possible AMT anomaly was located on the western part of the area on line W-1 at 012036R. This anomaly is located at moderate depth (OOOOm). To further evaluate this anomaly a 2-D inversion of the data should be calculated. Because the anomaly is not closed off to the east the AMT survey should be expanded to the east of the western grid.
JAN 20 '00 12:28 705 6B2 2144 PSGE.02

, PU grit hAi 70c. 662 2144 N CONSTRUCTION ] a 0.3
3. Re. Point 2.: The AMT set-ups need some area to lay out the sensors in the field (i.e.lOmxl Om). Therefore the stations often were established away from the proposed stations in more open areas. The grid location map with the property outline shows the actual location of the lines as they were cut and chained in the field and the proposed AMT stations. During the course of the AMT survey OPS readings were taken routinely as part of the recording of the field measurement. The OPS co-ordinates were used to plot the location of the stations in relation to the UTM grid (NAD 27) as shown in the report by Geosystem
4. Re. 3.: During the time the AMT survey was carried out the northern end of line W-2 was too wet to establish AMT stations in this area. New locations for the AMT stations were established to the east of line W-2 on dry ground. The new stations also were surveyed in by OPS. When the pseudosections were calculated, these new stations were included into a profile made out of stations along line W-1. This explains why the grid and proposed AMT field station and the actual stations and calculated pseudosections do not agree on the maps attached to the report. For the interpretation of the AMT data this is of little consequence because the results of the readings represent information from a large volume below the stations.
We hope that the above explanations will satisfy the requirements of the assessment report.
Eberhard K. Berrer Geophysicist
RECEIVED"JAN 20 ::co
JPN 20 '00 12=28 705 682 2144 PPGE.03

Ontario Ministry ofNorthern Developmentand Mines
Declaration of Assessment Work Performed on Mining Land
Mininn Art ftnhfinrtlon 65(2) and 66(3), R.S.O.1990
Transaction Number (office use)
. Q03CC/Assessment Files Research Imaging
sections 66(2) and 66(3) of the Mining Act. Under section 8 of the Mining Act, this ant work and correspond with the mining landholder. Questions about this collection ent and Mines, 3rd Floor, 933 Ramsey Lake Road, Sudbury, Ontario, P3E 685.
41I06NE2001 2.19816 WATERS 900
Instructions: - For work performed on Crown Lands before recording a claim, use form 0240. - Please type or print in ink.
1. Recorded holder(s) (Attach a list if necessary) ^ v .f". C; 1 ^Name Minescape Exploration Inc.Address 129 Fielding Road, Lively, Ont.
*
P3Y1L7
V^TXVVVn^ I^\a W\\Address ^- -\\ 0 ^
\^\ vA-^io w \Ujcf\W Grv-oov L\w\tii^ ;'J Ux^si cvvV - ?^\LI
' O J
2. Type of work performed
^Client Number ^ ~~" -^ 302136Telephone Number
(705) 682-9297Fax Number
Client Number — v~^ -.r- s5@^F^b Iy-{^.3oi
Telephone Number.r i J— ^^ ^f^ \^~^ C^ "^ f^m — in ^i
Fax Number
: Check (^) and report on only ONE of the following groups for this declaration.Geotechnical: prospecting, surveys, assays and work under section 18 (regs)
Physical: drilling stripping, trenching and associated assays D Rehabilitation
Work Type: Geology - AMT Geophysical Survey
Date* Work From 1 Performed Day
July 1999 To 28 Sept 1999 | Month | Year Day | Month | Year
Global Positioning System Data (if available) Township/Area: Water*, Graham
M or G-Plan Number: G-4120 and G-4052
Office UseCommodity
Total S Value of -,, — , — . , Work Claimed O*ox i J ^oNTS Reference
Mining Division: Sudbury
Resident Geologist r— , District CiUO&Utw
Please remember to: - obtain a work permit from the Ministry of Natural Resources as required;- provide proper notice to surface rights holders before starting work;- complete and attach a Statement of Costs, form 0212;- provide a map showing contiguous mining lands that are linked for assigning work;- include two copies of your technical report.
3. Person or companies who prepared the technical report (Attach a list if necessary)Name GEOSYSTEM CANADA INC.Address 560 Stonebridge Lane, Pickering Ontario, L1W 3B3Name MarkHaBAddress 129 Fielding Road, Lively Ontario, P3Y 1 L7Name *
iAddress
Telephone Number (905) 831-1599
Fax Number (905)831-0648Telephone Number (705)682-9297Fax Number
Telephone Number j^.^^ a .. r.;... it An*-.ntj-.*J f~- O^- __ :.--
Fax Number ;
4. Certification by Recorded Holder or AgentI.. Mark Hall , do hereby certify that l have personal knowledge of the facts set forth in
(Print Name)
this Declaration of Assessment Work having caused the work to be performed or witnessed the same during or after its completion and, to the best ofrrjvknowledge^h/annexed report is true.Signature of Recorded Holder 6r AgenJ^ * 7 U j MQ
Agents Address ^~~^ 129 Fielding Road, Lively, Ont. P3Y 1L7
Telephone Number (705) 682- 9297
Date October 15, 1999
Fax Number
02*1(03*7)
RECEIVED
OCT 1 9 '.333GEOSCIENCE ASSESSMENT
RECOFtr DOCT 1 9

5. Work to be recorded and distributed. Work can only be assigned to claims that are contiguous (adjoining) to the mining land where the work was performed, at the time the work was preformed. A map showing the contiguous link must accompany this form.
Mining Claim Number. Or if work wasdone on other eligible mining land,show in this column the locationnumber indicated on the claim map.egegeg
TB782712345671234568
Number of ClaimUnits. For othermining land, listthe hectares.16 ha
122
Value of workperformed onthis claim
S26,8250
38,892
Value of workapplied to thisclaim.N/AS 24,000.00S 4,000.00
Value of workassigned to othermining claims.S 24,000.00
00
Bank. Value of workto be distributed at afuture date.
S2.8250
34,892
l.5(a t-
L
1
23456789
101112
13
141516171819202122
122975012297521229753
' 1229754. 1229757
1229761S3/4 Lot 8 Con IV (20432 SWS)
Lot 8 Con III (20432 SWS)S1/2 Lot 7 Con IV (20432 SWS)
Lot 7Con III (20432 SWS)S1 12 tat 3 Con V (577 ANS) "'N1/2 Lot 3 Con IV (618 ANS) -SI/12 of the N1/2 and N1/2 of the SI/2 Lot 2 Con IV (1852 ANS) J
V N1/2 of the N1/2 lot 1 Con IV (584 ANS)
W1/2 of lot 1 Con V (8364 SWS)
122975912297581229766
Column Totals
4444166
97.11129.8964.94127.8764.9564.34
64.74
32.3764
748.21
* 1,186S 593S 4,745S 593S 2,966S 6,525S 3,5593 3,559S 2,373S 3,559S 1,186S 1 .780
S 593
$ 593S 2,966
S 36,778
S 6,400
S 800S 4,800
S 12,000
!p w,OO*7
S 3,5593 2,373S 2,373S 136S
S 12,000
1,186593
4,745593
2,9666,525
000
1,1861,0501,780
593
5932,966
0000000
24,778
Signature of Recorded Holdsi
- do herebv certify that the above work credits are eligible underrized in Writing V-
6. Instructions for cutting back credits that are not approved1. Credits are to be cut back from the bank first, then call for instructions (705) 682-9297).
For Office use only
f- -- - ,-'-t,. ^.- •~' ~
.-^.^-...i ^., it,..
Received Stamp
Deemed Approved Date
Date Approved.,-, r-sr^r..^.:, .-; ;,-.;
Date Notification SentTotal Value of.eredit.ApWPKefl ^ -,\
Approved for Recording by Mining Recorder (Signature) r*

Onta rin Mlnlstry of Northern ^ve,opment.nd Mines
statement of Costs for Assessment Transaction Number (office use)
Personal information collected on this form is obtained under the authority of 6(1) of the Assessment Work Regulation 6/96. Under section 8 of the Mining Act, the information is a public record. This information will be used to review the assessment work and correspond with the mining land holder. Questions about this collection should be directed to the Chief Mining Recorder, Ministry of Northern Development and Mines, 6th Floor, 933 Ramsey Lake Road, Sudbury, Ontario P3E 6B5. s-\
Work Type
Line cutting (Remainder of line cutting claimed under mapping)AMT SurveyAMT Stand-byDraftingReport writing - interpretationSupervision
Units of WorkDepending on the type of work, list the number of hours/days worked, meters of drilling, kilometers
of grid line, number of samples etc.
5.925 KM62 Stations
0 Days
Associated Costs (e.g. supplies, mobilization and demobilization)meals and accommodations
See Laamanen truck rentalTransportation Costs
Food and Lodging Costs
Total cost per Station
Cost Per Unitef*' (' — '
3 300.00S 550.003 750.00
3 14.52
3 593.19Total Value of Assessment Work
' Total Cost
S 1 .777.50S 34,100.00S
900
S 36,778
Calculation of filing Discounts:
1. Work filed within two years of performance is claimed at 100** of the above Total value of Assessment Work.2. If work is filed after two years and up to five years after performance, it can only be claimed at 50*36 of the total Value of Assessment Work. If this situation applies to your claims, use the calculation below:^-^^-——-^^^^^^———^^—^^—^———^——
TOTAL VALUE OF ASSESSMENT WORK x 0.60' Total value of assessment work claimed.
Note:- Work older than 5 years is not eligible for credit.A recorded holder may be required to verify expenditures claimed in this statement of costswithin 45 days of a request for verification and/or corrections/clarification is not made, the Ministermay reject all or part of the assessment work submitted.—————————-^—————-———
Certification verifying costs:
l, fv\o^k.Ha,xX^_____, do hereby certify, that the amounts shown are as accurate as may reasonably be determined and the costs were incurred while conducting assessment work on the lands indicated on the accompanying Declaration of Work form as r\JLAr___ l am authorized to make this certification.
RECEIVEDOCT 1.9 13G3
GEOSCIENCE ASSESSMENT OFFICE

Ministry of Ministers duNorthern Development Developpement du Nordand Mines et des Mines Ontario
Geoscience Assessment Office 933 Ramsey Lake Road
February 29, 2000 6th FloorSudbury, Ontario
Mark Hall P3E 6B5 MINESCAPE EXPLORATION INC.R.R. #2, 129 FIELDING ROAD Telephone: (888) 415-9845 LIVELY, ONTARIO Fax: (877)670-1555 P3Y-1L7
Visit our website at: www.gov.on.ca/MNDM/MINES/LANDS/mlsmnpge.htm
Dear Sir or Madam: Submission Number: 2.19816
Status Subject: Transaction Number(s): W9970.00304 Approval After Notice
We have reviewed your Assessment Work submission with the above noted Transaction Number(s). The attached summary page(s) indicate the results of the review. WE RECOMMEND YOU READ THIS SUMMARY FOR THE DETAILS PERTAINING TO YOUR ASSESSMENT WORK.
If the status for a transaction is a 45 Day Notice, the summary will outline the reasons for the notice, and any steps you can take to remedy deficiencies. The 90-day deemed approval provision, subsection 6(7) of the Assessment Work Regulation, will no longer be in effect for assessment work which has received a 45 Day Notice. Allowable changes to your credit distribution can be made by contacting the Geoscience Assessment Office within this 45 Day period, otherwise assessment credit will be cut back and distributed as outlined in Section #6 of the Declaration of Assessment work form.
Please note any revisions must be submitted in DUPLICATE to the Geoscience Assessment Office, by the response date on the summary.
If you have any questions regarding this correspondence, please contact BRUCE GATES by e-mail at [email protected] or by telephone at (705) 670-5856.
Yours sincerely,
ORIGINAL SIGNED BYBlair KiteSupervisor, Geoscience Assessment OfficeMining Lands Section
Correspondence ID: 14611
Copy for: Assessment Library

Work Report Assessment Results
Submission Number: 2.19816
Date Correspondence Sent: February 29, 2000^^^^—^^—^^——^——-Assessor:BRUCE GATES^^^^^^^^^^^^^^^^^
Transaction First ClaimNumber Number Township(s) l Area(s) Status Approval Date
W9970.00304 1229750 WATERS, GRAHAM Approval After Notice February 21,2000
Section:18 Other OGEOT
The revisions outlined in the Notice dated January 7, 2000 have been corrected. Accordingly, assessment work credit has been approved as outlined on the Declaration of Assessment Work Form accompanying this submission.
Correspondence to: Recorded Holder(s) and/or Agent(s):Resident Geologist Mark HallSudbury, ON MINESCAPE EXPLORATION INC.
LIVELY, ONTARIO Assessment Files Library Sudbury, ON WALLBRIDGE MINING COMPANY LIMITED
LIVELY, ONTARIO
Page: 1Correspondence ID: 14611

IQNF 17*i*i*' • I"*'
' r r 7T7 "TT""™- ' rt' '-'\ ' '- ' ; -TT"V'\y-ft r ™ ' ''! ,. li '' ,' -v" !? v^ . i S \ * - " ^^ J' -f', ^'—"j G", T~ 7 ! 7 M m -' 'V~~~t ^3?n"^\ | .. L__ ( :; Ij.'i 1 . T'..1 /) 1 ' lln ,\ '-riL-pi otfei- * l p p'1-'' -' - ;' "J : "' '--•'-- " J*^~,^\ f i -i- J-^ -rf! -^spixj' f "'S-' '| . .- '. -p'W-ii1^" *V
. . -V-' "; i; "! i ^-i.'
11*11'
Ministry of Ministry ofNatural Northern DevelopmentResources and Mines
Ontario• irm* N*.r*ntir l.ltlf
DATE V ISSUE
MOV t 1
OUtltDYDfFICF
INDEX TO LAND DISPOSITION
rum
G-4052IMMIHP
GRAHAM
H AR. MMMftTMTNE DWHUCT
SUDBURY
SUDBURY
SUDBURY
SYMBOLSBoundary
Townstiip, Meridian, BMeline Road allowance; surveyed . . . . . . . . . . , . . . . . . .
LofConcnvton;
Parcel; surveyedunsurvtyed
Ri jht-of-way. road . . - - . . . . - . . . . . .railway... ....................utility............. ..........
AREAS WITHDRAWN FROM DISPOSTIONM.R.O. - MINING RIGHTS ONLY S.R.O. - SURFACE RIGHTS ONLY M.+S. - MINING AND SURFACE RIGHTS
IMKnptm Order Mo. Date Diipdtnion Hie
(g HND*H AmjCOTON IMMMIMUC UNU *CT
Cliff, Pt, Pil* - - ............................
ContourInterpolated . . . . . . . . . , . . . . . . . . . . . . . . .(kpproxiinata
Depression - - . . . . . . . . . . . , ,
Control point [liorizonUI]
Flooded land .. ............................Mine hMid fr*me - - - - . - . . , . .. .
Pipeline (above ground)- . . . . . . . . . . , , , . . . , . . .
Ralway; single track . .
R6td; highway, County, towuhip-access-- ........... ........ ... .......trail bush - - - - - - - - . ............ ,.....
Shoielitw (ofiijiriali . . . - - - - . . .
Transmission line . . . . . . - - . - . . . . . - . - - . . . . . . .Wooded area .... . .........,. ............
DISPOSITION OF CROWN LANDSPatent
Surface S, Mining Right* - Surface Rights Only-- - Mining Rights Oily,. .
Surface A Mining ftght* ............,......Sutfuce Rights Onlf,. . .. .. . ,Mining Higrtlt Only.
Licence of Occupation-.............. ........
Order-in-CouncilCancelled................. ................
Reseivation . .. - - - - - - .. . .. .SandSGravel ........LANDUStPhKMII
e•d
BS•a A.
~tE MFORMATIOM THATAPPEARS ON THIS IMP HAS BEEN COMPILED FROM VARIOUS SOLHGE3, AND ACCURACY B MOT GUARANTEED. THOSE WISHIN9 TD STAKE MINING CLAIMS SHOULD CONSULT WITH THP UIMNTi RFOTROFR MINISTRY OF MORTHERNDEVELOPMENT AND WiNEa. FOR ADDITIONAL INFORMATION ON THE 3T4TIM OF THELANDS SHOWN HEREQN.
Map ban Md hnd dl^oiltfon dnning by Surwyi init Mippng Bf trtch, MlnWry of Nalunil ROCDUIOM
ThvdicpotHlonof Iwd, kctton o* Wtibrlctnd parMtbounUrlMantilt tnOt* "rt* enmpiXd rw atfm tiMrvt v* purpom erty.
41I06NE2001 2.19816 WATERS200

41I06NE2001 2.19816 WATBSS 210