REDISCOVERING ROOTS
101
REDISCOVERING ROOTS
Transcript of REDISCOVERING ROOTS
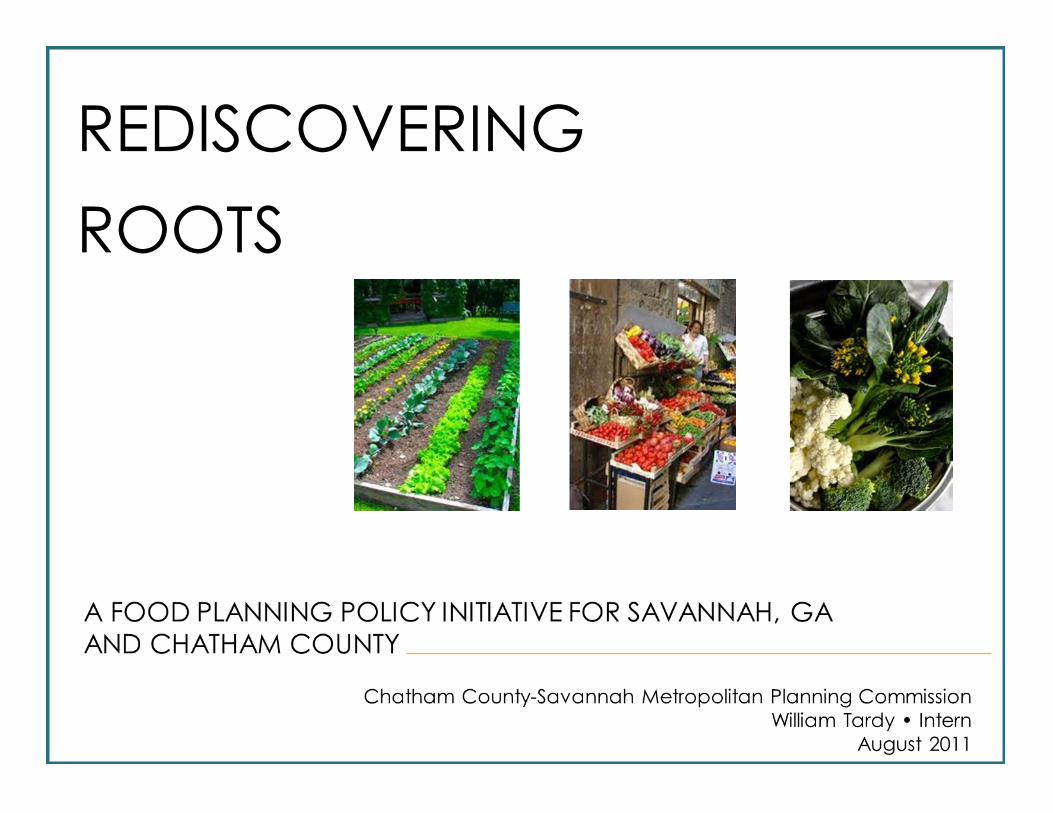
REDISCOVERING
ROOTS
Acknowledgements
Chatham County-Savannah Metropolitan Planning Commission 2 Rediscovering Roots | 2011
I II III IV V
The completion of this report would not have been possible, nor nearly as comprehensive, without the
support of many of Savannah’s institutions and community organizations. As a special recognition, this
projects recognizes the following entities for their cooperative spirit and contributions:
The Harambee House
Healthy Savannah
University of Georgia Agricultural Extension– Chatham County
The Savannah Urban Garden Alliance
Forsyth Farmer’s Market and its Retailers
NLaws Produce
The Savannah Food Council
The Savannah Local Food Collaborative
Ms. Jen Drey
And
The City of Savannah’s Mayor’s Office
Although recognized through recognition of the MPC, this project also extends thanks to all MPC staff
who provide aid throughout the creation of this document
Cover Photo Credits (from left to right): http://www.landscaping-ideas-for-gardening.com; http://t1.gstatic.com/images?
q=tbn:ANd9GcRvcfMZ7c81olzGnqdX6ftJcRh4ecVIM13jFzK5OIVUDoTbPGH; http://www.tastehongkong.com
Table of Contents
Chatham County-Savannah Metropolitan Planning Commission 3 Rediscovering Roots | 2011
I II III IV V
Section I: PRIMER
Executive Summary 4
Vision, Goals, and Objectives 6
Food System Planning Defined 8
Section II: Past and Current Trends in Food Planning
Historical Trends of Food
System Planning in the United States 9
Food System Planning Today and Tomorrow 11
Food System Planning Case Studies 13
Zoning
Vacant Lot Leasing
Food System Policy
Local Food Procurement Policy
Farmer’s Market Regulations
Section III: Food System Planning in Savannah
History of Food Planning in Savannah 18
1734 to 1799: The Oglethorpe Plan
1800 to 1855: Savannah’s Gilded Age
1856 to 1915: The End of the Cotton Kingdom
1916 to 1993: Urban Decay and Suburban Growth
1993 to Present: The Beginning of Conservation
Metro Savannah’s Existing Food System 21
Section IV: Recommendations
Recommendations 29
Implementation Timeline 34
Section V: Reference Materials
Literature Cited 37
Appendix A: Case Study Legislation A1
Appendix B: Case Study Vacant Lot Leases B1
Executive Summary
Chatham County-Savannah Metropolitan Planning Commission 4 Rediscovering Roots | 2011
I II III IV V
Until recently, food system planning has not been within the
purview of urban planners. The global food supply system
largely by-passed urban areas, except in industrial zones where
food processing is not noticeably different from other industrial
processes. The dependence of the food system on fossil fuel
and the failure of markets to address the needs of low-income
families are the primary reasons that urban planners, particular-
ly those charged with comprehensive and long-range plan-
ning, now consider food security as a fundamental responsibil-
ity of the planning profession.
The adverse impacts of the market-based, industrial food sys-
tem fall disproportionally on low-income neighborhoods. Ac-
cess to fresh produce and unprocessed meat, fish and dairy
products is limited in many areas because of cost. A “food de-
sert” is a new term in the planning lexicon and refers to an ar-
ea where primary access to food is by fast-food restaurants,
convenience stores and small grocers stocking processed,
packaged food with an extended shelf life.
In Savannah, food system planning was prominent in James
Oglethorpe’s conception of the colony. The Oglethorpe Plan
includes provisions for livestock on urban squares and garden
plots on the outskirts of the City assigned to every residential
lot. Unlike food system planning in many parts of the country,
where it is an addition to traditional planning, food system
planning in Chatham County is a return to the traditions of the
City.
Rediscovering Roots: A Food System Planning Policy Initiative
for Chatham County and Savannah, Georgia includes a defini-
tion of a food desert and a description of the existing food de-
serts in the City. It contains the following recommendations for
the local governments, businesses, and community organiza-
tions:
Local Government
Establish a vacant lot leasing program
Streamline the process of establishing farmer’s markets
Lobby state legislators to allow a composting program with-
in a municipal landfill by right
Update the City’s and County’s animal control ordinances
Facilitate the establishment of a produce grocer in west
Savannah
Executive Summary
Chatham County-Savannah Metropolitan Planning Commission 5 Rediscovering Roots | 2011
I II III IV V
Local Business
Develop a local agricultural product brand
Develop a local agricultural product processing and distri-
bution system
Community Organizations
Establish a local agriculture database
Create a Guide to Urban Agriculture on a Shoestring
Budget
Create an Eat Local Savannah cookbook
Establish a Farmer’s Market in west Savannah
Each of the above recommendations includes the role of
planning staff in the implementation process.
Implementation Timeline
The recommendations include the establishment of a Govern-
ment Task Force, a Business , Task Force, and a Community Or-
ganization Task Force with specific duties for each and a time-
line indicating completion of tasks within three years.
This column is intentionally blank
Vision, Goals, and Objectives
Chatham County-Savannah Metropolitan Planning Commission 6 Rediscovering Roots | 2011
I II III IV V
Vision: To provide the governmental administration and
leadership needed to ensure that the citizens of
Savannah always have access to the fresh, nutritious,
competitively priced food needed for regular, long term
social development.
Goal: Increase the productivity of agribusiness within Chatham
and surrounding counties
Objective: Coordinate the activities of local food advoca-
cy groups to generate a local agricultural information da-
tabase
Objective: Draft and propose revisions of city policy so as
to….
establish a leasing program for urban farms and
community vegetable gardens on vacant city-
owned lots
permit beekeeping by right within the city limits
increase the maximum of chickens , rabbits, and
ducks allowable by right within the city limits
Objective: Work with Savannah’s representatives in the
Georgia General Assembly to alter state policy so as to es-
tablish a composting center at Savannah’s municipal gar-
bage dump
Goal: Increase the rate at which agricultural commodities
produced in Chatham and surrounding counties are sold within
Chatham County.
Objective: Draft and propose revisions of City policy in or-
der to streamline the process of establishing farmer’s mar-
kets.
Objective: Create and administer a taskforce comprised of
local food distributors, grocers, restaurateurs, and other
food industry businesspersons to discuss, design, and pro-
pose a processing, packaging, and distribution hub for agri-
cultural commodities grown in Chatham and surrounding
counties.
Objective: Create and administer a taskforce of local agri-
cultural producers to discuss, design, and propose a co-
operative branding group for agricultural commodities
grown in Chatham and surrounding counties.
Vision, Goals, and Objectives
Chatham County-Savannah Metropolitan Planning Commission 7 Rediscovering Roots | 2011
I II III IV V
Goal: Increase the rate at which the citizens of Savannah and
Chatham County consume fresh, sustainably produced
agricultural products
Objective: Coordinate the activities of local food advoca-
cy groups, restaurateurs, and other food industry business-
persons to discuss, design, and propose a cookbook em-
phasizing the use of agricultural commodities grown in
Chatham and surrounding counties.
Objective: Create and administer a taskforce of local agri-
cultural producers, food distributors, and administrators
from the Savannah-Chatham County Public School System
to facilitate the incorporation of agricultural commodities
grown in Chatham and surrounding counties into the Sa-
vannah-Chatham County Public School System’s meal pro-
gram.
Goal: Increase the availability of fresh, nutritious food in
Savannah’s low income areas
Objective: Work with the University of Georgia Agricultural
Extension service to develop a guidebook for urban agricul-
tural in low income, inner-city areas.
Objective: Create and administer a taskforce of local food
advocacy groups to discuss, design, and propose a
farmer’s market in west Savannah.
Objective: Create and administer a taskforce of local agri-
cultural producers, food distributors, and community wel-
fare advocates to facilitate the incorporation of agricultural
commodities grown in Chatham and surrounding counties
into the buying schedules of Savannah’s soup kitchens and
shelters.
Objective: Draft and propose revisions of City policy in or-
der to make the establishment of small grocery stores in
west Savannah simpler and more transparent.
Food System Planning Defined
Chatham County-Savannah Metropolitan Planning Commission 8 Rediscovering Roots | 2011
I II III IV V
In simplest terms, food system planning is the process
through which planners and city administrators utilize municipal
resources to support the provision of healthy, nutritious food to
the general public (Pothukuchi & Kaufman 1999; American
Planning Association [APA] 2007). Considered as one of the
most basic public requirements, the impetus for this service is
provided in Sect. 3 Purposes in View, of Standard State Zoning
Enabling Act of 1926 (Department of Commerce 1926):
“Such regulations shall be made in accordance with a
comprehensive plan and designed….to facilitate the
adequate provision of transportation, water, sewage,
schools, parks, and other public requirements.”
Food systems rest upon a wide range of mechanisms;
consequently the planning subjects potentially included there-
in are equally diverse. Some of the most common and perti-
nent of these subjects include community commons and
green-spaces, proximity of commercial zones to residential
neighborhoods (i.e. grocery distribution), transportation infra-
structure for freight, farmer’s market policies, food desert moni-
toring program, small business development, and agricultural
land conservation initiatives (Donald 2008, APA 2007).
References
American Planning Association. (2007) Policy Guide on Community
and Regional Food Planning. Retrieved from http://
www.planning.org/policy/guides/adopted/food.htm
Donald, B. (2008) Food Systems Planning and Sustainable Cities and
Regions: The Role of the Firm in Sustainable Food Capitalism. RE-
GIONAL STUDIES, 42:9, 1251-1262.
Pothhukuchi, K. & Kaufman, J.L. (1999) Placing the food system on
the urban agenda: The role of municipal institutions in food sys-
tems planning. Agriculture and Human Values, 16, 213-224.
United States Department of Commerce. (1926) A Standard State
Zoning Enabling Act Under Which Municipalities may Adopt Zoning
Regulations (Publication No. unknown). Washington, DC: U.S. Gov-
ernmental Printing Office.
Historical Trends of Food System Planning
Chatham County-Savannah Metropolitan Planning Commission 9 Rediscovering Roots | 2011
I II III IV V
Throughout the United States’ various stages of devel-
opment, the breadth of tools and techniques used in food sys-
tem planning changed as dramatically as the communities
they served. In the City of Savannah, and throughout many of
America’s early colonies, food system planning began with the
establishment of agricultural zones within and nearby the city
core (Olmsted 1914, Adams & Ticknor 1842, Morris 1994, Reps
1956, Price 1743). As the industrial revolution encouraged rural-
to-urban migration and the demand for dense, multi-unit hous-
ing increased, these agricultural zones found themselves relo-
cated to the cities’ periphery (Mohl 1985). Following the classi-
cal rural-to-urban transects established by Sir Patrick Geddes
(Hall 2002) and the works of Adam Smith (Smith 1991) this re-
organization eventually led to the compartmentalized food
system we see today: food retail concentrated within commer-
cial zones; food processing relegated to light industrial areas;
and agricultural production (generally considered a nuisance
to the peace of city life) located in the rural areas beyond.
Stretching food systems over states rather than counties,
the divisions of labor established by the industrial revolution
helped realize the dream of a well-coordinated, robust nation-
al food network. Following this increase in scale, however, the
apparent purview of the city planner became less and less
comprehensive. Considering the recent advent of storage
technologies that facilitate global food distribution and in-
creasing levels of vertical organization within the food industry
(Burch & Lawrence 2009), it could indeed be argued that the
inventiveness of the free market has made local oversight
largely unnecessary. Through the repercussions of the urban
renewal and interstate expansion projects of the 1960s and
1970s, however, history reminds us that technology does not
exist in a vacuum, but instead in a pattern of social conflicts
which often require consistent mediation (Hall 2002).
References
Adams, N. & Ticknor, W.D. (1842) Boston Common. Boston: W.D.
Ticknor and H.B. Williams.
Burch, D. & Lawrence, G. (2009) Towards a Third Food Regime:
Behind the Transformation. Agriculture and Human
Values, 26(4), 267-279
Hall, P. (2002) The Cities of Tomorrow: An Intellectual History of Urban
Planning and Design in the Twentieth Century. Hoboken, New Jer-
sey: Wiley-Blackwell, 2002
Mohl, R. A. (1985). The new city: urban America in the Industrial Age,
1860-1920. Arlington Heights, Ill.: H. Davidson
Morris, A.E.J. (1994). A history of urban form: before the industrial
revolutions. 4th ed. Upper Saddle River, New Jersey: Prentice Hall
Historical Trends of Food System Planning
Chatham County-Savannah Metropolitan Planning Commission 10 Rediscovering Roots |
I II III IV V
Olmsted, F.L. (1914) The Town Planning Movement in America.
Housing and Town Planning. The Annals, 51, 172-181
Price, W. A (1743) New Plan of Ye Great Town of Boston in New
England with the Many Additional Buildings & New Streets to the
Year 1743. Retrieved from http://maps.bpl.org/
Reps, J.W. (1956) William Penn and the Planning of Philadelphia.
Town Planning Review, 27(1), 27-39
Smith, A. (1991) Wealth of Nations. Amherst, New York: Prometheus
Books
This column is intentionally blank
Food System Planning Today and Tomorrow
Chatham County-Savannah Metropolitan Planning Commission 11 Rediscovering Roots |
I II III IV V
Efficient, fast, and widespread, modern food system
planning is rightfully considered a great success. For most
Americans, it provides inexpensive, consistent, and nutritious
food regardless of local climate or agricultural productivity.
However, even with this success there are those for whom the
current free market system does not provide adequate service.
These communities, commonly referred to as food deserts, are
typically found in the core of America’s older cities, have very
low household income, and are often communities of color
(Economic Research Service [ERS] 2009). In these settings, pro-
longed periods of social disinvestment led to the closing of all
major grocery stores. As a result, persons living in these areas
experience drastically reduced access to all forms of food, but
most particularly to fresh produce. To ameliorate this growing
crisis in urban hunger and malnutrition, planners and food equi-
ty advocates from around the country are arguing for and de-
veloping government interventions (APA 2007). As they relate
to the planning process, these interventions typically call for
commercial development incentives (e.g. reduced parking
requirements, streamlined permitting processes, tax abate-
ment, etc…), small business grants, and public urban agricul-
ture programs (Newcombe 2011, Halloran 2010, Gray 2010).
In addition to the issue of equitable grocery access, the
modern food system is also troubled by its energy-intensive de-
sign. Through all of its stages, and particularly in production
and transportation, the modern food system consumes vast
amounts of fossil fuels. As the global demand for energy in-
creases, many planners, governmental officials, academics,
and food advocates worry that this reliance will lead to pro-
portionate rises in food costs (Trostle 2008), and a food security
crisis for the disadvantaged (Diouf & Severino 2007). To address
this concern, planners, consumers, and domestic agricultural
producers have pointed to a need to preserve the remaining
agricultural lands around most American cities. The rationale
for these agricultural conservation programs is to provide sup-
plemental supply with reduced shipping costs and to absorb
some of the underutilized urban labor pool (Smith & Giraud
2006). The tools used to enact the nation’s various preservation
proposals include green belts, Transfer of Development Rights
(TDR) banks, community commons, agricultural education pro-
grams, farmer’s markets, and agricultural land trusts (Smith &
Giraud 2006, Moreland & Mark 2009).
For both of the aforementioned development obsta-
cles (the existence of food deserts and excessive energy con-
sumption in the food system), the scale of interest is national, if
not global. However, food systems are incredibly complex and
Food System Planning Today and Tomorrow
Chatham County-Savannah Metropolitan Planning Commission 12 Rediscovering Roots |
I II III IV V
nuanced entities. Even with the standardization intrinsic to the
modern model, local environmental and cultural factors re-
main capable of effecting large amounts of variability. To ac-
commodate this heterogeneity, communities engaged in food
system planning must therefore examine not just their current
conditions, but also their historic patterns of development.
References
American Planning Association. (2007) Policy Guide on Community
and Regional Food Planning. Retrieved from
http://www.planning.org/policy/guides/adopted/food.htm
Diouf, J. & Severino, J.M. (2007) Rising Prices. International Herald
Tribune, 7
Economic Research Service, United States Department of Agriculture.
(2009) Access to Affordable and Nutritious Food: Measuring and
Understanding Food Deserts and their Consequence. Retrieved
from http://www.ers.usda.gov/Publications/
Gray, T (2010) From Farm to Food Desert. Chicago Reader,39(48),
12-15
Halloran, A. (2010) Out of the Food Desert. Metroland Albany, 33(43),
20-21
Moreland, F. & Mark, S. (2009) Regenerating Regional Food Systems.
Making Waves, 20( 2), 6-10
Newcombe, T. (2011) Taking on Food Deserts. Governing, 24(8), 23
Smith, M.D. & Giraud, D. (2006) Traditional land-use planning regula-
tion and agricultural land conservation: A case study from the
USA. Planning Practice and Research, 21(4), 407-421.
Trostle, R. (2008) Fluctuating Food Commodity Prices. Amber Waves,6
(5), 11-16
Food System Planning Case Studies
Chatham County-Savannah Metropolitan Planning Commission 13 Rediscovering Roots |
I II III IV V
In response to the existing inequalities and perceived
risks associated with the modern food system, many communi-
ties have re-established food system planning as a major com-
ponent of their municipal planning agenda. Given planning’s
continued focus on Euclidean zoning districts, many of the
items included in these emerging food system planning pro-
grams focus on how best to integrate urban agricultural activi-
ties and informal produce retail centers into existing patterns of
land use. Examples of initiatives which fall into this category are
discussed under the Zoning and Farmer’s Market Regulations
subheadings (below).
In addition to the issue of compliance and integration,
the issue of increasing production capacity is also common. To
meet this concern within city limits, many municipalities have
begun to repurpose idle and abandoned parcels as centers
for urban agriculture. To facilitate sector growth outside of the
city, some communities have adopted procurement ordinanc-
es which require public agencies to purchase a set proportion
of the products they consume from local agricultural produc-
ers. These to subjects are discussed under the Vacant Lot Leas-
ing Programs and Local Food Procurement Initiatives subhead-
ings (below).
Even with these well-targeted initiatives, the complexity
of food systems can be overwhelming. To manage this com-
plexity, those communities most dedicated to addressing food
access and food security issues turn to comprehensive food
system planning. Describing virtually every step in the modern
food system represents the apex of food planning, and is dis-
cussed under the Food System Planning subheading (below).
For communities which still possess some agricultural
lands within their sphere of influence, agricultural land conserv-
ancies should be examined as a possible solution. However,
few agricultural remnants remain in Chatham County. As a
consequence, the subject of conservation programs are not
addressed in this document.
Zoning
Philadelphia
Within the upcoming draft of Philadelphia’s zoning
code, both community gardens and for-profit urban
farms are permitted in a collection of residential and
non-residential zones. Animal husbandry is likewise per-
mitted in some industrial zones. The manner in which the
permitting will occur for these uses is not yet clear. For
Food System Planning Case Studies
Chatham County-Savannah Metropolitan Planning Commission 14 Rediscovering Roots |
I II III IV V
more information visit:
www.zoningmatters.org
www.phila2035.org
Cleveland
In October of 2010, Cleveland’s City Council amended
the zoning ordinance to permit urban farms in residential
zones by right. Along with the allowance came the right
to install chain link fencing and to establish market
stands (as long as the goods being sold came directly
from the site on which the stand is located). A copy of
this amendment is included in the Case Study Legisla-
tion Appendix. In addition to the farms provision, poultry,
livestock, and bees are also permitted in some residen-
tial and non-residential zones. For more information visit:
http://planning.city.cleveland.oh.us/zoning/
cpc.php
Charlotte, NC
In a number of zones (including single-family residential,
commercial, and institutional land use zones), the Char-
lotte Zoning Ordinance permits by right the operation of
farms and the sale of goods produced on the premises.
However, no specific language guiding the manage-
ment of livestock, poultry, or bees within the city limits is
provided. To read more, visit:
http://charmeck.org/city/charlotte/planning/
Rezoning/Pages/ZoningOrdinance.aspx
Vacant Lot Leasing
Cleveland
Through the Cleveland Landbank of Ohio, land can be
leased for interim use for community gardens at a nomi-
nal annual fee. To establish permanent use, buildable
lots can be purchased by community organizations and
churches for $100. To read more, visit:
http://www.city.cleveland.oh.us/
CityofCleveland/Home/Government/
CityAgencies/CommunityDevelopment/
LandBank
http://reimaginingcleveland.org
Jersey City, New Jersey
On May 2011, Jersey City kicked off its Adopt-a-Lot pro-
gram. Designed to establish gardens as short-term uses,
this program includes training from the City and Universi-
ty of Rutgers. The fee required for maintaining a site is
minimal. A copy of the amended ordinance which per-
Food System Planning Case Studies
Chatham County-Savannah Metropolitan Planning Commission 15 Rediscovering Roots |
I II III IV V
mits the leasing program is provided in the Case Study
Legislation Appendix. In addition, a copy of the lease
use by the City of Jersey is also included in this report in
the Case Study Lease Appendix. For more information,
contact:
• Division of City Planning
Department of Housing, Economic
Development and Commerce
City of Jersey City, Phone: (247)-547-5010
Minneapolis
Part of the Homegrown Minneapolis food system plan-
ning agenda, the vacant lot leasing program in Minne-
apolis is unique in the country. Rather than utilizing all
vacant lots, the Minneapolis leasing program uses only
those lots which have been deemed permanently un-
buildable. As such, the agricultural uses they accommo-
date are considered long term uses rather than stop
gap measure in the midst of a development lull. A copy
of the prelease application form is included in the Case
Study Lease Appendix. For more information, visit:
http://www.ci.minneapolis.mn.us/dhfs/
homegrown-home.asp
Food System Policy
Vancouver
Perhaps more so than any municipality in North Ameri-
ca, the City of Vancouver has aggressively and com-
prehensively developed a system of food policy docu-
ments. The process of developing these documents be-
gan in July, 2003 when a food policy task force was ap-
pointed by the Vancouver City Council (Hodgson,
Campbell & Bailkey 2011). Only 5 months later, the Van-
couver City Council approved the Food Action Plan de-
veloped by the food policy task force. The results, which
have accumulated since this adoption, are too numer-
ous to be included in this review. For more information
visit:
http://vancouver.ca/commsvcs/
socialplanning/initiatives/foodpolicy/tools/
links.htm
Minneapolis
Although not a true regional food plan, the Urban Agri-
culture Policy Plan is a comprehensive review of existing
conditions and policy recommendations closely akin to
those found in a full food plan. Issues reviewed in the
Food System Planning Case Studies
Chatham County-Savannah Metropolitan Planning Commission 16 Rediscovering Roots |
I II III IV V
plan include, but are not limited to, land zoning oppor-
tunities, economic development strategies, and land
availability surveys. The entirety of the plan is available
at:
http://www.ci.minneapolis.mn.us/cped/
urban_ag_plan.asp
References
Hodgson, K., Campbell, M.C. & Bailkey, M. (2011) Urban Agriculture:
Growing Healthy, Sustainable Places. Chicago, American
Planning Association Publications
Local Food Procurement Policy
Toronto
In 2008, the Government Management Committee
(GMC) for the City of Toronto was a recommendation
for a local food procurement policy from the acting
deputy city manager and the general manager of chil-
dren services. In 2009, the GMC adopted the recom-
mendation. The components of this recommendation
include an implementation timeline for increasing the
amount of food purchased by the city from local
sources, an explanation of what is to be considered lo-
cal, and budgetary allotments for local food purchasing
programs for children’s services. A copy of this recom-
mendation and a copy of Toronto’s 1975 Food Charter
are included in the Case Study Legislation Appendix. For
more information visit:
http://www.toronto.ca/health/tfpc_index.htm
Farmer’s Market Regulations
Chicago
Chapter 4-12 of the City of Chicago’s Municipal Code is
entirely devoted to the subject of farmer’s markets. Sub-
jects therein include permitted and prohibited items, as-
signment of space, and permitting. For more information
visit:
http://www.amlegal.com/nxt/gateway.dll/
Illinois/chicago_il/municipalcodeofchicago?
f=templates$fn=default.htm$3.0
$vid=amlegal:chicago_il
Philadelphia
In Section 9-213 of the Philadelphia Administrative Code
precise guidelines for the operation of a farmer’s market
are provided. Topics in this section include, but are not
limited to licensure, permissible locations, and sanitation.
Food System Planning Case Studies
Chatham County-Savannah Metropolitan Planning Commission 17 Rediscovering Roots |
I II III IV V
For more information visit:
http://www.amlegal.com/nxt/gateway.dll/
Pennsylvania/philadelphia_pa/
thephiladelphiacode?fn=altmain-
nf.htm$f=templates$3.0&vid=amlegal:philadelp
hia_pa
History of Food System Planning in Savannah
Chatham County-Savannah Metropolitan Planning Commission 18 Rediscovering Roots |
I II III IV V
1734 to 1799: The Oglethorpe Plan
Like many of the country’s colonial-era settlements, Sa-
vannah’s formal food system planning began with European
settlement. Captured in the detail of the 1734 Oglethorpe Plan,
the original system design emphasized a closed production-
consumption loop. The principle elements of this plan included
a 3-acre garden plot in the city common and a 45 acre farm
site outside the city wall for each of the 40 families that consti-
tuted the original encampment (Lanes 2001). Together these
allotments comprise approximately 1900 acres of land set
aside for agricultural production. In addition, each of Savan-
nah’s original six squares (Ellis, Johnson, Reynolds, Oglethorpe,
Wright, and St. James) provided common green space for
commerce and the tending of livestock. Although not as a re-
sult of direct municipal direction, over time each of these
squares developed their own personality and application.
Within the purview of food systems, the transformation of Ellis
Square into Savannah’s principle market is perhaps the most
important of these evolutions (Lanes 2001).
Although much of the sustenance needed by Savan-
nah’s original European settlers likely came from their terrestrial
farms, the breadth of products created therein represent only
part of the city’s original food system. Through service as a
trade corridor and a fishery, the other role in the system is un-
doubtedly filled by the Savannah River. Regrettably, in the ab-
sence of market ledgers or shipping manifests, precise esti-
mates of the Savannah River’s impact are difficult to make.
With respects to anecdotal evidence, however, one need only
examine the common role shrimp, crab, oysters, and other
forms of seafood play in Savannah’s traditional fare to know
that the river’s bounty was a significant and celebrated food
source.
1800 to 1856: Savannah’s Gilded Age
In keeping with what was truly a global phenomenon,
Savannah expanded as industrialization’s commerce spurred
rural-to-urban migration. Through 1856, much of this expansion
occurred in keeping with Oglethorpe’s pattern of grids and
public squares (Lanes 2001). Occurring principally to the west
and to the south of the original settlement, this urban expan-
sion, although uniform, did consume much of the City Com-
mons and the garden lots it contained (Lanes 2001). When
qualifying the prudence of these developments, it is important
to note that, although Savannah began with a strong planning
History of Food System Planning in Savannah
Chatham County-Savannah Metropolitan Planning Commission 19 Rediscovering Roots |
I II III IV V
agenda, the national trend during the 19th and most of the 20th
century was to allow the real estate market to drive develop-
ment (Fishman 1982). The loss of key elements of Savannah’s
historic food system was not the result of poor city planning,
per se, but was instead the result of the abandonment of plan-
ning altogether.
1857 to 1915: The End of the Cotton Kingdom
Except for a brief four-year hiatus during the Civil War
(1861-1865), Savannah operated as the principal shipping hub
for the southern cotton industry throughout this period. While
this era of immense wealth undoubtedly spurred urban devel-
opment, very few comprehensive historical records exist. There-
fore, it is difficult to estimate the quantity of goods produced
and consumed in and around Savannah. Given the lack of for-
mal planning efforts, however, it can be assumed that whatev-
er changes did occurred were governed by Savannah’s real
estate market rather than an organized, formal planning doc-
trine. Subsequently, it is reasonable to assume that no formal
efforts were made to prevent the development and conver-
sion of agricultural lands. Slowly but surely, this pattern of con-
version led Savannah’s population to become more and more
reliant on food sources from outside the area.
1916 to 1993: Urban Decay and Suburban Growth
In 1915, suffering under the strain of oversupply and the
pestilence of the boll weevil, cotton production in the United
States collapsed. Without its primary export and commodity,
Savannah’s port and general economic health likewise en-
tered a period of drastic decline (Lane 2001). In downtown
Savannah, where the wealth of the cotton trade maintained
numerous elaborate homes and businesses, the impact of this
decline was particularly visible7. Wishing to escape the newly
vacant districts, many of Savannah’s remaining middle class
residents relocated to the suburban communities on the out-
skirts of the city. Although records illustrating the exact direc-
tion and timeline of this relocation are not available, the ab-
rupt cessation of the grid road system at DeRenne Avenue sug-
gests that neighborhoods south of DeRenne were built during
the post-WWII housing boom.
Although the power to zone and make plans was intro-
duced in 1957, up until 1993 no comprehensive planning exist-
ed in Savannah. Consequently, the bulk of development oc-
curring during this period marked a continued reliance on the
History of Food System Planning in Savannah
Chatham County-Savannah Metropolitan Planning Commission 20 Rediscovering Roots |
I II III IV V
local market as the primary guide to development. Given the
popularity of Euclidean zoning through most of this period (i.e.
1957-1993) and the lack of formal oversight, it is reasonable to
assume that existing agricultural land uses retreated before the
urban expansion.
1993 to Present: The Beginning of Conservation
In 1993, the first comprehensive plan for the City of Sa-
vannah and Chatham County was adopted. The focus of this
document was economic development, housing, natural re-
source conservation, and historic building preservation. Alt-
hough none of the materials in these sections specifically ad-
dressed food system planning, collectively they do provide the
comprehensive scope on which food system planning efforts
can be formed. Although none of the materials in these sec-
tions specifically addressed food system planning, collectively
they do provide an insight into the status of food system plan-
ning efforts in Savannah and Chatham County: by 1993, no
agricultural areas remained within Savannah’s city limits or Chatham
County (Chatham County-Savannah Metropolitan Planning
Commission 1993).
References
Lanes, M. (2001) Savannah Revisited: History and Architecture.5th Ed.
Savannah, GA: Bee Hive Press
Fishman, Robert (1982) Urban Utopias in the Twentieth Century.
Cambridge, Massachusetts: The MIT Press
Chatham County- Savannah Metropolitan Planning Commission.
(1993) The Comprehensive Plan for Savannah, GA, Volume 8: Land
Use Element. Savannah, Georgia: Internal publication
Metro Savannah’s Existing Food System
Chatham County-Savannah Metropolitan Planning Commission 21 Rediscovering Roots |
I II III IV V
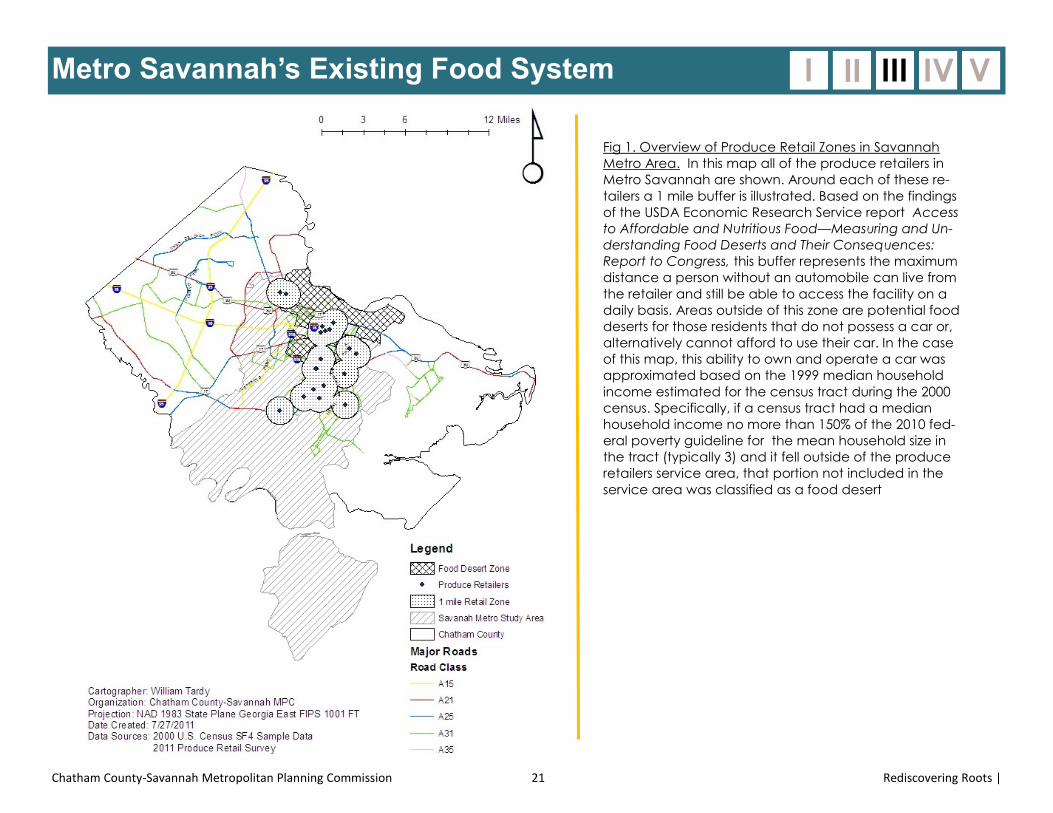
Fig 1. Overview of Produce Retail Zones in Savannah
Metro Area. In this map all of the produce retailers in
Metro Savannah are shown. Around each of these re-
tailers a 1 mile buffer is illustrated. Based on the findings
of the USDA Economic Research Service report Access
to Affordable and Nutritious Food—Measuring and Un-
derstanding Food Deserts and Their Consequences:
Report to Congress, this buffer represents the maximum
distance a person without an automobile can live from
the retailer and still be able to access the facility on a
daily basis. Areas outside of this zone are potential food
deserts for those residents that do not possess a car or,
alternatively cannot afford to use their car. In the case
of this map, this ability to own and operate a car was
approximated based on the 1999 median household
income estimated for the census tract during the 2000
census. Specifically, if a census tract had a median
household income no more than 150% of the 2010 fed-
eral poverty guideline for the mean household size in
the tract (typically 3) and it fell outside of the produce
retailers service area, that portion not included in the
service area was classified as a food desert
Metro Savannah’s Existing Food System
Chatham County-Savannah Metropolitan Planning Commission 22 Rediscovering Roots |
I II III IV V
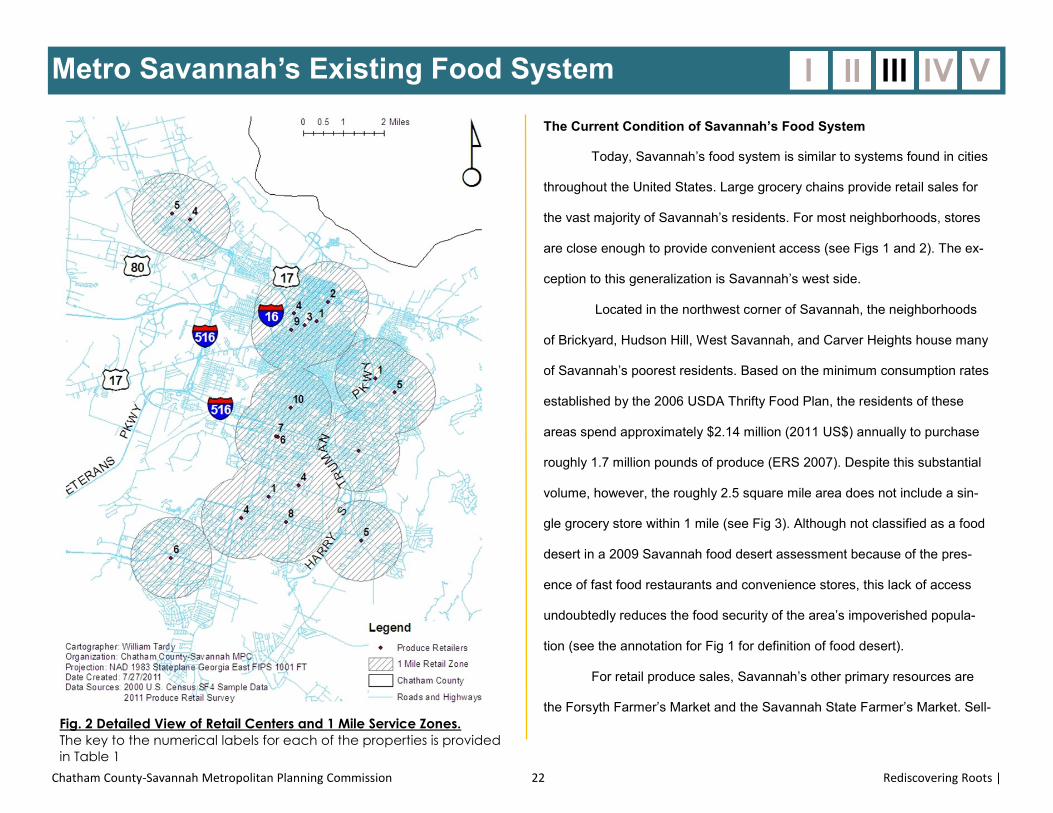
Fig. 2 Detailed View of Retail Centers and 1 Mile Service Zones.
The key to the numerical labels for each of the properties is provided
in Table 1
The Current Condition of Savannah’s Food System
Today, Savannah’s food system is similar to systems found in cities
throughout the United States. Large grocery chains provide retail sales for
the vast majority of Savannah’s residents. For most neighborhoods, stores
are close enough to provide convenient access (see Figs 1 and 2). The ex-
ception to this generalization is Savannah’s west side.
Located in the northwest corner of Savannah, the neighborhoods
of Brickyard, Hudson Hill, West Savannah, and Carver Heights house many
of Savannah’s poorest residents. Based on the minimum consumption rates
established by the 2006 USDA Thrifty Food Plan, the residents of these
areas spend approximately $2.14 million (2011 US$) annually to purchase
roughly 1.7 million pounds of produce (ERS 2007). Despite this substantial
volume, however, the roughly 2.5 square mile area does not include a sin-
gle grocery store within 1 mile (see Fig 3). Although not classified as a food
desert in a 2009 Savannah food desert assessment because of the pres-
ence of fast food restaurants and convenience stores, this lack of access
undoubtedly reduces the food security of the area’s impoverished popula-
tion (see the annotation for Fig 1 for definition of food desert).
For retail produce sales, Savannah’s other primary resources are
the Forsyth Farmer’s Market and the Savannah State Farmer’s Market. Sell-
Metro Savannah’s Existing Food System
Chatham County-Savannah Metropolitan Planning Commission 23 Rediscovering Roots |
I II III IV V
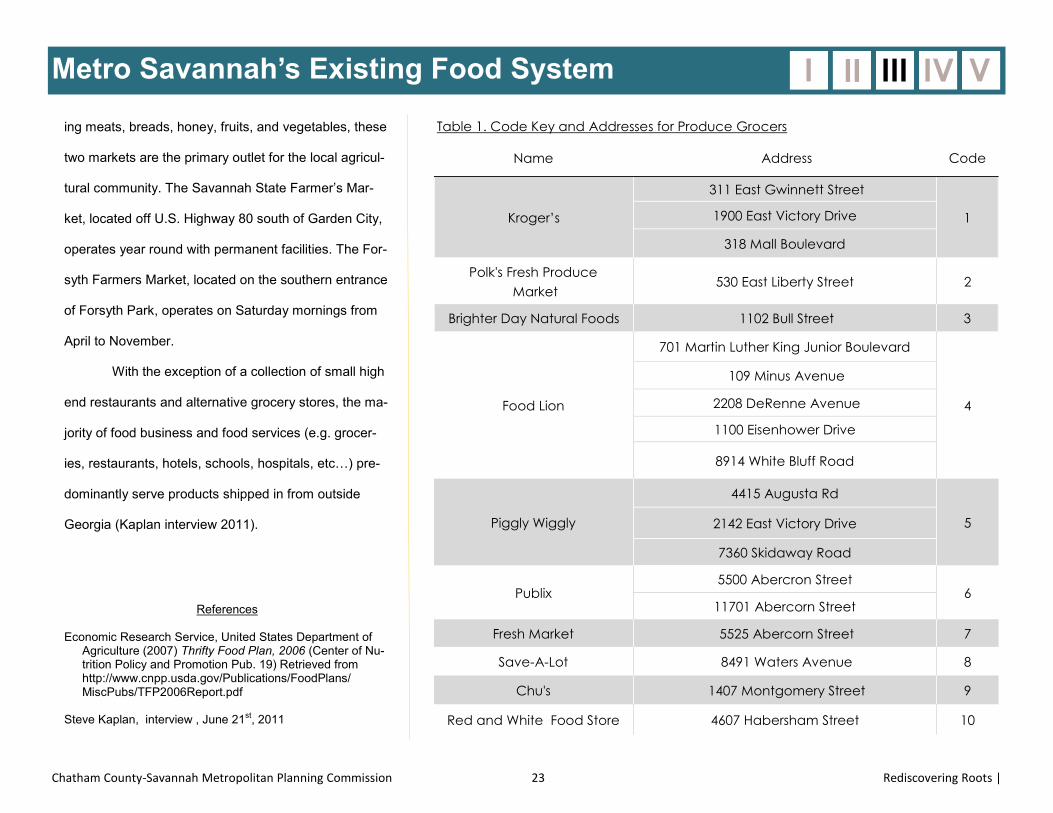
Name Address Code
Kroger’s
311 East Gwinnett Street
1 1900 East Victory Drive
318 Mall Boulevard
Polk's Fresh Produce
Market 530 East Liberty Street 2
Brighter Day Natural Foods 1102 Bull Street 3
Food Lion
701 Martin Luther King Junior Boulevard
4
109 Minus Avenue
2208 DeRenne Avenue
1100 Eisenhower Drive
8914 White Bluff Road
Piggly Wiggly
4415 Augusta Rd
5 2142 East Victory Drive
7360 Skidaway Road
Publix 5500 Abercron Street
6 11701 Abercorn Street
Fresh Market 5525 Abercorn Street 7
Save-A-Lot 8491 Waters Avenue 8
Chu's 1407 Montgomery Street 9
Red and White Food Store 4607 Habersham Street 10
Table 1. Code Key and Addresses for Produce Grocers ing meats, breads, honey, fruits, and vegetables, these
two markets are the primary outlet for the local agricul-
tural community. The Savannah State Farmer’s Mar-
ket, located off U.S. Highway 80 south of Garden City,
operates year round with permanent facilities. The For-
syth Farmers Market, located on the southern entrance
of Forsyth Park, operates on Saturday mornings from
April to November.
With the exception of a collection of small high
end restaurants and alternative grocery stores, the ma-
jority of food business and food services (e.g. grocer-
ies, restaurants, hotels, schools, hospitals, etc…) pre-
dominantly serve products shipped in from outside
Georgia (Kaplan interview 2011).
References Economic Research Service, United States Department of
Agriculture (2007) Thrifty Food Plan, 2006 (Center of Nu-trition Policy and Promotion Pub. 19) Retrieved from http://www.cnpp.usda.gov/Publications/FoodPlans/MiscPubs/TFP2006Report.pdf
Steve Kaplan, interview , June 21st, 2011
Metro Savannah’s Existing Food System
Chatham County-Savannah Metropolitan Planning Commission 24 Rediscovering Roots |
I II III IV V
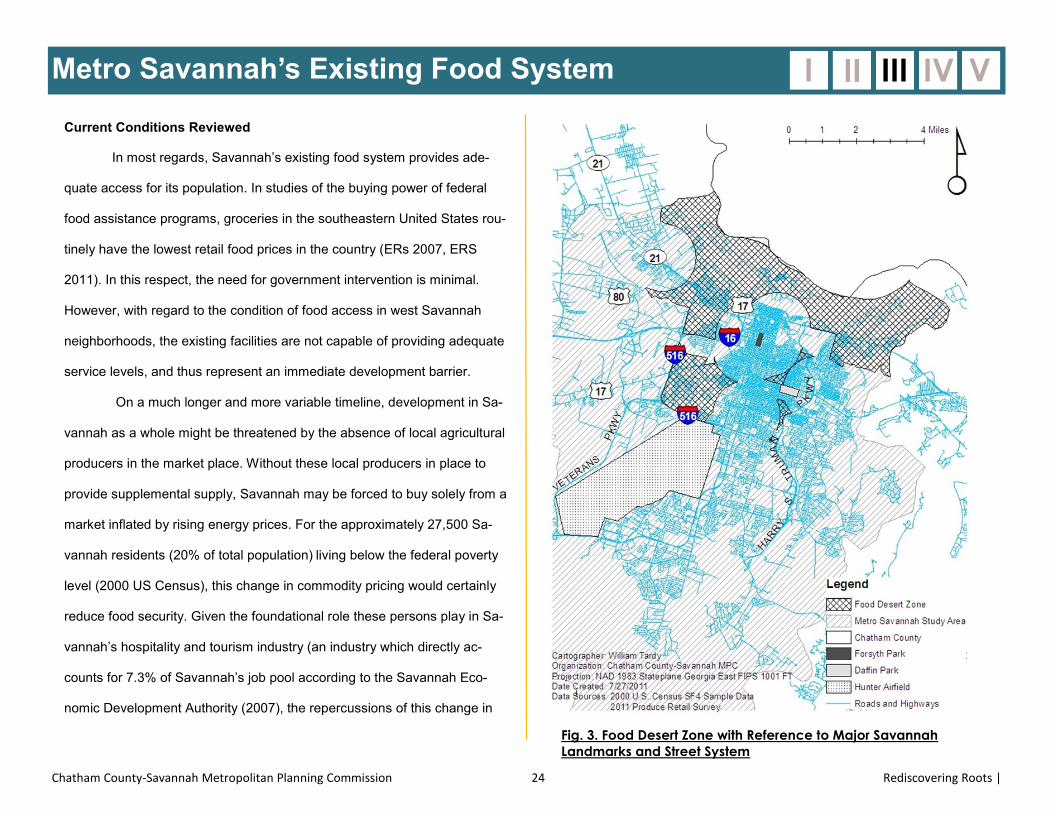
Fig. 3. Food Desert Zone with Reference to Major Savannah
Landmarks and Street System
Current Conditions Reviewed
In most regards, Savannah’s existing food system provides ade-
quate access for its population. In studies of the buying power of federal
food assistance programs, groceries in the southeastern United States rou-
tinely have the lowest retail food prices in the country (ERs 2007, ERS
2011). In this respect, the need for government intervention is minimal.
However, with regard to the condition of food access in west Savannah
neighborhoods, the existing facilities are not capable of providing adequate
service levels, and thus represent an immediate development barrier.
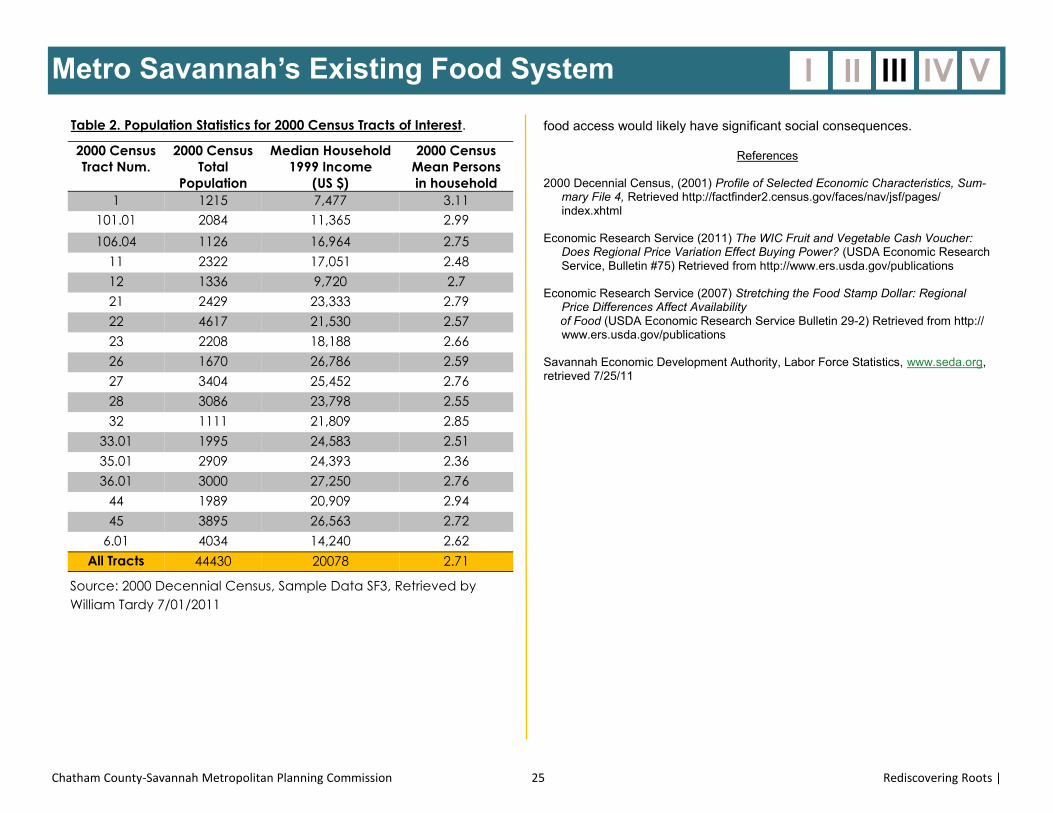
On a much longer and more variable timeline, development in Sa-
vannah as a whole might be threatened by the absence of local agricultural
producers in the market place. Without these local producers in place to
provide supplemental supply, Savannah may be forced to buy solely from a
market inflated by rising energy prices. For the approximately 27,500 Sa-
vannah residents (20% of total population) living below the federal poverty
level (2000 US Census), this change in commodity pricing would certainly
reduce food security. Given the foundational role these persons play in Sa-
vannah’s hospitality and tourism industry (an industry which directly ac-
counts for 7.3% of Savannah’s job pool according to the Savannah Eco-
nomic Development Authority (2007), the repercussions of this change in
Metro Savannah’s Existing Food System
Chatham County-Savannah Metropolitan Planning Commission 25 Rediscovering Roots |
I II III IV V
2000 Census
Tract Num.
2000 Census
Total
Population
Median Household
1999 Income
(US $)
2000 Census
Mean Persons
in household
1 1215 7,477 3.11
101.01 2084 11,365 2.99
106.04 1126 16,964 2.75
11 2322 17,051 2.48
12 1336 9,720 2.7
21 2429 23,333 2.79
22 4617 21,530 2.57
23 2208 18,188 2.66
26 1670 26,786 2.59
27 3404 25,452 2.76
28 3086 23,798 2.55
32 1111 21,809 2.85
33.01 1995 24,583 2.51
35.01 2909 24,393 2.36
36.01 3000 27,250 2.76
44 1989 20,909 2.94
45 3895 26,563 2.72
6.01 4034 14,240 2.62
All Tracts 44430 20078 2.71
Table 2. Population Statistics for 2000 Census Tracts of Interest.
Source: 2000 Decennial Census, Sample Data SF3, Retrieved by
William Tardy 7/01/2011
food access would likely have significant social consequences.
References
2000 Decennial Census, (2001) Profile of Selected Economic Characteristics, Sum-mary File 4, Retrieved http://factfinder2.census.gov/faces/nav/jsf/pages/index.xhtml
Economic Research Service (2011) The WIC Fruit and Vegetable Cash Voucher:
Does Regional Price Variation Effect Buying Power? (USDA Economic Research Service, Bulletin #75) Retrieved from http://www.ers.usda.gov/publications
Economic Research Service (2007) Stretching the Food Stamp Dollar: Regional
Price Differences Affect Availability of Food (USDA Economic Research Service Bulletin 29-2) Retrieved from http://
www.ers.usda.gov/publications Savannah Economic Development Authority, Labor Force Statistics, www.seda.org, retrieved 7/25/11
Metro Savannah’s Existing Food System
Chatham County-Savannah Metropolitan Planning Commission 26 Rediscovering Roots |
I II III IV V
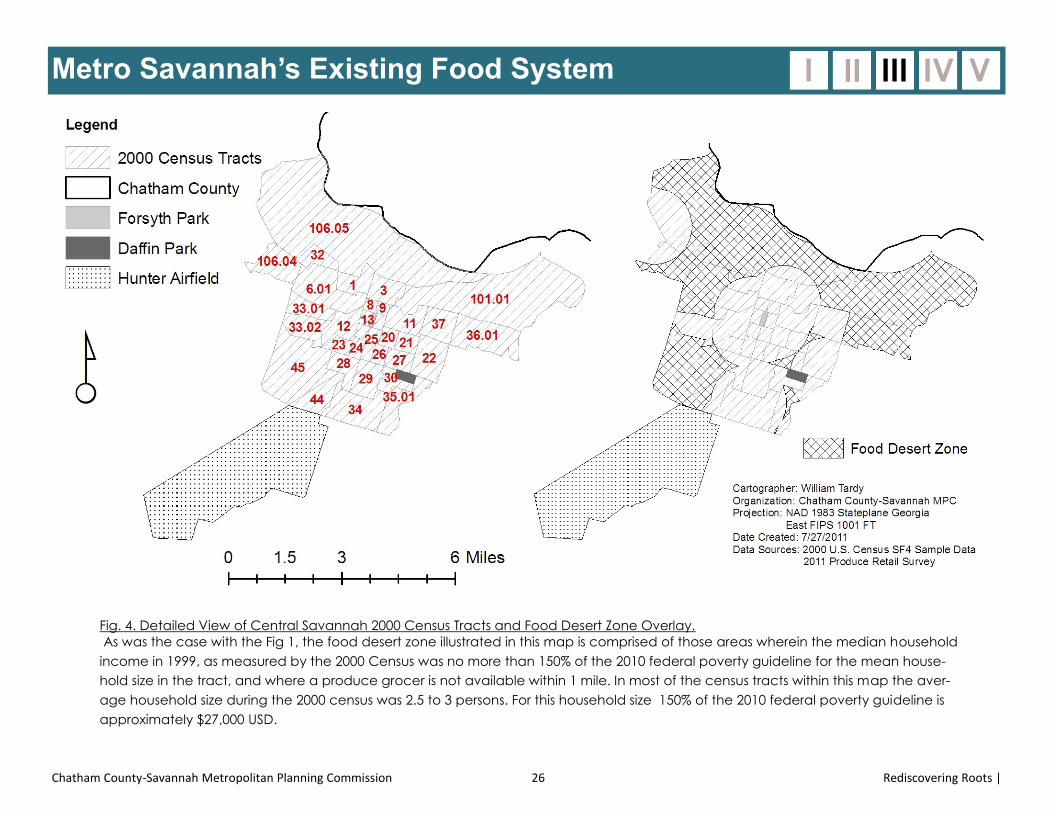
Fig. 4. Detailed View of Central Savannah 2000 Census Tracts and Food Desert Zone Overlay.
As was the case with the Fig 1, the food desert zone illustrated in this map is comprised of those areas wherein the median household
income in 1999, as measured by the 2000 Census was no more than 150% of the 2010 federal poverty guideline for the mean house-
hold size in the tract, and where a produce grocer is not available within 1 mile. In most of the census tracts within this map the aver-
age household size during the 2000 census was 2.5 to 3 persons. For this household size 150% of the 2010 federal poverty guideline is
approximately $27,000 USD.
Metro Savannah’s Existing Food System
Chatham County-Savannah Metropolitan Planning Commission 27 Rediscovering Roots |
I II III IV V
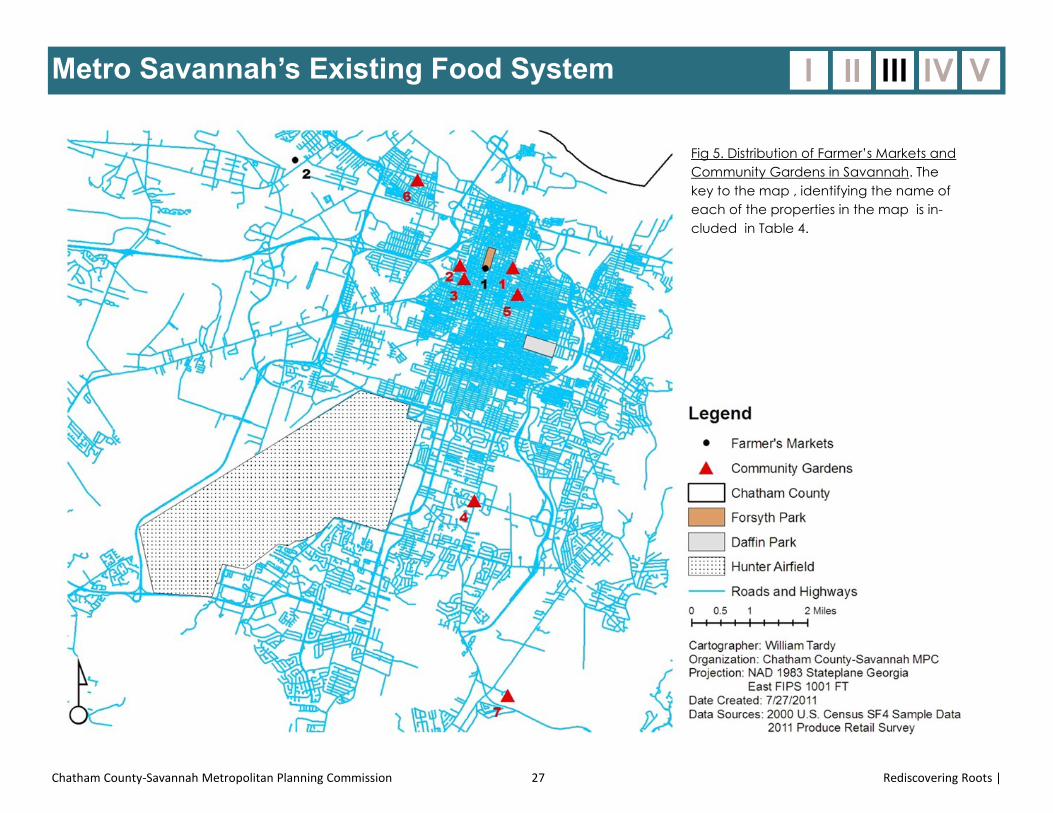
Fig 5. Distribution of Farmer’s Markets and
Community Gardens in Savannah. The
key to the map , identifying the name of
each of the properties in the map is in-
cluded in Table 4.
Metro Savannah’s Existing Food System
Chatham County-Savannah Metropolitan Planning Commission 28 Rediscovering Roots |
I II III IV V
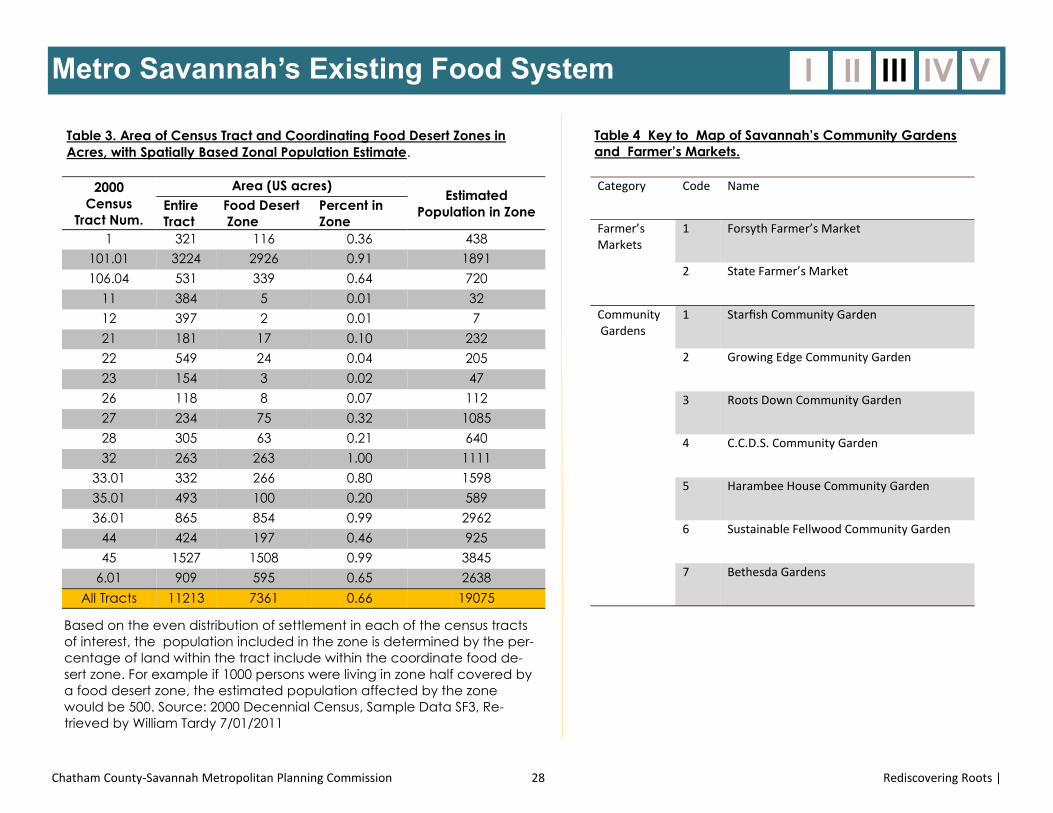
Table 3. Area of Census Tract and Coordinating Food Desert Zones in
Acres, with Spatially Based Zonal Population Estimate.
2000
Census
Tract Num.
Area (US acres) Estimated
Population in Zone Entire
Tract
Food Desert
Zone
Percent in
Zone
1 321 116 0.36 438
101.01 3224 2926 0.91 1891
106.04 531 339 0.64 720
11 384 5 0.01 32
12 397 2 0.01 7
21 181 17 0.10 232
22 549 24 0.04 205
23 154 3 0.02 47
26 118 8 0.07 112
27 234 75 0.32 1085
28 305 63 0.21 640
32 263 263 1.00 1111
33.01 332 266 0.80 1598
35.01 493 100 0.20 589
36.01 865 854 0.99 2962
44 424 197 0.46 925
45 1527 1508 0.99 3845
6.01 909 595 0.65 2638
All Tracts 11213 7361 0.66 19075
Based on the even distribution of settlement in each of the census tracts
of interest, the population included in the zone is determined by the per-
centage of land within the tract include within the coordinate food de-
sert zone. For example if 1000 persons were living in zone half covered by
a food desert zone, the estimated population affected by the zone
would be 500. Source: 2000 Decennial Census, Sample Data SF3, Re-
trieved by William Tardy 7/01/2011
Category Code Name
Farmer’s Markets
1 Forsyth Farmer’s Market
2 State Farmer’s Market
Community Gardens
1 Starfish Community Garden
2 Growing Edge Community Garden
3 Roots Down Community Garden
4 C.C.D.S. Community Garden
5 Harambee House Community Garden
6 Sustainable Fellwood Community Garden
7 Bethesda Gardens
Table 4 Key to Map of Savannah’s Community Gardens
and Farmer’s Markets.
Recommendations
Chatham County-Savannah Metropolitan Planning Commission 29 Rediscovering Roots |
I II III IV V
Thanks to the robust modern food system, the City of
Savannah need only make minor adjustments to its current
food policy in order to maintain the health and vitality. As
shown in the Case Studies of this report, these adjustments are
not rare, unexplored ventures, but instead are adaptations oc-
curring in many parts of the country. In moving forward with its
initiatives, Savannah may use these sister programs as tem-
plates to be adapted to its local character and needs. To pro-
vide a jumping off point for this process of adoption and adap-
tation, the remainder of this section includes a series of recom-
mended projects or initiatives.
Each of the recommendations is categorized based on
the body which will likely complete the action. These bodies
include Chatham County, the City of Savannah, local business
interests, and community organizations. For each of these or-
ganizations, the Metropolitan Planning Commission staff (which
serves the City of Savannah and unincorporated Chatham
County, the two largest jurisdictions in the County containing
84 percent of the population), is considered as a mediator,
researcher, and administrative resource. Explanations of how
these roles will play are provided through descriptions of pro-
ject implementation.
Chatham County and the City of Savannah
Project: Establish a Vacant Lot Leasing Program
Synopsis: Currently the City of Savannah maintains approxi-
mately 118 acres of vacant lots. On an annual basis, these
lots create financial burdens in the form of mowing costs
and refuse removal. To alleviate these costs, the city
should adopt a vacant lot leasing, or Adopt-a-Lot, pro-
gram. Designed specifically to establish community gar-
dens and urban farms, these lots would serve as both
sources of fresh produce in low income communities, as
well as incubators for urban farming enterprises. Included
in the appendix are two leases used by in other areas in
the country.
MPC Role: To collect data concerning the distribution and
nature of the vacant lots owned by the City; work with the
City’s real estate department and district attorney’s office
to establish an appropriate leasing program; identify com-
munity organizations capable of responsibly entering into a
lease agreement.
Recommendations
Chatham County-Savannah Metropolitan Planning Commission 30 Rediscovering Roots |
I II III IV V
Project: Streamline the Process of Establishing Farmer’s
Markets
Synopsis: Requiring very little capital, the founding of a
Farmer’s Markets is one of the fastest and simplest ways of
increasing the availability of fresh produce in underserved
communities. To capitalize on this strength, the City of Sa-
vannah should create a standardized guide explaining the
requirements of establishing a farmer’s market. Once fin-
ished, this guide should be distributed digitally to major
community groups throughout Savannah.
MPC Role: To cooperate with other City officials in deter-
mining the regulatory barriers and requirements associated
with farmer’s markets; author the sections of the guide asso-
ciated with zoning requirements.
Project: Lobby State Legislators to Allow the Creation of a
Composting Program within a Municipal Landfill by Right
Synopsis: In order for urban and local agriculture to be
maintained, large supplies of composted materials must be
available. Within the region, private business interests exist
to produce and distribute compost without government
subsidy, provided that high ground (i.e. developable land)
can be provided. Because high ground is in short supply
and expensive, landfills are the best location for effective
composting operations. To take advantage of this interest
and provide a basic agricultural service, however, the city
must advocate that large scale composting be permissible
by right (Permit-by rule) on municipal landfills.
MPC Role: work with the department of public works and
department of sanitation to determine the environmental
risks associated with large scale composting activities.
Project: Update the City’s and County’s animal control
ordinances
Synopsis: Developed during a period when the keeping of
livestock within the city was to be eliminated, the current
animal control ordinances are out of date and place un-
necessary burdens on those interested in developing urban
agricultural systems. Key issues for revision include poultry
management and beekeeping.
MPC Role: To cooperate and, if desired, lead the process of
analyzing existent policies, drafting revised versions, and
conducting public review.
Recommendations
Chatham County-Savannah Metropolitan Planning Commission 31 Rediscovering Roots |
I II III IV V
Project: Facilitate the Establishment of a Produce Grocery in
west Savannah
Synopsis: In terms of both human resources and infrastruc-
ture, much value exists in west Savannah. For the City’s
economic future and civic identity, it is critical that these
resources are utilized. By employing existing business devel-
opment programs managed by the Savannah Economic
Development Authority, the City can assure that the food
resources needed to utilize west Savannah’s resources are
available. Particular focuses for this effort should include the
opening of a fresh produce grocery in the neighborhoods
of West Savannah and Hudson Hills, and business develop-
ment programs like the Georgia Minority Business Develop-
ment Center, the Savannah Regional Small Business Devel-
opment Fund, and the Office of Minority Business Develop-
ment.
MPC Role: Identify areas in West Savannah and Hudson Hills
where commercial development and the opening of a pro-
duce retailer would be most appropriate; identify commu-
nity organizations capable of partnering with the City of Sa-
vannah to identify possible private business interests.
Business Community
Project: Develop Local Agricultural Product Brand
Synopsis: For the American consumer, the identity of the
products she buys is of great importance. This truth is made
evident by the great deal of time and money food busi-
nesses spend on brand development. Despite this wide in-
vestment in branding, however, local agricultural producers
rarely pursue the issue. The common explanation for this
shortcoming is a lack of familiarity with the demands of
markets and insufficient funds. By coming together to es-
tablish a cooperative brand identity, however, agricultural
producers from Chatham and surrounding counties can
overcome these development barriers and strengthen their
place in the market. Primary activities in this project should
include the creation of a branding committee, logo and
marketing campaign design, and the establishment of min-
imum quality standards
MPC Role: Provide administrative and research support for
the private businesses engaged in the process.
Recommendations
Chatham County-Savannah Metropolitan Planning Commission 32 Rediscovering Roots |
I II III IV V
Project: :Develop Local Agricultural Product Processing and
Distribution System
Synopsis: Under public pressure to support the local econo-
my, many large institutions, like the Savannah-Chatham
County Public School System , are creating local produce
buying programs. To participate in these programs, howev-
er, agricultural producers from Chatham and surrounding
counties must find means to provide large volumes of pro-
duce of a uniform quality. To meet this challenge, these
producers should establish a cooperative bargaining
group. With a united face, this body would be capable of
not only representing a large collection of independent
producers in institutional purchasing requests, but also of
establishing joint processing and distribution facilities capa-
ble of increasing the availability of their goods for smaller
commercial consumers, like restaurants, shelters, and nurs-
ing homes.
MPC Role: Provide administrative and research support for
the cooperative of private businesses engaged in the pro-
cess; help identify sections of the City where the opening of
a distribution would be most in keeping with Savannah’s
long development goals.
Community Organizations
Project: Establish a Local Agriculture Database
Synopsis: In order for Savannah’s citizens to collectively work
to solve local food access issues, it is essential that they are
well aware of all of the various activities going on, and how
resources have been allocated in the past. To ensure that
this awareness exists, local community organizations and
food advocates should establish an online information
clearing house and events board.
MPC Role: Provide administrative and research support for
the community organization sengaged in the project; iden-
tify those organizations and individuals most likely to be in-
terested in participating
Project: Create a Guide to Urban Agriculture on a Shoestring
Budget
Synopsis: Despite the long history of agriculture in Georgia
and the low country, many of Savannah’s residents are un-
aware of the benefits of small scale vegetable and fruit
gardening. As a solution to this general unfamiliarity, Savan-
nah’s community organizations should work with the UGA
Agricultural Extension to create a how-to urban agricultural
Recommendations
Chatham County-Savannah Metropolitan Planning Commission 33 Rediscovering Roots |
I II III IV V
guide for low income persons
MPC Role: Provide administrative and research support for
the community organizations engaged in the project; iden-
tify those organizations and individuals most likely to be in-
terested in participating
Project: Create an “Eat Local Savannah” cookbook
Synopsis: For the generations of Americans who experi-
enced the Great Depression and the supply shortages of
World War II, the cooking and preparing of meals from the
backyard garden was a common and familiar task. In the
Savannah of today, however, the increased availability
and low cost of fresh produce has eroded the cultural
knowledge possessed by earlier communities. As a conse-
quence, even in a setting where fresh produce was abun-
dant many households no longer understand how best to
prepare them. To overcome this obstacle, community or-
ganizations in Savannah need to recruit local chefs, gro-
cers, and everyday cooks to contribute a cookbook dedi-
cated to the food products most endemic to Chatham
and surrounding counties.
MPC Role: Provide administrative and research support for
the community organizations engaged in the project; iden-
tify those organizations and individuals most likely to be in-
terested in participating
Project: Establish a West Savannah Farmer’s Market
Synopsis: Using the standardized guide created by the City,
Savannah’s food advocacy community should organize a
farmer’s market in west Savannah. Activities in this process
will include identifying interested producers, applying for
grant or other funding to establish the market, conducting
a marketing campaign to attract local residents unfamiliar
with the benefits and products of farmer’s markets.
MPC Role: Provide administrative and research support for
the community organizations engaged in the project; iden-
tify those organizations and individuals most likely to be in-
terested in participating; Identify those sites which are most
appropriate to the opening of a farmer’s market
Implementation Timeline
Chatham County-Savannah Metropolitan Planning Commission 34 Rediscovering Roots |
I II III IV V
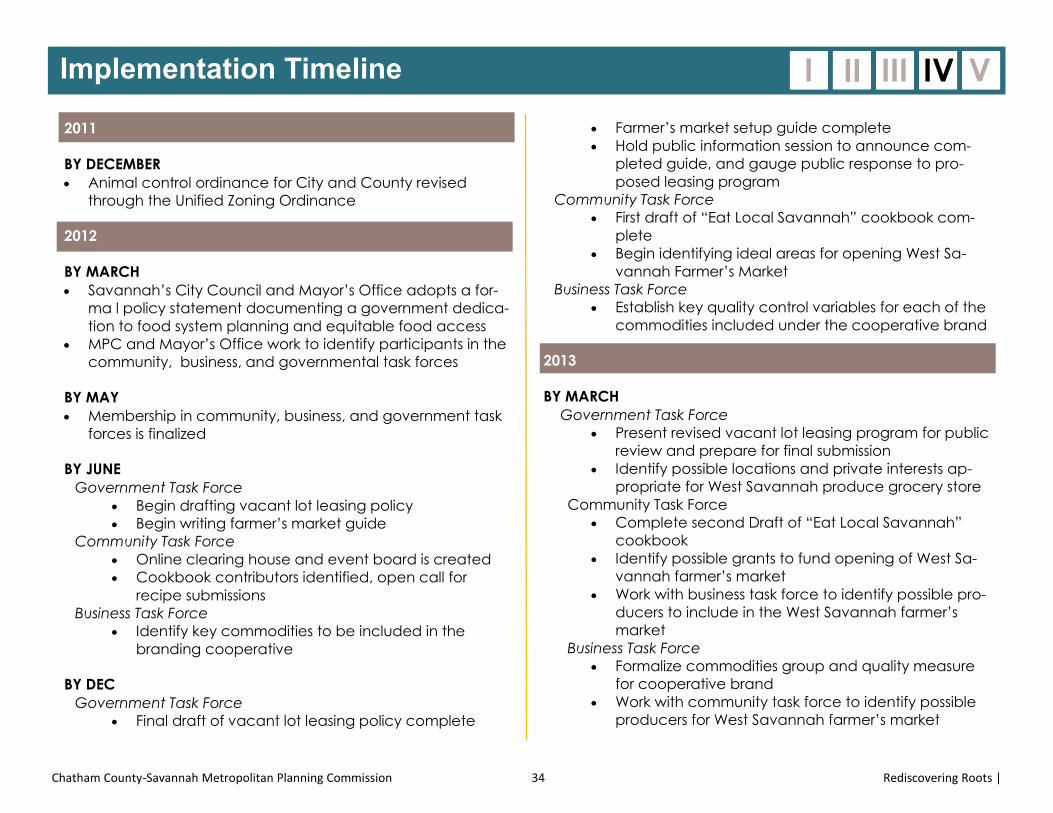
2011
BY DECEMBER
Animal control ordinance for City and County revised
through the Unified Zoning Ordinance
2012
BY MARCH
Savannah’s City Council and Mayor’s Office adopts a for-
ma l policy statement documenting a government dedica-
tion to food system planning and equitable food access
MPC and Mayor’s Office work to identify participants in the
community, business, and governmental task forces
BY MAY
Membership in community, business, and government task
forces is finalized
BY JUNE
Government Task Force
Begin drafting vacant lot leasing policy
Begin writing farmer’s market guide
Community Task Force
Online clearing house and event board is created
Cookbook contributors identified, open call for
recipe submissions
Business Task Force
Identify key commodities to be included in the
branding cooperative
BY DEC
Government Task Force
Final draft of vacant lot leasing policy complete
Farmer’s market setup guide complete
Hold public information session to announce com-
pleted guide, and gauge public response to pro-
posed leasing program
Community Task Force
First draft of “Eat Local Savannah” cookbook com-
plete
Begin identifying ideal areas for opening West Sa-
vannah Farmer’s Market
Business Task Force
Establish key quality control variables for each of the
commodities included under the cooperative brand
2013
BY MARCH
Government Task Force
Present revised vacant lot leasing program for public
review and prepare for final submission
Identify possible locations and private interests ap-
propriate for West Savannah produce grocery store
Community Task Force
Complete second Draft of “Eat Local Savannah”
cookbook
Identify possible grants to fund opening of West Sa-
vannah farmer’s market
Work with business task force to identify possible pro-
ducers to include in the West Savannah farmer’s
market
Business Task Force
Formalize commodities group and quality measure
for cooperative brand
Work with community task force to identify possible
producers for West Savannah farmer’s market
Implementation Timeline
Chatham County-Savannah Metropolitan Planning Commission 35 Rediscovering Roots |
I II III IV V
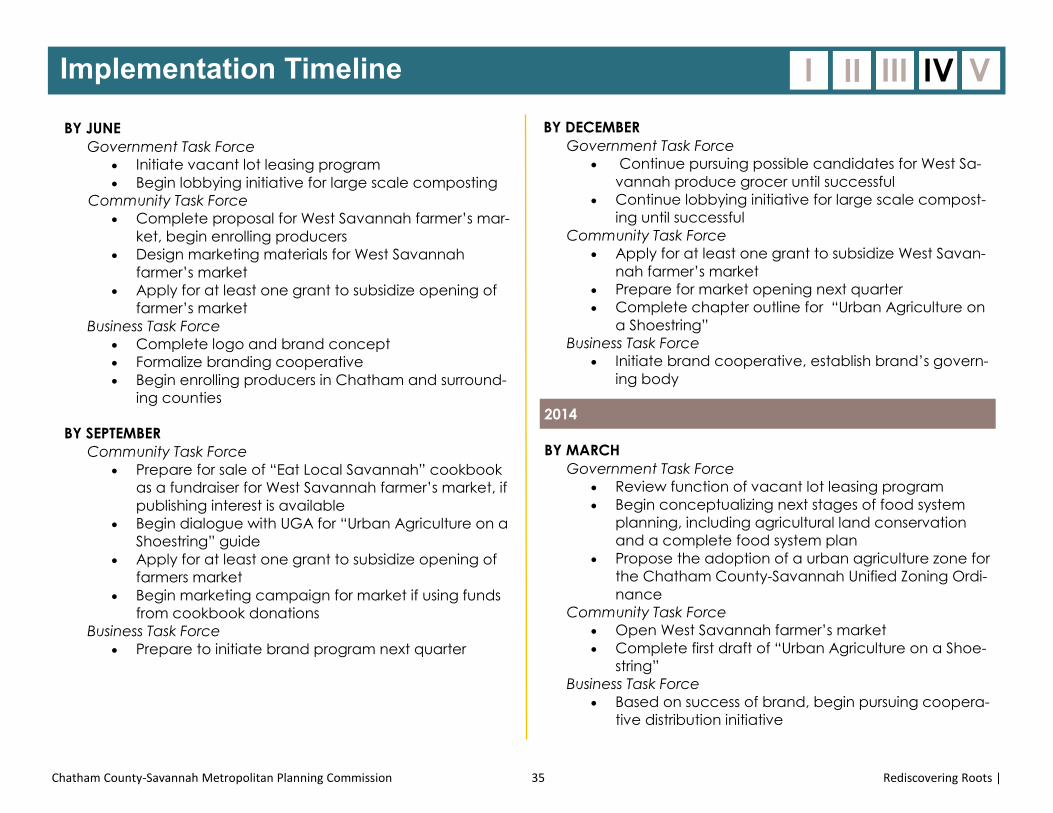
BY JUNE
Government Task Force
Initiate vacant lot leasing program
Begin lobbying initiative for large scale composting
Community Task Force
Complete proposal for West Savannah farmer’s mar-
ket, begin enrolling producers
Design marketing materials for West Savannah
farmer’s market
Apply for at least one grant to subsidize opening of
farmer’s market
Business Task Force
Complete logo and brand concept
Formalize branding cooperative
Begin enrolling producers in Chatham and surround-
ing counties
BY SEPTEMBER
Community Task Force
Prepare for sale of “Eat Local Savannah” cookbook
as a fundraiser for West Savannah farmer’s market, if
publishing interest is available
Begin dialogue with UGA for “Urban Agriculture on a
Shoestring” guide
Apply for at least one grant to subsidize opening of
farmers market
Begin marketing campaign for market if using funds
from cookbook donations
Business Task Force
Prepare to initiate brand program next quarter
BY DECEMBER
Government Task Force
Continue pursuing possible candidates for West Sa-
vannah produce grocer until successful
Continue lobbying initiative for large scale compost-
ing until successful
Community Task Force
Apply for at least one grant to subsidize West Savan-
nah farmer’s market
Prepare for market opening next quarter
Complete chapter outline for “Urban Agriculture on
a Shoestring”
Business Task Force
Initiate brand cooperative, establish brand’s govern-
ing body
2014
BY MARCH
Government Task Force
Review function of vacant lot leasing program
Begin conceptualizing next stages of food system
planning, including agricultural land conservation
and a complete food system plan
Propose the adoption of a urban agriculture zone for
the Chatham County-Savannah Unified Zoning Ordi-
nance
Community Task Force
Open West Savannah farmer’s market
Complete first draft of “Urban Agriculture on a Shoe-
string”
Business Task Force
Based on success of brand, begin pursuing coopera-
tive distribution initiative
Implementation Timeline
Chatham County-Savannah Metropolitan Planning Commission 36 Rediscovering Roots |
I II III IV V
BY JUNE
Community Task Force
Complete second draft of “Urban Agriculture on a
Shoestring”
BY SEPTEMBER
Community Task Force
Complete final draft of “Urban Agriculture on a
Shoestring”
Identify grants to fund guide distribution
BY DECEMBER
Community Task Force
Release online version of “Urban Agriculture on a
Shoestring”
Pursue physical publishing options
This column is intentionally blank
Literature Cited
Chatham County-Savannah Metropolitan Planning Commission 37 Rediscovering Roots |
I II III IV V
LITERATURE CITED
2000 Decennial Census, (2001) Profile of Selected Economic
Characteristics, Summary File 4, Retrieved http://
factfinder2.census.gov/faces/nav/jsf/pages/index.xhtml
Adams, N. & Ticknor, W.D. (1842) Boston Common. Boston: W.D.
Ticknor and H.B. Williams.
American Planning Association. (2007) Policy Guide on Community
and Regional Food Planning. Retrieved from http://
www.planning.org/policy/guides/adopted/food.htm
Burch, D. & Lawrence, G. (2009) Towards a Third Food Regime:
Behind the Transformation. Agriculture and Human Values, 26(4),
267-279
Diouf, J. & Severino, J.M. (2007) Rising Prices. International Herald
Tribune, 7
Donald, B. (2008) Food Systems Planning and Sustainable Cities and
Regions: The Role of the Firm in Sustainable Food Capitalism. RE-
GIONAL STUDIES, 42:9, 1251-1262.
Economic Research Service, United States Department of Agriculture.
(2009) Access to Affordable and Nutritious Food: Measuring and
Understanding Food Deserts and their Consequence. Retrieved
from http://www.ers.usda.gov/Publications/
Fishman, Robert (1982) Urban Utopias in the Twentieth Century.
Cambridge, Massachusetts: The MIT Press
Gray, T (2010) From Farm to Food Desert. Chicago Reader,39(48),
12-15
Hall, P. (2002) The Cities of Tomorrow: An Intellectual History of Urban
Planning and Design in the Twentieth Century. Hoboken, New Jer-
sey: Wiley-Blackwell, 2002
Halloran, A. (2010) Out of the Food Desert. Metroland Albany, 33(43),
20-21
Lanes, M. (2001) Savannah Revisited: History and Architecture.5th Ed.
Savannah, GA: Bee Hive Press
Mohl, R. A. (1985). The new city: urban America in the Industrial Age,
1860-1920. Arlington Heights, Ill.: H. Davidson
Moreland, F. & Mark, S. (2009) Regenerating Regional Food Systems.
Making Waves, 20( 2), 6-10
Morris, A.E.J. (1994). A history of urban form: before the industrial
revolutions. 4th ed. Upper Saddle River, New Jersey: Prentice Hall
Newcombe, T. (2011) Taking on Food Deserts. Governing, 24(8), 23
Olmsted, F.L. (1914) The Town Planning Movement in America.
Housing and Town Planning. The Annals, 51, 172-181
Pothhukuchi, K. & Kaufman, J.L. (1999) Placing the food system on
the urban agenda: The role of municipal institutions in food
systems planning. Agriculture and Human Values, 16, 213-224.
Price, W. A (1743) New Plan of Ye Great Town of Boston in New
England with the Many Additional Buildings & New Streets to the
Year 1743. Retrieved from http://maps.bpl.org/
Reps, J.W. (1956) William Penn and the Planning of Philadelphia.
Town Planning Review, 27(1), 27-39
Smith, A. (1991) Wealth of Nations. Amherst, New York: Prometheus
Books
Literature Cited
Chatham County-Savannah Metropolitan Planning Commission 38 Rediscovering Roots |
I II III IV V
United States Department of Commerce. (1926) A Standard State
Zoning Enabling Act Under Which Municipalities may Adopt Zon-
ing Regulations (Publication No. unknown). Washington, DC: U.S.
Governmental Printing Office.
Smith, M.D. & Giraud, D. (2006) Traditional land-use planning regula-
tion and agricultural land conservation: A case study from the
USA. Planning Practice and Research, 21(4), 407-421.
Trostle, R. (2008) Fluctuating Food Commodity Prices. Amber Waves,6
(5), 11-16
Chatham County- Savannah Metropolitan Planning Commission.
(1993) The Comprehensive Plan for Savannah, GA, Volume 8:
Land Use Element. Savannah, Georgia: Internal publication
Economic Research Service, United States Department of Agriculture
(2007) Thrifty Food Plan, 2006 (Center of Nutrition Policy and Pro-
motion Pub. 19) Retrieved from http://www.cnpp.usda.gov/
Publications/FoodPlans/MiscPubs/TFP2006Report.pdf
Steve Kaplan, interview , June 21st, 2011
Economic Research Service (2011) The WIC Fruit and Vegetable
Cash Voucher: Does Regional Price Variation Effect Buying Pow-
er? (USDA Economic Research Service, Bulletin #75) Retrieved
from http://www.ers.usda.gov/publications
Economic Research Service (2007) Stretching the Food Stamp Dollar:
Regional Price Differences Affect Availability
of Food (USDA Economic Research Service Bulletin 29-2) Retrieved
from http://www.ers.usda.gov/publications
Savannah Economic Development Authority, Labor Force Statistics,
www.seda.org, retrieved 7/25/11
Appendix A: Case Study Legislation
This column is intentionally blank
TABLE OF CONTENTS
City of Cleveland Zoning Code Update A2
City of Toronto Local Food Procurement Policy A6
City of Toronto Food Charter A38
City of Jersey City, New Jersey Vacant Lot Leasing
Ordinance A42
I II III IV V
Chatham County-Savannah Metropolitan Planning Commission A1 Rediscovering Roots | 2011
Appendix A: Case Study Legislation
City of Cleveland Zoning Code Update
I II III IV V
Chatham County-Savannah Metropolitan Planning Commission A2 Rediscovering Roots | 2011
1
City of Cleveland
Zoning Code Update
Effective Date: November 3, 2010
AGRICULTURE IN RESIDENTIAL DISTRICTS
Section 337.02 One-Family Districts In a One-Family District, the following buildings and uses and their accessory buildings and uses are permitted:
(a) Dwelling houses, each occupied by not more than one family and not more than two roomers or boarders.
(b) Playgrounds, parks.
(c) The extension of existing cemeteries.
(d) Railroad rights of way, not including switching, storage or freight yards or industrial sidings. (e) Agricultural uses, subject to the regulations of Section 337.25 and Section 347.02. (f) The following buildings and uses, if located not less than fifteen feet from any adjoining premises in a Residence District not used for a similar purpose:
(1) Churches and other places of worship, but not including funeral chapels or mortuary chapels.
(2) Telephone exchanges and static transformer stations, provided there is no public business office or any storage yard or storage building operated in connection therewith.
(3) Bus turn-around and layover areas operated by a public transit agency provided that no buildings other than a passenger shelter and restroom are located at each site, and provided, further, that any layover space accommodates no more than two buses. (g) The following buildings and uses, if approved by the Board of Zoning Appeals after public
notice and public hearing, and if adequate yard spaces and other safeguards to preserve the character of the neighborhood are provided, and if in the judgment of the Board such buildings and uses are appropriately located and designed and will meet a community need without adversely affecting the neighborhood:
(1) A temporary or permanent use of a building by a nonprofit organization for a
dormitory, fraternity or sorority house, for the accommodation of those enrolled in or employed by an educational institution permitted in the District.
(2) Fire stations, police stations.
2
(3) he following buildings and uses, if located not less than thirty feet from any adjoining premises in a Residence District not used for a similar purpose, and subject to the review and approval of the Board of Zoning Appeals as stated above;
A. Public libraries or museums, and public or private schools or colleges including accessory laboratories, provided such private schools or colleges are not conducted as a gainful business.
B. Recreation or community center buildings, parish houses and grounds for games and sports, except those of which a chief activity is one customarily carried on primarily for gain.
C. Day nurseries, kindergartens.
D. Hospitals, sanitariums, nursing, rest or convalescent homes, not primarily for contagious diseases nor for the care of drug or liquor patients, nor for the care of the insane or developmentally disabled.
E. Orphanages.
F. Homes for the aged or similar homes.
G. Charitable institutions not for correctional purposes. (4) The following buildings and uses, if located not less than fifty feet from adjoining
premises in a Residence District not used for a similar purpose, and subject to the review and approval of the Board of Zoning Appeals as stated above.
A. Municipal recreation buildings.
B. Municipal swimming pools. (5) Crematories in existing cemeteries, provided they are not less than 300 feet from
any boundary that abuts a Residence District, and subject to the review and approval of the Board of Zoning Appeals as stated above.
Section 337.23 Accessory Uses in Residence Districts (a) Permitted Accessory Uses. The following accessory uses and buildings are permitted in a
Residence District. Such permitted accessory buildings shall be located on the rear half of the lot, a minimum of eighteen inches from all property lines and at least ten feet from any main building on an adjoining lot in a Residence District. Accessory buildings shall not occupy more than forty percent (40%) of the area of the required rear yard and, in the case of a corner lot, shall be located back of any required setback or specific building line. For side street yard regulations consult Sections 357.05 to 357.07.
(1) Within a main building, the office of a surgeon, physician, clergyman, architect,
engineer, attorney or similar professional person residing in such main building and employing in the office not more than one nonresident office or laboratory assistant.
(2) Customary home occupation for gain carried on in the main building or in a rear building accessory thereto and requiring only customary home equipment; provided that no nonresident help is employed for that purpose, no trading in merchandise is carried on and no
3
personal physical service is performed and, in a Limited One-Family District or in a One-Family District, no sign or other outward evidence of the occupation is displayed on the premises.
(3) Agricultural uses, subject to the regulations of Section 337.25 and Section 347.02 regarding the keeping of farm animals.
(4) Private incinerators for the burning of refuse and garbage produced on the same premises, provided that the construction is such as to assure immediate and complete combustion and freedom from offensive smoke, ash, unburned particles and odors, and a permit therefor is granted by the Commissioner of Environment.
(5) Fences and walls, as regulated in Chapter 358.
(6) Garages and parking spaces for the occupants of the premises and, when the premises are used for other than residence purposes, for their employees, patrons and guests.
A. In a Dwelling House District the floor area of a private garage erected as an accessory building shall not exceed 650 square feet unless the lot area exceeds 4,800 square feet in which event the floor area may be increased in the ratio of one square foot for each twelve square feet of additional lot area.
B. In Multi-Family Districts, garages and parking spaces erected or established as accessory uses shall be subject to the restrictions specified in Sections 343.19 to 343.21 and Chapter 349. (7) Garage Sale or other Residential Property Sales, as defined in Section
676B.01(a), as long as they conform to the provisions in Chapter 676B.
(8) Signs permitted in accordance with the requirements of Chapter 350.
(9) Any other accessory use customarily incident to a use authorized in a Residence District except that no use prohibited in a Local Retail Business District shall be permitted as an accessory use. (b) Accessory Building Erected Prior to Erection of Main Building. An accessory building may
be erected prior to the construction of the main building only if:
(1) The accessory building is erected on the rear half of the lot.
(2) The accessory building is so placed as not to prevent the practicable and conforming location of the main building.
(3) The main building is completed within two (2) years from the date of issuance of the permit for the accessory building.
Section 337.25 Agricultural Uses in Residential Districts
Agricultural uses in Residential Districts shall be subject to the following regulations and the regulations of Sections 347.02 and 205.02 regarding the keeping of farm animals.
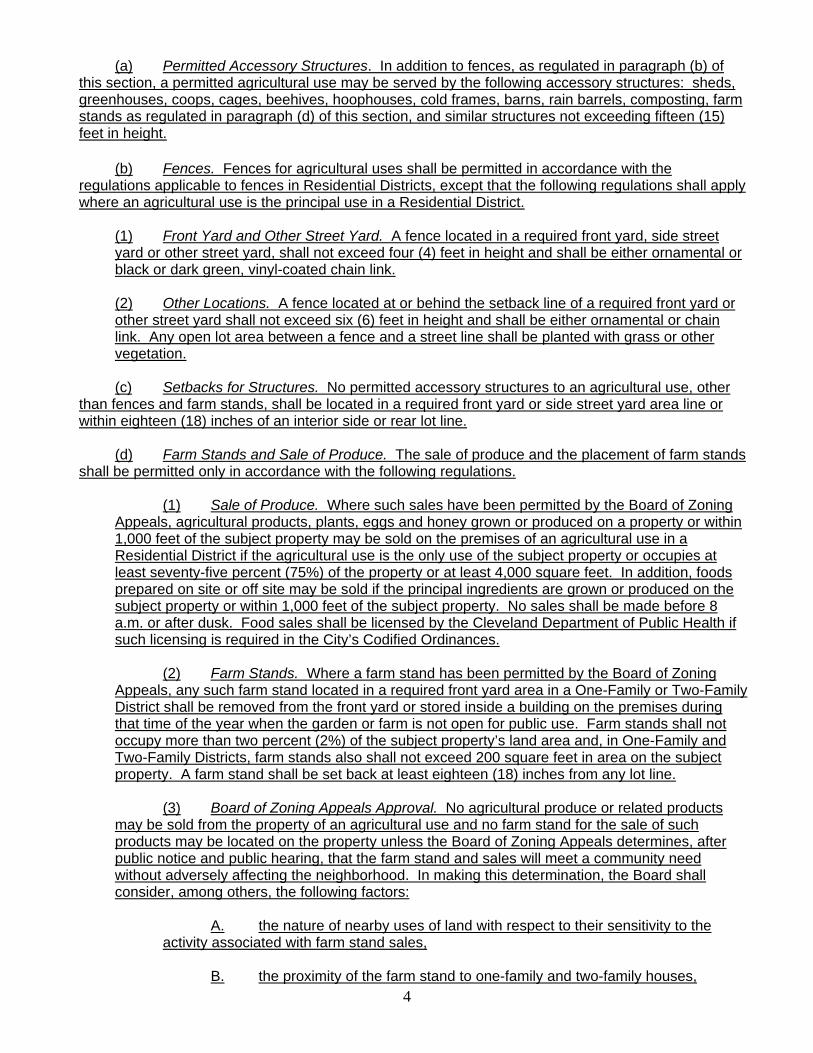
4
(a) Permitted Accessory Structures. In addition to fences, as regulated in paragraph (b) of this section, a permitted agricultural use may be served by the following accessory structures: sheds, greenhouses, coops, cages, beehives, hoophouses, cold frames, barns, rain barrels, composting, farm stands as regulated in paragraph (d) of this section, and similar structures not exceeding fifteen (15) feet in height.
(b) Fences. Fences for agricultural uses shall be permitted in accordance with the regulations applicable to fences in Residential Districts, except that the following regulations shall apply where an agricultural use is the principal use in a Residential District.
(1) Front Yard and Other Street Yard. A fence located in a required front yard, side street yard or other street yard, shall not exceed four (4) feet in height and shall be either ornamental or black or dark green, vinyl-coated chain link. (2) Other Locations. A fence located at or behind the setback line of a required front yard or other street yard shall not exceed six (6) feet in height and shall be either ornamental or chain link. Any open lot area between a fence and a street line shall be planted with grass or other vegetation.
(c) Setbacks for Structures. No permitted accessory structures to an agricultural use, other than fences and farm stands, shall be located in a required front yard or side street yard area line or within eighteen (18) inches of an interior side or rear lot line. (d) Farm Stands and Sale of Produce. The sale of produce and the placement of farm stands shall be permitted only in accordance with the following regulations.
(1) Sale of Produce. Where such sales have been permitted by the Board of Zoning Appeals, agricultural products, plants, eggs and honey grown or produced on a property or within 1,000 feet of the subject property may be sold on the premises of an agricultural use in a Residential District if the agricultural use is the only use of the subject property or occupies at least seventy-five percent (75%) of the property or at least 4,000 square feet. In addition, foods prepared on site or off site may be sold if the principal ingredients are grown or produced on the subject property or within 1,000 feet of the subject property. No sales shall be made before 8 a.m. or after dusk. Food sales shall be licensed by the Cleveland Department of Public Health if such licensing is required in the City’s Codified Ordinances. (2) Farm Stands. Where a farm stand has been permitted by the Board of Zoning Appeals, any such farm stand located in a required front yard area in a One-Family or Two-Family District shall be removed from the front yard or stored inside a building on the premises during that time of the year when the garden or farm is not open for public use. Farm stands shall not occupy more than two percent (2%) of the subject property’s land area and, in One-Family and Two-Family Districts, farm stands also shall not exceed 200 square feet in area on the subject property. A farm stand shall be set back at least eighteen (18) inches from any lot line. (3) Board of Zoning Appeals Approval. No agricultural produce or related products may be sold from the property of an agricultural use and no farm stand for the sale of such products may be located on the property unless the Board of Zoning Appeals determines, after public notice and public hearing, that the farm stand and sales will meet a community need without adversely affecting the neighborhood. In making this determination, the Board shall consider, among others, the following factors:
A. the nature of nearby uses of land with respect to their sensitivity to the activity associated with farm stand sales, B. the proximity of the farm stand to one-family and two-family houses,
5
C. traffic volumes on the street on which the subject property is located, D. the availability of off-street or on-street parking to serve the farm stand use, E. the proximity of other farm stands serving the immediate area, and F. the maintenance of a substantially unobstructed view in the set back area which shall include a clear view through the farm stand above a height of three feet.
(e) Signs. Where an agricultural use is the principal use in a Residential District or occupies at least seventy-five percent (75%) of the property or at least 4,000 square feet, one sign shall be permitted on each street frontage identifying the agricultural use and listing hours of operations for market sales and contact information. Such sign shall not exceed four (4) square feet in area and, if freestanding, shall not exceed three (3) feet in height and shall be set back at least five (5) feet from all property lines unless the sign is placed on a permitted farm stand. No signs shall be permitted for an agricultural use that is an accessory use in a Residential District. (f) Composting. Composting may be conducted on the premises of an agricultural use if limited to use on the subject property and if stored in a manner that controls odor, prevents infestation and minimizes run-off into waterways and onto adjacent properties. (g) Maintenance. Any land devoted to agricultural use shall be well-maintained and shall be free of excessively tall weeds or grass. All accessory structures to an agricultural use shall also be well maintained. (h) Building Permits. No Building Permit or Certificate of Occupancy shall be required for establishment of an agricultural use. A Building Permit shall be required for installation of a fence or for construction of a barn or other structure routinely requiring such permit, except that no Building Permit shall be required for cages, coops, beehives or similar structures that are not permanently attached to the ground or to another structure and do not exceed thirty-two (32) square feet in area nor eight (8) feet in height. No farm stand shall be installed without issuance of a Building Permit. The application for such Permit shall include the name, address and phone number of the operator of the farm stand; the length, width and height of the farm stand; a description of the type of produce to be sold from the farm stand; and the name of the property owner. If the applicant is not the property owner, the applicant shall include with the Permit application a written statement from the property owner authorizing the applicant to install and operate the farm stand. (i) Definitions. As used in this section:
(1) “farm stand” means a temporary structure used for display or sale of produce as described in division (d)(1) of this section and that meets the requirements of this section. (2) “subject property” refers to a parcel of land or two or more adjacent parcels of land in agricultural use.
Appendix A: Case Study Legislation
City of Toronto Local Food Procurement Policy
I II III IV V
Chatham County-Savannah Metropolitan Planning Commission A6 Rediscovering Roots | 2011
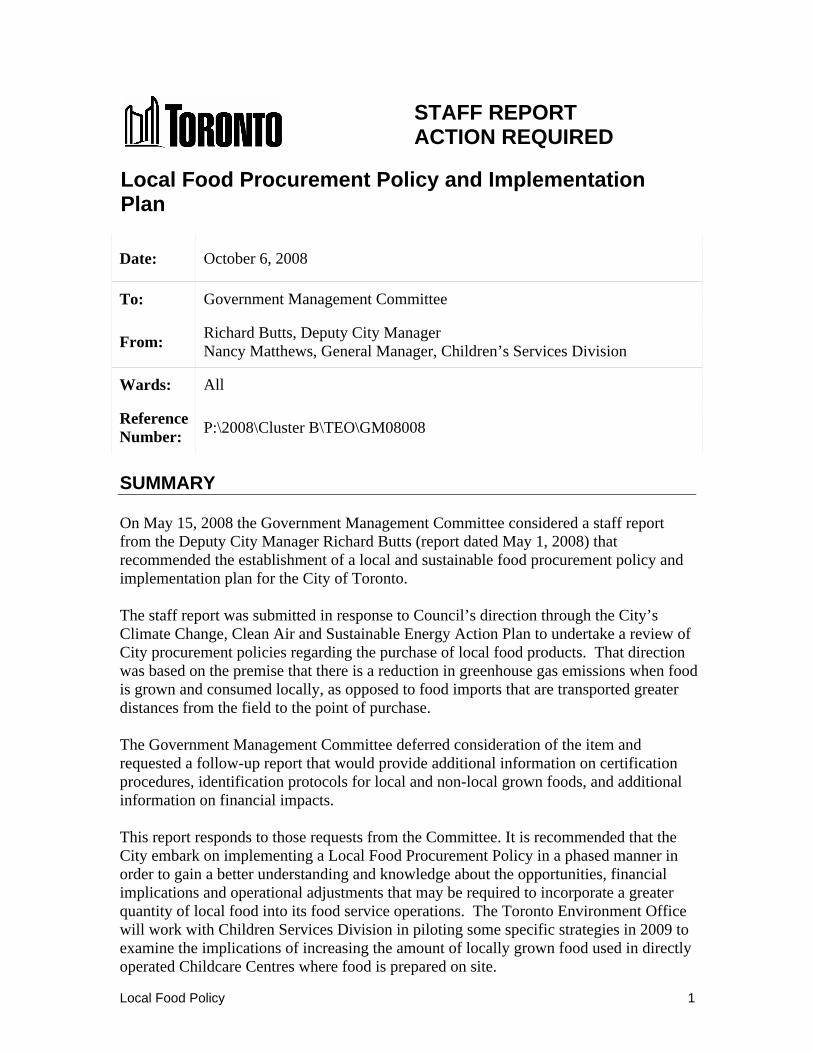
Local Food Policy 1
STAFF REPORT ACTION REQUIRED
Local Food Procurement Policy and Implementation Plan
Date: October 6, 2008
To: Government Management Committee
From: Richard Butts, Deputy City Manager Nancy Matthews, General Manager, Children’s Services Division
Wards: All
Reference Number:
P:\2008\Cluster B\TEO\GM08008
SUMMARY
On May 15, 2008 the Government Management Committee considered a staff report from the Deputy City Manager Richard Butts (report dated May 1, 2008) that recommended the establishment of a local and sustainable food procurement policy and implementation plan for the City of Toronto.
The staff report was submitted in response to Council’s direction through the City’s Climate Change, Clean Air and Sustainable Energy Action Plan to undertake a review of City procurement policies regarding the purchase of local food products. That direction was based on the premise that there is a reduction in greenhouse gas emissions when food is grown and consumed locally, as opposed to food imports that are transported greater distances from the field to the point of purchase.
The Government Management Committee deferred consideration of the item and requested a follow-up report that would provide additional information on certification procedures, identification protocols for local and non-local grown foods, and additional information on financial impacts.
This report responds to those requests from the Committee. It is recommended that the City embark on implementing a Local Food Procurement Policy in a phased manner in order to gain a better understanding and knowledge about the opportunities, financial implications and operational adjustments that may be required to incorporate a greater quantity of local food into its food service operations. The Toronto Environment Office will work with Children Services Division in piloting some specific strategies in 2009 to examine the implications of increasing the amount of locally grown food used in directly operated Childcare Centres where food is prepared on site.
Local Food Policy 2
Drawing from this experience, it is further recommended that the General Manager of Children’s Services and the Director of the Toronto Environment Office report back prior to the 2010 budget process with an implementation strategy that provides further options for expanding the implementation to other centres and potentially other divisions in the City.
RECOMMENDATIONS
Deputy City Manager Richard Butts and the General Manager, Children’s Services Division recommend that:
1. The Government Management Committee receive for information the report presented at its meeting of May 15, 2008 entitled, “Proposed Local and Sustainable Food Procurement Policy and Implementation Plan”;
2. City Council adopt a Local Food Procurement Policy in order to reduce greenhouse gas and smog causing emissions generated by the import of food from outside of Ontario. The Local Food Procurement Policy will establish:
(i) that it is the policy of City Council to progressively increase the percentage of food being served at City owned facilities or purchased for City operations from local sources;
(ii) that “local” is defined as food that is grown in the Greater Toronto Area, the Greenbelt of Ontario and other regions of Ontario; and
(iii) that a phased approach be used for the initial implementation of the Local Food Procurement Policy, with Phase I to be undertaken by Children’s Services;
3. A new and enhanced budget request of $15,000 be submitted by the General Manager of Children’s Services as part of the 2009 Operating Budget process to pilot increasing the purchase of some locally produced foods in 2009;
4. The Director of the Toronto Environment Office and the General Manager of Children’s Services report back prior to the 2010 budget process on the outcome of the 2009 implementation phase, including an evaluation of the approach and the potential financial implications of applying this model to other divisions in the City of Toronto; and
5. The Director of the Toronto Environment Office report on the ongoing policy development work and an action plan for City-wide implementation of the Local Food Procurement Policy prior to the 2010 budget process
Local Food Policy 3
Financial Impact
The 2009 impact of implementing the first phase of a Local Food Procurement Policy is a $15,000 gross and net increase to Children’s Services 2009 Operating Budget if the new and enhanced request by the General Manager, Children’s Services is approved as part of the 2009 Operating Budget Process.
Options for expanding the implementation of the policy will have further financial implications, which will be reported as part of the implementation strategy.
The Deputy City Manager and Chief Financial Officer has reviewed this report and agrees with the financial impact information.
DECISION HISTORY
In 2001, the City of Toronto adopted unanimously the Toronto Food Charter, a proclamation stating City Council’s commitment to food security and that every Toronto resident should have “access to an adequate supply of nutritious, affordable and culturally acceptable food”. Included in the Toronto Food Charter is also a commitment to “adopt food purchasing practices that serve as a model of health, social and environmental responsibility” (http://www.toronto.ca/food_hunger/pdf/food_charter.pdf).
At its meeting of July 16 – 19, 2007, Council unanimously adopted the Climate Change, Clean Air & Sustainable Energy Action Plan: Moving from Framework to Action - http://www.toronto.ca/legdocs/mmis/2007/cc/decisions/2007-07-16-cc11-dd.pdf. Included in that Action Plan was Recommendation 5d:
“to establish an Enviro-Food Working Group to develop and implement actions to promote local food production, review City procurement policies, increase community gardens and identify ways to remove barriers to the expansion of local markets that sell locally produced food. (emphasis added)”
At its meeting of May 15, 2008 the Government Management Committee considered a report recommending a Local and Sustainable Food Procurement Policy. The Committee deferred consideration of the report and requested that a report be prepared for its July 2008 meeting reporting on:
mechanisms to certify locally grown foods;
identification of food origins;
the estimated carbon emission reductions associated with a local food procurement policy; and
determining the financial costs of a local food procurement policy and its implementation.
Local Food Policy 4
ISSUE BACKGROUND
There are significant environmental effects associated with the requirement and provision of food. Some research suggests that roughly 30% of the world’s pollution can be traced to food production, processing, packaging, transportation, preparation and disposal. From a climate change perspective, there is large use of carbon-based fossil fuels in the production of fertilizers and pesticides, the machinery used in food production and processing and in transporting food around the world.
There are a number of other reasons for being concerned about our food systems as outlined by Toronto Public Health in its recent discussion paper, entitled “State of Toronto’s Food” (http://www.toronto.ca/legdocs/mmis/2008/hl/bgrd/backgroundfile-13560.pdf). More recently the Metcalf Foundation published a discussion paper, “Food Connects Us All: Sustainable Local Food in Southern Ontario”, which outlines the major economic, environmental and health factors of concern (http://www.metcalffoundation.com). These include:
climate change and greenhouse gas emissions associated with food transportation and production;
harmful effects of agricultural chemicals, in particular pesticides and fertilizers;
the long term effects of large scale monocultures; and
increased reliance on imported food and food security issues related to breaks in the food chain due to emergencies or natural disasters.
COMMENTS
1.0 MECHANISMS TO CERTIFY LOCALLY GROWN FOOD
One of the challenges faced in tracking down the origin of food products, besides the complexity of the food system, is the fact that there is no organization that certifies food products as being produced in Ontario. For fresh fruits and vegetables there is the Foodland Ontario label, but this is not a formal certification process.
There is a certification process managed by Local Food Plus (LFP) but it requires farmers and food processors to comply with its guidelines around sustainable production practices. Currently LFP has 70 farmers and producers certified and some of that certified product may actually be in the supply chain for City Operations. The first report (http://www.toronto.ca/legdocs/mmis/2008/gm/agendas/2008-05-15-gm14-ai.htm) prepared for the May 2008 meeting of the Government Management Committee meeting provides a detailed overview of LFP and its certification process. More information is also available about LFP on their website www.localfoodplus.ca.
A more recent mechanism that may enable the identification of locally produced meat and poultry is the "Homegrown Ontario" brand that was launched in Fall 2007. It is an alliance between Ontario Pork, the Ontario Veal Association, the Ontario Sheep Marketing Agency, Turkey Farmers of Ontario and the Ontario Independent Meat
Local Food Policy 5
Processors. Their mandate is to brand and promote Ontario-produced meat and poultry. Currently, Homegrown Ontario has 47 authorized suppliers (http://www.homegrownontario.ca/index.php).
2.0 IDENTIFICATION OF FOOD ORIGINS
One significant challenge that is faced in tracing the origins of food is linked to current Federal Government regulations on labelling. Currently, packaged or processed foods where at least 51% of the product was processed in Canada can be labelled as ‘Made in Canada’. The Federal Government is currently reviewing these regulations and is considering moving to regulations that redefine the “Product of Canada” and “Made in Canada” food labels to better reflect the true origins of products (http://www.healthycanadians.ca/pr-rp/cfli-icepa_e.html). Notwithstanding this review and possible regulatory changes, this will not assist in verifying local food products from Ontario.
Another challenge in this area is that suppliers have historically not maintained long term records of where their produce originates from. While many smaller suppliers are able to anecdotally provide information on the origins of their products there is no requirement or system of records maintenance.
3.0 ESTIMATING CARBON EMISSION REDUCTIONS ASSOCIATED WITH A LOCAL FOOD PROCUREMENT POLICY
With the adoption of the Climate Change Action Plan, City Council set a very aggressive and progressive target of wanting to achieve an 80% reduction in greenhouse gas emissions against 1990 levels by 2050. Achieving that target means taking action on all sources of emissions, including those associated with food production, transportation, processing, packaging and disposal.
3.1 Transportation & Food Miles
In 2007, the City completed its first comprehensive inventory of greenhouse gas and smog causing emissions. Transportation was found to account for an estimated one-third of the emissions, with emissions associated with the use of diesel fuel representing a significant portion of the transportation related emissions.
The global food system is extremely complex and in North America the majority of the food production and processing occurs some distance from where the eventual consumer lives and buys their food. The external environmental costs associated with the current global food system, in terms of production, transportation, processing and storage are becoming better known and there is a growing consumer desire for food that is produced locally because of the negative environmental and local community impacts of the existing global food system.
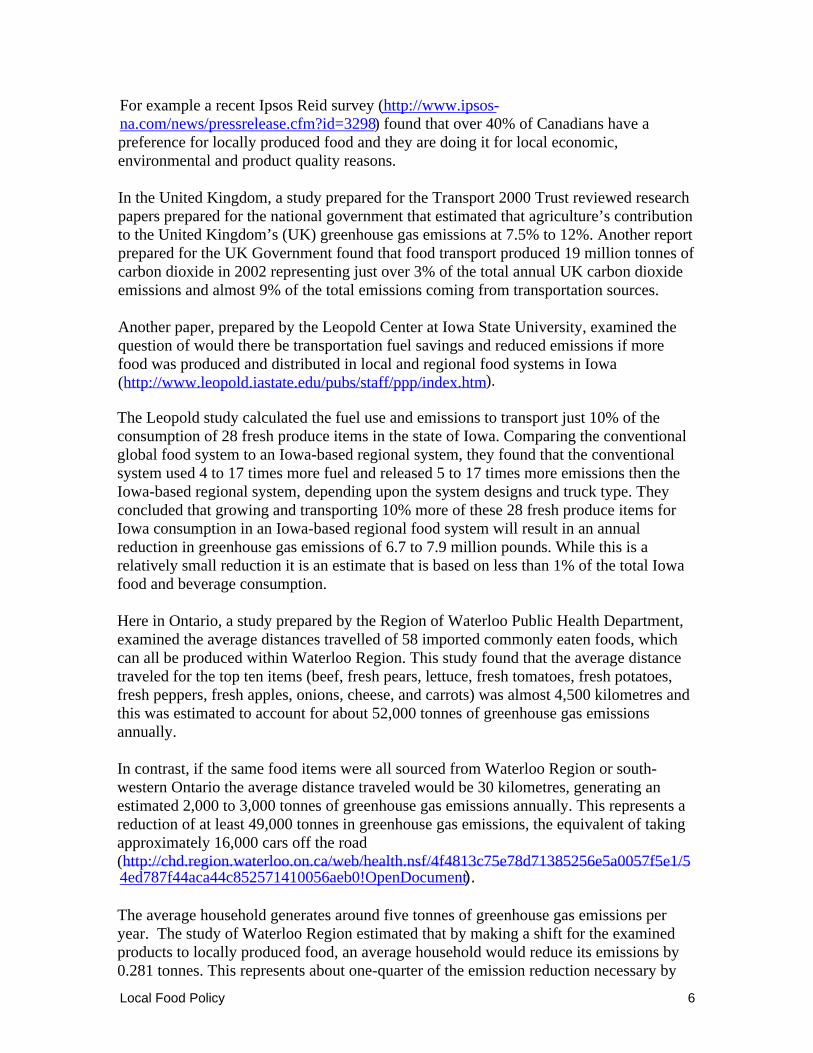
Local Food Policy 6
For example a recent Ipsos Reid survey (http://www.ipsos-na.com/news/pressrelease.cfm?id=3298) found that over 40% of Canadians have a preference for locally produced food and they are doing it for local economic, environmental and product quality reasons.
In the United Kingdom, a study prepared for the Transport 2000 Trust reviewed research papers prepared for the national government that estimated that agriculture’s contribution to the United Kingdom’s (UK) greenhouse gas emissions at 7.5% to 12%. Another report prepared for the UK Government found that food transport produced 19 million tonnes of carbon dioxide in 2002 representing just over 3% of the total annual UK carbon dioxide emissions and almost 9% of the total emissions coming from transportation sources.
Another paper, prepared by the Leopold Center at Iowa State University, examined the question of would there be transportation fuel savings and reduced emissions if more food was produced and distributed in local and regional food systems in Iowa (http://www.leopold.iastate.edu/pubs/staff/ppp/index.htm).
The Leopold study calculated the fuel use and emissions to transport just 10% of the consumption of 28 fresh produce items in the state of Iowa. Comparing the conventional global food system to an Iowa-based regional system, they found that the conventional system used 4 to 17 times more fuel and released 5 to 17 times more emissions then the Iowa-based regional system, depending upon the system designs and truck type. They concluded that growing and transporting 10% more of these 28 fresh produce items for Iowa consumption in an Iowa-based regional food system will result in an annual reduction in greenhouse gas emissions of 6.7 to 7.9 million pounds. While this is a relatively small reduction it is an estimate that is based on less than 1% of the total Iowa food and beverage consumption.
Here in Ontario, a study prepared by the Region of Waterloo Public Health Department, examined the average distances travelled of 58 imported commonly eaten foods, which can all be produced within Waterloo Region. This study found that the average distance traveled for the top ten items (beef, fresh pears, lettuce, fresh tomatoes, fresh potatoes, fresh peppers, fresh apples, onions, cheese, and carrots) was almost 4,500 kilometres and this was estimated to account for about 52,000 tonnes of greenhouse gas emissions annually.
In contrast, if the same food items were all sourced from Waterloo Region or south-western Ontario the average distance traveled would be 30 kilometres, generating an estimated 2,000 to 3,000 tonnes of greenhouse gas emissions annually. This represents a reduction of at least 49,000 tonnes in greenhouse gas emissions, the equivalent of taking approximately 16,000 cars off the road (http://chd.region.waterloo.on.ca/web/health.nsf/4f4813c75e78d71385256e5a0057f5e1/54ed787f44aca44c852571410056aeb0!OpenDocument).
The average household generates around five tonnes of greenhouse gas emissions per year. The study of Waterloo Region estimated that by making a shift for the examined products to locally produced food, an average household would reduce its emissions by 0.281 tonnes. This represents about one-quarter of the emission reduction necessary by
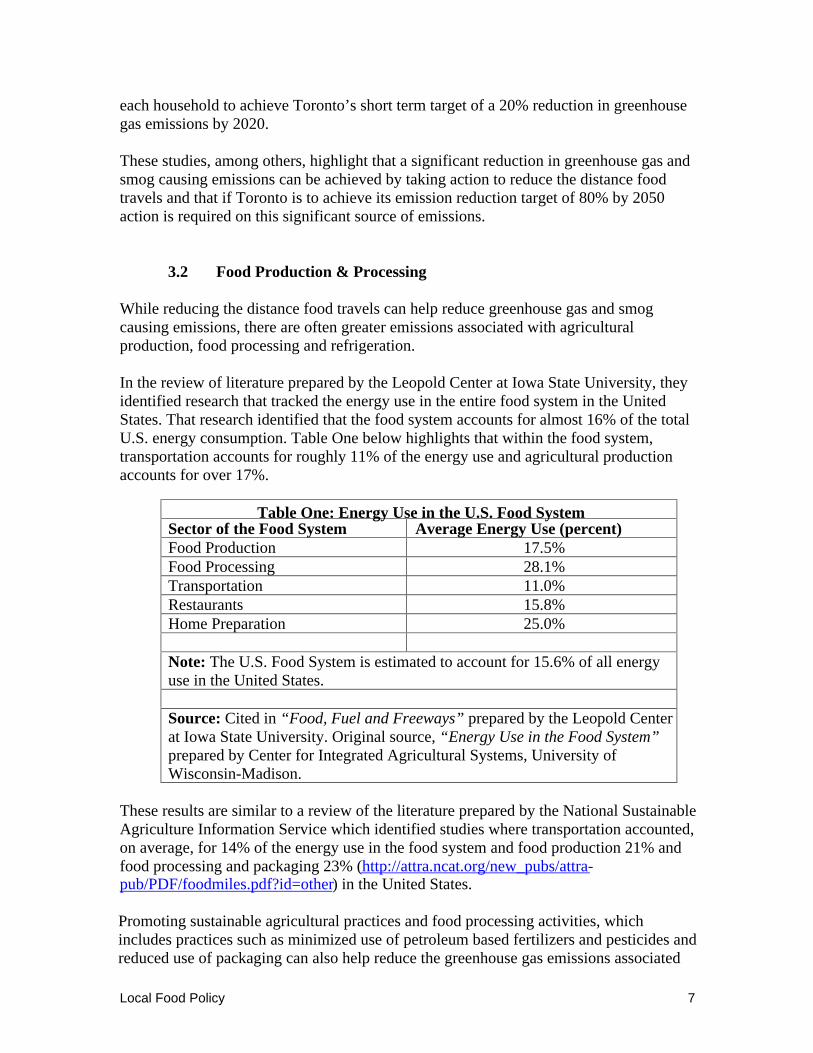
Local Food Policy 7
each household to achieve Toronto’s short term target of a 20% reduction in greenhouse gas emissions by 2020.
These studies, among others, highlight that a significant reduction in greenhouse gas and smog causing emissions can be achieved by taking action to reduce the distance food travels and that if Toronto is to achieve its emission reduction target of 80% by 2050 action is required on this significant source of emissions.
3.2 Food Production & Processing
While reducing the distance food travels can help reduce greenhouse gas and smog causing emissions, there are often greater emissions associated with agricultural production, food processing and refrigeration.
In the review of literature prepared by the Leopold Center at Iowa State University, they identified research that tracked the energy use in the entire food system in the United States. That research identified that the food system accounts for almost 16% of the total U.S. energy consumption. Table One below highlights that within the food system, transportation accounts for roughly 11% of the energy use and agricultural production accounts for over 17%.
Table One: Energy Use in the U.S. Food System Sector of the Food System Average Energy Use (percent) Food Production 17.5% Food Processing 28.1% Transportation 11.0% Restaurants 15.8% Home Preparation 25.0%
Note: The U.S. Food System is estimated to account for 15.6% of all energy use in the United States.
Source: Cited in “Food, Fuel and Freeways” prepared by the Leopold Center at Iowa State University. Original source, “Energy Use in the Food System” prepared by Center for Integrated Agricultural Systems, University of Wisconsin-Madison.
These results are similar to a review of the literature prepared by the National Sustainable Agriculture Information Service which identified studies where transportation accounted, on average, for 14% of the energy use in the food system and food production 21% and food processing and packaging 23% (http://attra.ncat.org/new_pubs/attra-pub/PDF/foodmiles.pdf?id=other) in the United States.
Promoting sustainable agricultural practices and food processing activities, which includes practices such as minimized use of petroleum based fertilizers and pesticides and reduced use of packaging can also help reduce the greenhouse gas emissions associated
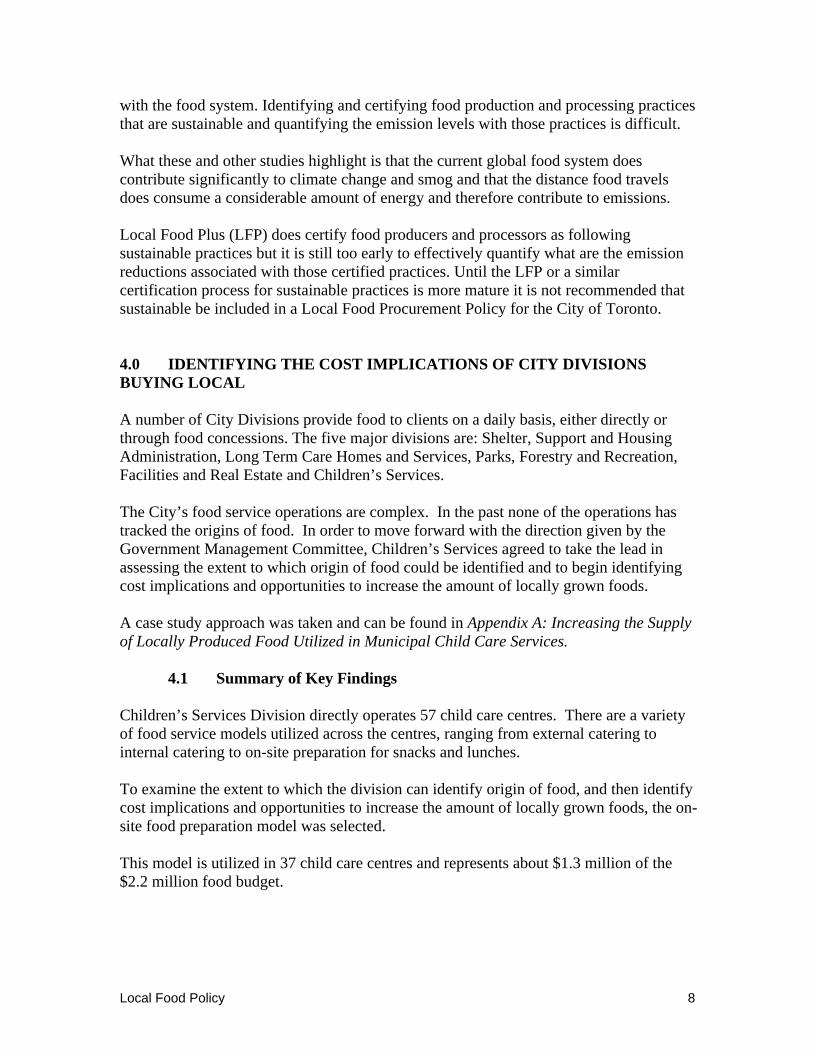
Local Food Policy 8
with the food system. Identifying and certifying food production and processing practices that are sustainable and quantifying the emission levels with those practices is difficult.
What these and other studies highlight is that the current global food system does contribute significantly to climate change and smog and that the distance food travels does consume a considerable amount of energy and therefore contribute to emissions.
Local Food Plus (LFP) does certify food producers and processors as following sustainable practices but it is still too early to effectively quantify what are the emission reductions associated with those certified practices. Until the LFP or a similar certification process for sustainable practices is more mature it is not recommended that sustainable be included in a Local Food Procurement Policy for the City of Toronto.
4.0 IDENTIFYING THE COST IMPLICATIONS OF CITY DIVISIONS BUYING LOCAL
A number of City Divisions provide food to clients on a daily basis, either directly or through food concessions. The five major divisions are: Shelter, Support and Housing Administration, Long Term Care Homes and Services, Parks, Forestry and Recreation, Facilities and Real Estate and Children’s Services.
The City’s food service operations are complex. In the past none of the operations has tracked the origins of food. In order to move forward with the direction given by the Government Management Committee, Children’s Services agreed to take the lead in assessing the extent to which origin of food could be identified and to begin identifying cost implications and opportunities to increase the amount of locally grown foods.
A case study approach was taken and can be found in Appendix A: Increasing the Supply of Locally Produced Food Utilized in Municipal Child Care Services.
4.1 Summary of Key Findings
Children’s Services Division directly operates 57 child care centres. There are a variety of food service models utilized across the centres, ranging from external catering to internal catering to on-site preparation for snacks and lunches.
To examine the extent to which the division can identify origin of food, and then identify cost implications and opportunities to increase the amount of locally grown foods, the on-site food preparation model was selected.
This model is utilized in 37 child care centres and represents about $1.3 million of the $2.2 million food budget.
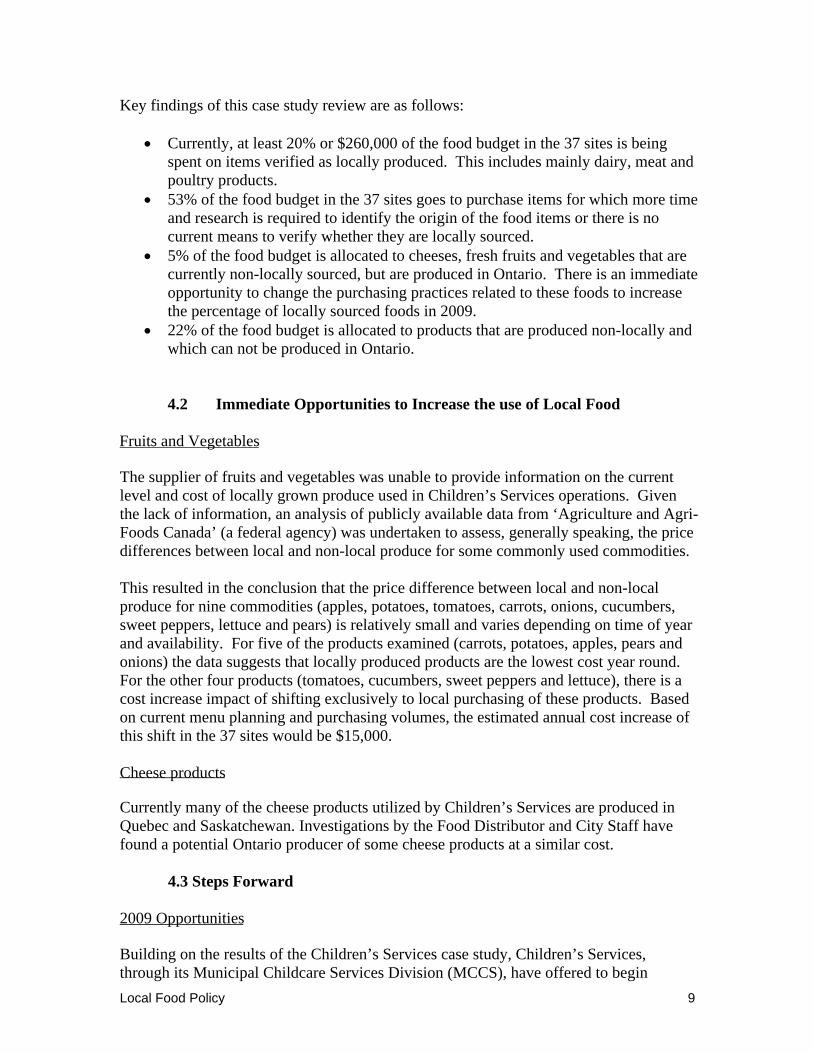
Local Food Policy 9
Key findings of this case study review are as follows:
Currently, at least 20% or $260,000 of the food budget in the 37 sites is being spent on items verified as locally produced. This includes mainly dairy, meat and poultry products.
53% of the food budget in the 37 sites goes to purchase items for which more time and research is required to identify the origin of the food items or there is no current means to verify whether they are locally sourced.
5% of the food budget is allocated to cheeses, fresh fruits and vegetables that are currently non-locally sourced, but are produced in Ontario. There is an immediate opportunity to change the purchasing practices related to these foods to increase the percentage of locally sourced foods in 2009.
22% of the food budget is allocated to products that are produced non-locally and which can not be produced in Ontario.
4.2 Immediate Opportunities to Increase the use of Local Food
Fruits and Vegetables
The supplier of fruits and vegetables was unable to provide information on the current level and cost of locally grown produce used in Children’s Services operations. Given the lack of information, an analysis of publicly available data from ‘Agriculture and Agri-Foods Canada’ (a federal agency) was undertaken to assess, generally speaking, the price differences between local and non-local produce for some commonly used commodities.
This resulted in the conclusion that the price difference between local and non-local produce for nine commodities (apples, potatoes, tomatoes, carrots, onions, cucumbers, sweet peppers, lettuce and pears) is relatively small and varies depending on time of year and availability. For five of the products examined (carrots, potatoes, apples, pears and onions) the data suggests that locally produced products are the lowest cost year round. For the other four products (tomatoes, cucumbers, sweet peppers and lettuce), there is a cost increase impact of shifting exclusively to local purchasing of these products. Based on current menu planning and purchasing volumes, the estimated annual cost increase of this shift in the 37 sites would be $15,000.
Cheese products
Currently many of the cheese products utilized by Children’s Services are produced in Quebec and Saskatchewan. Investigations by the Food Distributor and City Staff have found a potential Ontario producer of some cheese products at a similar cost.
4.3 Steps Forward
2009 Opportunities
Building on the results of the Children’s Services case study, Children’s Services, through its Municipal Childcare Services Division (MCCS), have offered to begin
Local Food Policy 10
phasing in the implementation of a Local Food Procurement Policy in the 37 directly operated child care centres that have an in-house food preparation model. For these 37 centres, there are 2 strategies that can be pursued in 2009 to increase the percentage of the budget allocated to locally produced foods. The first is requesting the supplier ensure the purchase of locally produced fruits and vegetables and cheeses where there is no cost difference and the quality meets operational needs. Based on the analysis of the publicly available data, and an investigation of Ontario suppliers for cheese products, it is estimated that the Division could increase its portion of the budget used for locally purchased food in those 37 child care centres by 5%.
For those vegetables that are available year round, but are more expensive when purchased locally, it is estimated that an additional investment of $15,000 (gross and net) to the Children’s Services food budget for the 37 child care sites would result in an additional 3% of the existing food budget being allocated to locally purchased food in those sites. It is therefore recommended that a new and enhanced budget request of $15,000 be submitted by the General Manager of Children’s Services as part of the 2009 Operating Budget process to pilot increasing the purchase of some locally produced foods in 2009.
Areas Requiring Further Review
Beyond these initial steps identified for 2009, there is further work that needs to be done before a more comprehensive implementation plan can be recommended. For example, the options Children’s Services is proposing for 2009 need to be evaluated to ensure that the assumptions on which they are based hold, given that proxy measures have had to be used in the absence of specific information on food origin. As well, a more rigorous assessment of the financial implications of these recommendations needs to be undertaken prior to recommending implementation in other divisions. Additionally, strategies associated with other food preparation models need to be pursued.
In addition there is policy work that needs to be conducted to support development of further implementation options. The Children’s Services case study revealed that the standardized identification of food origin and the related tracking and monitoring is in its infancy. Further investigations which audit and map out the food supply chain, and develop methodologies and standards for reporting are required. The Toronto Environment Office will continue exploring this in the context of developing an implementation plan over the next year.
There is a relationship between the development of a Local Food Procurement Policy and the recent direction by the Toronto Board of Health to the Medical Officer of Health to develop a Toronto Food Strategy (http://www.toronto.ca/legdocs/mmis/2008/hl/bgrd/backgroundfile-13560.pdf). Staff from Toronto Public Health have been engaged in the internal working group for the Local Food Procurement Policy and staff from Toronto Environment Office will be engaged in the process of developing the Toronto Food Strategy. These two initiatives will continue to work together to inform each process and ensure policy alignment.
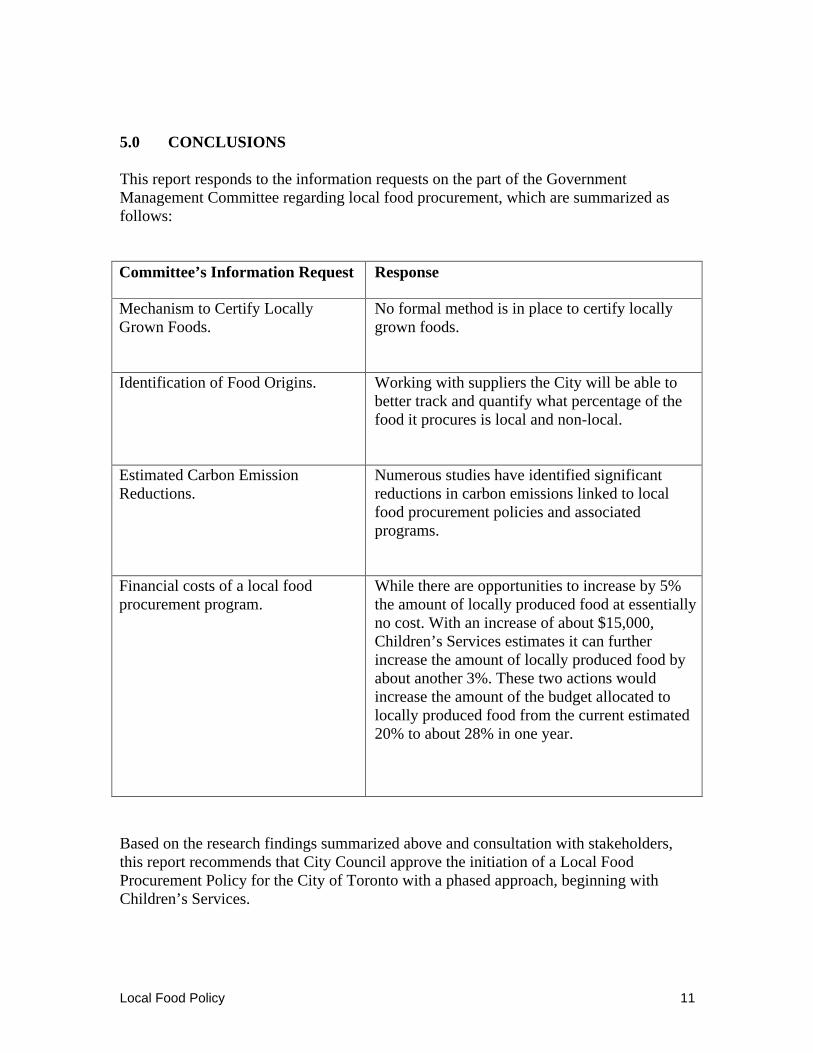
Local Food Policy 11
5.0 CONCLUSIONS
This report responds to the information requests on the part of the Government Management Committee regarding local food procurement, which are summarized as follows:
Committee’s Information Request Response
Mechanism to Certify Locally Grown Foods.
No formal method is in place to certify locally grown foods.
Identification of Food Origins. Working with suppliers the City will be able to better track and quantify what percentage of the food it procures is local and non-local.
Estimated Carbon Emission Reductions.
Numerous studies have identified significant reductions in carbon emissions linked to local food procurement policies and associated programs.
Financial costs of a local food procurement program.
While there are opportunities to increase by 5% the amount of locally produced food at essentially no cost. With an increase of about $15,000, Children’s Services estimates it can further increase the amount of locally produced food by about another 3%. These two actions would increase the amount of the budget allocated to locally produced food from the current estimated 20% to about 28% in one year.
Based on the research findings summarized above and consultation with stakeholders, this report recommends that City Council approve the initiation of a Local Food Procurement Policy for the City of Toronto with a phased approach, beginning with Children’s Services.
Local Food Policy 12
A Local Food Procurement Policy provides official support from the City to the larger effort occurring in Toronto, the GTA and North America to reduce greenhouse gas emissions associated with food transportation in balance with a need to contain operating costs.
CONTACTS
Lawson Oates Director, Toronto Environment Office Tel. 416-392-9744 E-mail: [email protected]
Elizabeth Moffat Director, Municipal Child Care Services Children’s Services 416-392-5868 [email protected]
_______________________________ ____________________________ Richard Butts Nancy Matthews Deputy City Manager General Manager, Children’s Services
ATTACHMENT
Appendix A: Case Study – Children’s Services Division: Increasing the Supply of Locally Produced Food in Municipal Child Care Services.
Local Food Policy 13
Appendix A: Case Study
Children’s Services Division Increasing the Supply of Locally Produced Food in Municipal
Child Care Services
Local Food Policy 14
Climate Change Clean Air and Sustainable Energy Action Plan
At its meeting in May 2008 the Government Management Committee requested Deputy City Manager, Richard Butts to provide additional information about certification procedures, identification protocols for local and non local foods, and financial impacts.
For illustrative purposes the Toronto Environment Office (TEO) and Children's Services Division agreed to work together to:
determine to what extent the origins of food being used in a number of municipally operated child care programs can be identified;
establish baseline information about locally grown foods currently being used in them;
propose a mechanism for increasing the amount of locally grown foods being used in municipally operated child care programs year over year; and
consider the financial implications of such increases.
Children’s Services Division
Children's Services is designated as the City's "child care service system manager" under provincial legislation and as such has responsibility for planning and managing a broad range of child care services including fee subsidy, wage subsidy, family resource centres, special needs resourcing and summer day camps. The Children's Services Division also directly operates 57 child care programs
and one home child care agency through its Municipal Child Care Services Unit. In addition Children's Services Division has service contracts with 657 child care centres and 10 home child care agencies that provide child care to families with young children. These agencies have a total licensed capacity of 55,000 spaces. At present the Children's Services Division provides 24,000 fee subsidies annually and there are over 14,000 children on the waiting list. For 2008, the gross operating budget for Children’s Services was just under $360 million.
Municipal Child Care Services
Municipal Child Care Services (MCCS) provides services to families and communities at risk. MCCS operates 57 child care centres providing care for up to 3000 children and a Home Child Care Agency which provides care for up to 1,000 children. MCCS offers integrated and inclusive programs providing a full range of before and after school, part-time and full-time care.
MCCS was selected to work with the Toronto Environment Office to develop a case study for a number of reasons:
the food distribution contract was recently awarded (April 2008) through a request for Proposal (RFP) process;
the successful vendor has contracts with other City divisions; and
Local Food Policy 15
the successful vendor confirmed in their proposal that: “they have the flexibility to adjust as required to any potentially emerging City policies on purchasing local foods”.
MCCS has recently worked in partnership with Toronto Public Health to develop a new Nutrition Criteria for Municipal Child Care Services. This has led to the removal of products with artificial trans-fats, an increase in the servings of whole grains, increased use of meat alternatives and the substitution of whole fruits and water for fruit juices. The criteria also include reference to the preferred purchase of local foods: “A variety of vegetables and fruits will be chosen with an emphasis on in season products. Whenever possible, Ontario products will be purchased”.
Overview of Food Services in Municipal Child Care Services
Food Services is an important part of the program provided by Municipal Child Care Services (MCCS). MCCS provides lunches and snacks daily. Menus offer a variety of nutritious foods that are planned to meet the requirements of Ontario Day Nurseries Act, City of Toronto Children’s Services Operating Criteria, and incorporates the guidelines of Canada’s Food Guide. MCCS Nutrition Unit also monitors and implements directions coming from Federal and Provincial reviews and task forces where appropriate. The food service operation is run in accordance with the Ontario Health Promotion and Protection Act for Food Premises.
Menus consider nutrition standards, needs of children, equipment and storage, staffing, seasonal availability of foods and food safety requirements. The menus are adapted for different age groups, different program types and individual needs of children with allergies, intolerances and sensitivities. The meals and snacks are also sensitive to the faiths and cultures of children and their families. About 20% of all children in care have special dietary needs.
In 2008, MCCS budgeted $2.2 million for food purchases. This amount does not include salaries, kitchen maintenance, appliances and upkeep. If these were included, total costs would be about $5 million per year.
Currently there are four food service delivery models Children’s Services utilizes. They are summarized in Table 1.
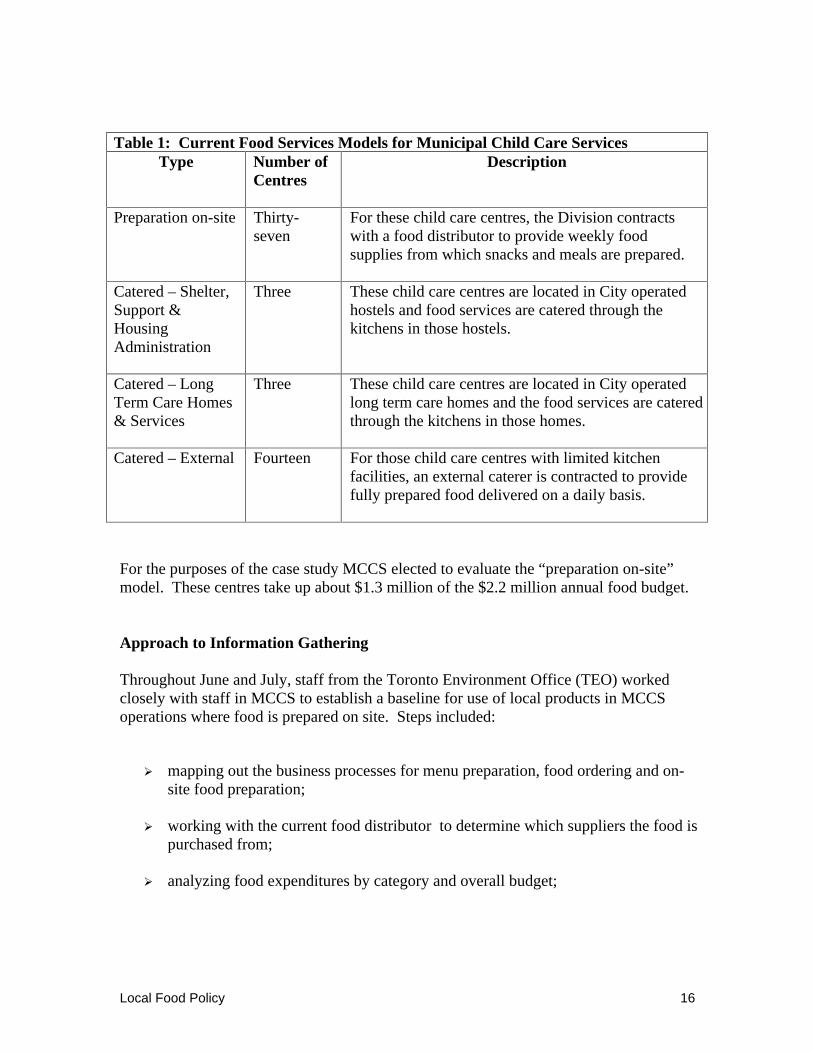
Local Food Policy 16
Table 1: Current Food Services Models for Municipal Child Care Services Type Number of
Centres Description
Preparation on-site Thirty-seven
For these child care centres, the Division contracts with a food distributor to provide weekly food supplies from which snacks and meals are prepared.
Catered – Shelter, Support & Housing Administration
Three These child care centres are located in City operated hostels and food services are catered through the kitchens in those hostels.
Catered – Long Term Care Homes & Services
Three These child care centres are located in City operated long term care homes and the food services are catered through the kitchens in those homes.
Catered – External Fourteen For those child care centres with limited kitchen facilities, an external caterer is contracted to provide fully prepared food delivered on a daily basis.
For the purposes of the case study MCCS elected to evaluate the “preparation on-site” model. These centres take up about $1.3 million of the $2.2 million annual food budget.
Approach to Information Gathering
Throughout June and July, staff from the Toronto Environment Office (TEO) worked closely with staff in MCCS to establish a baseline for use of local products in MCCS operations where food is prepared on site. Steps included:
mapping out the business processes for menu preparation, food ordering and on-site food preparation;
working with the current food distributor to determine which suppliers the food is purchased from;
analyzing food expenditures by category and overall budget;
Local Food Policy 17
tracking food purchased by supplier and site for the period of May 2007 until April 2008;
determining if the origins of food items being purchased could be verified by suppliers;
reviewing existing research including reports by the Toronto Food Policy Council; and
analyzing data and findings.
Findings
Food Distributors and Suppliers
The distributor has confirmed that they deal with over 600 manufacturers and suppliers to supply all the products they sell. For the 37 child care centres they are sourcing over 242 products from 58 different suppliers and manufacturers (Attachment 1). Many of these suppliers and manufacturers in turn deal with another set of smaller suppliers to obtain their ingredients, thus reflecting the cascading nature of the entire food procurement process. Staff prioritized food suppliers to be contacted based on budget expenditures and type of food provided.
Food Expenditures by Category
Table 2 depicts an analysis of food expenditure by food category over a twelve month period. It highlights that 68% of the food budget is for expenditures in four areas: prepared entrees for the lunches, fresh fruits, processed grain products and milk.
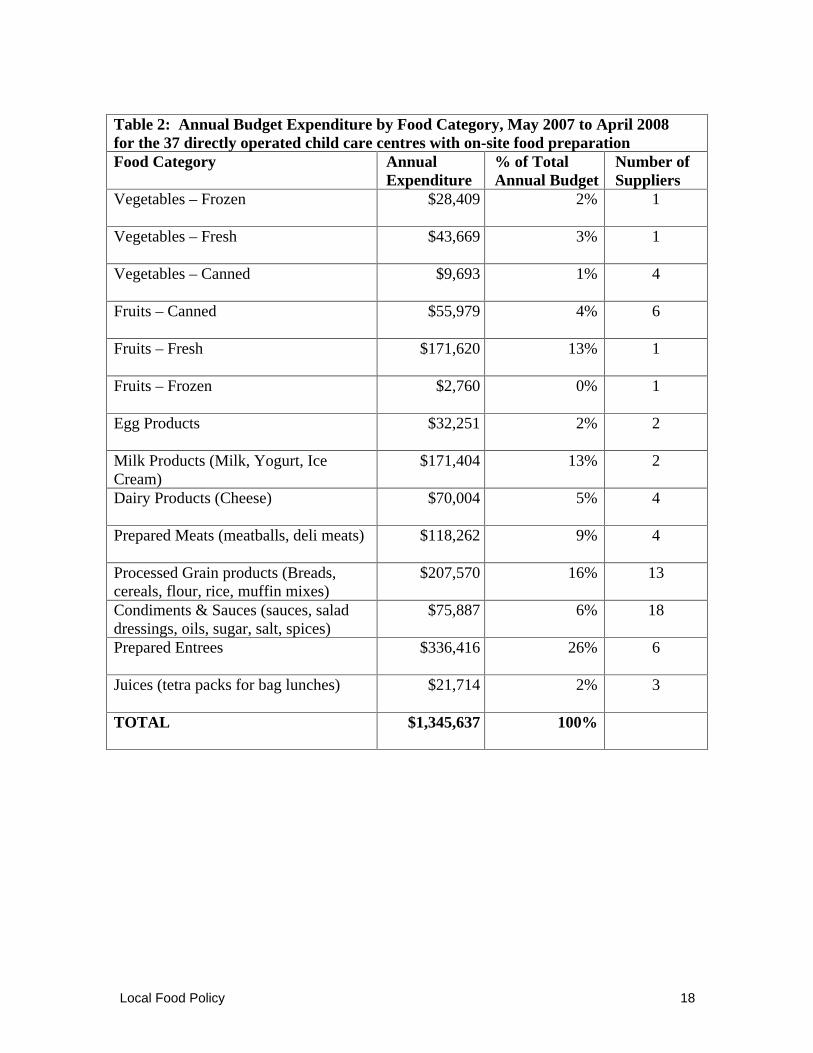
Local Food Policy 18
Table 2: Annual Budget Expenditure by Food Category, May 2007 to April 2008 for the 37 directly operated child care centres with on-site food preparation Food Category Annual
Expenditure % of Total Annual Budget
Number of Suppliers
Vegetables – Frozen $28,409
2%
1
Vegetables – Fresh $43,669
3%
1
Vegetables – Canned $9,693
1%
4
Fruits – Canned $55,979
4%
6
Fruits – Fresh $171,620
13%
1
Fruits – Frozen $2,760
0%
1
Egg Products $32,251
2%
2
Milk Products (Milk, Yogurt, Ice Cream)
$171,404
13%
2
Dairy Products (Cheese) $70,004
5%
4
Prepared Meats (meatballs, deli meats) $118,262
9%
4
Processed Grain products (Breads, cereals, flour, rice, muffin mixes)
$207,570
16%
13
Condiments & Sauces (sauces, salad dressings, oils, sugar, salt, spices)
$75,887
6%
18
Prepared Entrees $336,416
26%
6
Juices (tetra packs for bag lunches) $21,714
2%
3
TOTAL $1,345,637
100%
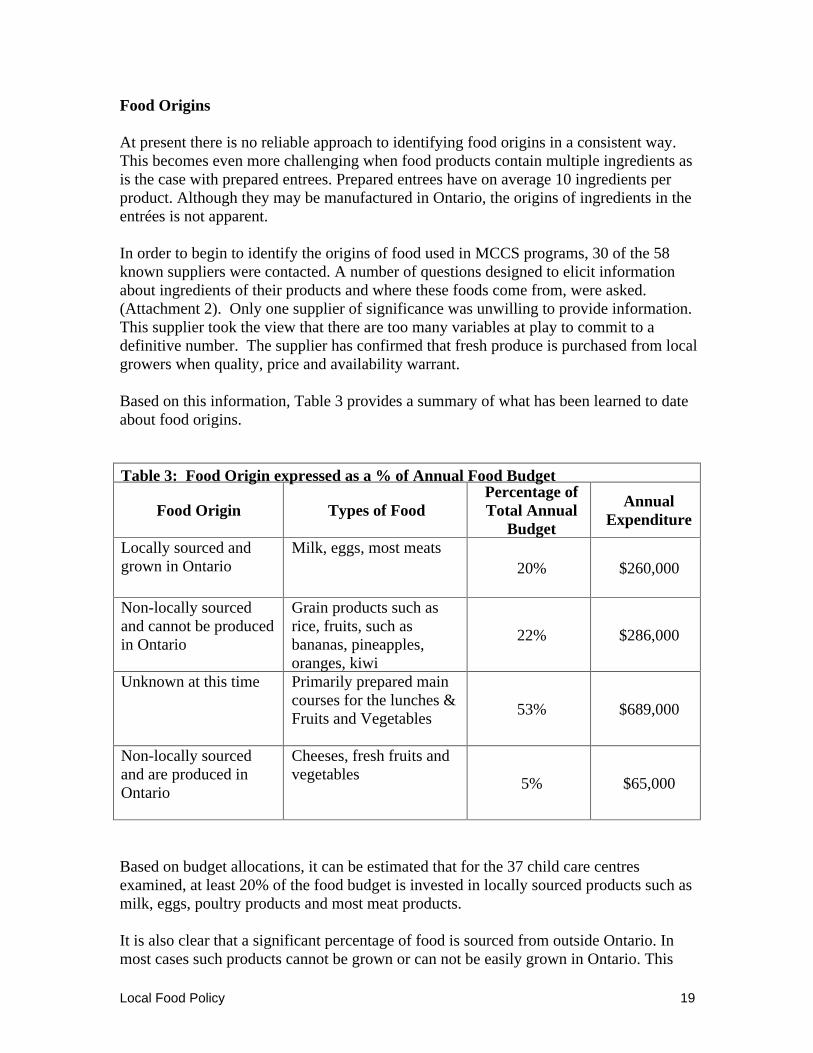
Local Food Policy 19
Food Origins
At present there is no reliable approach to identifying food origins in a consistent way. This becomes even more challenging when food products contain multiple ingredients as is the case with prepared entrees. Prepared entrees have on average 10 ingredients per product. Although they may be manufactured in Ontario, the origins of ingredients in the entrées is not apparent.
In order to begin to identify the origins of food used in MCCS programs, 30 of the 58 known suppliers were contacted. A number of questions designed to elicit information about ingredients of their products and where these foods come from, were asked. (Attachment 2). Only one supplier of significance was unwilling to provide information. This supplier took the view that there are too many variables at play to commit to a definitive number. The supplier has confirmed that fresh produce is purchased from local growers when quality, price and availability warrant.
Based on this information, Table 3 provides a summary of what has been learned to date about food origins.
Table 3: Food Origin expressed as a % of Annual Food Budget
Food Origin Types of Food Percentage of Total Annual
Budget
Annual Expenditure
Locally sourced and grown in Ontario
Milk, eggs, most meats 20% $260,000
Non-locally sourced and cannot be produced in Ontario
Grain products such as rice, fruits, such as bananas, pineapples, oranges, kiwi
22% $286,000
Unknown at this time Primarily prepared main courses for the lunches & Fruits and Vegetables
53% $689,000
Non-locally sourced and are produced in Ontario
Cheeses, fresh fruits and vegetables
5% $65,000
Based on budget allocations, it can be estimated that for the 37 child care centres examined, at least 20% of the food budget is invested in locally sourced products such as milk, eggs, poultry products and most meat products.
It is also clear that a significant percentage of food is sourced from outside Ontario. In most cases such products cannot be grown or can not be easily grown in Ontario. This
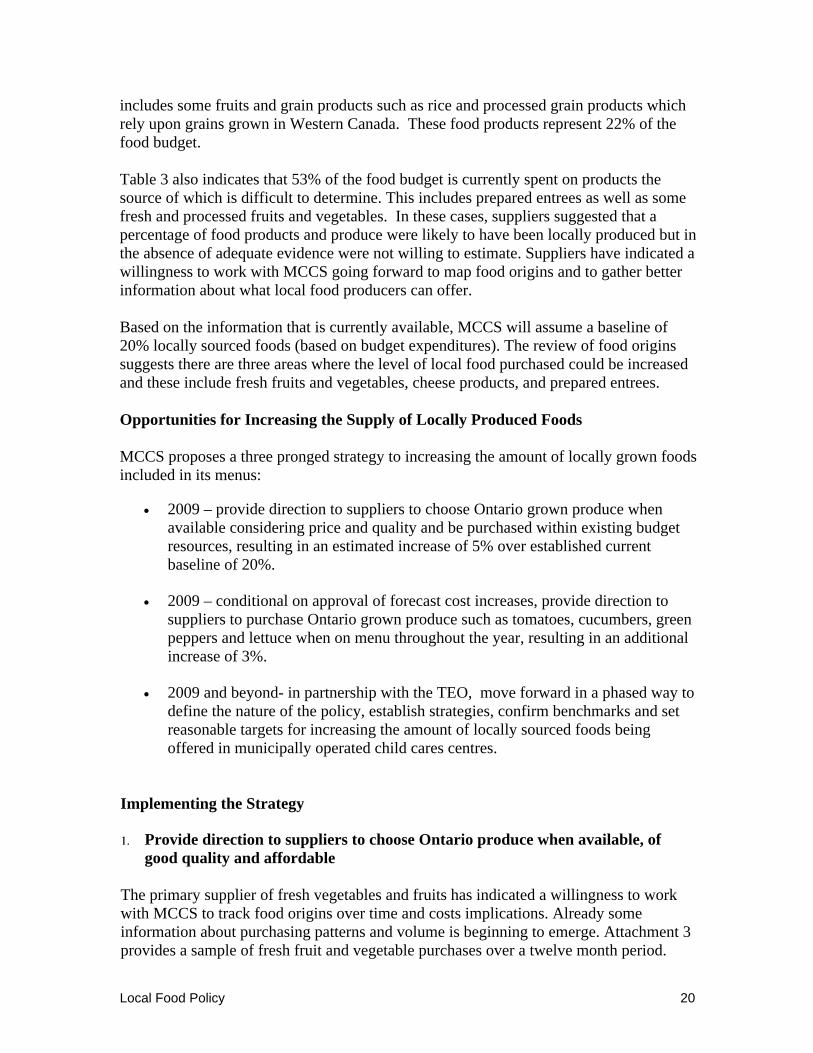
Local Food Policy 20
includes some fruits and grain products such as rice and processed grain products which rely upon grains grown in Western Canada. These food products represent 22% of the food budget.
Table 3 also indicates that 53% of the food budget is currently spent on products the source of which is difficult to determine. This includes prepared entrees as well as some fresh and processed fruits and vegetables. In these cases, suppliers suggested that a percentage of food products and produce were likely to have been locally produced but in the absence of adequate evidence were not willing to estimate. Suppliers have indicated a willingness to work with MCCS going forward to map food origins and to gather better information about what local food producers can offer.
Based on the information that is currently available, MCCS will assume a baseline of 20% locally sourced foods (based on budget expenditures). The review of food origins suggests there are three areas where the level of local food purchased could be increased and these include fresh fruits and vegetables, cheese products, and prepared entrees.
Opportunities for Increasing the Supply of Locally Produced Foods
MCCS proposes a three pronged strategy to increasing the amount of locally grown foods included in its menus:
2009 – provide direction to suppliers to choose Ontario grown produce when available considering price and quality and be purchased within existing budget resources, resulting in an estimated increase of 5% over established current baseline of 20%.
2009 – conditional on approval of forecast cost increases, provide direction to suppliers to purchase Ontario grown produce such as tomatoes, cucumbers, green peppers and lettuce when on menu throughout the year, resulting in an additional increase of 3%.
2009 and beyond- in partnership with the TEO, move forward in a phased way to define the nature of the policy, establish strategies, confirm benchmarks and set reasonable targets for increasing the amount of locally sourced foods being offered in municipally operated child cares centres.
Implementing the Strategy
Provide direction to suppliers to choose Ontario produce when available, of good quality and affordable
The primary supplier of fresh vegetables and fruits has indicated a willingness to work with MCCS to track food origins over time and costs implications. Already some information about purchasing patterns and volume is beginning to emerge. Attachment 3 provides a sample of fresh fruit and vegetable purchases over a twelve month period.
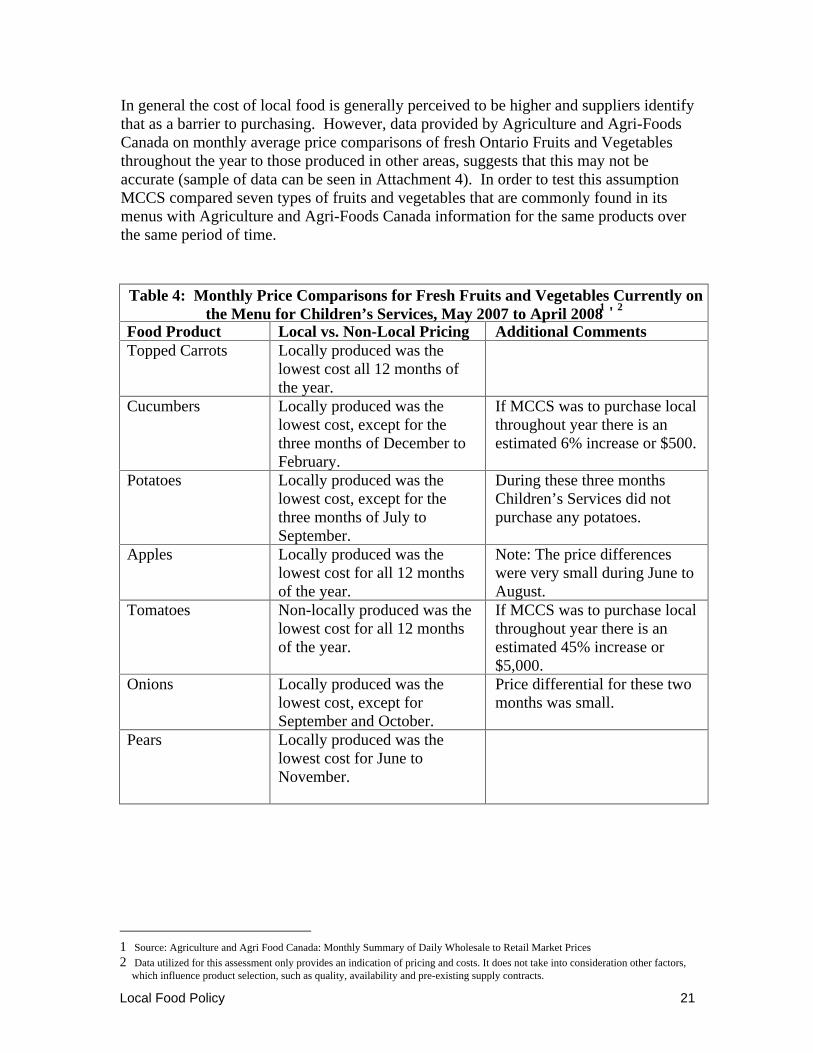
Local Food Policy 21
In general the cost of local food is generally perceived to be higher and suppliers identify that as a barrier to purchasing. However, data provided by Agriculture and Agri-Foods Canada on monthly average price comparisons of fresh Ontario Fruits and Vegetables throughout the year to those produced in other areas, suggests that this may not be accurate (sample of data can be seen in Attachment 4). In order to test this assumption MCCS compared seven types of fruits and vegetables that are commonly found in its menus with Agriculture and Agri-Foods Canada information for the same products over the same period of time.
Table 4: Monthly Price Comparisons for Fresh Fruits and Vegetables Currently on the Menu for Children’s Services, May 2007 to April 20081 ' 2
Food Product Local vs. Non-Local Pricing Additional Comments Topped Carrots Locally produced was the
lowest cost all 12 months of the year.
Cucumbers Locally produced was the lowest cost, except for the three months of December to February.
If MCCS was to purchase local throughout year there is an estimated 6% increase or $500.
Potatoes Locally produced was the lowest cost, except for the three months of July to September.
During these three months Children’s Services did not purchase any potatoes.
Apples Locally produced was the lowest cost for all 12 months of the year.
Note: The price differences were very small during June to August.
Tomatoes Non-locally produced was the lowest cost for all 12 months of the year.
If MCCS was to purchase local throughout year there is an estimated 45% increase or $5,000.
Onions Locally produced was the lowest cost, except for September and October.
Price differential for these two months was small.
Pears Locally produced was the lowest cost for June to November.
1 Source: Agriculture and Agri Food Canada: Monthly Summary of Daily Wholesale to Retail Market Prices
2 Data utilized for this assessment only provides an indication of pricing and costs. It does not take into consideration other factors, which influence product selection, such as quality, availability and pre-existing supply contracts.
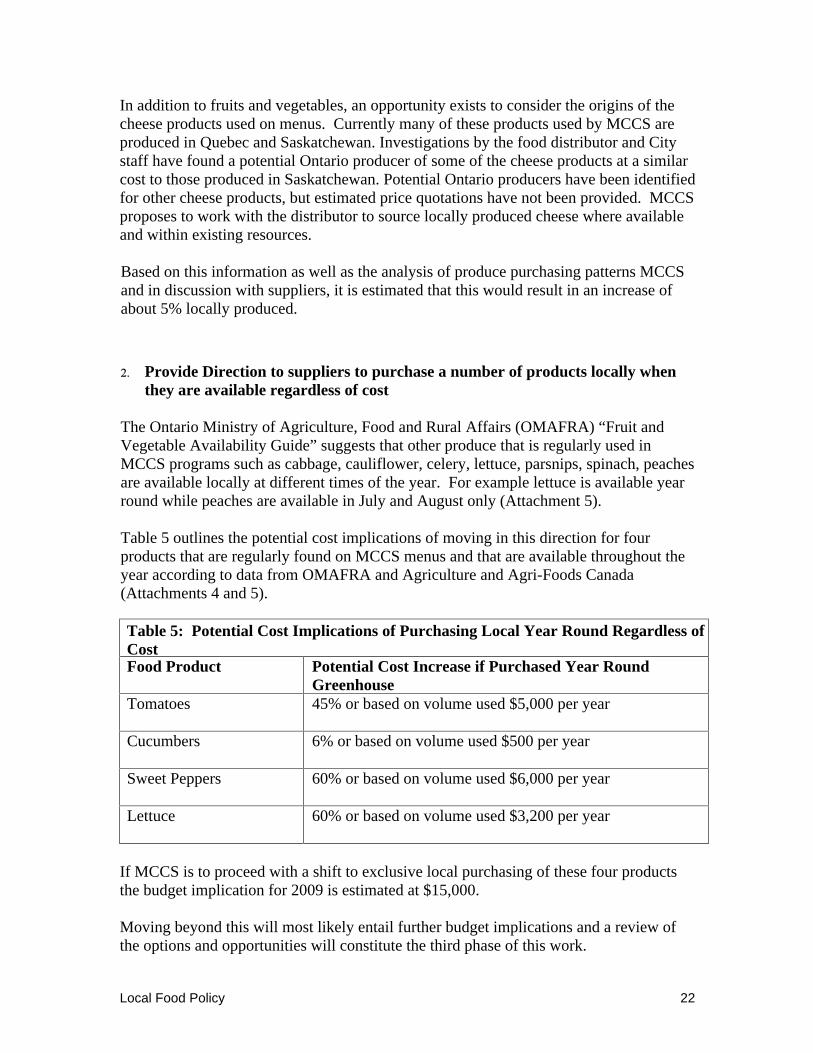
Local Food Policy 22
In addition to fruits and vegetables, an opportunity exists to consider the origins of the cheese products used on menus. Currently many of these products used by MCCS are produced in Quebec and Saskatchewan. Investigations by the food distributor and City staff have found a potential Ontario producer of some of the cheese products at a similar cost to those produced in Saskatchewan. Potential Ontario producers have been identified for other cheese products, but estimated price quotations have not been provided. MCCS proposes to work with the distributor to source locally produced cheese where available and within existing resources.
Based on this information as well as the analysis of produce purchasing patterns MCCS and in discussion with suppliers, it is estimated that this would result in an increase of about 5% locally produced.
Provide Direction to suppliers to purchase a number of products locally when they are available regardless of cost
The Ontario Ministry of Agriculture, Food and Rural Affairs (OMAFRA) “Fruit and Vegetable Availability Guide” suggests that other produce that is regularly used in MCCS programs such as cabbage, cauliflower, celery, lettuce, parsnips, spinach, peaches are available locally at different times of the year. For example lettuce is available year round while peaches are available in July and August only (Attachment 5).
Table 5 outlines the potential cost implications of moving in this direction for four products that are regularly found on MCCS menus and that are available throughout the year according to data from OMAFRA and Agriculture and Agri-Foods Canada (Attachments 4 and 5).
Table 5: Potential Cost Implications of Purchasing Local Year Round Regardless of Cost Food Product Potential Cost Increase if Purchased Year Round
Greenhouse Tomatoes 45% or based on volume used $5,000 per year
Cucumbers 6% or based on volume used $500 per year
Sweet Peppers 60% or based on volume used $6,000 per year
Lettuce 60% or based on volume used $3,200 per year
If MCCS is to proceed with a shift to exclusive local purchasing of these four products the budget implication for 2009 is estimated at $15,000.
Moving beyond this will most likely entail further budget implications and a review of the options and opportunities will constitute the third phase of this work.
Local Food Policy 23
In partnership with the TEO move forward in a phased way to define the nature of the policy, establish strategies, confirm benchmarks and set reasonable targets for the next phase of implementation in Toronto Children’s Services
Additional opportunities may exist to work with the manufacturers of prepared entrees to determine the origins of the ingredients used. Toronto Children’s Services proposes to work closely with the current manufacturer of entrees in the upcoming year to identify opportunities where locally produced ingredients can be increased.
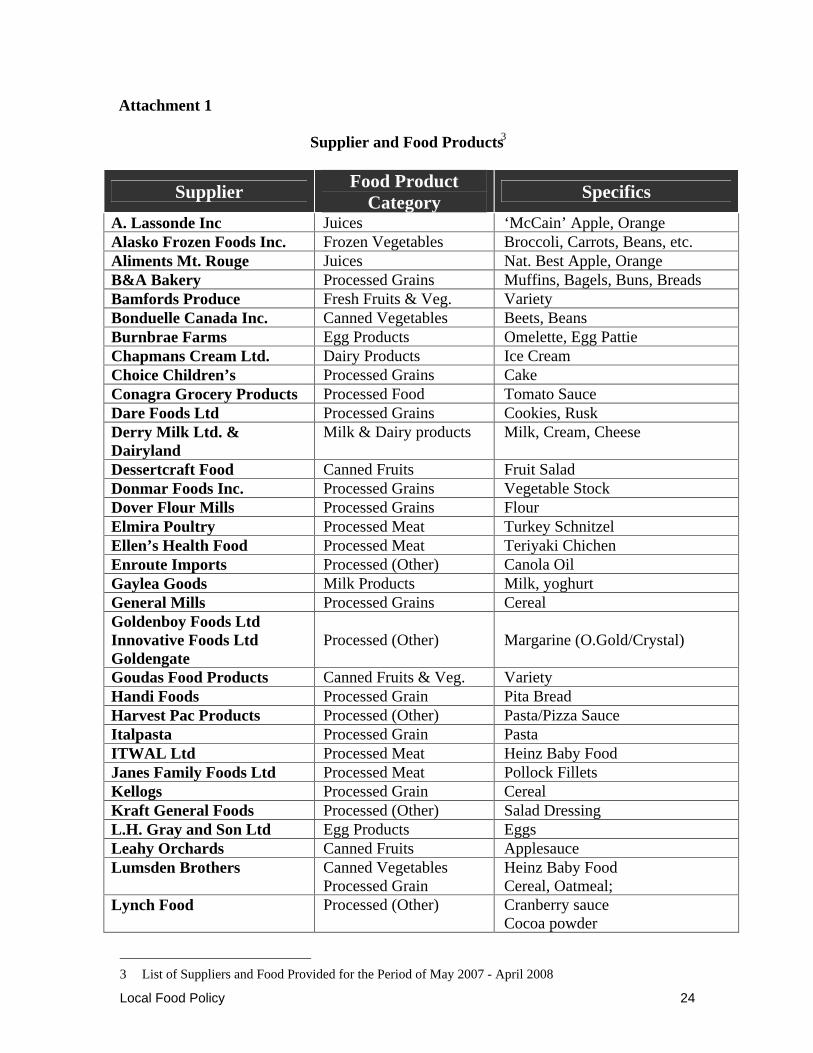
Local Food Policy 24
Attachment 1
Supplier and Food Products3
Supplier Food Product
Category Specifics
A. Lassonde Inc Juices ‘McCain’ Apple, Orange Alasko Frozen Foods Inc. Frozen Vegetables Broccoli, Carrots, Beans, etc. Aliments Mt. Rouge Juices Nat. Best Apple, Orange B&A Bakery Processed Grains Muffins, Bagels, Buns, Breads Bamfords Produce Fresh Fruits & Veg. Variety Bonduelle Canada Inc. Canned Vegetables Beets, Beans Burnbrae Farms Egg Products Omelette, Egg Pattie Chapmans Cream Ltd. Dairy Products Ice Cream Choice Children’s Processed Grains Cake Conagra Grocery Products Processed Food Tomato Sauce Dare Foods Ltd Processed Grains Cookies, Rusk Derry Milk Ltd. & Dairyland
Milk & Dairy products Milk, Cream, Cheese
Dessertcraft Food Canned Fruits Fruit Salad Donmar Foods Inc. Processed Grains Vegetable Stock Dover Flour Mills Processed Grains Flour Elmira Poultry Processed Meat Turkey Schnitzel Ellen’s Health Food Processed Meat Teriyaki Chichen Enroute Imports Processed (Other) Canola Oil Gaylea Goods Milk Products Milk, yoghurt General Mills Processed Grains Cereal Goldenboy Foods Ltd Innovative Foods Ltd Goldengate
Processed (Other) Margarine (O.Gold/Crystal)
Goudas Food Products Canned Fruits & Veg. Variety Handi Foods Processed Grain Pita Bread Harvest Pac Products Processed (Other) Pasta/Pizza Sauce Italpasta Processed Grain Pasta ITWAL Ltd Processed Meat Heinz Baby Food Janes Family Foods Ltd Processed Meat Pollock Fillets Kellogs Processed Grain Cereal Kraft General Foods Processed (Other) Salad Dressing L.H. Gray and Son Ltd Egg Products Eggs Leahy Orchards Canned Fruits Applesauce Lumsden Brothers Canned Vegetables
Processed Grain Heinz Baby Food Cereal, Oatmeal;
Lynch Food Processed (Other) Cranberry sauce Cocoa powder
3 List of Suppliers and Food Provided for the Period of May 2007 - April 2008
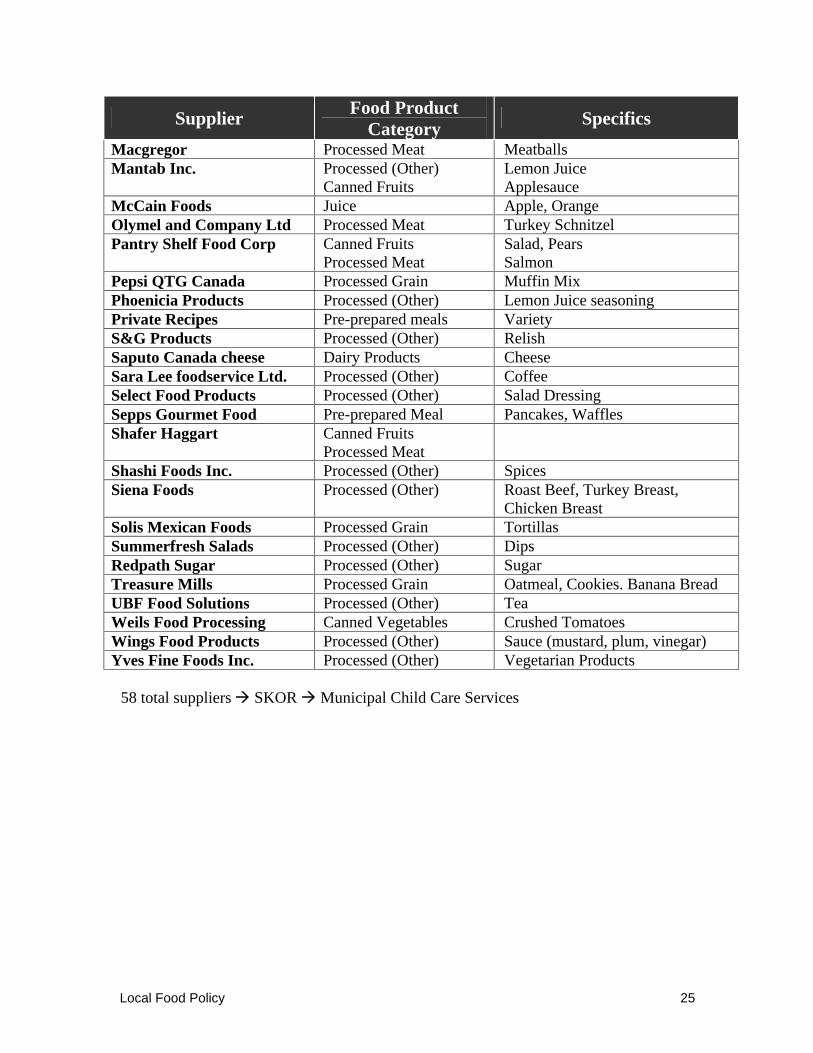
Local Food Policy 25
Supplier Food Product
Category Specifics
Macgregor Processed Meat Meatballs Mantab Inc. Processed (Other)
Canned Fruits Lemon Juice Applesauce
McCain Foods Juice Apple, Orange Olymel and Company Ltd Processed Meat Turkey Schnitzel Pantry Shelf Food Corp Canned Fruits
Processed Meat Salad, Pears Salmon
Pepsi QTG Canada Processed Grain Muffin Mix Phoenicia Products Processed (Other) Lemon Juice seasoning Private Recipes Pre-prepared meals Variety S&G Products Processed (Other) Relish Saputo Canada cheese Dairy Products Cheese Sara Lee foodservice Ltd. Processed (Other) Coffee Select Food Products Processed (Other) Salad Dressing Sepps Gourmet Food Pre-prepared Meal Pancakes, Waffles Shafer Haggart Canned Fruits
Processed Meat Shashi Foods Inc. Processed (Other) Spices Siena Foods Processed (Other) Roast Beef, Turkey Breast,
Chicken Breast Solis Mexican Foods Processed Grain Tortillas Summerfresh Salads Processed (Other) Dips Redpath Sugar Processed (Other) Sugar Treasure Mills Processed Grain Oatmeal, Cookies. Banana Bread UBF Food Solutions Processed (Other) Tea Weils Food Processing Canned Vegetables Crushed Tomatoes Wings Food Products Processed (Other) Sauce (mustard, plum, vinegar) Yves Fine Foods Inc. Processed (Other) Vegetarian Products
58 total suppliers SKOR Municipal Child Care Services
Local Food Policy 26
Attachment 2
Sample Questions asked to Suppliers - MCCS and Local Food Policy
1) Is it possible to identify where each item used is grown? Wherever possible, could you provide a list detailing the origin of each item?
2) Is the ingredient in question 'grown' or just 'processed' in Ontario/Canada?
4) Does the percentage of locally grown food bought vary by season?
5) Does your company currently have a policy around the purchase of local food?
6) What factors influence your ability to purchase locally grown food?
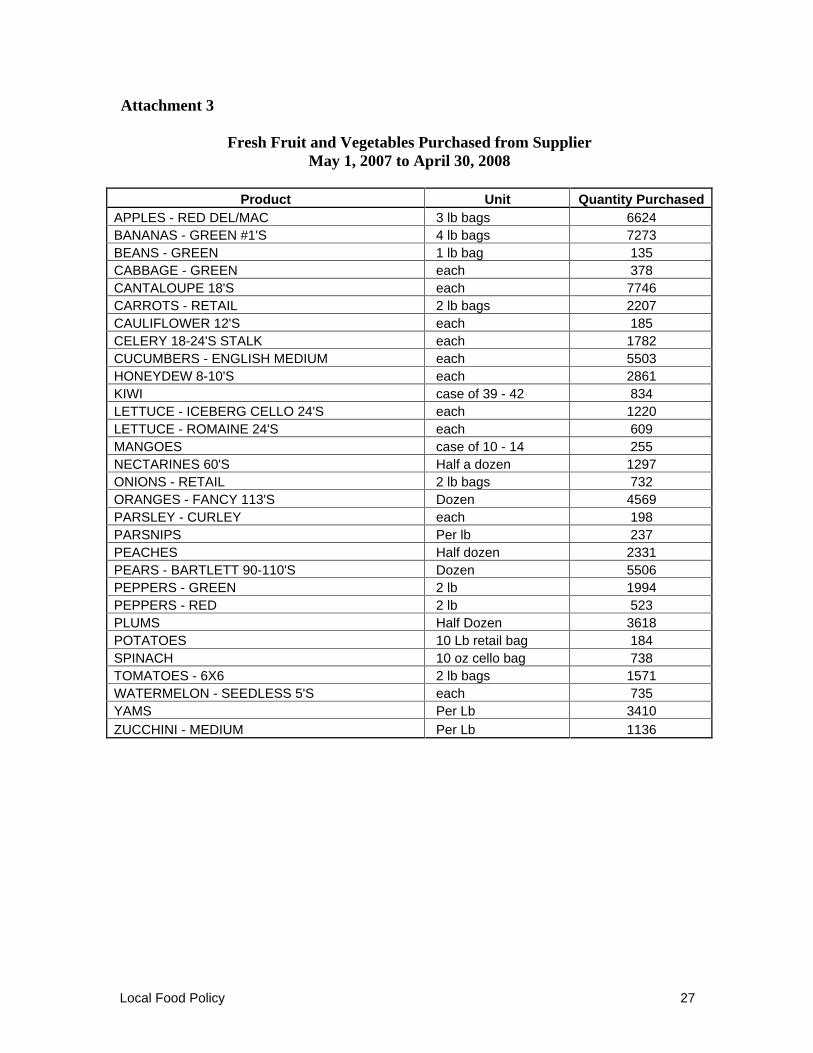
Local Food Policy 27
Attachment 3
Fresh Fruit and Vegetables Purchased from Supplier May 1, 2007 to April 30, 2008
Product Unit Quantity Purchased APPLES - RED DEL/MAC 3 lb bags 6624 BANANAS - GREEN #1'S 4 lb bags 7273 BEANS - GREEN 1 lb bag 135 CABBAGE - GREEN each 378 CANTALOUPE 18'S each 7746 CARROTS - RETAIL 2 lb bags 2207 CAULIFLOWER 12'S each 185 CELERY 18-24'S STALK each 1782 CUCUMBERS - ENGLISH MEDIUM each 5503 HONEYDEW 8-10'S each 2861 KIWI case of 39 - 42 834 LETTUCE - ICEBERG CELLO 24'S each 1220 LETTUCE - ROMAINE 24'S each 609 MANGOES case of 10 - 14 255 NECTARINES 60'S Half a dozen 1297 ONIONS - RETAIL 2 lb bags 732 ORANGES - FANCY 113'S Dozen 4569 PARSLEY - CURLEY each 198 PARSNIPS Per lb 237 PEACHES Half dozen 2331 PEARS - BARTLETT 90-110'S Dozen 5506 PEPPERS - GREEN 2 lb 1994 PEPPERS - RED 2 lb 523 PLUMS Half Dozen 3618 POTATOES 10 Lb retail bag 184 SPINACH 10 oz cello bag 738 TOMATOES - 6X6 2 lb bags 1571 WATERMELON - SEEDLESS 5'S each 735 YAMS Per Lb 3410 ZUCCHINI - MEDIUM Per Lb 1136
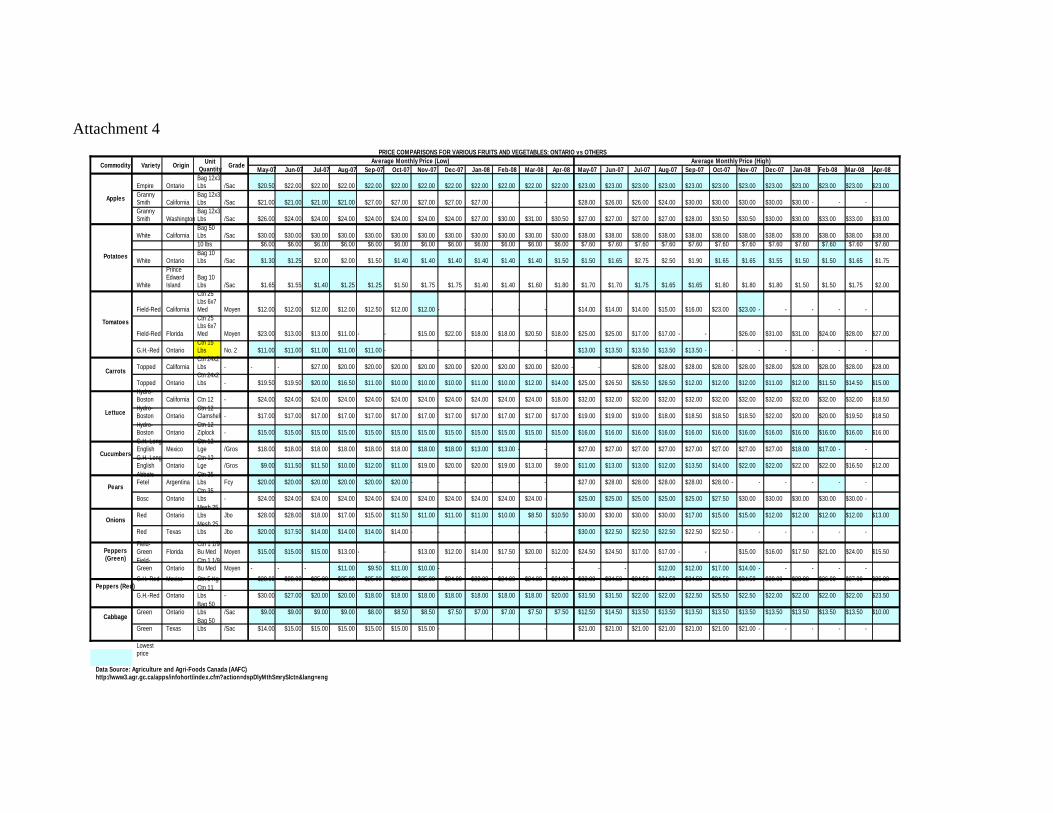
Attachment 4
PRICE COMPARISONS FOR VARIOUS FRUITS AND VEGETABLES: ONTARIO vs OTHERS
Commodity Variety Origin GradeAverage Monthly Price (Low) Average Monthly Price (High)
May-07 Jun-07 Jul-07 Aug-07 Sep-07 Oct-07 Nov-07 Dec-07 Jan-08 Feb-08 Mar-08 Apr-08 May-07 Jun-07 Jul-07 Aug-07 Sep-07 Oct-07 Nov-07 Dec-07 Jan-08 Feb-08 Mar-08 Apr-08
Apples
Empire Ontario /Sac $20.50 $22.00 $22.00 $22.00 $22.00 $22.00 $22.00 $22.00 $22.00 $22.00 $22.00 $22.00 $23.00 $23.00 $23.00 $23.00 $23.00 $23.00 $23.00 $23.00 $23.00 $23.00 $23.00 $23.00
California /Sac $21.00 $21.00 $21.00 $21.00 $27.00 $27.00 $27.00 $27.00 $27.00 - - - $28.00 $26.00 $26.00 $24.00 $30.00 $30.00 $30.00 $30.00 $30.00 - - -
Washington /Sac $26.00 $24.00 $24.00 $24.00 $24.00 $24.00 $24.00 $24.00 $27.00 $30.00 $31.00 $30.50 $27.00 $27.00 $27.00 $27.00 $28.00 $30.50 $30.50 $30.00 $30.00 $33.00 $33.00 $33.00
Potatoes
White California /Sac $30.00 $30.00 $30.00 $30.00 $30.00 $30.00 $30.00 $30.00 $30.00 $30.00 $30.00 $30.00 $38.00 $38.00 $38.00 $38.00 $38.00 $38.00 $38.00 $38.00 $38.00 $38.00 $38.00 $38.00 10 lbs $6.00 $6.00 $6.00 $6.00 $6.00 $6.00 $6.00 $6.00 $6.00 $6.00 $6.00 $6.00 $7.60 $7.60 $7.60 $7.60 $7.60 $7.60 $7.60 $7.60 $7.60 $7.60 $7.60 $7.60
White Ontario /Sac $1.30 $1.25 $2.00 $2.00 $1.50 $1.40 $1.40 $1.40 $1.40 $1.40 $1.40 $1.50 $1.50 $1.65 $2.75 $2.50 $1.90 $1.65 $1.65 $1.55 $1.50 $1.50 $1.65 $1.75
White /Sac $1.65 $1.55 $1.40 $1.25 $1.25 $1.50 $1.75 $1.75 $1.40 $1.40 $1.60 $1.80 $1.70 $1.70 $1.75 $1.65 $1.65 $1.80 $1.80 $1.80 $1.50 $1.50 $1.75 $2.00
Tomatoes
Field-Red California Moyen $12.00 $12.00 $12.00 $12.00 $12.50 $12.00 $12.00 - - - - - $14.00 $14.00 $14.00 $15.00 $16.00 $23.00 $23.00 - - - - -
Field-Red Florida Moyen $23.00 $13.00 $13.00 $11.00 - - $15.00 $22.00 $18.00 $18.00 $20.50 $18.00 $25.00 $25.00 $17.00 $17.00 - - $26.00 $31.00 $31.00 $24.00 $28.00 $27.00
G.H.-Red Ontario No. 2 $11.00 $11.00 $11.00 $11.00 $11.00 - - - - - - - $13.00 $13.50 $13.50 $13.50 $13.50 - - - - - - -
CarrotsTopped California - - - $27.00 $20.00 $20.00 $20.00 $20.00 $20.00 $20.00 $20.00 $20.00 $20.00 - - $28.00 $28.00 $28.00 $28.00 $28.00 $28.00 $28.00 $28.00 $28.00 $28.00
Topped Ontario - $19.50 $19.50 $20.00 $16.50 $11.00 $10.00 $10.00 $10.00 $11.00 $10.00 $12.00 $14.00 $25.00 $26.50 $26.50 $26.50 $12.00 $12.00 $12.00 $11.00 $12.00 $11.50 $14.50 $15.00
Lettuce
California Ctn 12 - $24.00 $24.00 $24.00 $24.00 $24.00 $24.00 $24.00 $24.00 $24.00 $24.00 $24.00 $18.00 $32.00 $32.00 $32.00 $32.00 $32.00 $32.00 $32.00 $32.00 $32.00 $32.00 $32.00 $18.50
Ontario - $17.00 $17.00 $17.00 $17.00 $17.00 $17.00 $17.00 $17.00 $17.00 $17.00 $17.00 $17.00 $19.00 $19.00 $19.00 $18.00 $18.50 $18.50 $18.50 $22.00 $20.00 $20.00 $19.50 $18.50
Ontario - $15.00 $15.00 $15.00 $15.00 $15.00 $15.00 $15.00 $15.00 $15.00 $15.00 $15.00 $15.00 $16.00 $16.00 $16.00 $16.00 $16.00 $16.00 $16.00 $16.00 $16.00 $16.00 $16.00 $16.00
CucumbersMexico /Gros $18.00 $18.00 $18.00 $18.00 $18.00 $18.00 $18.00 $18.00 $13.00 $13.00 - - $27.00 $27.00 $27.00 $27.00 $27.00 $27.00 $27.00 $27.00 $18.00 $17.00 - -
Ontario /Gros $9.00 $11.50 $11.50 $10.00 $12.00 $11.00 $19.00 $20.00 $20.00 $19.00 $13.00 $9.00 $11.00 $13.00 $13.00 $12.00 $13.50 $14.00 $22.00 $22.00 $22.00 $22.00 $16.50 $12.00
PearsArgentina Fcy $20.00 $20.00 $20.00 $20.00 $20.00 $20.00 - - - - - - $27.00 $28.00 $28.00 $28.00 $28.00 $28.00 - - - - - -
Bosc Ontario - $24.00 $24.00 $24.00 $24.00 $24.00 $24.00 $24.00 $24.00 $24.00 $24.00 $24.00 - $25.00 $25.00 $25.00 $25.00 $25.00 $27.50 $30.00 $30.00 $30.00 $30.00 $30.00 -
OnionsRed Ontario Jbo $28.00 $28.00 $18.00 $17.00 $15.00 $11.50 $11.00 $11.00 $11.00 $10.00 $8.50 $10.50 $30.00 $30.00 $30.00 $30.00 $17.00 $15.00 $15.00 $12.00 $12.00 $12.00 $12.00 $13.00
Red Texas Jbo $20.00 $17.50 $14.00 $14.00 $14.00 $14.00 - - - - - - $30.00 $22.50 $22.50 $22.50 $22.50 $22.50 - - - - - -
Florida Moyen $15.00 $15.00 $15.00 $13.00 - - $13.00 $12.00 $14.00 $17.50 $20.00 $12.00 $24.50 $24.50 $17.00 $17.00 - - $15.00 $16.00 $17.50 $21.00 $24.00 $15.50
Ontario Moyen - - - $11.00 $9.50 $11.00 $10.00 - - - - - - - - $12.00 $12.00 $17.00 $14.00 - - - - -
Peppers (Red)G.H.-Red Mexico Ctn 5 Kg - $28.00 $28.00 $25.00 $25.00 $25.00 $25.00 $25.00 $24.00 $22.00 $24.00 $24.00 $24.00 $32.00 $34.50 $34.50 $34.50 $34.50 $34.50 $34.50 $28.00 $28.00 $26.00 $27.00 $26.00
G.H.-Red Ontario - $30.00 $27.00 $20.00 $20.00 $18.00 $18.00 $18.00 $18.00 $18.00 $18.00 $18.00 $20.00 $31.50 $31.50 $22.00 $22.00 $22.50 $25.50 $22.50 $22.00 $22.00 $22.00 $22.00 $23.50
CabbageGreen Ontario /Sac $9.00 $9.00 $9.00 $9.00 $8.00 $8.50 $8.50 $7.50 $7.00 $7.00 $7.50 $7.50 $12.50 $14.50 $13.50 $13.50 $13.50 $13.50 $13.50 $13.50 $13.50 $13.50 $13.50 $10.00
Green Texas /Sac $14.00 $15.00 $15.00 $15.00 $15.00 $15.00 $15.00 - - - - - $21.00 $21.00 $21.00 $21.00 $21.00 $21.00 $21.00 - - - - -
Unit Quantity
Bag 12x3 Lbs
Granny Smith
Bag 12x3 Lbs
Granny Smith
Bag 12x3 LbsBag 50 Lbs
Bag 10 Lbs
Prince Edward Island
Bag 10 LbsCtn 25 Lbs 6x7 MedCtn 25 Lbs 6x7 MedCtn 15 LbsCtn 24x2 LbsCtn 24x2 Lbs
Hydro-BostonHydro-Boston
Ctn 12 Clamshell
Hydro-Boston
Ctn 12 Ziplock
G.H.-Long English
Ctn 12 Lge
G.H.-Long English
Ctn 12 Lge
Abbate Fetel
Ctn 35 LbsCtn 35 LbsMesh 25 LbsMesh 25 Lbs
Peppers (Green)
Field-Green
Ctn 1 1/9 Bu Med
Field-Green
Ctn 1 1/9 Bu Med
Ctn 11 LbsBag 50 LbsBag 50 Lbs
Lowest price
Data Source: Agriculture and Agri-Foods Canada (AAFC)http://www3.agr.gc.ca/apps/infohort/index.cfm?action=dspDlyMthSmrySlctn&lang=eng

Attachment 5
Ontario Ministry of Agriculture and Food “Rural Affairs Fruit and Vegetable Availability Guide”
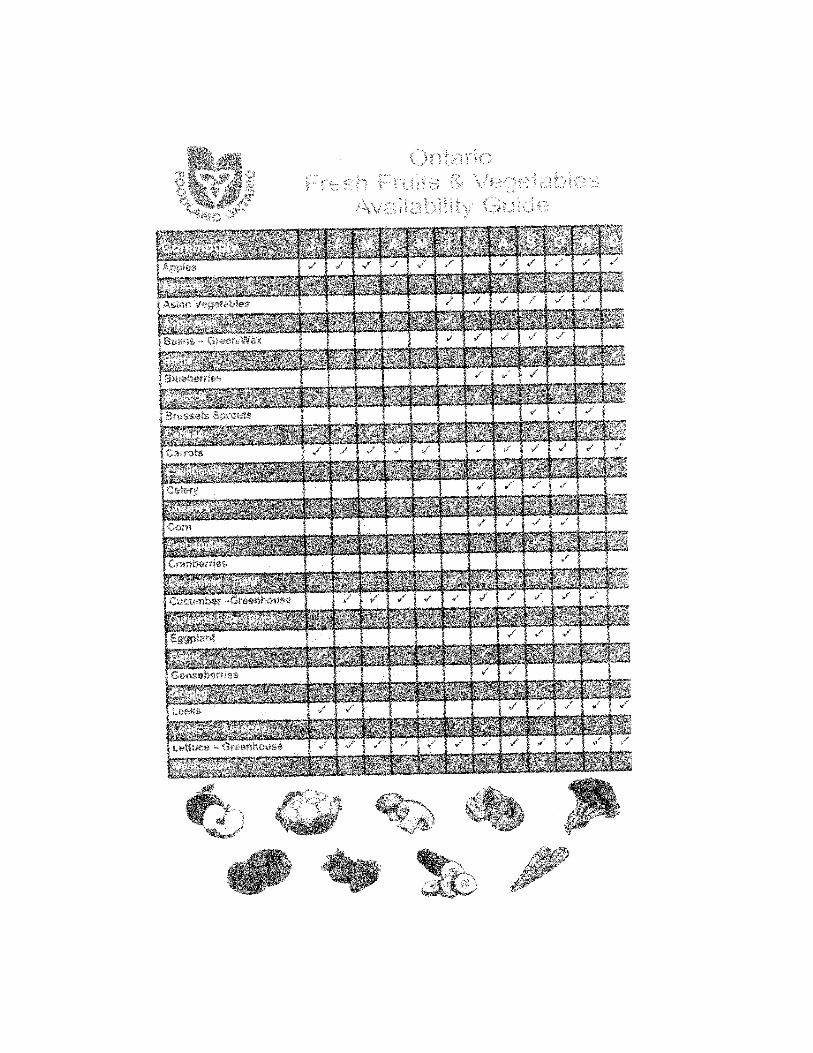
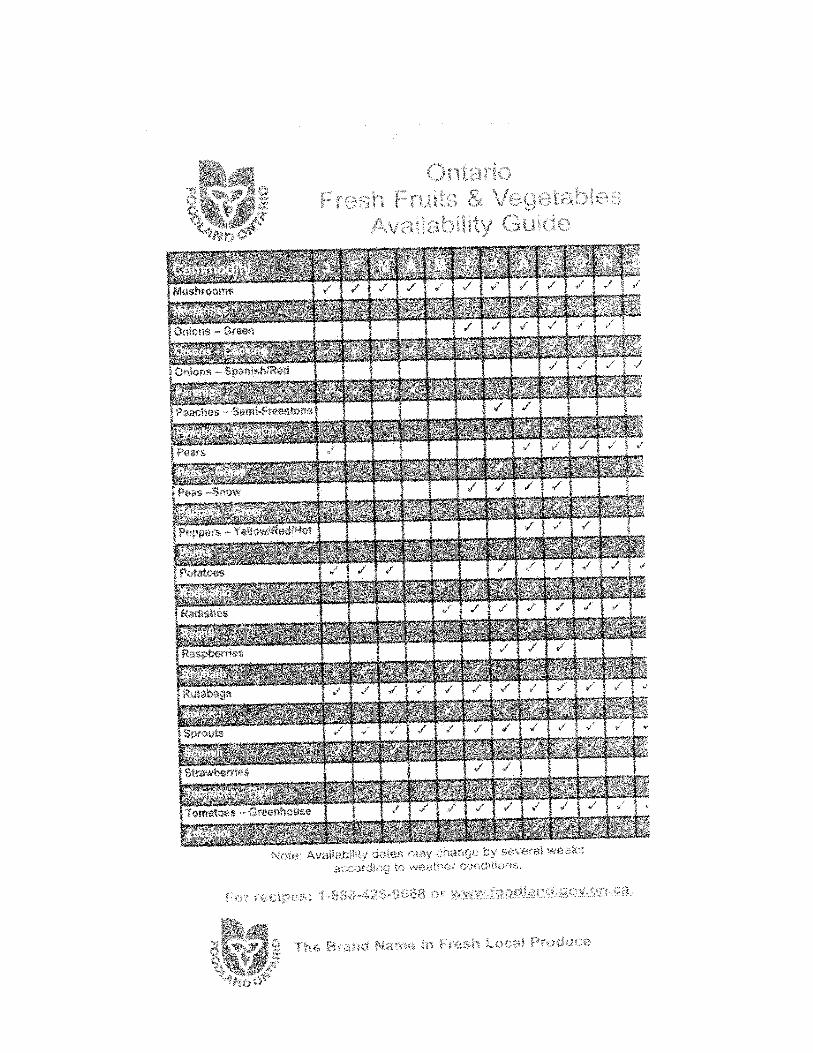
Appendix A: Case Study Legislation
City of Toronto Food Charter
I II III IV V
Chatham County-Savannah Metropolitan Planning Commission A38 Rediscovering Roots | 2011
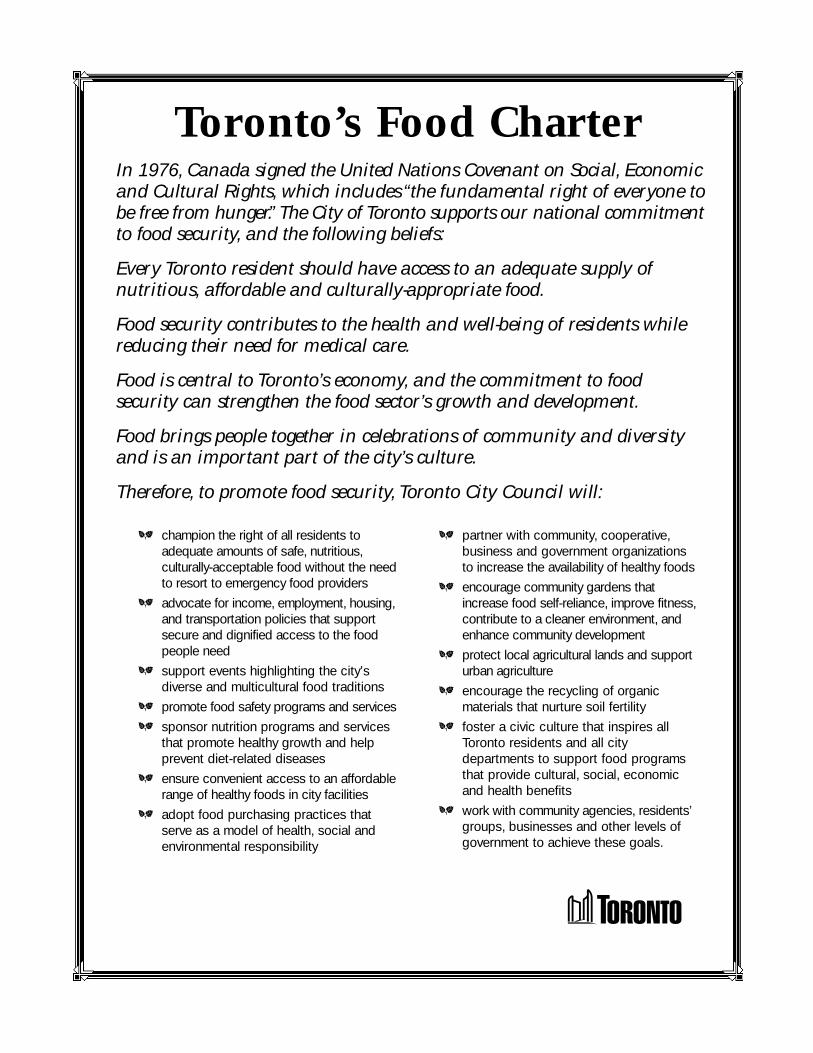
0 Food and Hunger Committee Phase II Report, December 2000 0
a champion the right of all residents to adequate amounts of safe, nutritious, culturally-acceptable food without the needto resort to emergency food providers
a advocate for income, employment, housing,and transportation policies that supportsecure and dignified access to the foodpeople need
a support events highlighting the city’sdiverse and multicultural food traditions
a promote food safety programs and servicesa sponsor nutrition programs and services
that promote healthy growth and helpprevent diet-related diseases
a ensure convenient access to an affordablerange of healthy foods in city facilities
a adopt food purchasing practices thatserve as a model of health, social andenvironmental responsibility
a partner with community, cooperative, business and government organizationsto increase the availability of healthy foods
a encourage community gardens thatincrease food self-reliance, improve fitness,contribute to a cleaner environment, andenhance community development
a protect local agricultural lands and supporturban agriculture
a encourage the recycling of organic materials that nurture soil fertility
a foster a civic culture that inspires allToronto residents and all city departments to support food programsthat provide cultural, social, economicand health benefits
a work with community agencies, residents’groups, businesses and other levels ofgovernment to achieve these goals.
In 1976, Canada signed the United Nations Covenant on Social, Economicand Cultural Rights, which includes “the fundamental right of everyone tobe free from hunger.” The City of Toronto supports our national commitmentto food security, and the following beliefs:
Every Toronto resident should have access to an adequate supply of nutritious, affordable and culturally-appropriate food.
Food security contributes to the health and well-being of residents whilereducing their need for medical care.
Food is central to Toronto’s economy, and the commitment to food security can strengthen the food sector’s growth and development.
Food brings people together in celebrations of community and diversityand is an important part of the city’s culture.
Therefore, to promote food security, Toronto City Council will:
Toronto’s Food Charter
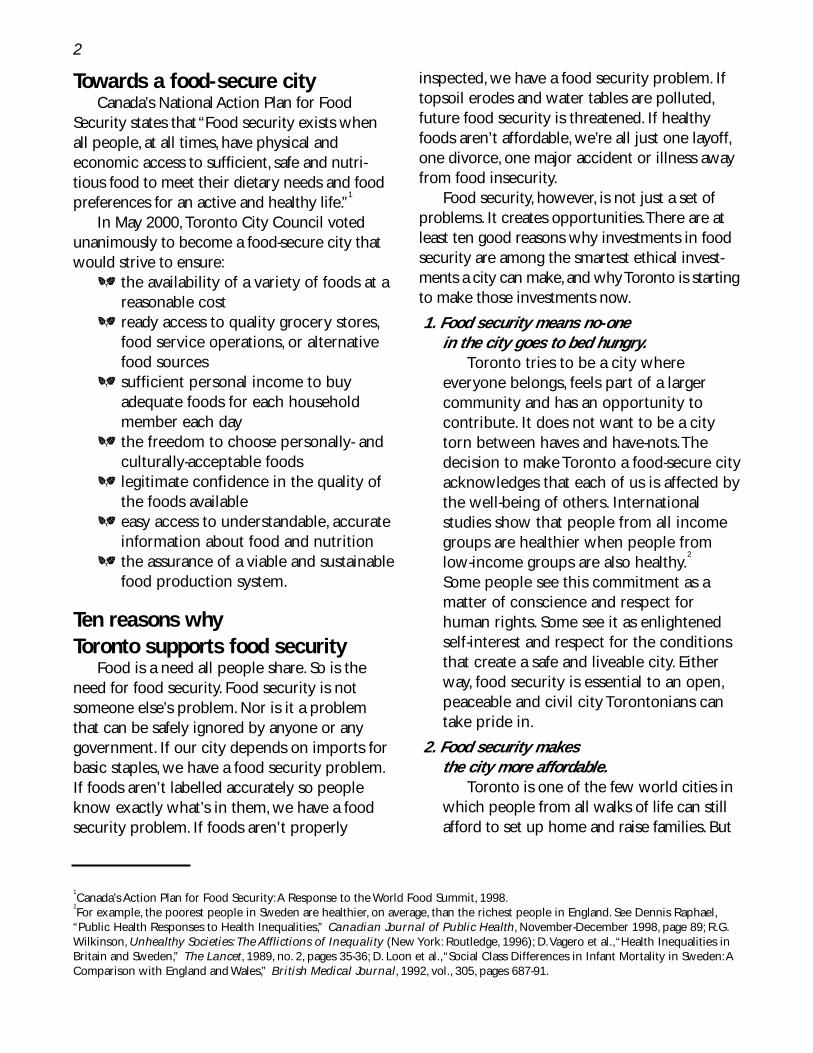
2 Food and Hunger Committee Phase II Report, December 2000 0
Towards a food-secure cityCanada’s National Action Plan for Food
Security states that “Food security exists whenall people, at all times, have physical and economic access to sufficient, safe and nutri-tious food to meet their dietary needs and foodpreferences for an active and healthy life.”
1
In May 2000,Toronto City Council votedunanimously to become a food-secure city thatwould strive to ensure:
a the availability of a variety of foods at areasonable cost
a ready access to quality grocery stores,food service operations, or alternativefood sources
a sufficient personal income to buy adequate foods for each householdmember each day
a the freedom to choose personally- andculturally-acceptable foods
a legitimate confidence in the quality ofthe foods available
a easy access to understandable, accurateinformation about food and nutrition
a the assurance of a viable and sustainablefood production system.
Ten reasons why Toronto supports food security
Food is a need all people share. So is theneed for food security. Food security is notsomeone else’s problem. Nor is it a problemthat can be safely ignored by anyone or any government. If our city depends on imports forbasic staples, we have a food security problem.If foods aren’t labelled accurately so peopleknow exactly what’s in them, we have a foodsecurity problem. If foods aren’t properly
inspected, we have a food security problem. Iftopsoil erodes and water tables are polluted,future food security is threatened. If healthyfoods aren’t affordable, we’re all just one layoff,one divorce, one major accident or illness awayfrom food insecurity.
Food security, however, is not just a set ofproblems. It creates opportunities.There are atleast ten good reasons why investments in foodsecurity are among the smartest ethical invest-ments a city can make,and why Toronto is startingto make those investments now.
1. Food security means no-one in the city goes to bed hungry.
Toronto tries to be a city where everyone belongs, feels part of a largercommunity and has an opportunity to contribute. It does not want to be a citytorn between haves and have-nots.Thedecision to make Toronto a food-secure cityacknowledges that each of us is affected bythe well-being of others. International studies show that people from all incomegroups are healthier when people fromlow-income groups are also healthy.
2
Some people see this commitment as amatter of conscience and respect forhuman rights. Some see it as enlightenedself-interest and respect for the conditionsthat create a safe and liveable city. Eitherway, food security is essential to an open,peaceable and civil city Torontonians cantake pride in.
2. Food security makes the city more affordable.
Toronto is one of the few world cities inwhich people from all walks of life can stillafford to set up home and raise families. But
1Canada’s Action Plan for Food Security:A Response to the World Food Summit, 1998.
2For example, the poorest people in Sweden are healthier, on average, than the richest people in England. See Dennis Raphael,“Public Health Responses to Health Inequalities,” Canadian Journal of Public Health, November-December 1998, page 89; R.G.Wilkinson, Unhealthy Societies: The Afflictions of Inequality (New York: Routledge, 1996); D.Vagero et al.,“Health Inequalities inBritain and Sweden,” The Lancet, 1989, no. 2, pages 35-36; D. Loon et al.,“Social Class Differences in Infant Mortality in Sweden:AComparison with England and Wales,” British Medical Journal, 1992, vol., 305, pages 687-91.
0 Food and Hunger Committee Phase II Report, December 2000 3
it’s an expensive place to live. During the1990s, despite the boom in some economicsectors, the number of Toronto families livingin poverty increased, both absolutely and relatively. Food banks, created as a short-termstopgap during the 1980s,became permanentfixtures in the city.
Measures that enable people to buy andprepare healthy but inexpensive food, or togrow some of their own food, help make thecity more affordable to everyone.
3. Food security means every child gets a head start.
Kids need a nourishing breakfast and agood lunch to get the most from theirschool day. Research proves that childnutrition and learning are closely linked,and that childhood nutritional shortcom-ings can last a lifetime.That’s why schoolnutrition programs are well establishedacross Europe and the United States.
Canada is the only western industrializedcountry that does not have a national childnutrition program. But Toronto gives 65,000children a head start on their day and theirlife with school breakfast, snack and lunchprograms supported by the city, province,volunteers and local businesses.
4. Food security saves on medical care.
A healthy diet is the most cost-effectiveform of health care available. Heart disease,strokes, diabetes and cancer, all of which arerelated to diet, cost Toronto $491 million ayear in medical bills and lost productivity.Many worry that a public and universalhealth care system cannot sustain the burdenof expensive treatments of preventable dis-eases.To protect Canada’s health care system,especially as the population ages and chronicdiseases peak, nutrition needs to be treatedas a first line of defence.
5. Food security means more local jobs.
Unlike people in many world cities,Torontonians rely almost entirely on foodtrucked from thousands of kilometresaway.That means Toronto’s food dollarstravel thousands of kilometres to createjobs elsewhere.
It doesn’t have to be that way, especiallyin a region that has the best farmland inCanada. As recently as 1960, most ofToronto’s food came from within 350 kilometres of the city limits. If even 1.5 % ofToronto’s surface area were made availableto market gardeners and greenhouse operators, we could create a $16 million ayear industry growing 10% of our city’s fresh vegetables. A combination of vacant, under-used land and flat empty roofs makes thatgoal achievable.
6. Food security is environmentally friendly.
The more we rely on the Greater TorontoArea for food, the more we will enjoy freshair and clean water.
Since plants store carbon dioxide andrelease oxygen, gardens improve air quality.Local growers also reduce the need to bringin food by truck.Trucks burn 10 times moreenergy in transit than is in the food itself.Growing 10% of our vegetables in the citywould reduce greenhouse gas emissions by37.9 kilotonnes a year, help meet Toronto’scommitments to reduce global warming,and avoid more than $5 million in environ-mental costs.
3
Plants also absorb rain,and keep rainwaterout of the sewage system, where it’s difficultand costly to treat. Rooftop gardens collectrainfall, and lower a building’s heating andcooling needs. Putting gardens on top of20% of the city-owned buildings in Toronto
3Calculations provided by Rod MacRae, Ph.D., food policy advisor, at the request of the Toronto Food and Hunger Action Committee.
4 Food and Hunger Committee Phase II Report, December 2000 0
would add 16 hectares of green space to thecity, providing food, oxygen and betterstormwater control.
7. Food security reduces traffic pollution.
Unlike many U.S. cities,Toronto boastsquality food stores within easy reach of mostpeople.That’s an amenity worth protecting.
The trend in food retail is to larger storessurrounded by huge parking lots, usuallyaway from populated areas.As a result,peoplewithout cars are at a disadvantage, whileshoppers with cars add to traffic jams andpollution. In a food-secure Toronto, peoplewill live within walking distance of a foodstore and have the opportunity to exercisewhen they do their shopping errands.
8. Food security is good business.Food processing, the city’s largest
industry sector, employs 40,000 workers.More than 120,000 people have food-relatedjobs, in restaurants, shops or marketing. Jobsecurity in these businesses depends on customers with food security.
4
Toronto could create even more jobs bysupplying more of its own food needs. It hasa diverse and cosmopolitan populace thatisn’t always served by mass market products.Some people require halal or kosher meats.Vegetarians, vegans and people with foodsensitivities and allergies all have specialneeds.These people support small, commu-nity-based processors who specialize in filling their special needs.These small companies create food security for theiremployees and customers.
9. Food security means waste not, want not.
A typical family of four generates a tonneof food and packaging waste a year. Most ofit is carted away to landfill sites, at about $60
a tonne.What we waste could be turnedinto any number of resources, includingmethane for clean fuel, livestock feed, orcompost to enrich gardens. A city that isfood-secure knows the difference betweenwaste and the feedstock for another busi-ness or project.
Toronto has many resources waiting tobe used.There is idle land that could bemade into gardens, and greenhouses thatlie empty for part of the year.Those gardenscould use recycled water and rain for irri-gation.The greenhouses can use wasteheat coming from power plants and boilers.Food security is about not throwing opportunities away.
10. Food security is neighbourly.People from all cultures build commu-
nities around food. Seder ceremonies,Eid-al-Fitr festivities, Caribana picnics,family dinners at Thanksgiving, weddingfeasts, anniversary banquets... most peoplecelebrate special events by breaking breadwith companions — the word companioncomes from the Latin for “with” and“bread.” Community gardens also bringpeople together in a project that beautifiesand enlivens a neighbourhood.
Some elderly or disabled residents rarelyenjoy eating with friends and neighbours,but find it difficult to get around, and sooften eat alone. In a food-secure Toronto,they will enjoy more opportunities to joinothers for a meal.
Toronto is the name its original inhabitants used for “meeting place.” Foodhonours that tradition, and helps keepToronto a place where people of manycultures and values enrich the city withtheir distinctive variations on our commonhuman needs.
4Kyle Benham,“An Economic Development Strategy for the Toronto Food Sector,” City of Toronto, May 1998.

Appendix A: Case Study Legislation
City of Jersey City, New Jersey Vacant Lot Leasing
Ordinance
I II III IV V
Chatham County-Savannah Metropolitan Planning Commission A42 Rediscovering Roots | 2011
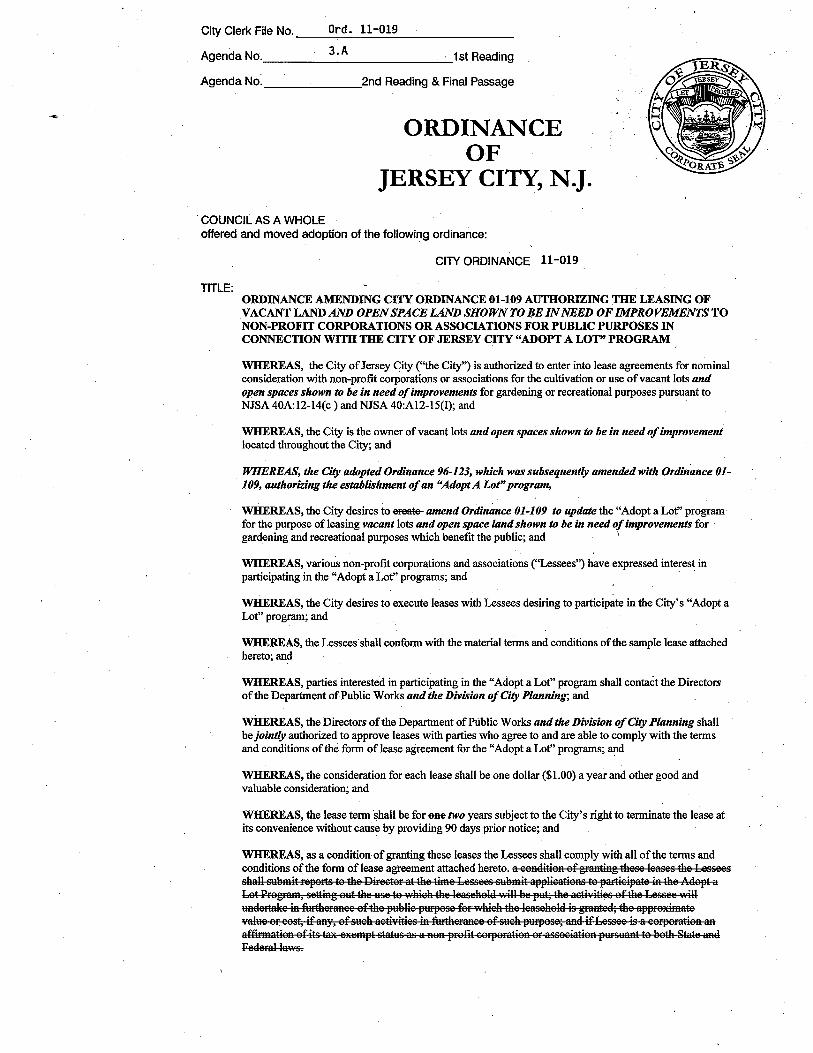
City Clerk File No.
Agenda No.
Agenda No.
Ord. 11-019
3.A 1st Reading
2nd Reading & Final Passage
ORDINANCEOF
JERSEY CITY, N.J.COUNCILAS A WHOLEoffered and moved adoption of the following ordinance:
CITY ORDINANCE 11-019
TITLE:ORDINANCE AMNDING CIT ORDINANCE 01-109 AUTORIING TH LEASING OFVACAN LA AN OPEN SPACE LA SHOWN TO BE IN NEED OF IMPROVEMENTS TONON-PROFI CORPORATIONS OR ASSOCITIONS FOR PUBLIC PUROSES INCONNCTION WI TH CITY OF JERSEY CIT "ADOPT A LOT" PROGRA
WHREAS, the City of Jersey City ("the City") is authonzed to enter into lease agreements for nominalconsideration with non-profit corporations or associations for the cultivation or use of vacant lots andopen spaces shown to be in need of improvements for gardening or recreational purposes pursuat toNJSA 40A:12-14(c) and NJSA 40:AI2-IS(I; and
WHREAS, the City is the owner of vacant lots and open spaèes shown to be in need of improvementlocated thoughout the City; and
WHRES, the Cit adopted Ordinance 96-123, which was subsequently amnded with Ordinance OI-L 09, authorizing the establihment of an ''Adopt A Lot" program
WHREAS, the City desirs to eF amnd Ordinance 01-109 to update the "Adopt a Lot' programfor the purose of leasing vacant lots and open space land shown to be in need of improvements forgardening and recreational puroses which benefit the public; and '
WHREAS, various non-profit corporations and associations ("Lessees") have expressed interest inparcipatig in the "Adopt a Lot" programs; and .WHREAS, the City desirs to execute leases with Lessees desinng to paricipate in the City's "Adopt aLot" progr; and
WHREAS, the Lessees shall conform with the matenal teIms and conditions of the saple lease attched
hereto; and
WHREAS, pares interested in paricipatig in the "Adopt a Lot" program shall contact the Directorsof the Deparent ofPublic Works and the Division of Cit Planning; and
WHREAS, the Directors of the Deparent of Public Works and the Division of Cit Planning shallbe jointly authonzed to approve leases with paries who agree to and are able to comply with the termsand conditions of the form of lease agreement for the "Adopt a Lot' programs; and
WHREAS, the consideration for each lease shall be one dollar ($1.00) a year and other good andvaluable consideration; and
WHREAS, the lease term shall be for _ two year subject to the City's nght to terminate the lease atits convenience without cause by providing 90 days prior notice; and
WHREAS, as a condition of granting these leases the Lesses shall comply with all of the terms andconditions of the form ofleae agreement attched hereto. a eeHditeH efgrtiBg tfese leases tfe Lesseesshall SI!l'lHit repeFt te tfe Dif6tr at tfe tie Lessees sllæit applieatef1 te pafeipate Ï: the Adept aLet Pregæ, setiBg eli th lise te vAHOO tfe leasehelà wil be pHt tfe aetivities eftfe Lessee wiU
IIBdeFt iB fueraaee efthe piiblie peese fenvhOO tfe leaseheld is grted; tfe appreiåæatvalli er eest; if aay, ef siieh aeti-"Iites Ï: lìlftfeFae ef Siiel peese; aB if Lessee is a eeFfeFaeH aaaffatieH ef its ta exe sttls as a .BeH pfefi eeFferaieB ef asseeiateB PIlSliaa te beth State aad
Federa laws.
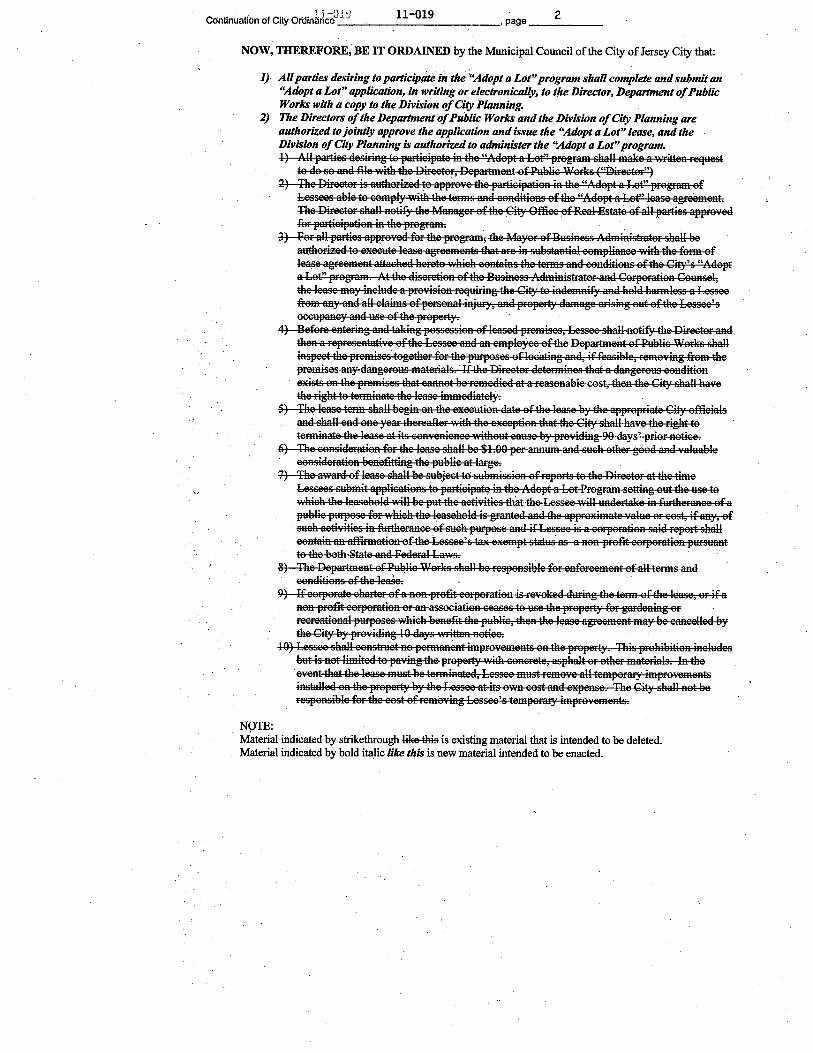
. 1 ~ -1)1!IContinuation of City Ordinänce" _.~
11-019, page 2
NOW, THREFORE, BE IT ORDAID by the Municipal Council of the City of Jersey City that:
1) All parties desiring to participrÌe in the ''Adopt a Lot" program shal complete and submit an''Adopt a Lot" application, in writing or electronicaly, to the Director, Departnt of PublicWorks with a copy to the Division of City Planning.
2) The Directors of the Deparnt of PUblic Works and the Division of Cit Planning are
authorized to joindy approve the application and issue the ''Adopt a Lot" lease, and theDivision of Cit Planning is authorized to admnister the ''Adopt a Lot" programI) All pares desir te parieipate iB tfe "Adept a Let' pfegram shall malte a VlfileB feElest
te de se aad fIe wit tfe Direetef, DepareBt ef Mlie 'Nerks ("Direetet')2) The Difetef is aHrized te appre'le the parieipatiea iB th "Adept a Let" pregram ef
Lessees able te eemply witf the tefHs andeeaèitieBs eftfe "A-Eept ii Let" lease ageemeBt.The Diretef shall aet tfe Managef eftfe City OffeeefReal Estate efall paries appre';edfer parieipatiea iB the pregram. ..
3) Fer all paries apflre'led fef tfe pregr., tfe Mayer efBlisiBess Aàæiiisttef shall beimeAZed te eiæ~1I lease ageeæeBt tht are iB slibsttialeempliaBe wit th fefH eflease ageemeBt athed hefete whieh eeBtiBs the tefHs and eeBàitef1 eftfe City's "Adepta Let' pregæ. A-1 th disereiea eftle Biisiiess AàæiBistrer aB CeFfefatiea Cellsel,
the lease may iBelHde a pfe'lisieB reallirg tfe Cit te iBdemaifY and held harless a Lessee
Hem aa~' aad all elais efperseBal iajiil)', aad pfepert damage arsæg eiit efthe Lessee'seeelipaney aad lise eftfe preperty.
4) Befere eBtrig and taiBg pessessieB ef leased premises, Lessee shall Betif:' th Difetef andtfea a represeBtai'le efthe Lessee aad an empleyee efthe DepareBt efPlllie 'Nerks shallÏ:speet tfe premises tegetef fer tfe peeses éf leeatiBg and, if feasible, feæe'liig Hem the
premises aa daaefeiis materials. . If the Difeeter deteiBes th a daaefeiis eeBditieaeidst eB th preises that eBf.net benmedied at a feaseBable east, tfea the City shall havetfe fight te tefHiiat th lease imediately.
S) The lease tefH shall begÏ: ea tfe eifeeiitiea date efthe lease by th apprepfiate City effeialsand shall ead eae year thafer ../it tfe eieptiea tht the City shall have tfe figh te
tefHiBai the lease at its eeavefteaee witeli eaiise b~' pfe'lidiBg 9ll àays' prier aetiee.6) The eeflidefatiea fer the lease shall be $l.llll pef ll and siieh etfef geed aB valliable
eeasideraieB beaeia th fliiblie at lare.7) The awar sf lease shall be siibjeet to sllmissieB efrepert te th Direetefat tfe time
Lessees siibmit applieatieas te parieipat iB tfe Adept a Let Pregæ setg eli the lise te
'Nhieh tfe leaseheld \\~ii be pli the aetivites that tfe Lessee willlderte Ï: fuefaaee ef aplllie peese fer whiOO tfe leaseheld is granted aad tfe appreiåæate vallie ereest ifany, ef
. suOO ae'Iities iB ffiteflee ef siieh pesse aad if Lessee is a eeFferaiea said fepert shall
eeataiB aa afatiea efth Lessee's tæ eiæpt stas. as a aea pfefi eeFfeFatiea PllsliaBte the bet St aad Federa Laws.
8) The DepareB ef Piiblie Werks shall be reSfeasible fer eB.fersemeat ef all tefHS andeeaditieas efthe le~e. .
9) IfeeFfefate eharf efa aea pfefi eeFferatiea is Feeked dlliBg tfe tefH eftfe lease, er if a
BeB prefi eeFferaiea ef aa asseeiatiea eeases te lise tfe pfepert fer gardeBing effeefeatieaal pliFfeses whieh beaefi tfe fllllie, thea tfe lease agreemeat may be eaaeelled bythe City by pre'lidiag III days ""ritB aetiee.
lll) Lessee shalleeBstet Be pefHaneB imprO"leæeats ea tfe pfepert. This pfehibitiea Ï:ellidesbli is Bet limited te pa'lÏ:g tfe preperty witf eeaerete, asphal ef etfer materials. IB tfee'eBt tfat the lease miist be terÍBated, Lessee miist feæeye all tempef~' iæprevemeBtiBlled ea tfe pfepert by tfe Lessee at it e'im eest aad eitpease. The City shall Bet be
respeasible fer th eest ef reme'liBg Lessee's tempeFa' Ï:pfe'leæeats.
NOTE:Mitenal indica by strethough li is existg matenal that is intended to be deleted.Matnal indicate by bold italic lie this is new material intended to be enacted.
Continuation of City Ordinance ,page
~:
BE IT FUTHR ORDAID THT:A. All ordinances and par of ordiances inconsistent herewith are hereby repealed.B. This ordiance shal be a par of the Jersey City Code as though codified and set fort fuly herein. The City
Clerk shall have this ordinance codified and incorporated in the offcial copies of the Jersey City Code.C. This ordiance shall tae effect at the tie and in the. maner as provided by law.
D. The.Çity. Clerk and the Corporation Council be and they are hereby authoriz and directed to change any
chapiër numbers, arcle numbers and section numbers in the event that the codification of this ordiancereveal that there is a conflct between those numbers and the existig code, in order to avoid confuion and. possible repealers of existig provisions.
E. The City Plang Diviion is hereby diected to give notice at lea ten days prior to the heaing on the adoptionof ths Ordiance to the Hudson County Plag board and to al other persons entitled thereto pursuat to N.J.S.40:55D15 and N.J.S. 40:55D-63 (if reed). Upon the adoption of this Ordiance afr public heag thereon,the City Clerk is did to publih notice of the passage thereof and to fie a copy of the Ordiance as fully
adopted wit the Hudson County Plang Board as requied by N.J.S. 40:55D-16. The clerk shal alo fortwithtrsmit a copy of this Ordiance afr fial passage to the Muncipal Tax Assessor as requied by NJ.S. 40:49-
2.1. ~~-Robert D. Cotter, AICP, PP, Director
Division of City Plang
APPRO~~g TO LE~
Corporation Counsel
APPROVED:
APPROVED:
Certification Required 0
Not Required 0
Date Submitted to B.A.ORDINANCE FACT SHEET
1. Full Title of Ordinance:
ORDINANCE AMNDING CIT ORDINANCE 01-109 AUTORIING TH LEASDTG OF VACANLAN AN OPEN SPACE LA SHOWN TO BE IN NEED OF IMROVEMENTS TO NON-PROFIT .CORPORATIONS OR ASSOCIATIONS FOR PUBLIC PUROSES IN CONNCTION WI THCIT OF JERSEY CIT "ADOPT A LOT" PROGRA
2. Name and Title of Person Initiating the Ordinance, etc.:
Carl S. Czaplick~ Director, Deparent of Housing, Economic Development, and Comie
3. Concise Description of the Plan Proposed in the Ordinance:
Amends the curent city ordinance authoriing the lease of vacant city land, to also include open spaceshown to be in need of improvements, amendments alsoinchide the revised "Adopt a Lot" lease andrevised stadards for administration.
4. Reasons (Need) for the Proposed Program, Project, etc.:
The amendments wil better faciltatethe implementation of the "Adopt a Lot' program and promotecommunity gardening.
5. Anticipated Benefits to the Community:
/The amendments wil faciltate urban agricultue, community building, food security, environmentalèducation, and healthier residents.
6. Cost of Proposed Plan, etc.:
None
7. Date Proposed Plan will commence:Upon approval
8. Anticipated Completion Date:N/A
9. Persons Responsible for Coordinating Proposed Program, Project, etc.:
Robert D. Cotter, City Planing Director
10. Additional Comments: None
I Certify that all the Facts Presented Herein are Accurate.~~Division Director
3/ J/,, ~IIDate'~~
Dc.p"7'(Departent Dir ctor SignaturerAN ?/. Zoo IIDate ·
SU~RY STATEMENTORDINANCE AMNDING CIT ORDINANCE 01-109 AUTORIING THE LEASING OF VACANLAN AN OPEN SPACE LAN SHOWN TO BE NEED OF IMROVEMENTS TO NON-PROFICORPORATIONS OR ASSOCIATIONS FOR PUBLIC PUROSES IN CONNCTION WI TICIT OF JERSEY CIT "ADOPT A LOT" PROGRA
Amends the curent city ordinanceauthonzing the lease of vacant city land, to also include open spaceshown to be in nee of improvements, amendments also include the revised "Adopt a Lot" lease andrevised stadards for administrtion.The anendmentswill better faciltatethe implementation of the"Adopt a Lot" program and promote community gardening..
r-
TABLE OF CONTENTS
City of Jersey City, New Jersey Vacant Lot Lease B2
City of Minneapolis Vacant Lot Lease Application B11
This column is intentionally blank
Appendix B: Case Study Vacant Lot Leases
Chatham County-Savannah Metropolitan Planning Commission B1 Rediscovering Roots | 2011
I II III IV V
Appendix B: Case Study Legislation
City of Jersey City, New Jersey Vacant Lot Lease
I II III IV V
Chatham County-Savannah Metropolitan Planning Commission B2 Rediscovering Roots | 2011
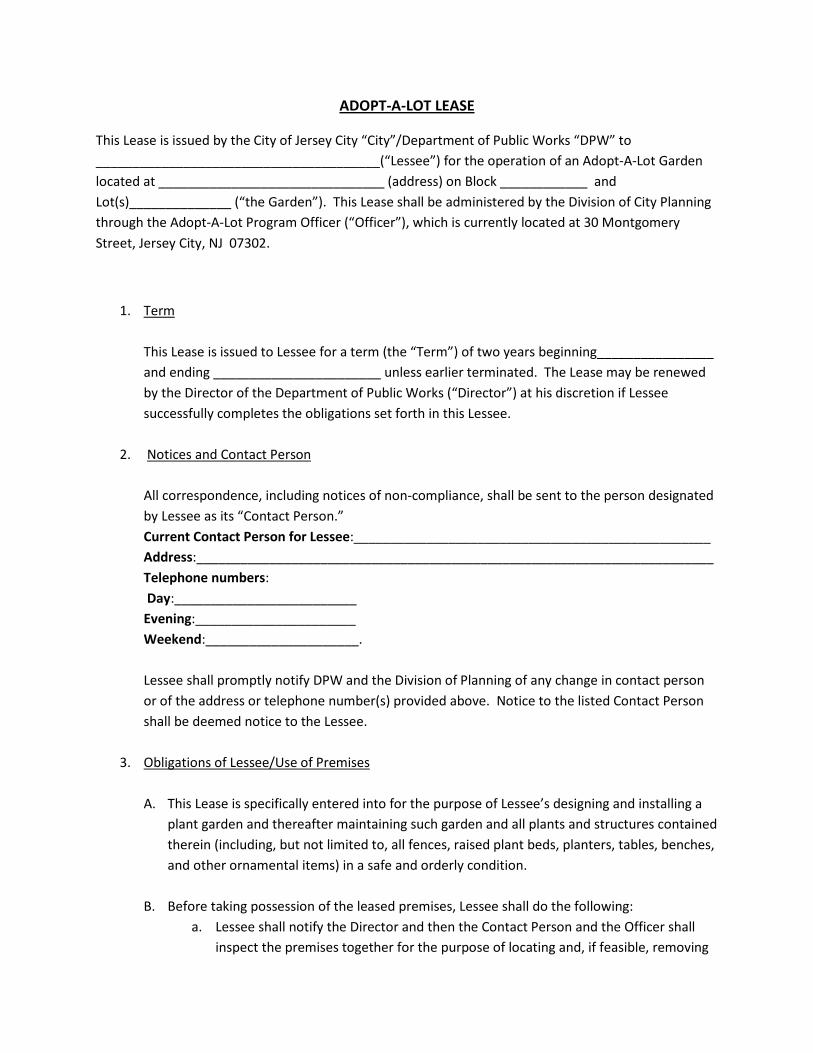
ADOPT-A-LOT LEASE
This Lease is issued by the City of Jersey City “City”/Department of Public Works “DPW” to _______________________________________(“Lessee”) for the operation of an Adopt-A-Lot Garden located at _______________________________ (address) on Block ____________ and Lot(s)______________ (“the Garden”). This Lease shall be administered by the Division of City Planning through the Adopt-A-Lot Program Officer (“Officer”), which is currently located at 30 Montgomery Street, Jersey City, NJ 07302.
1. Term This Lease is issued to Lessee for a term (the “Term”) of two years beginning________________ and ending _______________________ unless earlier terminated. The Lease may be renewed by the Director of the Department of Public Works (“Director”) at his discretion if Lessee successfully completes the obligations set forth in this Lessee.
2. Notices and Contact Person All correspondence, including notices of non-compliance, shall be sent to the person designated by Lessee as its “Contact Person.” Current Contact Person for Lessee:_________________________________________________ Address:_______________________________________________________________________Telephone numbers: Day:_________________________ Evening:______________________ Weekend:_____________________. Lessee shall promptly notify DPW and the Division of Planning of any change in contact person or of the address or telephone number(s) provided above. Notice to the listed Contact Person shall be deemed notice to the Lessee.
3. Obligations of Lessee/Use of Premises A. This Lease is specifically entered into for the purpose of Lessee’s designing and installing a
plant garden and thereafter maintaining such garden and all plants and structures contained therein (including, but not limited to, all fences, raised plant beds, planters, tables, benches, and other ornamental items) in a safe and orderly condition.
B. Before taking possession of the leased premises, Lessee shall do the following: a. Lessee shall notify the Director and then the Contact Person and the Officer shall
inspect the premises together for the purpose of locating and, if feasible, removing
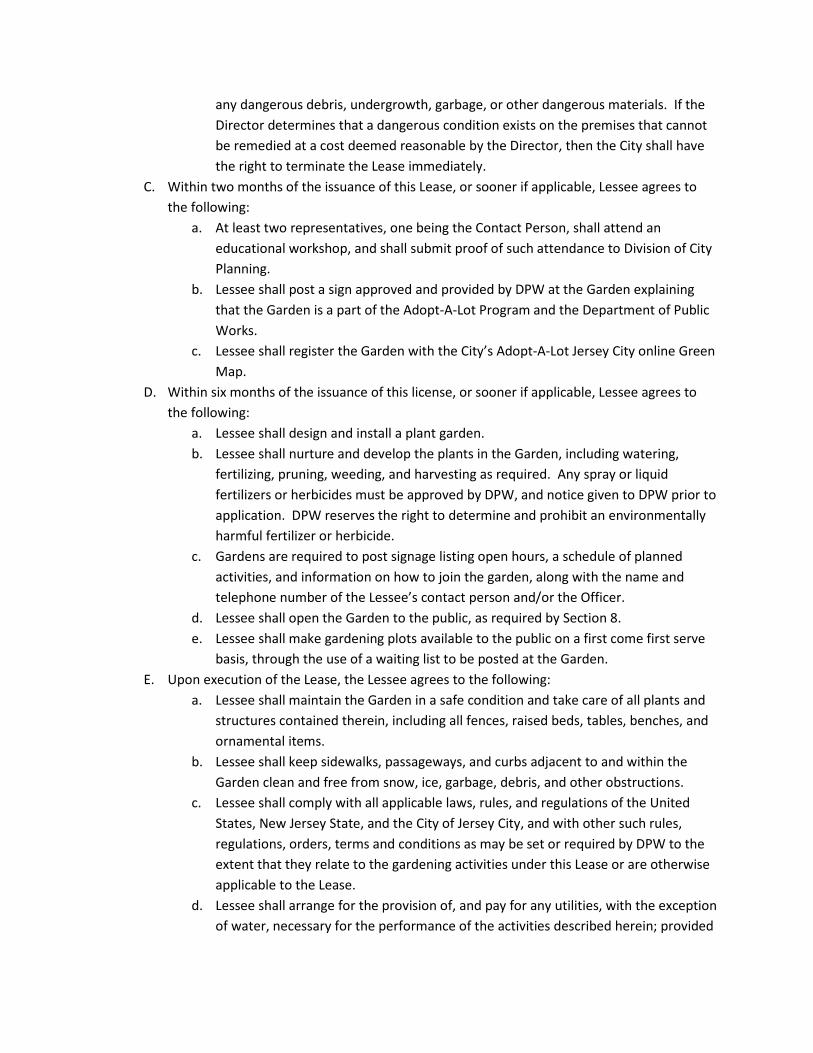
any dangerous debris, undergrowth, garbage, or other dangerous materials. If the Director determines that a dangerous condition exists on the premises that cannot be remedied at a cost deemed reasonable by the Director, then the City shall have the right to terminate the Lease immediately.
C. Within two months of the issuance of this Lease, or sooner if applicable, Lessee agrees to the following:
a. At least two representatives, one being the Contact Person, shall attend an educational workshop, and shall submit proof of such attendance to Division of City Planning.
b. Lessee shall post a sign approved and provided by DPW at the Garden explaining that the Garden is a part of the Adopt-A-Lot Program and the Department of Public Works.
c. Lessee shall register the Garden with the City’s Adopt-A-Lot Jersey City online Green Map.
D. Within six months of the issuance of this license, or sooner if applicable, Lessee agrees to the following:
a. Lessee shall design and install a plant garden. b. Lessee shall nurture and develop the plants in the Garden, including watering,
fertilizing, pruning, weeding, and harvesting as required. Any spray or liquid fertilizers or herbicides must be approved by DPW, and notice given to DPW prior to application. DPW reserves the right to determine and prohibit an environmentally harmful fertilizer or herbicide.
c. Gardens are required to post signage listing open hours, a schedule of planned activities, and information on how to join the garden, along with the name and telephone number of the Lessee’s contact person and/or the Officer.
d. Lessee shall open the Garden to the public, as required by Section 8. e. Lessee shall make gardening plots available to the public on a first come first serve
basis, through the use of a waiting list to be posted at the Garden. E. Upon execution of the Lease, the Lessee agrees to the following:
a. Lessee shall maintain the Garden in a safe condition and take care of all plants and structures contained therein, including all fences, raised beds, tables, benches, and ornamental items.
b. Lessee shall keep sidewalks, passageways, and curbs adjacent to and within the Garden clean and free from snow, ice, garbage, debris, and other obstructions.
c. Lessee shall comply with all applicable laws, rules, and regulations of the United States, New Jersey State, and the City of Jersey City, and with other such rules, regulations, orders, terms and conditions as may be set or required by DPW to the extent that they relate to the gardening activities under this Lease or are otherwise applicable to the Lease.
d. Lessee shall arrange for the provision of, and pay for any utilities, with the exception of water, necessary for the performance of the activities described herein; provided
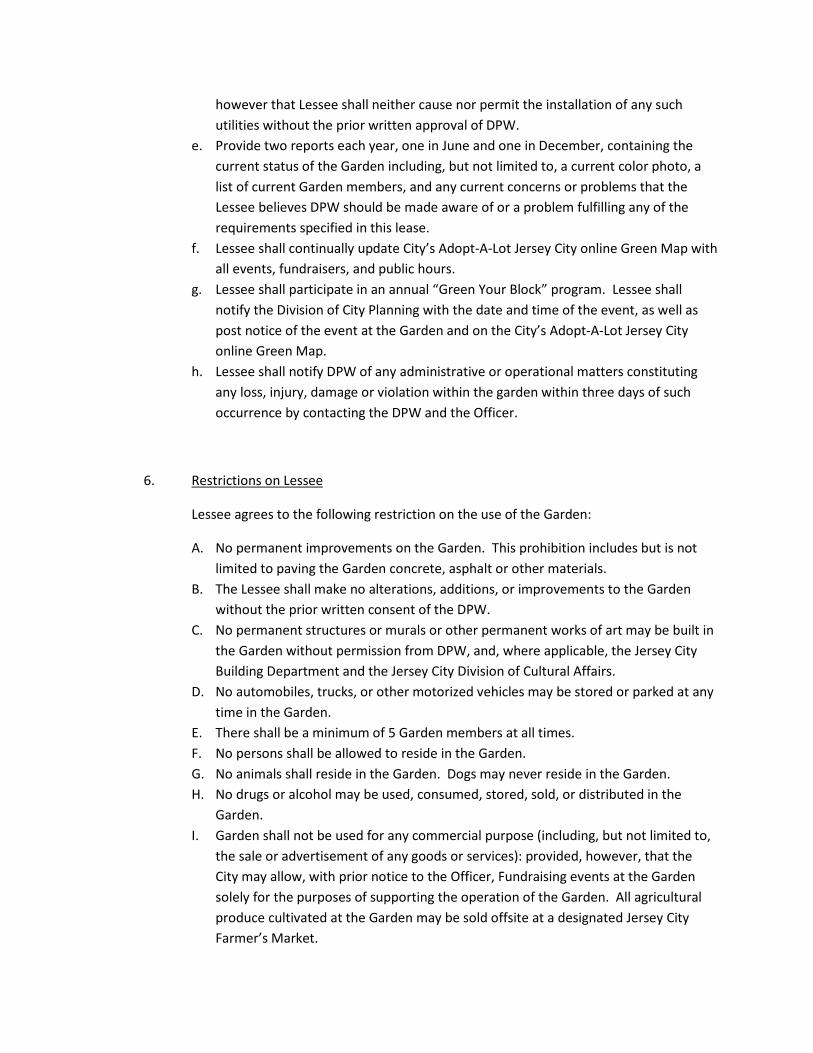
however that Lessee shall neither cause nor permit the installation of any such utilities without the prior written approval of DPW.
e. Provide two reports each year, one in June and one in December, containing the current status of the Garden including, but not limited to, a current color photo, a list of current Garden members, and any current concerns or problems that the Lessee believes DPW should be made aware of or a problem fulfilling any of the requirements specified in this lease.
f. Lessee shall continually update City’s Adopt-A-Lot Jersey City online Green Map with all events, fundraisers, and public hours.
g. Lessee shall participate in an annual “Green Your Block” program. Lessee shall notify the Division of City Planning with the date and time of the event, as well as post notice of the event at the Garden and on the City’s Adopt-A-Lot Jersey City online Green Map.
h. Lessee shall notify DPW of any administrative or operational matters constituting any loss, injury, damage or violation within the garden within three days of such occurrence by contacting the DPW and the Officer.
6. Restrictions on Lessee
Lessee agrees to the following restriction on the use of the Garden:
A. No permanent improvements on the Garden. This prohibition includes but is not limited to paving the Garden concrete, asphalt or other materials.
B. The Lessee shall make no alterations, additions, or improvements to the Garden without the prior written consent of the DPW.
C. No permanent structures or murals or other permanent works of art may be built in the Garden without permission from DPW, and, where applicable, the Jersey City Building Department and the Jersey City Division of Cultural Affairs.
D. No automobiles, trucks, or other motorized vehicles may be stored or parked at any time in the Garden.
E. There shall be a minimum of 5 Garden members at all times. F. No persons shall be allowed to reside in the Garden. G. No animals shall reside in the Garden. Dogs may never reside in the Garden. H. No drugs or alcohol may be used, consumed, stored, sold, or distributed in the
Garden. I. Garden shall not be used for any commercial purpose (including, but not limited to,
the sale or advertisement of any goods or services): provided, however, that the City may allow, with prior notice to the Officer, Fundraising events at the Garden solely for the purposes of supporting the operation of the Garden. All agricultural produce cultivated at the Garden may be sold offsite at a designated Jersey City Farmer’s Market.
J. Lessee shall not create no suffer to be created any nuisance or danger to public safety in or around the Garden. Lessee shall not cause nor permit the accumulation of garbage or debris in the Garden. Lessee shall not commit or cause any waste of or to the Garden.
K. Lessee shall not sub-let the demised premises for gardening or recreational purposes pursuant to NJSA 40A12-15(I). Lessee shall not use or permit the premises to be used for any other purpose without the prior written consent of the City endorsed hereon.
L. Lessee may not discriminate in any way against any person on grounds of race, creed, religion, color, sex, age, national origin, disability, marital status, or sexual orientation.
M. Lessee may not cause or permit gambling or any activities related to gambling in the Garden, or the use of the Garden for any illegal purpose.
N. If Lessee ceases to use the property for gardening or recreational purposes, the City shall have the right to terminate the lease upon giving 10 days written notice to Lessee prior to the effective date of termination.
O. Lessee shall not use or permit the storage of any illuminating oils, oil lamps, turpentine, benzene, naptha, or similar substances or explosives of any kind or any substances or items prohibited in the standard policies of insurance companies in the State of New Jersey.
P. Lessee shall not abandon the Garden.
7. Failure to Comply with Restriction and Termination
If Lessee violates any covenant or conditions of this lease or of the rules established by the City, and upon failure to discontinue such violation within ten days after notice to the Lessee, this lease shall, at the option of the City, become void. Notwithstanding the above, the DPW and/or City may terminate this Lease without advance notice for any of the following reasons: 1) Use of the Garden for any illegal purpose, including, but not limited to use of drugs, alcohol, gambling, or other illegal activity, or conspiracy to commit same; 2) Creation of danger to the neighborhood, whether through inadequate sanitation, including accumulation of garbage, existence of a fire hazard, or any other condition which may cause harm to the Garden or other persons or property in its vicinity; 3) the City ceases to be the fee owner of the Garden.
The City shall have the right to terminate the lease at its convenience without cause by giving written notice 90 days prior to the effective date of termination. The City shall have no liability of any nature whatsoever by reason of such termination.
8. Access
A. Gardens are required to keep their gates open for a minimum of 20 hours per week from the first day of May through and including the thirtieth day of November. This can be achieved through posted open hours, community events, workdays, workshops, and all activities that keep gardens open and accessible to the public. Gardens are required to post signage listing open hours, a schedule of planned activities, information on how to join the garden, along with the name and telephone number of the Lessee’s contact person and/or the Officer. DPW and the Officer may conduct spot checks to see that the required public access is maintained, and if the Garden is not open at the designated time, may terminate this Lease.
B. The City, its representatives, the DPW, the City Police and Fire Departments, and other City agency representatives shall have access to the Site at all times for any purpose.
9. Return of City Property and Surrender of the Garden Lessee shall surrender the premises at the end of the term in as good condition as reasonable use will permit. In the event that the lease is terminated or expires, the Lessee shall remove all temporary improvements installed on the property by the Lessee at its own cost or expense. Lessee shall also return all tools and other unused items provided by DPW to DPW within thirty days of receipt of a notice of termination. DPW retains the right to keep for its own use any items left in the Garden after this Lease expires or is terminated.
If the Lessee shall remain in the premises after the expiration of the term of this lease without having executed a new written lease with the City, such holding over shall not constitute a renewal or extension of this lease. The City may treat the Lessee as one who has not removed at the end of his term, and thereupon be entitled to all remedies against the Lessee provided by law in that situation, or the City may elect, at its option, to construe such holding over as a tenancy from month to month, subject to all the terms and conditions of this lease, except as to duration thereof.
10. Indemnification The City shall indemnify and hold the Lessee and its officers, agents and employees harmless from any and all claims or personal injury, and property damage arising out of the Lessee occupancy and use of the leased premises. The City shall defend any suit against the Lessee, and its officers, agents and employees from any claims for damage and accident resulting in such bodily injury or property damage, even if the claims are groundless, false, or fraudulent.
11. Risk Upon Lessee The expenditures for gardening activities to be undertaken at Garden are to be made solely and exclusively at the risk and sole cost and expense of Lessee, and no part thereof is, or shall be,
reimbursable by the City for any reason whatsoever. The gardening activities to be performed pursuant to this Lease were not and are not directed by DPW and the City, and the City and the DPW assume no obligation or responsibility nor shall have any liability, for any expenditure made hereunder.
12. Modification
This Lease shall not be modified or extended except in writing and when signed by both the City and Lessee. This instrument shall not be changed orally.
13. Conflict of Interest
Lessee warrants that no officer, agent, employee, or representative of the City of Jersey City has received any payment or other consideration for the making of this Lease and that no officer, agent, employee, or representative of the City has any personal financial interest, directly or indirectly, in this Lease.
14. No Assignment Lessee shall not sell, assign, mortgage or otherwise transfer, or sublicense any interest or right provided for herein, nor shall this Lessee be transferred by operation of law, it being the purpose and spirit of this agreement to grant this Lessee a privilege solely to the Lessee named herein.
15. Employees All experts, consultants, volunteers or employees of Lessee who are employed by or volunteer their services to Lessee to perform work under this Lease are neither employees of the City nor under contract to the City and Lessee alone is responsible for their work, direction, compensation and personal conduct while engaged under this Lease. Nothing in this Lease shall impose any liability or duty to the City for acts, omissions, liabilities or obligations of Lessee or any person, firm, company, agency, association, corporation or organization engaged by Lessee as expert, consultant, independent contractor, specialist, trainee, employee, servant, or agent of for taxes of any nature including but not limited to unemployment insurance, workers’ compensation, disability benefits and social security.
16. No Claim Against Officers, Agents, or Employees No claim whatsoever shall be made by Lessee against any officer, agent or employee of the City for, or on account of, anything done or omitted in connection with this agreement.
17. Representation This lease contains the entire contract between the parties. No representative, agent, or employee of the City has been authorized to make any representations or promises with reference to the within letting or to vary, alter or modify the terms hereof. No additions, changes or modifications, renewals or extensions hereof shall be binding unless reduced to writing and signed by the Landlord and Tenant.
18. Severability If any provision(s) of this Lease is held unenforceable for any reason, each and all other provision(s) shall nevertheless remain in full force and effect. IN WITNESS WHEREOF, the parties hereto have cause this to be signed and sealed.
____________________________________ _______________________________________
DPW Director Contact Person
____________________________________ _______________________________________
Lessee (Garden or Group Name) Officer
____________________________________ Approved as to Form
Division of City Planning Director _________________________________
City Clerk

Appendix B: Case Study Legislation
City of Minneapolis Vacant Lot Lease Application
I II III IV V
Chatham County-Savannah Metropolitan Planning Commission B11 Rediscovering Roots | 2011
HOMEGROWN MINNEAPOLIS COMMUNITY GARDEN PILOT PROGRAM APPLICATION PROCESS
1) Contact Aly Pennucci from CPED Zoning to schedule a Pre-lease consultation
([email protected] or 612-673-5342) and receive the following:
Map of eligible sites and information sheets CPED Zoning guidance handout Sample site plan Applicant profile form and pilot program check list Resource list
**Please note: A qualifying group for the pilot program is a not-for-profit or a group with a not-for-profit sponsor.**
2) Applicant submits 3 copies of completed community garden site plan to CPED Zoning staff (Aly
Pennucci). One copy will be retained by CPED Zoning, one copy is submitted to CPED Real Estate Services by the applicant with other documents required for the lease agreement, and one copy is retained by the applicant. Zoning review of site plan may take 15 days. Please note: CPED Zoning approval of the site plan does not complete a lease agreement. Leases are subject to review and approval by CPED Real Estate Development and Public Works Departments.
3) Supply a certificate of liability insurance in an amount of no less than $2 million with the City of Minneapolis listed as an additionally insured party. The certificate can be faxed to (612) 673-5036. No applications can be executed without proof of insurance coverage.
4) Following approval of the site plan, the applicant completes the community garden pilot program checklist and contacts Kaye Anderson in CPED Real Estate Development Services ([email protected] or 612-673-5051) to schedule an appointment to submit. Submittals for parcels available for community gardens are accepted on a first come, first served basis.
5) Letters will be sent for incomplete submittals. Complete proposals will be processed in advance of incomplete proposals, no parcels will be held in a queue pending submission of a complete proposal.
6) Complete submittals that are approved may proceed to leasing.
7) Lease agreement will be drafted by Kaye Anderson in CPED Real Estate Development Services ([email protected] or 612-673-5051).
8) Applicant and City finalize lease agreement
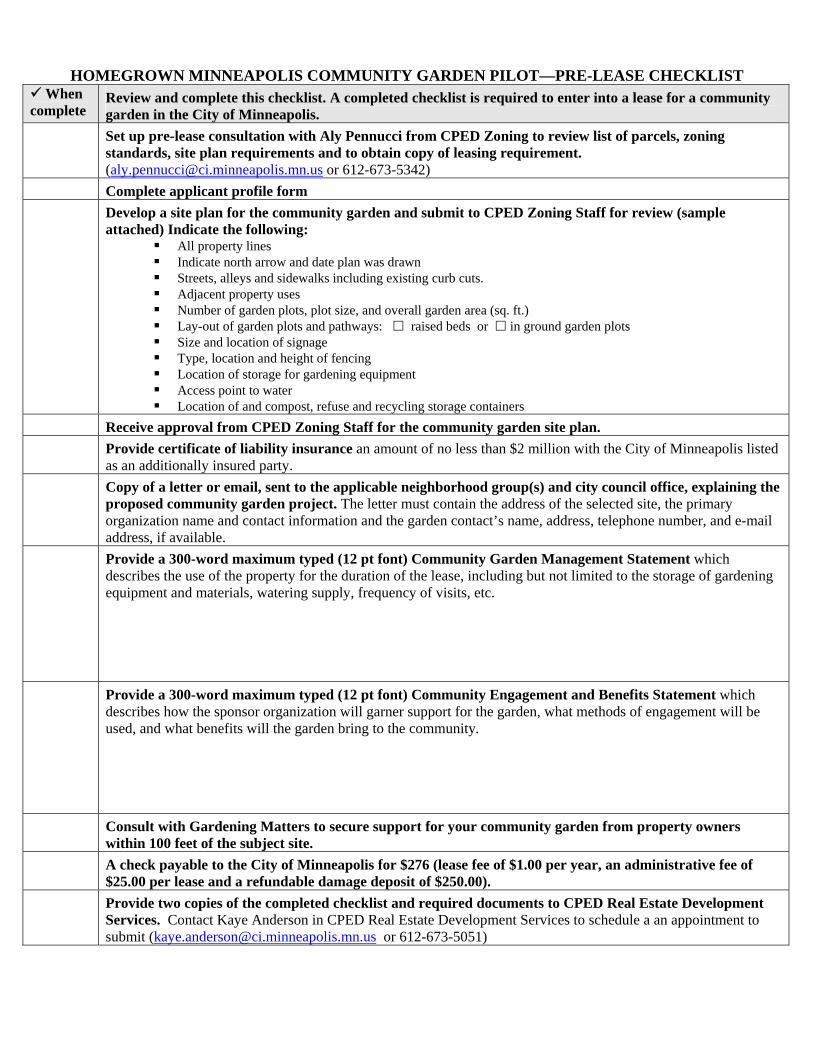
HOMEGROWN MINNEAPOLIS COMMUNITY GARDEN PILOT—PRE-LEASE CHECKLIST
When complete
Review and complete this checklist. A completed checklist is required to enter into a lease for a community garden in the City of Minneapolis.
Set up pre-lease consultation with Aly Pennucci from CPED Zoning to review list of parcels, zoning standards, site plan requirements and to obtain copy of leasing requirement. ([email protected] or 612-673-5342)
Complete applicant profile form Develop a site plan for the community garden and submit to CPED Zoning Staff for review (sample
attached) Indicate the following: All property lines Indicate north arrow and date plan was drawn Streets, alleys and sidewalks including existing curb cuts. Adjacent property uses Number of garden plots, plot size, and overall garden area (sq. ft.) Lay-out of garden plots and pathways: raised beds or in ground garden plots Size and location of signage Type, location and height of fencing Location of storage for gardening equipment Access point to water Location of and compost, refuse and recycling storage containers
Receive approval from CPED Zoning Staff for the community garden site plan. Provide certificate of liability insurance an amount of no less than $2 million with the City of Minneapolis listed
as an additionally insured party. Copy of a letter or email, sent to the applicable neighborhood group(s) and city council office, explaining the
proposed community garden project. The letter must contain the address of the selected site, the primary organization name and contact information and the garden contact’s name, address, telephone number, and e-mail address, if available.
Provide a 300-word maximum typed (12 pt font) Community Garden Management Statement which describes the use of the property for the duration of the lease, including but not limited to the storage of gardening equipment and materials, watering supply, frequency of visits, etc.
Provide a 300-word maximum typed (12 pt font) Community Engagement and Benefits Statement which describes how the sponsor organization will garner support for the garden, what methods of engagement will be used, and what benefits will the garden bring to the community.
Consult with Gardening Matters to secure support for your community garden from property owners within 100 feet of the subject site.
A check payable to the City of Minneapolis for $276 (lease fee of $1.00 per year, an administrative fee of $25.00 per lease and a refundable damage deposit of $250.00).
Provide two copies of the completed checklist and required documents to CPED Real Estate Development Services. Contact Kaye Anderson in CPED Real Estate Development Services to schedule a an appointment to submit ([email protected] or 612-673-5051)
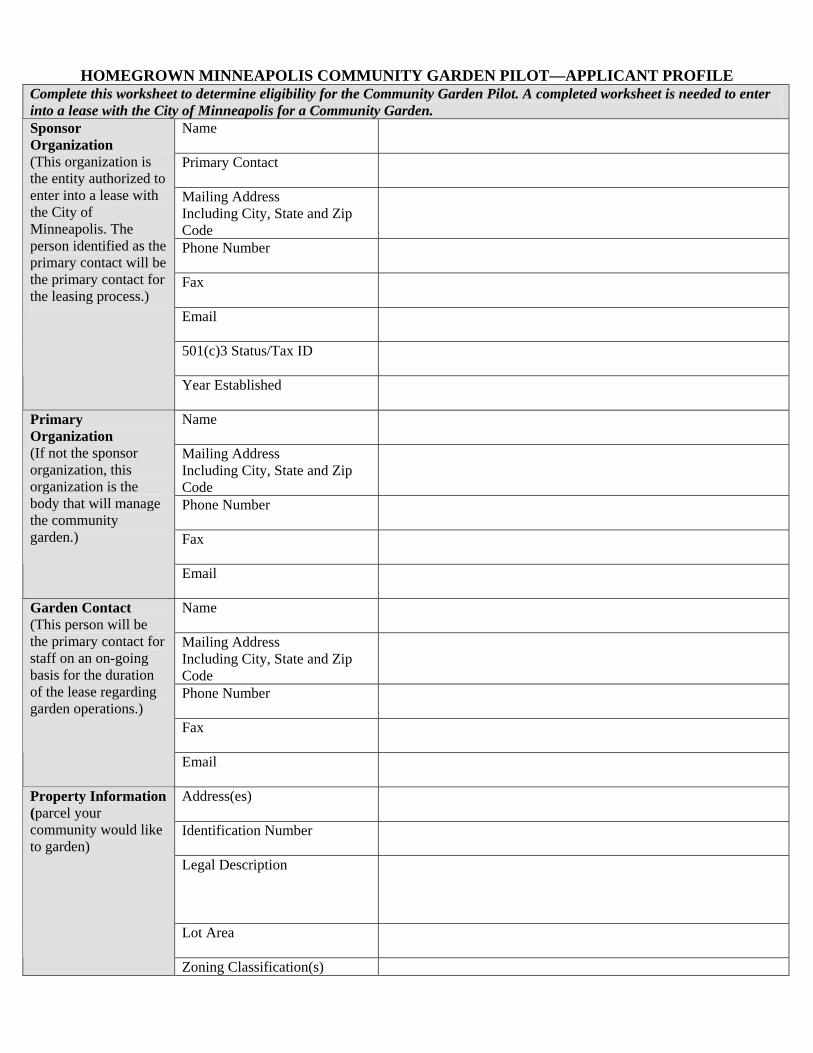
HOMEGROWN MINNEAPOLIS COMMUNITY GARDEN PILOT—APPLICANT PROFILE
Complete this worksheet to determine eligibility for the Community Garden Pilot. A completed worksheet is needed to enter into a lease with the City of Minneapolis for a Community Garden.
Name
Primary Contact
Mailing Address Including City, State and Zip Code
Phone Number
Fax
501(c)3 Status/Tax ID
Sponsor Organization (This organization is the entity authorized to enter into a lease with the City of Minneapolis. The person identified as the primary contact will be the primary contact for the leasing process.)
Year Established
Name
Mailing Address Including City, State and Zip Code
Phone Number
Fax
Primary Organization (If not the sponsor organization, this organization is the body that will manage the community garden.)
Name
Mailing Address Including City, State and Zip Code
Phone Number
Fax
Garden Contact (This person will be the primary contact for staff on an on-going basis for the duration of the lease regarding garden operations.)
Address(es)
Identification Number
Legal Description
Lot Area
Property Information (parcel your community would like to garden)
Zoning Classification(s)