Recent FEP Working Papers
30
!" !" !" !" !# ! ! ! ! $ "" $ "" $ "" $ "" "& ’( )*( & ’( )*( & ’( )*( & ’( )*( "" "" "" "" + ) + ) + ) + ) & ’( & ’( & ’( & ’( + + + + $ $ $ $ , - , - , - , - . . . .) ) ) )+ + + + //0 //0 //0 //0
Transcript of Recent FEP Working Papers

������������������� ������������������� ������������������� ������������������� ������������������� ������������������� ������������������� �������������������
������� ��������� ��������������� ��������� ��������������� ��������� ��������������� ��������� ��������������� ��������� ��������������� ��������� ��������������� ��������� ��������������� ��������� ��������
����������� ����������������� ����������������� ����������������� ����������������� ����������������� ����������������� ����������������� �������������� ������������������������������������������������������������������������
� ��� � ��� � ��� � ��� � ��� � ��� � ��� � ��� ������������������������ ���������������������������������������������������������������� ����������������
�������������������������� ���������� ���������� ���������� ����!����"!����"!����"!����"
!!!!####���!�� ����!�� ����!�� ����!�� �$��������""$��������""$��������""$��������""
%""""& ��'�����(������)*��� �(������� ���& ��'�����(������)*��� �(������� ���& ��'�����(������)*��� �(������� ���& ��'�����(������)*��� �(������� ���
%""""""""��� �� �+ ������ ������������ ���)��� �� �+ ������ ������������ ���)��� �� �+ ������ ������������ ���)��� �� �+ ������ ������������ ���)
%& ��'�����(�& ��'�����(�& ��'�����(�& ��'�����(�+ ��� �+ ��� �+ ��� �+ ��� �
����������������� ����������������� ����������������� ����������������� ����������������� ����������������� ����������������� ����������������� $�������$�������$�������$�������
, ��-, ��-, ��-, ��- ��������
������������������������������������������������� ����������������� ����������������� ����������������� ����������������� ����������������� ����������������� �����������������
�.�.�.�.���)���)���)���)+ ����+ ����+ ����+ ���� �//0�//0�//0�//0

1
ACCOUNTING FOR FINANCIAL INSTRUMENTS: A COMPARISON OF EUROPEAN
COMPANIES’ PRACTICES WITH IAS 32 AND IAS 39*
Patrícia Teixeira Lopes
University of Porto Faculty of Economics
Lúcia Lima Rodrigues
University of Minho School of Management and Economics
Draft – please do not quote without the authors’ permission
Contact Author
Patrícia Teixeira Lopes University of Porto Faculty of Economics Rua Dr. Roberto Frias, 4200-464 Porto, Portugal Telef.: 351 22 5571100; Fax: 351 22 5505050; e-mail: [email protected]
*Acknowledgements: The financial support of Faculdade de Economia do Porto (Portugal) and PRODEP is
gratefully acknowledged. The comments and suggestions of the participants in the Workshop on “Accounting in
Europe Beyond 2005”, Regensburg (September, 2005), especially those of Professor David Alexander
(discussant), are also gratefully acknowledged.

2
ACCOUNTING FOR FINANCIAL INSTRUMENTS: A COMPARISON OF EUROPEAN
COMPANIES’ PRACTICES WITH IAS 32 AND IAS 39
This paper analyses accounting for financial instruments of STOXX 50 companies and
compare them to the requirements of IAS 32 and IAS 39, before IFRS are mandatory in the
European Union. We use a list of 120 categories of inquiry and 370 possible responses and
analyse companies’ annual reports. The results show that the majority of companies disclose
the fair value amounts and methods of calculation but the information is neither clear nor
objective, preventing the fair value information from being relevant and useful. We conclude
that companies have a long way to go in terms of accounting and disclosure of financial
instruments, namely derivatives. The mandatory adoption of more stringent standards such as
the IAS 32 and IAS 39 may improve the information disclosed by companies. Doubts about
the compliance degree and the usefulness of the information still remain. This paper brings
new perspectives to the challenges of IAS/IFRS adoption, namely to what relates to fair value
measurement.
Key words: Accounting for financial instruments, Fair value accounting, International
Accounting, Accounting harmonisation, IAS/IFRS, STOXX 50

3
1. INTRODUCTION
IAS 32 and IAS 39 are seen as the most complex IASB standards in terms of
understandability and the ones that are more difficult to implement by companies (BDO et al.
(2003); Jermakowicz (2004); Sucher and Jindrichovska (2004); Larson and Street (2004) and
Street and Larson (2004)); additionally, the requirements of these standards have generated
much controversy among the various agents on the accounting scene and it is far from being
a closed issue (Pacter (2005); Whittington (2005); Walton (2004) Gélard (2004) and Hague
(2004)). Additionally, the 2001/65/EC Directive, which amended the Forth (78/660/EEC) and
Seventh (83/349/EEC) Directives as regards valuation rules, allowing for accounting for
financial instruments at fair value, and Regulation 1606/2002, known as IAS Regulation, are
effective signs of the irreversibility of the accounting harmonisation process within Europe,
resulting in many companies adopting fair value measures (Schipper (2005)).
Within this context, the purpose of this paper is twofold. First, we want to analyse current
accounting practices for financial instruments by European companies. Then, we want to
compare these practices with the measurement, recognition and disclosure requirements of
IAS 32 and IAS 39, in order to ascertain how far the European companies are from IAS
requirements.
The remainder of the paper is organised as follows: Section 2 reviews prior literature. Section
3 describes research design. Section 4 presents the empirical results and section 5 discusses
the results and presents some limitations of the study.
2. PRIOR LITERATURE
Prior studies that analyse accounting practices under financial instrument accounting
standards include those of Chalmers (2001), Chalmers and Godfrey (2000), Blankley et al.
(2000), Roulstone (1999) and Mahoney and Kawamura (1995). Chalmers (2001) and
Chalmers and Godfrey (2000) show high levels of non-compliance among Australian
companies and problems of understanding, comparability and consistency with derivative
disclosures. Chalmers and Godfrey (2000) conclude that companies are not disclosing details
about derivative accounting policies making the information not useful and not comparable.
They also find diversity in terms of the clarity, detail and consistency of companies’

4
disclosures about the classification of accounting policies. Regarding accounting for hedges,
companies generally state that they use the same accounting method as the underlying, but do
not describe the method in particular. They also find low levels of disclosure regarding special
items of hedges of forecasted transactions. Regarding fair value disclosures, they find that
companies disclose the fair value but show reluctance to disclose the calculation method.
Both Blankley et al. (2000) and Roulstone (1999) measure compliance with FRR 481 of US
companies. Blankley et al. (2000) find mixed results: compliance with qualitative disclosure
requirements concerning company’s risk and its management is high, but detailed disclosures
for the quantitative items are incomplete or lacking. Roulstone (1999) finds that disclosures
are not presented in accordance with SEC requirements: there is lack of contextual
information regarding quantitative market risk exposure and low details about risk
management procedures and accounting policies.
Mahoney and Kawamura (1995) analyse compliance with SFAS 1192 disclosures. The items
that show lowest levels of disclosure are cash requirements of derivative financial instruments
held or issued, disclosures about trading derivatives (average fair value, end-of-period fair
value and net gains or losses), hedges of anticipated transactions, gap analysis and value at
risk disclosures.
In another stream of research, Edwards Jr. and Eller (1995), Edwards Jr. and Eller (1996),
Roulstone (1999), Woods and Marginson (2004), Dunne et al. (2004) and Hamlen and Largay
(2005) try to assess the increase in quality/understanding of the disclosures as a consequence
of a new standard on financial instruments. Edwards Jr. and Eller (1995) and Edwards Jr. and
Eller (1996) analyse the top ten US dealer banks’ annual reports, after SFAS 119 had become
effective. They conclude that the depth of both the qualitative and the quantitative disclosures
improved. They argue that the experimentation of better approaches to disclosure encouraged
by standard setters is evident namely in increasing transparency but further efforts should
continue to be made.
Roulstone (1999) concludes that the quality of the disclosures improved after FRR 48 but
there is still room for improvement, namely regarding the detail of quantitative measures of
market risk and discussion of risk management activities. 1 FRR 48: Disclosure of Accounting Policies for Derivative Financial Instruments and Derivative Commodity Instruments and Disclosure of Quantitative and Qualitative Information about Market Risk Inherent in Derivative Financial Instruments, Other Financial Instruments and Derivative Commodity Instruments, issued by the US Securities Exchange Commission, 1997. 2 SFAS 119: Disclosure about Derivative Financial Instruments and Fair Value of Financial Instruments, issued by the Financial Accounting Standards Board (FASB), 1994.

5
Woods and Marginson (2004) and Dunne et al. (2004) analyse the implementation of FRS 133
in the UK. Woods and Marginson (2004) conclude that the information disclosed lacks
usefulness. The reasons for this are the generic nature of qualitative disclosures (in line with
the USA study of Roulstone (1999)), lack of detail and comparability of the quantitative
disclosures and difficulty of combining qualitative and quantitative disclosures. Dunne et al.
(2004) conclude that the implementation of a mandatory standard on derivatives is associated
with an increase in disclosures in the annual reports. In a related study, Dunne et al. (2003)
find support for the introduction of the standard from preparers, though numerical disclosures
appear to be less popular than narrative disclosures, because of the time and effort needed to
prepare them.
Hamlen and Largay (2005) analyse the disclosures under SFAS 133. They find that
companies increase disclosures after SFAS 133, but disclosures are not informative enough
and reflect unobservable assumptions and choices, harming comparability among companies.
Concluding, there is wide evidence of problems in the accounting for financial instruments
around the world. In the context of the convergence to IFRS within European Union and of
the actual discussion about new models and paradigms of accounting, especially devoted to
the financial instruments, we find that the objectives that we stated for this research are useful
and timely. This research improves our knowledge and understanding of the complex reality
of fair value accounting.
3. RESEARCH DESIGN
With the aim of identifying accounting practices for financial instruments, we analyse
companies’ annual reports4 using a pre-defined list of categories. Table 1 summarises some
recently published studies (all of them reviewed in the prior research section) that examine
information published on the companies’ annual reports in order to identify accounting
practices. All studies are specifically concerned with derivative accounting and disclosure
practices. This paper extends the analysis to all financial instruments.
3 FRS 13: Derivatives and other Financial Instruments: Disclosures, issued by the UK Accounting Standards Board, 1998. 4 Accounting practices are communicated to external parties in many other forms than the annual report, such as press releases, interim financial reports and institutional presentations. However, annual reports are not subject to journalistic interpretations and distortions due to press reporting (Guthrie and Parker (1989)) and are generally considered to be the primary source of information for external parties, such as investors, creditors and the government. Moreover, the analysis of accounting practices for financial instruments through the annual reports is supported by previous research (see Table 1).

6
Table 1: Content analysis studies on accounting practices for financial instruments Instrument/Standard Country Woods and Marginson (2004) and Dunne et al. (2004)
Derivatives/ FRS13 (a) United Kingdom
Chalmers (2001,Chalmers and Godfrey (2000)
Derivatives / AASB 1033 (b) Australia
Blankley et al. (2000) and Roulstone (1999)
Derivatives / FRR 48 (c) United States of America
Edwards Jr. and Eller (1995, (1996) Derivatives/ SFAS 119 (d) United States of America (a) FRS 13: Derivatives and other Financial Instruments: Disclosures, issued by the UK Accounting Standards Board, 1998. (b) AASB 1033: Presentation and Disclosure of Financial Instruments, issued by the Australian Accounting Standards Board (AASB), 1996. (c) FRR 48: Disclosure of Accounting Policies for Derivative Financial Instruments and Derivative Commodity Instruments and Disclosure of Quantitative and Qualitative Information about Market Risk Inherent in Derivative Financial Instruments, Other Financial Instruments and Derivative Commodity Instruments, issued by the US Securities Exchange Commission, 1997. (d) SFAS 119: Disclosure about Derivative Financial Instruments and Fair Value of Financial Instruments, issued by the Financial Accounting Standards Board (FASB), 1994
In order to develop the analysis of the annual reports, we draw up a list of the categories of
inquiry and possible responses that we are interested in analysing. These categories and
responses cover the items that assist our attempt to identify the adoption of IAS 39
measurement and recognition rules and the existence and content of disclosures required by
IAS 32 and IAS 395.
The analysis of the annual reports is structured into two levels:
1 – Analysis of the Balance sheet and Income statement to obtain numerical information
about some generic accounting amounts and financial instruments specific amounts, such as
total assets; total liabilities; total sales/total turnover6; financial investments, excluding parts
of capital in group and associated companies, loans to group and associated companies and
prepayments; short-term marketable securities; and loans, which included long and short term
bond issues, loans and debts to credit institutions7.
2 – Analysis of the Notes to the accounts, and other parts of the annual report, namely letter to
shareholders, management report and corporate governance report in order to codify the
quantitative and qualitative information into the pre-defined categories and responses.
5 Before developing the analysis for the entire sample, we conducted an exploratory analysis on 3 selected annual reports to test the adequacy of the categories/variables identified. This exploratory analysis resulted in few adjustments to the first list of categories related to the amounts of gains and losses realised/non-realised for financial instruments, commissions due to financial instrument operations and amounts of collateral of derivative instruments. 6 In financial companies, this amount corresponds to total revenue. 7 This item is not applicable to financial institutions and so it is not obtained for this type of companies.

7
As derivative instruments have very specific accounting rules compared with other non-
derivative instruments, we divide this part of the analysis into three parts. The first relates to
non-derivative financial instruments, the second to derivative instruments and the third to
information related to all financial instruments.
For each category of information, we qualify the type of information reported as either
quantitative (numerical/monetary) or qualitative (narrative/descriptive) and register the
location in the annual report (letter to shareholders, management report, notes to accounts,
other, including corporate governance report and more than in one location).
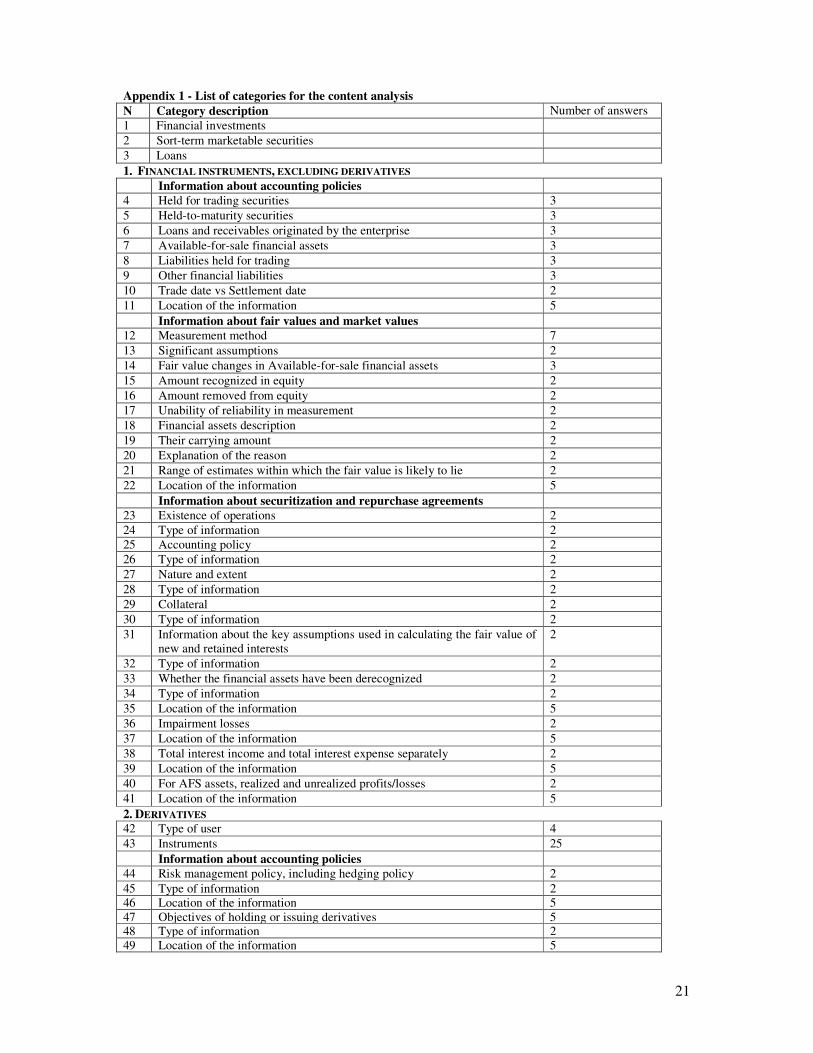
In all, 120 categories and 370 possible responses are drawn up. Appendix 1 shows the list of
categories8.
Sample design and data collection
Our sample includes all companies of the Dow Jones Stoxx 50 Index on 31st December 2001.
The reason for this choice lies in the fact that this index includes the leading European stocks
from 17 western European countries9 allowing us to attain a global view over the other
countries that are going to be affected by Regulation 1606/2002. The annual reports of the
STOXX 50 companies were all obtained from each company’s web pages. Error! Reference
source not found. shows the categorisation of the sample by economic sectors and by
country of origin.
Table 2: Sample By economic sector
N Percent Basic materials 1 2.0 Consumer, cyclical 4 8.0 Consumer, non-cyclical 4 8.0 Energy 5 10.0 Financial 21 42.0 Healthcare 4 8.0 Technology 4 8.0 Telecommunications 5 10.0 Utilities 2 4.0 Total 50 100.0
By country of origin
N Percent Spain 3 6.0 Germany 8 16.0 Finland 1 2.0 France 8 16.0 UK 13 26.0 Netherlands 6 12.0 Italy 3 6.0 Sweden 1 2.0 Switzerland 7 14.0 Total 50 100.0
8 A complete list with all the 370 possible responses is available from the authors upon request. 9Austria, Belgium, Denmark, Finland, France, Germany, Greece, Italy, Ireland, Luxembourg, the Netherlands, Norway, Spain, Sweden, Switzerland, Portugal and the United Kingdom.

8
We begin by developing a standard form to be used to collect the responses to each of the
categories of inquiry. All data are then collected by hand from the companies’ 2001 annual
reports10. A separate form is completed for each company. Finally, we enter the responses
from the completed forms in a database from which the data can be analysed (SPSS software).
The main descriptive statistics of the sample are summarised in Table 3. In this group of
companies, 12% are listed solely on the stock exchange of the country of origin. The majority
of the companies are listed on several stock exchanges, 82% in the USA and 4% on non-USA
stock exchanges. Regarding the type of auditor, almost all companies (except one) are audited
by an auditor that belongs to the big five group.
Table 3: Selected descriptive statistics Continuous variables N Min Max Mean Std. Dev. Total assets (10^6 euros) 50 14872.00 918222.00 242610.30 258347.30
Liabilities/ Asset (%) 50 18.09 101.29 74.6148 20.45238
Liabilities/Equity (D/E) (%) 50 -7829.89 3868.84 686.3357 1557.33350
Sales (10^6 euros) 50 5689.77 197682.97 48513.66 39811.26
Sales to foreign countries/Sales (%) 45 (a) 19.32 98.55 68.79 23.36
Market value /Assets (%) 50 4.08 606.71 82.03 122.50
Financial liabilities/ Assets (%) 29 (b) 4.62835 66.64 24.44886 15.67519 (a) 5 companies did not disclose in their annual reports the amount of sales to foreign countries (b) This ratio is calculated for all non-financial companies Categorical variables
Attributes N % Listed, origin country stock exchange 6 12.0 Multilisting, including USA 41 82.0 Multilisting, not including USA 2 4.0
Listing status
Do not disclose 1 2.0 Big five 49 98.0 Auditor status Not big five 1 2.0
4. EMPIRICAL RESULTS
Next we present the main results of the analysis of the annual reports based on the frequencies
for each accounting method and for each disclosure and compare companies’ accounting
choices with those required by IAS 32 and IAS 39 methods and disclosures. Analysis of
10 With the exception of the BT Group, Diageo, Siemens and Vodafone, which have end of years different from the 31st December. For these companies we choose the 2002 annual reports, since IAS 39 became operative for financial statements covering financial years beginning on or after 1 January 2001.
9
frequencies is the most common technique found in IAS compliance and harmonisation
studies (Tay and Parker (1990); Evans and Taylor (1982); Nobes (1990); Street and Gray
(1999); Street et al. (1999); Chalmers (2001); Chalmers and Godfrey (2000)).
The research questions stated are the following:
- How are European companies accounting for financial instruments (including derivatives)
costs, gains and losses?
- How are European companies calculating and disclosing the fair value of financial
instruments?
- How are European companies disclosing the risks of their financial instruments positions?
- Is the disclosed information understandable and comparable?
- How far are these practices from IAS 32 and IAS 39 requirements?
Before presenting the results, two notes must be made. The first note relates to non-
disclosure. We are very careful when classifying a company as non-disclosing. An item is
considered non-disclosed only if it is applicable to the company. If the opposite is true, it is
considered non-applicable and the company is excluded from the analysis of that specific
item. The second note relates to the analysis by country. Our research objective is not to
analyse the practices in the various European countries. Instead we aim to describe the
practices among a group of big European listed groups, global player companies, supposedly
the ones possessing the best information systems and applying the most advanced and
sophisticated accounting and disclosure practices, and which can be seen as benchmarks by
other parties. Our analysis applies to the group of companies of the STOXX 50 as a whole.
Financial instruments, excluding derivatives
Measurement
Regarding measurement, more than a half of the companies (55.3%) adopt fair value for held-
for-trading financial assets, according to IAS 39 requirements. However, for available-for-sale
financial assets the majority of companies (64%) adopt cost criterion, against IAS 39.
Regarding held-for-trading liabilities, there are only 4 companies that report this type of
liability. All of them use fair value in balance sheet recognition.

10
Table 4: Accounting Policies
Non disclosing
Cost or amortised cost
Fair value or market value
Held-for-trading financial assets 0 .0% 21 44.7% 26 55.3% Held-to-maturity financial assets 0 .0% 44 100.0% 0 .0% Loans and Receivables Originated by the Enterprise 0 .0% 49 98.0% 1 2.0% Available-for-sale financial assets 0 .0% 32 64.0% 18 36.0% Held-for-trading Liabilities 0 .0% 0 .0% 4 100.0% Other financial liabilities 0 .0% 50 100.0% 0 .0%
Fair value disclosures
According to IAS 32 and IAS 39 companies are required to disclose the fair value
determination method and the significant assumptions adopted. These disclosures are
essential for the comprehensibility and comparability of the information. In fact, as companies
use several financial instruments that are not traded in liquid markets, their fair value must be
estimated. This fact implies choices by companies. Without clear and complete information
about the methods and the assumptions adopted, the fair value information in not useful,
because it is not reliable and does not permit comparisons, making it very difficult to ascertain
the company’s exposure to risk.
Regarding the fair value calculation method, 22% of companies do not disclose any type of
method. Most companies (68%) report the use of more than one method, depending on the
type of instrument and on the fact that the instrument is listed or not. Among these companies,
all of them use market quotation for listed securities and some other method when market
quotation is not available. The most used method is discounted cash-flows, which is pointed
out by 21 companies. Market quotations of similar instruments, independent appraisals and
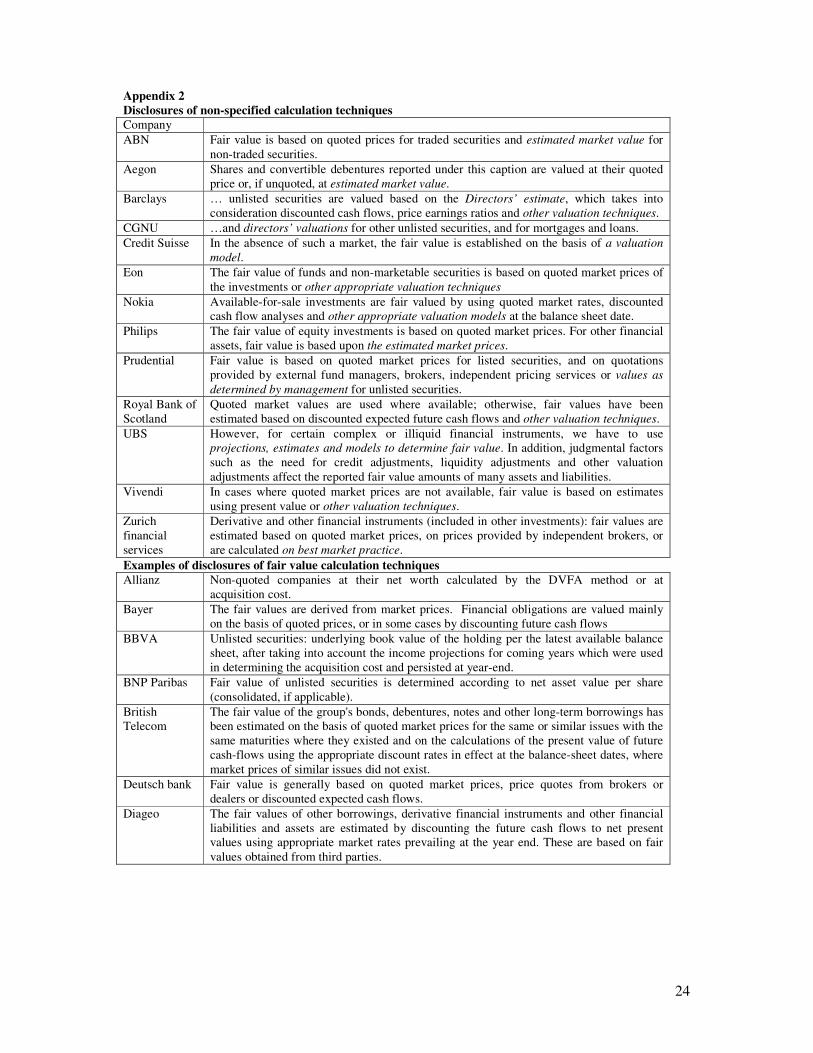
option valuation techniques are each mentioned by 4 companies. We register several cases
(13) of generic and vague mention to “standard valuation models”, “market accepted
valuation techniques”, or “directors’ estimates” (see Appendix 2). Some companies (e.g.
ABN) also make a reference to the subjective nature of values obtained by estimation
methods advising that disclosed fair values may not be comparable with other companies’ and
may not be indicative of the net realisable value. We argue that this limitation can be
overcome with a full disclosure information system, which includes the description of the
method and clear and objective information (with quantitative information) about the adopted
assumptions and the sources of those assumptions and values, per type of instrument.
Regarding significant assumptions adopted, there is an almost total lack of information
disclosed by companies. None of the sample companies discloses quantitative information of

11
assumptions adopted, such as discount rates, credit risk adjustments, etc. The only
information that we find is of qualitative type, such as that of Astrazeneca (p. 73): “…the fair
value of remaining debt is estimated using appropriate zero coupon valuation techniques
based on rates current at year end” and of Zurich Financial Services (p. 79): “…discounted
cash flow calculations based upon the Group’s current incremental lending rates for similar
type loans. Universal life and other investment contracts: fair values are estimated using
discounted cash flow calculations based on interest rates currently being offered for similar
contracts with maturities consistent with those remaining for the contracts being valued.”
Table 5: Fair value calculation method N Non-disclosing* 11 22.0% Disclosing Market quotation 5 10.0% Market quotation of a similar instrument 0 0
Independent appraisals 0 0 Discounted cash-flows 0 0 Option valuation models 0 0 Several methods 34 68.0% N Market quotation 34 Market quotation of a similar
instrument 4
Independent appraisals 4 Discounted cash-flows 21 Option valuation models 4 Other specified calculation
methods 6
Other not specified 13 * Non-disclosing stands for companies that say nothing about calculation methods; if the company refers to standard valuation techniques or another generic expression it is included in the category of other not specified.
Available-for-sale assets
When companies adopt fair value for available-for-sale financial assets, under IAS 39 they
must disclose additional information. They must disclose where (equity / profit or loss for the
period) they register unrealised gains or losses and if it is in equity, they must disclose the
amounts recognised and removed from equity during the year. Among our sample companies
that adopt fair value to this class of assets (18 companies), 16 companies recognises
unrealised gains and losses in equity. Additionally, only 10 companies, among those 16 that
register gains and losses in equity, disclose the amount taken to equity and 7 disclose the
12
amount removed from equity and recognised in profit and losses. Summing up, there is quite
a large percentage of non disclosure regarding this item.
Derivatives
Before analysing the accounting practices for derivatives, we are going to characterise the
sample regarding instruments adopted and purposes stated for the use of derivatives.
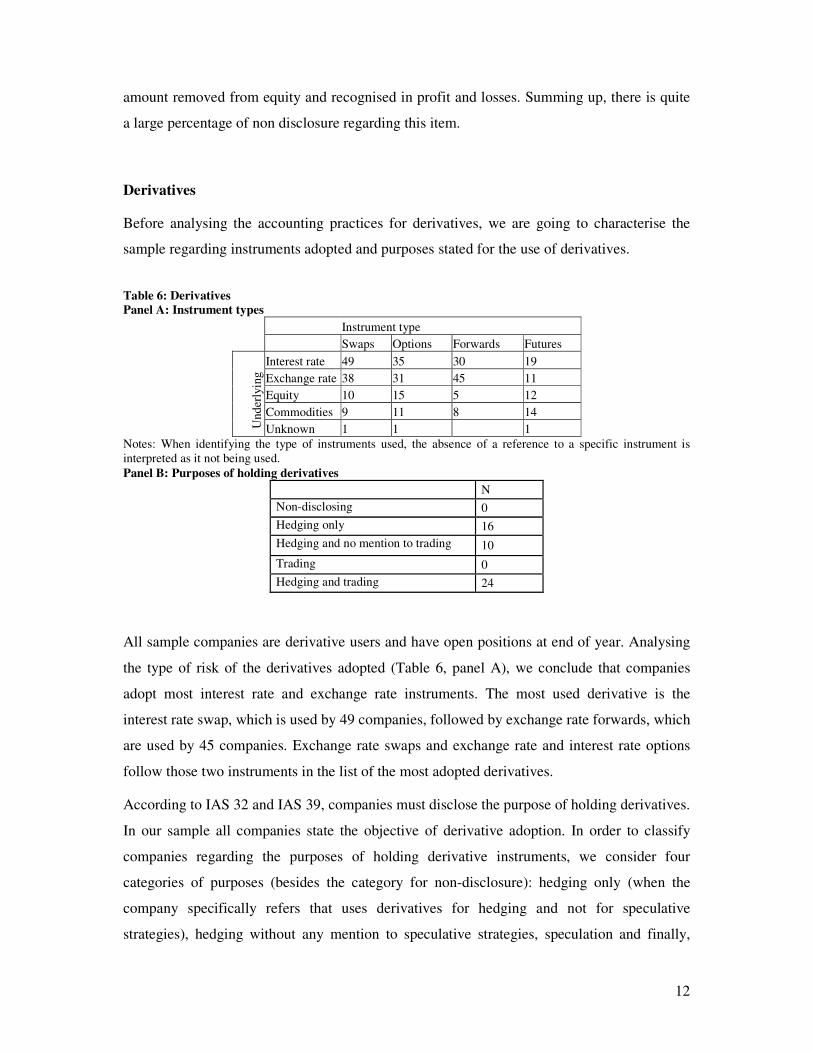
Table 6: Derivatives Panel A: Instrument types
Instrument type Swaps Options Forwards Futures
Interest rate 49 35 30 19 Exchange rate 38 31 45 11 Equity 10 15 5 12 Commodities 9 11 8 14
Und
erly
ing
Unknown 1 1 1 Notes: When identifying the type of instruments used, the absence of a reference to a specific instrument is interpreted as it not being used. Panel B: Purposes of holding derivatives
N Non-disclosing 0 Hedging only 16 Hedging and no mention to trading 10 Trading 0 Hedging and trading 24
All sample companies are derivative users and have open positions at end of year. Analysing
the type of risk of the derivatives adopted (Table 6, panel A), we conclude that companies
adopt most interest rate and exchange rate instruments. The most used derivative is the
interest rate swap, which is used by 49 companies, followed by exchange rate forwards, which
are used by 45 companies. Exchange rate swaps and exchange rate and interest rate options
follow those two instruments in the list of the most adopted derivatives.
According to IAS 32 and IAS 39, companies must disclose the purpose of holding derivatives.
In our sample all companies state the objective of derivative adoption. In order to classify
companies regarding the purposes of holding derivative instruments, we consider four
categories of purposes (besides the category for non-disclosure): hedging only (when the
company specifically refers that uses derivatives for hedging and not for speculative
strategies), hedging without any mention to speculative strategies, speculation and finally,

13
both hedging and speculation. We think that this classification is useful because the specific
mention by companies that they do not use derivatives for speculation can be interpreted that
companies expect that this disclosure is perceived by the market as a non-risky use of these
types of instruments, which are normally related to risky positions. All the companies use
derivatives for hedging purposes. The majority of companies (24) state that behind hedging,
they use derivatives for investment and speculative purposes. Additionally, a group of
companies (16) specifically states that it adopts derivatives for hedging only, not using them
for other purposes, namely for speculative strategies.
Accounting policies
The disclosure of the accounting policies adopted regarding derivative instruments is analysed
by considering 4 categories of methods of recognition and measurement (lower of cost or
market, fair value/market value only, hedge accounting only and both fair value/market value
and hedge accounting), besides the category for non-disclosure (Table 7, panel A). Most
companies are classified in the category of fair value/market value plus hedge accounting
meaning that the accounting policy adopted depends on the purpose of using derivatives. We
register 3 companies that always use fair value/market value for all their derivatives positions
and 11 companies that only use hedge accounting. Then we analysed the accounting policies
applied within hedge accounting (Table 7, panel B). Most companies (31) use the deferral
method to account for gains and losses of derivatives in hedging relations. This is against the
requirements of IAS 39, which requires that gains and losses in the hedging position
(derivative) be recognised immediately in equity or profit and loss account, and gains and
losses in the hedged position also be recognised immediately (even if out of the hedge relation
the hedge position is being measured at cost). 15 companies adopt the accounting policy
required by IAS 39, that is, recognise gains and losses in the profit and loss account or in
equity.
Table 7: Accounting policies and methods adopted Panel A: All types of transactions
N Percent Non-disclosing 2 4.0 LOCOM 2 4.0 Fair value/ Market value 3 6.0 Hedge accounting 11 22.0 Fair value/ Market value + hedge accounting 32 64.0

14
Total 50 100.0 Panel B: Hedging accounting policies
N Percent Non-disclosing 3 6.0 Deferral 31 62.0 Profit and loss account 1 2.0 Profit and loss account and equity 15 30.0 Total 50 100.0
Hedging disclosures
IAS 32 and IAS 39 prescribe quite an extensive list of disclosures regarding hedging
operations. We analyse the degree of disclosure of each item required by IAS among our
sample companies. The degree of non-disclosure is between 12% and 36% depending on the
item. The biggest non-disclosure percentage is found in the fair value of the hedging
instruments. Most of the companies disclose a description of the hedging operations, the
instruments adopted for the operations and the type of risks hedged.
Table 8: Hedging Panel A: Disclosures
Non-disclosing Disclosing Hedging description 10 20.0% 40 80.0% Financial instruments designated as hedging instruments description 7 14.0% 43 86.0%
Their fair values 18 36.0% 32 64.0% Nature of the risks being hedged 6 12.0% 44 88.0%
Panel B: Hedging of forecasted transaction disclosures Non-disclosing Disclosing Period in which the transaction is expected to occur 37 82.2% 8 17.8%
Period in which it is expected to appear in the determination of net profit or loss 29 64.4% 16 35.6%
Panel C: Cash-flow hedging disclosures Non-disclosing Disclosing Non applicable Amount recognised in equity 6 12.0% 9 18.0% 35 70.0% Amount removed from equity and reported in net profit or loss 11 22.0% 4 8.0% 35 70.0%
Amount removed from equity and added to the initial measurement of the acquisition cost 15 30.0% 0 .0% 35 70.0%
The so-called forecasted transaction hedges and cash-flow hedges imply, according to IAS 39,
additional disclosures. In our sample, 45 companies engage in hedges of forecasted
transactions and 46 in cash-flow hedges. Regarding the hedging of forecasted transactions, we

15
register a high degree of non-disclosure either regarding the disclosure of the period in which
the forecasted transaction will occur or the disclosure of the period in which the operation will
appear in the determination of net profit or loss (Table 8, panel B). Regarding the required
disclosures for cash-flow hedges (Table 8, panel C), they relate to the accounting policy
required by IAS 39 in this type of hedges. IAS 39 requires the disclosure of the amount
recognised in equity, the amount removed from equity and reported in net profit or loss and
the amount removed from equity and added to the initial measurement of the acquisition cost.
Only 15 companies are eligible for this analysis, as shown in Table 7, panel B. The only item
that is disclosed by the majority of companies belonging to this group is the amount taken to
equity (disclosed by 9 companies). The other two items are not disclosed by the majority of
companies.
Other derivative disclosures
Regarding other derivative policies disclosures (Table 9, panel A), financial control policy is
the least disclosed item. Risk management policy and monitoring policy are disclosed by 86%
and 58% of the companies, respectively. This denotes a good degree of disclosure of the risk
management policy of the companies, but a medium and small degree of disclosure of the
monitoring and the financial control policies applied to derivatives.
Table 9: Derivative disclosures Panel A: Policies
Non-disclosing Disclosing Risk management policy 7 14.0% 43 86.0% Monitoring policy 21 42.0% 29 58.0% Financial control 32 64.0% 18 36.0%
Panel B: Risks Non-disclosing Disclosing Segregation by risk categories 9 18.0% 41 82.0% Extent 11 22.0% 39 78.0% Maturity 25 50.0% 25 50.0% Effective or weighted interest rate 36 72.0% 14 28.0%
Almost all the information disclosed by companies regarding these items is of a qualitative
type, even regarding the financial control policy. In this item it would be expected that
companies would present the financial controls and limits that they have defined to their
derivative positions. Most of the time, what we find is a generic and qualitative description of
16
the controls. For example, Alcatel says that “The group controls credit risks related to these
financial instruments by credits, investments limits authorisation and centralised treasury
policies but do not ask for pledge or other guarantees to cover risks linked to these financial
instruments.” Diageo refers to a “defined benchmark level” without specifying it. Zurich
Financial Services also refers to the existence of limits but does not specify them. Some
companies, such as Eni and Deutsche Telekom state that risk evaluation of their positions in
this type of instruments is carried out according to Basel Committee recommendations.
Several companies, most of them from the financial sector, make reference to the VAR
technique as a measure of risk exposure and a means of risk control. In some cases, this
technique is accompanied by other analyses, such as stress tests and sensitivity analyses. Two
examples of detailed descriptions of VAR technique adoption from non-financial companies
are the cases of Nokia and Novartis. Nokia says: “Nokia uses the Value-at-Risk (“VaR”)
methodology to assess the foreign exchange risk related to the Treasury management of the
Group exposures. The VaR figure represents the potential losses for a portfolio resulting from
adverse changes in market factors using a specified time period and confidence level based on
historical data. To correctly take into account the non-linear price function of certain
derivative instruments, Nokia uses Monte Carlo simulation. Volatilities and correlations are
calculated from a one-year set of daily data. The VaR figures assume that the forecasted cash
flows materialize as expected”. Novartis states that “The Group uses a value at risk (“VAR”)
computation to estimate the potential ten-day loss in the fair value of its interest rate-sensitive
financial instruments, the loss in pre-tax earnings of its foreign currency price-sensitive
derivative financial instruments as well as the potential ten-day loss of its equity holdings. In
addition to these VAR analyses, the Group uses stress-testing techniques. Such stress-testing
is aimed at reflecting a worst case scenario”.
Lastly, regarding the location of risk management policies, most companies disclose this
information in the Management Report (20 companies), the non-audited part of the annual
report and in the Notes to the accounts (19 companies).
When it comes to the disclosure of the risks of derivative positions (Table 9, panel B), the
great majority of companies disclose information segregated by risk categories (exchange
rate, interest rate, equity, commodity prices) and disclose the notional or other similar amount
of their derivative positions. Yet, the maturity and the effective or weighted interest rate are
not disclosed by the majority of companies.

17
Derivative fair value disclosures
As for other non-derivative instruments, the disclosure of the fair value calculation method
and the significant assumptions adopted for the estimation of the fair value when there is not
an active market for the derivative are essential for the usefulness and comparability of the
fair value amounts. Again, we find that, though the majority of companies disclose the fair
value amount of their derivative positions, they do not disclose the calculation methods (38%
of companies) and the assumptions adopted to calculate the fair value (none of the companies
disclose clear information about this). Finally, the degree of non-disclosure of the average fair
value in the period is also almost total (90% of the companies).
Table 10: Fair value disclosures Non-disclosing Disclosing Fair value amount 11 22.0% 39 78.0% Significant assumptions 50 100.0% 0 .0% Average fair value in the period 45 90.0% 5 10.0%
Analysing the methods of fair value calculation disclosed by companies, besides the
companies that do not disclose this information (38%), the great majority state the use of
more than one method of calculation, including the market value when it is available. When
there is not a market for the instrument, fair value is calculated mostly by using discounted
cash-flow techniques (by 16 companies) and option valuation models (by 8 companies). As
for non-derivative instruments, we register several cases (12) of generic references to
valuation techniques not specifying them.
Table 11: Derivative fair value calculation method Non-disclosing 19 38.0% Market price 1 2.0% Similar instrument market price 0 .0% Independent appraisal 0 .0% Discounted cash-flow analysis 5 10.0% Option valuation model 0 .0% Several 25 50.0% Market quotation 24 Market quotation of a similar
instrument 1 Independent appraisals 6 Discounted cash-flows 16 Option valuation models 8 Other not specified 12

18
Financial Instrument Risks
Interest rate risk disclosures
Within interest rate risk disclosures, Table 12, panel A, shows that most companies disclose
the contractual repricing or maturity dates of the assets and liabilities exposed to interest rate
risk. Yet, when it comes to the disclosure of the effects of future interest rate changes, the
level of non-disclosure increases to 52% of the companies.
IAS 32 suggests several alternative formats for information disclosure, including tabular,
narrative descriptions based on maturity time bands, fixed and floating rate exposures, interest
rate sensitivity analysis and through the use of weighted average rates or ranges of rates. The
formats to disclose interest rate risk exposure most chosen by companies are the tabular
format (50% of the companies) and sensitivity analysis (30.4% of companies).
Table 12: Interest rate risk Panel A: Disclosures
Non-disclosing Disclosing Effects of future interest rate changes 26 52.0% 24 48.0%
Maturity dates 7 14.0% 43 86.0% Panel B: Format
N % Narrative descriptions 1 2.2% Tabular format 23 50.0% Sensitivity analysis 14 30.4% Combination of several formats 8 17.4%
Credit risk disclosures
Regarding credit risk disclosures, overall the level of disclosure is very low. The
counterparties are disclosed by a very small number of companies (20%). The maximum
amount of credit risk exposure and the significant concentration of credit risk show slightly
better disclosure levels, but they are still disclosed by a minority of companies (32% and
42%, respectively).
Table 13: Credit risk disclosures Non-disclosing Disclosing N % N % Counterparties identification 40 80.0% 10 20.0% Maximum amount of credit risk exposure 34 68.0% 16 32.0%
Significant concentration of credit risk 29 58.0% 21 42.0%

19
5. DISCUSSION
Summarising, we conclude that about half of the companies are using fair value for held-for-
trading financial assets, but less than half adopt this criteria for available-for-sale financial
assets as required by IAS 39. The majority of companies disclose the fair value method, but
the information is far from being clear and objective, preventing the fair value information
from being relevant and useful. Regarding derivative accounting policies, the worst situation
was recorded in the accounting for hedging transactions. The majority of companies are still
using deferral methods and show low levels of disclosure.
We registered generic and qualitative type descriptions of risk management policies and
derivatives’ financial controls, making it difficult for users to have a clear understanding of
information. Similar studies in other countries (Roulstone (1999), in USA, Woods and
Marginson (2004), in the UK, Chalmers and Godfrey (2000), in Australia) also found that
companies disclose generic information about the adoption of derivatives and risk
management. Chalmers (2001) presents two arguments for these findings: the lack of quality
of information available to managers and the proprietary nature of specific disclosure items.
In her opinion, there are two areas, commodity risk and interest rate risk, which may be
critical for companies due to their specific commercial sensitivity. Chalmers and Godfrey
(2000) argue that the solution lies in more stringent standards with extended disclosure
requirements in terms of quantity and specificity. They point out IAS 39 and SFAS 133 as
examples of standards that require enhanced disclosures. Woods and Marginson (2004) are in
line with this last solution. They expect that improvements in the derivative disclosures may
be forthcoming with new financial instrument standards, namely as a consequence of IAS 32.
Our empirical study shows that companies have quite a long way to go in terms of accounting
and disclosure of financial instruments, namely derivatives. The mandatory adoption of more
stringent standards such as the IAS 32 and IAS 39 may improve the information disclosed by
companies. However, since this area is quite critical and sensitive for companies as it deals
with exposure to risks and their management, two doubts remain: first, if the existence of
mandatory standards will mean compliance with them; second, even if companies comply
with IAS 32 and IAS 39, it remains to be seen whether the information disclosed under these
standards is more useful for decision-making.
20
Finally, we would like to mention some limitations of this study. First, we are aware that
annual reports may not be the best source of information about compliance, at least, they are
certainly not the only one. We should thus accept that our results may not show important
aspects of accounting practices, and that they are naturally influenced by the source of
information used. Then there is the limitation inherent in the research technique adopted. The
authors took every care when examining the information provided in the annual reports and
classifying it into the categories, but errors may have occurred.
In spite of these limitations, we think that this paper makes important contributions. We
provide a first complete and exhaustive template for analysing the accounting practices for
financial instruments based on companies’ annual reports. Then, the research describes the
practices of the accounting for financial instruments of the biggest European companies
(European global players), supposedly the ones possessing the best information systems and
applying the most advanced and sophisticated accounting and disclosure practices. We show
the areas in which these companies are farther away from complying with the requirements of
IAS in relation to financial instruments, an issue widely accepted as being complex and one
that is far from being closed.
These results are useful for the IASB and national standard setters and for every other
company that is going to change to IFRS since they point out the areas which will require
more work in order to achieve convergence to IAS 32 and IAS 39 and high degrees of
compliance with these accounting standards.
21
Appendix 1 - List of categories for the content analysis N Category description Number of answers 1 Financial investments 2 Sort-term marketable securities 3 Loans 1. FINANCIAL INSTRUMENTS, EXCLUDING DERIVATIVES Information about accounting policies 4 Held for trading securities 3 5 Held-to-maturity securities 3 6 Loans and receivables originated by the enterprise 3 7 Available-for-sale financial assets 3 8 Liabilities held for trading 3 9 Other financial liabilities 3 10 Trade date vs Settlement date 2 11 Location of the information 5 Information about fair values and market values 12 Measurement method 7 13 Significant assumptions 2 14 Fair value changes in Available-for-sale financial assets 3 15 Amount recognized in equity 2 16 Amount removed from equity 2 17 Unability of reliability in measurement 2 18 Financial assets description 2 19 Their carrying amount 2 20 Explanation of the reason 2 21 Range of estimates within which the fair value is likely to lie 2 22 Location of the information 5 Information about securitization and repurchase agreements 23 Existence of operations 2 24 Type of information 2 25 Accounting policy 2 26 Type of information 2 27 Nature and extent 2 28 Type of information 2 29 Collateral 2 30 Type of information 2 31 Information about the key assumptions used in calculating the fair value of
new and retained interests 2
32 Type of information 2 33 Whether the financial assets have been derecognized 2 34 Type of information 2 35 Location of the information 5 36 Impairment losses 2 37 Location of the information 5 38 Total interest income and total interest expense separately 2 39 Location of the information 5 40 For AFS assets, realized and unrealized profits/losses 2 41 Location of the information 5 2. DERIVATIVES 42 Type of user 4 43 Instruments 25 Information about accounting policies 44 Risk management policy, including hedging policy 2 45 Type of information 2 46 Location of the information 5 47 Objectives of holding or issuing derivatives 5 48 Type of information 2 49 Location of the information 5

22
50 Accounting policies and methods adopted 5 51 Type of information 2 52 Location of the information 5 53 Monitoring and controlling policy 2 54 Type of information 2 55 Location of the information 5 56 Financial controls 2 57 Type of information 2 58 Location of the information 5 Information about risks 59 Segregation by risk categories 2 60 Type of information 2 61 Location of the information 5 62 Principal, stated value, face value, notional value 2 63 Type of information 2 64 Location of the information 5 65 Maturity 2 66 Type of information 2 67 Location of the information 5 68 Weighted average/effective interest rate 2 69 Type of information 2 70 Location of the information 5 Information about hedging transactions 71 Hedging description 2 72 Type of information 2 73 Location of the information 5 74 Accounting method 4 75 Type of information 2 76 Location of the information 5 77 Financial instruments designated as hedging instruments 2 78 Type of information 2 79 Location of the information 5 80 Fair values 2 81 Type of information 2 82 Location of the information 5 83 Nature of the risks being hedged 2 84 Type of information 2 85 Location of the information 5 Future transactions hedging 86 Existence 2 87 The period in which forecasted transactions are expected to occur 2 88 The period they are expected to enter in income 2 Cash-flow hedging 89 Existence 2 90 The amount recognized in equity 2 91 The amount removed from equity and recognized in income 2 92 The amount removed from equity and added to initial measurement of
the acquisition cost 2
Information about fair values 93 Fair value 2 94 Method adopted 7 95 Significant assumptions 2 96 Average fair value during the year 2 97 Location of the information 5 3. ALL FINANCIAL INSTRUMENTS Information about interest rate risk 98 Future changes in interest rates 2 99 Type of information 2

23
100 Maturity dates 2 101 Disclosure format 4 102 Location of the information 5 Information about credit risk 103 Counterparties identification 2 104 Type of information 2 105 Location of the information 5 106 Maximum amount of credit risk exposure 2 107 Type of information 2 108 Location of the information 5 109 Significant concentration of credit risk 2 110 Type of information 2 111 Location of the information 5 Others 112 Collateral – terms and conditions 2 113 Type of information 2 114 Location of the information 5 115 Collateral - Carrying amount and fair value 2 116 Type of information 2 117 Location of the information 5 118 Negative Information 2 119 Type of information 2 120 Location of the information 5 Total answers 370
24
Appendix 2 Disclosures of non-specified calculation techniques Company ABN Fair value is based on quoted prices for traded securities and estimated market value for
non-traded securities. Aegon Shares and convertible debentures reported under this caption are valued at their quoted
price or, if unquoted, at estimated market value. Barclays … unlisted securities are valued based on the Directors’ estimate, which takes into
consideration discounted cash flows, price earnings ratios and other valuation techniques. CGNU …and directors’ valuations for other unlisted securities, and for mortgages and loans. Credit Suisse In the absence of such a market, the fair value is established on the basis of a valuation
model. Eon The fair value of funds and non-marketable securities is based on quoted market prices of
the investments or other appropriate valuation techniques Nokia Available-for-sale investments are fair valued by using quoted market rates, discounted
cash flow analyses and other appropriate valuation models at the balance sheet date. Philips The fair value of equity investments is based on quoted market prices. For other financial
assets, fair value is based upon the estimated market prices. Prudential Fair value is based on quoted market prices for listed securities, and on quotations
provided by external fund managers, brokers, independent pricing services or values as determined by management for unlisted securities.
Royal Bank of Scotland
Quoted market values are used where available; otherwise, fair values have been estimated based on discounted expected future cash flows and other valuation techniques.
UBS However, for certain complex or illiquid financial instruments, we have to use projections, estimates and models to determine fair value. In addition, judgmental factors such as the need for credit adjustments, liquidity adjustments and other valuation adjustments affect the reported fair value amounts of many assets and liabilities.
Vivendi In cases where quoted market prices are not available, fair value is based on estimates using present value or other valuation techniques.
Zurich financial services
Derivative and other financial instruments (included in other investments): fair values are estimated based on quoted market prices, on prices provided by independent brokers, or are calculated on best market practice.
Examples of disclosures of fair value calculation techniques Allianz Non-quoted companies at their net worth calculated by the DVFA method or at
acquisition cost. Bayer The fair values are derived from market prices. Financial obligations are valued mainly
on the basis of quoted prices, or in some cases by discounting future cash flows BBVA Unlisted securities: underlying book value of the holding per the latest available balance
sheet, after taking into account the income projections for coming years which were used in determining the acquisition cost and persisted at year-end.
BNP Paribas Fair value of unlisted securities is determined according to net asset value per share (consolidated, if applicable).
British Telecom
The fair value of the group's bonds, debentures, notes and other long-term borrowings has been estimated on the basis of quoted market prices for the same or similar issues with the same maturities where they existed and on the calculations of the present value of future cash-flows using the appropriate discount rates in effect at the balance-sheet dates, where market prices of similar issues did not exist.
Deutsch bank Fair value is generally based on quoted market prices, price quotes from brokers or dealers or discounted expected cash flows.
Diageo The fair values of other borrowings, derivative financial instruments and other financial liabilities and assets are estimated by discounting the future cash flows to net present values using appropriate market rates prevailing at the year end. These are based on fair values obtained from third parties.

25
References
BDO, DELOITTE, ERNST&YOUNG, G. THORNTON, KPMG, and PRICEWATERHOUSECOOPERS (2003): "GAAP Convergence 2002: A Survey of National Efforts to Promote and Achieve Convergence with International Financial Reporting Standards", BDO, Deloitte, Ernst&Young, G. Thornton, KPMG, and Pricewaterhousecoopers.
BLANKLEY, A., R. LAMB, and R. SCHROEDER (2000): "Compliance with SEC Disclosure Requirements about Market Risk", Journal of Derivatives, Vol. 7, 3, 39-51.
CHALMERS, K. (2001): "The Progression from Voluntary to Mandatory Derivative Instrument Disclosures - Look Who's Talking", Australian Accounting Review, Vol. 11, 1, 34-44.
CHALMERS, K., and J. GODFREY (2000): "Practice versus Prescription in the Disclosure and Recognition of Derivatives", Australian Accounting Review, Vol. 11, 2, 40-50.
DUNNE, T., C. HELLIAR, C. MALLIN, L. MOIR, K. OW-YONG, and D. POWER (2003): "The financial reporting of derivatives and other financial instruments: a study of the implementation and disclosures of FRS 13", (ICAEW).
DUNNE, T., C. HELLIAR, D. POWER, C. MALLIN, K. OW-YONG, and L. MOIR (2004): "The introduction of derivatives reporting in the UK: A content analysis of FRS 13 disclosures", Journal of Derivatives Accounting, Vol. 1, 2, 205-219.
EDWARDS JR., G., and G. ELLER (1995): "Overview of Derivatives Disclosures by Major U.S. Banks", Federal Reserve Bulletin, September, 817-831.
— (1996): "Derivatives Disclosures by Major U.S. Banks, 1995", Federal Reserve Bulletin, September, 792-801.
EVANS, T., and M. TAYLOR (1982): ""Bottom line compliance" with IASC: A Comparative Analysis", The International Journal of Accounting, Vol. 18, 1, 115-128.
GÉLARD, G. (2004): "What can be expected from Accounting Standards?" Accounting in Europe, Vol. 1, September, 17-20.
GUTHRIE, J., and L. PARKER (1989): "Corporate Social Reporting: A Rebuttal of Legitimacy Theory", Accounting and Business Research, Vol. 19, 76, 343-352.
HAGUE, I. (2004): "IAS 39: Underlying principles", Accounting in Europe, Vol. 1, September, 21-26.
HAMLEN, S., and J. LARGAY (2005): "Has SFAS 133 made derivatives reporting more transparent? A look at the Dow-Jones 30", Journal of Derivatives Accounting, Vol. 2, 2, 215-230.
JERMAKOWICZ, E. (2004): "Effects of Adoption of International Financial Reporting Standards in Belgium: The Evidence from BEL-20 Companies", Accounting in Europe, Vol. 1, September, 51-70.
LARSON, R., and D. STREET (2004): "Convergence with IFRS in an expanding Europe: progress and obstacles identified by large accounting firms' survey", Journal of International Accounting, Auditing & Taxation, Vol. 13, 2, 89-119.
MAHONEY, J., and Y. KAWAMURA (1995): "Review of 1994 Disclosures about Derivative Financial Instruments and Fair Value of Financial Instruments", Financial Accounting Series, 156-A, F. A. S. Board. Norwalk.

26
NOBES, C. (1990): "Compliance by US Corporations with IASC Standards", The British Accounting Review, Vol. 22, 1, 41-49.
PACTER, P. (2005): "What exactly is convergence", International Journal of Accounting, Auditing and Performance Evaluation, Vol. 2, 1/2, 67-83.
ROULSTONE, D. (1999): "Effect of SEC Financial Reporting Release nº 48 on Derivative and Market Risk Disclosures", Accounting Horizons, December, Vol. 13, 4, 343-363.
SCHIPPER, K. (2005): "The introduction of International Accounting Standards in Europe: Implications for international convergence", European Accounting Review, Vol. 14, 1, 101-126.
STREET, D., and S. GRAY (1999): "How wide is the gap between IASC and U.S. GAAP? Impact of the IASC comparability project and recent international developments", Journal of International Accounting, Auditing & Taxation, Vol. 8, 1, 133-164.
STREET, D., S. GRAY, and S. BRYANT (1999): "Acceptance and Observance of International Accounting Standards: An Empirical Study of Companies Claiming to Comply with IASs", The International Journal of Accounting, Vol. 34, 1, 11-48.
STREET, D., and R. LARSON (2004): "Large Accounting Firms' survey reveals emergence of "Two Standard" system in the European Union", Advances in international accounting, Vol. 17, 1-29.
SUCHER, P., and I. JINDRICHOVSKA (2004): "Implementing IFRS: A Case Study of the Czech Republic", Accounting in Europe, Vol. 1, September, 109-141.
TAY, J., and R. PARKER (1990): "Measuring International Harmonization and Standardization", Abacus, Vol. 26, 1, 71-88.
WALTON, P. (2004): "IAS 39: Where Different Accounting Models Collide", Accounting in Europe, Vol. 1, 5-16.
WHITTINGTON, G. (2005): "The adoption of International Accounting Standards in the European Union", European Accounting Review, Vol. 14, 1, 127-153.
WOODS, M., and D. MARGINSON (2004): "Accounting for Derivatives: An Evaluation of Reporting Practice by UK Banks", European Accounting Review, Vol. 13, 2, 373-391.

Recent FEP Working Papers
������������ �� ������������������������� ���������������������������������������������������������������������������������������
�������������������������� �����!��������������������������������������������� ����������������� �����������������
�����"������ �� �������������!���� �� �� �����#�� !��������� �������������������������������������������������������������������������������������������������
�����$�������������%&�#��������� ������'�(����� ������������������ �����"#$�$��������$������������%������������������
�����)������ �� ���������� !��������� �����������������������������������������������������������������������������*�(�+������"�
������� ����,�#+������������������ �, �-��.����� ���"������&�����������&�������������������������"������� �������� ����������'�������������(��������)������*�����������*�(�+������"�
�������/#���0�+�#�������������������� �, �-��.����� ��+���������������������,������������������������������������������������������+������"�
�����1�,���#�����#�����,�#�����2������ #�������������������+���� ��������������+�������������'�������+������"�
����������� �����*����������3#����������0����%��� ����������+��������� �������-��������������� ������������������&���4��+������"�
�����5�������-����#������� ��������� � � , �-��.����� .�� ���� ��+������� � ��+���������� ������� ����� ��� ���� ���� � ��� ����,� �� ���������+����������������������&���4��+������"�
��������������� �##���� ������/��+���� ������ ���������� ��� #�+�������*�������,�������������#��������&���4��+������"�
�������������-����#����������������� �, �-��.����� ����+����������������� � ���0�������������������+��� ��������������������������&����#�����"�
�����"������ � � , � -��.���� ���� ���6(��� �������� !����� ������&� ����� ��������/���������+���1�%������� ���� ��������������������������������� �����������������������&�2345/6552�&����#�����"�
�����$�,������������������������� �, �-��.����� ������ �������������������������������1��������������������������������'�&����#�����"�
�����)�����4�� � � ���#�� ���� 7�8#� � � ��� ,�#���� . � ���� ����� ������� � � ���������������������&���������"�
������� ����,�#+�����,�#���������� 7������ ����/��������+�� �������,� �� ������������� ��������� ������ ��� ���� ��������� � � �� ������� ��������+��������&���������"�
������� ����������#�������� �, �-��.������������9������:2�(%����� %���8��/����������������� ����������9�/������������ ��������������������� ����:#��;�������+��+���������������������������������&���������"�
�����1��������� �� ������#�� #���������������<����������=����������>��,�����������?����@���&���������"�
�����������9������:2�(%���� ����� � �������������#�� @��������� ���� ����������������������� ������ A�������������������&���������"�
����15�;#(���'��#��!�������<���=�������#�� %��#� �������7������#� �����,��������@������"������������#� ��������*�������'�&���������"�
����1��!���<���=�������#�����;#(���'��#��� %��� 7���� ���������� ���� A���������,�����"�������&�����������'�&���������"�
����1������(��>�,��?��@�A#@������!���<���=�������#�� "������������������� �����@������B������ ���@����������&���������"�
����1"������ ,����:��:������ ���� ,���#� <��6#:2���#��� ������� @�����������@�������������@��������������B��������#���+���&���������"�
����1$� ����� !�#B��� ������ ���� !��� ����#�� !��� �� ��� )���/��/����� ���
���������� ���'�����+���� �����������������������&���������"�
����1)�������B��+��!�(%������������ , �-��.����� ������/��������+���������� ���������������������,�����������������8��������9����������������'�&���������"�
����1�������!�#B�������������!�������#�� #����.���7�����������$��+��%���)��/����C�������*�����'�&���������"�
����1�� ����,�#+�����,�#������������������� �, �-��.����� !����� ����������� �������,� �� ������������� ������ � � ���� ������ ������ ������������������������������&��������"�
����11����� -��#�� -����#� ���� ����� � � , � -��.����� $�� ������ ������� ������� ������������������ ��������9��"#$��������+�����'����������"�
����1������� !�#B��� ������ ���� !��� ����#�� �� ���� ����/������ ������� ����������� ���������,� ���� �������� ������� ���+��� ���� ����������������������;���������4������"�
�����5� ��8(���-��.����7�4�#�����7C(���7�+��!�����#������������� ��"���������$���������,� ��� ��������� � � ���� #����������� � � #��������� ��� ��������������������@����������4������"�
������� ����,�#+��,�#����������@������������,�B�������DE������������'���4������"�
������������ � , � -��.���� ���� ������ ,�#����C���� ���� � � ��� ����� ����������+������������������������������B��+�������'����(%����"�
�����"������ ,����:��:������ ���� ,���#� <��6#:2���#��� ��������� @�����������@�������������@��������������B��������#���+������(%����"�
�����$�7�8#�*��'�+������#�������#6����>&���@��������&���������#��������������������%������$������������������"�
�����)�,���#� � � ����#� ���� ��(��� �����#�� ������� ���� ����9� � ��������������,���������+�������������������������'������������"�
�������,���#� � � ����#� ���� ��(��� �����#�� ��� ������� ���� ��+������ ��� ;���'������������"�
�������;#(���'��#������ �����2 ���#(��(���#��7������������������� �� ��������+������������������������������������"�
�����1�������� �����������������-��#��-����#��D�����+�<�#���������������+�����7���������� ���������������� ����/� �,�����������������/� �������������"�
������������� , �-��.�����F����������G23HI/655IJ����"@��C����������,����������� ����� �� ������+�� ������������ ��� ������DE�� ��������� ��������������������������"�
���155���+����,�E�����#� ����������������� �������+���/������������������ ����������������+��������� �������������������"�
���15��
��+����,�E�����#� ��������� ����,�#+��,�#����������!������������������� ���� � � ����+���� ������'� �� ����������� ������ �������� ������+�������� � � ������������ ����������� ������� �����-�������� ����������"�
Editor: Sandra Silva ([email protected]) Download available at: http://www.fep.up.pt/investigacao/workingpapers/workingpapers.htm also in http://ideas.repec.org/PaperSeries.html

�������
������
�������
������
�������
������
�������
������
�������
������
�������
������
�������
������
�������
������
��� ��� ���� �������������� �� ��������������
*��� ������������ ����& ��'���������������*��� ������������ ����& ��'���������������*��� ������������ ����& ��'���������������*��� ������������ ����& ��'���������������
���������������������������