Rating Company Buy Vivint Solar - QualEnergia.it 10.26.14.pdf · Vivint Solar Date 26 October 2014...
44
Deutsche Bank Markets Research Rating Buy North America United States Industrials Clean Technology Company Vivint Solar Date 26 October 2014 Initiation of Coverage Initiating Coverage with a BUY Reuters Bloomberg Exchange Ticker VSLR.N VSLR US NYS VSLR Forecasts And Ratios Year End Dec 31 2013A 2014E 2015E 2016E FY EPS (USD) 0.07 0.15 -0.40 -1.32 Revenue (USDm) 6.2 25.1 66.4 139.2 Source: Deutsche Bank estimates, company data Initiating Coverage with BUY rating, $20 PT ________________________________________________________________________________________________________________ Deutsche Bank Securities Inc. Deutsche Bank does and seeks to do business with companies covered in its research reports. Thus, investors should be aware that the firm may have a conflict of interest that could affect the objectivity of this report. Investors should consider this report as only a single factor in making their investment decision. DISCLOSURES AND ANALYST CERTIFICATIONS ARE LOCATED IN APPENDIX 1. MCI (P) 148/04/2014. Price at 23 Oct 2014 13.07 Price target 20.00 52-week range 16.01 - 10.47 Vishal Shah Research Analyst (+1) 212 250-0028 [email protected] Jerimiah Booream-Phelps Research Associate (+1) 212 250-3037 [email protected] Price/price relative 9 11 12 14 15 17 10/14 Vivint Solar S&P 500 INDEX (Rebased) Performance (%) 1m 3m 12m Absolute – – – S&P 500 INDEX -1.6 -1.8 11.7 Source: Deutsche Bank VSLR is one of the top residential solar installers in the country and is poised to benefit from accelerating growth of retail customers switching to solar as an increasing number of states reach grid parity across the US. We expect the company’s differentiated sales model and flexible supply chain will enable 100% YoY growth of installations through 2016. Vivint’s door-to-door sales model should enable lower customer acquisition costs and we expect the introduction of additional innovative financing structures to act as catalysts to help lower the cost of capital and drive additional growth. Asset Light, Differentiated Sales Model Vivint differentiates itself from peers through differentiated sales model, 10- 20% lower customer acquisition costs, and asset-light sourcing strategy. The company is well positioned to continue gaining share as industry consolidation continues into 2017+, and remains technology agnostic with no manufacturing base existing or planned. Door to door sales techniques help the company efficiently utilize resources to install efficiently, generate leads, and achieve high penetration rates in targeted neighborhoods. Robust Expansion Opportunities VSLR currently operates in only 7 states vs SCTY’s ~15 currently, and has not yet participated in the asset backed security market, yieldco, or retail loan markets for additional financing mechanisms. We believe the company will likely announce additional strategic financing initiatives and channel partners over the next several quarters which should act as positive catalysts for shares. Additionally, further expansion into extra states should drive TAM expansion, MW deployment, and potential retained value expansion. Furthermore, the company is exploring options in the commercial business and we do not believe VSLR will experience demand constraints for the foreseeable future. Valuation/Risks We use a sum of the parts valuation with an 18% discount rate to value current and future leasing business cash flows and arrive at our $20 PT. We apply a higher discount than SCTY due to smaller platform and younger business. Risks include: 1) Adverse regulatory shifts on the state or federal level which could impact net metering, or other solar incentives 2) Changes in input prices 3) Headline risk from increased scrutiny of large utilities and lawmakers; 4) Inability to acquire project financing at attractive rates. 5) Competitive dynamics from new entrants or large incumbents 6) Widespread Customer defaults or bookings cancellations
Transcript of Rating Company Buy Vivint Solar - QualEnergia.it 10.26.14.pdf · Vivint Solar Date 26 October 2014...

Deutsche Bank Markets Research
Rating
Buy North America
United States
Industrials
Clean Technology
Company
Vivint Solar
Date
26 October 2014
Initiation of Coverage
Initiating Coverage with a BUY
Reuters Bloomberg Exchange Ticker VSLR.N VSLR US NYS VSLR
Forecasts And Ratios
Year End Dec 31 2013A 2014E 2015E 2016E
FY EPS (USD) 0.07 0.15 -0.40 -1.32
Revenue (USDm) 6.2 25.1 66.4 139.2
Source: Deutsche Bank estimates, company data
Initiating Coverage with BUY rating, $20 PT
________________________________________________________________________________________________________________
Deutsche Bank Securities Inc.
Deutsche Bank does and seeks to do business with companies covered in its research reports. Thus, investors should be aware that the firm may have a conflict of interest that could affect the objectivity of this report. Investors should consider this report as only a single factor in making their investment decision. DISCLOSURES AND ANALYST CERTIFICATIONS ARE LOCATED IN APPENDIX 1. MCI (P) 148/04/2014.
Price at 23 Oct 2014 13.07
Price target 20.00
52-week range 16.01 - 10.47
Vishal Shah
Research Analyst
(+1) 212 250-0028
Jerimiah Booream-Phelps
Research Associate
(+1) 212 250-3037
Price/price relative
9
11
12
14
15
17
10/14
Vivint Solar
S&P 500 INDEX (Rebased)
Performance (%) 1m 3m 12m
Absolute – – –
S&P 500 INDEX -1.6 -1.8 11.7
Source: Deutsche Bank
VSLR is one of the top residential solar installers in the country and is poised to benefit from accelerating growth of retail customers switching to solar as an increasing number of states reach grid parity across the US. We expect the company’s differentiated sales model and flexible supply chain will enable 100% YoY growth of installations through 2016. Vivint’s door-to-door sales model should enable lower customer acquisition costs and we expect the introduction of additional innovative financing structures to act as catalysts to help lower the cost of capital and drive additional growth.
Asset Light, Differentiated Sales Model Vivint differentiates itself from peers through differentiated sales model, 10-20% lower customer acquisition costs, and asset-light sourcing strategy. The company is well positioned to continue gaining share as industry consolidation continues into 2017+, and remains technology agnostic with no manufacturing base existing or planned. Door to door sales techniques help the company efficiently utilize resources to install efficiently, generate leads, and achieve high penetration rates in targeted neighborhoods.
Robust Expansion Opportunities VSLR currently operates in only 7 states vs SCTY’s ~15 currently, and has not yet participated in the asset backed security market, yieldco, or retail loan markets for additional financing mechanisms. We believe the company will likely announce additional strategic financing initiatives and channel partners over the next several quarters which should act as positive catalysts for shares. Additionally, further expansion into extra states should drive TAM expansion, MW deployment, and potential retained value expansion. Furthermore, the company is exploring options in the commercial business and we do not believe VSLR will experience demand constraints for the foreseeable future.
Valuation/Risks We use a sum of the parts valuation with an 18% discount rate to value current and future leasing business cash flows and arrive at our $20 PT. We apply a higher discount than SCTY due to smaller platform and younger business. Risks include: 1) Adverse regulatory shifts on the state or federal level which could impact net metering, or other solar incentives 2) Changes in input prices 3) Headline risk from increased scrutiny of large utilities and lawmakers; 4) Inability to acquire project financing at attractive rates. 5) Competitive dynamics from new entrants or large incumbents 6) Widespread Customer defaults or bookings cancellations

26 October 2014
Clean Technology
Vivint Solar
Page 2 Deutsche Bank Securities Inc.
Vivint Solar
Initiating Coverage
We are initiating coverage on VSLR with a BUY rating, $20 target price target.
We believe risk-reward is attractive and shares are not fully discounting the
long term contracted cash flow potential of the company. Vivint solar is the
second largest installer in the highest-margin residential segment, with a
primary focus on power purchase agreements and leases. We believe more
than 10 US states are currently at grid parity and nearly all 50 states would be
at grid parity by 2016 timeframe. We expect VSLR's installations for solar
customers to double in 2014 and believe growth could accelerate in the
2015/16 timeframe and will likely at least double each year. VSLR
differentiates itself from competition by maintaining supplier flexibility,
although strategically important acquisitions will be key to lowering cost of
installs and driving base of installations higher. Declining system costs,
customer acquisition costs, financing costs and rising volumes should drive
significant scale benefits and operating leverage in the model. While
competitive pressures, risks associated with assessment of the ITC, rising
interest rates and potential utility surcharge could likely impact underlying
business model economics, some of these concerns are largely discounted in
valuation, in our view. Vivint Solar’s unique business model, low customer
acquisition costs, and relationship with Vivint, Inc should allow the company to
continue gaining share in the residential market. Moreover, the company has
considerable potential to improve financing structures and expand into asset
backed securities, solar leases, yieldco, and retail bonds.
We apply sum of parts discounted cash flow valuation framework to arrive at
our base case $20 price target. For existing installed base of solar systems and
new installations, we calculate the NPV of cashflows over 30 years in order to
calculate leasing business value. Our assumptions include: an installed base of
~1.1 GW by 2016, current blended average PPA of ~14-15c/kwh decreasing to
13.8c/kWh by 2020 with 2.5% annual contract escalator. We use a 1%
terminal growth rate after 2020 and assume an 18% discount rate. See our
valuation section for a more in depth look at other assumptions in our
valuation model.
Downside Risks:
1) State level regulatory decisions and any adverse changes to net metering or
electricity prices; 2) Changes in input prices (panels/labor/racking); 3) Headline
risk from increased scrutiny of large utilities and lawmakers; 4) Inability to
acquire project financing at attractive rates. 5) Competitive dynamics from new
entrants or large incumbents

26 October 2014
Clean Technology
Vivint Solar
Deutsche Bank Securities Inc. Page 3
Investment Positives
Largest Pure Play on Residential Leasing/PPA’s
Unlike some of its peers, Vivint does not offer to serve as an installer only and
it focuses all efforts on the residential segment (no commercial or utility.
Residential is typically the highest margin segment, and a focus on PPA’s
enables the company to capture the greatest margin over the life of the
contract.
Relationship with Vivint, Inc.
Vivint Solar was originally a subsidiary of Vivint, Inc. which is a home security
company with over 825K customers. Using relatively conservative assumptions
(25% eligible, 50% high FICO, 25-75% penetration of remaining customers) the
company could have access to ~500+MW of installations at a relatively low
customer acquisition cost. As financing innovations evolve and eligibility
approves, we expect potential customer acquisitions from Vivint could prove to
be notable higher than initial estimates.
Differentiated Sales Model
Vivint Solar built on the successful model of Vivint, Inc. and often uses door-to-
door sales techniques to canvas entire neighborhoods, lowering customer
acquisition costs and helping to facilitate high solar penetration rates in Vivint-
neighborhoods. While SolarCity and others have traditionally focused on cold
calling, business-partners, and online platforms, Vivint has demonstrated that
door to door sales can be a strong driver of sales with direct benefits to
customer acquisition, installation, and salesforce efficiency.
Figure 1: Competitive Landscape
Vertically
Integrated with
Channel Partners
Downstream
Integrated
Downstream
Channel
Partnership
Marketplace Installer
Manufacturing ✓ Supply Chain Supply Chain Supply Chain Supply Chain
Sales Channel Partners ✓Direct & Channel
PartnersChannel Partners ✓
Installation Channel Partners ✓ Channel Partners Channel Partners ✓
Long-term
System
Ownership
✓ ✓ ✓ Fund Investors Owner/Investor
Financing ✓ ✓ ✓ Channel Partners Channel Partners
Billing,
Monitoring &
Maintaining
✓ ✓ ✓ Channel Partners
Examples Sunpower Vivint & Solarcity SunrunClean Power
FinanceVeregno, REC
Source: Company Reports

26 October 2014
Clean Technology
Vivint Solar
Page 4 Deutsche Bank Securities Inc.
Asset-Light
While foregoing upstream investment in panel manufacturing could provide
some long-term uncertainty for panel supply, we believe Vivint’s current
flexible, relatively capital-light business model is preferable in an emerging-
industry context.
Beneficiary of ongoing industry consolidation
The US solar installer market is still highly fragmented, and we expect this to
shift dramatically over the next 3-5 years as the companies with the necessary
scale to facilitate tax equity funds, asset backed securities, and economies of
scale in a post-ITC environment.
Figure 2: VSLR Market Share Trends Figure 3: The US Solar Market is highly fragmented
0.5%
2.2%
4.1% 4.3%
6.3%
8.5%8.8%
0.0%
1.0%
2.0%
3.0%
4.0%
5.0%
6.0%
7.0%
8.0%
9.0%
10.0%
Q1 Q2 Q3 Q4 Q1 Q2 Q3
2012 2013
Mark
et S
hare
23.1%
7.4%
5.9%
3.0%
2.0%
1.9%1.7%1.6%1.2%1.2%
51.7%
SolarCity
Vivint Solar
Verengo
REC Solar
SunPower
Sungevity
PeterseDean
Real Goods Solar
Astrum Solar
Roof Diagnostics
Source: GTM Research
Source: GTM Research Note: 1H ’13 data
Recent Residential Electricity Price Trend Supports 2.9% PPA Escalator…
Vivint PPA agreements include a ~2.9% escalator, which is not unreasonable
considering starting PPA prices are often 15-30% below the utility price and
the 10 year trailing CAGR for the average residential electricity price in the US
has been ~3.1%. We have seen price increases slow over the last several years
as marginal fuel costs (generally natural gas) have moderated, but believe the
longer term trend should continue on an upward trajectory. Furthermore, Vivint
tends to operate in high priced, high growth (for electricity price)
environments.

26 October 2014
Clean Technology
Vivint Solar
Deutsche Bank Securities Inc. Page 5
Figure 4: Average Retail Price of Electricity, 2012-2013 (cents/kwh)
cents/kWh cents/kWh
Census Divisionand State 2013 2012 YoY Census Divisionand State 2013 2012 YoY
New England 16.23 15.74 3.1% East South Central 10.42 10.25 1.6%
Connecticut 17.61 17.38 1.3% Alabama 11.28 11.29 -0.1%
Maine 14.41 14.72 -2.1% Kentucky 9.71 9.34 3.9%
Massachusetts 15.74 14.91 5.5% Mississippi 10.75 10.23 5.0%
New Hampshire 16.37 16.12 1.5% Tennessee 10.07 10.06 0.1%
Rhode Island 15.58 14.40 8.2% West South Central 10.68 10.35 3.1%
Vermont 17.52 17.29 1.3% Arkansas 9.49 9.27 2.4%
Middle Atlantic 15.65 15.31 2.2% Louisiana 9.27 8.39 10.5%
New Jersey 15.64 15.77 -0.8% Oklahoma 9.66 9.48 1.9%
New York 18.67 17.62 6.0% Texas 11.32 11.08 2.2%
Pennsylvania 12.82 12.83 -0.1% Mountain 11.22 10.83 3.6%
East North Central 12.03 12.04 -0.1% Arizona 11.56 11.10 4.2%
Illinois 10.39 11.48 -9.5% Colorado 11.81 11.33 4.2%
Indiana 10.84 10.46 3.7% Idaho 9.27 8.49 9.2%
Michigan 14.56 14.10 3.3% Montana 10.43 10.15 2.8%
Ohio 11.91 11.67 2.0% Nevada 11.96 11.94 0.2%
Wisconsin 13.72 13.30 3.2% New Mexico 11.59 11.31 2.5%
West North Central 10.92 10.51 3.9% Utah 10.32 9.86 4.7%
Iowa 11.14 10.85 2.7% Wyoming 10.24 9.93 3.2%
Kansas 11.50 11.09 3.7% Pacific Contiguous 13.50 13.07 3.3%
Minnesota 11.91 11.37 4.7% California 16.15 15.48 4.3%
Missouri 10.47 9.97 5.0% Oregon 9.95 9.88 0.7%
Nebraska 10.31 9.98 3.3% Washington 8.70 8.56 1.5%
North Dakota 9.35 9.22 1.4% Pacific Noncontiguous 28.52 28.84 -1.1%
South Dakota 10.34 10.04 3.0% Alaska 18.09 17.90 1.1%
South Atlantic 11.34 11.36 -0.1% Hawaii 36.94 37.29 -1.0%
Delaware 13.13 13.64 -3.8% U.S. Total 12.08 11.88 1.7%District of Columbia 12.51 12.28 1.8%
Florida 11.39 11.55 -1.4%
Georgia 11.14 10.89 2.3% = Vivint StateMaryland 13.18 12.87 2.4%
North Carolina 10.91 10.85 0.5%
South Carolina 11.81 11.62 1.6%
Virginia 10.95 11.14 -1.8%
West Virginia 9.60 9.89 -2.9%
Source: EIA
Figure 5: Long Term Residential Electricity Prices in the US
-15%
-10%
-5%
0%
5%
10%
15%
6
7
8
9
10
11
12
13
1990 1991 1992 1993 1994 1995 1996 1997 1998 1999 2000 2001 2002 2003 2004 2005 2006 2007 2008 2010 2011 2012 2013
Y/Y
Ch
ange
Ce
nts
/kW
h
Residentail Price Commercial Price YoY (Residential) YoY (Commercial) 1990-2013 CAGR
Long Term CAGR of Residential Electricity Prices is ~1.9%... ...but trailing 10-year CAGR is ~3.1%
Source: EIA, Deutsche Bank

26 October 2014
Clean Technology
Vivint Solar
Page 6 Deutsche Bank Securities Inc.
Rapid Expansion and Options
Vivint currently operates in less than half the number of states that its main
competitor, SolarCity, does but has stated plans to increase breadth both in
number of states and within current markets. In the LTM as of the end of 2Q,
the company added 21 new sales offices (on top of 16 existing as of June 30,
2013) and plans to open 20 new offices during 2014. Additionally, the
company is considering expansion into the commercial segment.
Valuation is Compelling
At current market cap of ~$1.4B, VSLR is less than 30% the size of Solarcity,
despite a growth trajectory which we believe could grow at a faster rate over
the next several years. Furthermore, company-reported retained value per
watt is notably higher than SCTY and Vivint has multiple catalysts in the near
future (financing options, potential acquisitions, new state expansion) and
stands to add significant capacity over the next several years. Implied market
cap of ~$2.4B at our $20 price target is less than 27% of SCTY’s implied
market cap of ~$9B on our $90 price target, despite possibility to achieve 1/3
or more MW deployed in 2015 timeframe at a higher retained value and lower
current opex per watt.
Figure 6: VSLR Vs SCTY
VSLR SCTY
Retained Value ($/W) 2.39* 1.72*
Nominal Contract Payments Remaining ($M) 648 3300
Ests / Guidance
2014 MW Deployed 150** 500-550% Y/Y 159% 88%
2015 MW Deployed 300** 900-1000% Y/Y 100% 81%
Metrics
Opex/W 0.64* 0.91*
Installation Cost/W NA 2.29*
* 2Q14, ** DB estimates Source: Deutsche Bank, Company Reports
Concerns
Net Metering is Necessary Before Batteries Are Economic
Net energy metering, which allows a producer of solar power to sell unused
power back to the grid, is key to the economics of solar until battery
technology improves. Currently, 43 states and D.C. have implemented net
metering policies although some are more favorable than others. However,
several states - including Arizona, California, New Mexico, Idaho, Louisiana,
Wisconsin – have discussed revisions to their net metering policies. Potential
policy shifts such as lower compensation (for electricity sold to the grid) or
fixed monthly charges would make solar less competitive if implemented.
However, if low cost battery systems are developed and successfully

26 October 2014
Clean Technology
Vivint Solar
Deutsche Bank Securities Inc. Page 7
implemented we view this to be less concerning. Longer term, Vivint would
need to demonstrate high quality supply relationships with battery makers to
offset concerns here, particularly because SCTY has a business relationship
with Tesla.
2016 ITC Step Down Could Impact Current Financing Model
VSLR’s current business model utilizes significant amounts of tax equity
financing which require extensive use of the federal ITCs and other State/Local
incentives. We believe the ITC step-down from 30% to 10% after 2016 could
pose a risk to the company’s current strategy. While SCTY has laid
groundwork for other financing models, VSLR has yet to execute on ABS
transactions or other financial innovations (crowdfunding, solar loan, yieldco,
etc). Furthermore, the company will have to implement aggressive cost
cutting/efficiency measures to maintain attractive system economics beyond
2016, which will require a notable scale increase, capital investment, and
strategy shift for capital priorities. That said, we do believe that even in a post
ITC environment, solar will be competitive in 40+ states within the US due to
lower system and financing costs.
Utility Rate Cases Across the Country Could Likely Affect Overall Economics
Given the structure of rate cases in the United States in regulated electricity
markets, VSLR could find itself at a disadvantage in the future for legacy PPA
contracts with an escalator. In the event that the PPA rose faster than the
utility rate over the medium to longer term, the company risks pricing itself out
of the market for customers who choose to make the comparison. This is
largely a theoretical risk and unlikely to happen for a decade or more given that
the company generally prices initial contracts 15-30% below the utility rate.
Utility rates have trended up over time but in the event that rates dropped in a
given area while VSLRs escalators kicked in, this situation could take place.
We view this as relatively unlikely on a large scale but the possibility exists. In
that event, the company would likely renegotiate the contract.
Figure 7: Sample PPA/Rate progression over 20 year contract
0.1
0.12
0.14
0.16
0.18
0.2
0.22
0.24
0.26
0.28
1 2 3 4 5 6 7 8 9 10 11 12 13 14 15 16 17 18 19 20
$/K
wh
Year of Contract
Utility Rate (2.1% Escalator) PPA Rate (2.9% escalator)
Even assuming residential electricity rates increaseslower than recent historical levels...
...the PPA price does not overtake theutility rate
Source: Deutsche Bank Note: Assumes 20% starting discount to 18 cent starting utility pricet

26 October 2014
Clean Technology
Vivint Solar
Page 8 Deutsche Bank Securities Inc.
Model Highly Sensitive to Interest Rates, PPA Prices, Treatment of DG by
Utilities and ITC Monetization:
While our base case valuation approach takes a conservative view towards all
of the above factors, we expect headline risk and continued volatility from
these 4 factors. We do not expect electricity prices to decrease in the near
term, but even flattish prices in the near term could impact the longer term
perception of electricity pricing and make it difficult for SCTY to negotiate
customer contracts with high escalators. Moreover, interest rate headline risk
exists as the tapering discussion takes place in early 2014. We do not expect a
significant impact on financing costs in a moderate rise in interest rates as we
expect financing structures such as ABS and yieldcos to help drive overall
financing costs down.
ITC Calculation Rules Could Likely Impact Investor Sentiment and Drive Near
Term Share Price Volatility
VSLR likely benefits from a favorable fair market value treatment of system
costs which is currently allowed under the ITC law but has been examined by
the US treasury. We believe the company currently benefits from ~$5/W total
system price to calculate ITC of 30% whereas we believe overall system costs
have the potential to decline to $2-3/W or lower over the next few years. The
company realizes ~$1.40/W positive impact on retained earnings by using a
higher fair market value, according to our calculations. That said, our base
case price target calculation takes this risk into consideration and assumes a
reasonable fair market value of $5/W in 2014E reducing to $4/W in 2016E.

26 October 2014
Clean Technology
Vivint Solar
Deutsche Bank Securities Inc. Page 9
Company Overview
Business Overview
Vivint Solar installs residential solar panels and offers solar energy to
residential customers in 7 US states, currently: Arizona, California, Hawaii,
Maryland, Massachusetts, New Jersey and New York. Customers typically
enter into 20-year contracts with the company (at prices below their current
utility rates) and pay little or no upfront fees. Prior to 1Q14, all of the
company’s long-term contracts were structured as PPAs. In 1Q14, VSLR
started offering leases as well, because the legal framework in Arizona
required it and the company was entering the Arizona market at the time.
PPA: Customers are charged a fee per unit of electricity use (kWh)
based on the amount the solar system produces.
Leases: In the lease structure, customers are charged fixed monthly
payment based (assuming certain generation parameters). The
company typically guarantees a certain level of production.
Both types of contract are structured for 20 years with an escalator (most of
the current contracts contain price escalators of 2.9-3.9% annually). The
company also sees further potential cross sell opportunities from the 20 year
relationship.
Figure 8: Vivint’s Business Model
Professional ConsultationDirect-to-home sales force to provide in-person
professional consultations to prospective customers
Design and EngineeringDesigns a custom solar energy system
InstallationControls every aspect of the installation process
Monitoring and Service Monitors performance of all solar energy
systems
ReferralsReferrals lower customer acquisition costs
Source: Deutsche Bank, Company Data

26 October 2014
Clean Technology
Vivint Solar
Page 10 Deutsche Bank Securities Inc.
As of June 2014, Vivint had ~130MW under contract at ~21,900+ homes.
Market share has shown a steady uptick over the last several years.
Figure 9: Cumulative MW Deployed Figure 10: US Residential Market Share
15
73
93
130
0
20
40
60
80
100
120
140
2012 2013 1Q14 2Q14
1%
8%9%
15%
0%
2%
4%
6%
8%
10%
12%
14%
16%
2012 2013 1Q14 2Q14
Source: Company Data
Source: Company Data, GTM Research
Tax Equity
Vivint finances solar system installations by monetizing investment tax credits
(ITCs), accelerated MACRS depreciation and other incentives through tax
equity partnerships. Tax equity investors provide cash upfront in exchange for
a share of the tax attributes and cash flows from a portfolio of systems. As of
Sep 17, 2014, Vivint had 10 funds with committed investments of ~$543M,
which will enable the company to install solar energy systems with a market
value of ~$1.3B ($913M of this has already been installed). Net tax equity is
expected to provide ~81MWs of capacity. Furthermore, the company has an
additional ~$300M or ~133MW of commitments for future funds.
Typically, the funds own the portfolio of solar arrays and pay out cash flows to
investors. Since the tax equity partners are able to achieve a large portion of
their required IRR from tax benefits, Vivint retains the majority of the cash
flows over the lifetime of the system.
The company has different types of funds with fund investors, including
partnership flip funds and inverted lease structures.
Partnerships: Under partnership structures, Vivint and fund investors
contribute cash into a partnership company. The partnership uses this
cash to acquire solar energy systems from VSLR and collects
payments from customers. The investor is typically paid first until
their required return is satisfied, at which point the ownership flips to
Vivint (and the associated cash flows). Six of the ten established funds
are partnerships.
26 October 2014
Clean Technology
Vivint Solar
Deutsche Bank Securities Inc. Page 11
Figure 11: Partnership Structure
Partnership Company
Vivint Fund Investors
1
2
Customers
3
1. Vivint and fund investors contributecash into a partnership company
2. Partnership acquires solar energysystems developed by Vivint
3. Partnership sells energy/ leases solarenergy systems to customers; andreceives recurring long-termpayments
4. Prior to the fund investor receiving itscontractual rate of return, the fundinvestor receives substantially all ofthe long-term recurring customerpayments and other incentives. Afterthat, Vivint receives substantially allof the long-term recurring customerpayments and the other incentives
4
Source: Deutsche Bank, Company Data
Inverted Lease/Lease Pass-through: There are several partnerships
within the structure, and this essentially allows VSLR to use half of the
depreciation and potentially benefit from a higher fair market value (to
use in the assessment of the investment tax credit)
Figure 12: Inverted Lease Structure
Tenant(illustrative ownership –99% Fund Investors, 1%
Vivint)
Owner(illustrative ownership –51% Vivint, 49% Tenant)
VivintFund Investors
Customers
1. Vivint contributes solar energy systems to an owner partnership
2. In return, Vivint gets a share in the owner partnership
3. Fund investors contribute cash to a tenant partnership
4. In return, fund investors get an interest in the tenant partnership
5. Tenant partnership makes an investment in the owner partnership
6. In return, tenant partnership gets an interest in the owner partnership
7. Owner partnership leases solar energy systems to the tenant partnership (under a master lease), and the tenant partnership pays the owner partnership rent for those systems
8. Tenant partnership sells energy/ leases solar energy systems to customers; and receives recurring long-term payments
3 4
5
6
1 2
78
Source: Deutsche Bank, Company Data

26 October 2014
Clean Technology
Vivint Solar
Page 12 Deutsche Bank Securities Inc.
Key Operating Metrics
Solar Energy Systems Installed: Vivint had ~22k systems as of June
2014 (~8.6k installed in 2Q alone). The company installed 10.5k and
~2.7k systems in 2013 and 2012 respectively.
MW Installed: Vivint has ~130MW under as of June 2014 (~57MW
installed in 1H). In the year 2013, the company installed 58MW of
systems, which was an increase of 303% over 2012 when the
company installed just ~14MW of systems.
Figure 13: Systems Installed Figure 14: MW Installed
2,669
10,521
8,625
-
2,000
4,000
6,000
8,000
10,000
12,000
2012 2013 1H '14
14
58 57
0
10
20
30
40
50
60
70
2012 2013 1H '14
Source: Company Data
Source: Company Data
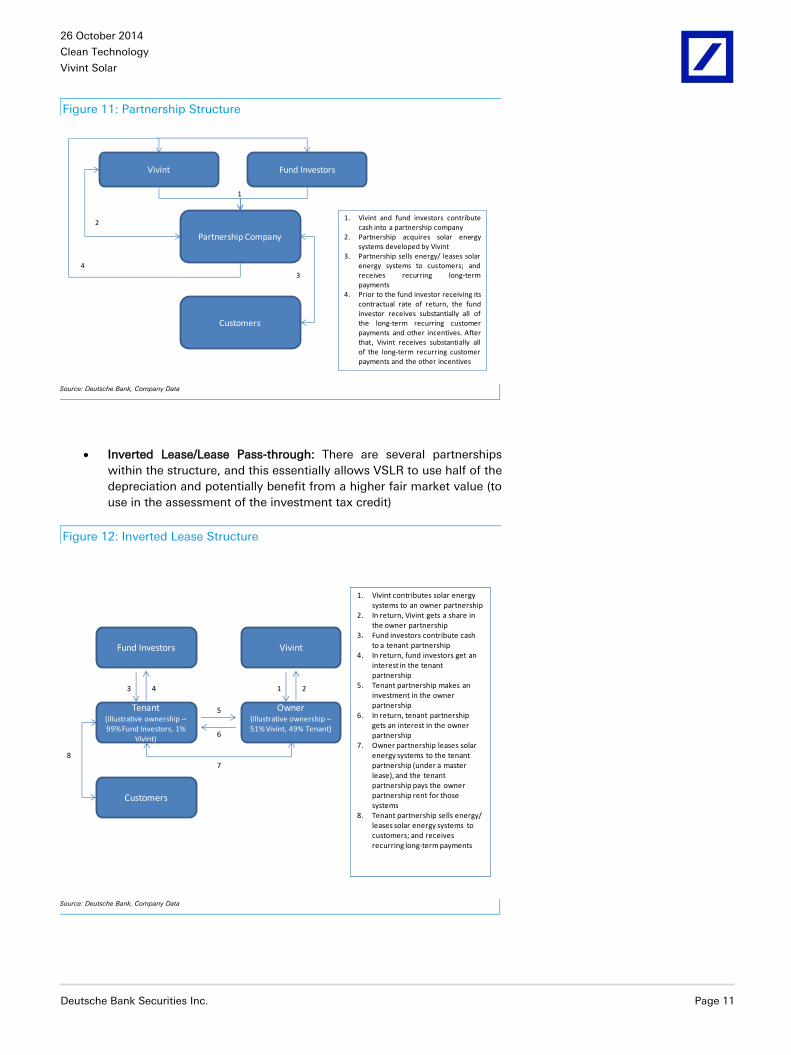
Estimated Nominal Contracted Payments Remaining: Estimated
nominal contracted payments remaining equals the sum of the
remaining cash payments that customers are expected to pay over the
term of their agreements. However, the metric does not reflect
potential customer defaults/ cancellations. The company calculates
this metric in the following ways for a PPA and a lease – 1) PPA: For a
PPA, contract price/kWh is multiplied by the estimated annual energy
output of the associated solar energy system to determine the
estimated nominal contracted payments. 2) Lease: For a customer
lease, the company includes the monthly fees and upfront fee (if any),
as set forth in the lease. As of June 2014, estimated nominal
contracted payments remaining totaled ~$648M.
Estimated Retained Value: Estimated retained value represents the
cash flows, discounted at 6%, that the company expects to receive
from customers pursuant to long-term contracts net of estimated cash
distributions to fund investors and estimated opex for systems
installed. For calculating this metric, the company aggregates the
estimated retained value from the solar energy systems during the
typical 20-year term of the contracts, and the estimated retained value
associated with an assumed 10-year renewal term. As of June 2014,
estimated retained value was ~310M.
26 October 2014
Clean Technology
Vivint Solar
Deutsche Bank Securities Inc. Page 13
Figure 15: Estimated Nominal Contracted Payments
Remaining
Figure 16: Estimated Retained Value
89
223
394
648
0
100
200
300
400
500
600
700
2012 2Q13 2013 2Q14
$41.6
$190.4
$309.9
2.83
2.62
2.39
$0.0
$50.0
$100.0
$150.0
$200.0
$250.0
$300.0
$350.0
2.1
2.2
2.3
2.4
2.5
2.6
2.7
2.8
2.9
2012 2013 2Q14
Retained Value ($M) Retained Value per Watt
Source: Company Data
Source: Company Data
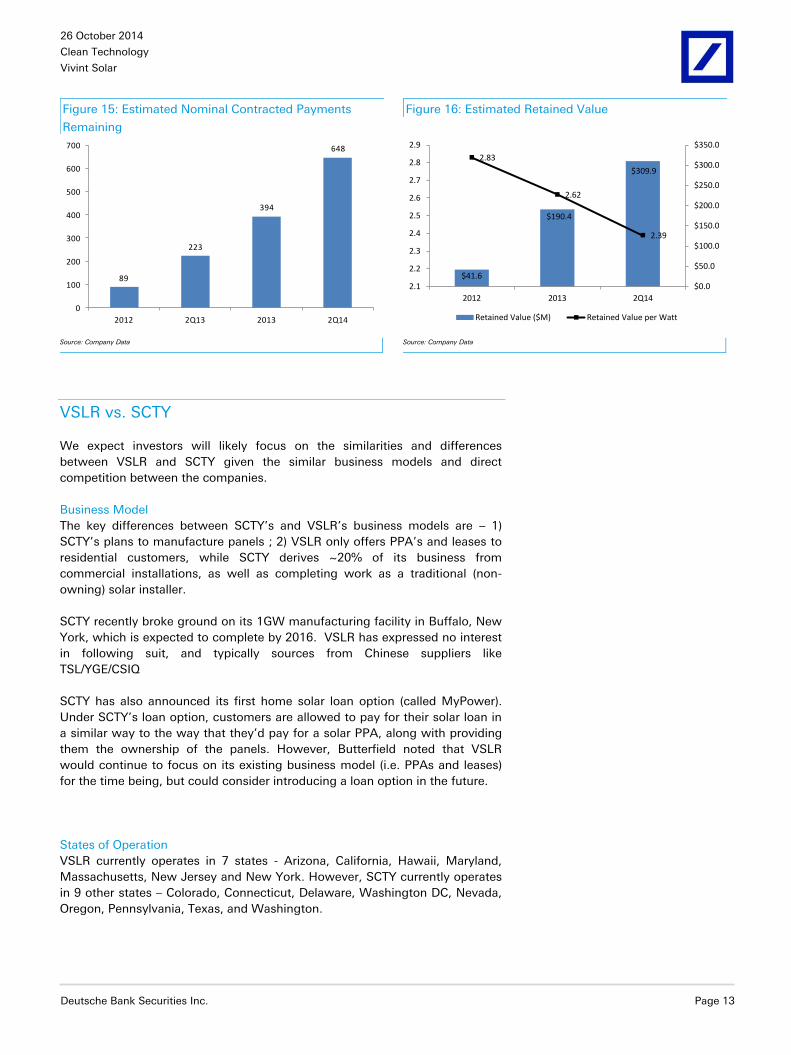
VSLR vs. SCTY
We expect investors will likely focus on the similarities and differences
between VSLR and SCTY given the similar business models and direct
competition between the companies.
Business Model
The key differences between SCTY’s and VSLR’s business models are – 1)
SCTY’s plans to manufacture panels ; 2) VSLR only offers PPA’s and leases to
residential customers, while SCTY derives ~20% of its business from
commercial installations, as well as completing work as a traditional (non-
owning) solar installer.
SCTY recently broke ground on its 1GW manufacturing facility in Buffalo, New
York, which is expected to complete by 2016. VSLR has expressed no interest
in following suit, and typically sources from Chinese suppliers like
TSL/YGE/CSIQ
SCTY has also announced its first home solar loan option (called MyPower).
Under SCTY’s loan option, customers are allowed to pay for their solar loan in
a similar way to the way that they’d pay for a solar PPA, along with providing
them the ownership of the panels. However, Butterfield noted that VSLR
would continue to focus on its existing business model (i.e. PPAs and leases)
for the time being, but could consider introducing a loan option in the future.
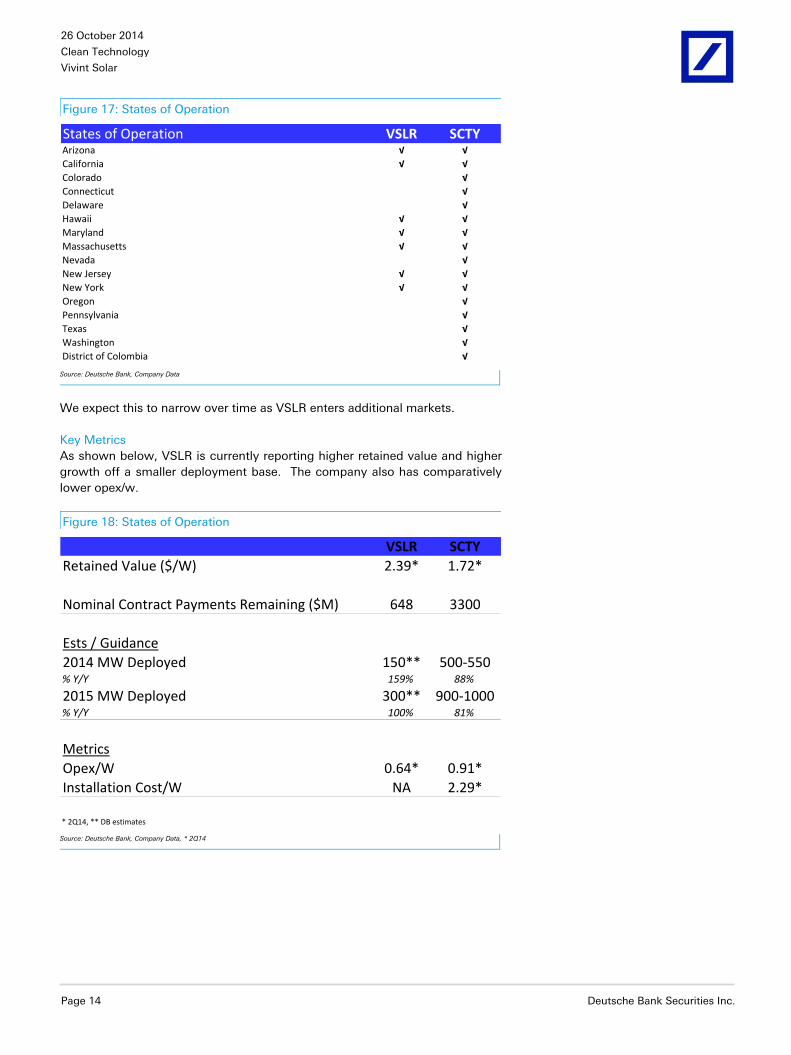
States of Operation
VSLR currently operates in 7 states - Arizona, California, Hawaii, Maryland,
Massachusetts, New Jersey and New York. However, SCTY currently operates
in 9 other states – Colorado, Connecticut, Delaware, Washington DC, Nevada,
Oregon, Pennsylvania, Texas, and Washington.
26 October 2014
Clean Technology
Vivint Solar
Page 14 Deutsche Bank Securities Inc.
Figure 17: States of Operation
States of Operation VSLR SCTYArizona √ √
California √ √
Colorado √
Connecticut √
Delaware √
Hawaii √ √
Maryland √ √
Massachusetts √ √
Nevada √
New Jersey √ √
New York √ √
Oregon √
Pennsylvania √
Texas √
Washington √
District of Colombia √ Source: Deutsche Bank, Company Data
We expect this to narrow over time as VSLR enters additional markets.
Key Metrics
As shown below, VSLR is currently reporting higher retained value and higher
growth off a smaller deployment base. The company also has comparatively
lower opex/w.
Figure 18: States of Operation
VSLR SCTY
Retained Value ($/W) 2.39* 1.72*
Nominal Contract Payments Remaining ($M) 648 3300
Ests / Guidance
2014 MW Deployed 150** 500-550% Y/Y 159% 88%
2015 MW Deployed 300** 900-1000% Y/Y 100% 81%
Metrics
Opex/W 0.64* 0.91*
Installation Cost/W NA 2.29*
* 2Q14, ** DB estimates Source: Deutsche Bank, Company Data, * 2Q14

26 October 2014
Clean Technology
Vivint Solar
Deutsche Bank Securities Inc. Page 15
Valuation
We apply a sum of the parts valuation framework to arrive at our $20 price
target.
Figure 19: Value Per Share Walk
$12
$0
$20
$40
$60
$80
$100
$120
$140
$160
Renewal Contracted Customer Payments
Depreciation ITC System Costs Financing Costs
Future Tax Effect
18% Discount Rate 2014+ Cashflows
Net Value Per Share Through
2020
Terminal ValueTotal Value Per Share
$/S
hare
~$20
Source: Deutsche Bank
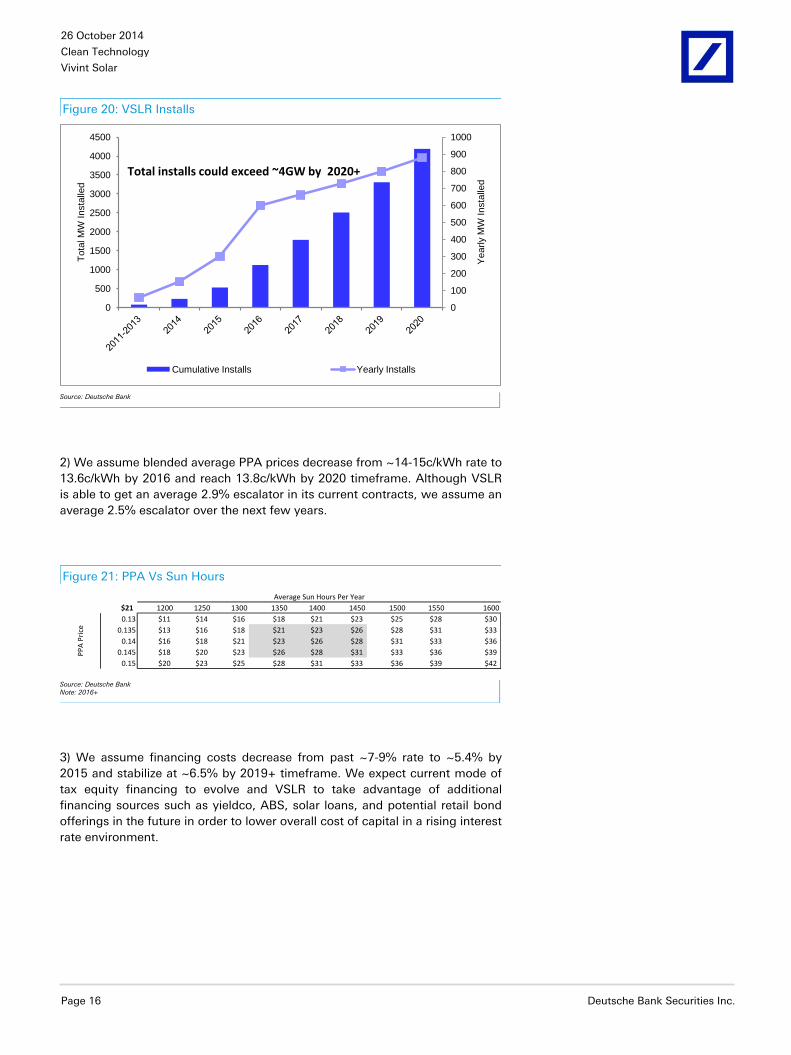
1) We assume 2Q ‘14 installed base of ~130MW grows to ~1.1GW by end of
2016 and ~4.1GW by end of 2020. We expect annual installations to increase
by 65% in 2015 (from current 2014 guide) to ~800MW and 55% in 2016 to
~1200MW. We then assume ~10% annual installations growth from 2017-
2020 timeframe and a 1% terminal growth rate after 2020. We also assume
that after 2021, the company starts paying 35% taxes.
26 October 2014
Clean Technology
Vivint Solar
Page 16 Deutsche Bank Securities Inc.
Figure 20: VSLR Installs
0
100
200
300
400
500
600
700
800
900
1000
0
500
1000
1500
2000
2500
3000
3500
4000
4500
Yearly M
W Insta
lled
Tota
l M
W Insta
lled
Cumulative Installs Yearly Installs
Total installs could exceed ~4GW by 2020+
Source: Deutsche Bank
2) We assume blended average PPA prices decrease from ~14-15c/kWh rate to
13.6c/kWh by 2016 and reach 13.8c/kWh by 2020 timeframe. Although VSLR
is able to get an average 2.9% escalator in its current contracts, we assume an
average 2.5% escalator over the next few years.
Figure 21: PPA Vs Sun Hours
$21 1200 1250 1300 1350 1400 1450 1500 1550 1600
0.13 $11 $14 $16 $18 $21 $23 $25 $28 $30
0.135 $13 $16 $18 $21 $23 $26 $28 $31 $33
0.14 $16 $18 $21 $23 $26 $28 $31 $33 $36
0.145 $18 $20 $23 $26 $28 $31 $33 $36 $39
0.15 $20 $23 $25 $28 $31 $33 $36 $39 $42
Average Sun Hours Per Year
PP
A P
rice
Source: Deutsche Bank Note: 2016+
3) We assume financing costs decrease from past ~7-9% rate to ~5.4% by
2015 and stabilize at ~6.5% by 2019+ timeframe. We expect current mode of
tax equity financing to evolve and VSLR to take advantage of additional
financing sources such as yieldco, ABS, solar loans, and potential retail bond
offerings in the future in order to lower overall cost of capital in a rising interest
rate environment.

26 October 2014
Clean Technology
Vivint Solar
Deutsche Bank Securities Inc. Page 17
Figure 22: Financing Costs
0%
1%
2%
3%
4%
5%
6%
7%
8%
9%
10%
$-
$500
$1,000
$1,500
$2,000
$2,500
Yearly M
W Insta
lled
Tota
l $ c
ost
Financing costs Financing rate
Source: Deutsche Bank
4) Our model incorporates a small monthly utility surcharge of
$~58/customer/year on ~20% of the new customer base (increasing to ~30%+
by 2020)- primarily based on the Arizona utility model where solar customers
are required to pay ~$0.7/Kw/month in order to access the grid. Our model
does not include any state incentives which typically tend to be an average of
2-4c/kWh. As such, even in a scenario where utility rates were to decline more
than expected, VSLR would be able to maintain cash inflows/W by using the
state level incentives.
5) We assume that the 30% ITC expires at the end of 2016 and solar project
investors are still able to take advantage of accelerated depreciation as well as
10% ITC from 2017 timeframe.
Figure 23: ITC Benefit
$-
$0.20
$0.40
$0.60
$0.80
$1.00
$1.20
$1.40
$1.60
ITC
Valu
e p
er
Watt
ITC Reduces to 10%
Source: Deutsche Bank

26 October 2014
Clean Technology
Vivint Solar
Page 18 Deutsche Bank Securities Inc.
6)We assume the fair market value the company is able to claim for the federal
ITC decreases from ~$5/W today to ~$4.50/W in 2015, ~$4/W in 2016, and
reduces at the same $ value as system costs through 2020, to ~$3.60/W.7) We
assume 120M shares outstanding to value the company.

26 October 2014
Clean Technology
Vivint Solar
Deutsche Bank Securities Inc. Page 19
Figure 24: Valuation
Year In Which Systems Are Installed
2011-2012 2013 2014 2015 2016
Present Value Per Watt at Time of Installation (Assumes 6% Discount Rate on Cash Flows)
Sources of Cash/Funding/Value
Renewal/W $0.61 $0.65 $0.63 $0.60 $0.57
Contracted Customer Payments/W $2.54 $2.71 $2.64 $2.51 $2.40
Depreciation/W $0.45 $0.46 $0.47 $0.44 $0.38
ITC/W $1.41 $1.44 $1.41 $1.27 $1.12
Uses of Cash/Funding
System Costs/Watt (Includes inverter replacement and O&M)($3.53) ($3.63) ($3.77) ($3.50) ($3.07)
Financing Costs/W ($0.32) ($0.26) ($0.24) ($0.19) ($0.17)
Total Cost/Watt ($3.85) ($3.89) ($4.01) ($3.69) ($3.24)
Average Residential System size (kW) 6,400 6,400 6,800 7,000 7,000
MW installed 15 58 150 300 600
% Change 159% 100% 100%
NPV of Sources of Cash/Funding/Value
Renewal $3,877 $4,136 $4,275 $4,190 $4,011
Contracted Customer Payments $16,256 $17,340 $17,923 $17,567 $16,819
Depreciation $2,902 $2,935 $3,211 $3,046 $2,676
ITC $9,000 $9,238 $9,565 $8,856 $7,865
Assumptions: Sources of Cash/Funding
PPA Price (Initial Contracted) $0.150 $0.150 $0.147 $0.141 $0.136
Escalator (Yearly PPA) 2.5% 2.5% 2.5% 2.5% 2.5%
Renewal (% of Price in Year 20) 85% 85% 85% 85% 85%
Implied Base Case Renewal PPA (assuming escalator above)$0.20 $0.20 $0.20 $0.19 $0.18
% ITC 30% 30% 30% 30% 30%
FMV for ITC Calc ($/W) $5.30 $5.10 $4.97 $4.47 $3.97
ITC/W $1.59 $1.53 $1.49 $1.34 $1.19
NPV of Uses of Cash/Funding
System costs ($22,589) ($23,215) ($25,635) ($24,524) ($21,486)
Financing costs ($2,033) ($1,683) ($1,602) ($1,312) ($1,214)
Total System Cost ($24,622) ($24,899) ($27,237) ($25,836) ($22,700)
Assumptions: Uses of Cash/Funding
Total System cost/Watt $3.45 $3.32 $3.44 $3.17 $2.71
Fixed Cost/Watt $0.90 $0.90 $1.00 $0.87 $0.62
Variable Cost/Watt (Ex Module) $1.65 $1.72 $1.70 $1.60 $1.40
Module Cost/Watt $0.90 $0.70 $0.74 $0.70 $0.69
Financing rate 9.0% 7.3% 6.3% 5.4% 5.7%
Utility Surcharge Applied (Assumes 70 cents per KWp) 0% 0% 20% 22% 24%
Retained Value
Vivint NPV Value Per System Installed $7,414 $8,749 $7,736 $7,822 $8,671
Vivint NPV/W $1.16 $1.37 $1.14 $1.12 $1.24
Valuation
Leasing business value ($M)
Nominal Value $17 $79 $171 $335 $743
Taxes $4 $20 $46 $94 $217
Nominal Value - Taxes $13 $59 $125 $241 $527
($/Share) $0.1 $0.5 $1.0 $2.0 $4.4
Discounted ($M) $125 $205 $378
($/Share) $0.11 $0.49 $1.04 $1.70 $3.15
2014+ Leasing Business Discount Rate 18%
Terminal Growth Rate 1.0%
Terminal Tax Rate 35%
Year to StartTaxes 2021
Tax Rate 35%
Pre 2013 Leasing business value ($M) $13
2013 Leasing Business Value ($M) $59
Future leasing business value ($M) $1,351
Terminal Value $960
Fully Diluted Shares (M) 120
Implied Share Value $19.85 Source: Deutsche Bank

26 October 2014
Clean Technology
Vivint Solar
Page 20 Deutsche Bank Securities Inc.
Figure 25: Valuation Model Continued
2016 2017 2018 2019 2020
Present Value Per Watt at Time of Installation (Assumes 6% Discount Rate on Cash Flows)
Sources of Cash/Funding/Value
Renewal/W $0.57 $0.57 $0.57 $0.57 $0.57
Contracted Customer Payments/W $2.40 $2.39 $2.39 $2.41 $2.39
Depreciation/W $0.38 $0.37 $0.36 $0.35 $0.34
ITC/W $1.12 $0.37 $0.36 $0.35 $0.34
Uses of Cash/Funding
System Costs/Watt (Includes inverter replacement and O&M)($3.07) ($2.98) ($2.88) ($2.79) ($2.70)
Financing Costs/W ($0.17) ($0.18) ($0.18) ($0.18) ($0.17)
Total Cost/Watt ($3.24) ($3.15) ($3.06) ($2.97) ($2.88)
1124 4187.910510
Average Residential System size (kW) 7,000 7,000 7,000 7,000 7,000
MW installed 600 660 726 799 879
% Change 100% 10% 10% 10% 10%
NPV of Sources of Cash/Funding/Value
Renewal $4,011 $3,996 $3,995 $4,024 $3,995
Contracted Customer Payments $16,819 $16,755 $16,750 $16,872 $16,750
Depreciation $2,676 $2,602 $2,527 $2,453 $2,373
ITC $7,865 $2,556 $2,490 $2,424 $2,358
Assumptions: Sources of Cash/Funding
PPA Price (Initial Contracted) $0.136 $0.137 $0.138 $0.139 $0.138
Escalator (Yearly PPA) 2.5% 2.5% 2.5% 2.5% 2.5%
Renewal (% of Price in Year 20) 85% 85% 85% 85% 85%
Implied Base Case Renewal PPA (assuming escalator above)$0.18 $0.19 $0.19 $0.19 $0.19
% ITC 30% 10% 10% 10% 10%
FMV for ITC Calc ($/W) $3.97 $3.87 $3.77 $3.67 $3.57
ITC/W $1.19 $0.39 $0.38 $0.37 $0.36
NPV of Uses of Cash/Funding
System costs ($21,486) ($20,832) ($20,178) ($19,545) ($18,911)
Financing costs ($1,214) ($1,239) ($1,261) ($1,261) ($1,220)
Total System Cost ($22,700) ($22,071) ($21,439) ($20,805) ($20,131)
Assumptions: Uses of Cash/Funding
Total System cost/Watt $2.71 $2.61 $2.51 $2.41 $2.31
Fixed Cost/Watt $0.62 $0.59 $0.55 $0.52 $0.49
Variable Cost/Watt (Ex Module) $1.40 $1.37 $1.33 $1.30 $1.27
Module Cost/Watt $0.69 $0.66 $0.62 $0.59 $0.56
Financing rate 5.7% 6.0% 6.3% 6.5% 6.5%
Utility Surcharge Applied (Assumes 70 cents per KWp) 24% 26% 28% 30% 32%
Retained Value
Vivint NPV Value Per System Installed $8,671 $3,837 $4,323 $4,967 $5,345
Vivint NPV/W $1.24 $0.55 $0.62 $0.71 $0.76
Valuation
Leasing business value ($M)
Nominal Value $743 $362 $448 $567 $671
Taxes $217 $110 $141 $185 $227
Nominal Value - Taxes $527 $252 $307 $382 $444
($/Share) $4.4 $2.1 $2.6 $3.2 $3.7
Discounted ($M) $378 $153 $158 $167 $164
($/Share) $3.15 $1.28 $1.32 $1.39 $1.37 Source: Deutsche Bank

26 October 2014
Clean Technology
Vivint Solar
Deutsche Bank Securities Inc. Page 21
Model
Figure 26: Drivers
Numbers in Millions 2013 2014E 2015E 2016E
FYE: Dec 31 Q1 Q2 Q3 Q4 Q1 Q2 Q3E Q4E Q1E Q2E Q3E Q4E Q1E Q2E Q3E Q4E
CY March June Sept Dec March June Sept Dec March June Sept Dec March June Sept Dec 2011 2012 2013 2014E 2015E 2016E
Revenues
PPA Revenue 7.0 4.8 7.9 15.2 17.6 12.1 17.7 33.5 37.0 25.1 52.9 113.2
SREC Revenue 1.0 0.7 1.4 2.7 3.2 2.2 3.3 6.3 7.0 4.8 0.3 9.6 21.3
Rebate Amoritization 0.0 0.0 0.0 0.0 0.0 0.0 0.0 0.0 0.0 0.0 0.1 0.1
Operating Leases/Incentive Rev 0.6 1.2 2.1 1.9 2.9 5.8 8.0 5.5 9.4 18.0 20.9 14.4 21.0 39.8 44.0 29.8 22.2 62.6 134.6
Solar energy systems sales 0.0 0.0 0.1 0.0 0.0
Solmetric Revenue 0.75 0.75 0.88 0.93 0.98 1.03 1.08 1.13 1.18 1.23 3.8 4.6
Solar Energy System and Product Sales 0.0 0.1 0.2 0.0 0.6 0.8 0.8 0.8 0.9 0.9 1.0 1.0 1.1 1.1 1.2 1.2 2.9 3.8 4.6
Total 0.6 1.3 2.3 2.0 3.5 6.6 8.8 6.3 10.3 18.9 21.8 15.4 22.1 40.9 45.1 31.1 25.1 66.4 139.2
Q/Q Revenues
PPA Revs -31% 66% 91% 16% -31% 46% 89% 10% -32%
Total 33% -29% 64% 84% 15% -29% 43% 85% 10% -31%
MW Deployed Leasing 39 54 30 54 84 132 60 90 168 282 150 300 601
Cumulative MW Deployed Leasing (End of Q) 169 223 253 307 391 523 584 674 842 1124 223 523 1124
Average PPA 0.143 0.142 0.140 0.139 0.137 0.136 0.135 0.134 0.133 0.132
Yearly Average Sun Hours 1346 1344 1340 1336 1333 1330 1325 1322 1319 1316 1336 1322
% of Sun Hours in Quarter 28% 15% 19% 33% 31% 17% 19% 33% 31% 17%
Implied Capacity Factor 17.2% 9.2% 11.6% 19.8% 19.1% 10.4% 11.5% 19.6% 18.9% 10.3%
Quarterly Sun Hours 377 201 255 434 419 229 252 430 414 226 1336 1322
Revenue From PPAs and Leases 7.0$ 4.8$ 7.9$ 15.2$ 17.6$ 12.1$ 17.7$ 33.5$ 37.0$ 25.1$ 11.80$ 52.91$ ######
SREC Rev/Kwh (blended) $0.02 $0.02 $0.03 $0.03 $0.03 $0.03 $0.03 $0.03 $0.03 $0.03
1.0$ 0.7$ 1.4$ 2.7$ 3.2$ 2.2$ 3.3$ 6.3$ 7.0$ 4.8$ 1.66$ 9.62$ 21.30$
Revenue from legacy Rebates ($M) $0.03 $0.03 $0.03 $0.03 $0.03 $0.03 $0.03 $0.03 $0.03 $0.03
Cost of Revenues
Operating Leases/Incentives 3.6 4.4 4.8 6.2 11.2 16.5 17.5 19.2 23.8 25.9 29.9 36.4 40.8 46.9 51.8 57.6 19.0 64.3 116.0 197.0
Solar Energy System and Product Sales 0.0 0.1 0.0 0.0 0.4 0.5 0.5 0.0 0.0 0.0 0.0 0.0 0.0 0.0 0.0 0.0 0.1 1.3 0.0 0.0
Solmetric 0.40 0.40 0.44 0.44 0.44 0.44 0.52 0.52 0.52 0.52
Total 3.6 4.5 4.8 6.2 11.6 16.9 18.4 19.6 24.3 26.3 30.4 36.8 41.3 47.4 52.3 58.2 19.1 66.5 117.8 199.1
Cost of Revenues (% of Revenue)
PPA's 637% 359% 227% 317% 391% 284% 250% 400% 300% 170% 170% 300% 230% 140% 140% 230%
Solar Energy System and Product Sales 63% 56% 21% 65% 62% 64% 60% 60% 60% 60% 60% 60% 60% 60% 60% 60%
Total 614% 334% 213% 314% 330% 258% 210% 313% 236% 139% 139% 239% 187% 116% 116% 187%
Gross Income -3.0 -3.1 -2.6 -4.2 -8.1 -10.4 -9.6 -13.3 -14.0 -7.4 -8.5 -21.4 -19.2 -6.5 -7.1 -27.1 -41.4 -51.4 -59.9
Operating Lease GM -537% -259% -127% -217% -291% -184% -119% -249% -154% -44% -44% -153% -94% -18% -18% -93% -119% -74%
Overall Gross Margin -110% -213% -136% -39% -39% -139% -87% -16% -16% -87% -165% -77% -43%
Residential
Megawatts deployed 20 37 39 54 30 54 84 132 60 90 168 282 58 150 300 601
% of Yearly Installs in Q 13% 25% 26% 36% 10% 18% 28% 44% 10% 15% 28% 47%
Q/Q 85% 6% 39% -45% 80% 56% 57% -55% 50% 87% 68%
Y/Y % 50% 46% 115% 144% 100% 67% 100% 114% 159% 100% 100%
Cumulative megawatts deployed (end of period) 73 93 130 169 223 253 307 391 523 584 674 842 1124 15 73 223 523 1124
New System Size (kw) 6.8 6.8 6.8 6.8 7.0 7.0 7.0 7.0 7.0 7.0 7.0 7.0
Incremental Systems 2,941 5,441 5,744 7,965 4,292 7,726 12,018 18,885 8,584 12,876 24,035 40,345 22,091 42,920 85,840
Cumulative Systems Installed ##### 16,237 21,678 27,422 35,387 39,679 47,405 59,422 78,307 86,891 99,767 ##### ##### 13,296 35,387 78,307 ######
Cumulative System Size (Kw) 5.5 5.7 6.0 6.2 6.3 6.4 6.5 6.6 6.7 6.7 6.8 6.8 6.8 6.3 6.7 6.8
Opex 17.5 56.6 90.9 145.9
Sales and Marketing 1.2 1.7 2.1 2.4 5.2 5.8 9.8 11.3 11.9 12.2 12.6 13.0 17.9 21.5 22.2 24.4 7.3 32.2 49.7 86.0
% Change 37% 26% 12% 122% 11% 70% 15% 5% 3% 3% 3% 38% 20% 3% 10% 338% 55% 73%
General and Administrative 1.8 3.0 5.1 6.5 12.4 13.8 15.0 15.6 19.7 21.7 23.9 25.8 31.4 34.6 38.0 41.8 16.4 56.7 91.0 145.9
% Change 69% 69% 26% 91% 11% 9% 4% 27% 10% 10% 8% 22% 10% 10% 10% 245% 61% 60%
R&D Expense 0 0 0 0 0.47 0.50 0.50 0.55 0.60 0.65 0.70 0.75 0.80 0.85 0.90 0.95 0.0 2.0 2.7 3.5
Amortization of Intangible Assets 3.6 3.6 3.6 3.6 3.7 3.7 3.79 3.79 3.33 3.33 3.33 3.33 0.13 0.13 0.13 0.13 15.0 13.3 0.5
Total Opex 6.7 8.4 10.9 12.5 21.8 23.7 29.1 31.2 35.5 37.9 40.5 42.8 50.3 57.1 61.2 67.3 105.9 156.8 235.9
Opex/Watt $0.75 $0.58 $1.18 $0.70 $0.48 $0.32 $0.84 $0.63 $0.36 $0.24 $0.70 $0.52 $0.39 Source: Deutsche Bank

26 October 2014
Clean Technology
Vivint Solar
Page 22 Deutsche Bank Securities Inc.
Figure 27: Income Statement
Numbers in Millions 2013 2014 2015
FYE: Dec 31 Q1 Q2 Q3 Q4 Q1 Q2 Q3E Q4E Q1E Q2E Q3E Q4E
CY March June Sept Dec March June Sept Dec March June Sept Dec 2012 2013 2014E 2015E 2016E
Revenue
PPA Revenue $7.0 $4.8 $7.9 $15.2 $17.6 $12.1 $5.5 $52.9 $113.2
SREC Revenue $1.0 $0.7 $1.4 $2.7 $3.2 $2.2 $0.3 $9.6 $21.3
Amortization of Deferred Rebate Incentives $0.0 $0.0 $0.0 $0.0 $0.0 $0.0 $0.0 $0.1 $0.1
Operating Leases and Incentives Revenue $0.6 $1.2 $2.1 $1.9 $2.9 $5.8 $8.0 $5.5 $9.4 $18.0 $20.9 $14.4 $0.3 $5.9 $22.2 $62.6 $134.6
Solar Energy System Sales $0.0 $0.0
Solmetric Revenue $0.8 $0.8 $0.9 $0.9 $1.0 $1.0 $3.8 $4.6
Solar Energy System and Product Sales $0.0 $0.1 $0.2 $0.0 $0.6 $0.8 $0.8 $0.8 $0.9 $0.9 $1.0 $1.0 $0.2 $0.3 $2.9 $3.8 $4.6
Total Revenue $0.6 $1.3 $2.3 $2.0 $3.5 $6.6 $8.8 $6.3 $10.3 $18.9 $21.8 $15.4 $0.4 $6.2 $25.1 $66.4 $139.2
QoQ $1.3 $0.7 ($0.1) $0.8 $0.9 $0.3 ($0.3) $0.6 $0.8 $0.2 ($0.3)
YoY $4.9 $3.9 $2.8 $2.2 $1.9 $1.9 $1.5 $1.5 1274.2% 306.4% 165.0% 109.6%
Cost of Revenue
Cost of Revenue - Operating Leases & Incentives $3.6 $4.4 $4.8 $6.2 $11.2 $16.5 $17.5 $19.2 $23.8 $25.9 $29.9 $36.4 4.3 19.0 64.3 116.0 197.0
Cost of Revenue - Solar Energy System Sales $0.0 $0.1 $0.0 $0.0 $0.4 $0.5 $0.5 $0.0 $0.0 $0.0 $0.0 $0.0 0.1 0.1 1.3 0.0 0.0
Cost of Revenue - Solmetric Revenue 0.0 0.0 0.0 0.0
Total Cost of Revenue ($3.6) ($4.5) ($4.8) ($6.2) ($11.6) ($16.9) ($18.4) ($19.6) ($24.3) ($26.3) ($30.4) ($36.8) (4.4) (19.1) (66.5) (117.8) (199.1)
Gross Profit ($3.0) ($3.1) ($2.6) ($4.2) ($8.1) ($10.4) ($9.6) ($13.3) ($14.0) ($7.4) ($8.5) ($21.4) ($4.0) ($13.0) ($41.4) ($51.4) ($59.9)
% margin ($5.1) ($2.3) ($1.1) ($2.1) ($2.3) ($1.6) ($1.1) ($2.1) ($1.4) ($0.4) ($0.4) ($1.4) (883.3%) (210.0%) (165.1%) (77.3%) (43.0%)
Sales and marketing ($1.2) ($1.7) ($2.1) ($2.4) ($5.2) ($5.8) ($9.8) ($11.3) ($11.9) ($12.2) ($12.6) ($13.0) (2.0) (7.3) (32.2) (49.7) (86.0)
Research and Development $0.0 $0.0 $0.0 $0.0 ($0.5) ($0.5) ($0.5) ($0.6) ($0.6) ($0.7) ($0.7) ($0.8) 0.0 0.0 (2.0) (2.7) (3.5)
General and administrative ($1.8) ($3.0) ($5.1) ($6.5) ($12.4) ($13.8) ($15.0) ($15.6) ($19.7) ($21.7) ($23.9) ($25.8) (8.8) (16.4) (56.7) (91.0) (145.9)
Amortization of Intangible Assets ($3.6) ($3.6) ($3.6) ($3.6) ($3.7) ($3.7) ($3.8) ($3.8) ($3.3) ($3.3) ($3.3) ($3.3) (1.8) (14.6) (15.0) (13.3) (0.5)
Operating Expenses ($6.7) ($8.4) ($10.9) ($12.5) ($21.8) ($23.7) ($29.1) ($31.2) ($35.5) ($37.9) ($40.5) ($42.8) ($12.6) ($38.4) ($105.9) ($156.8) ($235.9)
Gross Cost + Opex ($10.3) ($11.5) ($13.5) ($16.7) ($29.9) ($34.1) ($38.7) ($44.6) ($49.5) ($45.3) ($49.0) ($64.2) (16.6) (51.9) (147.3) (208.1) (295.7)
Operating Income ($9.7) ($11.5) ($13.5) ($16.7) ($29.9) ($34.1) ($38.7) ($44.6) ($49.5) ($45.3) ($49.0) ($64.2) (16.6) (51.3) (147.3) (208.1) (295.7)
Non operating expense:
Interest Expense ($0.4) ($0.6) ($1.0) ($1.2) ($1.4) ($2.7) ($3.1) ($2.2) ($2.6) ($4.7) ($5.5) ($3.9) -1.0 (3.1) (9.3) (16.6) (34.8)
Other Expense ($0.2) ($0.4) ($0.5) ($0.8) ($0.9) ($0.3) ($0.3) ($0.3) ($0.3) ($0.3) ($0.3) ($0.3) (0.3) (1.9) (1.8) (1.2) (1.2)
Non operating expense: ($0.6) ($0.9) ($1.5) ($2.0) ($2.3) ($3.0) ($3.4) ($2.5) ($2.9) ($5.0) ($5.8) ($4.2) (1.3) (5.0) (11.1) (17.8) (36.0)
Income (loss) before taxes ($10.3) ($12.4) ($15.0) ($18.7) ($32.1) ($37.1) ($42.1) ($47.1) ($52.4) ($50.3) ($54.8) ($68.4) (17.8) (56.3) (158.4) (225.9) (331.7)
Income Tax Expense ($0.5) $0.4 ($0.0) ($0.0) ($4.4) ($2.5) ($1.8) ($1.3) $0.0 $0.0 $0.0 $0.0 1.1 -0.1 (9.9) 0.0 0.0
Net Income ($10.8) ($12.0) ($15.0) ($18.7) ($36.5) ($39.6) ($43.8) ($48.3) ($52.4) ($50.3) ($54.8) ($68.4) ($16.7) ($56.5) ($168.3) ($225.9) ($331.7)
Net income attributable to non-controlling interests$2.1 $0.0 $37.8 $22.0 $43.6 $45.1 $45.1 $45.1 $45.1 $45.1 $45.1 $45.1 $2.5 61.9 178.9 180.4 180.4
% of Net income attributable to non-controlling interests20% 0% 252% 117% 119% 114% 103% 93% 86% 90% 82% 66% 15% 110% 106% 80% 54%
Net Income (Loss) ($8.7) ($11.9) $22.9 $3.2 $7.0 $5.5 $1.3 ($3.2) ($7.3) ($5.2) ($9.7) ($23.3) ($34.3) $5.5 $10.6 ($45.5) ($151.3)
Basic income (loss) per share ($0.14) ($0.16) ($0.20) ($0.25) ($0.49) ($0.53) ($0.52) ($0.46) ($0.50) ($0.48) ($0.52) ($0.65) (0.2) (0.8) (2.0) (2.1) (3.2)
Diluted income (loss) per share from Operations ($0.14) ($0.16) ($0.20) ($0.25) ($0.48) ($0.52) ($0.44) ($0.42) ($0.46) ($0.44) ($0.48) ($0.60) (0.2) (0.8) (1.9) (2.0) (2.9)
Non-GAAP EPS ($0.12) ($0.16) $0.30 $0.04 $0.09 $0.07 $0.01 ($0.03) ($0.06) ($0.05) ($0.08) ($0.20) ($0.46) $0.07 $0.15 ($0.4) ($1.3)
Weighted average basic shares used (M) 75 75 75 75 75 75 84.7 105.3 105.3 105.3 105.3 105.3 75.0 75.0 85.0 105.3 105.3
Avg Shares - Fully Diluted (M) 75.2 75.2 75.2 75.2 76.2 76.2 98.8 114.6 114.6 114.6 114.6 114.6 75.0 75.2 91.5 114.6 114.6
Percent of Sales
Gross Margin (513.5%) (234.4%) (113.0%) (214.3%) (230.3%) (158.4%) (109.6%) (213.4%) (136.4%) (39.1%) (39.2%) (138.8%) (883.3%) (210.0%) (165.1%) (77.3%) (43.0%)
Sales and marketing 205.6% 125.5% 92.6% 119.4% 148.8% 88.3% 112.4% 181.0% 115.7% 64.7% 57.8% 84.2% (446.3%) (119.1%) (128.3%) (74.8%) (61.7%)
General and administrative 303.4% 227.8% 225.8% 328.3% 352.3% 209.7% 171.2% 249.3% 191.9% 114.7% 109.3% 167.1% (1951.0%) (266.4%) (226.1%) (137.0%) (104.8%)
Sales and marketing (205.6%) (125.5%) (92.6%) (119.4%) (148.8%) (88.3%) (112.4%) (181.0%) (115.7%) (64.7%) (57.8%) (84.2%) (2397.3%) (385.5%) (354.4%) (211.9%) (166.5%)
Operating Income (1638.9%) (861.3%) (591.8%) (847.1%) (851.4%) (520.3%) (442.3%) (713.1%) (482.2%) (239.4%) (224.7%) (416.6%) (3686.9%) (832.1%) (587.5%) (313.2%) (212.4%)
Net Income (1462.7%) (895.9%) 1005.1% 163.2% 200.8% 83.8% 14.5% (51.7%) (71.2%) (27.6%) (44.4%) (151.0%) (7634.3%) 88.7% 42.1% (68.5%) (108.7%)
Tax Rate 81.9% (33.0%) 1.4% 2.4% 125.3% 38.8% 20.0% 20.0% 0.0% 0.0% 0.0% 0.0% (237.6%) 2.0% 39.6% 0.0% 0.0%
Interest Expense 71.8% 42.5% 42.3% 60.4% 39.9% 40.8% 35.0% 35.0% 25.0% 25.0% 25.0% 25.0% 217.6% 51.0% 37.2% 25.0% 25.0% Source: Deutsche Bank

26 October 2014
Clean Technology
Vivint Solar
Deutsche Bank Securities Inc. Page 23
Industry Overview: US Residential Solar
1) Grid parity in 10+ states currently
We believe solar is currently competitive in more than 10 states in the U.S
without additional state subsidies. Solar LCOE in these states ranges from 11-
15 c/kWh and compares to retail electricity price of 11-37 c/kWh in these
markets. These grid parity states currently have a cumulative installed capacity
of ~6GW as of 2012. However, considering the improved economics of solar in
these markets along with other growth enablers such as solar leasing,
availability of low cost financing, we expect installed capacity growth of ~400-
500% over the next 3-4 years.
Figure 28: US Total PV Installations Figure 29: Total PV Capacity
0
2
4
6
8
10
12
14
16
18
2010 2011 2012 2013E 2014E 2015E 2016E
GW
Residential Commercial Utility
0.81.9
3.3
5.0
8.0
12.0
16.0
0
5,000
10,000
15,000
20,000
25,000
30,000
35,000
40,000
45,000
50,000
2007 2008 2009 2010 2011 2012 2013E 2014E 2015E 2016E
MW
dc
Total PV Capacity (MW dc)
~0.7GW
~7.1GW
~3.8GW~2.1GW~1.5GW~1GW
~46.8GW
~30.9GW
~18.9GW
~11.8GW
Source: Deutsche Bank, SEIA
Source: Deutsche Bank
2) Potential for further cost reductions and solar growth in additional states
over the next 18 months
Assuming solar system prices decline from sub $3/W currently to sub $2.50/W
over the next 12-18 months, solar LCOE in existing grid parity states could
decrease further to 9-14 c/kWh driving further acceleration in solar shipments
in these markets. At these system price levels, solar has the potential to reach
grid parity in 12 additional states as LCOE approaches 11-14 c/kWh in these
states.

26 October 2014
Clean Technology
Vivint Solar
Page 24 Deutsche Bank Securities Inc.
Figure 30: States Currently at Grid Parity Figure 31: Additional States Poised to Reach Grid Parity
Grid Parity at $3.00
($2.10 w/ ITC)LCOE ($/KWh)
Average Cost of
Electricity ($/KWh)
Arizona $0.11 $0.11
California $0.12 $0.16
Connecticut $0.15 $0.17
Hawaii $0.12 $0.37
Nevada $0.10 $0.12
New Hampshire $0.15 $0.16
New Jersey $0.15 $0.16
New Mexico $0.11 $0.11
New York $0.15 $0.18
Vermont $0.16 $0.17
Grid Parity at $2.50
($1.75 w/ ITC)LCOE ($/KWh)
Average Cost of
Electricity ($/KWh)
Colorado $0.10 $0.12
Delaware $0.12 $0.13
Washington, DC $0.12 $0.12
Florida $0.11 $0.11
Kansas $0.11 $0.11
Maryland $0.12 $0.13
Massachusetts $0.13 $0.15
Michigan $0.14 $0.14
Pennsylvania $0.13 $0.13
Rhode Island $0.13 $0.15
South Carolina $0.11 $0.12
Wisconsin $0.13 $0.13 Source: Deutsche Bank
Source: Deutsche Bank
3) Lower financing costs could provide additional growth kicker
We believe the broader acceptance of yieldco type
structures has lowered solar financing costs by ~200-300
bps in addition to providing significant amount of
liquidity within the solar sector. Every 100 bps reduction
in financing costs results in 1 c/kWh reduction of LCOE,
in our view. We believe solar LCOE could potentially
decrease from 10-16 c/kWh to 8-14 c/kWh as a result of
wider acceptance of yieldco type structures. Wider
availability of financing options could provide project
developers some cushion in a rising interest rate
environment.
4) ITC expiration could act as another catalyst
Current forms of federal investment tax credits are set to expire in 2016.
Without any ITC, solar LCOE increases from 10-16 c/kWh to 15-21c/kWh and
only 1 state (Hawaii) screening at grid parity states vs ~10 states currently. In a
2017+ 10% ITC environment, solar would be at grid parity in ~36 states (vs
~47 states with 30% ITC), assuming system prices and financing costs decline
although the economics for solar would not be as attractive. Consequently, we
expect to see a big rush of new installations ahead of the 2016 ITC expiration.
Figure 32: Shift in LCOE for 100bps Reduction
Cost of Debt /
Discount Rate
Average LCOE
($2.10 w/ITC)
Reduction per
100bps
7.50% $0.15
6.50% $0.14 $0.008
5.50% $0.13 $0.008
4.50% $0.12 $0.008
3.50% $0.12 $0.008
2.50% $0.11 $0.007
Source: Deutsche Bank Note: Average of all 50 states and DC for current net system LCOE (with ITC)

26 October 2014
Clean Technology
Vivint Solar
Deutsche Bank Securities Inc. Page 25
Figure 33: 2016 Grid Parity With ~30% ITC Figure 34: Grid Parity When ITC Steps Down to 10%
-$0.05
-$0.03
-$0.01
$0.01
$0.03
$0.05
$0.07
$0.09
Haw
aii
New
York
Calif
orn
ia
Connecticut
Verm
ont
New
Ham
pshire
New
Jers
ey
Rhode I
sla
nd
Massachusett
s
Nevada
New
Mexic
o
Arizona
Mic
hig
an
Dela
ware
Colo
rado
Main
e
Wis
consin
Mary
land
Pennsylv
ania
Dis
tric
t of C
olu
mbia
South
Caro
lina
Flo
rida
Kansas
Ala
bam
a
Georg
ia
Nort
h C
aro
lina
Texas
Wyom
ing
Min
nesota
Uta
h
Virgin
ia
Ohio
Mis
sis
sip
pi
Iow
a
Monta
na
Mis
souri
Okla
hom
a
Tennessee
Illin
ois
Nebra
ska
India
na
South
Dakota
Idaho
Nort
h D
akota
Ark
ansas
Kentu
cky
Louis
iana
West V
irgin
ia
Ore
gon
Ala
ska
Washin
gto
n
Distance from Average Future Cost of Electricity ($/KWh)
We could see 47 states at grid parityby the end of 2016 with 30% ITC...
-$0.10
-$0.08
-$0.06
-$0.04
-$0.02
$0.00
$0.02
$0.04
$0.06
$0.08
$0.10
Haw
aii
Calif
orn
ia
New
York
Connecticut
Verm
ont
New
Ham
pshire
New
Jers
ey
Nevada
New
Mexic
o
Rhode I
sla
nd
Arizona
Massachusett
s
Dela
ware
Colo
rado
Mic
hig
an
Mary
land
Wis
consin
Main
e
South
Caro
lina
Flo
rida
Pe
nnsylv
ania
Dis
tric
t of C
olu
mbia
Kansas
Ala
bam
a
Nort
h C
aro
lina
Georg
ia
Texas
Wyom
ing
Uta
h
Virgin
ia
Min
nesota
Mis
sis
sip
pi
Ohio
Iow
a
Monta
na
Okla
hom
a
Mis
souri
Tennessee
Nebra
ska
Illin
ois
India
na
Idaho
South
Dakota
Nort
h D
akota
Ark
ansas
Louis
iana
Ke
ntu
cky
West V
irgin
ia
Ore
gon
Washin
gto
n
Ala
ska
Distance from Average Future Cost of Electricity ($/KWh)
...but this could lower to 36 stateswhen the ITC reduces to 10%
Source: Deutsche Bank, EIA Note: Both Graphs above show LCOE minus average electricity price in States
Source: Deutsche Bank, EIA
5) Leasing model could become mainstream
We believe the availability of residential leasing option would also act as a
significant growth catalyst for the sector considering the fact that solar leasing
companies are highly profitable and have strong incentive to maximize the
number of leasing customers ahead of ITC expiration in 2016.

26 October 2014
Clean Technology
Vivint Solar
Page 26 Deutsche Bank Securities Inc.
Background
The US market has over 16GW of installed capacity and nearly 5GW of solar
capacity was added in 2013. While the data shows a focus on utility scale
installations, distributed generation (both residential and commercial) has also
been gaining ground recently. We estimate that ~800MW of residential
systems were installed in 2013 and expect this number to reach 5GW as solar
securitization increases and more states continue to reach grid parity. We
believe regions within 10+ states are at grid parity already, while more states
will follow suit as cost per watt continues to decline fueled by BoS cost
reductions, making solar more competitive with rising electricity rates over the
long term.
Figure 35: Total State Capacity/Installs
0
1000
2000
3000
4000
5000
6000
New Solar Power Capacity in 2013 (MW) Total Solar Power Capacity at Year End (MW)
In 2013, the top 10 statesaccounted for ~90%+ of US installations
Source: Deutsche Bank

26 October 2014
Clean Technology
Vivint Solar
Deutsche Bank Securities Inc. Page 27
State Economics
Figure 36: Dispersion of Electricity Prices in the US
Source: National Renewable Energy Laboratory
As shown above, the electricity price within any given state is often highly
variable (we estimate many states are +/- 3 cents from the mean), while the
vast number of rate structures can provide for further complications (fixed or
variable pricing, time of use, demand response, volume pricing, etc). We have
compiled the average state electric prices on a monthly basis and used the
LTM average for our model.

26 October 2014
Clean Technology
Vivint Solar
Page 28 Deutsche Bank Securities Inc.
Figure 37: Most Expensive Electricity (Residential) Figure 38: Least Expensive Electricity (Residential)
Rank State Residential ($/W) Commercial ($/W) Industrial ($/W)
1 Hawaii $0.37 $0.35 $0.31
2 New York $0.18 $0.15 $0.07
3 Alaska $0.18 $0.15 $0.16
4 Vermont $0.17 $0.14 $0.10
5 Connecticut $0.17 $0.15 $0.13
6 New Hampshire $0.16 $0.13 $0.12
7 California $0.16 $0.14 $0.11
8 New Jersey $0.16 $0.13 $0.11
9 Rhode Island $0.15 $0.12 $0.11
10 Massachusetts $0.15 $0.14 $0.13
11 Maine $0.15 $0.12 $0.08
12 Michigan $0.14 $0.11 $0.08
13 Delaware $0.13 $0.10 $0.09
14 Wisconsin $0.13 $0.11 $0.07
15 Maryland $0.13 $0.10 $0.08
16 Pennsylvania $0.13 $0.09 $0.07
17 District of Columbia $0.12 $0.12 $0.06
18 Nevada $0.12 $0.09 $0.06
19 Ohio $0.12 $0.09 $0.06
20 South Carolina $0.12 $0.10 $0.06
21 Minnesota $0.12 $0.09 $0.07
22 Colorado $0.12 $0.10 $0.07
23 Florida $0.11 $0.10 $0.08
24 New Mexico $0.11 $0.09 $0.06
25 Kansas $0.11 $0.09 $0.07
12 Month Average Electricity Price
Rank State Residential ($/kWh) Commercial ($/W) Industrial ($/W)
26 Arizona $0.11 $0.10 $0.07
27 Alabama $0.11 $0.11 $0.06
28 Texas $0.11 $0.08 $0.06
29 Georgia $0.11 $0.10 $0.06
30 Virginia $0.11 $0.08 $0.07
31 Illinois $0.11 $0.08 $0.06
32 Iowa $0.11 $0.08 $0.05
33 North Carolina $0.11 $0.09 $0.06
34 Indiana $0.11 $0.09 $0.06
35 Mississippi $0.10 $0.10 $0.06
36 Montana $0.10 $0.09 $0.05
37 Missouri $0.10 $0.08 $0.06
38 Tennessee $0.10 $0.10 $0.07
39 Nebraska $0.10 $0.08 $0.07
40 South Dakota $0.10 $0.08 $0.07
41 Wyoming $0.10 $0.08 $0.06
42 Utah $0.10 $0.08 $0.06
43 Oregon $0.10 $0.08 $0.06
44 West Virginia $0.10 $0.08 $0.06
45 Kentucky $0.09 $0.09 $0.05
46 Oklahoma $0.09 $0.07 $0.05
47 Arkansas $0.09 $0.08 $0.06
48 North Dakota $0.09 $0.08 $0.07
49 Idaho $0.09 $0.07 $0.05
50 Louisiana $0.09 $0.08 $0.05
51 Washington $0.09 $0.08 $0.04
12 Month Average Electricity Price
Source: Deutsche Bank, EIA
Source: Deutsche Bank, EIA
In the absence of outside incentives, utility electricity prices are the main form
of competition a residential/commercial solar project must face. We believe
the top 10-15 states provide the most compelling possibilities for unaided cost
parity, particularly as fossil fuel based generation has been in relative
oversupply and this environment begins to shift. For example, there are
~55GW of coal fired plant retirements planned through 2016 due in large part
to the finalization of the Mercury and Air Toxics Standards (MATS) by the EPA.
There will be incremental capacity additions to maintain adequate capacity in
the electricity market, but the addition of large power plants increases the rate
base of regulated utilities, which often allows them to raise rates on
consumers over time. As higher electricity prices make solar more competitive,
we view this as a positive
Theoretical Potential
In a 2012 paper (U.S. Renewable Energy Technical Potentials: A GIS-Based
Analysis) the US National Renewable Energy Laboratory (NREL) conducted a
study on the technical potential for various renewable energy technologies.
Using data from the EIA, McGraw-Hill, and Denholm and Margolis, NREL
concluded that ~664GW of potential capacity could be realized by the rooftop
market alone, versus <1% penetration currently.

26 October 2014
Clean Technology
Vivint Solar
Deutsche Bank Securities Inc. Page 29
Figure 39: Technical Rooftop Capacity Vs Electricity Price
0
10
20
30
40
50
60
70
80
$0.00
$0.05
$0.10
$0.15
$0.20
$0.25
$0.30
$0.35
$0.40
Ala
bam
a
Ala
ska
Arizona
Ark
ansas
Calif
orn
ia
Colo
rado
Connecticut
Dela
ware
Dis
tric
t of C
olu
mbia
Flo
rida
Georg
ia
Haw
aii
Idaho
Illin
ois
India
na
Iow
a
Kansas
Kentu
cky
Louis
iana
Main
e
Mary
land
Massachusett
s
Mic
hig
an
Min
nesota
Mis
sis
sip
pi
Mis
souri
Monta
na
Nebra
ska
Nevada
New
Ham
pshire
New
Jers
ey
New
Mexic
o
New
York
Nort
h C
aro
lina
Nort
h D
akota
Ohio
Okla
hom
a
Ore
gon
Pennsylv
ania
Rhode Isla
nd
South
Caro
lina
South
Dakota
Tennessee
Te
xa
s
Uta
h
Verm
ont
Vir
gin
ia
Washin
gto
n
West V
irgin
ia
Wis
consin
Wyom
ing
Technic
al C
apacity P
ote
ntial (G
W)
Ele
ctr
icity P
rice (
$/k
Wh)
Potential Rooftop PV Capacity (GW) 12 Month Residential Electricity Price ($/kWh) Median Electricity Price ($/kWh)
Source: Deutsche Bank, NREL, EIA, McGraw Hill, Denholm and Margolis,
From their analysis, we see that ~51% (343GW) of the technical potential lies
in states with electricity prices above the median electricity price
($0.1128/kWh) while, ~19% of the potential (~128GW) lies in states with
residential electricity prices already above $0.15/kwh – primarily California
(~76GW), New York (~25GW), New Jersey(13.7GW), and Connecticut(5.9GW).

26 October 2014
Clean Technology
Vivint Solar
Page 30 Deutsche Bank Securities Inc.
Grid Parity Increasing
We believe that the US is rapidly approaching grid parity in various regions
where high electricity prices and the declining cost of solar has made
investments increasingly attractive. By default our model takes into account
the gross lifetime cost of the system and the lifetime electricity production, but
we have assumed ITC inclusion (effectively 30% less system cost) in our LCOE
analysis.
Below, we show the states which we believe have likely reached grid parity,
depending on the region, electricity price, and type of consumption. Hawaii
and California are consistently the top two markets due to high insolation (a
measure of the sun’s radiation) and high electricity prices, but different pricing
schemes for types of electricity within state markets causes divergences
thereafter.
Figure 40: States At or Near Grid Parity
Type of Electricity
Rank Residential Commercial Industrial
1 Hawaii Hawaii Hawaii
2 California California California
3 New York New York Massachusetts
4 Connecticut Connecticut Connecticut
5 Nevada Massachusetts New Hampshire
6 Vermont Arizona Rhode Island
7 New Mexico Vermont New Jersey
8 Arizona New Mexico Arizona
9 New Hampshire New Hampshire Nevada
10 New Jersey Nevada New Mexico Source: Deutsche Bank, EIA
While Hawaii is an outlier due to drastically higher electricity prices, The next
ten states closest to grid parity reinforce our view that high electricity prices
provide the most compelling argument in favor of PV self generation. There is
often a direct correlation between population centers and high electricity
prices (more resources required to generate/transmit electricity equates to a
higher rate base) which implies upside bias to our estimates as customer
awareness increases and the financial viability of solar passes further into
mainstream decision making.
Furthermore, we have conducted a similar analysis for Commercial and
Industrial sectors with and with the ITC. While we assumed $2.10/w ($3/w ex
ITC) for residential, we have used $1.75/w ($2.50/w ex ITC) and $1.58/w
($2.25/w ex ITC) for commercial and industrial systems (given economies of
scale). Our analysis shows that despite lower electricity prices to compete
with compared to residential prices, the commercial market appears
particularly attractive and should continue to be a solid growth driver for the
US market. The residential market retains the most markets at grid parity in
the current ITC environment.

26 October 2014
Clean Technology
Vivint Solar
Deutsche Bank Securities Inc. Page 31
Based on our analysis we believe 10+ States in the US are at grid parity in
certain regions (depending on the local electricity price). Our base case model
uses the 12 month rolling average electricity price for each state. However,
given notable volatility in electricity prices within states, we have also tested
our assumptions compared to a high band (+$0.03) above average. Our
analysis shows that 20-30% of US States appear to be at or near to grid parity.
Industrial electricity prices are the most difficult to compete with (as they are
lowest) but are likely biased to the upside if our analysis considered other
incentives in the LCOE calculation.
Key States – Distance from Grid Parity
Figure 41: Residential Parity @ $2.10 Net Cost (w/ ITC. $3.00/w Gross)
-$0.10
-$0.08
-$0.06
-$0.04
-$0.02
$0.00
$0.02
$0.04
$0.06
$0.08
$0.10
Haw
aii
Calif
orn
ia
New
York
Connecticut
Nevada
Verm
ont
New
Mexic
o
Arizona
New
Ham
psh
ire
New
Jers
ey
Colo
rado
Rhode I
sla
nd
Massachusett
s
Dela
ware
Mic
hig
an
Mary
land
Flo
rid
a
So
uth
Caro
lina
Kansas
Wis
consin
State Average ($/kwh)
High Band ($0.03)
We believe 10+ statesare at grid parityin some regions
Source: Deutsche Bank, EIA Note: These three successive graphs show LCOE minus electricity price (average and +3 cents)
Figure 42: Commercial Parity @ $1.75/w Net Cost (w/ITC. $2.50/w Gross)
-$0.10
-$0.08
-$0.06
-$0.04
-$0.02
$0.00
$0.02
$0.04
$0.06
$0.08
$0.10
Haw
aii
Calif
orn
ia
New
York
Connectic
ut
Massachusetts
Arizona
Verm
ont
New
Mexic
o
New
Ham
pshire
Nevada
New
Jers
ey
Dis
tric
t of C
olu
mbia
Rhode Is
land
Colo
rado
Ala
bam
a
Flo
rida
South
Caro
lina
Tennessee
Kansas
Mary
land
State Average
($/kw h)
High Band (+$0.03)
Source: Deutsche Bank, EIA

26 October 2014
Clean Technology
Vivint Solar
Page 32 Deutsche Bank Securities Inc.
Figure 43: Industrial Parity @ $1.58/w Net Cost (w/ ITC. $2.25/w Gross)
-$0.10
-$0.08
-$0.06
-$0.04
-$0.02
$0.00
$0.02
$0.04
$0.06
$0.08
$0.10
Haw
aii
Calif
orn
ia
Massachusetts
Connectic
ut
New
Ham
pshire
Rhode Is
land
New
Jers
ey
Arizona
Nevada
New
Mexic
o
Colo
rado
Flo
rida
Verm
ont
Dela
ware
Mary
land
Kansas
Wyom
ing
Nort
h D
ako
ta
Tennessee
Nebra
ska
State Average
($/kw h)
High Band (+$0.03)
Source: Deutsche Bank, EIA
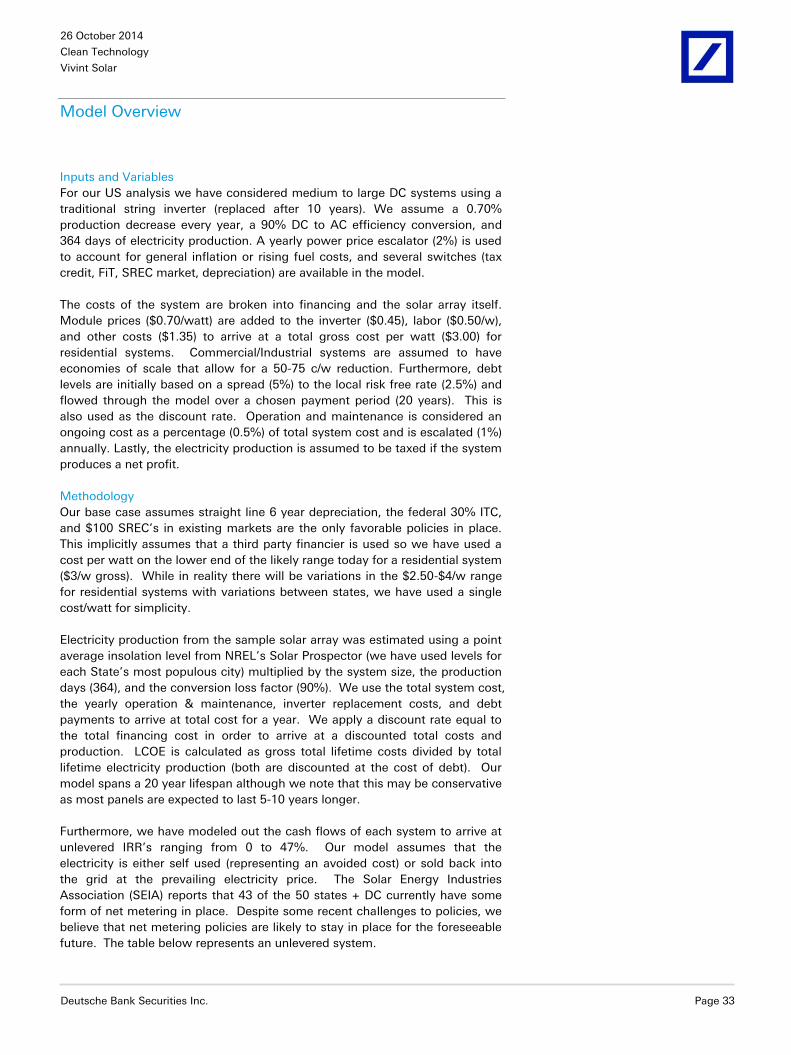
26 October 2014
Clean Technology
Vivint Solar
Deutsche Bank Securities Inc. Page 33
Model Overview
Inputs and Variables
For our US analysis we have considered medium to large DC systems using a
traditional string inverter (replaced after 10 years). We assume a 0.70%
production decrease every year, a 90% DC to AC efficiency conversion, and
364 days of electricity production. A yearly power price escalator (2%) is used
to account for general inflation or rising fuel costs, and several switches (tax
credit, FiT, SREC market, depreciation) are available in the model.
The costs of the system are broken into financing and the solar array itself.
Module prices ($0.70/watt) are added to the inverter ($0.45), labor ($0.50/w),
and other costs ($1.35) to arrive at a total gross cost per watt ($3.00) for
residential systems. Commercial/Industrial systems are assumed to have
economies of scale that allow for a 50-75 c/w reduction. Furthermore, debt
levels are initially based on a spread (5%) to the local risk free rate (2.5%) and
flowed through the model over a chosen payment period (20 years). This is
also used as the discount rate. Operation and maintenance is considered an
ongoing cost as a percentage (0.5%) of total system cost and is escalated (1%)
annually. Lastly, the electricity production is assumed to be taxed if the system
produces a net profit.
Methodology
Our base case assumes straight line 6 year depreciation, the federal 30% ITC,
and $100 SREC’s in existing markets are the only favorable policies in place.
This implicitly assumes that a third party financier is used so we have used a
cost per watt on the lower end of the likely range today for a residential system
($3/w gross). While in reality there will be variations in the $2.50-$4/w range
for residential systems with variations between states, we have used a single
cost/watt for simplicity.
Electricity production from the sample solar array was estimated using a point
average insolation level from NREL’s Solar Prospector (we have used levels for
each State’s most populous city) multiplied by the system size, the production
days (364), and the conversion loss factor (90%). We use the total system cost,
the yearly operation & maintenance, inverter replacement costs, and debt
payments to arrive at total cost for a year. We apply a discount rate equal to
the total financing cost in order to arrive at a discounted total costs and
production. LCOE is calculated as gross total lifetime costs divided by total
lifetime electricity production (both are discounted at the cost of debt). Our
model spans a 20 year lifespan although we note that this may be conservative
as most panels are expected to last 5-10 years longer.
Furthermore, we have modeled out the cash flows of each system to arrive at
unlevered IRR’s ranging from 0 to 47%. Our model assumes that the
electricity is either self used (representing an avoided cost) or sold back into
the grid at the prevailing electricity price. The Solar Energy Industries
Association (SEIA) reports that 43 of the 50 states + DC currently have some
form of net metering in place. Despite some recent challenges to policies, we
believe that net metering policies are likely to stay in place for the foreseeable
future. The table below represents an unlevered system.

26 October 2014
Clean Technology
Vivint Solar
Page 34 Deutsche Bank Securities Inc.
Figure 44: LCOE and IRR in USA’s Most Populous Cities (100% equity, ITC, SRECs in Select Markets)
City, StateInsolation
(kWh/m2/day)
Cost of Electricity - $/kWh (12 month
State average)
LCOE ($2.10/w Cost
with ITC)IRR
Honolulu, Hawaii 5.97 $0.37 $0.16 47.11%
Newark, New Jersey 4.67 $0.16 $0.21 15.11%
Los Angeles, California 6.06 $0.16 $0.16 13.68%
Boston, Massachusetts 4.57 $0.15 $0.21 13.32%
Wilmington, Delaware 4.81 $0.13 $0.20 12.97%
Baltimore, Maryland 4.85 $0.13 $0.20 12.14%
Washington, District of Columbia 4.87 $0.12 $0.20 11.39%
Philadelphia, Pennsylvania 4.72 $0.13 $0.21 11.08%
New York, New York 4.62 $0.18 $0.21 10.83%
Charlotte, North Carolina 5.19 $0.11 $0.19 10.73%
Las Vegas, Nevada 6.73 $0.12 $0.15 9.59%
Virginia Beach, Virginia 4.93 $0.11 $0.20 9.45%
Bridgeport, Connecticut 4.54 $0.17 $0.21 9.42%
Albuquerque, New Mexico 6.60 $0.11 $0.15 8.65%
Phoenix, Arizona 6.68 $0.11 $0.15 8.53%
Burlington, Vermont 4.30 $0.17 $0.23 8.42%
Columbus, Ohio 4.48 $0.12 $0.22 8.25%
Manchester, New Hampshire 4.54 $0.16 $0.21 8.06%
Providence, Rhode Island 4.59 $0.15 $0.21 6.57%
Denver, Colorado 5.85 $0.12 $0.17 6.50%
Louisville, Kentucky 4.70 $0.09 $0.21 5.77%
Detroit, Michigan 4.41 $0.14 $0.22 5.26%
Charleston, West Virginia 4.50 $0.10 $0.22 5.24%
Columbia, South Carolina 5.22 $0.12 $0.19 4.75%
Jacksonville, Florida 5.31 $0.11 $0.18 4.71%
Milwaukee, Wisconsin 4.54 $0.13 $0.21 4.70%
Wichita, Kansas 5.33 $0.11 $0.18 4.54%
Portland, Maine 4.04 $0.15 $0.24 4.13%
Birmingham, Alabama 5.00 $0.11 $0.20 3.42%
Atlanta, Georgia 5.09 $0.11 $0.19 3.30%
Cheyenne, Wyoming 5.53 $0.10 $0.18 3.21%
Salt Lake City, Utah 5.51 $0.10 $0.18 3.15%
Houston, Texas 4.96 $0.11 $0.20 3.14%
Jackson, Mississippi 5.11 $0.10 $0.19 2.43%
Minneapolis, Minnesota 4.56 $0.12 $0.21 2.40%
Des Moines, Iowa 4.72 $0.11 $0.21 1.99%
Oklahoma City, Oklahoma 5.41 $0.09 $0.18 1.93%
Billings, Montana 4.98 $0.10 $0.20 1.91%
Kansas City, Missouri 4.97 $0.10 $0.20 1.69%
Memphis, Tennessee 4.99 $0.10 $0.20 1.68%
Omaha, Nebraska 4.93 $0.10 $0.20 1.47%
Chicago, Illinois 4.50 $0.11 $0.22 1.30%
Indianapolis, Indiana 4.60 $0.11 $0.21 1.11%
Boise, Idaho 5.48 $0.09 $0.18 0.94%
Sioux Falls, South Dakota 4.75 $0.10 $0.21 0.91%
Fargo, North Dakota 5.16 $0.09 $0.19 0.80%
Little Rock, Arkansas 4.98 $0.09 $0.20 0.61%
Anchorage, Alaska 2.09 $0.18 $0.34 -
New Orleans, Louisiana 5.12 $0.09 $0.14 -
Portland, Oregon 4.04 $0.10 $0.17 -
Seattle, Washington 3.98 $0.09 $0.18 - Source: Deutsche Bank, NREL, EIA Note: Includes 30% ITC for all states and $100 SREC’s for 6 years in markets in Delaware, Washington DC, Kentucky, Maryland, Massachusetts,New Jersey, North Carolina, Ohio, Pennsylvania, Virginia, and West Virginia

26 October 2014
Clean Technology
Vivint Solar
Deutsche Bank Securities Inc. Page 35
SREC Markets
State renewable energy certificates (SRECs) have helped to push New Jersey
into one of the top solar markets in the country, and several other states have
followed suit. While California does not currently utilize SREC markets the
same way that other states do, we believe these market based instruments can
be an effective means to increase ROI and enhance solar adoption rates.
Overview – Active Markets
New Jersey, Maryland, Delaware, Massachusetts, Ohio, Pennsylvania, North
Carolina and Washington DC all employ active SREC markets currently.
Indiana, Kentucky, West Virginia, and North Carolina also have marginal SREC
markets because they have territory located within the PJM Regional
Transmission Organization, which allows them to trade into active SREC
markets like Ohio and Pennsylvania. Furthermore, California allows tradable
renewable energy credits (TRECs) which are considerably different from SRECs
and less likely to directly benefit distributed generation.
What is an SREC?
SREC’s have been implemented to provide a partially market based incentive
for solar capacity additions, particularly for distributed generation. 1 SREC is
created for every 1 MWh of electricity generated from a solar installation.
Using a Newark, NJ example, a 5kw system would generate ~6-8 SREC’s per
year. At current average wholesale prices, a residential system could generate
incremental yearly income of ~$1,000-$1,500 per year.
SREC markets are primarily based on supply and demand, although the
demand is essentially state mandated. The specifics vary across states, but
there is generally a target renewable portfolio standard (RPS) with a specific
carve out for solar generation over the next 10+ years as either a percentage of
total electricity use or total GWh generated from solar. For example, the
requirements for NJ are shown below, which have changed from absolute
generation targets to % generation targets as shown.

26 October 2014
Clean Technology
Vivint Solar
Page 36 Deutsche Bank Securities Inc.
Figure 45: New Jersey RPS Solar Mandate
Energy
Year
Old Solar
Carve-Out
New Solar
Carve Out
Energy
Year
OldSolar
Carve-Out
New Solar
Carve Out
EY 2011 306 GWh 306 GWh EY 2020 2,164 GWh 3.38%
EY 2012 442 GWh 442 GWh EY 2021 2,518 GWh 3.47%
EY 2013 596 GWh 596 GWh EY 2022 2,928 GWh 3.56%
EY 2014 772 GWh 2.05% EY 2023 3,433 GWh 3.65%
EY 2015 965 GWh 2.45% EY 2024 3,989 GWh 3.74%
EY 2016 1,150 GWh 2.75% EY 2025 4,610 GWh 3.83%
EY 2017 1,357 GWh 3.00% EY 2026+ 5,316 GWh 3.92%
EY 2018 1,591 GWh 3.20% EY 2027 5,316 GWh 4.01%
EY 2019 1,858 GWh 3.29% EY 2028 + 5,316 GWh 4.10%
*Note: Energy Year Begins June 1st of the prior calendar year in NJ
Source: NJ State Legislature Bills, DSIRE Note: “Old Solar Carve Out” refers to A.B. 3520, while “New Solar Carve Out” refers to S.B. 1925
Eligibility and SACP
SREC’s are generally designed to increase distributed generation market
penetration and focus specifically on smaller system sizes more suited to
residential or commercial scale. In some states, residential systems (<10-
20kw) can use estimated generation for SREC credits but this is starting to
change.
Solar Alternative Compliance Payments (SACPs) are effectively a price ceiling
for SREC’s, as they are the price a utility would pay if it cannot purchase
SRECs for a lower price. The existence of this mechanism encourages market
development but we believe it is unlikely that longer-term prices will rise above
a certain discount to these levels, given the attractive economics from SRECs
and relatively high prices for SACPs (~$300-400).
SRECs in Perspective
One of the most obvious benefits of an SREC is a notable reduction in the
payback time for a solar system. Given that 1 SREC is created for 1MWh, each
$100 in SREC prices is effectively equal to 10 cents per kwh. The average US
retail electricity price is only 12 cents per kwh, so we can see that the
economics improve with a functioning SREC market which is not dramatically
in oversupply. This has happened before (NJ specifically has been in relative
oversupply recently) which can cause a precipitous decline in SREC prices and
hurt the economics of legacy projects. However, state legislatures which
choose to implement RPS with a solar carve out may be more likely than
others to revise as needed.
SRECs in our Model
States with high insolation levels showed the greatest improvement in IRRs
because they produced the most SRECs.

26 October 2014
Clean Technology
Vivint Solar
Deutsche Bank Securities Inc. Page 37
Figure 46: Theoretical $100 SREC Project IRR
City, StateInsolation
(kWh/m2/day)
Cost of Electricity -
$/kWh (12 month
State average)
Base IRR
(No SRECs)$100 SREC IRR Change
Birmingham, Alabama 5.00 $0.11 3.37% 10.45% 7.08%
Anchorage, Alaska 2.09 $0.18 0.00%
Phoenix, Arizona 6.68 $0.11 8.48% 20.43% 11.95%
Little Rock, Arkansas 4.98 $0.09 0.53% 7.06% 6.53%
Los Angeles, California 6.06 $0.16 13.57% 25.65% 12.08%
Denver, Colorado 5.85 $0.12 6.44% 15.94% 9.49%
Bridgeport, Connecticut 4.54 $0.17 9.39% 16.88% 7.49%
Wilmington, Delaware 4.81 $0.14 5.80% 12.97% 7.17%
Washington, District of Columbia 4.87 $0.12 4.37% 11.39% 7.02%
Jacksonville, Florida 5.31 $0.12 4.75% 12.61% 7.87%
Atlanta, Georgia 5.09 $0.11 3.23% 10.48% 7.25%
Honolulu, Hawaii 5.97 $0.37 47.20% 65.75% 18.56%
Boise, Idaho 5.48 $0.09 0.86% 8.31% 7.45%
Chicago, Illinois 4.50 $0.11 1.43% 7.08% 5.65%
Indianapolis, Indiana 4.60 $0.10 1.02% 7.02% 6.00%
Des Moines, Iowa 4.72 $0.11 1.99% 8.26% 6.27%
Wichita, Kansas 5.33 $0.11 4.44% 12.44% 8.00%
Louisville, Kentucky 4.70 $0.09 5.77% 5.77%
New Orleans, Louisiana 5.12 $0.09 6.49% 6.49%
Portland, Maine 4.04 $0.15 4.14% 9.64% 5.49%
Baltimore, Maryland 4.85 $0.13 5.06% 12.14% 7.08%
Boston, Massachusetts 4.57 $0.15 6.42% 13.32% 6.90%
Detroit, Michigan 4.41 $0.14 5.19% 11.61% 6.42%
Minneapolis, Minnesota 4.56 $0.12 2.31% 8.47% 6.16%
Jackson, Mississippi 5.11 $0.10 2.31% 9.46% 7.16%
Kansas City, Missouri 4.97 $0.10 1.59% 8.33% 6.74%
Billings, Montana 4.98 $0.10 1.88% 8.61% 6.73%
Omaha, Nebraska 4.93 $0.10 1.40% 7.99% 6.59%
Las Vegas, Nevada 6.73 $0.12 9.61% 21.94% 12.34%
Manchester, New Hampshire 4.54 $0.16 8.02% 15.22% 7.20%
Newark, New Jersey 4.67 $0.16 7.80% 15.11% 7.31%
Albuquerque, New Mexico 6.60 $0.11 8.61% 20.40% 11.78%
New York, New York 4.62 $0.18 10.71% 18.76% 8.05%
Charlotte, North Carolina 5.19 $0.11 3.30% 10.73% 7.42%
Fargo, North Dakota 5.16 $0.09 0.79% 7.58% 6.80%
Columbus, Ohio 4.48 $0.12 2.26% 8.25% 5.99%
Oklahoma City, Oklahoma 5.41 $0.09 1.80% 9.39% 7.59%
Portland, Oregon 4.04 $0.10 3.04% 3.04%
Philadelphia, Pennsylvania 4.72 $0.13 4.37% 11.08% 6.71%
Providence, Rhode Island 4.59 $0.15 6.53% 13.51% 6.98%
Columbia, South Carolina 5.22 $0.12 4.61% 12.49% 7.88%
Sioux Falls, South Dakota 4.75 $0.10 0.88% 7.02% 6.14%
Memphis, Tennessee 4.99 $0.10 1.64% 8.34% 6.71%
Houston, Texas 4.96 $0.11 3.08% 10.05% 6.97%
Salt Lake City, Utah 5.51 $0.10 3.06% 11.07% 8.01%
Burlington, Vermont 4.30 $0.17 8.30% 15.18% 6.89%
Virginia Beach, Virginia 4.93 $0.11 2.72% 9.45% 6.73%
Seattle, Washington 3.98 $0.09 0.71% 0.71%
Charleston, West Virginia 4.50 $0.10 5.24% 5.24%
Milwaukee, Wisconsin 4.54 $0.13 4.65% 11.17% 6.52%
Cheyenne, Wyoming 5.53 $0.10 3.19% 11.18% 7.99% Source: Deutsche Bank, NREL

26 October 2014
Clean Technology
Vivint Solar
Page 38 Deutsche Bank Securities Inc.
Effect of Leverage on Model
We conducted a basic scenario analysis and lowered the equity contribution
from 100% to 50% in 10% increments using the same assumptions in previous
iterations ($3/w gross cost, 6 Year $100 SRECs, 30% ITC, etc). We use a 7.5%
cost of debt and 20 year payment term. Although some markets cannot
sustain their own projects, we see returns increasing notably across the most
important markets as leverage is added.

26 October 2014
Clean Technology
Vivint Solar
Deutsche Bank Securities Inc. Page 39
Figure 47: Debt on our Model
City, StateIRR (100%
equity)
IRR (90%
Equity)
IRR (80%
Equity)
IRR (70%
Equity)
IRR (60%
Equity)
IRR (50%
Equity)
Birmingham, Alabama 3.42% 2.69% 1.67% 0.15% - -
Anchorage, Alaska - - - - - -
Phoenix, Arizona 8.53% 8.72% 8.97% 9.38% 10.09% 11.74%
Little Rock, Arkansas 0.61% - - - - -
Los Angeles, California 13.68% 14.80% 16.43% 19.08% 23.89% 34.23%
Denver, Colorado 6.50% 6.32% 6.08% 5.70% 5.06% 3.77%
Bridgeport, Connecticut 9.42% 9.76% 10.25% 11.00% 12.37% 15.50%
Wilmington, Delaware 12.97% 14.28% 16.41% 20.12% 26.61% 52.27%
Washington, District of Columbia 11.39% 12.33% 13.89% 16.88% 21.74% 42.11%
Jacksonville, Florida 4.71% 4.22% 3.53% 2.49% 0.79% -
Atlanta, Georgia 3.30% 2.56% 1.51% - - -
Honolulu, Hawaii 47.11% 55.89% 71.09% 104.46% 243.33% -
Boise, Idaho 0.94% - - - - -
Chicago, Illinois 1.30% 0.18% - - - -
Indianapolis, Indiana 1.11% - - - - -
Des Moines, Iowa 1.99% 1.01% - - - -
Wichita, Kansas 4.54% 4.02% 3.28% 2.18% 0.37% -
Louisville, Kentucky 5.77% 5.33% 4.57% 3.01% - -
New Orleans, Louisiana - - - - - -
Portland, Maine 4.13% 3.54% 2.70% 1.44% - -
Baltimore, Maryland 12.14% 13.26% 15.10% 18.54% 24.12% 47.04%
Boston, Massachusetts 13.32% 14.68% 16.90% 20.69% 27.33% 52.97%
Detroit, Michigan 5.26% 4.87% 4.32% 3.48% 2.09% -
Minneapolis, Minnesota 2.40% 1.49% 0.20% - - -
Jackson, Mississippi 2.43% 1.53% 0.25% - - -
Kansas City, Missouri 1.69% 0.65% - - - -
Billings, Montana 1.91% 0.91% - - - -
Omaha, Nebraska 1.47% 0.37% - - - -
Las Vegas, Nevada 9.59% 9.95% 10.48% 11.30% 12.79% 16.16%
Manchester, New Hampshire 8.06% 8.16% 8.30% 8.51% 8.89% 9.74%
Newark, New Jersey 15.11% 16.91% 19.80% 24.10% 32.87% 66.19%
Albuquerque, New Mexico 8.65% 8.85% 9.14% 9.59% 10.39% 12.24%
New York, New York 10.83% 11.42% 12.27% 13.61% 16.11% 21.23%
Charlotte, North Carolina 10.73% 11.53% 12.88% 15.55% 19.92% 39.78%
Fargo, North Dakota 0.80% - - - - -
Columbus, Ohio 8.25% 8.43% 8.73% 9.31% 10.53% 8.96%
Oklahoma City, Oklahoma 1.93% 0.93% - - - -
Portland, Oregon - - - - - -
Philadelphia, Pennsylvania 11.08% 11.94% 13.35% 16.06% 20.57% 39.00%
Providence, Rhode Island 6.57% 6.41% 6.18% 5.82% 5.22% 4.02%
Columbia, South Carolina 4.75% 4.27% 3.59% 2.56% 0.87% -
Sioux Falls, South Dakota 0.91% - - - - -
Memphis, Tennessee 1.68% 0.63% - - - -
Houston, Texas 3.14% 2.37% 1.27% - - -
Salt Lake City, Utah 3.15% 2.38% 1.29% - - -
Burlington, Vermont 8.42% 8.58% 8.81% 9.16% 9.79% 11.23%
Virginia Beach, Virginia 9.45% 9.93% 10.74% 12.34% 15.15% 28.04%
Seattle, Washington - - - - - -
Charleston, West Virginia 5.24% 4.67% 3.69% 1.72% - -
Milwaukee, Wisconsin 4.70% 4.21% 3.51% 2.47% 0.75% -
Cheyenne, Wyoming 3.21% 2.45% 1.37% - - - Source: Deutsche Bank estimates

26 October 2014
Clean Technology
Vivint Solar
Page 40 Deutsche Bank Securities Inc.
Management
Greg Butterfield (CEO) - Gregory S. Butterfield is Vivint Solar’s CEO and
President since Sep 2013. He also became a member of the company’s board
in Mar 2014. Prior to joining Vivint Solar, Mr. Butterfield was a managing
partner at SageCreek Partners (from 2008 to 2013). He has also served as a
director for RES Software, Needle Inc., Omniture Inc., Utah Valley University
and Utah’s Technology Council. Mr. Butterfield was also the group president of
Symantec Corporation, and CEO of Altiris Inc. He holds a bachelor of science
degree in business administration and finance from Brigham Young University.
Dana C. Russell (CFO) - Dana C. Russell is Vivint Solar’s CFO and Executive
Vice President since Nov 2013. Prior to joining Vivint Solar, he was the CFO of
Allegiance, Inc (Jan-Nov 2013). From May 2011 – Dec 2012, Mr. Russell was
an independent contractor and provided financial services and business
consulting to various organizations. He was the CFO of Novell, Inc. (from June
2006 to April 2011). He holds a master’s degree in accounting from Weber
State University and a CPA license in the State of Utah.
L. Chance Allred (Vice President of Sales) - L. Chance Allred is Vivint Solar’s
Vice President of Sales since Mar 2012. Prior to joining Vivint Solar, Mr. Allred
served as a founding partner and vice president of sales for Platinum
Protection (from Sep 2006 to Mar 2012). From Mar 2000 - Oct 2006, he served
in various positions for Vivint, Inc. (a home automation and security company
and Vivint Solar’s sister company). He holds a bachelor’s degree. in marketing
from Southern Utah University.
Paul S. Dickson (Vice President of Operations): Paul S. Dickson is Vivint Solar’s
Vice President of Operations since Nov 2013. Prior to this, he served as the
company’s Vice President of Financing (from May 2011 to Nov 2013). Before
joining Vivint Solar, he was the director of smart grid and energy management
for Vivint, Inc. from Dec 2010 to May 2011. Mr. Dickson also co-founded and
served as the president and CEO of Meter Solutions Pros, which was acquired
by Vivint, Inc. Mr. Dickson holds a Bachelor of Arts degree from Brigham
Young University.
Dwain A. Kinghorn (Chief Strategy and Innovations Officer) - Dwain A.
Kinghorn has been Vivint Solar’s Chief Strategy and Innovations Officer since
Mar 2014. Prior to joinig Vivint Solar, he served as a partner for SageCreek
Partners (from July 2008 to Mar 2014). From Apr 2007 to July 2008, Mr.
Kinghorn served as a vice president for Symantec Corporation; and from Oct
2000 to Apr 2007, he was the chief technology officer for Altiris, Inc. He has
also served as the CEO of Computing Edge (from May 1994 to Sep 2000). He
holds a degree in electrical and computer engineering from Brigham Young
University.

26 October 2014
Clean Technology
Vivint Solar
Deutsche Bank Securities Inc. Page 41
Appendix 1
Important Disclosures
Additional information available upon request
Disclosure checklist
Company Ticker Recent price* Disclosure
Vivint Solar VSLR.N 13.07 (USD) 23 Oct 14 1,7,8 *Prices are current as of the end of the previous trading session unless otherwise indicated and are sourced from local exchanges via Reuters, Bloomberg and other vendors . Data is sourced from Deutsche Bank and subject companies.
Important Disclosures Required by U.S. Regulators
Disclosures marked with an asterisk may also be required by at least one jurisdiction in addition to the United States. See Important Disclosures Required by Non-US Regulators and Explanatory Notes.
1. Within the past year, Deutsche Bank and/or its affiliate(s) has managed or co-managed a public or private offering for this company, for which it received fees.
7. Deutsche Bank and/or its affiliate(s) has received compensation from this company for the provision of investment banking or financial advisory services within the past year.
8. Deutsche Bank and/or its affiliate(s) expects to receive, or intends to seek, compensation for investment banking services from this company in the next three months.
Important Disclosures Required by Non-U.S. Regulators
Please also refer to disclosures in the Important Disclosures Required by US Regulators and the Explanatory Notes.
1. Within the past year, Deutsche Bank and/or its affiliate(s) has managed or co-managed a public or private offering for this company, for which it received fees.
7. Deutsche Bank and/or its affiliate(s) has received compensation from this company for the provision of investment banking or financial advisory services within the past year.
For disclosures pertaining to recommendations or estimates made on securities other than the primary subject of this research, please see the most recently published company report or visit our global disclosure look-up page on our website at http://gm.db.com/ger/disclosure/Disclosure.eqsr?ricCode=VSLR.N
Analyst Certification
The views expressed in this report accurately reflect the personal views of the undersigned lead analyst(s) about the subject issuer and the securities of the issuer. In addition, the undersigned lead analyst(s) has not and will not receive any compensation for providing a specific recommendation or view in this report. Vishal Shah

26 October 2014
Clean Technology
Vivint Solar
Page 42 Deutsche Bank Securities Inc.
Historical recommendations and target price: Vivint Solar (VSLR.N) (as of 10/23/2014)
0.00
2.00
4.00
6.00
8.00
10.00
12.00
14.00
16.00
18.00
Oct 14
Secu
rity
Pri
ce
Date
Previous Recommendations
Strong Buy Buy Market Perform Underperform Not Rated Suspended Rating
Current Recommendations
Buy Hold Sell Not Rated Suspended Rating
*New Recommendation Structure as of September 9,2002
Equity rating key Equity rating dispersion and banking relationships
Buy: Based on a current 12- month view of total share-holder return (TSR = percentage change in share price from current price to projected target price plus pro-jected dividend yield ) , we recommend that investors buy the stock. Sell: Based on a current 12-month view of total share-holder return, we recommend that investors sell the stock Hold: We take a neutral view on the stock 12-months out and, based on this time horizon, do not recommend either a Buy or Sell. Notes:
1. Newly issued research recommendations and target prices always supersede previously published research. 2. Ratings definitions prior to 27 January, 2007 were:
Buy: Expected total return (including dividends) of 10% or more over a 12-month period Hold: Expected total return (including dividends) between -10% and 10% over a 12-month period Sell: Expected total return (including dividends) of -10% or worse over a 12-month period
51 %47 %
2 %
52 %38 %
29 %0
100
200
300
400
500
600
Buy Hold Sell
North American Universe
Companies Covered Cos. w/ Banking Relationship

26 October 2014
Clean Technology
Vivint Solar
Deutsche Bank Securities Inc. Page 43
Regulatory Disclosures
1. Important Additional Conflict Disclosures Aside from within this report, important conflict disclosures can also be found at https://gm.db.com/equities under the
"Disclosures Lookup" and "Legal" tabs. Investors are strongly encouraged to review this information before investing.
2. Short-Term Trade Ideas Deutsche Bank equity research analysts sometimes have shorter-term trade ideas (known as SOLAR ideas) that are
consistent or inconsistent with Deutsche Bank's existing longer term ratings. These trade ideas can be found at the
SOLAR link at http://gm.db.com.
3. Country-Specific Disclosures Australia and New Zealand: This research, and any access to it, is intended only for "wholesale clients" within the
meaning of the Australian Corporations Act and New Zealand Financial Advisors Act respectively.
Brazil: The views expressed above accurately reflect personal views of the authors about the subject company(ies) and
its(their) securities, including in relation to Deutsche Bank. The compensation of the equity research analyst(s) is
indirectly affected by revenues deriving from the business and financial transactions of Deutsche Bank. In cases where
at least one Brazil based analyst (identified by a phone number starting with +55 country code) has taken part in the
preparation of this research report, the Brazil based analyst whose name appears first assumes primary responsibility for
its content from a Brazilian regulatory perspective and for its compliance with CVM Instruction # 483.
EU countries: Disclosures relating to our obligations under MiFiD can be found at
http://www.globalmarkets.db.com/riskdisclosures.
Japan: Disclosures under the Financial Instruments and Exchange Law: Company name - Deutsche Securities Inc.
Registration number - Registered as a financial instruments dealer by the Head of the Kanto Local Finance Bureau
(Kinsho) No. 117. Member of associations: JSDA, Type II Financial Instruments Firms Association, The Financial Futures
Association of Japan, Japan Investment Advisers Association. Commissions and risks involved in stock transactions - for
stock transactions, we charge stock commissions and consumption tax by multiplying the transaction amount by the
commission rate agreed with each customer. Stock transactions can lead to losses as a result of share price fluctuations
and other factors. Transactions in foreign stocks can lead to additional losses stemming from foreign exchange
fluctuations. "Moody's", "Standard & Poor's", and "Fitch" mentioned in this report are not registered credit rating
agencies in Japan unless Japan or "Nippon" is specifically designated in the name of the entity. Reports on Japanese
listed companies not written by analysts of Deutsche Securities Inc. (DSI) are written by Deutsche Bank Group's analysts
with the coverage companies specified by DSI.
Malaysia: Deutsche Bank AG and/or its affiliate(s) may maintain positions in the securities referred to herein and may
from time to time offer those securities for purchase or may have an interest to purchase such securities. Deutsche Bank
may engage in transactions in a manner inconsistent with the views discussed herein.
Qatar: Deutsche Bank AG in the Qatar Financial Centre (registered no. 00032) is regulated by the Qatar Financial Centre
Regulatory Authority. Deutsche Bank AG - QFC Branch may only undertake the financial services activities that fall
within the scope of its existing QFCRA license. Principal place of business in the QFC: Qatar Financial Centre, Tower,
West Bay, Level 5, PO Box 14928, Doha, Qatar. This information has been distributed by Deutsche Bank AG. Related
financial products or services are only available to Business Customers, as defined by the Qatar Financial Centre
Regulatory Authority.
Russia: This information, interpretation and opinions submitted herein are not in the context of, and do not constitute,
any appraisal or evaluation activity requiring a license in the Russian Federation.
Kingdom of Saudi Arabia: Deutsche Securities Saudi Arabia LLC Company, (registered no. 07073-37) is regulated by the
Capital Market Authority. Deutsche Securities Saudi Arabia may only undertake the financial services activities that fall
within the scope of its existing CMA license. Principal place of business in Saudi Arabia: King Fahad Road, Al Olaya
District, P.O. Box 301809, Faisaliah Tower - 17th Floor, 11372 Riyadh, Saudi Arabia.
United Arab Emirates: Deutsche Bank AG in the Dubai International Financial Centre (registered no. 00045) is regulated
by the Dubai Financial Services Authority. Deutsche Bank AG - DIFC Branch may only undertake the financial services
activities that fall within the scope of its existing DFSA license. Principal place of business in the DIFC: Dubai
International Financial Centre, The Gate Village, Building 5, PO Box 504902, Dubai, U.A.E. This information has been
distributed by Deutsche Bank AG. Related financial products or services are only available to Professional Clients, as
defined by the Dubai Financial Services Authority.

David Folkerts-Landau Group Chief Economist
Member of the Group Executive Committee
Guy Ashton Global Chief Operating Officer
Research
Marcel Cassard Global Head
FICC Research & Global Macro Economics
Richard Smith and Steve Pollard Co-Global Heads Equity Research
Michael Spencer Regional Head
Asia Pacific Research
Ralf Hoffmann Regional Head
Deutsche Bank Research, Germany
Andreas Neubauer Regional Head
Equity Research, Germany
Steve Pollard Regional Head
Americas Research
International locations
Deutsche Bank AG
Deutsche Bank Place
Level 16
Corner of Hunter & Phillip Streets
Sydney, NSW 2000
Australia
Tel: (61) 2 8258 1234
Deutsche Bank AG
Große Gallusstraße 10-14
60272 Frankfurt am Main
Germany
Tel: (49) 69 910 00
Deutsche Bank AG
Filiale Hongkong
International Commerce Centre,
1 Austin Road West,Kowloon,
Hong Kong
Tel: (852) 2203 8888
Deutsche Securities Inc.
2-11-1 Nagatacho
Sanno Park Tower
Chiyoda-ku, Tokyo 100-6171
Japan
Tel: (81) 3 5156 6770
Deutsche Bank AG London
1 Great Winchester Street
London EC2N 2EQ
United Kingdom
Tel: (44) 20 7545 8000
Deutsche Bank Securities Inc.
60 Wall Street
New York, NY 10005
United States of America
Tel: (1) 212 250 2500
Global Disclaimer
The information and opinions in this report were prepared by Deutsche Bank AG or one of its affiliates (collectively "Deutsche Bank"). The information herein is believed to be reliable and has been obtained from public sources believed to be reliable. Deutsche Bank makes no representation as to the accuracy or completeness of such information.
Deutsche Bank may engage in securities transactions, on a proprietary basis or otherwise, in a manner inconsistent with the view taken in this research report. In addition, others within Deutsche Bank, including strategists and sales staff, may take a view that is inconsistent with that taken in this research report.
Opinions, estimates and projections in this report constitute the current judgement of the author as of the date of this report. They do not necessarily reflect the opinions of Deutsche Bank and are subject to change without notice. Deutsche Bank has no obligation to update, modify or amend this report or to otherwise notify a recipient thereof in the event that any opinion, forecast or estimate set forth herein, changes or subsequently becomes inaccurate. Prices and availability of financial instruments are subject to change without notice. This report is provided for informational purposes only. It is not an offer or a solicitation of an offer to buy or sell any financial instruments or to participate in any particular trading strategy. Target prices are inherently imprecise and a product of the analyst judgement.
In August 2009, Deutsche Bank instituted a new policy whereby analysts may choose not to set or maintain a target price of certain issuers under coverage with a Hold rating. In particular, this will typically occur for "Hold" rated stocks having a market cap smaller than most other companies in its sector or region. We believe that such policy will allow us to make best use of our resources. Please visit our website at http://gm.db.com to determine the target price of any stock.
The financial instruments discussed in this report may not be suitable for all investors and investors must make their own informed investment decisions. Stock transactions can lead to losses as a result of price fluctuations and other factors. If a financial instrument is denominated in a currency other than an investor's currency, a change in exchange rates may adversely affect the investment. Past performance is not necessarily indicative of future results. Deutsche Bank may with respect to securities covered by this report, sell to or buy from customers on a principal basis, and consider this report in deciding to trade on a proprietary basis. Prices are current as of the end of the previous trading session unless otherwise indicated and are sourced from local exchanges via Reuters, Bloomberg and other vendors. Data is sourced from Deutsche Bank and subject companies.
Unless governing law provides otherwise, all transactions should be executed through the Deutsche Bank entity in the investor's home jurisdiction. In the U.S. this report is approved and/or distributed by Deutsche Bank Securities Inc., a member of the NYSE, the NASD, NFA and SIPC. In Germany this report is approved and/or communicated by Deutsche Bank AG Frankfurt authorized by the BaFin. In the United Kingdom this report is approved and/or communicated by Deutsche Bank AG London, a member of the London Stock Exchange and regulated by the Financial Conduct Authority for the conduct of investment business in the UK and authorized by the BaFin. This report is distributed in Hong Kong by Deutsche Bank AG, Hong Kong Branch, in Korea by Deutsche Securities Korea Co. This report is distributed in Singapore by Deutsche Bank AG, Singapore Branch or Deutsche Securities Asia Limited, Singapore Branch (One Raffles Quay #18-00 South Tower Singapore 048583, +65 6423 8001), and recipients in Singapore of this report are to contact Deutsche Bank AG, Singapore Branch or Deutsche Securities Asia Limited, Singapore Branch in respect of any matters arising from, or in connection with, this report. Where this report is issued or promulgated in Singapore to a person who is not an accredited investor, expert investor or institutional investor (as defined in the applicable Singapore laws and regulations), Deutsche Bank AG, Singapore Branch or Deutsche Securities Asia Limited, Singapore Branch accepts legal responsibility to such person for the contents of this report. In Japan this report is approved and/or distributed by Deutsche Securities Inc. The information contained in this report does not constitute the provision of investment advice. In Australia, retail clients should obtain a copy of a Product Disclosure Statement (PDS) relating to any financial product referred to in this report and consider the PDS before making any decision about whether to acquire the product. Deutsche Bank AG Johannesburg is incorporated in the Federal Republic of Germany (Branch Register Number in South Africa: 1998/003298/10). Additional information relative to securities, other financial products or issuers discussed in this report is available upon request. This report may not be reproduced, distributed or published by any person for any purpose without Deutsche Bank's prior written consent. Please cite source when quoting.
Copyright © 2014 Deutsche Bank AG
![Vivint BD Deck[1] (Read-Only) - tcrntech.comtcrntech.com/wp-content/uploads/vivint_bd_deck.pdf · Security systems inflict.” “Instead of piecemeal gadgets and apps, Vivint sky](https://static.fdocuments.us/doc/165x107/5f661c5c500faa5bd3798fcf/vivint-bd-deck1-read-only-security-systems-inflicta-aoeinstead-of-piecemeal.jpg)