Rapeseed (Canola) and Products Tables · Total net exports 9,903 9,573 9,662 9,912 10,071 ... EU-28...
24
Rapeseed (Canola) and Products Tables
Transcript of Rapeseed (Canola) and Products Tables · Total net exports 9,903 9,573 9,662 9,912 10,071 ... EU-28...
Rapeseed (Canola) and Products Tables

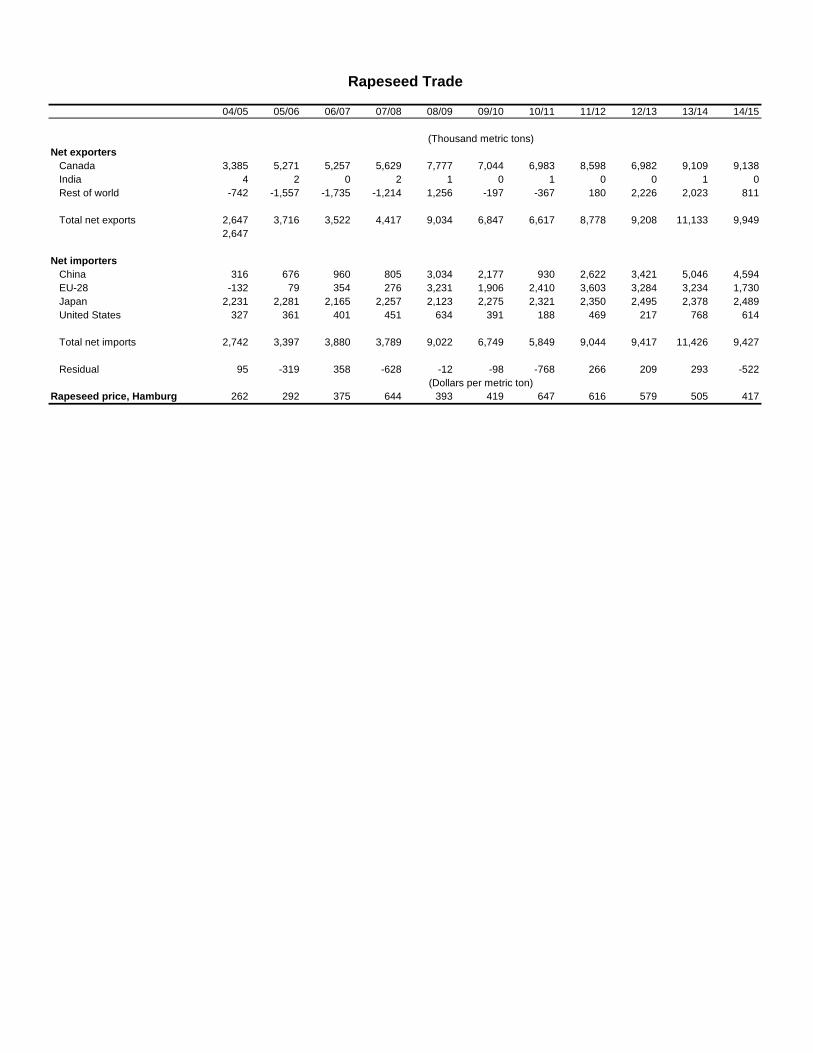
Rapeseed Trade Rapeseed Trade
04/05 05/06 06/07 07/08 08/09 09/10 10/11 11/12 12/13 13/14 14/15
(Thousand metric tons) (Thousand metric tons)
Net exporters
Canada 3,385 5,271 5,257 5,629 7,777 7,044 6,983 8,598 6,982 9,109 9,138
India 4 2 0 2 1 0 1 0 0 1 0
Rest of world -742 -1,557 -1,735 -1,214 1,256 -197 -367 180 2,226 2,023 811
Total net exports 2,647 3,716 3,522 4,417 9,034 6,847 6,617 8,778 9,208 11,133 9,949
2,647
Net importers
China 316 676 960 805 3,034 2,177 930 2,622 3,421 5,046 4,594
EU-28 -132 79 354 276 3,231 1,906 2,410 3,603 3,284 3,234 1,730
Japan 2,231 2,281 2,165 2,257 2,123 2,275 2,321 2,350 2,495 2,378 2,489
United States 327 361 401 451 634 391 188 469 217 768 614
Total net imports 2,742 3,397 3,880 3,789 9,022 6,749 5,849 9,044 9,417 11,426 9,427
Residual 95 -319 358 -628 -12 -98 -768 266 209 293 -522
(Dollars per metric ton) (Dollars per metric ton)
Rapeseed price, Hamburg 262 292 375 644 393 419 647 616 579 505 417
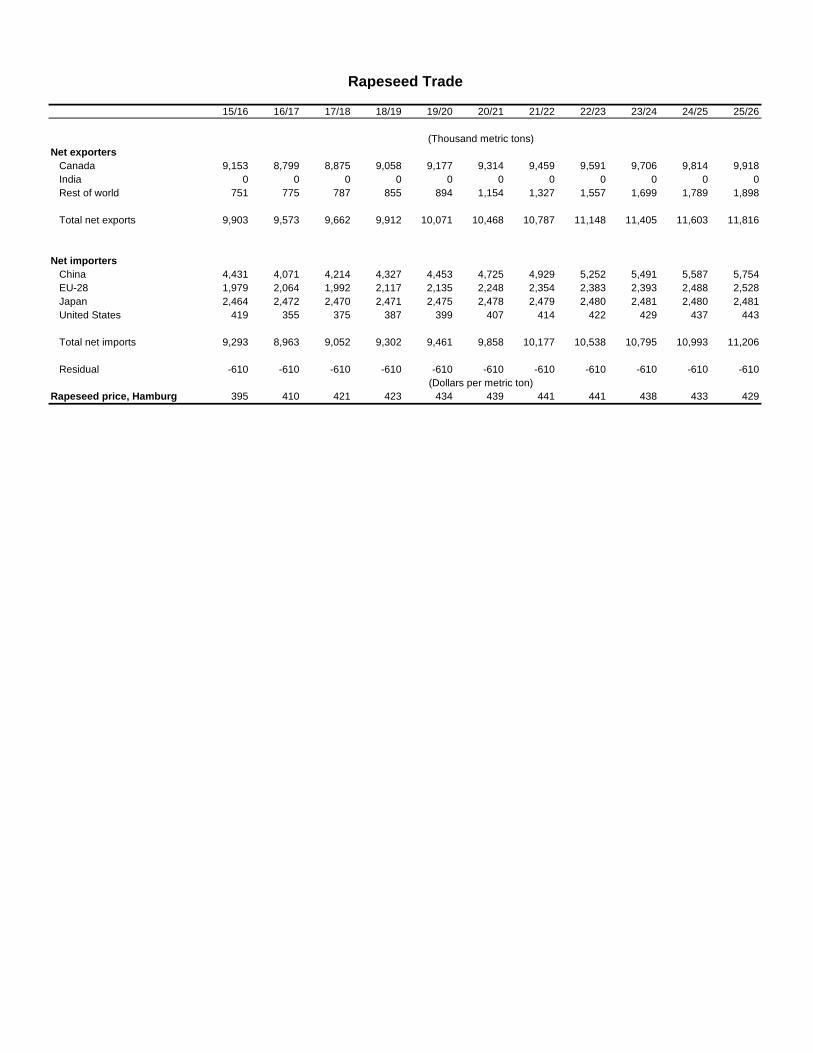
Rapeseed Trade
15/16 16/17 17/18 18/19 19/20 20/21 21/22 22/23 23/24 24/25 25/26
(Thousand metric tons)
Net exporters
Canada 9,153 8,799 8,875 9,058 9,177 9,314 9,459 9,591 9,706 9,814 9,918
India 0 0 0 0 0 0 0 0 0 0 0
Rest of world 751 775 787 855 894 1,154 1,327 1,557 1,699 1,789 1,898
Total net exports 9,903 9,573 9,662 9,912 10,071 10,468 10,787 11,148 11,405 11,603 11,816
Net importers
China 4,431 4,071 4,214 4,327 4,453 4,725 4,929 5,252 5,491 5,587 5,754
EU-28 1,979 2,064 1,992 2,117 2,135 2,248 2,354 2,383 2,393 2,488 2,528
Japan 2,464 2,472 2,470 2,471 2,475 2,478 2,479 2,480 2,481 2,480 2,481
United States 419 355 375 387 399 407 414 422 429 437 443
Total net imports 9,293 8,963 9,052 9,302 9,461 9,858 10,177 10,538 10,795 10,993 11,206
Residual -610 -610 -610 -610 -610 -610 -610 -610 -610 -610 -610
(Dollars per metric ton)
Rapeseed price, Hamburg 395 410 421 423 434 439 441 441 438 433 429
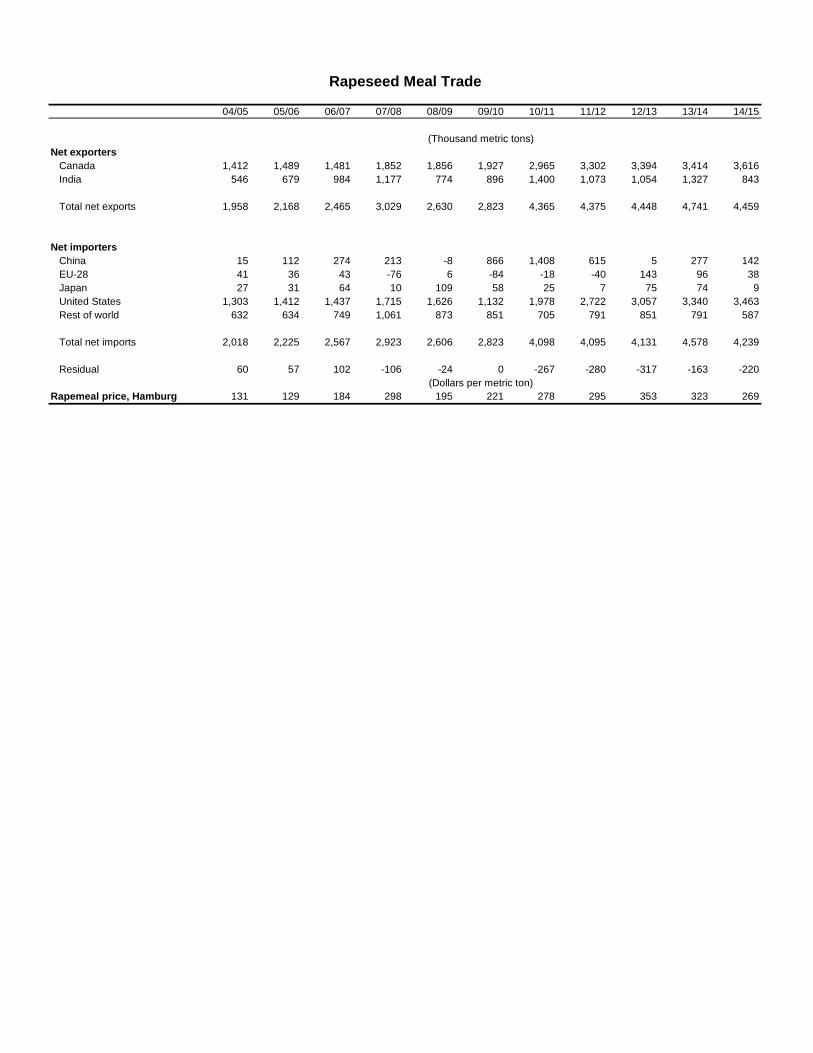
Rapeseed Meal Trade Rapeseed Meal Trade
04/05 05/06 06/07 07/08 08/09 09/10 10/11 11/12 12/13 13/14 14/15
(Thousand metric tons) (Thousand metric tons)
Net exporters
Canada 1,412 1,489 1,481 1,852 1,856 1,927 2,965 3,302 3,394 3,414 3,616
India 546 679 984 1,177 774 896 1,400 1,073 1,054 1,327 843
Total net exports 1,958 2,168 2,465 3,029 2,630 2,823 4,365 4,375 4,448 4,741 4,459
Net importers
China 15 112 274 213 -8 866 1,408 615 5 277 142
EU-28 41 36 43 -76 6 -84 -18 -40 143 96 38
Japan 27 31 64 10 109 58 25 7 75 74 9
United States 1,303 1,412 1,437 1,715 1,626 1,132 1,978 2,722 3,057 3,340 3,463
Rest of world 632 634 749 1,061 873 851 705 791 851 791 587
Total net imports 2,018 2,225 2,567 2,923 2,606 2,823 4,098 4,095 4,131 4,578 4,239
Residual 60 57 102 -106 -24 0 -267 -280 -317 -163 -220
(Dollars per metric ton) (Dollars per metric ton)
Rapemeal price, Hamburg 131 129 184 298 195 221 278 295 353 323 269
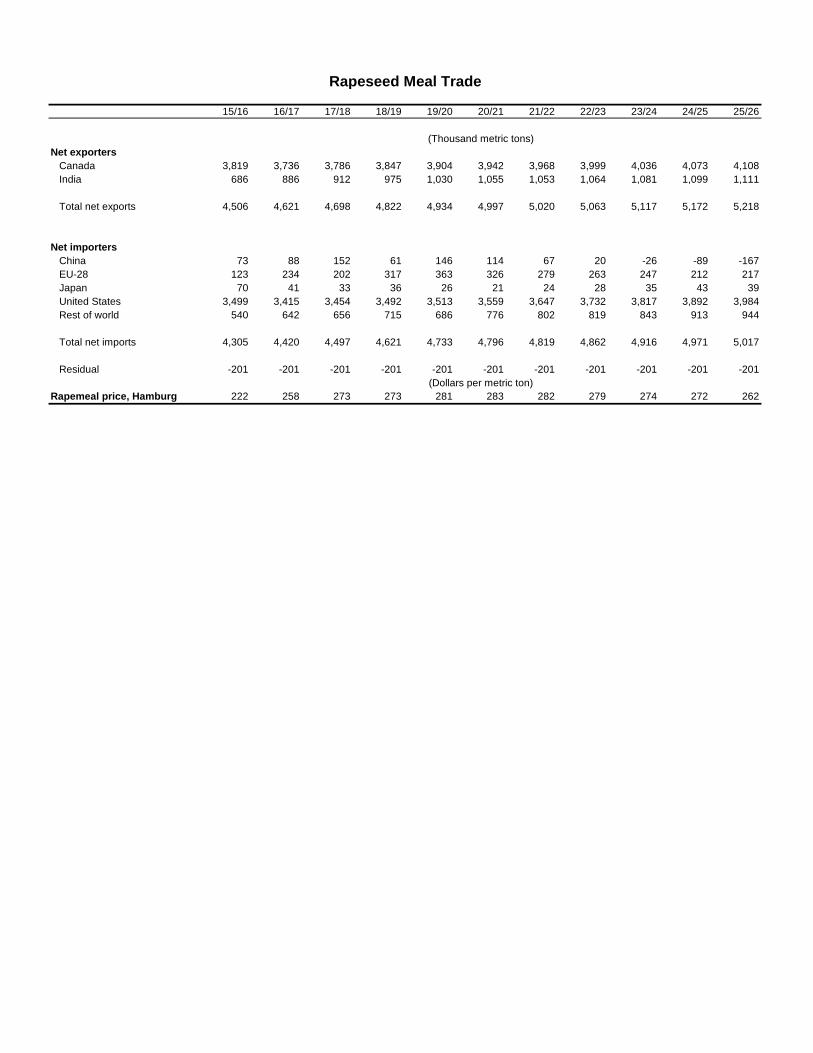
Rapeseed Meal Trade
15/16 16/17 17/18 18/19 19/20 20/21 21/22 22/23 23/24 24/25 25/26
(Thousand metric tons)
Net exporters
Canada 3,819 3,736 3,786 3,847 3,904 3,942 3,968 3,999 4,036 4,073 4,108
India 686 886 912 975 1,030 1,055 1,053 1,064 1,081 1,099 1,111
Total net exports 4,506 4,621 4,698 4,822 4,934 4,997 5,020 5,063 5,117 5,172 5,218
Net importers
China 73 88 152 61 146 114 67 20 -26 -89 -167
EU-28 123 234 202 317 363 326 279 263 247 212 217
Japan 70 41 33 36 26 21 24 28 35 43 39
United States 3,499 3,415 3,454 3,492 3,513 3,559 3,647 3,732 3,817 3,892 3,984
Rest of world 540 642 656 715 686 776 802 819 843 913 944
Total net imports 4,305 4,420 4,497 4,621 4,733 4,796 4,819 4,862 4,916 4,971 5,017
Residual -201 -201 -201 -201 -201 -201 -201 -201 -201 -201 -201
(Dollars per metric ton)
Rapemeal price, Hamburg 222 258 273 273 281 283 282 279 274 272 262
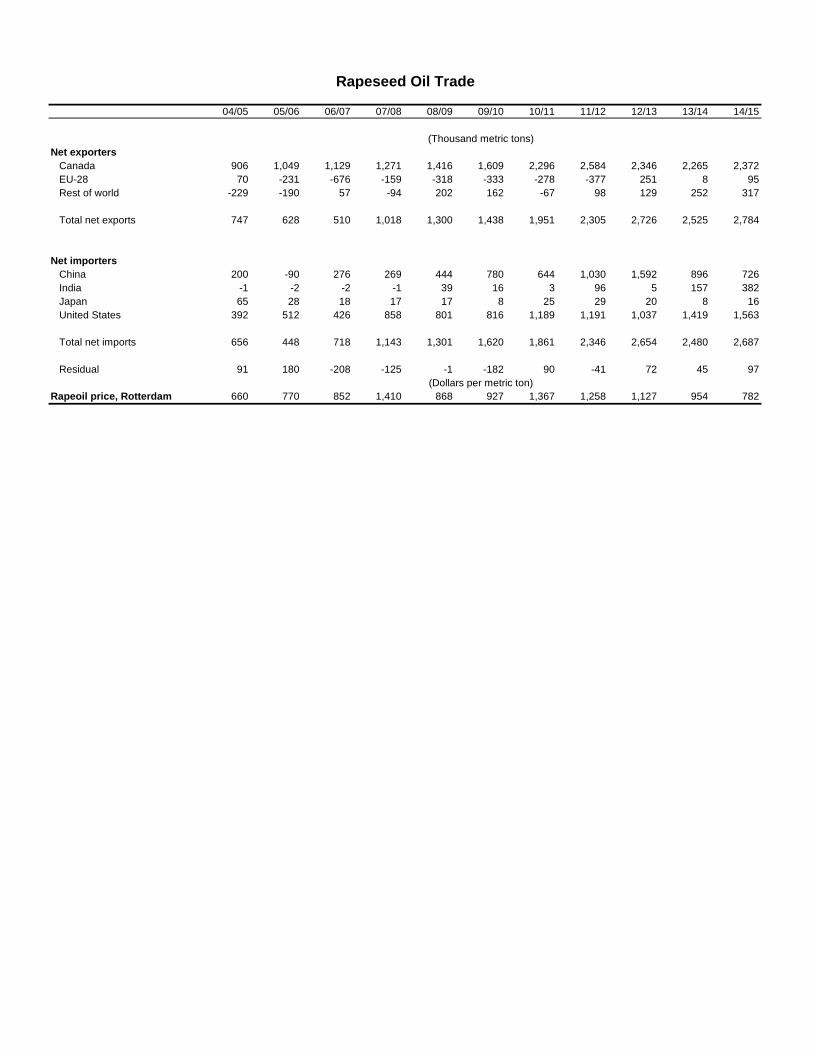
Rapeseed Oil Trade Rapeseed Oil Trade
04/05 05/06 06/07 07/08 08/09 09/10 10/11 11/12 12/13 13/14 14/15
(Thousand metric tons) (Thousand metric tons)
Net exporters
Canada 906 1,049 1,129 1,271 1,416 1,609 2,296 2,584 2,346 2,265 2,372
EU-28 70 -231 -676 -159 -318 -333 -278 -377 251 8 95
Rest of world -229 -190 57 -94 202 162 -67 98 129 252 317
Total net exports 747 628 510 1,018 1,300 1,438 1,951 2,305 2,726 2,525 2,784
Net importers
China 200 -90 276 269 444 780 644 1,030 1,592 896 726
India -1 -2 -2 -1 39 16 3 96 5 157 382
Japan 65 28 18 17 17 8 25 29 20 8 16
United States 392 512 426 858 801 816 1,189 1,191 1,037 1,419 1,563
Total net imports 656 448 718 1,143 1,301 1,620 1,861 2,346 2,654 2,480 2,687
Residual 91 180 -208 -125 -1 -182 90 -41 72 45 97
(Dollars per metric ton) (Dollars per metric ton)
Rapeoil price, Rotterdam 660 770 852 1,410 868 927 1,367 1,258 1,127 954 782
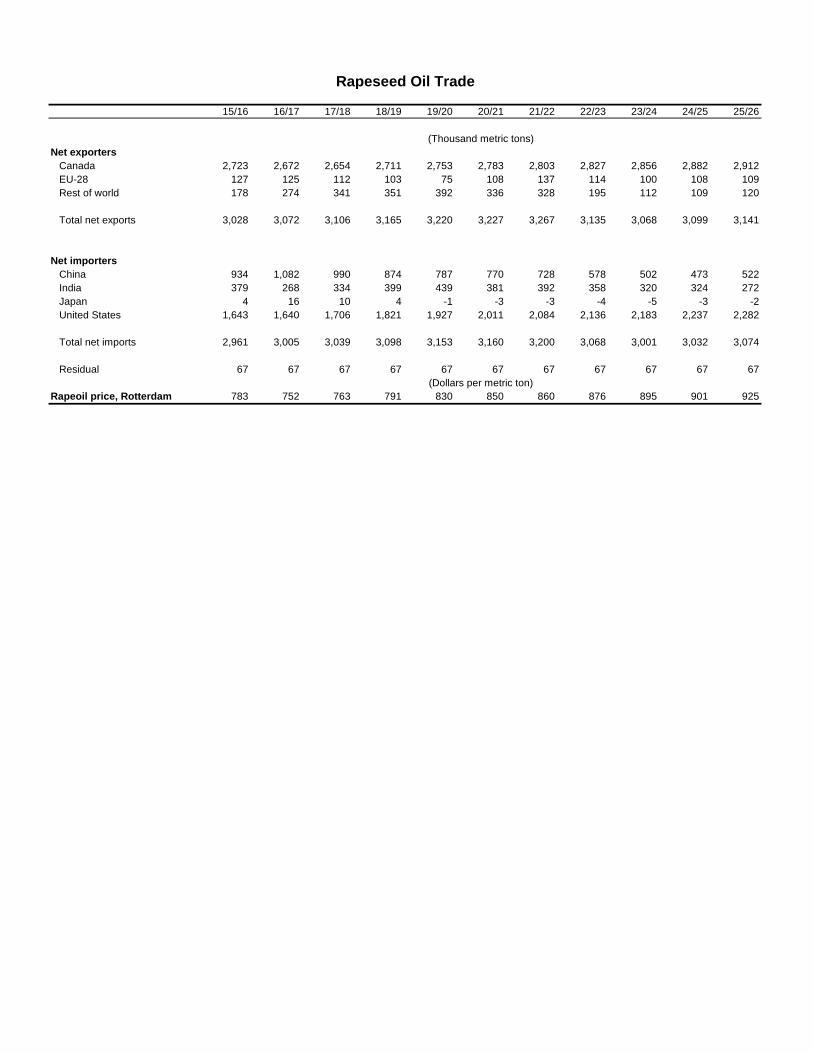
Rapeseed Oil Trade
15/16 16/17 17/18 18/19 19/20 20/21 21/22 22/23 23/24 24/25 25/26
(Thousand metric tons)
Net exporters
Canada 2,723 2,672 2,654 2,711 2,753 2,783 2,803 2,827 2,856 2,882 2,912
EU-28 127 125 112 103 75 108 137 114 100 108 109
Rest of world 178 274 341 351 392 336 328 195 112 109 120
Total net exports 3,028 3,072 3,106 3,165 3,220 3,227 3,267 3,135 3,068 3,099 3,141
Net importers
China 934 1,082 990 874 787 770 728 578 502 473 522
India 379 268 334 399 439 381 392 358 320 324 272
Japan 4 16 10 4 -1 -3 -3 -4 -5 -3 -2
United States 1,643 1,640 1,706 1,821 1,927 2,011 2,084 2,136 2,183 2,237 2,282
Total net imports 2,961 3,005 3,039 3,098 3,153 3,160 3,200 3,068 3,001 3,032 3,074
Residual 67 67 67 67 67 67 67 67 67 67 67
(Dollars per metric ton)
Rapeoil price, Rotterdam 783 752 763 791 830 850 860 876 895 901 925
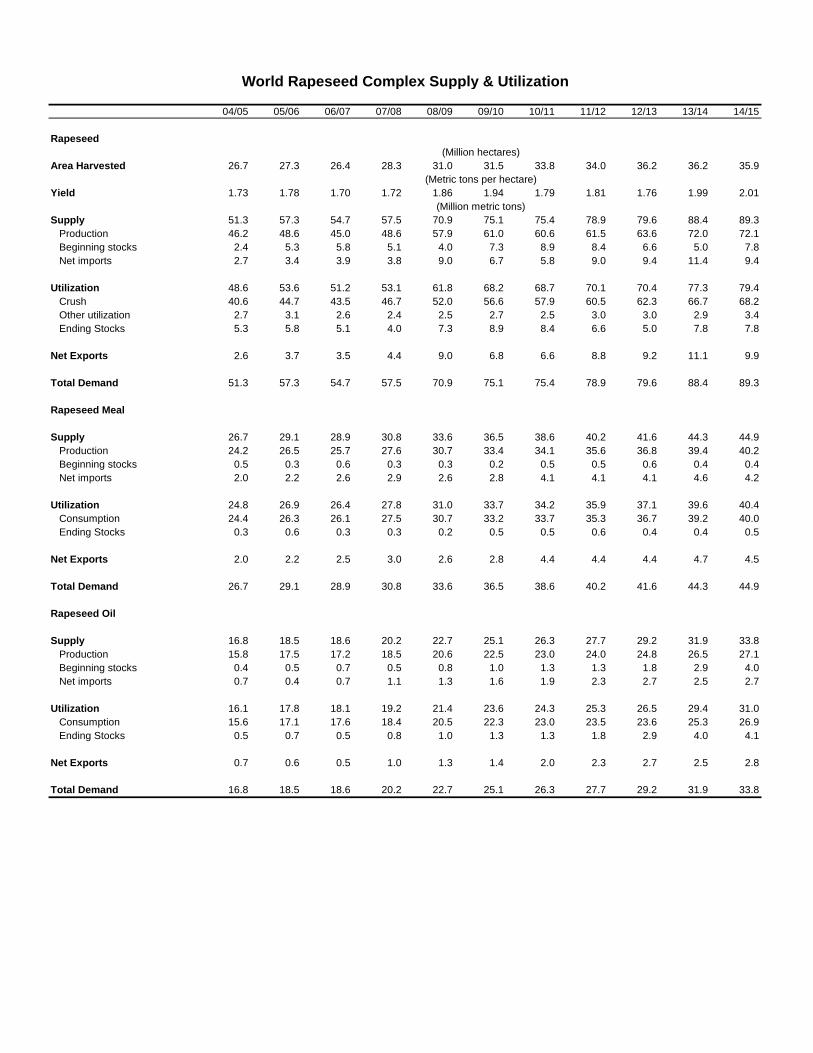
World Rapeseed Complex Supply & Utilization World Rapeseed Complex Supply & Utilization
04/05 05/06 06/07 07/08 08/09 09/10 10/11 11/12 12/13 13/14 14/15
Rapeseed
(Million hectares) (Million hectares)
Area Harvested 26.7 27.3 26.4 28.3 31.0 31.5 33.8 34.0 36.2 36.2 35.9
(Metric tons per hectare) (Metric tons per hectare)
Yield 1.73 1.78 1.70 1.72 1.86 1.94 1.79 1.81 1.76 1.99 2.01
(Million metric tons) (Million metric tons)
Supply 51.3 57.3 54.7 57.5 70.9 75.1 75.4 78.9 79.6 88.4 89.3
Production 46.2 48.6 45.0 48.6 57.9 61.0 60.6 61.5 63.6 72.0 72.1
Beginning stocks 2.4 5.3 5.8 5.1 4.0 7.3 8.9 8.4 6.6 5.0 7.8
Net imports 2.7 3.4 3.9 3.8 9.0 6.7 5.8 9.0 9.4 11.4 9.4
Utilization 48.6 53.6 51.2 53.1 61.8 68.2 68.7 70.1 70.4 77.3 79.4
Crush 40.6 44.7 43.5 46.7 52.0 56.6 57.9 60.5 62.3 66.7 68.2
Other utilization 2.7 3.1 2.6 2.4 2.5 2.7 2.5 3.0 3.0 2.9 3.4
Ending Stocks 5.3 5.8 5.1 4.0 7.3 8.9 8.4 6.6 5.0 7.8 7.8
Net Exports 2.6 3.7 3.5 4.4 9.0 6.8 6.6 8.8 9.2 11.1 9.9
Total Demand 51.3 57.3 54.7 57.5 70.9 75.1 75.4 78.9 79.6 88.4 89.3
Rapeseed Meal
Supply 26.7 29.1 28.9 30.8 33.6 36.5 38.6 40.2 41.6 44.3 44.9
Production 24.2 26.5 25.7 27.6 30.7 33.4 34.1 35.6 36.8 39.4 40.2
Beginning stocks 0.5 0.3 0.6 0.3 0.3 0.2 0.5 0.5 0.6 0.4 0.4
Net imports 2.0 2.2 2.6 2.9 2.6 2.8 4.1 4.1 4.1 4.6 4.2
Utilization 24.8 26.9 26.4 27.8 31.0 33.7 34.2 35.9 37.1 39.6 40.4
Consumption 24.4 26.3 26.1 27.5 30.7 33.2 33.7 35.3 36.7 39.2 40.0
Ending Stocks 0.3 0.6 0.3 0.3 0.2 0.5 0.5 0.6 0.4 0.4 0.5
Net Exports 2.0 2.2 2.5 3.0 2.6 2.8 4.4 4.4 4.4 4.7 4.5
Total Demand 26.7 29.1 28.9 30.8 33.6 36.5 38.6 40.2 41.6 44.3 44.9
Rapeseed Oil
Supply 16.8 18.5 18.6 20.2 22.7 25.1 26.3 27.7 29.2 31.9 33.8
Production 15.8 17.5 17.2 18.5 20.6 22.5 23.0 24.0 24.8 26.5 27.1
Beginning stocks 0.4 0.5 0.7 0.5 0.8 1.0 1.3 1.3 1.8 2.9 4.0
Net imports 0.7 0.4 0.7 1.1 1.3 1.6 1.9 2.3 2.7 2.5 2.7
Utilization 16.1 17.8 18.1 19.2 21.4 23.6 24.3 25.3 26.5 29.4 31.0
Consumption 15.6 17.1 17.6 18.4 20.5 22.3 23.0 23.5 23.6 25.3 26.9
Ending Stocks 0.5 0.7 0.5 0.8 1.0 1.3 1.3 1.8 2.9 4.0 4.1
Net Exports 0.7 0.6 0.5 1.0 1.3 1.4 2.0 2.3 2.7 2.5 2.8
Total Demand 16.8 18.5 18.6 20.2 22.7 25.1 26.3 27.7 29.2 31.9 33.8
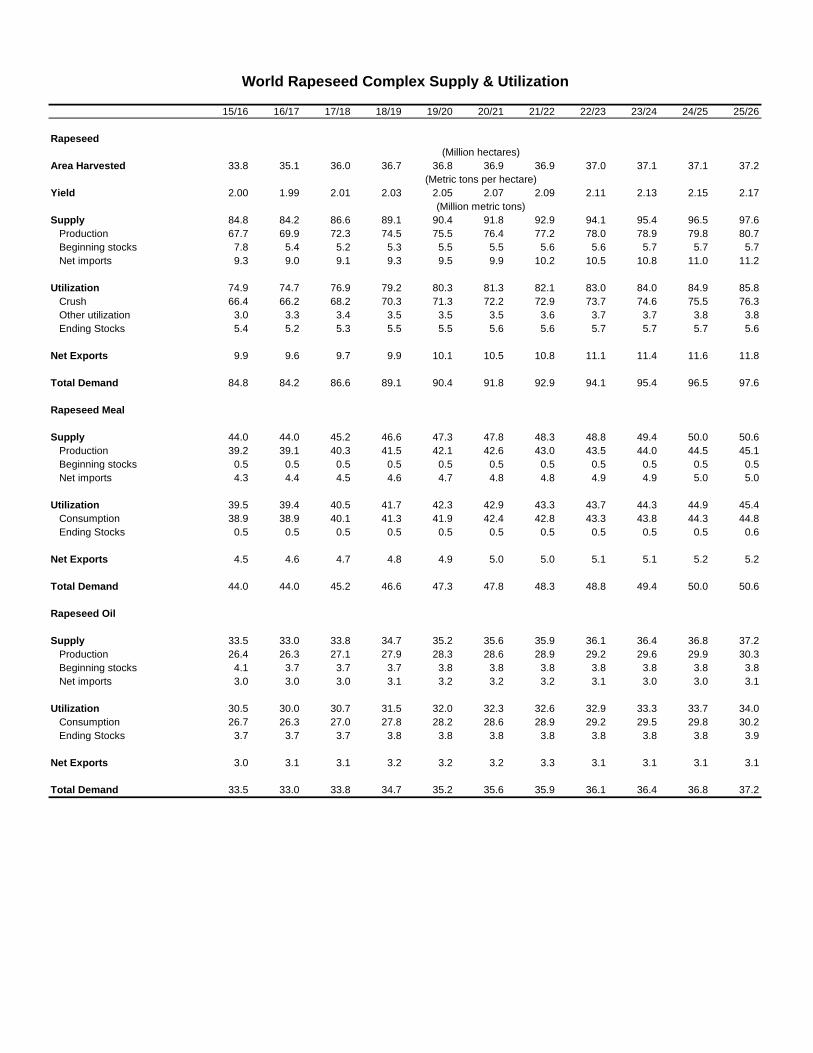
World Rapeseed Complex Supply & Utilization
15/16 16/17 17/18 18/19 19/20 20/21 21/22 22/23 23/24 24/25 25/26
Rapeseed
(Million hectares)
Area Harvested 33.8 35.1 36.0 36.7 36.8 36.9 36.9 37.0 37.1 37.1 37.2
(Metric tons per hectare)
Yield 2.00 1.99 2.01 2.03 2.05 2.07 2.09 2.11 2.13 2.15 2.17
(Million metric tons)
Supply 84.8 84.2 86.6 89.1 90.4 91.8 92.9 94.1 95.4 96.5 97.6
Production 67.7 69.9 72.3 74.5 75.5 76.4 77.2 78.0 78.9 79.8 80.7
Beginning stocks 7.8 5.4 5.2 5.3 5.5 5.5 5.6 5.6 5.7 5.7 5.7
Net imports 9.3 9.0 9.1 9.3 9.5 9.9 10.2 10.5 10.8 11.0 11.2
Utilization 74.9 74.7 76.9 79.2 80.3 81.3 82.1 83.0 84.0 84.9 85.8
Crush 66.4 66.2 68.2 70.3 71.3 72.2 72.9 73.7 74.6 75.5 76.3
Other utilization 3.0 3.3 3.4 3.5 3.5 3.5 3.6 3.7 3.7 3.8 3.8
Ending Stocks 5.4 5.2 5.3 5.5 5.5 5.6 5.6 5.7 5.7 5.7 5.6
Net Exports 9.9 9.6 9.7 9.9 10.1 10.5 10.8 11.1 11.4 11.6 11.8
Total Demand 84.8 84.2 86.6 89.1 90.4 91.8 92.9 94.1 95.4 96.5 97.6
Rapeseed Meal
Supply 44.0 44.0 45.2 46.6 47.3 47.8 48.3 48.8 49.4 50.0 50.6
Production 39.2 39.1 40.3 41.5 42.1 42.6 43.0 43.5 44.0 44.5 45.1
Beginning stocks 0.5 0.5 0.5 0.5 0.5 0.5 0.5 0.5 0.5 0.5 0.5
Net imports 4.3 4.4 4.5 4.6 4.7 4.8 4.8 4.9 4.9 5.0 5.0
Utilization 39.5 39.4 40.5 41.7 42.3 42.9 43.3 43.7 44.3 44.9 45.4
Consumption 38.9 38.9 40.1 41.3 41.9 42.4 42.8 43.3 43.8 44.3 44.8
Ending Stocks 0.5 0.5 0.5 0.5 0.5 0.5 0.5 0.5 0.5 0.5 0.6
Net Exports 4.5 4.6 4.7 4.8 4.9 5.0 5.0 5.1 5.1 5.2 5.2
Total Demand 44.0 44.0 45.2 46.6 47.3 47.8 48.3 48.8 49.4 50.0 50.6
Rapeseed Oil
Supply 33.5 33.0 33.8 34.7 35.2 35.6 35.9 36.1 36.4 36.8 37.2
Production 26.4 26.3 27.1 27.9 28.3 28.6 28.9 29.2 29.6 29.9 30.3
Beginning stocks 4.1 3.7 3.7 3.7 3.8 3.8 3.8 3.8 3.8 3.8 3.8
Net imports 3.0 3.0 3.0 3.1 3.2 3.2 3.2 3.1 3.0 3.0 3.1
Utilization 30.5 30.0 30.7 31.5 32.0 32.3 32.6 32.9 33.3 33.7 34.0
Consumption 26.7 26.3 27.0 27.8 28.2 28.6 28.9 29.2 29.5 29.8 30.2
Ending Stocks 3.7 3.7 3.7 3.8 3.8 3.8 3.8 3.8 3.8 3.8 3.9
Net Exports 3.0 3.1 3.1 3.2 3.2 3.2 3.3 3.1 3.1 3.1 3.1
Total Demand 33.5 33.0 33.8 34.7 35.2 35.6 35.9 36.1 36.4 36.8 37.2
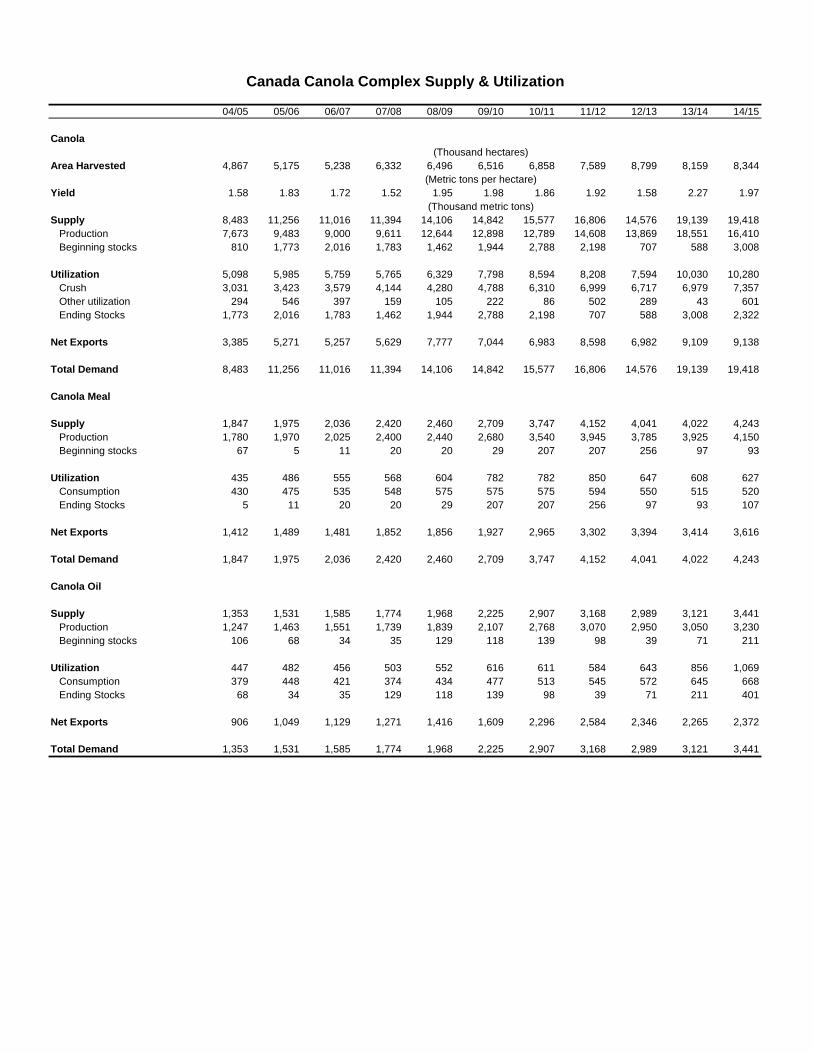
Canada Canola Complex Supply & Utilization Canada Canola Complex Supply & Utilization
04/05 05/06 06/07 07/08 08/09 09/10 10/11 11/12 12/13 13/14 14/15
Canola
(Thousand hectares) (Thousand hectares)
Area Harvested 4,867 5,175 5,238 6,332 6,496 6,516 6,858 7,589 8,799 8,159 8,344
(Metric tons per hectare) (Metric tons per hectare)
Yield 1.58 1.83 1.72 1.52 1.95 1.98 1.86 1.92 1.58 2.27 1.97
(Thousand metric tons) (Thousand metric tons)
Supply 8,483 11,256 11,016 11,394 14,106 14,842 15,577 16,806 14,576 19,139 19,418
Production 7,673 9,483 9,000 9,611 12,644 12,898 12,789 14,608 13,869 18,551 16,410
Beginning stocks 810 1,773 2,016 1,783 1,462 1,944 2,788 2,198 707 588 3,008
Utilization 5,098 5,985 5,759 5,765 6,329 7,798 8,594 8,208 7,594 10,030 10,280
Crush 3,031 3,423 3,579 4,144 4,280 4,788 6,310 6,999 6,717 6,979 7,357
Other utilization 294 546 397 159 105 222 86 502 289 43 601
Ending Stocks 1,773 2,016 1,783 1,462 1,944 2,788 2,198 707 588 3,008 2,322
Net Exports 3,385 5,271 5,257 5,629 7,777 7,044 6,983 8,598 6,982 9,109 9,138
Total Demand 8,483 11,256 11,016 11,394 14,106 14,842 15,577 16,806 14,576 19,139 19,418
Canola Meal
Supply 1,847 1,975 2,036 2,420 2,460 2,709 3,747 4,152 4,041 4,022 4,243
Production 1,780 1,970 2,025 2,400 2,440 2,680 3,540 3,945 3,785 3,925 4,150
Beginning stocks 67 5 11 20 20 29 207 207 256 97 93
Utilization 435 486 555 568 604 782 782 850 647 608 627
Consumption 430 475 535 548 575 575 575 594 550 515 520
Ending Stocks 5 11 20 20 29 207 207 256 97 93 107
Net Exports 1,412 1,489 1,481 1,852 1,856 1,927 2,965 3,302 3,394 3,414 3,616
Total Demand 1,847 1,975 2,036 2,420 2,460 2,709 3,747 4,152 4,041 4,022 4,243
Canola Oil
Supply 1,353 1,531 1,585 1,774 1,968 2,225 2,907 3,168 2,989 3,121 3,441
Production 1,247 1,463 1,551 1,739 1,839 2,107 2,768 3,070 2,950 3,050 3,230
Beginning stocks 106 68 34 35 129 118 139 98 39 71 211
Utilization 447 482 456 503 552 616 611 584 643 856 1,069
Consumption 379 448 421 374 434 477 513 545 572 645 668
Ending Stocks 68 34 35 129 118 139 98 39 71 211 401
Net Exports 906 1,049 1,129 1,271 1,416 1,609 2,296 2,584 2,346 2,265 2,372
Total Demand 1,353 1,531 1,585 1,774 1,968 2,225 2,907 3,168 2,989 3,121 3,441
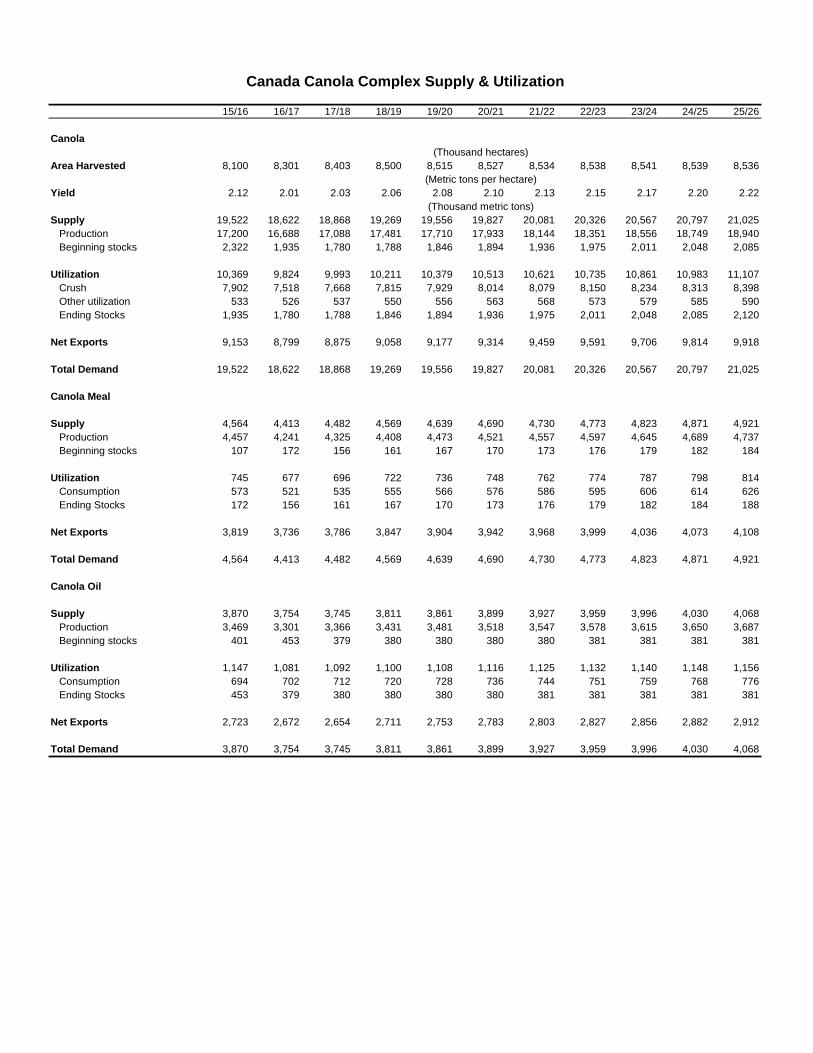
Canada Canola Complex Supply & Utilization
15/16 16/17 17/18 18/19 19/20 20/21 21/22 22/23 23/24 24/25 25/26
Canola
(Thousand hectares)
Area Harvested 8,100 8,301 8,403 8,500 8,515 8,527 8,534 8,538 8,541 8,539 8,536
(Metric tons per hectare)
Yield 2.12 2.01 2.03 2.06 2.08 2.10 2.13 2.15 2.17 2.20 2.22
(Thousand metric tons)
Supply 19,522 18,622 18,868 19,269 19,556 19,827 20,081 20,326 20,567 20,797 21,025
Production 17,200 16,688 17,088 17,481 17,710 17,933 18,144 18,351 18,556 18,749 18,940
Beginning stocks 2,322 1,935 1,780 1,788 1,846 1,894 1,936 1,975 2,011 2,048 2,085
Utilization 10,369 9,824 9,993 10,211 10,379 10,513 10,621 10,735 10,861 10,983 11,107
Crush 7,902 7,518 7,668 7,815 7,929 8,014 8,079 8,150 8,234 8,313 8,398
Other utilization 533 526 537 550 556 563 568 573 579 585 590
Ending Stocks 1,935 1,780 1,788 1,846 1,894 1,936 1,975 2,011 2,048 2,085 2,120
Net Exports 9,153 8,799 8,875 9,058 9,177 9,314 9,459 9,591 9,706 9,814 9,918
Total Demand 19,522 18,622 18,868 19,269 19,556 19,827 20,081 20,326 20,567 20,797 21,025
Canola Meal
Supply 4,564 4,413 4,482 4,569 4,639 4,690 4,730 4,773 4,823 4,871 4,921
Production 4,457 4,241 4,325 4,408 4,473 4,521 4,557 4,597 4,645 4,689 4,737
Beginning stocks 107 172 156 161 167 170 173 176 179 182 184
Utilization 745 677 696 722 736 748 762 774 787 798 814
Consumption 573 521 535 555 566 576 586 595 606 614 626
Ending Stocks 172 156 161 167 170 173 176 179 182 184 188
Net Exports 3,819 3,736 3,786 3,847 3,904 3,942 3,968 3,999 4,036 4,073 4,108
Total Demand 4,564 4,413 4,482 4,569 4,639 4,690 4,730 4,773 4,823 4,871 4,921
Canola Oil
Supply 3,870 3,754 3,745 3,811 3,861 3,899 3,927 3,959 3,996 4,030 4,068
Production 3,469 3,301 3,366 3,431 3,481 3,518 3,547 3,578 3,615 3,650 3,687
Beginning stocks 401 453 379 380 380 380 380 381 381 381 381
Utilization 1,147 1,081 1,092 1,100 1,108 1,116 1,125 1,132 1,140 1,148 1,156
Consumption 694 702 712 720 728 736 744 751 759 768 776
Ending Stocks 453 379 380 380 380 380 381 381 381 381 381
Net Exports 2,723 2,672 2,654 2,711 2,753 2,783 2,803 2,827 2,856 2,882 2,912
Total Demand 3,870 3,754 3,745 3,811 3,861 3,899 3,927 3,959 3,996 4,030 4,068
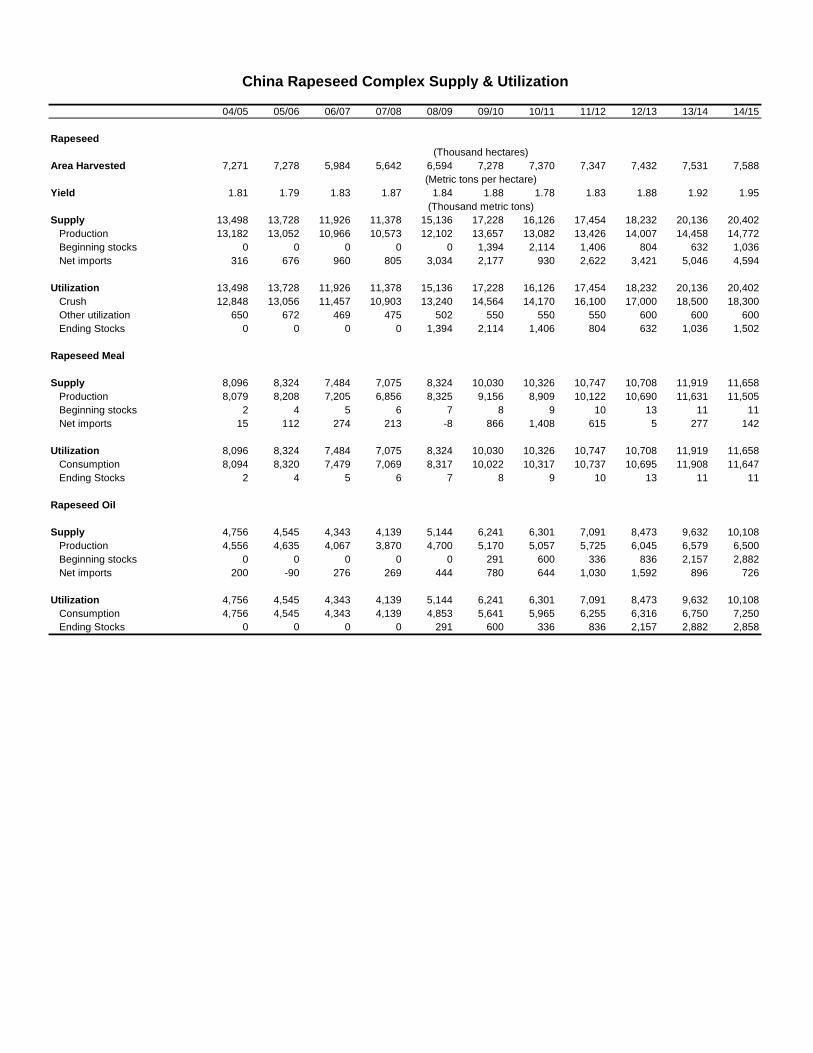
China Rapeseed Complex Supply & Utilization China Rapeseed Complex Supply & Utilization
04/05 05/06 06/07 07/08 08/09 09/10 10/11 11/12 12/13 13/14 14/15
Rapeseed
(Thousand hectares) (Thousand hectares)
Area Harvested 7,271 7,278 5,984 5,642 6,594 7,278 7,370 7,347 7,432 7,531 7,588
(Metric tons per hectare) (Metric tons per hectare)
Yield 1.81 1.79 1.83 1.87 1.84 1.88 1.78 1.83 1.88 1.92 1.95
(Thousand metric tons) (Thousand metric tons)
Supply 13,498 13,728 11,926 11,378 15,136 17,228 16,126 17,454 18,232 20,136 20,402
Production 13,182 13,052 10,966 10,573 12,102 13,657 13,082 13,426 14,007 14,458 14,772
Beginning stocks 0 0 0 0 0 1,394 2,114 1,406 804 632 1,036
Net imports 316 676 960 805 3,034 2,177 930 2,622 3,421 5,046 4,594
Utilization 13,498 13,728 11,926 11,378 15,136 17,228 16,126 17,454 18,232 20,136 20,402
Crush 12,848 13,056 11,457 10,903 13,240 14,564 14,170 16,100 17,000 18,500 18,300
Other utilization 650 672 469 475 502 550 550 550 600 600 600
Ending Stocks 0 0 0 0 1,394 2,114 1,406 804 632 1,036 1,502
Rapeseed Meal
Supply 8,096 8,324 7,484 7,075 8,324 10,030 10,326 10,747 10,708 11,919 11,658
Production 8,079 8,208 7,205 6,856 8,325 9,156 8,909 10,122 10,690 11,631 11,505
Beginning stocks 2 4 5 6 7 8 9 10 13 11 11
Net imports 15 112 274 213 -8 866 1,408 615 5 277 142
Utilization 8,096 8,324 7,484 7,075 8,324 10,030 10,326 10,747 10,708 11,919 11,658
Consumption 8,094 8,320 7,479 7,069 8,317 10,022 10,317 10,737 10,695 11,908 11,647
Ending Stocks 2 4 5 6 7 8 9 10 13 11 11
Rapeseed Oil
Supply 4,756 4,545 4,343 4,139 5,144 6,241 6,301 7,091 8,473 9,632 10,108
Production 4,556 4,635 4,067 3,870 4,700 5,170 5,057 5,725 6,045 6,579 6,500
Beginning stocks 0 0 0 0 0 291 600 336 836 2,157 2,882
Net imports 200 -90 276 269 444 780 644 1,030 1,592 896 726
Utilization 4,756 4,545 4,343 4,139 5,144 6,241 6,301 7,091 8,473 9,632 10,108
Consumption 4,756 4,545 4,343 4,139 4,853 5,641 5,965 6,255 6,316 6,750 7,250
Ending Stocks 0 0 0 0 291 600 336 836 2,157 2,882 2,858
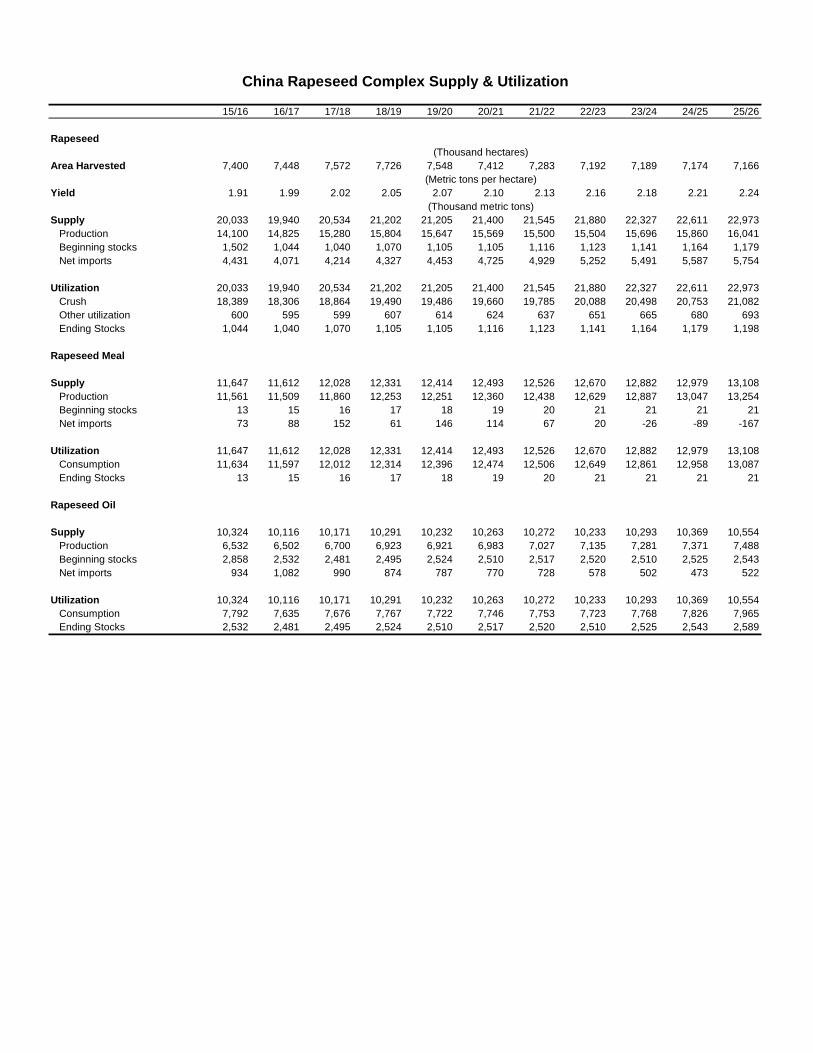
China Rapeseed Complex Supply & Utilization
15/16 16/17 17/18 18/19 19/20 20/21 21/22 22/23 23/24 24/25 25/26
Rapeseed
(Thousand hectares)
Area Harvested 7,400 7,448 7,572 7,726 7,548 7,412 7,283 7,192 7,189 7,174 7,166
(Metric tons per hectare)
Yield 1.91 1.99 2.02 2.05 2.07 2.10 2.13 2.16 2.18 2.21 2.24
(Thousand metric tons)
Supply 20,033 19,940 20,534 21,202 21,205 21,400 21,545 21,880 22,327 22,611 22,973
Production 14,100 14,825 15,280 15,804 15,647 15,569 15,500 15,504 15,696 15,860 16,041
Beginning stocks 1,502 1,044 1,040 1,070 1,105 1,105 1,116 1,123 1,141 1,164 1,179
Net imports 4,431 4,071 4,214 4,327 4,453 4,725 4,929 5,252 5,491 5,587 5,754
Utilization 20,033 19,940 20,534 21,202 21,205 21,400 21,545 21,880 22,327 22,611 22,973
Crush 18,389 18,306 18,864 19,490 19,486 19,660 19,785 20,088 20,498 20,753 21,082
Other utilization 600 595 599 607 614 624 637 651 665 680 693
Ending Stocks 1,044 1,040 1,070 1,105 1,105 1,116 1,123 1,141 1,164 1,179 1,198
Rapeseed Meal
Supply 11,647 11,612 12,028 12,331 12,414 12,493 12,526 12,670 12,882 12,979 13,108
Production 11,561 11,509 11,860 12,253 12,251 12,360 12,438 12,629 12,887 13,047 13,254
Beginning stocks 13 15 16 17 18 19 20 21 21 21 21
Net imports 73 88 152 61 146 114 67 20 -26 -89 -167
Utilization 11,647 11,612 12,028 12,331 12,414 12,493 12,526 12,670 12,882 12,979 13,108
Consumption 11,634 11,597 12,012 12,314 12,396 12,474 12,506 12,649 12,861 12,958 13,087
Ending Stocks 13 15 16 17 18 19 20 21 21 21 21
Rapeseed Oil
Supply 10,324 10,116 10,171 10,291 10,232 10,263 10,272 10,233 10,293 10,369 10,554
Production 6,532 6,502 6,700 6,923 6,921 6,983 7,027 7,135 7,281 7,371 7,488
Beginning stocks 2,858 2,532 2,481 2,495 2,524 2,510 2,517 2,520 2,510 2,525 2,543
Net imports 934 1,082 990 874 787 770 728 578 502 473 522
Utilization 10,324 10,116 10,171 10,291 10,232 10,263 10,272 10,233 10,293 10,369 10,554
Consumption 7,792 7,635 7,676 7,767 7,722 7,746 7,753 7,723 7,768 7,826 7,965
Ending Stocks 2,532 2,481 2,495 2,524 2,510 2,517 2,520 2,510 2,525 2,543 2,589
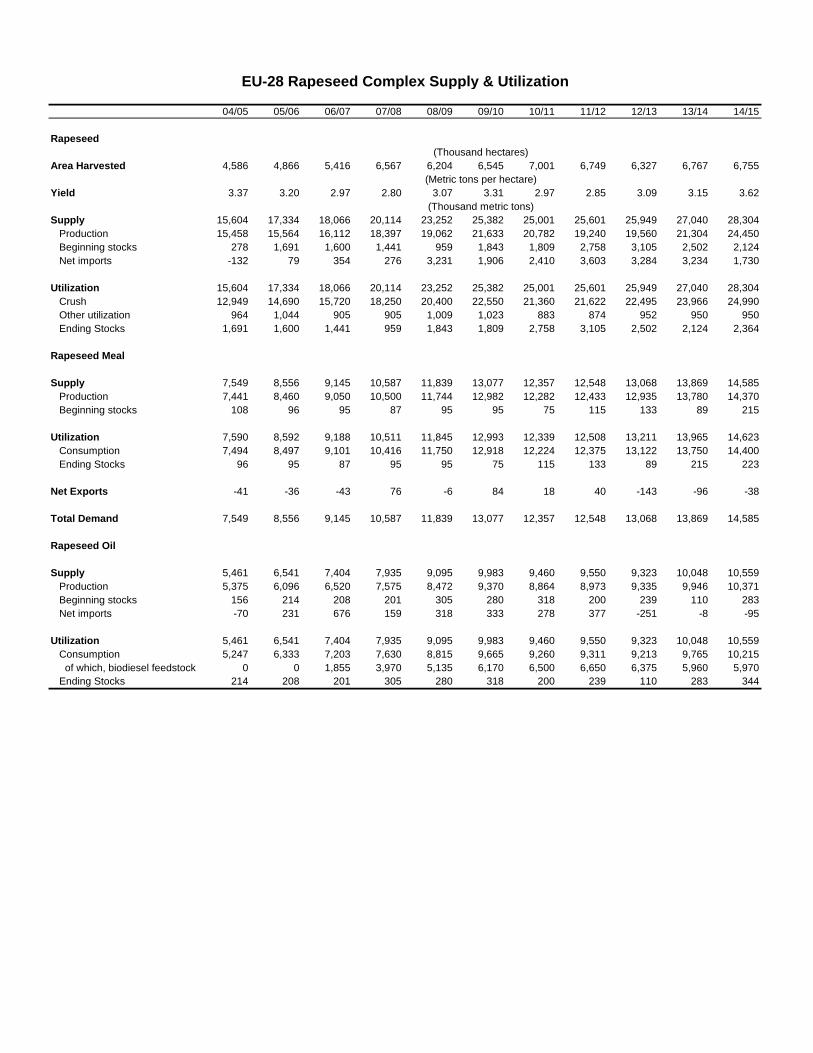
EU-28 Rapeseed Complex Supply & Utilization EU-28 Rapeseed Complex Supply & Utilization
04/05 05/06 06/07 07/08 08/09 09/10 10/11 11/12 12/13 13/14 14/15
Rapeseed
(Thousand hectares) (Thousand hectares)
Area Harvested 4,586 4,866 5,416 6,567 6,204 6,545 7,001 6,749 6,327 6,767 6,755
(Metric tons per hectare) (Metric tons per hectare)
Yield 3.37 3.20 2.97 2.80 3.07 3.31 2.97 2.85 3.09 3.15 3.62
(Thousand metric tons) (Thousand metric tons)
Supply 15,604 17,334 18,066 20,114 23,252 25,382 25,001 25,601 25,949 27,040 28,304
Production 15,458 15,564 16,112 18,397 19,062 21,633 20,782 19,240 19,560 21,304 24,450
Beginning stocks 278 1,691 1,600 1,441 959 1,843 1,809 2,758 3,105 2,502 2,124
Net imports -132 79 354 276 3,231 1,906 2,410 3,603 3,284 3,234 1,730
Utilization 15,604 17,334 18,066 20,114 23,252 25,382 25,001 25,601 25,949 27,040 28,304
Crush 12,949 14,690 15,720 18,250 20,400 22,550 21,360 21,622 22,495 23,966 24,990
Other utilization 964 1,044 905 905 1,009 1,023 883 874 952 950 950
Ending Stocks 1,691 1,600 1,441 959 1,843 1,809 2,758 3,105 2,502 2,124 2,364
Rapeseed Meal
Supply 7,549 8,556 9,145 10,587 11,839 13,077 12,357 12,548 13,068 13,869 14,585
Production 7,441 8,460 9,050 10,500 11,744 12,982 12,282 12,433 12,935 13,780 14,370
Beginning stocks 108 96 95 87 95 95 75 115 133 89 215
Utilization 7,590 8,592 9,188 10,511 11,845 12,993 12,339 12,508 13,211 13,965 14,623
Consumption 7,494 8,497 9,101 10,416 11,750 12,918 12,224 12,375 13,122 13,750 14,400
Ending Stocks 96 95 87 95 95 75 115 133 89 215 223
Net Exports -41 -36 -43 76 -6 84 18 40 -143 -96 -38
Total Demand 7,549 8,556 9,145 10,587 11,839 13,077 12,357 12,548 13,068 13,869 14,585
Rapeseed Oil
Supply 5,461 6,541 7,404 7,935 9,095 9,983 9,460 9,550 9,323 10,048 10,559
Production 5,375 6,096 6,520 7,575 8,472 9,370 8,864 8,973 9,335 9,946 10,371
Beginning stocks 156 214 208 201 305 280 318 200 239 110 283
Net imports -70 231 676 159 318 333 278 377 -251 -8 -95
Utilization 5,461 6,541 7,404 7,935 9,095 9,983 9,460 9,550 9,323 10,048 10,559
Consumption 5,247 6,333 7,203 7,630 8,815 9,665 9,260 9,311 9,213 9,765 10,215
of which, biodiesel feedstock 0 0 1,855 3,970 5,135 6,170 6,500 6,650 6,375 5,960 5,970
Ending Stocks 214 208 201 305 280 318 200 239 110 283 344

EU-28 Rapeseed Complex Supply & Utilization
15/16 16/17 17/18 18/19 19/20 20/21 21/22 22/23 23/24 24/25 25/26
Rapeseed
(Thousand hectares)
Area Harvested 6,576 6,948 7,163 7,299 7,347 7,377 7,395 7,406 7,419 7,425 7,428
(Metric tons per hectare)
Yield 3.32 3.22 3.25 3.27 3.29 3.32 3.34 3.37 3.39 3.42 3.44
(Thousand metric tons)
Supply 26,143 25,710 26,394 27,168 27,615 28,088 28,521 28,860 29,189 29,588 29,933
Production 21,800 22,376 23,244 23,865 24,204 24,484 24,726 24,947 25,173 25,376 25,569
Beginning stocks 2,364 1,270 1,158 1,186 1,277 1,357 1,441 1,530 1,623 1,724 1,836
Net imports 1,979 2,064 1,992 2,117 2,135 2,248 2,354 2,383 2,393 2,488 2,528
Utilization 26,143 25,710 26,394 27,168 27,615 28,088 28,521 28,860 29,189 29,588 29,933
Crush 23,895 23,659 24,283 24,943 25,302 25,684 26,022 26,264 26,482 26,760 26,991
Other utilization 978 893 925 948 957 963 969 973 983 992 1,000
Ending Stocks 1,270 1,158 1,186 1,277 1,357 1,441 1,530 1,623 1,724 1,836 1,942
Rapeseed Meal
Supply 13,963 13,799 14,139 14,512 14,722 14,944 15,142 15,285 15,416 15,582 15,721
Production 13,740 13,605 13,964 14,343 14,550 14,769 14,963 15,102 15,228 15,388 15,521
Beginning stocks 223 195 175 169 173 175 179 183 188 194 200
Utilization 14,086 14,033 14,340 14,830 15,085 15,270 15,421 15,548 15,663 15,794 15,938
Consumption 13,891 13,858 14,171 14,657 14,910 15,091 15,238 15,360 15,469 15,593 15,731
Ending Stocks 195 175 169 173 175 179 183 188 194 200 207
Net Exports -123 -234 -202 -317 -363 -326 -279 -263 -247 -212 -217
Total Demand 13,963 13,799 14,139 14,512 14,722 14,944 15,142 15,285 15,416 15,582 15,721
Rapeseed Oil
Supply 10,134 9,916 10,231 10,516 10,698 10,825 10,935 11,060 11,169 11,278 11,382
Production 9,917 9,819 10,078 10,352 10,501 10,659 10,799 10,900 10,990 11,105 11,202
Beginning stocks 344 223 265 268 272 274 273 274 280 280 290
Net imports -127 -125 -112 -103 -75 -108 -137 -114 -100 -108 -109
Utilization 10,134 9,916 10,231 10,516 10,698 10,825 10,935 11,060 11,169 11,278 11,382
Consumption 9,911 9,650 9,963 10,245 10,423 10,553 10,661 10,781 10,889 10,988 11,086
of which, biodiesel feedstock 5,932 5,743 5,902 5,995 6,002 6,050 6,090 6,118 6,139 6,097 6,046
Ending Stocks 223 265 268 272 274 273 274 280 280 290 296
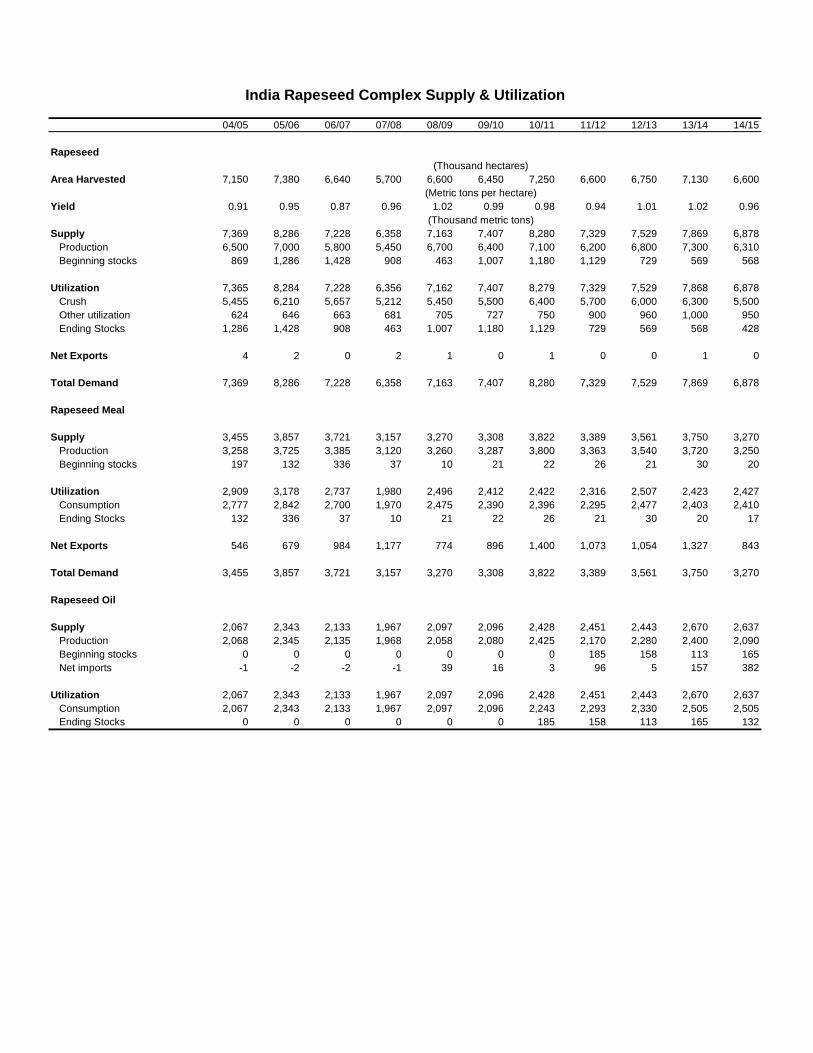
India Rapeseed Complex Supply & Utilization India Rapeseed Complex Supply & Utilization
04/05 05/06 06/07 07/08 08/09 09/10 10/11 11/12 12/13 13/14 14/15
Rapeseed
(Thousand hectares) (Thousand hectares)
Area Harvested 7,150 7,380 6,640 5,700 6,600 6,450 7,250 6,600 6,750 7,130 6,600
(Metric tons per hectare) (Metric tons per hectare)
Yield 0.91 0.95 0.87 0.96 1.02 0.99 0.98 0.94 1.01 1.02 0.96
(Thousand metric tons) (Thousand metric tons)
Supply 7,369 8,286 7,228 6,358 7,163 7,407 8,280 7,329 7,529 7,869 6,878
Production 6,500 7,000 5,800 5,450 6,700 6,400 7,100 6,200 6,800 7,300 6,310
Beginning stocks 869 1,286 1,428 908 463 1,007 1,180 1,129 729 569 568
Utilization 7,365 8,284 7,228 6,356 7,162 7,407 8,279 7,329 7,529 7,868 6,878
Crush 5,455 6,210 5,657 5,212 5,450 5,500 6,400 5,700 6,000 6,300 5,500
Other utilization 624 646 663 681 705 727 750 900 960 1,000 950
Ending Stocks 1,286 1,428 908 463 1,007 1,180 1,129 729 569 568 428
Net Exports 4 2 0 2 1 0 1 0 0 1 0
Total Demand 7,369 8,286 7,228 6,358 7,163 7,407 8,280 7,329 7,529 7,869 6,878
Rapeseed Meal
Supply 3,455 3,857 3,721 3,157 3,270 3,308 3,822 3,389 3,561 3,750 3,270
Production 3,258 3,725 3,385 3,120 3,260 3,287 3,800 3,363 3,540 3,720 3,250
Beginning stocks 197 132 336 37 10 21 22 26 21 30 20
Utilization 2,909 3,178 2,737 1,980 2,496 2,412 2,422 2,316 2,507 2,423 2,427
Consumption 2,777 2,842 2,700 1,970 2,475 2,390 2,396 2,295 2,477 2,403 2,410
Ending Stocks 132 336 37 10 21 22 26 21 30 20 17
Net Exports 546 679 984 1,177 774 896 1,400 1,073 1,054 1,327 843
Total Demand 3,455 3,857 3,721 3,157 3,270 3,308 3,822 3,389 3,561 3,750 3,270
Rapeseed Oil
Supply 2,067 2,343 2,133 1,967 2,097 2,096 2,428 2,451 2,443 2,670 2,637
Production 2,068 2,345 2,135 1,968 2,058 2,080 2,425 2,170 2,280 2,400 2,090
Beginning stocks 0 0 0 0 0 0 0 185 158 113 165
Net imports -1 -2 -2 -1 39 16 3 96 5 157 382
Utilization 2,067 2,343 2,133 1,967 2,097 2,096 2,428 2,451 2,443 2,670 2,637
Consumption 2,067 2,343 2,133 1,967 2,097 2,096 2,243 2,293 2,330 2,505 2,505
Ending Stocks 0 0 0 0 0 0 185 158 113 165 132
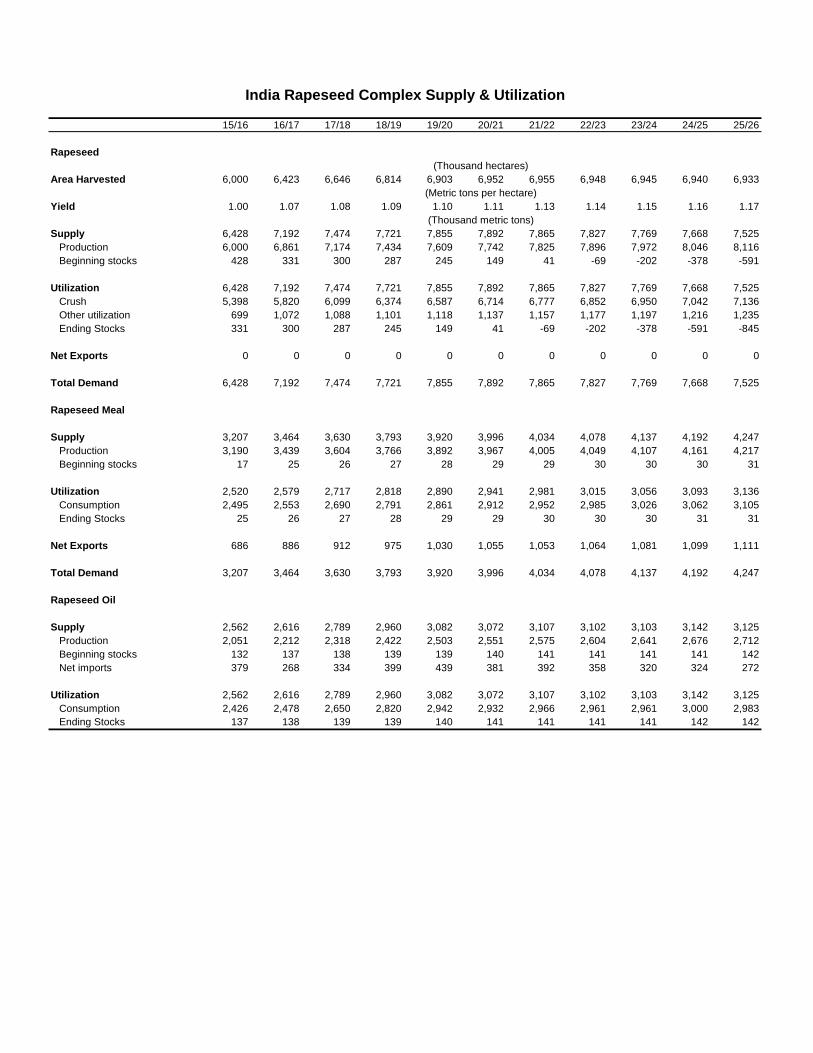
India Rapeseed Complex Supply & Utilization
15/16 16/17 17/18 18/19 19/20 20/21 21/22 22/23 23/24 24/25 25/26
Rapeseed
(Thousand hectares)
Area Harvested 6,000 6,423 6,646 6,814 6,903 6,952 6,955 6,948 6,945 6,940 6,933
(Metric tons per hectare)
Yield 1.00 1.07 1.08 1.09 1.10 1.11 1.13 1.14 1.15 1.16 1.17
(Thousand metric tons)
Supply 6,428 7,192 7,474 7,721 7,855 7,892 7,865 7,827 7,769 7,668 7,525
Production 6,000 6,861 7,174 7,434 7,609 7,742 7,825 7,896 7,972 8,046 8,116
Beginning stocks 428 331 300 287 245 149 41 -69 -202 -378 -591
Utilization 6,428 7,192 7,474 7,721 7,855 7,892 7,865 7,827 7,769 7,668 7,525
Crush 5,398 5,820 6,099 6,374 6,587 6,714 6,777 6,852 6,950 7,042 7,136
Other utilization 699 1,072 1,088 1,101 1,118 1,137 1,157 1,177 1,197 1,216 1,235
Ending Stocks 331 300 287 245 149 41 -69 -202 -378 -591 -845
Net Exports 0 0 0 0 0 0 0 0 0 0 0
Total Demand 6,428 7,192 7,474 7,721 7,855 7,892 7,865 7,827 7,769 7,668 7,525
Rapeseed Meal
Supply 3,207 3,464 3,630 3,793 3,920 3,996 4,034 4,078 4,137 4,192 4,247
Production 3,190 3,439 3,604 3,766 3,892 3,967 4,005 4,049 4,107 4,161 4,217
Beginning stocks 17 25 26 27 28 29 29 30 30 30 31
Utilization 2,520 2,579 2,717 2,818 2,890 2,941 2,981 3,015 3,056 3,093 3,136
Consumption 2,495 2,553 2,690 2,791 2,861 2,912 2,952 2,985 3,026 3,062 3,105
Ending Stocks 25 26 27 28 29 29 30 30 30 31 31
Net Exports 686 886 912 975 1,030 1,055 1,053 1,064 1,081 1,099 1,111
Total Demand 3,207 3,464 3,630 3,793 3,920 3,996 4,034 4,078 4,137 4,192 4,247
Rapeseed Oil
Supply 2,562 2,616 2,789 2,960 3,082 3,072 3,107 3,102 3,103 3,142 3,125
Production 2,051 2,212 2,318 2,422 2,503 2,551 2,575 2,604 2,641 2,676 2,712
Beginning stocks 132 137 138 139 139 140 141 141 141 141 142
Net imports 379 268 334 399 439 381 392 358 320 324 272
Utilization 2,562 2,616 2,789 2,960 3,082 3,072 3,107 3,102 3,103 3,142 3,125
Consumption 2,426 2,478 2,650 2,820 2,942 2,932 2,966 2,961 2,961 3,000 2,983
Ending Stocks 137 138 139 139 140 141 141 141 141 142 142
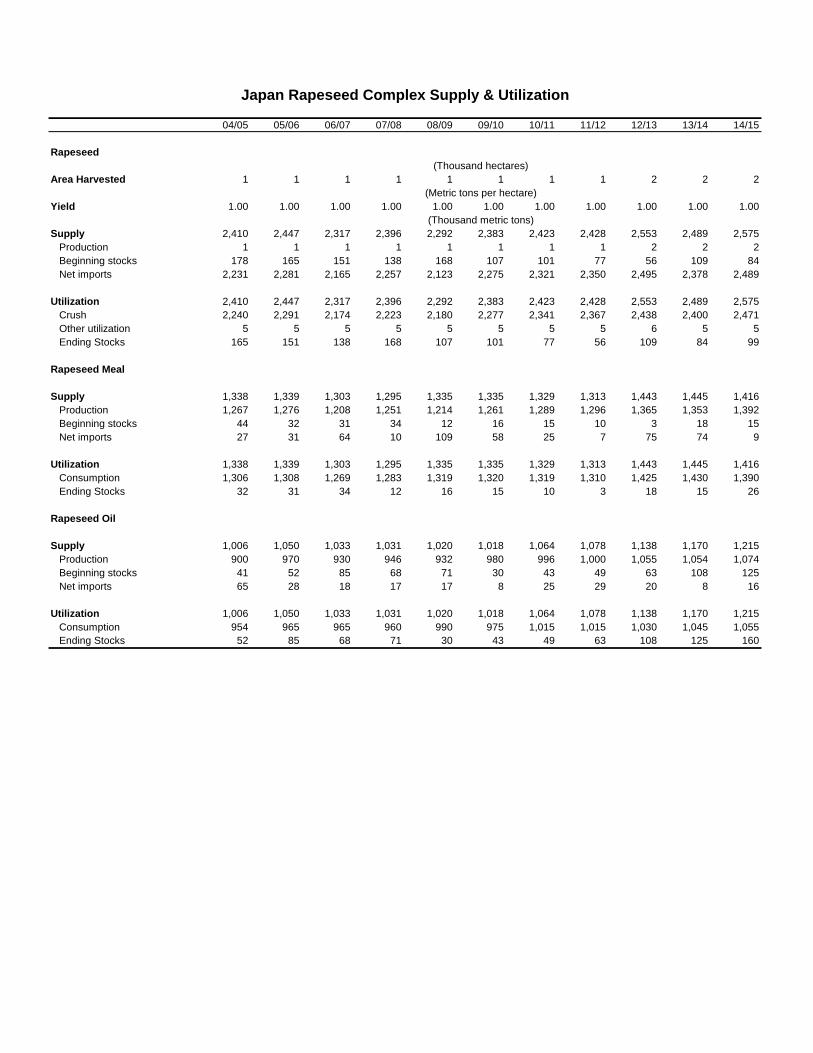
Japan Rapeseed Complex Supply & Utilization Japan Rapeseed Complex Supply & Utilization
04/05 05/06 06/07 07/08 08/09 09/10 10/11 11/12 12/13 13/14 14/15
Rapeseed
(Thousand hectares) (Thousand hectares)
Area Harvested 1 1 1 1 1 1 1 1 2 2 2
(Metric tons per hectare) (Metric tons per hectare)
Yield 1.00 1.00 1.00 1.00 1.00 1.00 1.00 1.00 1.00 1.00 1.00
(Thousand metric tons) (Thousand metric tons)
Supply 2,410 2,447 2,317 2,396 2,292 2,383 2,423 2,428 2,553 2,489 2,575
Production 1 1 1 1 1 1 1 1 2 2 2
Beginning stocks 178 165 151 138 168 107 101 77 56 109 84
Net imports 2,231 2,281 2,165 2,257 2,123 2,275 2,321 2,350 2,495 2,378 2,489
Utilization 2,410 2,447 2,317 2,396 2,292 2,383 2,423 2,428 2,553 2,489 2,575
Crush 2,240 2,291 2,174 2,223 2,180 2,277 2,341 2,367 2,438 2,400 2,471
Other utilization 5 5 5 5 5 5 5 5 6 5 5
Ending Stocks 165 151 138 168 107 101 77 56 109 84 99
Rapeseed Meal
Supply 1,338 1,339 1,303 1,295 1,335 1,335 1,329 1,313 1,443 1,445 1,416
Production 1,267 1,276 1,208 1,251 1,214 1,261 1,289 1,296 1,365 1,353 1,392
Beginning stocks 44 32 31 34 12 16 15 10 3 18 15
Net imports 27 31 64 10 109 58 25 7 75 74 9
Utilization 1,338 1,339 1,303 1,295 1,335 1,335 1,329 1,313 1,443 1,445 1,416
Consumption 1,306 1,308 1,269 1,283 1,319 1,320 1,319 1,310 1,425 1,430 1,390
Ending Stocks 32 31 34 12 16 15 10 3 18 15 26
Rapeseed Oil
Supply 1,006 1,050 1,033 1,031 1,020 1,018 1,064 1,078 1,138 1,170 1,215
Production 900 970 930 946 932 980 996 1,000 1,055 1,054 1,074
Beginning stocks 41 52 85 68 71 30 43 49 63 108 125
Net imports 65 28 18 17 17 8 25 29 20 8 16
Utilization 1,006 1,050 1,033 1,031 1,020 1,018 1,064 1,078 1,138 1,170 1,215
Consumption 954 965 965 960 990 975 1,015 1,015 1,030 1,045 1,055
Ending Stocks 52 85 68 71 30 43 49 63 108 125 160
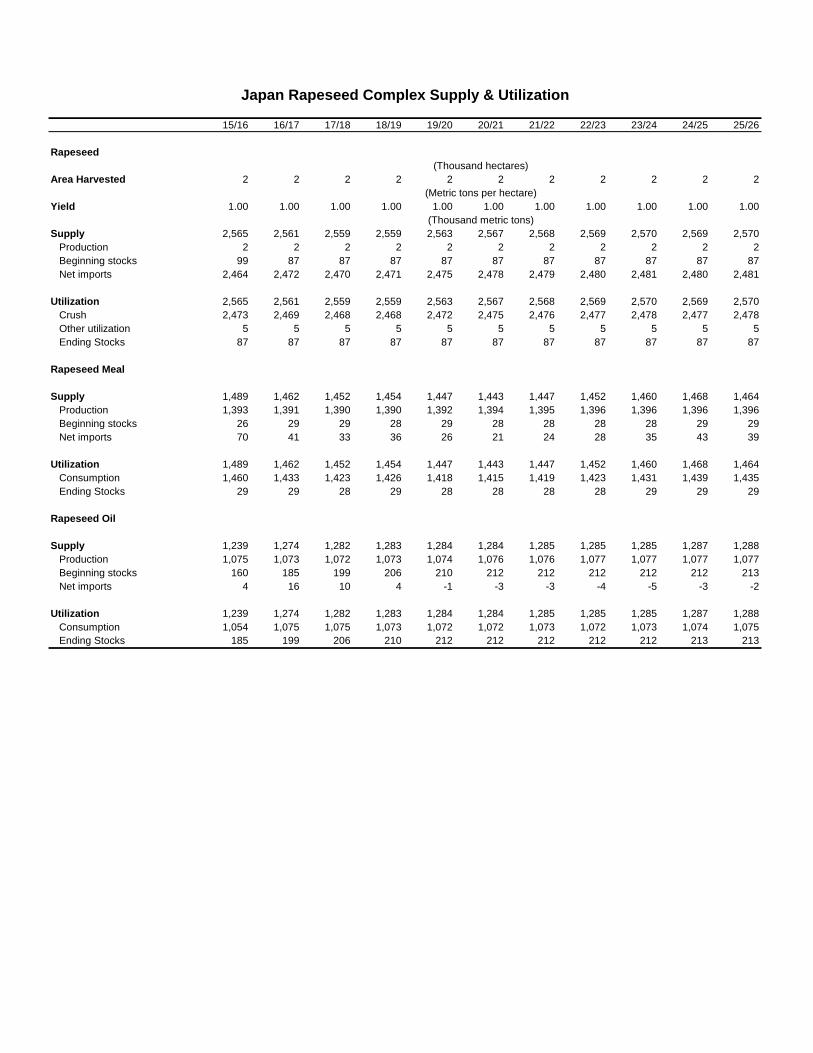
Japan Rapeseed Complex Supply & Utilization
15/16 16/17 17/18 18/19 19/20 20/21 21/22 22/23 23/24 24/25 25/26
Rapeseed
(Thousand hectares)
Area Harvested 2 2 2 2 2 2 2 2 2 2 2
(Metric tons per hectare)
Yield 1.00 1.00 1.00 1.00 1.00 1.00 1.00 1.00 1.00 1.00 1.00
(Thousand metric tons)
Supply 2,565 2,561 2,559 2,559 2,563 2,567 2,568 2,569 2,570 2,569 2,570
Production 2 2 2 2 2 2 2 2 2 2 2
Beginning stocks 99 87 87 87 87 87 87 87 87 87 87
Net imports 2,464 2,472 2,470 2,471 2,475 2,478 2,479 2,480 2,481 2,480 2,481
Utilization 2,565 2,561 2,559 2,559 2,563 2,567 2,568 2,569 2,570 2,569 2,570
Crush 2,473 2,469 2,468 2,468 2,472 2,475 2,476 2,477 2,478 2,477 2,478
Other utilization 5 5 5 5 5 5 5 5 5 5 5
Ending Stocks 87 87 87 87 87 87 87 87 87 87 87
Rapeseed Meal
Supply 1,489 1,462 1,452 1,454 1,447 1,443 1,447 1,452 1,460 1,468 1,464
Production 1,393 1,391 1,390 1,390 1,392 1,394 1,395 1,396 1,396 1,396 1,396
Beginning stocks 26 29 29 28 29 28 28 28 28 29 29
Net imports 70 41 33 36 26 21 24 28 35 43 39
Utilization 1,489 1,462 1,452 1,454 1,447 1,443 1,447 1,452 1,460 1,468 1,464
Consumption 1,460 1,433 1,423 1,426 1,418 1,415 1,419 1,423 1,431 1,439 1,435
Ending Stocks 29 29 28 29 28 28 28 28 29 29 29
Rapeseed Oil
Supply 1,239 1,274 1,282 1,283 1,284 1,284 1,285 1,285 1,285 1,287 1,288
Production 1,075 1,073 1,072 1,073 1,074 1,076 1,076 1,077 1,077 1,077 1,077
Beginning stocks 160 185 199 206 210 212 212 212 212 212 213
Net imports 4 16 10 4 -1 -3 -3 -4 -5 -3 -2
Utilization 1,239 1,274 1,282 1,283 1,284 1,284 1,285 1,285 1,285 1,287 1,288
Consumption 1,054 1,075 1,075 1,073 1,072 1,072 1,073 1,072 1,073 1,074 1,075
Ending Stocks 185 199 206 210 212 212 212 212 212 213 213
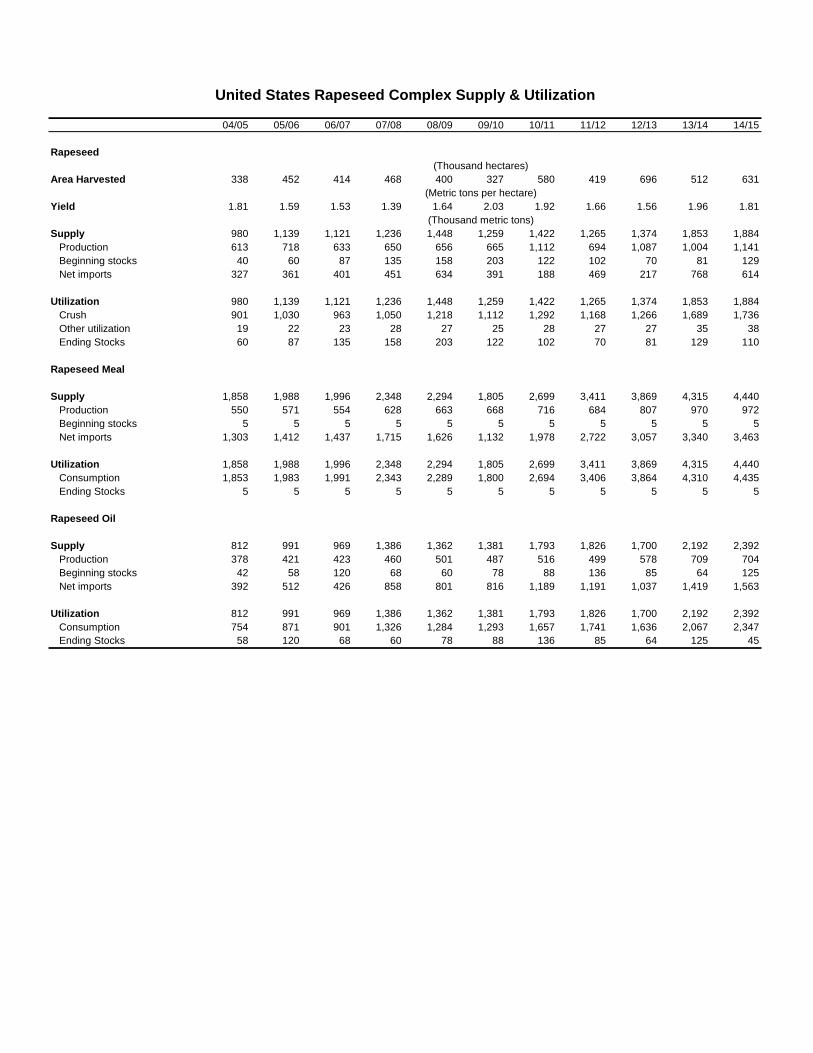
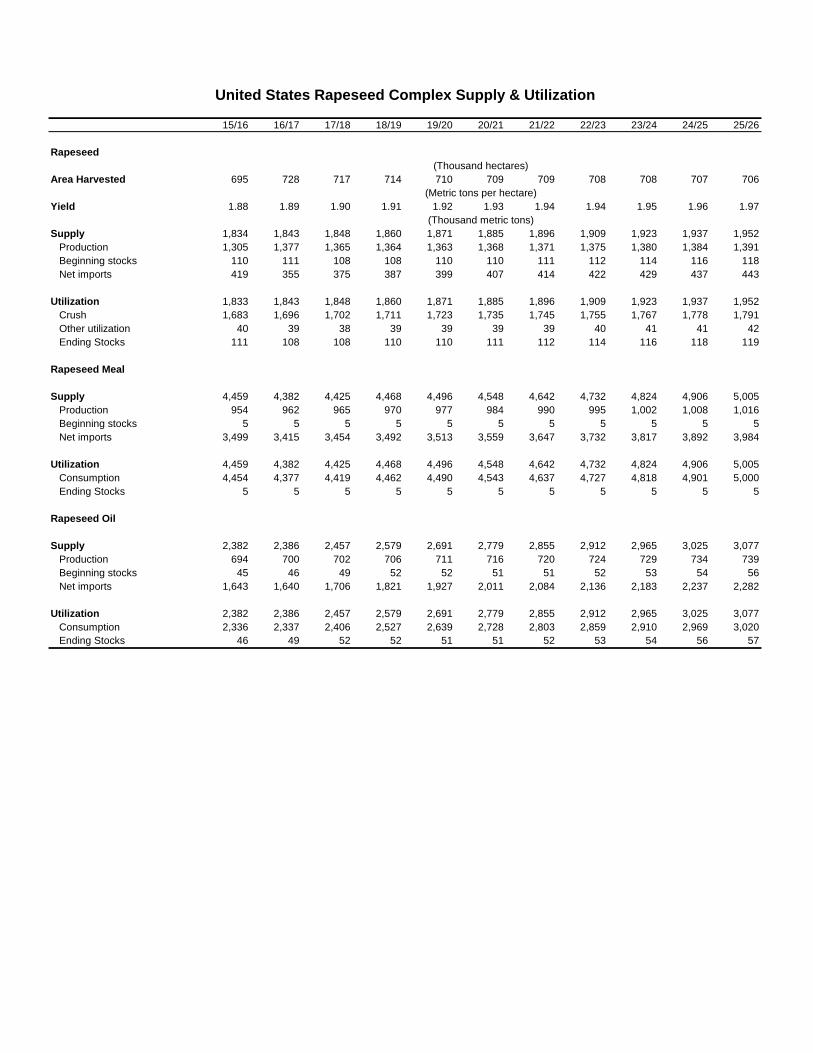
United States Rapeseed Complex Supply & Utilization United States Rapeseed Complex Supply & Utilization
04/05 05/06 06/07 07/08 08/09 09/10 10/11 11/12 12/13 13/14 14/15
Rapeseed
(Thousand hectares) (Thousand hectares)
Area Harvested 338 452 414 468 400 327 580 419 696 512 631
(Metric tons per hectare) (Metric tons per hectare)
Yield 1.81 1.59 1.53 1.39 1.64 2.03 1.92 1.66 1.56 1.96 1.81
(Thousand metric tons) (Thousand metric tons)
Supply 980 1,139 1,121 1,236 1,448 1,259 1,422 1,265 1,374 1,853 1,884
Production 613 718 633 650 656 665 1,112 694 1,087 1,004 1,141
Beginning stocks 40 60 87 135 158 203 122 102 70 81 129
Net imports 327 361 401 451 634 391 188 469 217 768 614
Utilization 980 1,139 1,121 1,236 1,448 1,259 1,422 1,265 1,374 1,853 1,884
Crush 901 1,030 963 1,050 1,218 1,112 1,292 1,168 1,266 1,689 1,736
Other utilization 19 22 23 28 27 25 28 27 27 35 38
Ending Stocks 60 87 135 158 203 122 102 70 81 129 110
Rapeseed Meal
Supply 1,858 1,988 1,996 2,348 2,294 1,805 2,699 3,411 3,869 4,315 4,440
Production 550 571 554 628 663 668 716 684 807 970 972
Beginning stocks 5 5 5 5 5 5 5 5 5 5 5
Net imports 1,303 1,412 1,437 1,715 1,626 1,132 1,978 2,722 3,057 3,340 3,463
Utilization 1,858 1,988 1,996 2,348 2,294 1,805 2,699 3,411 3,869 4,315 4,440
Consumption 1,853 1,983 1,991 2,343 2,289 1,800 2,694 3,406 3,864 4,310 4,435
Ending Stocks 5 5 5 5 5 5 5 5 5 5 5
Rapeseed Oil
Supply 812 991 969 1,386 1,362 1,381 1,793 1,826 1,700 2,192 2,392
Production 378 421 423 460 501 487 516 499 578 709 704
Beginning stocks 42 58 120 68 60 78 88 136 85 64 125
Net imports 392 512 426 858 801 816 1,189 1,191 1,037 1,419 1,563
Utilization 812 991 969 1,386 1,362 1,381 1,793 1,826 1,700 2,192 2,392
Consumption 754 871 901 1,326 1,284 1,293 1,657 1,741 1,636 2,067 2,347
Ending Stocks 58 120 68 60 78 88 136 85 64 125 45
United States Rapeseed Complex Supply & Utilization
15/16 16/17 17/18 18/19 19/20 20/21 21/22 22/23 23/24 24/25 25/26
Rapeseed
(Thousand hectares)
Area Harvested 695 728 717 714 710 709 709 708 708 707 706
(Metric tons per hectare)
Yield 1.88 1.89 1.90 1.91 1.92 1.93 1.94 1.94 1.95 1.96 1.97
(Thousand metric tons)
Supply 1,834 1,843 1,848 1,860 1,871 1,885 1,896 1,909 1,923 1,937 1,952
Production 1,305 1,377 1,365 1,364 1,363 1,368 1,371 1,375 1,380 1,384 1,391
Beginning stocks 110 111 108 108 110 110 111 112 114 116 118
Net imports 419 355 375 387 399 407 414 422 429 437 443
Utilization 1,833 1,843 1,848 1,860 1,871 1,885 1,896 1,909 1,923 1,937 1,952
Crush 1,683 1,696 1,702 1,711 1,723 1,735 1,745 1,755 1,767 1,778 1,791
Other utilization 40 39 38 39 39 39 39 40 41 41 42
Ending Stocks 111 108 108 110 110 111 112 114 116 118 119
Rapeseed Meal
Supply 4,459 4,382 4,425 4,468 4,496 4,548 4,642 4,732 4,824 4,906 5,005
Production 954 962 965 970 977 984 990 995 1,002 1,008 1,016
Beginning stocks 5 5 5 5 5 5 5 5 5 5 5
Net imports 3,499 3,415 3,454 3,492 3,513 3,559 3,647 3,732 3,817 3,892 3,984
Utilization 4,459 4,382 4,425 4,468 4,496 4,548 4,642 4,732 4,824 4,906 5,005
Consumption 4,454 4,377 4,419 4,462 4,490 4,543 4,637 4,727 4,818 4,901 5,000
Ending Stocks 5 5 5 5 5 5 5 5 5 5 5
Rapeseed Oil
Supply 2,382 2,386 2,457 2,579 2,691 2,779 2,855 2,912 2,965 3,025 3,077
Production 694 700 702 706 711 716 720 724 729 734 739
Beginning stocks 45 46 49 52 52 51 51 52 53 54 56
Net imports 1,643 1,640 1,706 1,821 1,927 2,011 2,084 2,136 2,183 2,237 2,282
Utilization 2,382 2,386 2,457 2,579 2,691 2,779 2,855 2,912 2,965 3,025 3,077
Consumption 2,336 2,337 2,406 2,527 2,639 2,728 2,803 2,859 2,910 2,969 3,020
Ending Stocks 46 49 52 52 51 51 52 53 54 56 57
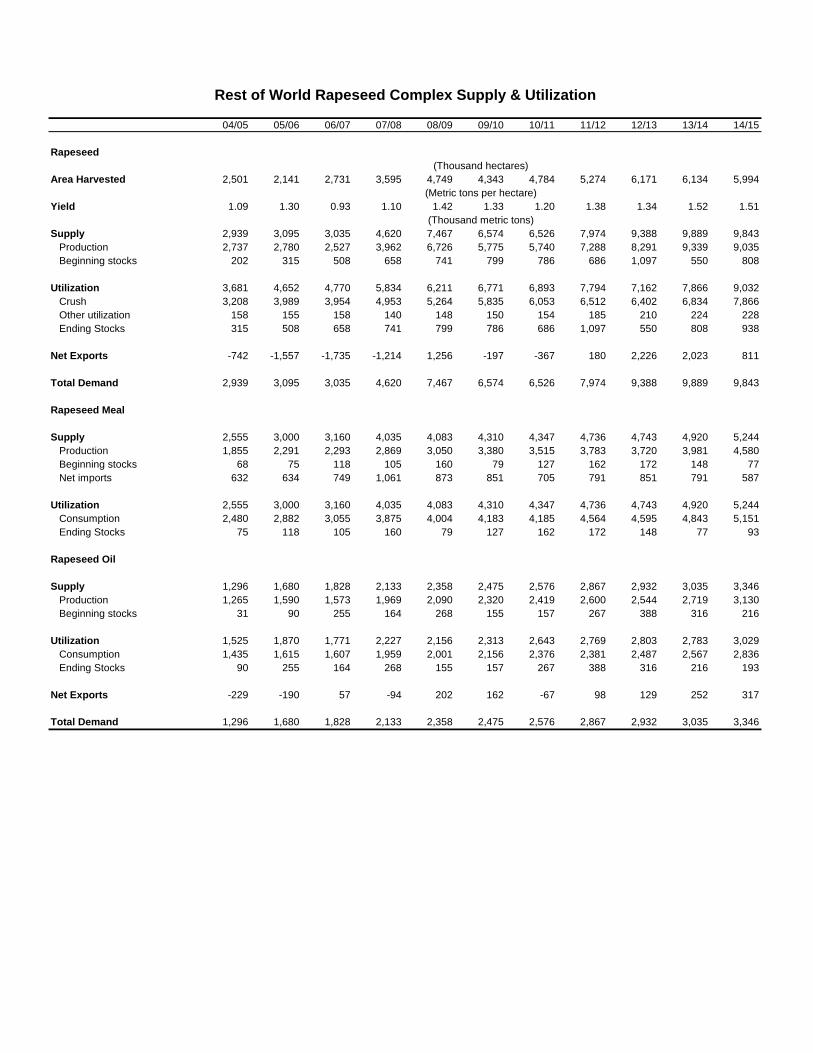
Rest of World Rapeseed Complex Supply & Utilization Rest of World Rapeseed Complex Supply & Utilization
04/05 05/06 06/07 07/08 08/09 09/10 10/11 11/12 12/13 13/14 14/15
Rapeseed
(Thousand hectares) (Thousand hectares)
Area Harvested 2,501 2,141 2,731 3,595 4,749 4,343 4,784 5,274 6,171 6,134 5,994
(Metric tons per hectare) (Metric tons per hectare)
Yield 1.09 1.30 0.93 1.10 1.42 1.33 1.20 1.38 1.34 1.52 1.51
(Thousand metric tons) (Thousand metric tons)
Supply 2,939 3,095 3,035 4,620 7,467 6,574 6,526 7,974 9,388 9,889 9,843
Production 2,737 2,780 2,527 3,962 6,726 5,775 5,740 7,288 8,291 9,339 9,035
Beginning stocks 202 315 508 658 741 799 786 686 1,097 550 808
Utilization 3,681 4,652 4,770 5,834 6,211 6,771 6,893 7,794 7,162 7,866 9,032
Crush 3,208 3,989 3,954 4,953 5,264 5,835 6,053 6,512 6,402 6,834 7,866
Other utilization 158 155 158 140 148 150 154 185 210 224 228
Ending Stocks 315 508 658 741 799 786 686 1,097 550 808 938
Net Exports -742 -1,557 -1,735 -1,214 1,256 -197 -367 180 2,226 2,023 811
Total Demand 2,939 3,095 3,035 4,620 7,467 6,574 6,526 7,974 9,388 9,889 9,843
Rapeseed Meal
Supply 2,555 3,000 3,160 4,035 4,083 4,310 4,347 4,736 4,743 4,920 5,244
Production 1,855 2,291 2,293 2,869 3,050 3,380 3,515 3,783 3,720 3,981 4,580
Beginning stocks 68 75 118 105 160 79 127 162 172 148 77
Net imports 632 634 749 1,061 873 851 705 791 851 791 587
Utilization 2,555 3,000 3,160 4,035 4,083 4,310 4,347 4,736 4,743 4,920 5,244
Consumption 2,480 2,882 3,055 3,875 4,004 4,183 4,185 4,564 4,595 4,843 5,151
Ending Stocks 75 118 105 160 79 127 162 172 148 77 93
Rapeseed Oil
Supply 1,296 1,680 1,828 2,133 2,358 2,475 2,576 2,867 2,932 3,035 3,346
Production 1,265 1,590 1,573 1,969 2,090 2,320 2,419 2,600 2,544 2,719 3,130
Beginning stocks 31 90 255 164 268 155 157 267 388 316 216
Utilization 1,525 1,870 1,771 2,227 2,156 2,313 2,643 2,769 2,803 2,783 3,029
Consumption 1,435 1,615 1,607 1,959 2,001 2,156 2,376 2,381 2,487 2,567 2,836
Ending Stocks 90 255 164 268 155 157 267 388 316 216 193
Net Exports -229 -190 57 -94 202 162 -67 98 129 252 317
Total Demand 1,296 1,680 1,828 2,133 2,358 2,475 2,576 2,867 2,932 3,035 3,346
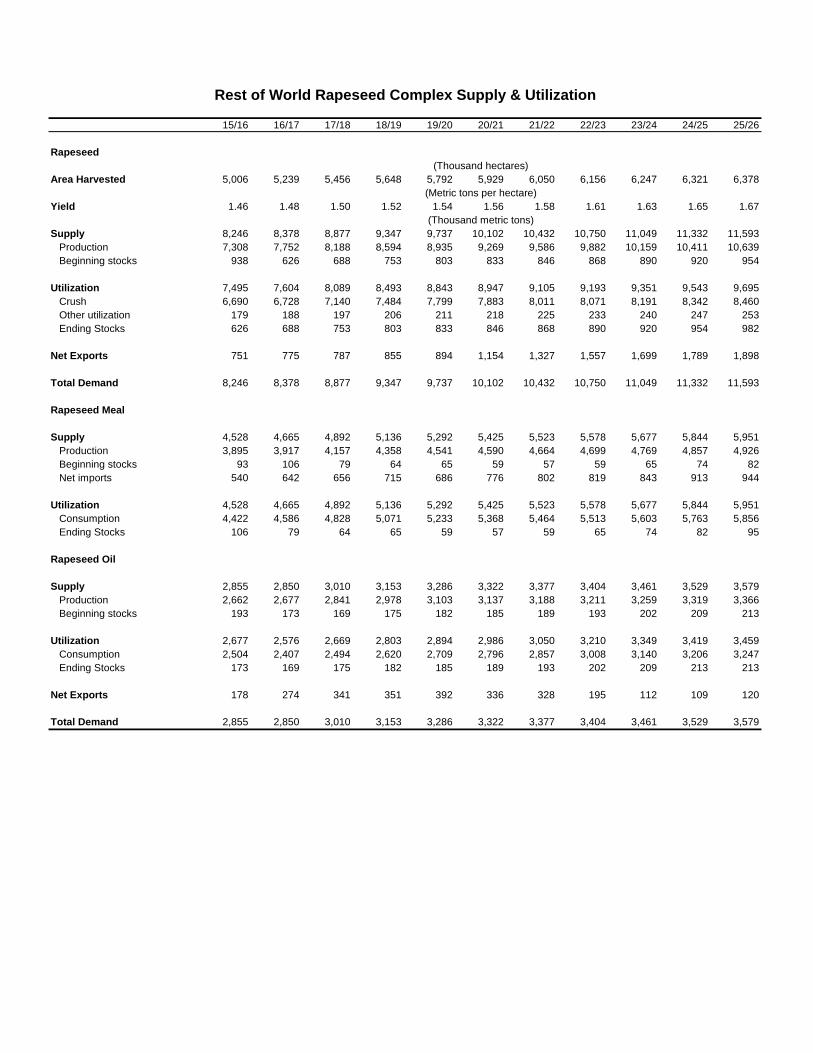
Rest of World Rapeseed Complex Supply & Utilization
15/16 16/17 17/18 18/19 19/20 20/21 21/22 22/23 23/24 24/25 25/26
Rapeseed
(Thousand hectares)
Area Harvested 5,006 5,239 5,456 5,648 5,792 5,929 6,050 6,156 6,247 6,321 6,378
(Metric tons per hectare)
Yield 1.46 1.48 1.50 1.52 1.54 1.56 1.58 1.61 1.63 1.65 1.67
(Thousand metric tons)
Supply 8,246 8,378 8,877 9,347 9,737 10,102 10,432 10,750 11,049 11,332 11,593
Production 7,308 7,752 8,188 8,594 8,935 9,269 9,586 9,882 10,159 10,411 10,639
Beginning stocks 938 626 688 753 803 833 846 868 890 920 954
Utilization 7,495 7,604 8,089 8,493 8,843 8,947 9,105 9,193 9,351 9,543 9,695
Crush 6,690 6,728 7,140 7,484 7,799 7,883 8,011 8,071 8,191 8,342 8,460
Other utilization 179 188 197 206 211 218 225 233 240 247 253
Ending Stocks 626 688 753 803 833 846 868 890 920 954 982
Net Exports 751 775 787 855 894 1,154 1,327 1,557 1,699 1,789 1,898
Total Demand 8,246 8,378 8,877 9,347 9,737 10,102 10,432 10,750 11,049 11,332 11,593
Rapeseed Meal
Supply 4,528 4,665 4,892 5,136 5,292 5,425 5,523 5,578 5,677 5,844 5,951
Production 3,895 3,917 4,157 4,358 4,541 4,590 4,664 4,699 4,769 4,857 4,926
Beginning stocks 93 106 79 64 65 59 57 59 65 74 82
Net imports 540 642 656 715 686 776 802 819 843 913 944
Utilization 4,528 4,665 4,892 5,136 5,292 5,425 5,523 5,578 5,677 5,844 5,951
Consumption 4,422 4,586 4,828 5,071 5,233 5,368 5,464 5,513 5,603 5,763 5,856
Ending Stocks 106 79 64 65 59 57 59 65 74 82 95
Rapeseed Oil
Supply 2,855 2,850 3,010 3,153 3,286 3,322 3,377 3,404 3,461 3,529 3,579
Production 2,662 2,677 2,841 2,978 3,103 3,137 3,188 3,211 3,259 3,319 3,366
Beginning stocks 193 173 169 175 182 185 189 193 202 209 213
Utilization 2,677 2,576 2,669 2,803 2,894 2,986 3,050 3,210 3,349 3,419 3,459
Consumption 2,504 2,407 2,494 2,620 2,709 2,796 2,857 3,008 3,140 3,206 3,247
Ending Stocks 173 169 175 182 185 189 193 202 209 213 213
Net Exports 178 274 341 351 392 336 328 195 112 109 120
Total Demand 2,855 2,850 3,010 3,153 3,286 3,322 3,377 3,404 3,461 3,529 3,579


![中港市場快遞cpywmg.com.hk/upload/news/中港市場快遞20201104.pdfN 1.96% OPQKRLM 10,071 G 135 N 1.36% OJSTUKRLM 7,714 G 129 N 1.70% HVW 7XYZ 1,296.3 [\ ,- ]^ XY_ Z 516.1 [\](https://static.fdocuments.us/doc/165x107/608261651cd0113229133342/e-e20201104pdf-n-196-opqkrlm-10071-g-135-n.jpg)