Direct program payments to agriculture producers ... · Gross Payments 4 1,686 337 810 54,074...
53
Catalogue No. 21-015-XIE, Vol. 3, No. 1, (ISSN: 1705-088X) Direct program payments to agriculture producers Agriculture economic statistics May 2004 Statistics Canada Agriculture Division Farm Income and Prices Section Catalogue No. 21-015-XIE is a semi-annual publication available free on the Internet at http://www.statcan.ca Highlights Record high program payments reached in 2003 Program payments rose to a record $4.9 billion in 2003, shattering the previous record of $3.8 billion in 1992. Total payments remained 81.1% above the previous five-year average. The majority of the 41.6% jump in program payments last year occurred in the form of payments delivered through three separate types of programs. These were: the 2003 Transition Funding program, assistance programs provided to help offset the impact of the BSE-related ban, and crop insurance programs. Canadian farmers received more than $1.0 billion through both the 2003 Transition Funding and the BSE- related programs. (The Transition Funding program was implemented to support the agricultural industry during the period of transition to the new Agricultural Policy Framework.) Note of Appreciation Canada owes the success of its statistical system to a long-standing partnership between Statistics Canada, the citizens of Canada, its businesses, governments and other institutions. Accurate and timely statistical information could not be produced without their continued cooperation and goodwill. Published by authority of the Minister responsible for Statistics Canada. © Minister of Industry, 2004. All rights reserved. No part of this publication may be reproduced, stored in a retrieval system or transmitted in any form or by any means, electronic, mechanical, photocopying, recording or otherwise without prior written permission from Licence Services, Marketing Division, Statistics Canada, Ottawa, Ontario, Canada, K1A 0T6. June 2004 La version française de cette publication est disponible (nº 21-015-XIF au catalogue).
Transcript of Direct program payments to agriculture producers ... · Gross Payments 4 1,686 337 810 54,074...

Catalogue No. 21-015-XIE, Vol. 3, No. 1, (ISSN: 1705-088X)
Direct program payments to agriculture producers Agriculture economic statistics May 2004 Statistics Canada
Agriculture Division Farm Income and Prices Section Catalogue No. 21-015-XIE is a semi-annual publication available free on the Internet at http://www.statcan.ca
Highlights
Record high program payments reached in 2003 Program payments rose to a record $4.9 billion in 2003, shattering the previous record of $3.8 billion in 1992. Total payments remained 81.1% above the previous five-year average. The majority of the 41.6% jump in program payments last year occurred in the form of payments delivered through three separate types of programs. These were: the 2003 Transition Funding program, assistance programs provided to help offset the impact of the BSE-related ban, and crop insurance programs. Canadian farmers received more than $1.0 billion through both the 2003 Transition Funding and the BSE-related programs. (The Transition Funding program was implemented to support the agricultural industry during the period of transition to the new Agricultural Policy Framework.) Note of Appreciation Canada owes the success of its statistical system to a long-standing partnership between Statistics Canada, the citizens of Canada, its businesses, governments and other institutions. Accurate and timely statistical information could not be produced without their continued cooperation and goodwill. Published by authority of the Minister responsible for Statistics Canada. © Minister of Industry, 2004. All rights reserved. No part of this publication may be reproduced, stored in a retrieval system or transmitted in any form or by any means, electronic, mechanical, photocopying, recording or otherwise without prior written permission from Licence Services, Marketing Division, Statistics Canada, Ottawa, Ontario, Canada, K1A 0T6. June 2004 La version française de cette publication est disponible (nº 21-015-XIF au catalogue).

Direct program payments to agriculture producers - Agriculture economic statistics May 2004
Statistics Canada - Catalogue No. 21-015-XIE ii
Symbols The symbols described in this document apply to all data published by Statistics Canada from all origins including surveys, censuses and administrative sources, as well as straight tabulations and all estimations.
Standards of service to the public Statistics Canada is committed to serving its clients in a prompt, reliable and courteous manner and in the official language of their choice. To this end, the agency has developed standards of service which its employees observe in serving its clients. To obtain a copy of these service standards, please contact Statistics Canada toll free at 1 800 263-1136.
. not available for any reference period
.. not available for a specific reference period
… not applicable
0 true zero or a value rounded to zero
0s value rounded to 0 (zero) where there is a meaningful distinction between true zero and the value that was rounded
p preliminary
r revised
x suppressed to meet the confidentiality requirementsof the Statistics Act
E use with caution
F too unreliable to be published

Direct program payments to agriculture producers - Agriculture economic statistics - 1971 June 1989 '000 of dollars
N.L. P.E.I. N.S. N.B. Que. Ont. Man. Sask. Alta. B.C. Canada Payments Enhancing Receipts
Western Grain Stabilization Gross Payments 0 0 0 0 0 0 0 0 0 0 0 Producer Premiums 0 0 0 0 0 0 0 0 0 0 0 Net Payments 0 0 0 0 0 0 0 0 0 0 0
Provincial Stabilization Programs Gross Payments 0 0 0 0 0 0 0 0 0 0 0 Producer Premiums 0 0 0 0 0 0 0 0 0 0 0 Net Payments 0 0 0 0 0 0 0 0 0 0 0
Agricultural Stab. Act (ASA) ASA Price Stabilization 3 5 18 10 186 122 205 79 591 23 1,242
Crop Insurance Gross Payments 0 276 50 0 2,184 313 1,018 143 2,438 1,264 7,686 Producer Prerniums 0 106 16 0 640 522 2,124 787 2,128 477 6,800 Net Payments 0 170 34 0 1,544 -209 -1,106 -644 310 787 886
Dairy Subsidy 0 1,405 269 800 51,511 33,099 3,471 2,748 6,743 290 100,336
Other Payments Lower Inventory for Tomorrow 0 0 0 0 0 0 1,057 6,032 3,559 173 10,821 Prairie Farm Assistance 0 0 0 0 0 0 915 778 2,074 67 3,834 Acreage Payments 0 0 0 0 0 0 3,600 0 0 0 3,600 Compensation for Animal Losses 1 0 0 0 193 51 86 132 27 1 491 Crop Loss Compensation 0 0 0 0 0 0 0 0 350 0 350
Total Gross Payments 1 0 0 0 193 51 5,658 6,942 6,010 241 19,096
TOTAL PAYMENTSGross Payments 4 1,686 337 810 54,074 33,585 10,352 9,912 15,782 1,818 128,360Producer Premiums 0 106 16 0 640 522 2,124 787 2,128 477 6,800Net Payments 4 1,580 321 810 53,434 33,063 8,228 9,125 13,654 1,341 121,560
REBATES REDUCING EXPENSES
Fertilizer 0 0 0 0 179 0 0 0 0 0 179 Lime 0 0 0 0 0 0 0 0 0 82 82 Property Taxes 0 0 0 0 0 8,854 5,120 3,347 0 0 17,321
TOTAL REBATES 0 0 0 0 179 8,854 5,120 3,347 0 82 17,582
TOTAL, DIRECT PAYMENTS AND REBATES
Gross Payments 4 1,686 337 810 54,253 42,439 15,472 13,259 15,782 1,900 145,942Producer Premiums 0 106 16 0 640 522 2,124 787 2,128 477 6,800Net Payments 4 1,580 321 810 53,613 41,917 13,348 12,472 13,654 1,423 139,142
NOTE: Unless indicated, there is no producer participation in the funding of the programs. See Explanatory Notes for brief program description.
Statistics Canada - Catalogue No.21-015-XIE 1

Direct program payments to agriculture producers - Agriculture economic statistics - 1972 June 1989 '000 of dollars
N.L. P.E.I. N.S. N.B. Que. Ont. Man. Sask. Alta. B.C. Canada Payments Enhancing Receipts
Western Grain Stabilization Gross Payments 0 0 0 0 0 0 0 0 0 0 0 Producer Premiums 0 0 0 0 0 0 0 0 0 0 0 Net Payments 0 0 0 0 0 0 0 0 0 0 0
Provincial Stabilization Programs Gross Payments 0 0 0 0 0 0 0 0 0 0 0 Producer Premiums 0 0 0 0 0 0 0 0 0 0 0 Net Payments 0 0 0 0 0 0 0 0 0 0 0
Agricultural Stab. Act (ASA) ASA Price Stabilization 128 693 443 1,473 3,332 6,922 2,754 2,703 4,341 445 23,234
Crop Insurance Gross Payments 0 221 82 0 4,848 2,719 2,528 1,263 2,112 1,116 14,889 Producer Prerniums 0 154 40 0 705 806 1,834 1,829 2,100 447 7,915 Net Payments 0 67 42 0 4,143 1,913 694 -566 12 669 6,974
Dairy Subsidy 0 1,730 230 805 50,133 33,359 3,913 3,060 7,851 329 101,410
Other Payments Two Price Wheat 0 2 3 0 259 5,381 9,171 30,380 17,196 573 62,965 Rain Damage 0 0 0 0 7,311 2,242 0 0 0 0 9,553 Prairie Farm Assistance 0 0 0 0 0 0 218 1,005 3,222 53 4,498 Compensation for Animal Losses 1 0 11 2 220 235 75 225 40 0 809 Crop Loss Compensation 0 0 0 0 0 0 0 0 350 0 350 Lower Inventory for Tomorrow 0 0 0 0 0 0 -3 -16 7 0 -12
Total Gross Payments 1 2 14 2 7,790 7,858 9,461 31,594 20,815 626 78,163
TOTAL PAYMENTSGross Payments 129 2,646 769 2,280 66,103 50,858 18,656 38,620 35,119 2,516 217,696Producer Premiums 0 154 40 0 705 806 1,834 1,829 2,100 447 7,915Net Payments 129 2,492 729 2,280 65,398 50,052 16,822 36,791 33,019 2,069 209,781
REBATES REDUCING EXPENSES
Fertilizer 0 0 0 0 183 0 0 0 0 0 183 Lime 0 0 0 0 0 0 0 0 0 153 153 Property Taxes 0 0 0 0 0 9,886 4,822 5,061 0 0 19,769
TOTAL REBATES 0 0 0 0 183 9,886 4,822 5,061 0 153 20,105
TOTAL, DIRECT PAYMENTS AND REBATES
Gross Payments 129 2,646 769 2,280 66,286 60,744 23,478 43,681 35,119 2,669 237,801Producer Premiums 0 154 40 0 705 806 1,834 1,829 2,100 447 7,915Net Payments 129 2,492 729 2,280 65,581 59,938 21,644 41,852 33,019 2,222 229,886
NOTE: Unless indicated, there is no producer participation in the funding of the programs. See Explanatory Notes for brief program description.
2 Statistics Canada - Catalogue No.21-015-XIE

Direct program payments to agriculture producers - Agriculture economic statistics - 1973 June 1989 '000 of dollars
N.L. P.E.I. N.S. N.B. Que. Ont. Man. Sask. Alta. B.C. Canada Payments Enhancing Receipts
Western Grain Stabilization Gross Payments 0 0 0 0 0 0 0 0 0 0 0 Producer Premiums 0 0 0 0 0 0 0 0 0 0 0 Net Payments 0 0 0 0 0 0 0 0 0 0 0
Provincial Stabilization Programs Gross Payments 0 0 0 0 0 0 0 0 0 2,088 2,088 Producer Premiums 0 0 0 0 0 0 0 0 0 0 0 Net Payments 0 0 0 0 0 0 0 0 0 2,088 2,088
Agricultural Stab. Act (ASA) ASA Price Stabilization 0 0 4 4 66 29 12 4 4 10 133
Crop Insurance Gross Payments 1 334 239 0 4,290 3,916 1,593 4,376 4,707 484 19,940 Producer Prerniums 0 147 49 0 1,012 2,091 2,172 6,399 3,746 409 16,025 Net Payments 1 187 190 0 3,278 1,825 -579 -2,023 961 75 3,915
Dairy Subsidy 0 2,112 269 977 68,143 39,808 5,406 3,820 9,883 604 131,022
Other Payments Two Price Wheat 0 0 5 0 51 1,817 9,325 31,639 16,934 593 60,364 Prairie Farm Assistance 0 0 0 0 0 0 147 1,419 3,273 559 5,398 Western Emergency Assistance 0 0 0 0 0 0 0 0 3,271 1,147 4,418 Rain Damage 0 0 0 0 1,360 304 0 0 0 0 1,664 Waterfowl Damage 0 0 0 0 0 0 8 561 474 0 1,043 Compensation for Animal Losses 0 7 8 5 181 132 95 294 61 11 794 Crop Loss Compensation 0 0 0 0 0 0 0 0 350 0 350 Lower Inventory for Tomorrow 0 0 0 0 0 0 0 24 4 0 28
Total Gross Payments 0 7 13 5 1,592 2,253 9,575 33,937 24,367 2,310 74,059
TOTAL PAYMENTSGross Payments 1 2,453 525 986 74,091 46,006 16,586 42,137 38,961 5,496 227,242Producer Premiums 0 147 49 0 1,012 2,091 2,172 6,399 3,746 409 16,025Net Payments 1 2,306 476 986 73,079 43,915 14,414 35,738 35,215 5,087 211,217
REBATES REDUCING EXPENSES
Fertilizer 0 0 0 0 189 0 0 0 0 0 189 Lime 0 0 0 0 0 0 0 0 0 73 73 Property Taxes 0 0 0 0 6,778 22,530 4,599 8,117 0 0 42,024
TOTAL REBATES 0 0 0 0 6,967 22,530 4,599 8,117 0 73 42,286
TOTAL, DIRECT PAYMENTS AND REBATESGross Payments 1 2,453 525 986 81,058 68,536 21,185 50,254 38,961 5,569 269,528Producer Premiums 0 147 49 0 1,012 2,091 2,172 6,399 3,746 409 16,025Net Payments 1 2,306 476 986 80,046 66,445 19,013 43,855 35,215 5,160 253,503
NOTE: Unless indicated, there is no producer participation in the funding of the programs. See Explanatory Notes for brief program description.
Statistics Canada - Catalogue No.21-015-XIE 3

Direct program payments to agriculture producers - Agriculture economic statistics - 1974 June 1989 '000 of dollars
N.L. P.E.I. N.S. N.B. Que. Ont. Man. Sask. Alta. B.C. Canada Payments Enhancing Receipts
Western Grain Stabilization Gross Payments 0 0 0 0 0 0 0 0 0 0 0 Producer Premiums 0 0 0 0 0 0 0 0 0 0 0 Net Payments 0 0 0 0 0 0 0 0 0 0 0
Provincial Stabilization Programs Gross Payments 0 0 0 0 27,400 0 0 14,427 0 16,087 57,914 Producer Premiums 0 0 0 0 0 0 0 0 0 0 0 Net Payments 0 0 0 0 27,400 0 0 14,427 0 16,087 57,914
Agricultural Stab. Act (ASA) ASA Price Stabilization 19 22 9 9 36 1,062 406 533 2,175 69 4,340
Crop Insurance Gross Payments 18 378 145 305 2,824 6,661 3,475 10,042 16,230 839 40,917 Producer Prerniums 3 223 78 28 1,032 3,814 2,644 14,427 7,184 621 30,054 Net Payments 15 155 67 277 1,792 2,847 831 -4,385 9,046 218 10,863
Dairy Subsidy 0 3,126 1,419 1,560 109,782 66,392 9,295 5,541 19,007 4,937 221,059
Other Payments Crop Assistance 0 0 0 0 1,108 6 0 1,807 25,208 1,500 29,629 Dairy, Hog, Lamb Prod'n Incentive 0 0 0 0 0 0 0 0 12,960 0 12,960 Two Price Wheat 0 0 0 0 532 8,304 109 113 287 0 9,345 Compensation for Animal Losses 3 1 1 1 258 342 166 544 253 33 1,602 Waterfowl Damage 0 0 0 0 0 0 44 528 812 0 1,384 Crop Loss Compensation 0 0 0 0 0 0 0 0 790 0 790 Prairie Farm Assistance 0 0 0 0 0 0 0 0 445 1 446
Total Gross Payments 3 1 1 1 1,898 8,652 319 2,992 40,755 1,534 56,156
TOTAL PAYMENTSGross Payments 40 3,527 1,574 1,875 141,940 82,767 13,495 33,535 78,167 23,466 380,386Producer Premiums 3 223 78 28 1,032 3,814 2,644 14,427 7,184 621 30,054Net Payments 37 3,304 1,496 1,847 140,908 78,953 10,851 19,108 70,983 22,845 350,332
REBATES REDUCING EXPENSES
Fuel 0 0 0 0 0 0 0 3,910 0 0 3,910 Fertilizer 0 0 758 0 193 0 0 0 0 0 951 Lime 0 0 0 0 22 0 0 0 0 4 26 Property Taxes 0 0 0 0 7,873 23,522 5,611 9,105 0 0 46,111
TOTAL REBATES 0 0 758 0 8,088 23,522 5,611 13,015 0 4 50,998
TOTAL, DIRECT PAYMENTS AND REBATES
Gross Payments 40 3,527 2,332 1,875 150,028 106,289 19,106 46,550 78,167 23,470 431,384Producer Premiums 3 223 78 28 1,032 3,814 2,644 14,427 7,184 621 30,054Net Payments 37 3,304 2,254 1,847 148,996 102,475 16,462 32,123 70,983 22,849 401,330
NOTE: Unless indicated, there is no producer participation in the funding of the programs. See Explanatory Notes for brief program description.
4 Statistics Canada - Catalogue No.21-015-XIE

Direct program payments to agriculture producers - Agriculture economic statistics - 1975 June 1989 '000 of dollars
N.L. P.E.I. N.S. N.B. Que. Ont. Man. Sask. Alta. B.C. Canada Payments Enhancing Receipts
Western Grain Stabilization Gross Payments 0 0 0 0 0 0 0 0 0 0 0 Producer Premiums 0 0 0 0 0 0 0 0 0 0 0 Net Payments 0 0 0 0 0 0 0 0 0 0 0
Provincial Stabilization Programs Gross Payments 0 103 79 75 30,100 24,149 10,884 0 0 22,890 88,280 Producer Premiums 0 179 708 227 0 1,560 0 0 0 6,874 9,548 Net Payments 0 -76 -629 -152 30,100 22,589 10,884 0 0 16,016 78,732
Agricultural Stab. Act (ASA) ASA Price Stabilization 38 5,485 124 4,606 2,884 2,602 560 1,171 2,368 175 20,013
Crop Insurance Gross Payments 37 1,218 279 39 1,264 11,882 10,455 40,868 18,647 735 85,424 Producer Prerniums 3 375 100 30 623 4,708 4,068 19,936 14,191 977 45,011 Net Payments 34 843 179 9 641 7,174 6,387 20,932 4,456 -242 40,413
Dairy Subsidy 0 3,624 2,317 1,808 126,714 84,133 10,131 5,726 17,224 8,093 259,770
Other Payments Compensation for Animal Losses 0 3 3 3 526 1,554 300 824 547 79 3,839 Wintering Beef Cattle 0 0 0 0 3,001 0 0 0 0 0 3,001 Waterfowl Damage 0 0 0 0 0 0 178 563 884 0 1,625 Two Price Wheat 0 0 42 0 945 0 0 0 0 0 987 Crop Loss Compensation 0 0 0 0 0 0 0 0 500 0 500 Crop Assistance 0 0 0 0 0 0 190 0 0 0 190
Total Gross Payments 0 3 45 3 4,472 1,554 668 1,387 1,931 79 10,142
TOTAL PAYMENTSGross Payments 75 10,433 2,844 6,531 165,434 124,320 32,698 49,152 40,170 31,972 463,629Producer Premiums 3 554 808 257 623 6,268 4,068 19,936 14,191 7,851 54,559Net Payments 72 9,879 2,036 6,274 164,811 118,052 28,630 29,216 25,979 24,121 409,070
REBATES REDUCING EXPENSES
Fuel 0 0 0 0 0 7,000 0 7,820 0 0 14,820 Interest 0 0 0 0 0 0 0 0 0 1,826 1,826 Fertilizer 0 0 1,023 0 189 0 0 0 0 0 1,212 Lime 0 0 0 0 37 0 0 0 0 4 41 Property Taxes 0 0 0 0 8,087 27,704 6,570 10,161 0 0 52,522
TOTAL REBATES 0 0 1,023 0 8,313 34,704 6,570 17,981 0 1,830 70,421
TOTAL, DIRECT PAYMENTS AND REBATES
Gross Payments 75 10,433 3,867 6,531 173,747 159,024 39,268 67,133 40,170 33,802 534,050Producer Premiums 3 554 808 257 623 6,268 4,068 19,936 14,191 7,851 54,559Net Payments 72 9,879 3,059 6,274 173,124 152,756 35,200 47,197 25,979 25,951 479,491
NOTE: Unless indicated, there is no producer participation in the funding of the programs. See Explanatory Notes for brief program description.
Statistics Canada - Catalogue No.21-015-XIE 5

Direct program payments to agriculture producers - Agriculture economic statistics - 1976 June 1989 '000 of dollars
N.L. P.E.I. N.S. N.B. Que. Ont. Man. Sask. Alta. B.C. Canada Payments Enhancing Receipts
Western Grain Stabilization Gross Payments 0 0 0 0 0 0 0 0 0 0 0 Producer Premiums 0 0 0 0 0 0 4,206 13,039 7,155 150 24,550 Net Payments 0 0 0 0 0 0 -4,206 -13,039 -7,155 -150 -24,550
Provincial Stabilization Programs Gross Payments 0 192 192 96 3,607 22,650 19,250 0 41,910 41,816 129,713 Producer Premiums 0 131 224 148 437 1,786 0 0 0 9,530 12,256 Net Payments 0 61 -32 -52 3,170 20,864 19,250 0 41,910 32,286 117,457
Agricultural Stab. Act (ASA) ASA Price Stabilization 0 30 1,224 102 2,955 5,748 862 1,606 3,457 7,296 23,280
Crop Insurance Gross Payments 40 550 95 58 1,525 11,546 9,917 21,825 16,816 729 63,101 Producer Prerniums 3 437 113 28 1,310 5,760 5,047 23,855 16,419 1,333 54,305 Net Payments 37 113 -18 30 215 5,786 4,870 -2,030 397 -604 8,796
Dairy Subsidy 0 3,961 2,903 2,041 127,711 84,398 9,742 5,806 17,257 7,894 261,713
Other Payments Beef Industry Assistance 0 0 0 0 0 0 0 9,090 0 0 9,090 Wintering Beef Cattle 0 0 0 0 6,011 0 0 0 0 0 6,011 Compensation for Animal Losses 1 1 11 1 897 2,459 939 634 416 289 5,648 Waterfowl Damage 0 0 0 0 0 0 357 377 489 0 1,223 Two Price Wheat 0 0 15 0 381 0 0 0 0 0 396 Weanling Pig Bonus 58 0 0 0 0 0 0 0 0 0 58 Crop Loss Compensation 0 0 0 0 0 0 0 0 30 0 30
Total Gross Payments 59 1 26 1 7,289 2,459 1,296 10,101 935 289 22,456
TOTAL PAYMENTSGross Payments 99 4,734 4,440 2,298 143,087 126,801 41,067 39,338 80,375 58,024 500,263Producer Premiums 3 568 337 176 1,747 7,546 9,253 36,894 23,574 11,013 91,111Net Payments 96 4,166 4,103 2,122 141,340 119,255 31,814 2,444 56,801 47,011 409,152
REBATES REDUCING EXPENSES
Fuel 14 14 27 20 157 12,083 496 11,405 809 84 25,109 Interest 0 0 709 485 0 0 0 0 0 4,893 6,087 Fertilizer 0 0 1,007 0 174 0 0 0 0 0 1,181 Lime 0 0 0 0 39 0 0 0 0 6 45 Property Taxes 0 0 0 0 7,791 32,316 7,477 10,133 0 0 57,717
TOTAL REBATES 14 14 1,743 505 8,161 44,399 7,973 21,538 809 4,983 90,139
TOTAL, DIRECT PAYMENTS AND REBATES
Gross Payments 113 4,748 6,183 2,803 151,248 171,200 49,040 60,876 81,184 63,007 590,402Producer Premiums 3 568 337 176 1,747 7,546 9,253 36,894 23,574 11,013 91,111Net Payments 110 4,180 5,846 2,627 149,501 163,654 39,787 23,982 57,610 51,994 499,291
NOTE: Unless indicated, there is no producer participation in the funding of the programs. See Explanatory Notes for brief program description.
6 Statistics Canada - Catalogue No.21-015-XIE

Direct program payments to agriculture producers - Agriculture economic statistics - 1977 June 1989 '000 of dollars
N.L. P.E.I. N.S. N.B. Que. Ont. Man. Sask. Alta. B.C. Canada Payments Enhancing Receipts
Western Grain Stabilization Gross Payments 0 0 0 0 0 0 0 0 0 0 0 Producer Premiums 0 0 0 0 0 0 4,789 14,898 8,149 168 28,004 Net Payments 0 0 0 0 0 0 -4,789 -14,898 -8,149 -168 -28,004
Provincial Stabilization Programs Gross Payments 0 80 78 42 9,324 12,613 7,300 1 0 50,586 80,024 Producer Premiums 0 70 115 59 2,037 1,888 0 53 0 17,623 21,845 Net Payments 0 10 -37 -17 7,287 10,725 7,300 -52 0 32,963 58,179
Agricultural Stab. Act (ASA) ASA Price Stabilization 2 342 322 388 1,615 17,412 4,148 5,237 15,603 3,624 48,693
Crop Insurance Gross Payments 18 1,107 218 171 1,744 19,945 6,463 27,226 38,780 1,480 97,152 Producer Prerniums 2 408 128 34 1,465 5,347 7,042 33,802 18,194 1,245 67,667 Net Payments 16 699 90 137 279 14,598 -579 -6,576 20,586 235 29,485
Dairy Subsidy 0 4,025 3,160 2,052 136,472 91,061 10,589 6,159 17,212 9,395 280,125
Other Payments Beef Industry Assistance 0 0 0 0 0 0 0 21,798 0 0 21,798 Compensation for Animal Losses 0 1 9 20 1,621 3,342 967 1,103 947 1,022 9,032 Wintering Beef Cattle 0 0 0 0 5,627 0 0 0 0 0 5,627 Waterfowl Damage 0 0 0 0 0 0 123 195 381 0 699 Forage Transportation Assist. 0 0 0 0 0 0 0 227 0 0 227 Weanling Pig Bonus 74 0 0 0 0 0 0 0 0 0 74 Crop Loss Compensation 0 0 0 0 0 0 0 0 18 0 18
Total Gross Payments 74 1 9 20 7,248 3,342 1,090 23,323 1,346 1,022 37,475
TOTAL PAYMENTSGross Payments 94 5,555 3,787 2,673 156,403 144,373 29,590 61,946 72,941 66,107 543,469Producer Premiums 2 478 243 93 3,502 7,235 11,831 48,753 26,343 19,036 117,516Net Payments 92 5,077 3,544 2,580 152,901 137,138 17,759 13,193 46,598 47,071 425,953
REBATES REDUCING EXPENSES
Fuel 118 127 178 201 1,305 15,156 3,766 14,070 8,039 895 43,855 Interest 0 0 1,088 575 0 0 0 0 0 7,549 9,212 Fertilizer 0 0 803 0 152 0 0 0 0 0 955 Lime 0 625 120 397 38 0 0 0 0 3 1,183 Property Taxes 0 0 0 0 7,898 36,223 7,910 10,125 0 0 62,156
TOTAL REBATES 118 752 2,189 1,173 9,393 51,379 11,676 24,195 8,039 8,447 117,361
TOTAL, DIRECT PAYMENTS AND REBATES
Gross Payments 212 6,307 5,976 3,846 165,796 195,752 41,266 86,141 80,980 74,554 660,830Producer Premiums 2 478 243 93 3,502 7,235 11,831 48,753 26,343 19,036 117,516Net Payments 210 5,829 5,733 3,753 162,294 188,517 29,435 37,388 54,637 55,518 543,314
NOTE: Unless indicated, there is no producer participation in the funding of the programs. See Explanatory Notes for brief program description.
Statistics Canada - Catalogue No.21-015-XIE 7

Direct program payments to agriculture producers - Agriculture economic statistics - 1978 June 1989 '000 of dollars
N.L. P.E.I. N.S. N.B. Que. Ont. Man. Sask. Alta. B.C. Canada Payments Enhancing Receipts
Western Grain Stabilization Gross Payments 0 0 0 0 0 0 17,868 69,092 27,275 722 114,957 Producer Premiums 0 0 0 0 0 0 4,684 16,965 6,712 200 28,561 Net Payments 0 0 0 0 0 0 13,184 52,127 20,563 522 86,396
Provincial Stabilization Programs Gross Payments 0 0 0 0 785 0 6,706 0 0 37,012 44,503 Producer Premiums 0 270 746 294 3,268 0 14 248 0 19,281 24,121 Net Payments 0 -270 -746 -294 -2,483 0 6,692 -248 0 17,731 20,382
Agricultural Stab. Act (ASA) ASA Price Stabilization 12 3,208 144 2,982 1,994 7,985 3,599 8,426 12,097 2,174 42,621
Crop Insurance Gross Payments 26 500 125 55 1,700 16,500 6,000 28,000 22,500 1,235 76,641 Producer Prerniums 2 573 143 34 1,800 8,340 8,276 33,860 18,640 1,500 73,168 Net Payments 24 -73 -18 21 -100 8,160 -2,276 -5,860 3,860 -265 3,473
Dairy Subsidy 0 4,125 3,189 2,315 119,836 81,216 10,370 6,528 17,683 7,855 253,117
Other Payments Compensation for Animal Losses 1 2 8 1 1,550 3,430 695 530 1,337 265 7,819 Wintering Beef Cattle 0 0 0 0 5,155 0 0 0 0 0 5,155 Waterfowl Damage 0 0 0 0 0 0 392 335 1,496 0 2,223 Forage Transportation Assist. 0 0 0 0 0 0 0 378 804 0 1,182 Crop Loss Compensation 0 0 0 0 0 0 0 0 95 0 95 Weanling Pig Bonus 52 0 0 0 0 0 0 0 0 0 52
Total Gross Payments 53 2 8 1 6,705 3,430 1,087 1,243 3,732 265 16,526
TOTAL PAYMENTSGross Payments 91 7,835 3,466 5,353 131,020 109,131 45,630 113,289 83,287 49,263 548,365Producer Premiums 2 843 889 328 5,068 8,340 12,974 51,073 25,352 20,981 125,850Net Payments 89 6,992 2,577 5,025 125,952 100,791 32,656 62,216 57,935 28,282 422,515
REBATES REDUCING EXPENSES
Fuel 105 154 198 256 1,478 13,605 4,027 10,958 8,416 986 40,183 Interest 0 0 1,288 662 0 0 0 0 0 4,385 6,335 Fertilizer 0 0 1,664 0 174 0 0 0 0 0 1,838 Lime 0 258 153 267 32 0 0 0 0 6 716 Property Taxes 0 0 0 0 7,879 39,952 7,529 11,135 0 0 66,495
TOTAL REBATES 105 412 3,303 1,185 9,563 53,557 11,556 22,093 8,416 5,377 115,567
TOTAL, DIRECT PAYMENTS AND REBATES
Gross Payments 196 8,247 6,769 6,538 140,583 162,688 57,186 135,382 91,703 54,640 663,932Producer Premiums 2 843 889 328 5,068 8,340 12,974 51,073 25,352 20,981 125,850Net Payments 194 7,404 5,880 6,210 135,515 154,348 44,212 84,309 66,351 33,659 538,082
NOTE: Unless indicated, there is no producer participation in the funding of the programs. See Explanatory Notes for brief program description.
8 Statistics Canada - Catalogue No.21-015-XIE

Direct program payments to agriculture producers - Agriculture economic statistics - 1979 June 1989 '000 of dollars
N.L. P.E.I. N.S. N.B. Que. Ont. Man. Sask. Alta. B.C. CanadaPAYMENTS ENHANCING RECEIPTS
Western Grain Stabilization Gross Payments 0 0 0 0 0 0 41,389 150,330 59,525 1,693 252,937 Producer Premiums 0 0 0 0 0 0 6,637 24,040 9,511 283 40,471 Net Payments 0 0 0 0 0 0 34,752 126,290 50,014 1,410 212,466
Provincial Stabilization Programs Gross Payments 0 389 646 299 7,904 8,249 446 0 0 9,419 27,352 Producer Premiums 0 97 200 86 3,322 2,749 1,571 207 0 4,648 12,880 Net Payments 0 292 446 213 4,582 5,500 -1,125 -207 0 4,771 14,472
Agricultural Stab. Act (ASA) ASA Price Stabilization 49 3,051 342 2,946 9,253 39,648 733 3 598 7 56,630
Crop Insurance Gross Payments 8 2,537 302 112 3,161 52,282 11,177 103,010 24,767 3,521 200,877 Producer Prerniums 3 682 151 15 2,496 8,631 8,494 34,120 20,972 1,742 77,306 Net Payments 5 1,855 151 97 665 43,651 2,683 68,890 3,795 1,779 123,571
Dairy Subsidy 0 4,430 3,656 2,128 120,238 78,192 9,757 5,767 14,848 7,100 246,116
Other Payments Waterfowl Damage 0 0 0 0 0 0 450 1,350 1,200 0 3,000 Compensation for Animal Losses 1 0 173 1 857 1,359 422 578 1,141 373 4,905 Wintering Beef Cattle 0 0 0 0 4,906 0 0 0 0 0 4,906 Weanling Pig Bonus 85 0 0 0 0 0 0 0 0 0 85 Crop Loss Compensation 0 0 0 0 0 0 0 0 44 0 44
Total Gross Payments 86 0 173 1 5,763 1,359 872 1,928 2,385 373 12,940
TOTAL PAYMENTSGross Payments 143 10,407 5,119 5,486 146,319 179,730 64,374 261,038 102,123 22,113 796,852Producer Premiums 3 779 351 101 5,818 11,380 16,702 58,367 30,483 6,673 130,657Net Payments 140 9,628 4,768 5,385 140,501 168,350 47,672 202,671 71,640 15,440 666,195
REBATES REDUCING EXPENSES
Fuel 89 154 202 248 1,436 13,822 3,960 12,590 6,993 824 40,318 Interest 0 0 1,454 719 15,409 0 0 0 0 8,243 25,825 Fertilizer 0 0 775 0 190 0 0 0 0 0 965 Lime 0 275 188 297 3,369 0 0 0 0 7 4,136 Property Taxes 0 0 0 0 6,470 39,827 7,294 11,501 0 0 65,092
TOTAL REBATES 89 429 2,619 1,264 26,874 53,649 11,254 24,091 6,993 9,074 136,336
TOTAL, DIRECT PAYMENTS AND REBATES
Gross Payments 232 10,836 7,738 6,750 173,193 233,379 75,628 285,129 109,116 31,187 933,188Producer Premiums 3 779 351 101 5,818 11,380 16,702 58,367 30,483 6,673 130,657Net Payments 229 10,057 7,387 6,649 167,375 221,999 58,926 226,762 78,633 24,514 802,531
NOTE: Unless indicated, there is no producer participation in the funding of the programs. See Explanatory Notes for brief program description.
Statistics Canada - Catalogue No.21-015-XIE 9

Direct program payments to agriculture producers - Agriculture economic statistics - 1980 June 1989 '000 of dollars
N.L. P.E.I. N.S. N.B. Que. Ont. Man. Sask. Alta. B.C. Canada Payments Enhancing Receipts
Western Grain Stabilization Gross Payments 0 0 0 0 0 0 0 0 0 0 0 Producer Premiums 0 0 0 0 0 0 9,270 24,394 14,636 488 48,788 Net Payments 0 0 0 0 0 0 -9,270 -24,394 -14,636 -488 -48,788
Provincial Stabilization Programs Gross Payments 0 1,808 2,274 951 14,409 10,221 0 2,866 0 11,442 43,971 Producer Premiums 0 14 27 14 5,232 3,407 661 0 0 6,002 15,357 Net Payments 0 1,794 2,247 937 9,177 6,814 -661 2,866 0 5,440 28,614
Agricultural Stab. Act (ASA) ASA Price Stabilization 84 2,555 639 2,400 7,334 16,181 2,483 1,643 3,186 203 36,708
Crop Insurance Gross Payments 5 1,836 188 731 16,972 16,377 55,289 135,334 32,948 2,182 261,862 Producer Prerniums 2 866 156 321 4,021 13,537 9,763 41,450 26,104 1,718 97,938 Net Payments 3 970 32 410 12,951 2,840 45,526 93,884 6,844 464 163,924
Dairy Subsidy 0 4,753 3,839 2,559 123,929 80,364 10,115 6,059 15,612 7,883 255,113
Other Payments Herd Maintenance 0 0 0 0 0 0 6,030 12,108 578 0 18,716 Stop Loss for Hogs 0 0 0 0 0 0 0 0 12,018 0 12,018 Compensation for Animal Losses 0 0 5 7 1,993 2,202 419 349 983 425 6,383 Wintering Beef Cattle 0 0 0 0 4,114 0 0 0 0 0 4,114 Waterfowl Damage 0 0 0 0 0 0 284 1,009 869 0 2,162 Livestock Fodder Procurement 0 0 0 0 0 0 80 250 8 0 338 Weanling Pig Bonus 60 0 0 0 0 0 0 0 0 0 60 Crop Loss Compensation 0 0 0 0 0 0 0 0 55 0 55
Total Gross Payments 60 0 5 7 6,107 2,202 6,813 13,716 14,511 425 43,846
TOTAL PAYMENTSGross Payments 149 10,952 6,945 6,648 168,751 125,345 74,700 159,618 66,257 22,135 641,500Producer Premiums 2 880 183 335 9,253 16,944 19,694 65,844 40,740 8,208 162,083Net Payments 147 10,072 6,762 6,313 159,498 108,401 55,006 93,774 25,517 13,927 479,417
REBATES REDUCING EXPENSES
Fuel 52 116 124 196 1,067 9,800 2,812 14,625 5,439 642 34,873 Interest 0 0 1,700 1,625 45,024 0 0 0 0 23,300 71,649 Fertilizer 0 0 1,500 0 133 0 0 0 0 0 1,633 Lime 0 747 0 0 2,613 0 0 0 0 0 3,360 Property Taxes 0 0 0 0 9,283 41,687 9,472 10,964 0 0 71,406
TOTAL REBATES 52 863 3,324 1,821 58,120 51,487 12,284 25,589 5,439 23,942 182,921
TOTAL, DIRECT PAYMENTS AND REBATES
Gross Payments 201 11,815 10,269 8,469 226,871 176,832 86,984 185,207 71,696 46,077 824,421Producer Premiums 2 880 183 335 9,253 16,944 19,694 65,844 40,740 8,208 162,083Net Payments 199 10,935 10,086 8,134 217,618 159,888 67,290 119,363 30,956 37,869 662,338
NOTE: Unless indicated, there is no producer participation in the funding of the programs. See Explanatory Notes for brief program description.
10 Statistics Canada - Catalogue No.21-015-XIE

Direct program payments to agriculture producers - Agriculture economic statistics - 1981 June 1989 '000 of dollars
N.L. P.E.I. N.S. N.B. Que. Ont. Man. Sask. Alta. B.C. Canada Payments Enhancing Receipts
Western Grain Stabilization Gross Payments 0 0 0 0 0 0 0 0 0 0 0 Producer Premiums 0 0 0 0 0 0 9,690 33,060 13,680 570 57,000 Net Payments 0 0 0 0 0 0 -9,690 -33,060 -13,680 -570 -57,000
Provincial Stabilization Programs Gross Payments 0 1,140 2,539 1,381 18,990 9,784 8,504 4,612 4,264 36,946 88,160 Producer Premiums 0 6 6 0 8,637 3,261 2,956 1,188 1,634 15,751 33,439 Net Payments 0 1,134 2,533 1,381 10,353 6,523 5,548 3,424 2,630 21,195 54,721
Agricultural Stab. Act (ASA) ASA Price Stabilization 294 5,106 1,893 4,359 47,880 38,732 11,394 6,280 13,827 2,451 132,216
Crop Insurance Gross Payments 1 1,236 238 197 7,000 18,496 18,529 92,010 27,396 5,938 171,041 Producer Prerniums 2 1,078 201 406 5,136 15,660 12,036 53,510 31,739 2,095 121,863 Net Payments -1 158 37 -209 1,864 2,836 6,493 38,500 -4,343 3,843 49,178
Dairy Subsidy 0 4,946 3,835 3,025 135,132 90,240 10,351 6,900 17,263 9,440 281,132
Other Payments Grain Embargo 0 0 0 0 0 13,000 9,270 39,578 18,675 476 80,999 Beef Cattle Assistance 0 0 0 0 0 37,286 0 0 0 0 37,286 Herd Maintenance 0 0 0 0 0 0 10,496 13,013 2,760 0 26,269 Stop Loss for Hogs 0 0 0 0 0 0 0 0 9,085 0 9,085 Compensation for Animal Losses 0 4 5 50 2,381 1,412 1,183 118 355 65 5,573 Waterfowl Damage 0 0 0 0 0 0 479 1,493 1,614 0 3,586 Wintering Beef Cattle 0 0 0 0 3,551 0 0 0 0 0 3,551 Livestock Fodder Procurement 0 0 0 0 0 0 1,586 1,355 85 0 3,026 Crop Loss Compensation 0 0 0 0 0 0 0 0 97 0 97 Weanling Pig Bonus 60 0 0 0 0 0 0 0 0 0 60
Total Gross Payments 60 4 5 50 5,932 51,698 23,014 55,557 32,671 541 169,532
TOTAL PAYMENTSGross Payments 355 12,432 8,510 9,012 214,934 208,950 71,792 165,359 95,421 55,316 842,081Producer Premiums 2 1,084 207 406 13,773 18,921 24,682 87,758 47,053 18,416 212,302Net Payments 353 11,348 8,303 8,606 201,161 190,029 47,110 77,601 48,368 36,900 629,779
REBATES REDUCING EXPENSES
Fuel 38 92 119 177 2,607 11,246 2,419 19,807 4,631 513 41,649 Interest 0 0 1,008 2,314 67,837 0 0 0 12,543 12,399 96,101 Fertilizer 0 0 1,500 0 60 0 0 0 0 0 1,560 Lime 0 707 0 0 1,801 0 0 0 0 0 2,508 Property Taxes 0 0 0 0 16,316 46,350 9,525 12,556 0 0 84,747 Heating Fuel 0 0 0 0 0 0 0 0 280 0 280
TOTAL REBATES 38 799 2,627 2,491 88,621 57,596 11,944 32,363 17,454 12,912 226,845
TOTAL, DIRECT PAYMENTS AND REBATES
Gross Payments 393 13,231 11,137 11,503 303,555 266,546 83,736 197,722 112,875 68,228 1,068,926Producer Premiums 2 1,084 207 406 13,773 18,921 24,682 87,758 47,053 18,416 212,302Net Payments 391 12,147 10,930 11,097 289,782 247,625 59,054 109,964 65,822 49,812 856,624
NOTE: Unless indicated, there is no producer participation in the funding of the programs. See Explanatory Notes for brief program description.
Statistics Canada - Catalogue No.21-015-XIE 11

Direct program payments to agriculture producers - Agriculture economic statistics - 1982 June 1989 '000 of dollars
N.L. P.E.I. N.S. N.B. Que. Ont. Man. Sask. Alta. B.C. Canada Payments Enhancing Receipts
Western Grain Stabilization Gross Payments 0 0 0 0 0 0 0 0 0 0 0 Producer Premiums 0 0 0 0 0 0 8,706 31,021 14,987 386 55,100 Net Payments 0 0 0 0 0 0 -8,706 -31,021 -14,987 -386 -55,100
Provincial Stabilization Programs Gross Payments 0 443 824 669 44,529 7,611 3,442 31,552 7,334 70,943 167,347 Producer Premiums 0 380 750 314 13,836 2,537 1,233 6,928 6,391 32,908 65,277 Net Payments 0 63 74 355 30,693 5,074 2,209 24,624 943 38,035 102,070
Agricultural Stab. Act (ASA) ASA Price Stabilization 11 139 1,282 257 5,525 8,685 246 434 1,621 6,805 25,005
Crop Insurance Gross Payments 1 1,785 112 240 8,996 19,941 20,019 82,043 82,000 6,176 221,313 Producer Prerniums 3 1,047 234 452 6,379 19,642 15,746 56,336 32,367 2,403 134,609 Net Payments -2 738 -122 -212 2,617 299 4,273 25,707 49,633 3,773 86,704
Dairy Subsidy 0 5,256 3,394 3,491 131,513 87,250 10,092 6,829 17,944 8,667 274,436
Other Payments Beef Cattle and Sheep Support 0 0 0 0 0 0 0 0 141,611 0 141,611 Beef Cattle Assistance 0 0 0 0 0 20,328 0 0 0 0 20,328 Beef Enhancement 0 0 0 0 0 0 7,034 0 0 0 7,034 Herd Maintenance 0 0 0 0 0 0 0 5,900 0 0 5,900 Compensation for Animal Losses 0 0 9 314 677 1,470 648 22 331 13 3,484 Wintering Beef Cattle 0 0 0 0 3,017 0 0 0 0 0 3,017 Waterfowl Damage 0 0 0 0 0 0 388 330 467 0 1,185 Livestock Compensation 0 0 0 0 0 0 0 136 0 0 136 Crop Loss Compensation 0 0 0 0 0 0 0 0 99 0 99 Weanting Pig Bonus 40 0 0 0 0 0 0 0 0 0 40
Total Gross Payments 40 0 9 314 3,694 21,798 8,070 6,388 142,508 13 182,834
TOTAL PAYMENTSGross Payments 52 7,623 5,621 4,971 194,257 145,285 41,869 127,246 251,407 92,604 870,935Producer Premiums 3 1,427 984 766 20,215 22,179 25,685 94,285 53,745 35,697 254,986Net Payments 49 6,196 4,637 4,205 174,042 123,106 16,184 32,961 197,662 56,907 615,949
REBATES REDUCING EXPENSES
Fuel 17 109 112 184 2,998 11,964 2,337 2,710 5,191 521 26,143 Interest 0 0 1,160 0 112,104 15,050 1,785 0 22,775 8,075 160,949 Fertilizer 0 0 1,584 0 2 0 0 0 0 0 1,586 Lime 0 766 0 0 1,141 0 0 0 0 0 1,907 Property Taxes 0 0 0 0 19,840 50,378 9,513 12,871 0 0 92,602 Heating Fuel 0 0 0 0 0 0 0 0 680 0 680
TOTAL REBATES 17 875 2,856 184 136,085 77,392 13,635 15,581 28,646 8,596 283,867
TOTAL, DIRECT PAYMENTS AND REBATES
Gross Payments 69 8,498 8,477 5,155 330,342 222,677 55,504 142,827 280,053 101,200 1,154,802Producer Premiums 3 1,427 984 766 20,215 22,179 25,685 94,285 53,745 35,697 254,986Net Payments 66 7,071 7,493 4,389 310,127 200,498 29,819 48,542 226,308 65,503 899,816
NOTE: Unless indicated, there is no producer participation in the funding of the programs. See Explanatory Notes for brief program description.
12 Statistics Canada - Catalogue No.21-015-XIE

Direct program payments to agriculture producers - Agriculture economic statistics - 1983 May 1994 '000 of dollars
N.L. P.E.I. N.S. N.B. Que. Ont. Man. Sask. Alta. B.C. Canada Payments Enhancing Receipts
Western Grain Stabilization Gross Payments 0 0 0 0 0 0 0 0 0 0 0 Producer Premiums 0 0 0 0 0 0 10,940 36,830 17,067 438 65,275 Net Payments 0 0 0 0 0 0 -10,940 -36,830 -17,067 -438 -65,275
Provincial Stabilization Programs Gross Payments 0 1,779 2,203 1,314 64,148 2,045 22,389 27,026 8,117 57,901 186,922 Producer Premiums 0 86 121 8 19,493 682 8,963 8,172 6,084 29,785 73,394 Net Payments 0 1,693 2,082 1,306 44,655 1,363 13,426 18,854 2,033 28,116 113,528
Agricultural Stabilization Payments Price Stabilization Payments 1 11 58 25 1,136 18,673 1,838 134 3,523 1,258 26,657
Crop Insurance Gross Payments 1 2,505 438 3,270 33,873 78,896 30,293 105,946 100,121 8,154 363,497 Producer Premiums 2 1,100 220 977 11,970 21,323 17,921 56,633 56,703 2,464 169,313 Net Payments -1 1,405 218 2,293 21,903 57,573 12,372 49,313 43,418 5,690 194,184
Dairy Subsidy 0 5,188 3,265 3,596 129,468 87,454 10,936 7,313 18,232 143 265,595
Other Payments Beef Enhancement 0 0 0 0 0 0 6,484 0 0 0 6,484 Wintering Beef Cattle 0 0 0 0 2,326 0 0 0 0 0 2,326 Compensation for Animal Losses 0 0 13 2 457 1,265 267 17 63 15 2,099 Waterfowl Damage 0 0 0 0 0 0 174 718 659 0 1,551 Crop Loss Compensation 0 0 0 0 0 0 0 0 67 0 67 Weanling Pig Bonus 40 0 0 0 0 0 0 0 0 0 40
Total Gross Payments 40 0 13 2 2,783 1,265 6,925 735 789 15 12,567
TOTAL PAYMENTSGross Payments 42 9,483 5,977 8,207 231,408 188,333 72,381 141,154 130,782 67,471 855,238Producer Premiums 2 1,186 341 985 31,463 22,005 37,824 101,635 79,854 32,687 307,982Net Payments 40 8,297 5,636 7,222 199,945 166,328 34,557 39,519 50,928 34,784 547,256
REBATES REDUCING EXPENSES
Fuel 13 99 90 144 4,126 14,367 2,216 2,514 4,423 426 28,418 Interest 0 0 1,130 0 70,210 3,200 2,049 3,308 56,121 6,872 142,890 Fertilizer 0 0 1,592 0 0 0 0 0 0 0 1,592 Lime 0 641 0 0 597 0 0 0 0 0 1,238 Property Taxes 0 0 0 0 20,610 54,075 9,237 13,115 0 0 97,037 Heating Fuel 0 0 0 0 0 0 0 0 2,328 0 2,328
TOTAL REBATES 13 740 2,812 144 95,543 71,642 13,502 18,937 62,872 7,298 273,503
TOTAL, DIRECT PAYMENTS AND REBATES
Gross Payments 55 10,223 8,789 8,351 326,951 259,975 85,883 160,091 193,654 74,769 1,128,741 Producer Premiums 2 1,186 341 985 31,463 22,005 37,824 101,635 79,854 32,687 307,982 Net Payments 53 9,037 8,448 7,366 295,488 237,970 48,059 58,456 113,800 42,082 820,759
NOTE: Unless indicated, there is no producer participation in the funding of the programs. See Explanatory Notes for brief program description.
Statistics Canada - Catalogue No.21-015-XIE 13

Direct program payments to agriculture producers - Agriculture economic statistics - 1984 May 1997 '000 of dollars
N.L. P.E.I. N.S. N.B. Que. Ont. Man. Sask. Alta. B.C. Canada Payments Enhancing Receipts
Gross Revenue Insurance Plan (GRIP) Gross Payments 0 0 0 0 0 0 0 0 0 0 0 Producer Premiums 0 0 0 0 0 0 0 0 0 0 0 Net Payments 0 0 0 0 0 0 0 0 0 0 0
Net Income Stabilization Account (NISA) 0 0 0 0 0 0 0 0 0 0 0
Western Grain Stabilization Gross Payments 0 0 0 0 0 0 36,127 125,940 59,338 1,510 222,915 Producer Premiums 0 0 0 0 0 0 8,902 26,384 13,192 322 48,800 Net Payments 0 0 0 0 0 0 27,225 99,556 46,146 1,188 174,115
Provincial Stabilization Programs Gross Payments 0 2,342 3,630 2,310 127,126 16,313 24,589 21,590 22,236 57,735 277,871 Producer Premiums 0 0 0 0 34,412 2,080 9,890 9,345 7,264 30,974 93,965 Net Payments 0 2,342 3,630 2,310 92,714 14,233 14,699 12,245 14,972 26,761 183,906
Price Stabilization Payments 185 52 2,790 197 27,069 78,828 9,331 695 10,178 8,362 137,687
Tripartite Payments Gross Payments 0 0 0 0 0 0 0 0 0 0 0 Producer Premiums 0 0 0 0 0 0 0 0 0 0 0 Net Payments 0 0 0 0 0 0 0 0 0 0 0
Crop Insurance Gross Payments 5 2,320 166 2,336 15,678 18,275 37,646 171,752 196,758 11,041 455,977 Producer Premiums 2 1,180 223 1,192 7,973 21,360 21,336 49,943 62,362 3,163 168,734 Net Payments 3 1,140 -57 1,144 7,705 -3,085 16,310 121,809 134,396 7,878 287,243
Dairy Subsidy 0 5,363 3,892 3,826 139,111 90,238 11,246 7,595 19,499 19 280,789
Other Payments Livestock Drought 0 0 0 0 0 0 2,838 21,152 16,142 0 40,132 Crop Loss Compensation 0 0 0 0 0 0 0 7,399 133 0 7,532 Waterfowl Damage 0 0 0 0 0 0 164 904 1,208 0 2,276 Wintering Beef Cattle 0 0 0 0 1,798 0 0 0 0 0 1,798 Compensation for Animal Losses 0 0 0 0 143 823 283 145 307 28 1,729 Livestock Transportation 0 0 0 0 0 0 0 247 0 0 247 Lambs Payments 0 0 0 0 0 0 0 210 0 0 210 Beef Enhancement 0 0 0 0 0 0 45 0 0 0 45 Weanling Pig Bonus 40 0 0 0 0 0 0 0 0 0 40
Total Gross Payments 40 0 0 0 1,941 823 3,330 30,057 17,790 28 54,009
TOTAL PAYMENTSGross Payments 230 10,077 10,478 8,669 310,925 204,477 122,269 357,629 325,799 78,695 1,429,248Producer Premiums 2 1,180 223 1,192 42,385 23,440 40,128 85,672 82,818 34,459 311,499Net Payments 228 8,897 10,255 7,477 268,540 181,037 82,141 271,957 242,981 44,236 1,117,749
Rebates Reducing Expenses Electricity 0 0 0 0 0 0 0 0 0 0 0 Fuel 10 93 86 163 4,281 14,295 2,186 3,417 4,145 443 29,119 Heating Fuel 0 0 0 0 0 0 0 0 3,045 0 3,045 Interest 0 0 1,153 0 65,087 2,894 6,448 10,887 48,933 10,981 146,383 Fertilizer 0 0 1,577 0 0 0 0 0 0 0 1,577 Lime 0 698 0 0 710 0 0 0 0 0 1,408 Feed 0 0 0 0 0 0 0 0 0 0 0 Pesticides 0 0 0 0 0 0 0 0 0 0 0 Property Taxes 0 0 0 0 22,978 71,620 9,110 20,820 0 0 124,528 Seed 0 0 0 0 0 0 0 0 0 0 0 Veterinary and A.I. 0 0 0 0 0 3,175 0 0 0 0 3,175 Livestock Purchases 0 0 0 0 0 0 0 0 0 0 0
Total Rebates 10 791 2,816 163 93,056 91,984 17,744 35,124 56,123 11,424 309,235
Total, Direct Payments and Rebates
Gross Payments 240 10,868 13,294 8,832 403,981 296,461 140,013 392,753 381,922 90,119 1,738,483 Producer Premiums 2 1,180 223 1,192 42,385 23,440 40,128 85,672 82,818 34,459 311,499 Net Payments 238 9,688 13,071 7,640 361,596 273,021 99,885 307,081 299,104 55,660 1,426,984
NOTE: Unless indicated, there is no producer participation in the funding of the programs. See Explanatory Notes for brief program description.
14 Statistics Canada - Catalogue No.21-015-XIE

Direct program payments to agriculture producers - Agriculture economic statistics - 1985 May 1997 '000 of dollars
N.L. P.E.I. N.S. N.B. Que. Ont. Man. Sask. Alta. B.C. Canada Payments Enhancing Receipts
Gross Revenue Insurance Plan (GRIP) Gross Payments 0 0 0 0 0 0 0 0 0 0 0 Producer Premiums 0 0 0 0 0 0 0 0 0 0 0 Net Payments 0 0 0 0 0 0 0 0 0 0 0
Net Income Stabilization Account (NISA) 0 0 0 0 0 0 0 0 0 0 0
Western Grain Stabilization Gross Payments 0 0 0 0 0 0 87,776 292,357 138,317 3,374 521,824 Producer Premiums 0 0 0 0 0 0 7,746 21,043 9,553 258 38,600 Net Payments 0 0 0 0 0 0 80,030 271,314 128,764 3,116 483,224
Provincial Stabilization Programs Gross Payments 0 2,895 5,051 2,906 158,937 4,136 31,771 33,513 11,084 44,384 294,677 Producer Premiums 0 0 0 0 44,392 6,033 13,860 8,459 0 23,575 96,319 Net Payments 0 2,895 5,051 2,906 114,545 -1,897 17,911 25,054 11,084 20,809 198,358
Price Stabilization Payments 2 86 67 11 2,475 3,774 2,698 320 2,101 4,275 15,809
Tripartite Payments Gross Payments 0 0 0 0 0 0 0 0 0 0 0 Producer Premiums 0 0 0 0 0 0 0 0 0 0 0 Net Payments 0 0 0 0 0 0 0 0 0 0 0
Crop Insurance Gross Payments 1 3,682 380 4,651 5,842 12,088 31,329 282,693 249,153 14,310 604,129 Producer Premiums 4 1,246 225 1,280 11,647 20,870 27,628 72,463 66,243 4,178 205,784 Net Payments -3 2,436 155 3,371 -5,805 -8,782 3,701 210,230 182,910 10,132 398,345
Dairy Subsidy 0 5,090 3,502 3,720 133,344 90,018 10,935 6,979 18,591 9,894 282,073
Other Payments Livestock Drought 0 0 0 0 0 0 1,087 36,379 29,537 3,972 70,975 Crop Loss Compensation 0 0 0 0 31,253 0 1,094 0 925 0 33,272 Crop Insurance Restoration 0 0 0 0 0 0 0 0 20,543 0 20,543 Flood Compensation 0 0 0 0 0 0 0 7,481 0 0 7,481 Waterfowl Damage 0 0 0 0 0 0 95 767 1,526 0 2,388 Sugar Beet Subsidy 0 0 0 0 0 0 1,742 0 0 0 1,742 Compensation for Animal Losses 0 0 52 56 22 638 258 42 212 14 1,294 Temporary Guidelines Modifications 0 0 0 0 0 0 0 0 873 0 873 Fresh Vegetable Incentive 0 0 0 0 0 0 0 0 709 0 709 Swine Incentive 0 675 0 0 0 0 0 0 0 0 675 Livestock Transportation 0 0 0 0 0 0 0 385 0 0 385 Beef Cow-Calf Assistance 0 100 0 0 0 0 0 0 0 0 100 Weanling Pig Bonus 21 0 0 0 0 0 0 0 0 0 21 Beef Enhancement 0 0 0 0 0 0 15 0 0 0 15
Total Gross Payments 21 775 52 56 31,275 638 4,291 45,054 54,325 3,986 140,473
Total Payments Gross Payments 24 12,528 9,052 11,344 331,873 110,654 168,800 660,916 473,571 80,223 1,858,985 Producer Premiums 4 1,246 225 1,280 56,039 26,903 49,234 101,965 75,796 28,011 340,703 Net Payments 20 11,282 8,827 10,064 275,834 83,751 119,566 558,951 397,775 52,212 1,518,282
Rebates Reducing Expenses Property Taxes 0 0 0 0 23,864 76,352 8,982 3,103 0 0 112,301 Wages 0 0 0 0 0 0 0 0 0 0 0 Interest 0 0 1,174 0 60,911 37,457 6,738 17,117 38,293 5,215 166,905 Electricity 0 0 0 0 0 0 0 0 0 0 0 Heating Fuel 0 0 0 0 0 0 0 0 3,668 0 3,668 Fuel 13 162 114 293 4,039 14,680 3,218 6,409 9,330 748 39,006 Fertilizer and Lime 0 0 0 0 0 0 0 0 0 0 0 Pesticides 0 0 0 0 0 0 0 0 2,585 0 2,585 Seed 0 0 0 0 0 0 0 0 0 0 0 Feed 0 0 0 0 0 0 0 0 13,238 0 13,238 Veterinary and A.I. 0 0 0 0 0 5,571 0 0 0 0 5,571 Livestock Purchases 0 0 0 0 0 0 0 0 0 0 0Total Rebates 13 729 2,853 293 89,535 134,060 18,938 26,629 83,639 5,963 362,652
Total, Direct Payments and Rebates
Gross Payments 37 13,257 11,905 11,637 421,408 244,714 187,738 687,545 557,210 86,186 2,221,637 Producer Premiums 4 1,246 225 1,280 56,039 26,903 49,234 101,965 75,796 28,011 340,703 Net Payments 33 12,011 11,680 10,357 365,369 217,811 138,504 585,580 481,414 58,175 1,880,934
NOTE: Unless indicated, there is no producer participation in the funding of the programs. See Explanatory Notes for brief program description.
Statistics Canada - Catalogue No.21-015-XIE 15

Direct program payments to agriculture producers - Agriculture economic statistics - 1986 June 1999 '000 of dollars
N.L. P.E.I. N.S. N.B. Que. Ont. Man. Sask. Alta. B.C. Canada Payments Enhancing Receipts
Gross Revenue Insurance Plan (GRIP) Gross Payments 0 0 0 0 0 0 0 0 0 0 0 Producer Premiums 0 0 0 0 0 0 0 0 0 0 0 Net Payments 0 0 0 0 0 0 0 0 0 0 0
Net Income Stabilization Account (NISA) 0 0 0 0 0 0 0 0 0 0 0
Western Grain Stabilization Gross Payments 0 0 0 0 0 0 150,797 477,144 225,438 5,360 858,739 Producer Premiums 0 0 0 0 0 0 4,621 14,423 7,113 143 26,300 Net Payments 0 0 0 0 0 0 146,176 462,721 218,325 5,217 832,439
Provincial Stabilization Programs Gross Payments 762 926 1,657 934 191,576 13,734 19,463 27,256 31,014 44,054 331,376 Producer Premiums 0 445 1,158 622 57,309 4,581 12,909 9,926 0 22,652 109,602 Net Payments 762 481 499 312 134,267 9,153 6,554 17,330 31,014 21,402 221,774
Price Stabilization Payments 2 88 30 41 2,320 20,393 2,864 430 24 1,243 27,435
Tripartite Payments Gross Payments 0 26 0 0 0 1,156 0 0 1,879 0 3,061 Producer Premiums 0 76 1 0 0 8,697 1,900 931 7,989 0 19,594 Net Payments 0 -50 -1 0 0 -7,541 -1,900 -931 -6,110 0 -16,533
Crop Insurance Gross Payments 5 2,595 978 1,640 20,065 22,596 40,598 289,849 156,365 15,455 550,146 Producer Premiums 4 1,294 244 1,059 11,949 24,849 26,596 93,882 87,330 4,584 251,791 Net Payments 1 1,301 734 581 8,116 -2,253 14,002 195,967 69,035 10,871 298,355
Dairy Subsidy 0 5,331 3,654 3,672 131,233 85,815 10,628 7,206 18,878 10,227 276,644
Other Payments Crop Drought 0 0 0 0 0 0 0 69,569 72,168 7,219 148,956 Livestock Special Assistance 0 0 0 0 0 0 0 0 70,087 0 70,087 Crop Drought Special Assistance 0 0 0 0 0 0 0 51,716 0 0 51,716 Livestock Drought 0 0 0 0 0 0 0 1,350 41,325 1,000 43,675 Temporary Guidelines Modifications 0 0 0 0 0 0 0 0 12,093 0 12,093 Crop Insurance Restoration 0 0 0 0 0 0 0 0 11,600 0 11,600 Waterfowl Damage 0 0 0 0 0 0 1,126 6,429 3,502 0 11,057 Sugar Beet Incentive 0 0 0 0 0 0 3,485 0 4,553 0 8,038 Potato Diversion 0 4,258 0 0 0 0 0 0 0 0 4,258 Flood Compensation 0 0 0 0 0 0 0 0 4,058 0 4,058 Beehive Production Losses 0 0 0 0 0 0 0 0 2,439 0 2,439 Compensation for Animal Losses 0 0 68 0 46 766 300 71 594 10 1,855 Swine Incentive 0 1,375 0 0 0 0 0 0 0 0 1,375 Crop Loss Compensation 0 0 0 0 4 0 0 0 1,298 0 1,302 Sugar Beet Subsidy 0 0 0 0 0 0 1,132 0 0 0 1,132 Livestock Transportation 0 0 0 0 0 0 0 447 0 0 447 Cull Potato Burial Assistance 0 295 0 0 0 0 0 0 0 0 295 Beef Cow-Calf Assistance 0 131 0 0 0 0 0 0 0 0 131 Straw for Feed 0 0 0 0 0 0 0 0 0 95 95 Weanling Pig Bonus 19 0 0 0 0 0 0 0 0 0 19 Beef Enhancement 0 0 0 0 0 0 4 0 0 0 4
Total Gross Payments 19 6,059 68 0 50 766 6,047 129,582 223,717 8,324 374,632
Total Payments Gross Payments 788 15,025 6,387 6,287 345,244 144,460 230,397 931,467 657,315 84,663 2,422,033 Producer Premiums 4 1,815 1,403 1,681 69,258 38,127 46,026 119,162 102,432 27,379 407,287 Net Payments 784 13,210 4,984 4,606 275,986 106,333 184,371 812,305 554,883 57,284 2,014,746
Rebates Reducing Expenses Property Taxes 0 0 0 0 25,754 81,313 8,854 24 0 0 115,945 Wages 0 0 0 0 0 0 0 0 0 0 0 Interest 0 0 1,172 0 61,340 58,889 7,889 18,171 24,145 6,741 178,347 Electricity 0 0 0 0 2,116 0 0 0 0 0 2,116 Heating Fuel 0 0 0 0 0 0 0 0 5,412 0 5,412 Fuel 15 342 185 420 4,850 17,564 6,849 15,101 16,166 1,287 62,779 Fertilizer and Lime 0 570 1,459 0 517 0 0 0 19,200 0 21,746 Pesticides 0 0 0 0 0 0 0 0 2,500 0 2,500 Seed 0 0 0 0 0 0 0 0 0 0 0 Feed 0 0 0 0 0 0 0 0 74,800 0 74,800 Veterinary and A.I. 0 0 0 0 0 6,969 0 0 0 0 6,969 Livestock Purchases 0 0 0 0 0 0 0 0 0 0 0Total Rebates 15 912 2,816 420 94,577 164,735 23,592 33,296 142,223 8,028 470,614
Total, Direct Payments and Rebates
Gross Payments 803 15,937 9,203 6,707 439,821 309,195 253,989 964,763 799,538 92,691 2,892,647 Producer Premiums 4 1,815 1,403 1,681 69,258 38,127 46,026 119,162 102,432 27,379 407,287 Net Payments 799 14,122 7,800 5,026 370,563 271,068 207,963 845,601 697,106 65,312 2,485,360
NOTE: Unless indicated, there is no producer participation in the funding of the programs. See Explanatory Notes for brief program description.
16 Statistics Canada - Catalogue No.21-015-XIE

Direct program payments to agriculture producers - Agriculture economic statistics - 1987 June 1999 '000 of dollars
N.L. P.E.I. N.S. N.B. Que. Ont. Man. Sask. Alta. B.C. Canada Payments Enhancing Receipts
Gross Revenue Insurance Plan (GRIP) Gross Payments 0 0 0 0 0 0 0 0 0 0 0 Producer Premiums 0 0 0 0 0 0 0 0 0 0 0 Net Payments 0 0 0 0 0 0 0 0 0 0 0
Net Income Stabilization Account (NISA) 0 0 0 0 0 0 0 0 0 0 0
Western Grain Stabilization Gross Payments 0 0 0 0 0 0 260,112 759,238 368,036 8,087 1,395,473 Producer Premiums 0 0 0 0 0 0 4,791 14,909 9,115 385 29,200 Net Payments 0 0 0 0 0 0 255,321 744,329 358,921 7,702 1,366,273
Provincial Stabilization Programs Gross Payments 1,594 466 787 501 68,727 28,615 249 10,207 0 14,113 125,259 Producer Premiums 0 759 1,220 515 70,295 9,539 5,888 9,370 0 10,617 108,203 Net Payments 1,594 -293 -433 -14 -1,568 19,076 -5,639 837 0 3,496 17,056
Price Stabilization Payments 0 53 1,360 110 15,524 90,530 5,352 0 7,388 4,233 124,550
Tripartite Payments Gross Payments 0 6 0 0 0 181 0 0 982 0 1,169 Producer Premiums 0 71 233 1 320 14,147 5,988 2,732 16,271 1,039 40,802 Net Payments 0 -65 -233 -1 -320 -13,966 -5,988 -2,732 -15,289 -1,039 -39,633
Crop Insurance Gross Payments 42 3,200 627 4,748 51,329 15,215 41,586 110,289 130,277 10,084 367,397 Producer Premiums 3 1,296 272 1,171 15,051 22,837 24,274 69,391 73,452 5,189 212,936 Net Payments 39 1,904 355 3,577 36,278 -7,622 17,312 40,898 56,825 4,895 154,461
Dairy Subsidy 0 5,153 3,447 3,613 132,069 87,877 11,071 7,261 18,799 10,423 279,713
Other Payments Special Canadian Grain Program 0 2,409 739 861 32,124 109,397 154,576 408,086 252,410 5,500 966,102 Crop Insurance Restoration 0 0 0 0 0 0 0 0 17,776 0 17,776 Waterfowl Damage 0 0 0 0 0 0 836 6,621 3,496 0 10,953 Compensation for Animal Losses 0 55 69 0 230 1,323 344 12 455 52 2,540 Swine Incentive 0 1,212 0 0 0 0 0 0 0 0 1,212 Crop Loss Compensation 0 0 0 0 0 0 0 0 582 0 582 Finished Beef Cattle Assistance 0 0 358 0 0 0 0 0 0 0 358 Crop Drought 0 0 0 0 0 0 0 73 147 0 220 Cull Potato Burial Assistance 0 165 0 0 0 0 0 0 0 0 165 Beef Cow-Calf Assistance 0 118 0 0 0 0 0 0 0 0 118 Crop Drought Special Assistance 0 0 0 0 0 0 0 26 0 0 26 Weanling Pig Bonus 18 0 0 0 0 0 0 0 0 0 18 Livestock Drought 0 0 0 0 0 0 0 0 16 0 16 Livestock Transportation 0 0 0 0 0 0 0 11 0 0 11 Dairy Heifer Replacement Bonus 10 0 0 0 0 0 0 0 0 0 10
Total Gross Payments 28 3,959 1,166 861 32,354 110,720 155,756 414,829 274,882 5,552 1,000,107
Total Payments Gross Payments 1,664 12,837 7,387 9,833 300,003 333,138 474,126 1,301,824 800,364 52,492 3,293,668 Producer Premiums 3 2,126 1,725 1,687 85,666 46,523 40,941 96,402 98,838 17,230 391,141 Net Payments 1,661 10,711 5,662 8,146 214,337 286,615 433,185 1,205,422 701,526 35,262 2,902,527
Rebates Reducing Expenses Property Taxes 0 0 0 0 26,486 115,748 18,780 0 0 0 161,014 Wages 0 0 0 0 0 0 0 0 0 0 0 Interest 0 0 1,183 0 52,680 83,635 1,587 17,186 16,260 5,417 177,948 Electricity 0 0 0 0 2,009 0 0 0 0 0 2,009 Heating Fuel 0 0 0 0 0 0 0 0 2,743 0 2,743 Fuel 24 418 217 335 3,896 17,018 5,572 36,434 7,836 856 72,606 Fertilizer and Lime 0 847 1,508 0 602 0 0 0 16,420 0 19,377 Pesticides 0 0 0 0 0 0 0 0 789 0 789 Seed 0 24 0 0 0 0 0 0 0 0 24 Feed 0 0 0 0 0 0 0 0 71,530 419 71,949 Veterinary and A.I. 0 0 0 0 0 22,802 0 0 0 0 22,802 Livestock Purchases 0 0 0 0 0 0 0 0 0 0 0Total Rebates 24 1,289 2,908 335 85,673 239,203 25,939 53,620 115,578 6,692 531,261
Total, Direct Payments and Rebates
Gross Payments 1,688 14,126 10,295 10,168 385,676 572,341 500,065 1,355,444 915,942 59,184 3,824,929 Producer Premiums 3 2,126 1,725 1,687 85,666 46,523 40,941 96,402 98,838 17,230 391,141 Net Payments 1,685 12,000 8,570 8,481 300,010 525,818 459,124 1,259,042 817,104 41,954 3,433,788
NOTE: Unless indicated, there is no producer participation in the funding of the programs. See Explanatory Notes for brief program description.
Statistics Canada - Catalogue No.21-015-XIE 17

Direct program payments to agriculture producers - Agriculture economic statistics - 1988 June 1999 '000 of dollars
N.L. P.E.I. N.S. N.B. Que. Ont. Man. Sask. Alta. B.C. Canada Payments Enhancing Receipts
Gross Revenue Insurance Plan (GRIP) Gross Payments 0 0 0 0 0 0 0 0 0 0 0 Producer Premiums 0 0 0 0 0 0 0 0 0 0 0 Net Payments 0 0 0 0 0 0 0 0 0 0 0
Net Income Stabilization Account (NISA) 0 0 0 0 0 0 0 0 0 0 0
Western Grain Stabilization Gross Payments 0 0 0 0 0 0 131,154 378,496 179,583 3,822 693,055 Producer Premiums 0 0 0 0 0 0 14,800 43,900 22,900 600 82,200 Net Payments 0 0 0 0 0 0 116,354 334,596 156,683 3,222 610,855
Provincial Stabilization Programs Gross Payments 2,075 4,955 6,242 3,563 214,504 36,259 656 48,201 0 43,670 360,125 Producer Premiums 0 0 0 0 64,757 12,088 3,717 9,935 0 25,738 116,235 Net Payments 2,075 4,955 6,242 3,563 149,747 24,171 -3,061 38,266 0 17,932 243,890
Price Stabilization Payments 7 4,540 446 3,770 31,350 94,690 5,276 135 5,008 930 146,152
Tripartite Payments Gross Payments 0 386 467 56 865 55,205 13,759 5,940 56,799 2,976 136,453 Producer Premiums 0 72 296 49 358 20,275 3,645 2,056 16,494 798 44,043 Net Payments 0 314 171 7 507 34,930 10,114 3,884 40,305 2,178 92,410
Crop Insurance Gross Payments 22 2,623 177 811 24,212 38,403 90,023 250,905 170,786 8,143 586,105 Producer Premiums 8 1,295 258 1,072 15,672 19,791 22,068 68,027 72,974 5,139 206,304 Net Payments 14 1,328 -81 -261 8,540 18,612 67,955 182,878 97,812 3,004 379,801
Dairy Subsidy 0 5,422 3,481 3,811 135,656 89,918 10,980 7,391 19,010 10,539 286,208
Other Payments Special Canadian Grain Program 0 3,057 554 982 34,318 106,094 165,324 450,632 297,869 6,612 1,065,442 Greenfeed and Livestock Assistance 0 0 0 0 0 0 11,684 42,238 13,534 0 67,456 Red Delicious Apple Assistance 0 0 0 0 0 0 0 0 0 3,231 3,231 Waterfowl Damage 0 0 0 0 0 0 105 1,772 937 0 2,814 Compensation for Animal Losses 0 2 71 0 1,290 710 148 18 267 38 2,544 Crop Insurance Restoration 0 0 0 0 0 0 0 0 1,823 0 1,823 Feed Grain Development Program 0 0 0 0 0 0 0 0 0 1,754 1,754 Swine Incentive 0 1,019 0 0 0 0 0 0 0 0 1,019 Assistance to Feedlot Operators 0 0 0 0 0 0 0 0 0 1,002 1,002 Finished Beef Cattle Assistance 0 0 348 0 0 0 0 0 0 0 348 Cull Potato Burial Assistance 0 228 0 0 0 0 0 0 0 0 228 Beef Cow-Calf Assistance 0 113 0 0 0 0 0 0 0 0 113 Crop Loss Compensation 0 0 0 0 0 0 0 0 76 0 76 Weanling Pig Bonus 17 0 0 0 0 0 0 0 0 0 17 Dairy Heifer Replacement Bonus 7 0 0 0 0 0 0 0 0 0 7
Total Gross Payments 24 4,419 973 982 35,608 106,804 177,261 494,660 314,506 12,637 1,147,874
Total Payments Gross Payments 2,128 22,345 11,786 12,993 442,195 421,279 429,109 1,185,728 745,692 82,717 3,355,972 Producer Premiums 8 1,367 554 1,121 80,787 52,154 44,230 123,918 112,368 32,275 448,782 Net Payments 2,120 20,978 11,232 11,872 361,408 369,125 384,879 1,061,810 633,324 50,442 2,907,190
Rebates Reducing Expenses Property Taxes 0 0 0 0 27,913 122,399 6,919 0 0 0 157,231 Wages 0 0 0 0 0 0 0 0 0 0 0 Interest 0 0 1,193 0 58,910 64,744 1,651 14,573 12,532 636 154,239 Electricity 0 0 0 0 2,264 0 0 0 0 0 2,264 Heating Fuel 0 0 0 0 0 0 0 0 3,975 0 3,975 Fuel 32 674 291 578 3,721 17,011 5,468 28,892 7,130 1,010 64,807 Fertilizer and Lime 0 1,276 1,614 0 457 0 0 0 16,146 0 19,493 Pesticides 0 0 0 0 0 0 0 0 0 0 0 Seed 0 24 0 0 0 0 0 0 0 0 24 Feed 0 0 0 0 0 0 0 0 47,262 1,373 48,635 Veterinary and A.I. 0 0 0 0 0 11,150 0 0 0 0 11,150 Livestock Purchases 0 0 0 0 0 0 0 0 0 0 0Total Rebates 32 1,974 3,098 578 93,265 215,304 14,038 43,465 87,045 3,019 461,818
Total, Direct Payments and Rebates
Gross Payments 2,160 24,319 14,884 13,571 535,460 636,583 443,147 1,229,193 832,737 85,736 3,817,790 Producer Premiums 8 1,367 554 1,121 80,787 52,154 44,230 123,918 112,368 32,275 448,782 Net Payments 2,152 22,952 14,330 12,450 454,673 584,429 398,917 1,105,275 720,369 53,461 3,369,008
NOTE: Unless indicated, there is no producer participation in the funding of the programs. See Explanatory Notes for brief program description.
18 Statistics Canada - Catalogue No.21-015-XIE

Direct program payments to agriculture producers - Agriculture economic statistics - 1989 June 1999 '000 of dollars
N.L. P.E.I. N.S. N.B. Que. Ont. Man. Sask. Alta. B.C. Canada Payments Enhancing Receipts
Gross Revenue Insurance Plan (GRIP) Gross Payments 0 0 0 0 0 0 0 0 0 0 0 Producer Premiums 0 0 0 0 0 0 0 0 0 0 0 Net Payments 0 0 0 0 0 0 0 0 0 0 0
Net Income Stabilization Account (NISA) 0 0 0 0 0 0 0 0 0 0 0
Western Grain Stabilization Gross Payments 0 0 0 0 0 0 31,576 87,980 55,650 1,130 176,336 Producer Premiums 0 0 0 0 0 0 26,000 76,900 50,100 1,000 154,000 Net Payments 0 0 0 0 0 0 5,576 11,080 5,550 130 22,336
Provincial Stabilization Programs Gross Payments 2,358 3,792 4,793 2,564 262,064 1,826 803 41,893 0 24,799 344,892 Producer Premiums 0 0 0 0 62,831 -20,032 1,285 7,449 0 8,939 60,472 Net Payments 2,358 3,792 4,793 2,564 199,233 21,858 -482 34,444 0 15,860 284,420
Price Stabilization Payments 1 678 39 341 15,435 47,363 1,337 18 220 4,034 69,466
Tripartite Payments Gross Payments 0 4,285 6,943 2,642 39,991 163,336 72,074 37,798 142,794 16,283 486,146 Producer Premiums 0 598 863 497 13,454 11,203 6,721 3,429 16,451 4,139 57,355 Net Payments 0 3,687 6,080 2,145 26,537 152,133 65,353 34,369 126,343 12,144 428,791
Crop Insurance Gross Payments 27 954 1,138 1,549 40,116 42,784 154,962 501,849 185,347 12,424 941,150 Producer Premiums 3 1,224 274 956 19,719 26,845 42,785 141,333 100,873 4,787 338,799 Net Payments 24 -270 864 593 20,397 15,939 112,177 360,516 84,474 7,637 602,351
Dairy Subsidy 0 5,243 3,630 3,676 129,690 85,327 10,624 6,998 18,467 10,726 274,381
Other Payments Special Drought Assistance 0 0 0 0 0 60,913 143,370 435,733 96,127 0 736,143 Two-price Wheat Program 0 81 37 262 4,038 16,478 11,548 33,620 20,140 772 86,976 Greenfeed and Livestock Assistance 0 0 0 0 0 3,525 11,478 17,835 30,434 848 64,120 Waterfowl Damage 0 0 0 0 0 0 102 1,346 1,680 0 3,128 Assistance to Feedlot Operators 0 0 0 0 0 0 0 0 0 2,905 2,905 Compensation for Animal Losses 0 4 45 0 50 1,161 255 590 314 27 2,446 Feed Grain Development Program 0 0 0 0 0 0 0 0 0 1,774 1,774 Special Atlantic Livestock Incentive 251 0 947 195 0 0 0 0 0 0 1,393 Red Delicious Apple Assistance 0 0 88 0 35 651 110 0 0 190 1,074 Special Canadian Grain Program 0 1 0 1 65 128 81 322 350 2 950 Swine Incentive 0 903 0 0 0 0 0 0 0 0 903 Beef Cow-Calf Assistance 0 179 0 0 0 0 0 0 0 0 179 Crop Loss Compensation 0 0 0 0 0 0 0 0 151 0 151 Cull Potato Burial Assistance 0 58 0 0 0 0 0 0 0 0 58 Dairy Heifer Replacement Bonus 21 0 0 0 0 0 0 0 0 0 21 Weanling Pig Bonus 16 0 0 0 0 0 0 0 0 0 16 Certified Seed Potato Assistance 0 0 3 0 0 0 0 0 0 0 3
Total Gross Payments 288 1,226 1,120 458 4,188 82,856 166,944 489,446 149,196 6,518 902,240
Total Payments Gross Payments 2,674 16,178 17,663 11,230 491,484 423,492 438,320 1,165,982 551,674 75,914 3,194,611 Producer Premiums 3 1,822 1,137 1,453 96,004 18,016 76,791 229,111 167,424 18,865 610,626 Net Payments 2,671 14,356 16,526 9,777 395,480 405,476 361,529 936,871 384,250 57,049 2,583,985
Rebates Reducing Expenses Property Taxes 0 0 0 0 29,969 109,272 0 0 0 0 139,241 Wages 0 0 0 0 0 0 0 0 0 0 0 Interest 0 0 1,142 235 83,840 33,267 2,276 11,127 10,322 0 142,209 Electricity 0 0 0 0 2,335 0 0 0 0 0 2,335 Heating Fuel 0 0 0 0 0 0 0 0 2,813 0 2,813 Fuel 35 519 222 453 2,809 14,722 3,521 19,203 4,758 721 46,963 Fertilizer and Lime 0 610 1,580 0 354 0 0 0 18,143 0 20,687 Pesticides 0 0 0 0 0 0 0 0 0 0 0 Seed 0 24 0 0 0 0 0 0 0 0 24 Feed 0 0 0 0 0 0 0 0 47,614 1,491 49,105 Veterinary and A.I. 0 0 0 0 0 817 0 0 0 0 817 Livestock Purchases 0 0 0 0 0 0 0 0 0 0 0Total Rebates 35 1,153 2,944 688 119,307 158,078 5,797 30,330 83,650 2,212 404,194
Total, Direct Payments and Rebates
Gross Payments 2,709 17,331 20,607 11,918 610,791 581,570 444,117 1,196,312 635,324 78,126 3,598,805 Producer Premiums 3 1,822 1,137 1,453 96,004 18,016 76,791 229,111 167,424 18,865 610,626 Net Payments 2,706 15,509 19,470 10,465 514,787 563,554 367,326 967,201 467,900 59,261 2,988,179
NOTE: Unless indicated, there is no producer participation in the funding of the programs. See Explanatory Notes for brief program description.
Statistics Canada - Catalogue No.21-015-XIE 19

Direct program payments to agriculture producers - Agriculture economic statistics - 1990 June 1999 '000 of dollars
N.L. P.E.I. N.S. N.B. Que. Ont. Man. Sask. Alta. B.C. Canada Payments Enhancing Receipts
Gross Revenue Insurance Plan (GRIP) Gross Payments 0 0 0 0 0 0 0 0 0 0 0 Producer Premiums 0 0 0 0 0 0 0 0 0 0 0 Net Payments 0 0 0 0 0 0 0 0 0 0 0
Net Income Stabilization Account (NISA) 0 0 0 0 0 0 0 0 0 0 0
Western Grain Stabilization Gross Payments 0 0 0 0 0 0 0 0 0 0 0 Producer Premiums 0 0 0 0 0 0 24,348 70,731 40,263 680 136,022 Net Payments 0 0 0 0 0 0 -24,348 -70,731 -40,263 -680 -136,022
Provincial Stabilization Programs Gross Payments 1,915 3,382 1,800 772 204,247 7,805 0 2,603 0 15,098 237,622 Producer Premiums 0 0 0 0 79,454 2,168 0 232 0 7,199 89,053 Net Payments 1,915 3,382 1,800 772 124,793 5,637 0 2,371 0 7,899 148,569
Price Stabilization Payments 0 6 0 4 1,000 818 4 0 0 46 1,878
Tripartite Payments Gross Payments 0 701 2,815 1,161 36,384 36,179 16,422 9,171 36,891 8,848 148,572 Producer Premiums 0 530 918 471 11,498 18,376 7,886 8,172 20,664 4,011 72,526 Net Payments 0 171 1,897 690 24,886 17,803 8,536 999 16,227 4,837 76,046
Crop Insurance Gross Payments 89 2,387 842 323 25,512 28,286 79,741 306,291 135,346 9,659 588,476 Producer Premiums 15 1,388 281 854 21,954 33,210 37,309 106,727 56,466 4,916 263,120 Net Payments 74 999 561 -531 3,558 -4,924 42,432 199,564 78,880 4,743 325,356
Dairy Subsidy 0 4,929 3,605 3,510 124,368 83,736 10,004 6,784 18,020 10,273 265,229
Other Payments Farm Income Assistance 0 456 2,990 563 0 27,968 46,801 274,725 98,636 18,554 470,693 Special Drought Assistance 0 0 0 0 20,960 3,773 5,136 8,143 1,607 0 39,619 Disaster Assistance (Peace River) 0 0 0 0 0 0 0 0 20,457 0 20,457 Waterfowl Damage 0 0 0 0 0 0 231 3,711 2,400 0 6,342 Feed Grain Adjustment Program 0 0 0 0 0 0 0 5,081 0 0 5,081 Tobacco Deficiency Payment 0 0 0 0 0 4,158 0 0 0 0 4,158 Special Atlantic Livestock Incentive 219 1,601 903 200 0 0 0 0 0 0 2,923 Compensation for Animal Losses 0 1 2 20 425 1,102 14 73 383 722 2,742 Greenfeed and Livestock Assistance 0 0 0 0 1,621 48 300 27 2 243 2,241 Livestock Development Program 0 0 0 0 0 0 1,165 0 0 0 1,165 Swine Incentive 0 703 0 0 0 0 0 0 0 0 703 Crop Loss Compensation 0 0 0 0 0 0 150 0 434 0 584 Beef Cow-Calf Assistance 0 192 0 0 0 0 0 0 0 0 192 Feed Grain Development Program 0 0 0 0 0 0 0 0 0 192 192 Hog Transportation Assistance 0 0 0 50 0 0 0 0 0 0 50 Cull Potato Burial Assistance 0 50 0 0 0 0 0 0 0 0 50 Special Canadian Grain Program 0 0 0 0 0 2 8 15 16 0 41 Dairy Heifer Replacement Bonus 34 0 0 0 0 0 0 0 0 0 34 Weanling Pig Bonus 14 0 0 0 0 0 0 0 0 0 14 Certified Seed Potato Assistance 0 0 9 0 0 0 0 0 0 0 9
Total Gross Payments 267 3,003 3,904 833 23,006 37,051 53,805 291,775 123,935 19,711 557,290
Total Payments Gross Payments 2,271 14,408 12,966 6,603 414,517 193,875 159,976 616,624 314,192 63,635 1,799,067 Producer Premiums 15 1,918 1,199 1,325 112,906 53,754 69,543 185,862 117,393 16,806 560,721 Net Payments 2,256 12,490 11,767 5,278 301,611 140,121 90,433 430,762 196,799 46,829 1,238,346
Rebates Reducing Expenses Property Taxes 0 0 0 0 31,253 110,363 0 0 0 0 141,616 Wages 0 0 0 0 0 0 0 0 0 0 0 Interest 0 0 614 266 99,010 52,106 0 8,487 9,954 0 170,437 Electricity 0 0 0 0 2,620 0 0 0 0 0 2,620 Heating Fuel 0 0 0 0 0 0 0 0 2,294 0 2,294 Fuel 23 599 234 349 2,342 13,835 3,304 4,624 3,822 655 29,787 Fertilizer and Lime 0 611 1,204 0 115 0 0 0 19,666 0 21,596 Pesticides 0 0 0 0 0 0 0 0 0 0 0 Seed 0 26 0 0 0 0 0 0 0 0 26 Feed 0 0 0 0 0 0 0 0 38,752 161 38,913 Veterinary and A.I. 0 0 0 0 0 6,596 0 0 0 0 6,596 Livestock Purchases 0 0 868 72 0 0 0 0 0 0 940Total Rebates 23 1,236 2,920 687 135,340 182,900 3,304 13,111 74,488 816 414,825
Total, Direct Payments and Rebates
Gross Payments 2,294 15,644 15,886 7,290 549,857 376,775 163,280 629,735 388,680 64,451 2,213,892 Producer Premiums 15 1,918 1,199 1,325 112,906 53,754 69,543 185,862 117,393 16,806 560,721 Net Payments 2,279 13,726 14,687 5,965 436,951 323,021 93,737 443,873 271,287 47,645 1,653,171
NOTE: Unless indicated, there is no producer participation in the funding of the programs. See Explanatory Notes for brief program description.
20 Statistics Canada - Catalogue No.21-015-XIE

Direct program payments to agriculture producers - Agriculture economic statistics - 1991 November 2003 '000 of dollars
N.L. P.E.I. N.S. N.B. Que. Ont. Man. Sask. Alta. B.C. Canada Payments Enhancing Receipts
Gross Revenue Insurance Plan (GRIP) Gross Payments 0 1,962 690 966 42,216 92,292 112,128 366,609 217,539 3,254 837,656 Producer Premiums 0 810 250 320 26,470 39,200 44,110 133,430 80,125 1,630 326,345 Net Payments 0 1,152 440 646 15,746 53,092 68,018 233,179 137,414 1,624 511,311
Net Income Stabilization Account (NISA) 0 6 0 0 0 1,598 323 35,952 0 0 37,879
Western Grain Stabilization Gross Payments 0 0 0 0 0 0 27,465 80,549 49,023 954 157,991 Producer Premiums 0 0 0 0 0 0 17,716 51,567 27,234 582 97,099 Net Payments 0 0 0 0 0 0 9,749 28,982 21,789 372 60,892
Provincial Stabilization Programs Gross Payments 2,283 1,459 1,800 807 319,904 15,596 0 692 0 22,334 364,875 Producer Premiums 0 0 0 0 63,563 5,197 0 0 0 11,800 80,560 Net Payments 2,283 1,459 1,800 807 256,341 10,399 0 692 0 10,534 284,315
Price Stabilization Payments 0 22 4 0 588 17,717 3 0 0 0 18,334
Tripartite Payments Gross Payments 0 909 1,597 702 19,377 29,090 9,799 6,482 35,402 4,533 107,891 Producer Premiums 0 684 776 479 16,063 19,300 6,806 5,583 19,715 3,262 72,668 Net Payments 0 225 821 223 3,314 9,790 2,993 899 15,687 1,271 35,223
Crop Insurance Gross Payments 163 2,802 714 3,547 61,018 41,343 23,971 69,283 50,090 9,428 262,359 Producer Premiums 14 1,131 236 1,109 22,035 28,739 28,884 72,846 59,407 5,313 219,714 Net Payments 149 1,671 478 2,438 38,983 12,604 -4,913 -3,563 -9,317 4,115 42,645
Dairy Subsidy 0 4,758 3,232 3,251 119,319 79,149 9,682 6,260 16,344 10,124 252,119
Other PaymentsFarm Support and Adjustment Measures II 0 0 0 0 0 0 19,700 71,500 23,800 0 115,000Farm Income Assistance 0 627 500 845 0 26,907 15,065 1,922 77 1,399 47,342Disaster Assistance Program South-east Alta. 1990 0 0 0 0 0 0 0 0 25,249 0 25,249Compensation for Animal Losses 0 0 0 58 215 1,448 236 733 8,201 539 11,430PVYn Compensation Program 0 9,773 45 351 0 67 0 0 44 0 10,280Special Tree Fruit Assistance 0 0 0 0 0 0 0 0 0 10,001 10,001Feed Grain Adjustment Program 0 0 0 0 0 0 0 8,281 0 0 8,281Permanent Cover Program 0 0 0 0 0 0 1,430 3,140 2,990 80 7,640Special Drought Assistance 0 0 0 0 4,810 0 7 1 0 12 4,830Waterfowl Damage 0 0 0 0 0 0 133 2,121 770 0 3,024Livestock Development Program 0 0 0 0 0 0 738 0 0 0 738Special Atlantic Livestock Incentive 71 122 0 363 0 0 0 0 0 0 556Crop Loss Compensation 0 0 0 0 0 0 135 0 278 0 413Tobacco Deficiency Payment 0 0 0 0 0 331 0 0 0 0 331Beef Cow-Calf Assistance 0 215 0 0 0 0 0 0 0 0 215Hog Transportation Assistance 0 0 0 200 0 0 0 0 0 0 200Greenfeed and Livestock Assistance 0 0 0 0 87 0 0 0 0 0 87Dairy Heifer Replacement Bonus 68 0 0 0 0 0 0 0 0 0 68Cull Potato Burial Assistance 0 24 0 0 0 0 0 0 0 0 24Weanling Pig Bonus 20 0 0 0 0 0 0 0 0 0 20Certified Seed Potato Assistance 0 0 8 0 0 0 0 0 0 0 8
Total Gross Payments 159 10,761 553 1,817 5,112 28,753 37,444 87,698 61,409 12,031 245,737
Total Payments Gross Payments 2,605 22,679 8,590 11,090 567,534 305,538 220,815 653,525 429,807 62,658 2,284,841 Producer Premiums 14 2,625 1,262 1,908 128,131 92,436 97,516 263,426 186,481 22,587 796,386 Net Payments 2,591 20,054 7,328 9,182 439,403 213,102 123,299 390,099 243,326 40,071 1,488,455
Rebates Reducing Expenses Property Taxes 0 0 0 0 42,444 116,384 0 0 0 0 158,828 Wages 0 0 0 0 0 0 0 0 0 0 0 Interest 0 0 3 259 76,000 59,133 14,418 4,962 9,378 0 164,153 Electricity 0 0 0 0 3,171 0 0 0 0 0 3,171 Heating Fuel 0 0 0 0 0 0 0 0 2,600 0 2,600 Fuel 18 322 193 244 1,737 11,643 1,781 2,312 3,037 400 21,687 Fertilizer and Lime 0 477 921 0 184 0 0 0 20,575 0 22,157 Pesticides 0 0 0 0 0 0 0 0 0 0 0 Seed 0 28 0 0 0 0 0 0 0 0 28 Feed 0 0 0 0 0 0 0 0 33,358 0 33,358 Veterinary and A.I. 0 0 0 0 0 5,463 0 0 0 0 5,463 Livestock Purchases 0 0 845 76 0 0 0 0 0 0 921Total Rebates 18 827 1,962 579 123,536 192,623 16,199 7,274 68,948 400 412,366
Total, Direct Payments and Rebates
Gross Payments 2,623 23,506 10,552 11,669 691,070 498,161 237,014 660,799 498,755 63,058 2,697,207 Producer Premiums 14 2,625 1,262 1,908 128,131 92,436 97,516 263,426 186,481 22,587 796,386 Net Payments 2,609 20,881 9,290 9,761 562,939 405,725 139,498 397,373 312,274 40,471 1,900,821
NOTE: Unless indicated, there is no producer participation in the funding of the programs. See Explanatory Notes for brief program description.
Statistics Canada - Catalogue No.21-015-XIE 21

Direct program payments to agriculture producers - Agriculture economic statistics - 1992 November 2003 '000 of dollars
N.L. P.E.I. N.S. N.B. Que. Ont. Man. Sask. Alta. B.C. Canada Payments Enhancing Receipts
Gross Revenue Insurance Plan (GRIP) Gross Payments 0 4,667 963 1,880 77,090 254,338 169,469 517,783 357,190 6,249 1,389,629 Producer Premiums 0 1,450 330 470 38,490 67,115 65,250 175,370 114,404 2,170 465,049 Net Payments 0 3,217 633 1,410 38,600 187,223 104,219 342,413 242,786 4,079 924,580
Net Income Stabilization Account (NISA) 289 1,717 377 0 2,526 44,506 62,278 138,421 98,894 4,255 353,263
Western Grain Stabilization Gross Payments 0 0 0 0 0 0 -2,494 -7,317 -4,452 -87 -14,350 Producer Premiums 0 0 0 0 0 0 0 0 0 0 0 Net Payments 0 0 0 0 0 0 -2,494 -7,317 -4,452 -87 -14,350
Provincial Stabilization Programs Gross Payments 2,581 1,157 1,800 902 318,387 26,012 0 0 0 16,961 367,800 Producer Premiums 0 0 0 0 87,343 8,266 0 0 0 6,571 102,180 Net Payments 2,581 1,157 1,800 902 231,044 17,746 0 0 0 10,390 265,620
Price Stabilization Payments 0 2 34 109 1,555 9,822 0 0 0 3 11,525
Tripartite Payments Gross Payments 0 3,616 3,491 2,037 68,984 106,040 38,427 24,501 116,209 7,726 371,031 Producer Premiums 0 703 1,103 501 17,707 16,934 8,719 6,107 29,270 3,319 84,363 Net Payments 0 2,913 2,388 1,536 51,277 89,106 29,708 18,394 86,939 4,407 286,668
Crop Insurance Gross Payments 124 1,888 1,025 10,336 37,248 33,645 21,048 165,175 80,404 5,061 355,954 Producer Premiums 29 1,019 217 1,717 20,988 34,253 32,548 98,110 35,471 2,424 226,776 Net Payments 95 869 808 8,619 16,260 -608 -11,500 67,065 44,933 2,637 129,178
Dairy Subsidy 0 4,857 2,937 3,008 107,477 72,245 8,981 6,132 15,248 10,094 230,979
Other PaymentsFarm Support and Adjustment Measures II 1,024 9,275 3,708 9,379 10,279 93,936 77,016 223,473 165,580 9,666 603,336Disaster Assistance Program South-east Alta. 1990 0 0 0 0 0 0 0 0 24,439 0 24,439Compensation for Animal Losses 0 0 2 29 323 2,919 471 72 5,419 136 9,371Feed Grain Adjustment Program 0 0 0 0 0 0 0 9,252 0 0 9,252Permanent Cover Program 0 0 0 0 0 0 1,430 3,140 2,990 80 7,640Special Tree Fruit Assistance 0 0 0 0 0 0 0 0 0 5,600 5,600PVYn Compensation Program 0 3,467 46 103 0 227 0 0 0 0 3,843Waterfowl Damage 0 0 0 0 373 0 428 683 1,182 0 2,666Farm Support and Adjustment Measures I 181 0 0 0 0 0 1,498 0 0 111 1,790Replant Adjustment Program Losses 0 0 0 0 0 0 0 0 0 785 785Crop Loss Compensation 0 0 0 0 0 0 568 0 204 0 772Hog Transportation Assistance 0 0 0 200 0 0 0 0 0 0 200Beef Cow-Calf Assistance 0 184 0 0 0 0 0 0 0 0 184Greenfeed and Livestock Assistance 0 0 0 0 86 0 0 0 0 0 86Dairy Heifer Replacement Bonus 40 0 0 0 0 0 0 0 0 0 40Farm Income Assistance 0 0 0 0 0 27 0 0 0 0 27Cull Potato Burial Assistance 0 25 0 0 0 0 0 0 0 0 25Special Atlantic Livestock Incentive 5 0 0 16 0 0 0 0 0 0 21Weanling Pig Bonus 15 0 0 0 0 0 0 0 0 0 15Special Drought Assistance 0 0 0 0 10 0 0 0 0 0 10Certified Seed Potato Assistance 0 0 6 0 0 0 0 0 0 0 6Livestock Development Program 0 0 0 0 0 0 2 0 0 2 4
Total Gross Payments 1,265 12,951 3,762 9,727 11,071 97,109 81,413 236,620 199,814 16,380 670,112
Total Payments Gross Payments 4,259 30,855 14,389 27,999 624,338 643,717 379,122 1,081,315 863,307 66,642 3,735,943 Producer Premiums 29 3,172 1,650 2,688 164,528 126,568 106,517 279,587 179,145 14,484 878,368 Net Payments 4,230 27,683 12,739 25,311 459,810 517,149 272,605 801,728 684,162 52,158 2,857,575
Rebates Reducing Expenses Property Taxes 0 0 0 0 56,344 116,972 0 0 0 0 173,316 Wages 0 0 0 0 0 306 0 0 0 0 306 Interest 0 0 0 250 45,300 3,075 0 1,806 9,136 0 59,567 Electricity 0 0 0 0 3,357 0 0 0 0 0 3,357 Heating Fuel 0 0 0 0 0 0 0 0 300 0 300 Fuel 0 25 15 22 883 8,596 102 111 283 85 10,122 Fertilizer and Lime 0 306 682 0 214 0 0 0 6,229 0 7,431 Pesticides 0 0 0 0 0 0 0 0 0 0 0 Seed 0 28 0 0 0 0 0 0 0 0 28 Feed 0 0 0 0 0 0 0 0 43,658 0 43,658 Veterinary and A.I. 0 0 0 0 0 2,413 0 0 0 0 2,413 Livestock Purchases 0 0 795 85 0 0 0 0 0 0 880Total Rebates 0 359 1,492 357 106,098 131,362 102 1,917 59,606 85 301,378
Total, Direct Payments and Rebates
Gross Payments 4,259 31,214 15,881 28,356 730,436 775,079 379,224 1,083,232 922,913 66,727 4,037,321 Producer Premiums 29 3,172 1,650 2,688 164,528 126,568 106,517 279,587 179,145 14,484 878,368 Net Payments 4,230 28,042 14,231 25,668 565,908 648,511 272,707 803,645 743,768 52,243 3,158,953
NOTE: Unless indicated, there is no producer participation in the funding of the programs. See Explanatory Notes for brief program description.
22 Statistics Canada - Catalogue No.21-015-XIE

Direct program payments to agriculture producers - Agriculture economic statistics - 1993 November 2003 '000 of dollars
N.L. P.E.I. N.S. N.B. Que. Ont. Man. Sask. Alta. B.C. Canada Payments Enhancing Receipts
Gross Revenue Insurance Plan (GRIP) Gross Payments 0 2,481 880 2,215 119,919 108,735 275,045 467,415 350,890 7,683 1,335,263 Producer Premiums 0 2,000 270 450 37,021 54,314 50,190 125,290 101,582 2,320 373,437 Net Payments 0 481 610 1,765 82,898 54,421 224,855 342,125 249,308 5,363 961,826
Net Income Stabilization Account (NISA) 21 1,148 144 0 1,888 23,902 24,046 69,919 39,118 2,274 162,460
Western Grain Stabilization Gross Payments 0 0 0 0 0 0 -2,609 -7,652 -4,656 -91 -15,008 Producer Premiums 0 0 0 0 0 0 0 0 0 0 0 Net Payments 0 0 0 0 0 0 -2,609 -7,652 -4,656 -91 -15,008
Provincial Stabilization Programs Gross Payments 1,705 963 1,800 891 250,414 1,167 0 0 0 5,019 261,959 Producer Premiums 0 0 0 0 89,350 389 0 0 0 1,666 91,405 Net Payments 1,705 963 1,800 891 161,064 778 0 0 0 3,353 170,554
Price Stabilization Payments 0 0 0 0 11 5 0 0 0 0 16
Tripartite Payments Gross Payments 0 -2 1,701 122 3,215 5,213 1,446 4,924 2,982 1,671 21,272 Producer Premiums 0 534 850 418 23,762 12,565 8,183 7,338 23,155 2,671 79,476 Net Payments 0 -536 851 -296 -20,547 -7,352 -6,737 -2,414 -20,173 -1,000 -58,204
Crop Insurance Gross Payments 68 2,304 532 9,348 52,025 182,206 69,895 259,741 134,613 12,989 723,721 Producer Premiums 22 1,210 425 3,430 30,838 43,338 34,953 120,451 49,983 4,749 289,399 Net Payments 46 1,094 107 5,918 21,187 138,868 34,942 139,290 84,630 8,240 434,322
Dairy Subsidy 0 4,774 3,009 2,884 109,828 70,029 8,637 5,473 14,935 10,361 229,930
Other PaymentsFarm Support and Adjustment Measures II 0 0 1 0 1,151 25,341 14 98 31 1,498 28,134Disaster Assistance Program South-east Alta. 1990 0 0 0 0 0 0 0 0 20,385 0 20,385Waterfowl Damage 0 0 0 0 169 0 870 8,868 738 0 10,645Interim Red Meat Production Equalization Program 0 0 0 0 0 0 0 4,795 0 0 4,795Compensation for Animal Losses 0 0 0 16 241 2,603 17 23 1,190 25 4,115PVYn Compensation Program 0 988 0 1,400 0 32 0 0 0 0 2,420Feed Grain Adjustment Program 0 0 0 0 0 0 0 1,765 0 0 1,765Hog Production Subsidy 847 0 0 0 0 0 0 0 0 0 847Farm Support and Adjustment Measures I 44 0 0 0 0 0 730 0 0 5 779Hog Transportation Subsidy 759 0 0 0 0 0 0 0 0 0 759Crop Loss Compensation 0 0 0 0 0 0 313 0 247 0 560Transitional Production Adjustment Program (TPAP) 0 0 0 0 0 0 0 0 0 244 244Beef Cow-Calf Assistance 0 225 0 0 0 0 0 0 0 0 225Hog Transportation Assistance 0 0 0 200 0 0 0 0 0 0 200Cull Potato Burial Assistance 0 39 0 0 0 0 0 0 0 0 39Certified Seed Potato Assistance 0 0 10 0 0 0 0 0 0 0 10Weanling Pig Bonus 8 0 0 0 0 0 0 0 0 0 8Dairy Heifer Replacement Bonus 7 0 0 0 0 0 0 0 0 0 7Special Atlantic Livestock Incentive 0 0 0 4 0 0 0 0 0 0 4Livestock Development Program 0 0 0 0 0 0 0 0 0 2 2Replant Adjustment Program Losses 0 0 0 0 0 0 0 0 0 1 1
Total Gross Payments 1,665 1,252 11 1,620 1,561 27,976 1,944 15,549 22,591 1,775 75,944
Total Payments Gross Payments 3,459 12,920 8,077 17,080 538,861 419,233 378,404 815,369 560,473 41,681 2,795,557 Producer Premiums 22 3,744 1,545 4,298 180,971 110,606 93,326 253,079 174,720 11,406 833,717 Net Payments 3,437 9,176 6,532 12,782 357,890 308,627 285,078 562,290 385,753 30,275 1,961,840
Rebates Reducing Expenses Property Taxes 0 0 0 0 62,365 112,323 0 0 0 0 174,688 Wages 0 0 0 0 0 431 0 0 0 0 431 Interest 0 0 0 126 34,944 91 0 11 8,907 0 44,079 Electricity 0 0 0 0 0 0 0 0 0 0 0 Heating Fuel 0 0 0 0 0 0 0 0 0 0 0 Fuel 0 0 0 0 1,139 7,300 1 36,500 0 0 44,940 Fertilizer and Lime 0 0 550 0 0 0 0 0 0 0 550 Pesticides 0 0 0 0 0 0 0 0 0 0 0 Seed 0 0 0 0 0 0 0 0 0 0 0 Feed 0 0 0 0 0 0 0 0 43,254 0 43,254 Veterinary and A.I. 0 0 0 0 0 736 0 0 0 0 736 Livestock Purchases 0 0 773 70 0 0 0 0 0 0 843Total Rebates 0 0 1,323 196 98,448 120,881 1 36,511 52,161 0 309,521
Total, Direct Payments and Rebates
Gross Payments 3,459 12,920 9,400 17,276 637,309 540,114 378,405 851,880 612,634 41,681 3,105,078 Producer Premiums 22 3,744 1,545 4,298 180,971 110,606 93,326 253,079 174,720 11,406 833,717 Net Payments 3,437 9,176 7,855 12,978 456,338 429,508 285,079 598,801 437,914 30,275 2,271,361
NOTE: Unless indicated, there is no producer participation in the funding of the programs. See Explanatory Notes for brief program description.
Statistics Canada - Catalogue No.21-015-XIE 23

Direct program payments to agriculture producers - Agriculture economic statistics - 1994 November 2003 '000 of dollars
N.L. P.E.I. N.S. N.B. Que. Ont. Man. Sask. Alta. B.C. Canada Payments Enhancing Receipts
Gross Revenue Insurance Plan (GRIP) Gross Payments 0 8,505 1,242 1,101 128,631 17,766 161,930 3,791 217,513 2,380 542,859 Producer Premiums 0 3,300 392 98 33,180 49,425 43,096 4,470 32,675 1,561 168,197 Net Payments 0 5,205 850 1,003 95,451 -31,659 118,834 -679 184,838 819 374,662
Net Income Stabilization Account (NISA) 9 208 118 62 595 9,217 4,152 16,629 8,210 1,419 40,619
Western Grain Stabilization Gross Payments 0 0 0 0 0 0 -230 -674 -411 -8 -1,323 Producer Premiums 0 0 0 0 0 0 0 0 0 0 0 Net Payments 0 0 0 0 0 0 -230 -674 -411 -8 -1,323
Provincial Stabilization Programs Gross Payments 2,883 739 1,800 583 290,245 409 0 0 0 3,813 300,472 Producer Premiums 0 0 0 0 100,359 136 0 0 0 1,226 101,721 Net Payments 2,883 739 1,800 583 189,886 273 0 0 0 2,587 198,751
Price Stabilization Payments 0 0 0 0 0 5 0 0 0 0 5
Tripartite Payments Gross Payments 0 556 780 200 8,723 7,728 5,282 3,921 33,709 6,687 67,586 Producer Premiums 0 227 821 2,309 8,149 4,429 2,544 1,894 9,265 443 30,081 Net Payments 0 329 -41 -2,109 574 3,299 2,738 2,027 24,444 6,244 37,505
Crop Insurance Gross Payments 41 1,506 642 3,631 40,045 38,015 96,407 173,594 55,739 5,205 414,825 Producer Premiums 24 1,195 248 2,988 18,458 36,414 28,973 92,320 46,131 4,896 231,647 Net Payments 17 311 394 643 21,587 1,601 67,434 81,274 9,608 309 183,178
Dairy Subsidy 0 4,289 2,765 2,748 104,971 69,107 8,442 5,432 14,928 9,622 222,304
Other PaymentsDisaster Assistance Program South-east Alta. 1990 0 0 0 0 0 0 0 0 18,703 0 18,703Interim Red Meat Production Equalization Program 0 0 0 0 0 0 0 7,332 0 0 7,332Crop Loss Compensation 0 0 0 0 0 0 624 0 4,958 0 5,582Waterfowl Damage 0 0 0 0 396 0 262 1,949 506 0 3,113Compensation for Animal Losses 0 0 14 15 148 1,162 30 14 671 22 2,076Hog Production Compensation 1,705 0 0 0 0 0 0 0 0 0 1,705Transitional Production Adjustment Program (TPAP) 0 0 0 0 0 0 0 0 0 439 439Hog Transportation Assistance 0 0 0 200 0 0 0 0 0 0 200Beef Cow-Calf Assistance 0 147 0 0 0 0 0 0 0 0 147Feed Grain Adjustment Program 0 0 0 0 0 0 0 52 0 0 52Cull Potato Burial Assistance 0 13 0 0 0 0 0 0 0 0 13
Total Gross Payments 1,705 160 14 215 544 1,162 916 9,347 24,838 461 39,362
Total Payments Gross Payments 4,638 15,963 7,361 8,540 573,754 143,409 276,899 212,040 354,526 29,579 1,626,709 Producer Premiums 24 4,722 1,461 5,395 160,146 90,404 74,613 98,684 88,071 8,126 531,646 Net Payments 4,614 11,241 5,900 3,145 413,608 53,005 202,286 113,356 266,455 21,453 1,095,063
Rebates Reducing Expenses Property Taxes 0 0 0 0 63,629 110,986 0 0 0 0 174,615 Wages 0 0 0 0 0 906 0 0 0 0 906 Interest 0 0 0 93 31,256 0 0 0 9,308 0 40,657 Electricity 0 0 0 0 0 0 0 0 0 0 0 Heating Fuel 0 0 0 0 0 0 0 0 0 0 0 Fuel 0 0 0 0 982 6,475 0 36,600 0 0 44,057 Fertilizer and Lime 0 0 0 0 0 0 0 0 0 0 0 Pesticides 0 0 0 0 0 0 0 0 0 0 0 Seed 0 0 0 0 0 0 0 0 0 0 0 Feed 0 0 0 0 0 0 0 0 35,452 0 35,452 Veterinary and A.I. 0 0 0 0 0 0 0 0 0 0 0 Livestock Purchases 0 0 677 50 0 0 0 0 0 0 727Total Rebates 0 0 677 143 95,867 118,367 0 36,600 44,760 0 296,414
Total, Direct Payments and Rebates
Gross Payments 4,638 15,963 8,038 8,683 669,621 261,776 276,899 248,640 399,286 29,579 1,923,123 Producer Premiums 24 4,722 1,461 5,395 160,146 90,404 74,613 98,684 88,071 8,126 531,646 Net Payments 4,614 11,241 6,577 3,288 509,475 171,372 202,286 149,956 311,215 21,453 1,391,477
NOTE: Unless indicated, there is no producer participation in the funding of the programs. See Explanatory Notes for brief program description.
24 Statistics Canada - Catalogue No.21-015-XIE

Direct program payments to agriculture producers - Agriculture economic statistics - 1995 November 2003 '000 of dollars
N.L. P.E.I. N.S. N.B. Que. Ont. Man. Sask. Alta. B.C. Canada Payments Enhancing Receipts
Gross Revenue Insurance Plan (GRIP) Gross Payments 0 3,924 763 2,304 66,315 -199 50,393 -254 54,635 986 178,867 Producer Premiums 0 1,240 314 884 32,025 0 42,717 156 15,400 478 93,214 Net Payments 0 2,684 449 1,420 34,290 -199 7,676 -410 39,235 508 85,653
Net Income Stabilization Account (NISA) 19 138 171 31 454 11,593 4,465 24,001 3,290 2,134 46,296
Western Grain Stabilization Gross Payments 0 0 0 0 0 0 -109 -319 -195 -3 -626 Producer Premiums 0 0 0 0 0 0 0 0 0 0 0 Net Payments 0 0 0 0 0 0 -109 -319 -195 -3 -626
Provincial Stabilization Programs Gross Payments 3,057 628 1,800 477 302,016 0 0 0 0 150 308,128 Producer Premiums 0 0 172 128 104,210 0 0 0 0 83 104,593 Net Payments 3,057 628 1,628 349 197,806 0 0 0 0 67 203,535
Price Stabilization Payments 0 0 0 0 0 2 0 0 0 0 2
Tripartite Payments Gross Payments 0 -1 -11 -1 1,496 725 972 2,761 4,477 133 10,551 Producer Premiums 0 -47 161 -7 2,861 -635 1,412 -198 -796 -86 2,665 Net Payments 0 46 -172 6 -1,365 1,360 -440 2,959 5,273 219 7,886
Crop Insurance Gross Payments 1 1,864 292 5,902 38,154 25,818 36,825 139,740 54,650 3,479 306,725 Producer Premiums 14 988 222 3,401 17,866 35,356 34,716 96,898 59,045 4,236 252,742 Net Payments -13 876 70 2,501 20,288 -9,538 2,109 42,842 -4,395 -757 53,983
Dairy Subsidy 0 4,197 2,889 2,750 102,346 65,258 7,919 5,335 13,169 9,690 213,553
Other PaymentsHog Transition 0 362 417 207 14 7,068 4,138 2,218 5,160 576 20,160Disaster Assistance Program South-east Alta. 1990 0 0 0 0 0 0 0 0 16,294 0 16,294PVYn Settlement 0 15,300 0 0 0 0 0 0 0 0 15,300Transition Financial Assistance Program 0 0 0 0 0 0 0 0 0 6,856 6,856Waterfowl Damage 0 0 0 0 561 0 104 1,275 553 0 2,493Interim Red Meat Production Equalization Program 0 0 0 0 0 0 0 2,017 0 0 2,017Transitional Production Adjustment Program (TPAP) 0 0 0 0 0 0 0 0 0 1,467 1,467Compensation for Animal Losses 0 4 0 12 118 1,142 12 35 21 13 1,357Crop Loss Compensation 0 0 0 0 0 0 487 0 198 0 685NISA Deposit Assistance Program 0 0 266 0 0 0 0 0 0 0 266Hog Transportation Assistance 0 0 0 150 0 0 0 0 0 0 150Beef Cow-Calf Assistance 0 119 0 0 0 0 0 0 0 0 119Cull Potato Burial Assistance 0 7 0 0 0 0 0 0 0 0 7
Total Gross Payments 0 15,792 683 369 693 8,210 4,741 5,545 22,226 8,912 67,171
Total Payments Gross Payments 3,077 26,542 6,587 11,832 511,474 111,407 105,206 176,809 152,252 25,481 1,130,667 Producer Premiums 14 2,181 869 4,406 156,962 34,721 78,845 96,856 73,649 4,711 453,214 Net Payments 3,063 24,361 5,718 7,426 354,512 76,686 26,361 79,953 78,603 20,770 677,453
Rebates Reducing Expenses Property Taxes 0 0 0 0 61,359 108,504 0 0 0 0 169,863 Wages 0 0 0 0 0 1,106 0 0 0 0 1,106 Interest 0 0 0 254 44,900 0 0 0 7,150 0 52,304 Electricity 0 0 0 0 0 0 0 0 0 0 0 Heating Fuel 0 0 0 0 0 0 0 0 0 0 0 Fuel 0 0 0 0 0 5,400 0 38,623 0 0 44,023 Fertilizer and Lime 0 0 0 0 0 0 0 0 0 0 0 Pesticides 0 0 0 0 0 0 0 0 0 0 0 Seed 0 0 0 0 0 0 0 0 0 0 0 Feed 0 0 0 0 0 0 0 0 8,750 0 8,750 Veterinary and A.I. 0 0 0 0 0 0 0 0 0 0 0 Livestock Purchases 0 0 499 46 0 0 0 0 0 0 545Total Rebates 0 0 499 300 106,259 115,010 0 38,623 15,900 0 276,591
Total, Direct Payments and Rebates
Gross Payments 3,077 26,542 7,086 12,132 617,733 226,417 105,206 215,432 168,152 25,481 1,407,258 Producer Premiums 14 2,181 869 4,406 156,962 34,721 78,845 96,856 73,649 4,711 453,214 Net Payments 3,063 24,361 6,217 7,726 460,771 191,696 26,361 118,576 94,503 20,770 954,044
NOTE: Unless indicated, there is no producer participation in the funding of the programs. See Explanatory Notes for brief program description.
Statistics Canada - Catalogue No.21-015-XIE 25
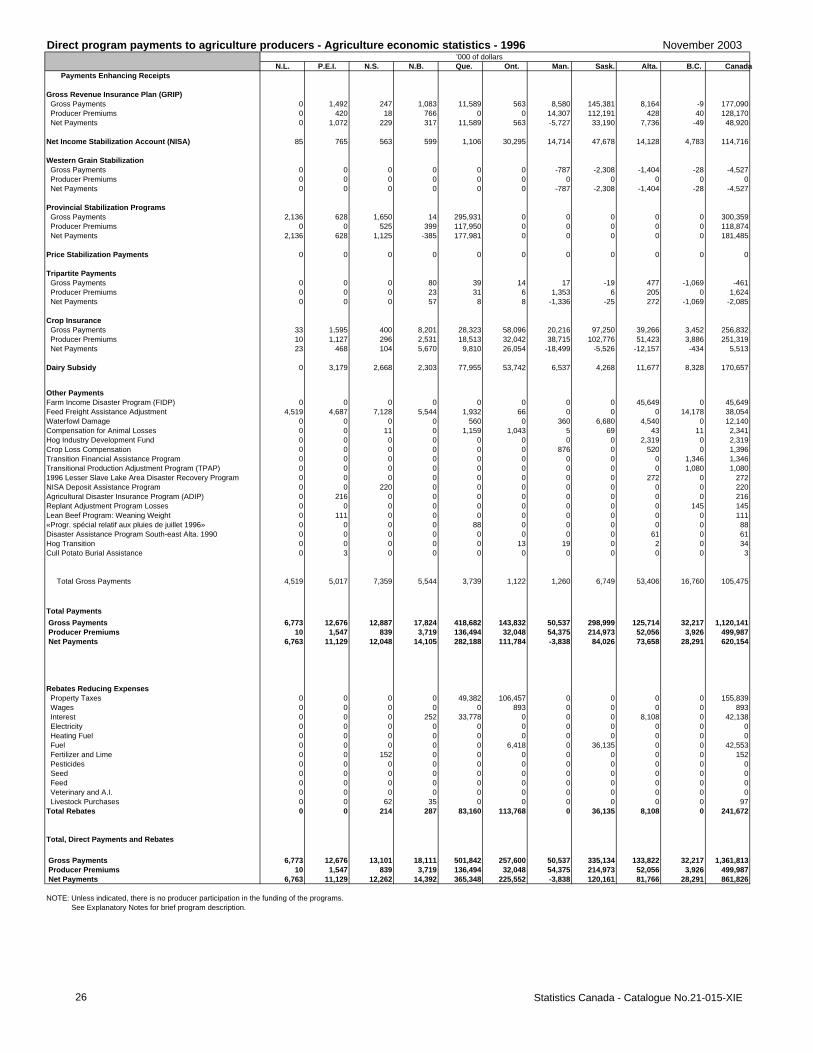
Direct program payments to agriculture producers - Agriculture economic statistics - 1996 November 2003 '000 of dollars
N.L. P.E.I. N.S. N.B. Que. Ont. Man. Sask. Alta. B.C. Canada Payments Enhancing Receipts
Gross Revenue Insurance Plan (GRIP) Gross Payments 0 1,492 247 1,083 11,589 563 8,580 145,381 8,164 -9 177,090 Producer Premiums 0 420 18 766 0 0 14,307 112,191 428 40 128,170 Net Payments 0 1,072 229 317 11,589 563 -5,727 33,190 7,736 -49 48,920
Net Income Stabilization Account (NISA) 85 765 563 599 1,106 30,295 14,714 47,678 14,128 4,783 114,716
Western Grain Stabilization Gross Payments 0 0 0 0 0 0 -787 -2,308 -1,404 -28 -4,527 Producer Premiums 0 0 0 0 0 0 0 0 0 0 0 Net Payments 0 0 0 0 0 0 -787 -2,308 -1,404 -28 -4,527
Provincial Stabilization Programs Gross Payments 2,136 628 1,650 14 295,931 0 0 0 0 0 300,359 Producer Premiums 0 0 525 399 117,950 0 0 0 0 0 118,874 Net Payments 2,136 628 1,125 -385 177,981 0 0 0 0 0 181,485
Price Stabilization Payments 0 0 0 0 0 0 0 0 0 0 0
Tripartite Payments Gross Payments 0 0 0 80 39 14 17 -19 477 -1,069 -461 Producer Premiums 0 0 0 23 31 6 1,353 6 205 0 1,624 Net Payments 0 0 0 57 8 8 -1,336 -25 272 -1,069 -2,085
Crop Insurance Gross Payments 33 1,595 400 8,201 28,323 58,096 20,216 97,250 39,266 3,452 256,832 Producer Premiums 10 1,127 296 2,531 18,513 32,042 38,715 102,776 51,423 3,886 251,319 Net Payments 23 468 104 5,670 9,810 26,054 -18,499 -5,526 -12,157 -434 5,513
Dairy Subsidy 0 3,179 2,668 2,303 77,955 53,742 6,537 4,268 11,677 8,328 170,657
Other PaymentsFarm Income Disaster Program (FIDP) 0 0 0 0 0 0 0 0 45,649 0 45,649Feed Freight Assistance Adjustment 4,519 4,687 7,128 5,544 1,932 66 0 0 0 14,178 38,054Waterfowl Damage 0 0 0 0 560 0 360 6,680 4,540 0 12,140Compensation for Animal Losses 0 0 11 0 1,159 1,043 5 69 43 11 2,341Hog Industry Development Fund 0 0 0 0 0 0 0 0 2,319 0 2,319Crop Loss Compensation 0 0 0 0 0 0 876 0 520 0 1,396Transition Financial Assistance Program 0 0 0 0 0 0 0 0 0 1,346 1,346Transitional Production Adjustment Program (TPAP) 0 0 0 0 0 0 0 0 0 1,080 1,0801996 Lesser Slave Lake Area Disaster Recovery Program 0 0 0 0 0 0 0 0 272 0 272NISA Deposit Assistance Program 0 0 220 0 0 0 0 0 0 0 220Agricultural Disaster Insurance Program (ADIP) 0 216 0 0 0 0 0 0 0 0 216Replant Adjustment Program Losses 0 0 0 0 0 0 0 0 0 145 145Lean Beef Program: Weaning Weight 0 111 0 0 0 0 0 0 0 0 111«Progr. spécial relatif aux pluies de juillet 1996» 0 0 0 0 88 0 0 0 0 0 88Disaster Assistance Program South-east Alta. 1990 0 0 0 0 0 0 0 0 61 0 61Hog Transition 0 0 0 0 0 13 19 0 2 0 34Cull Potato Burial Assistance 0 3 0 0 0 0 0 0 0 0 3
Total Gross Payments 4,519 5,017 7,359 5,544 3,739 1,122 1,260 6,749 53,406 16,760 105,475
Total Payments Gross Payments 6,773 12,676 12,887 17,824 418,682 143,832 50,537 298,999 125,714 32,217 1,120,141 Producer Premiums 10 1,547 839 3,719 136,494 32,048 54,375 214,973 52,056 3,926 499,987 Net Payments 6,763 11,129 12,048 14,105 282,188 111,784 -3,838 84,026 73,658 28,291 620,154
Rebates Reducing Expenses Property Taxes 0 0 0 0 49,382 106,457 0 0 0 0 155,839 Wages 0 0 0 0 0 893 0 0 0 0 893 Interest 0 0 0 252 33,778 0 0 0 8,108 0 42,138 Electricity 0 0 0 0 0 0 0 0 0 0 0 Heating Fuel 0 0 0 0 0 0 0 0 0 0 0 Fuel 0 0 0 0 0 6,418 0 36,135 0 0 42,553 Fertilizer and Lime 0 0 152 0 0 0 0 0 0 0 152 Pesticides 0 0 0 0 0 0 0 0 0 0 0 Seed 0 0 0 0 0 0 0 0 0 0 0 Feed 0 0 0 0 0 0 0 0 0 0 0 Veterinary and A.I. 0 0 0 0 0 0 0 0 0 0 0 Livestock Purchases 0 0 62 35 0 0 0 0 0 0 97Total Rebates 0 0 214 287 83,160 113,768 0 36,135 8,108 0 241,672
Total, Direct Payments and Rebates
Gross Payments 6,773 12,676 13,101 18,111 501,842 257,600 50,537 335,134 133,822 32,217 1,361,813 Producer Premiums 10 1,547 839 3,719 136,494 32,048 54,375 214,973 52,056 3,926 499,987 Net Payments 6,763 11,129 12,262 14,392 365,348 225,552 -3,838 120,161 81,766 28,291 861,826
NOTE: Unless indicated, there is no producer participation in the funding of the programs. See Explanatory Notes for brief program description.
26 Statistics Canada - Catalogue No.21-015-XIE

Direct program payments to agriculture producers - Agriculture economic statistics - 1997 November 2003 '000 of dollars
N.L. P.E.I. N.S. N.B. Que. Ont. Man. Sask. Alta. B.C. Canada Payments Enhancing Receipts
Gross Revenue Insurance Plan (GRIP) Gross Payments 0 0 0 0 6,151 0 15,829 -667 21,487 1,656 44,456 Producer Premiums 0 12 0 0 0 0 137 59 29 20 257 Net Payments 0 -12 0 0 6,151 0 15,692 -726 21,458 1,636 44,199
Net Income Stabilization Account (NISA) 64 2,180 509 1,234 1,790 34,318 20,065 65,109 22,773 5,280 153,322
Western Grain Stabilization Gross Payments 0 0 0 0 0 0 -101 -297 -181 -3 -582 Producer Premiums 0 0 0 0 0 0 0 0 0 0 0 Net Payments 0 0 0 0 0 0 -101 -297 -181 -3 -582
Provincial Stabilization Programs Gross Payments 1,662 621 103 134 168,326 0 0 0 0 0 170,846 Producer Premiums 0 0 431 238 109,547 0 0 0 0 0 110,216 Net Payments 1,662 621 -328 -104 58,779 0 0 0 0 0 60,630 Private sector Contributing to the program funding 0 0 321 0 0 0 0 0 0 0 321
Tripartite Payments Gross Payments 0 0 650 1,109 0 -29 0 -45 3,895 -3 5,577 Producer Premiums 0 0 0 0 0 0 0 0 -1 0 -1 Net Payments 0 0 650 1,109 0 -29 0 -45 3,896 -3 5,578
Crop Insurance Gross Payments 137 1,481 725 3,188 39,075 47,154 32,682 84,899 80,395 12,985 302,721 Producer Premiums 18 965 297 1,761 19,923 36,403 39,223 91,375 60,651 1,869 252,485 Net Payments 119 516 428 1,427 19,152 10,751 -6,541 -6,476 19,744 11,116 50,236
Dairy Subsidy 0 2,064 3,633 2,746 59,615 53,284 4,528 3,404 9,121 8,215 146,610
Other PaymentsFreight Cost Pooling Assistance Program 0 0 0 0 0 0 53,359 49,563 0 0 102,922Farm Income Disaster Program (FIDP) 0 0 0 0 0 0 0 0 56,386 0 56,386Feed Freight Assistance Adjustment 4,147 350 2,304 2,736 2,265 357 0 0 0 4,387 16,546Waterfowl Damage 0 0 0 0 430 0 368 5,754 4,518 0 11,070Crop Loss Compensation 0 0 0 0 0 0 1,971 0 4,501 0 6,472The Big Game Damage Compensation Program 0 0 0 0 0 0 0 6,133 0 0 6,133Western Diversification's ReStart Program 0 0 0 0 0 0 4,600 0 0 0 4,600NTSP Apple Transition Program 0 0 529 0 1,913 0 0 0 0 0 2,442Compensation for Animal Losses 5 0 2 7 1,167 1,087 40 4 16 13 2,341Jobs and Economic Restoration Initiative (JERI) 0 0 0 0 0 0 2,000 0 0 0 2,000Agricultural Disaster Insurance Program (ADIP) 0 1,170 0 0 0 0 0 0 0 0 1,1701997 Special Transitional Payment 0 0 0 0 0 0 0 0 0 1,007 1,007Crop Restoration Program 0 0 0 0 0 0 752 0 0 0 752Canada-Ontario Market Revenue Program 0 0 0 0 0 416 0 0 0 0 416«Prog. de reconstruction économique temp.-Pluies 1996» 0 0 0 0 166 0 0 0 0 0 166Lean Beef Program: Weaning Weight 0 111 0 0 0 0 0 0 0 0 111«Progr. spécial relatif aux pluies de juillet 1996» 0 0 0 0 61 0 0 0 0 0 611996 Lesser Slave Lake Area Disaster Recovery Program 0 0 0 0 0 0 0 0 53 0 53Transitional Production Adjustment Program (TPAP) 0 0 0 0 0 0 0 0 0 20 20Hog Industry Development Fund 0 0 0 0 0 0 0 0 14 0 14Cull Potato Burial Assistance 0 12 0 0 0 0 0 0 0 0 12
Total Gross Payments 4,152 1,643 2,835 2,743 6,002 1,860 63,090 61,454 65,488 5,427 214,694 Producers Premiums 0 0 0 0 0 0 0 0 0 0 0 Net Payments 4,152 1,643 2,835 2,743 6,002 1,860 63,090 61,454 65,488 5,427 214,694
Total Payments Gross Payments 6,015 7,989 8,455 11,154 280,959 136,587 136,093 213,857 202,978 33,557 1,037,644 Producer Premiums 18 977 728 1,999 129,470 36,403 39,360 91,434 60,679 1,889 362,957 Net Payments 5,997 7,012 7,727 9,155 151,489 100,184 96,733 122,423 142,299 31,668 674,687
Rebates Reducing Expenses Property Taxes 0 0 0 0 49,601 108,883 0 0 0 0 158,484 Wages 0 0 0 0 0 1,983 0 0 0 0 1,983 Interest 0 0 0 218 14,798 0 0 0 7,370 0 22,386 Electricity 0 0 0 0 0 0 0 0 0 0 0 Heating Fuel 0 0 0 0 0 0 0 0 0 0 0 Fuel 0 0 0 0 0 5,605 0 38,860 0 0 44,465 Fertilizer and Lime 0 0 178 0 0 0 0 0 0 0 178 Pesticides 0 0 0 0 0 0 0 0 0 0 0 Seed 0 0 0 0 0 0 0 0 0 0 0 Feed 0 0 0 0 0 0 0 0 0 0 0 Veterinary and A.I. 0 0 0 0 0 0 0 0 0 0 0 Livestock Purchases 0 19 80 26 0 0 0 0 0 0 125Total Rebates 0 19 258 244 64,399 116,471 0 38,860 7,370 0 227,621
Total, Direct Payments and Rebates
Gross Payments 6,015 8,008 8,713 11,398 345,358 253,058 136,093 252,717 210,348 33,557 1,265,265 Producer Premiums 18 977 728 1,999 129,470 36,403 39,360 91,434 60,679 1,889 362,957 Net Payments 5,997 7,031 7,985 9,399 215,888 216,655 96,733 161,283 149,669 31,668 902,308
NOTE: Unless indicated, there is no producer participation in the funding of the programs. See Explanatory Notes for brief program description.
Statistics Canada - Catalogue No.21-015-XIE 27

Direct program payments to agriculture producers - Agriculture economic statistics - 1998 November 2003 '000 of dollars
N.L. P.E.I. N.S. N.B. Que. Ont. Man. Sask. Alta. B.C. Canada Payments Enhancing Receipts
Gross Revenue Insurance Plan (GRIP) Gross Payments 0 0 0 0 0 0 36 -378 0 0 -342 Producer Premiums 0 0 0 0 0 0 29 27 0 0 56 Net Payments 0 0 0 0 0 0 7 -405 0 0 -398
Net Income Stabilization Account (NISA) 116 4,513 1,722 613 4,024 76,002 29,678 105,053 38,269 8,734 268,724
Western Grain Stabilization Gross Payments 0 0 0 0 0 0 -40 -116 -71 -1 -228 Producer Premiums 0 0 0 0 0 0 0 0 0 0 0 Net Payments 0 0 0 0 0 0 -40 -116 -71 -1 -228
Provincial Stabilization Programs Gross Payments 0 1,141 7,790 427 498,589 0 0 0 0 0 507,947 Producer Premiums 0 0 664 0 106,695 0 0 0 0 0 107,359 Net Payments 0 1,141 7,126 427 391,894 0 0 0 0 0 400,588 Private sector Contributing to the program funding 0 0 664 0 0 0 0 0 0 0 664
Tripartite Payments Gross Payments 0 0 0 0 -3 -3 -2 -3 -13 -2 -26 Producer Premiums 0 0 0 0 0 0 0 0 0 0 0 Net Payments 0 0 0 0 -3 -3 -2 -3 -13 -2 -26
Crop Insurance Gross Payments 10 754 888 1,417 17,307 51,329 39,948 95,478 103,327 7,898 318,356 Producer Premiums 9 813 312 781 20,075 40,446 39,231 77,607 62,778 2,173 244,225 Net Payments 1 -59 576 636 -2,768 10,883 717 17,871 40,549 5,725 74,131
Dairy Subsidy 0 1,898 3,323 2,499 54,536 47,364 3,965 2,734 7,711 8,083 132,113
Other PaymentsFarm Income Disaster Program (FIDP) 0 0 0 0 0 0 0 0 63,215 0 63,215Canada-Ontario Market Revenue Program 0 0 0 0 0 15,071 0 0 0 0 15,071«Progr. relatif au verglas de 1998» 0 0 0 0 14,829 0 0 0 0 0 14,829Jobs and Economic Restoration Initiative (JERI) 0 0 0 0 0 0 11,500 0 0 0 11,500"Eastern Ontario Disaster Relief" 0 0 0 0 0 9,643 0 0 0 0 9,643B.C. Whole Farm Insurance Program (WFIP) 0 0 0 0 0 0 0 0 0 9,059 9,059Compensation for Animal Losses 0 0 0 5 2,054 1,635 522 28 61 35 4,340Crop Loss Compensation 16 0 0 0 0 0 768 0 1,987 0 2,771Waterfowl Damage 0 0 0 0 1,000 0 210 554 937 0 2,701Feed Freight Assistance Adjustment 227 1,272 0 0 0 0 0 0 0 0 1,499Agricultural Disaster Insurance Program (ADIP) 0 1,431 0 0 0 0 0 0 0 0 1,431Hog Stabilization Fund N.B. 0 0 0 797 0 0 0 0 0 0 797The Big Game Damage Compensation Program 0 0 0 0 0 0 0 577 0 0 577Ice Storm Recovery Program 0 0 0 0 493 0 0 0 0 0 493Beef Performance Program 0 0 365 0 0 0 0 0 0 0 365Southwestern Alberta Grass Fire Disaster Recovery Prog. 0 0 0 0 0 0 0 0 323 0 323Crop Restoration Program 0 0 0 0 0 0 156 0 0 0 156Lean Beef Program: Weaning Weight 0 115 0 0 0 0 0 0 0 0 115«Prog. de reconstruction économique temp.-Pluies 1996» 0 0 0 0 95 0 0 0 0 0 951996 Lesser Slave Lake Area Disaster Recovery Program 0 0 0 0 0 0 0 0 82 0 82«Progr. spécial relatif aux pluies de juillet 1996» 0 0 0 0 12 0 0 0 0 0 12Cull Potato Burial Assistance 0 7 0 0 0 0 0 0 0 0 71997 Special Transitional Payment 0 0 0 0 0 0 0 0 0 6 6
Total Gross Payments 243 2,825 365 802 18,483 26,349 13,156 1,159 66,605 9,100 139,087 Producers Premiums 0 0 0 0 0 0 0 0 0 0 0 Net Payments 243 2,825 365 802 18,483 26,349 13,156 1,159 66,605 9,100 139,087
Total Payments Gross Payments 369 11,131 14,088 5,758 592,936 201,041 86,741 203,927 215,828 33,812 1,365,631 Producer Premiums 9 813 976 781 126,770 40,446 39,260 77,634 62,778 2,173 351,640 Net Payments 360 10,318 13,112 4,977 466,166 160,595 47,481 126,293 153,050 31,639 1,013,991
Rebates Reducing ExpensesProperty Taxes 0 0 0 0 51,762 350 0 0 0 0 52,112Wages 0 0 0 0 0 2,850 0 0 0 0 2,850Interest 0 0 3,004 211 15,912 0 0 0 4,956 0 24,083Electricity 0 0 0 0 0 0 0 0 0 0 0Heating Fuel 0 0 0 0 0 0 0 0 0 0 0Fuel 0 0 0 0 0 5,085 0 34,725 0 0 39,810Fertilizer and Lime 0 0 194 0 0 0 0 0 0 0 194Pesticides 0 0 0 0 0 0 0 0 0 0 0Seed 0 0 0 0 0 0 0 0 0 0 0Feed 0 0 0 0 0 0 0 0 0 0 0Veterinary and A.I. 0 0 0 0 0 0 0 0 0 0 0Livestock Purchases 0 34 100 26 0 0 0 0 0 0 160 Total Rebates 0 34 3,298 237 67,674 8,285 0 34,725 4,956 0 119,209
Total, Direct Payments and Rebates
Gross Payments 369 11,165 17,386 5,995 660,610 209,326 86,741 238,652 220,784 33,812 1,484,840 Producer Premiums 9 813 976 781 126,770 40,446 39,260 77,634 62,778 2,173 351,640 Net Payments 360 10,352 16,410 5,214 533,840 168,880 47,481 161,018 158,006 31,639 1,133,200
NOTE: Unless indicated, there is no producer participation in the funding of the programs. See Explanatory Notes for brief program description.
28 Statistics Canada - Catalogue No.21-015-XIE

Direct program payments to agriculture producers - Agriculture economic statistics - 1999 Novmeber 2003 '000 of dollars
N.L. P.E.I. N.S. N.B. Que. Ont. Man. Sask. Alta. B.C. Canada Payments Enhancing Receipts
Net Income Stabilization Account (NISA) 115 5,842 2,174 932 5,194 109,107 58,267 187,785 65,656 9,846 444,918
Income Disaster Assistance Programs Farm Income Disaster Program (FIDP) 0 0 0 0 0 0 0 0 78,921 0 78,921 Agriculture Disaster Insurance Program (ADIP) 0 1,339 0 0 0 0 0 0 0 0 1,339 B.C. Whole Farm Insurance Program (WFIP) 0 0 0 0 0 0 0 0 0 14,141 14,141 Ontario Whole Farm Relief Program (OWFRP) 0 0 0 0 0 77,885 0 0 0 0 77,885 Agricultural Disaster Assistance Program (AIDA) 39 6,607 1,880 342 80 0 42,183 113,552 2,352 0 167,035
Total 39 7,946 1,880 342 80 77,885 42,183 113,552 81,273 14,141 339,321
Provincial Stabilization Programs Gross Payments 0 1,029 6,954 0 564,793 0 0 0 0 0 572,776 Producer Premiums 0 0 1,546 0 152,173 0 0 0 0 0 153,719 Net Payments 0 1,029 5,408 0 412,620 0 0 0 0 0 419,057 Private Sector Contribution to Program Funding 0 0 1,537 0 0 0 0 0 0 0 1,537
Crop Insurance Gross Payments 165 2,204 711 961 8,560 28,644 29,668 117,747 45,967 4,917 239,544 Producer Premiums 8 1,137 323 540 21,107 35,458 27,758 68,854 57,077 2,325 214,587 Net Payments 157 1,067 388 421 -12,547 -6,814 1,910 48,893 -11,110 2,592 24,957
Dairy Subsidy 0 1,480 2,485 1,940 42,726 36,487 3,137 2,252 6,636 6,509 103,652
Other PaymentsCanada-Ontario Market Revenue Program 0 0 0 0 0 74,844 0 0 0 0 74,8441999 MFDAP Unseeded Acreage 0 0 0 0 0 0 55,836 0 0 0 55,836«Progr. relatif au verglas de 1998» 0 0 0 0 27,251 0 0 0 0 0 27,251Can.-Sask. 1999 Unseeded Acreage 0 0 0 0 0 0 0 7,726 0 0 7,726Waterfowl Damage 0 0 0 0 783 0 365 3,455 1,513 0 6,1161999 MFDAP Custom Seeding 0 0 0 0 0 0 5,645 0 0 0 5,645Transitional Production Adjustment Program (TPAP) 0 0 0 0 0 0 0 0 0 5,316 5,316Compensation for Animal Losses 0 0 0 0 1,701 2,693 71 112 387 85 5,049"Eastern Ontario Disaster Relief" 0 0 0 0 0 3,284 0 0 0 0 3,2841999 MFDAP Forage Restoration 0 0 0 0 0 0 3,038 0 0 0 3,038Jobs and Economic Restoration Initiative (JERI) 0 0 0 0 0 0 2,500 0 0 0 2,500Tripartite Plan for Crop and Livestock Sectors 0 0 0 0 -5 -5 2,421 -4 -17 -2 2,3881999 MFDAP - Hay Shortfall 0 0 0 0 0 0 2,185 0 0 0 2,185Ice Storm Recovery Program 0 0 0 0 2,003 0 0 0 0 0 2,003Crop Loss Compensation 30 0 0 0 0 0 512 852 516 0 1,910Hog Stabilization Fund N.B. 0 0 0 673 0 0 0 0 0 0 673Swine Processing Enhancing Program (Gov. pymnt.) 0 0 0 503 0 0 0 0 0 0 503Beef Performance Program 0 0 313 0 0 0 0 0 0 0 313Livestock Predation Compensation Program 0 0 0 0 0 0 165 0 0 0 165Feed Freight Assistance Adjustment 0 108 0 0 0 0 0 0 0 0 108Lean Beef Program: Weaning Weight 0 79 0 0 0 0 0 0 0 0 79Cull Potato Burial Assistance 0 8 0 0 0 0 0 0 0 0 8Western Grain Stabilization Program 0 0 0 0 0 0 -6 -16 -9 0 -31Gross Revenue Insurance Plan 0 0 0 0 0 0 -43 -183 0 0 -226
Total Gross Payments 30 195 313 1,176 31,733 80,816 72,689 11,942 2,390 5,399 206,683 Producers Premiums 0 0 0 0 0 0 11 9 0 0 20 Net Payments 30 195 313 1,176 31,733 80,816 72,678 11,933 2,390 5,399 206,663
Total Payments Gross Payments 349 18,696 14,517 5,351 653,086 332,939 205,944 433,278 201,922 40,812 1,906,894 Producer Premiums 8 1,137 1,869 540 173,280 35,458 27,769 68,863 57,077 2,325 368,326 Net Payments 341 17,559 12,648 4,811 479,806 297,481 178,175 364,415 144,845 38,487 1,538,568
Rebates Reducing Expenses Property Taxes 0 0 0 0 60,495 0 0 0 0 0 60,495 Wages 0 0 0 0 0 2,946 0 0 0 0 2,946 Interest 0 0 3,001 303 16,380 0 0 0 4,010 0 23,694 Electricity 0 0 0 0 0 0 0 0 0 0 0 Heating Fuel 0 0 0 0 0 0 0 0 0 0 0 Fuel 0 0 0 0 0 5,028 0 34,849 0 0 39,877 Fertilizer and Lime 0 0 160 0 0 0 0 0 0 0 160 Pesticides 0 0 0 0 0 0 0 0 0 0 0 Seed 0 0 0 0 0 0 0 0 0 0 0 Feed 0 0 0 0 0 0 0 0 0 0 0 Veterinary and A.I. 0 0 0 0 0 0 0 0 0 0 0 Livestock Purchases 0 96 100 31 0 0 0 0 0 0 227Total Rebates 0 96 3,261 335 76,875 7,974 0 34,849 4,010 0 127,399
Total, Direct Payments and Rebates
Gross Payments 349 18,792 17,778 5,686 729,961 340,913 205,944 468,127 205,932 40,812 2,034,293 Producer Premiums 8 1,137 1,869 540 173,280 35,458 27,769 68,863 57,077 2,325 368,326 Net Payments 341 17,655 15,909 5,146 556,681 305,455 178,175 399,264 148,855 38,487 1,665,967
NOTE: Unless indicated, there is no producer participation in the funding of the programs. See Explanatory Notes for brief program description.
Statistics Canada - Catalogue No.21-015-XIE 29

Direct program payments to agriculture producers - Agriculture economic statistics - 2000 Novmeber 2003 '000 of dollars
N.L. P.E.I. N.S. N.B. Que. Ont. Man. Sask. Alta. B.C. Canada Payments Enhancing Receipts
Net Income Stabilization Account (NISA) 136 6,266 1,731 1,289 7,633 109,730 61,628 186,722 71,853 9,233 456,221
Income Disaster Assistance Programs Farm Income Disaster Program (FIDP) 0 0 0 0 0 0 0 0 135,849 0 135,849 Agriculture Disaster Insurance Program (ADIP) 0 10 0 0 0 0 0 0 0 0 10 B.C. Whole Farm Insurance Program (WFIP) 0 0 0 0 0 0 0 0 0 6,630 6,630 Ontario Whole Farm Relief Program (OWFRP) 0 0 0 0 0 86,795 0 0 0 0 86,795 Agricultural Disaster Assistance Program (AIDA) 148 6,101 1,817 1,457 5,369 0 45,101 108,574 19,346 4,656 192,569
Total 148 6,111 1,817 1,457 5,369 86,795 45,101 108,574 155,195 11,286 421,853
Provincial Stabilization Programs Gross Payments 0 598 722 0 409,860 0 0 0 0 0 411,180 Producer Premiums 0 0 408 0 159,738 0 0 0 0 0 160,146 Net Payments 0 598 314 0 250,122 0 0 0 0 0 251,034 Private Sector Contribution to Program Funding 0 0 493 0 0 0 0 0 0 0 493
Crop Insurance Gross Payments 77 2,878 431 1,294 80,121 71,749 53,954 116,510 116,001 8,367 451,382 Producer Premiums 4 1,071 300 429 20,248 31,655 29,071 59,062 39,871 2,371 184,082 Net Payments 73 1,807 131 865 59,873 40,094 24,883 57,448 76,130 5,996 267,300
Dairy Subsidy 0 1,022 1,759 1,368 30,393 25,934 2,167 1,553 4,182 4,288 72,666
Other PaymentsAlberta Farm Income Assistance Program 0 0 0 0 0 0 0 0 309,357 0 309,357Canada-Saskatchewan Adjustment Program 0 0 0 0 0 0 0 259,665 0 0 259,665Canada-Ontario Market Revenue Program 0 0 0 0 0 127,244 0 0 0 0 127,244Canada-Manitoba Adjustment Program 0 0 0 0 0 0 100,007 0 0 0 100,007Compensation for Animal Losses 0 0 0 0 1,915 830 62 3,959 1,429 331 8,526Waterfowl Damage 0 0 0 0 1,048 0 697 3,179 2,991 0 7,915Weather-Related Loss Provision Program 0 0 5,000 0 0 0 0 0 0 0 5,000«Progr. relatif au verglas de 1998» 0 0 0 0 3,684 0 0 0 0 0 3,684Transitional Production Adjustment Program (TPAP) 0 0 0 0 0 0 0 0 0 3,554 3,554Crop Loss Compensation 7 0 0 0 0 0 632 973 1,624 0 3,236Transportation Adjustment Fund (TAF) 0 0 0 0 0 0 0 0 0 1,335 1,335Can.-Sask. 1999 Unseeded Acreage 0 0 0 0 0 0 0 1,140 0 0 1,140«Aide aux exploit. ovines affecteés par la tremblante» 0 0 0 0 1,000 0 0 0 0 0 1,0001999 MFDAP Unseeded Acreage 0 0 0 0 0 0 950 0 0 0 9501999 MFDAP Forage Restoration 0 0 0 0 0 0 944 0 0 0 9441999 MFDAP - Hay Shortfall 0 0 0 0 0 0 929 0 0 0 929Beef Performance Program 0 0 504 0 0 0 0 0 0 0 504Ice Storm Recovery Program 0 0 0 0 464 0 0 0 0 0 464Swine Processing Enhancing Program (Gov. pymnt.) 0 0 0 198 0 0 0 0 0 0 198Livestock Predation Compensation Program 0 0 0 0 0 0 197 0 0 0 197SIR Clean up and Compliance Grant 0 0 0 0 0 0 0 0 0 151 1511999 MFDAP Custom Seeding 0 0 0 0 0 0 151 0 0 0 151Lean Beef Program: Weaning Weight 0 50 0 0 0 0 0 0 0 0 50Beef Quality Incentive Program 0 29 0 0 0 0 0 0 0 0 29Beef Quality Marketing Initiative 0 0 0 18 0 0 0 0 0 0 18Tripartite Plan for Crop and Livestock Sectors 0 0 0 0 -4 -4 -1 -6 -17 -1 -33Gross Revenue Insurance Plan 0 0 0 0 0 0 -1 -87 0 0 -88Western Grain Stabilization Program 0 0 0 0 0 0 -32 -92 -56 0 -180
Total Gross Payments 7 79 5,504 216 8,107 128,070 104,535 268,731 315,328 5,370 835,947 Producers Premiums 0 0 0 0 0 0 7 9 0 0 16 Net Payments 7 79 5,504 216 8,107 128,070 104,528 268,722 315,328 5,370 835,931
Total Payments Gross Payments 368 16,954 11,964 5,624 541,483 422,278 267,385 682,090 662,559 38,544 2,649,249 Producer Premiums 4 1,071 708 429 179,986 31,655 29,078 59,071 39,871 2,371 344,244 Net Payments 364 15,883 11,256 5,195 361,497 390,623 238,307 623,019 622,688 36,173 2,305,005
Rebates Reducing Expenses Property Taxes 0 0 0 0 63,799 0 0 650 0 0 64,449 Wages 0 0 0 0 0 2,329 0 0 0 0 2,329 Interest 0 0 0 300 15,696 0 0 0 6,109 0 22,105 Electricity 0 0 0 0 0 0 0 0 0 0 0 Heating Fuel 0 0 0 0 0 0 0 0 2,700 0 2,700 Fuel 0 0 0 0 0 3,885 0 34,997 0 0 38,882 Fertilizer and Lime 0 0 0 0 0 0 0 0 0 0 0 Pesticides 0 0 0 0 0 0 0 0 0 0 0 Seed 0 0 0 0 0 0 0 0 0 0 0 Feed 0 0 0 0 0 0 0 0 0 0 0 Veterinary and A.I. 0 0 0 0 0 0 0 0 0 0 0 Livestock Purchases 0 40 0 0 0 0 0 0 0 0 40Total Rebates 0 40 0 300 79,495 6,214 0 35,647 8,809 0 130,505
Total, Direct Payments and Rebates
Gross Payments 368 16,994 11,964 5,924 620,978 428,492 267,385 717,737 671,368 38,544 2,779,754 Producer Premiums 4 1,071 708 429 179,986 31,655 29,078 59,071 39,871 2,371 344,244 Net Payments 364 15,923 11,256 5,495 440,992 396,837 238,307 658,666 631,497 36,173 2,435,510
NOTE: Unless indicated, there is no producer participation in the funding of the programs. See Explanatory Notes for brief program description.
30 Statistics Canada - Catalogue No.21-015-XIE

Direct program payments to agriculture producers - Agriculture economic statistics - 2001 Novmeber 2003 '000 of dollars
N.L. P.E.I. N.S. N.B. Que. Ont. Man. Sask. Alta. B.C. Canada Payments Enhancing Receipts
Net Income Stabilization Account (NISA) 168 6,945 2,888 2,059 8,146 122,008 58,642 166,914 65,883 8,058 441,711
Income Disaster Assistance Programs Farm Income Disaster Program (FIDP) 0 0 0 0 0 0 0 0 124,605 0 124,605 Agriculture Disaster Insurance Program (ADIP) 0 0 0 0 0 0 0 0 0 0 0 B.C. Whole Farm Insurance Program (WFIP) 0 0 0 0 0 0 0 0 0 3,199 3,199 Ontario Whole Farm Relief Program (OWFRP) 0 0 0 0 0 52,900 0 0 0 0 52,900 Agricultural Disaster Assistance Program (AIDA) 350 449 2,765 2,038 3,860 0 100,370 183,611 4,328 9,411 307,182 Canadian Farm Income Program 53 5,870 884 678 1,511 0 17,223 53,332 0 2,909 82,460 Ontario Farm Income Disaster Program (OFIDP) 0 0 0 0 0 56,336 0 0 0 0 56,336
Total 403 6,319 3,649 2,716 5,371 109,236 117,593 236,943 128,933 15,519 626,682
Provincial Stabilization Programs Gross Payments 0 482 0 0 515,994 0 0 0 0 0 516,476 Producer Premiums 0 0 0 0 136,547 0 0 0 0 0 136,547 Net Payments 0 482 0 0 379,447 0 0 0 0 0 379,929 Private Sector Contribution to Program Funding 0 0 0 0 0 0 0 0 0 0 0
Crop Insurance Gross Payments 132 6,746 852 750 74,633 218,699 86,492 296,841 222,212 10,232 917,589 Producer Premiums 9 1,253 323 377 20,233 35,187 29,867 70,907 56,652 2,655 217,463 Net Payments 123 5,493 529 373 54,400 183,512 56,625 225,934 165,560 7,577 700,126
Dairy Subsidy 0 583 999 768 17,434 14,704 1,277 881 2,573 2,666 41,885
Other PaymentsCanada Alberta Farm Income Assistance Program (CAFIAP) 0 0 0 0 0 0 0 0 276,486 0 276,486Canada-Saskatchewan Assistance Program (C-SAP II) 0 0 0 0 0 0 0 200,088 0 0 200,088Canada-Ontario Market Revenue Program 0 0 0 0 0 121,853 0 0 0 0 121,853Alberta Farm Income Assistance Program 0 0 0 0 0 0 0 0 98,193 0 98,193Canada-Manitoba Adjustment Program 2 (CMAP 2) 0 0 0 0 0 0 92,088 0 0 0 92,088Ontario Grain Stabilization Payment 0 0 0 0 0 91,000 0 0 0 0 91,000Canada-Ontario Grain and Oilseed Payment 0 0 0 0 0 68,000 0 0 0 0 68,000Canada-Ontario Edible Horticulture Payment 0 0 0 0 0 31,000 0 0 0 0 31,000Potato Diversion Program (2001) 0 27,866 0 0 0 0 0 0 0 0 27,866Compensation for Animal Losses 0 0 0 4 1,890 679 392 22,243 580 95 25,883Canada-British Columbia Assistance Program 0 0 0 0 0 0 0 0 0 21,990 21,990Gross Revenue Insurance Plan 0 0 0 0 0 0 7,796 -111 0 0 7,685Conservation Cover Program 0 0 0 0 0 0 0 7,249 0 0 7,249Weather-Related Loss Provision Program 0 0 5,303 0 0 0 0 0 0 0 5,303Farm Income Adjustment Program 0 4,876 0 0 0 0 0 0 0 0 4,876Crop Loss Compensation 7 0 0 0 0 0 1,455 763 2,550 0 4,775Potato Disposal Adjustment Program 0 4,600 0 0 0 0 0 0 0 0 4,600Farm Income Support Program 0 0 3,677 0 0 0 0 0 0 0 3,677Waterfowl Damage 0 0 0 0 427 0 492 714 1,117 0 2,750Transitional Production Adjustment Program (TPAP) 0 0 0 0 0 0 0 0 0 1,296 1,296Canada-Saskatchewan Adjustment Program 0 0 0 0 0 0 0 416 0 0 416Canada-Manitoba Adjustment Program 0 0 0 0 0 0 307 0 0 0 307Livestock Predation Compensation Program 0 0 0 0 0 0 250 0 0 0 250Beef Quality Incentive Program 0 120 0 0 0 0 0 0 0 0 120Swine Processing Enhancing Program (Gov. pymnt.) 0 0 0 43 0 0 0 0 0 0 43Beef Quality Marketing Initiative 0 0 0 30 0 0 0 0 0 0 30«Progr. relatif au verglas de 1998» 0 0 0 0 25 0 0 0 0 0 25SIR Clean up and Compliance Grant 0 0 0 0 0 0 0 0 0 8 8Cull Potato Burial Assistance 0 5 0 0 0 0 0 0 0 0 5Can.-Sask. 1999 Unseeded Acreage 0 0 0 0 0 0 0 -1 0 0 -1Tripartite Plan for Crop and Livestock Sectors 0 0 0 0 -4 -4 -1 -1 -9 -1 -20Western Grain Stabilization Program 0 0 0 0 0 0 -19 -55 -34 0 -108
Total Gross Payments 7 37,467 8,980 77 2,338 312,528 102,760 231,305 378,883 23,388 1,097,733 Producers Premiums 0 0 0 0 0 0 9 11 0 0 20 Net Payments 7 37,467 8,980 77 2,338 312,528 102,751 231,294 378,883 23,388 1,097,713
Total Payments Gross Payments 710 58,542 17,368 6,370 623,916 777,175 366,764 932,884 798,484 59,863 3,642,076 Producer Premiums 9 1,253 323 377 156,780 35,187 29,876 70,918 56,652 2,655 354,030 Net Payments 701 57,289 17,045 5,993 467,136 741,988 336,888 861,966 741,832 57,208 3,288,046
Rebates Reducing ExpensesProperty Taxes 0 0 0 0 70,965 0 0 29,222 0 0 100,187Wages 0 0 0 0 0 2,280 0 0 0 0 2,280Interest 0 0 0 305 15,624 0 0 0 5,588 0 21,517Electricity 0 0 0 0 0 0 0 0 0 0 0Heating Fuel 0 0 0 0 0 0 0 0 13,000 0 13,000Fuel 0 0 0 0 0 3,026 0 36,844 0 0 39,870Fertilizer and Lime 0 0 0 0 0 0 0 0 0 0 0Pesticides 0 0 0 0 0 0 0 0 0 0 0Seed 0 0 0 0 0 0 0 0 0 0 0Feed 0 0 0 0 0 0 0 0 0 0 0Veterinary and A.I. 0 0 0 0 0 0 0 0 0 0 0Livestock Purchases 0 40 0 0 0 0 0 0 0 0 40Total Rebates 0 40 0 305 86,589 5,306 0 66,066 18,588 0 176,894
Total, Direct Payments and Rebates
Gross Payments 710 58,582 17,368 6,675 710,505 782,481 366,764 998,950 817,072 59,863 3,818,970 Producer Premiums 9 1,253 323 377 156,780 35,187 29,876 70,918 56,652 2,655 354,030 Net Payments 701 57,329 17,045 6,298 553,725 747,294 336,888 928,032 760,420 57,208 3,464,940
NOTE: Unless indicated, there is no producer participation in the funding of the programs. See Explanatory Notes for brief program description.
Statistics Canada - Catalogue No.21-015-XIE 31

Direct program payments to agriculture producers - Agriculture economic statistics - 2002 May 2004 '000 of dollars
N.L. P.E.I. N.S. N.B. Que. Ont. Man. Sask. Alta. B.C. Canada Payments Enhancing Receipts
Net Income Stabilization Account (NISA) 271 8,539 6,088 3,544 10,674 169,790 77,725 216,423 110,424 12,207 615,685
Income Disaster Assistance Programs Agricultural Disaster Assistance Program (AIDA) 0 0 0 0 87 0 0 0 0 3 90 Agriculture Disaster Insurance Program (ADIP) 0 0 0 0 0 0 0 0 0 0 0 B.C. Whole Farm Insurance Program (WFIP) 0 0 0 0 0 0 0 0 0 4,519 4,519 Canadian Farm Income Program 12 9,398 2,479 1,383 6,035 0 45,951 138,283 0 6,861 210,402 Farm Income Disaster Program (FIDP) 0 0 0 0 0 0 0 0 114,294 0 114,294 Ontario Farm Income Disaster Program (OFIDP) 0 0 0 0 0 57,557 0 0 0 0 57,557 Ontario Whole Farm Relief Program (OWFRP) 0 0 0 0 0 63 0 0 0 0 63
Total 12 9,398 2,479 1,383 6,122 57,620 45,951 138,283 114,294 11,383 386,925
Provincial Stabilization Programs Gross Payments 0 387 0 0 395,286 0 0 0 0 0 395,673 Producer Premiums 0 0 0 0 55,742 0 0 0 0 0 55,742 Net Payments 0 387 0 0 339,544 0 0 0 0 0 339,931 Private Sector Contribution to Program Funding 0 0 0 0 0 0 0 0 0 0 0
Crop Insurance Gross Payments 180 5,878 482 630 42,100 218,983 76,585 580,148 477,319 4,742 1,407,047 Producer Premiums 19 1,724 372 311 26,600 48,853 33,461 81,548 104,198 3,151 300,237 Net Payments 161 4,154 110 319 15,500 170,130 43,124 498,600 373,121 1,591 1,106,810
Dairy Subsidy 0 137 210 167 3,628 3,190 258 174 516 478 8,758
Other PaymentsFarm Income Assistance Program (FIAP) 2002 0 0 0 0 0 0 0 0 253,955 0 253,955Canada-Ontario Market Revenue Program 0 0 0 0 0 100,977 0 0 0 0 100,977Ontario Bridge Funding Payment (OBFP) 0 0 0 0 0 72,105 0 0 0 0 72,105Alberta Farm Income Assistance Program 0 0 0 0 0 0 0 0 31,453 0 31,453Canada Alberta Farm Income Assistance Program (CAFIAP) 0 0 0 0 0 0 0 0 30,404 0 30,404Agricultural Revenue Stabilization Account 0 0 0 0 7,944 0 0 0 0 0 7,944Compensation for Animal Losses 0 0 0 0 1,214 746 30 4,004 799 217 7,010Herd Retention Program 0 0 0 0 0 0 0 6,610 0 0 6,610Waterfowl Damage 0 0 0 0 1,050 0 435 1,691 1,660 0 4,836Crop Loss Compensation 22 0 0 0 0 0 652 1,032 1,822 0 3,528Conservation Cover Program 0 0 0 0 0 0 0 2,558 0 0 2,558Canada-New Brunswick Farm Assistance Program 0 0 0 2,201 0 0 0 0 0 0 2,201Weather-Related Loss Provision Program 0 0 1,483 0 0 0 0 0 0 0 1,483Transitional Production Adjustment Program (TPAP) 0 0 0 0 0 0 0 0 0 1,182 1,182Forage Companion Program 699 0 0 0 0 0 0 0 0 0 699Farm Income Support Program 0 0 633 0 0 0 0 0 0 0 633Wildlife Compensation Companion program 0 0 0 0 0 0 0 0 0 622 622Livestock Predation Compensation Program 0 0 0 0 0 0 337 0 0 0 337Canada-Saskatchewan Assistance Program (C-SAP II) 0 0 0 0 0 0 0 122 0 0 122Transportation Adjustment Fund (TAF) 0 0 0 0 0 0 0 0 0 85 85Canada-Manitoba Adjustment Program 2 (CMAP 2) 0 0 0 0 0 0 10 0 0 0 10Gross Revenue Insurance Plan 0 0 0 0 0 0 5 5 0 0 10Farm Income Adjustment Program 0 9 0 0 0 0 0 0 0 0 9Cull Potato Burial Assistance 0 7 0 0 0 0 0 0 0 0 7Canada-Saskatchewan Adjustment Program 0 0 0 0 0 0 0 2 0 0 2Western Grain Stabilization Program 0 0 0 0 0 0 -1 -2 -3 0 -6Tripartite Plan for Crop and Livestock Sectors 0 0 0 0 -3 -3 -1 -2 -14 -1 -24
Total Gross Payments 721 16 2,116 2,201 10,205 173,825 1,467 16,020 320,076 2,105 528,752 Producers Premiums 0 0 0 0 0 0 3 5 0 0 8 Net Payments 721 16 2,116 2,201 10,205 173,825 1,464 16,015 320,076 2,105 528,744
Total Payments Gross Payments 1,184 24,355 11,375 7,925 468,015 623,408 201,986 951,048 1,022,629 30,915 3,342,840 Producer Premiums 19 1,724 372 311 82,342 48,853 33,464 81,553 104,198 3,151 355,987 Net Payments 1,165 22,631 11,003 7,614 385,673 574,555 168,522 869,495 918,431 27,764 2,986,853
Rebates Reducing ExpensesProperty Taxes 0 0 0 0 73,455 0 0 15,291 0 0 88,746Wages 0 0 0 0 0 2,462 0 0 0 0 2,462Interest 0 0 0 0 5,500 0 0 0 5,914 0 11,414Electricity 0 0 0 0 0 6,700 0 0 0 0 6,700Heating Fuel 0 0 0 0 0 0 0 0 199 0 199Fuel 0 0 0 0 0 3,475 0 1,824 0 0 5,299Fertilizer and Lime 0 0 0 0 0 0 0 0 0 0 0Pesticides 0 0 0 0 0 0 0 0 5,336 0 5,336Seed 0 0 0 0 0 0 0 0 0 0 0Feed 0 0 0 0 0 0 0 0 0 0 0Veterinary and A.I. 0 0 0 0 0 0 0 0 0 0 0Livestock Purchases 0 33 0 0 0 0 0 0 0 0 33Total Rebates 0 33 0 0 78,955 12,637 0 17,115 11,449 0 120,188
Total, Direct Payments and Rebates
Gross Payments 1,184 24,388 11,375 7,925 546,970 636,045 201,986 968,163 1,034,078 30,915 3,463,028 Producer Premiums 19 1,724 372 311 82,342 48,853 33,464 81,553 104,198 3,151 355,987 Net Payments 1,165 22,664 11,003 7,614 464,628 587,192 168,522 886,610 929,880 27,764 3,107,041
NOTE: Unless indicated, there is no producer participation in the funding of the programs. See Explanatory Notes for brief program description.
32 Statistics Canada - Catalogue No.21-015-XIE

Direct program payments to agriculture producers - Agriculture economic statistics - 2003 May 2004 '000 of dollars
N.L. P.E.I. N.S. N.B. Que. Ont. Man. Sask. Alta. B.C. Canada Payments Enhancing Receipts
Net Income Stabilization Account (NISA) 432 7,490 7,635 5,703 14,967 190,663 86,554 245,742 147,600 16,279 723,065
Income Disaster Assistance Programs Agricultural Disaster Assistance Program (AIDA) 0 0 0 0 0 0 0 0 0 0 0 B.C. Whole Farm Insurance Program (WFIP) 0 0 0 0 0 0 0 0 0 6,691 6,691 Canadian Farm Income Program 19 5,751 1,463 860 4,176 0 26,560 140,565 0 10,442 189,836 Farm Income Disaster Program (FIDP) 0 0 0 0 0 0 0 0 203,599 0 203,599 Ontario Farm Income Disaster Program (OFIDP) 0 0 0 0 0 40,247 0 0 0 0 40,247 Ontario Whole Farm Relief Program (OWFRP) 0 0 0 0 0 -42 0 0 0 0 -42
Total 19 5,751 1,463 860 4,176 40,205 26,560 140,565 203,599 17,133 440,331
Provincial Stabilization Programs Gross Payments 0 285 0 0 711,036 0 0 0 0 0 711,321 Producer Premiums 0 0 0 0 181,526 0 0 0 0 0 181,526 Net Payments 0 285 0 0 529,510 0 0 0 0 0 529,795 Private Sector Contribution to Program Funding 0 0 0 0 0 0 0 0 0 0 0
Crop Insurance Gross Payments 196 1,268 800 540 35,147 118,763 86,375 939,267 519,062 4,166 1,705,584 Producer Premiums 142 1,613 458 271 24,915 57,310 44,689 121,970 145,292 2,822 399,482 Net Payments 54 -345 342 269 10,232 61,453 41,686 817,297 373,770 1,344 1,306,102
Dairy Subsidy 0 0 0 0 0 0 0 0 0 0 0
Other PaymentsBovine Spongiform Encephalopathy Recovery Program 2 3,066 1,207 1,516 58,826 87,353 18,233 41,100 225,504 6,526 443,3332003 Transition Funding 175 4,438 3,275 3,261 5,394 91,642 62,583 140,466 105,407 13,625 430,266Farm Income Assistance Program (FIAP) 2002 0 0 0 0 0 0 0 0 69,722 0 69,722Ontario BSE Recovery Initiatives 0 0 0 0 0 43,274 0 0 0 0 43,274Alberta Fed Cattle Competitive Bid Program 0 0 0 0 0 0 0 0 28,256 0 28,256Fed Cattle Competitive Market Adjustment Program 0 0 0 0 0 0 0 0 24,332 0 24,332Agricultural Revenue Stabilization Account 0 0 0 0 22,040 0 0 0 0 0 22,040Crop Loss Compensation 13 0 0 0 0 0 947 16,049 3,976 0 20,985Canada-Ontario Market Revenue Program 0 0 0 0 0 12,712 0 0 0 0 12,712Producer Assistance 2003 0 0 932 208 0 0 679 0 8,379 343 10,541Saskatchewan Fed Livestock Competitive Market Adjustment Program 0 0 0 0 0 0 0 10,000 0 0 10,000"Programme de soutien à l’industrie bovine suite à l’ESB" 0 0 0 0 10,000 0 0 0 0 0 10,000Manitoba Slaughter Deficiency Program 0 0 0 0 0 0 8,103 0 0 0 8,103Waterfowl Damage 0 0 0 0 439 0 252 6,060 900 0 7,651Compensation for Animal Losses 0 0 0 0 1,452 792 394 1,231 3,612 91 7,572Manitoba BSE Feeder Assistance Program 0 0 0 0 0 0 6,263 0 0 0 6,263Herd Retention Program 0 0 0 0 0 0 0 4,552 0 0 4,552Saskatchewan Set-Aside Program 0 0 0 0 0 0 0 4,400 0 0 4,400Canada Alberta Farm Income Assistance Program (CAFIAP) 0 0 0 0 0 0 0 0 3,207 0 3,207Conservation Cover Program 0 0 0 0 0 0 0 2,942 0 0 2,942Transitional Production Adjustment Program (TPAP) 0 0 0 0 0 0 0 0 0 1,568 1,568Manitoba Drought Assistance Program 0 0 0 0 0 0 1,543 0 0 0 1,543NS Beef Producer Assistance 0 0 1,500 0 0 0 0 0 0 0 1,500PEI Cattle Marketing Initiative 0 390 0 0 0 0 0 0 0 0 390Wildlife Compensation Companion program 0 0 0 0 0 0 0 0 0 386 386Livestock Predation Compensation Program 0 0 0 0 0 0 279 0 0 0 279Cull Animal Program 0 0 0 0 0 0 0 0 0 250 250Alberta Farm Income Assistance Program 0 0 0 0 0 0 0 0 98 0 98Alberta Winter Feed Program 0 0 0 0 0 0 0 0 70 0 70Beef Transportation Assistance Program 0 62 0 0 0 0 0 0 0 0 62Ontario Bridge Funding Payment (OBFP) 0 0 0 0 0 42 0 0 0 0 42Western Grain Stabilization Program 0 0 0 0 0 0 0 -2 -1 0 -3Tripartite Plan for Crop and Livestock Sectors 0 0 0 0 -9 -9 -5 -7 -34 -5 -69
Total Gross Payments 190 7,956 6,914 4,985 98,142 235,806 99,271 226,791 473,428 22,784 1,176,267 Producers Premiums 0 0 0 0 0 0 0 0 0 0 0 Net Payments 190 7,956 6,914 4,985 98,142 235,806 99,271 226,791 473,428 22,784 1,176,267
Total Payments Gross Payments 837 22,750 16,812 12,088 863,468 585,437 298,760 1,552,365 1,343,689 60,362 4,756,568 Producer Premiums 142 1,613 458 271 206,441 57,310 44,689 121,970 145,292 2,822 581,008 Net Payments 695 21,137 16,354 11,817 657,027 528,127 254,071 1,430,395 1,198,397 57,540 4,175,560
Rebates Reducing ExpensesProperty Taxes 0 0 0 0 76,901 0 0 0 0 0 76,901Wages 0 0 0 0 0 2,624 0 0 0 0 2,624Interest 0 0 0 0 3,500 0 0 0 5,851 0 9,351Electricity 0 0 0 0 0 0 0 0 0 0 0Heating Fuel 0 0 0 0 0 0 0 0 0 0 0Fuel 0 0 0 0 0 3,001 0 1,343 0 0 4,344Fertilizer and Lime 0 0 0 0 0 0 0 0 0 0 0Pesticides 0 0 0 0 0 0 0 0 4,172 0 4,172Seed 0 0 0 0 0 0 0 0 0 0 0Feed 0 0 0 0 0 0 0 0 0 0 0Veterinary and A.I. 0 0 0 0 0 0 0 0 0 0 0Livestock Purchases 0 0 0 0 0 0 0 0 0 0 0Total Rebates 0 0 0 0 80,401 5,625 0 1,343 10,023 0 97,392
Total, Direct Payments and Rebates
Gross Payments 837 22,750 16,812 12,088 943,869 591,062 298,760 1,553,708 1,353,712 60,362 4,853,960 Producer Premiums 142 1,613 458 271 206,441 57,310 44,689 121,970 145,292 2,822 581,008 Net Payments 695 21,137 16,354 11,817 737,428 533,752 254,071 1,431,738 1,208,420 57,540 4,272,952
NOTE: Unless indicated, there is no producer participation in the funding of the programs. See Explanatory Notes for brief program description.
Statistics Canada - Catalogue No.21-015-XIE 33

Direct Program Payments to Agriculture Producers - Agriculture Economic Statistics May 2004
Statistics Canada - Catalogue No. 21- 015-XIE 34
Explanatory Notes on Direct Program Payments to Producers Payments Enhancing Receipts Agricultural Stabilization Act (ASA) - Price Stabilization The A.S.A., enacted in 1958, provides payments to producers in every province during periods of low commodity prices. Payments are made whenever the average market prices of commodities covered under the Act fall below calculated support prices. Mandatory support is provided for cattle, hogs, lambs and wool; industrial milk and industrial cream; corn and soybeans; and spring wheat, winter wheat, oats and barley not produced in the designated area of the Canadian Wheat Board. Other commodities may be designated for support by the Governor in Council. Agricultural Stabilization Act (ASA) - Tripartite Plans Under an amendment to the A.S.A., in 1985, stabilization plans can be established on a commodity basis. Each commodity stabilization plan provides for price stabilization according to pre-set formulae. Payments are made to producers whenever market prices fall below the stabilization price. By September 1987, plans had been established in various provinces for the following commodities: slaughter cattle, feeder cattle, feeder calves, hogs, lambs, white beans, coloured beans, sugar beets and apples. Starting in 1999, payments under this program (mainly recoveries of overpayments) are included in the Other Payments category. Crop Insurance The Crop Insurance Act, enacted in 1959, makes available to farmers, in every province, all-risk crop insurance. Dairy Subsidy Under the Canadian Dairy Commission Act, enacted in 1966, producers in every province except Newfoundland are paid subsidies on shipments of industrial milk and cream that do not exceed Canadian requirements. Gross Revenue Insurance Plan (GRIP) The Gross Revenue Insurance Plan (GRIP) was established in 1991 under the Farm Income Protection Act. GRIP builds on crop insurance by providing producers with revenue protection by offering price support in addition to yield protection. Payments are made when a producer's market revenue falls below a predetermined target revenue. In 1991, grain and oilseed and speciality crop producers were eligible to participate in GRIP. Starting in 1999, payments under this program (mainly recoveries of overpayments) are included in the Other Payments category.
Income Disaster Assistance Programs This category includes the Agricultural Income Disaster Assistance (AIDA) program, its related provincial disaster programs and beginning in 2001, the Canadian Farm Income Program (CFIP). These programs are designed to provide funding for Canadian agricultural producers to cushion extreme income reductions beyond their control. The AIDA-related provincial programs are: • Agricultural Disaster Insurance Program (ADIP),
Prince Edward Island • Ontario Whole Farm Relief Program (OWFRP),
Ontario • Farm Income Disaster Program (FIDP), Alberta • B.C. Whole Farm Insurance Program (WFIP), British
Columbia. Readers should note that not all disaster programs are included in the Disaster Income Assistance Programs category. In Quebec, the majority of AIDA funding is directed into the Provincial Income Stabilization Program. This program is not included in the Disaster Income Assistance Programs category because the AIDA support makes up a small portion of the Provincial Stabilization payments. Payments under ad hoc programs that compensate for losses due to natural disasters (e.g. ice storm, flood) are recorded in the Other Payments category. Agricultural Income Disaster Assistance (AIDA) Program (1999 to present) The Agricultural Income Disaster Assistance (AIDA) program was designed to provide assistance to producers facing dramatic income declines in 1998 and 1999 as a result of factors beyond their control and for which existing programs could not provide assurance of continuing the farm business. Funded 60% by the federal government and 40% by provincial governments, AIDA is available to anyone in Canada who files income tax returns as a farmer, and whose gross margin has dropped below 70% of their average gross margin over the previous three years. For beginning farmers, a special calculation is used to determine eligibility. The AIDA program provides individual payments to eligible producers and credits to the provincial governments for programs already established to assist producers. The provincial programs (this list is not exhaustive) that are partly funded by the AIDA program are: • Agricultural Disaster Insurance Program (ADIP),
Prince Edward Island; • Assurance stabilisation du revenu agricole (ASRA),
Québec

Direct Program Payments to Agriculture Producers - Agriculture Economic Statistics May 2004
Statistics Canada - Catalogue No. 21- 015-XIE 35
• Ontario Whole Farm Relief Program (OWFRP), Ontario
• Farm Income Disaster Program (FIDP), Alberta • B.C. Whole Farm Insurance Program (BCWFIP),
British Columbia. Agricultural Disaster Insurance Program (ADIP) (1996 to present) The Agricultural Disaster Insurance Program was designed to provide individual farm operations in Prince Edward Island relief from financial losses caused by disastrous changes in commodity prices, rising input costs, and/or unpredictable production losses. The program calculates an annual program margin defined in general as the difference between all commodity sales and most operating expenses (except wages, interest, rent, property taxes, and depreciation). If the current year's margin falls below 70% of the average of the previous three years' program margin, the farm may be eligible for a payment. The farm is eligible for a payment if the drop in the program margin is attributed to a decrease in commodity sale prices per unit; and/or an increase in farm input costs per unit; and/or a loss in productivity (i.e., crop destroyed, animal diseases, etc.). Ontario Farm Income Disaster Program (2001 to present) The Ontario Farm Income Disaster Program (OFIDP) is a whole farm program designed to provide financial support to farmers who experience a significant drop in their income for reasons beyond their control such as declining prices, poor crop yields and increased expenses. The funding is provided to the farmer whose gross margin in the claim year falls below 70% of either their previous 3-year average or their olympic 5-year average. Ontario Whole Farm Relief Program (OWFRP) (1999 to present) The Ontario Whole Farm Relief Program was introduced in December 1998 to provide financial assistance to farmers suffering from extremely low commodity prices and weather-related disasters. Funding is provided to individual farmers whose gross margins for the reference year fall below 70 per cent of their three to five year average. Farm Income Disaster Program (FIDP) This program was established in 1995, and is available to Alberta farmers. It provides a measure of stability against fluctuations in the farm’s program margin which is the difference between allowable farm revenue and expenses. It is a whole farm program, which means all agricultural commodities are eligible.
B.C. Whole Farm Insurance Program (1997 to present) The Whole Farm Insurance Program is a voluntary program instituted in 1997 for British Colombia farmers. The objective is to reduce extreme income reductions that are beyond the farmer’s control. Eligible farmers may apply for a claim when their current year program margin falls below 70 per cent of their reference margin. Net Income Stabilization Account (NISA) The Net Income Stabilization Account (NISA) was established in 1991 under the Farm Income Protection Act. The purpose of NISA is to encourage producers to save portion of their income for use during periods of reduced income. Producers can deposit up to 3% of their “Eligible Net Sales” (ENS) annually in their NISA account and receive matching government contributions. The federal government and several provinces offer enhanced matching contributions over and above the base 3% on specified commodities. All these deposits earn a 3% interest bonus in addition to the regular rates offered by the financial institution where the account is held. Most primary agricultural products are included in the calculation of “Eligible Net Sales” (sales of qualifying commodities minus purchases of qualifying commodities), the main exception being those covered by supply management (dairy, poultry and eggs). The NISA account is comprised of two funds. Fund No. 1 holds producer deposits while Fund No. 2 contains the matching government contributions and all accumulated interest earned on both Fund 1 and Fund 2. Included as payments in the series «Direct Program Payments to Producers» are the producer withdrawals from Fund 2. Provincial Stabilization Programs (1971 to present) Under provincial stabilization programs (P.S.P.), payments are made in order to support either producer incomes or prices for selected commodities. Western Grain Stabilization The Western Grain Stabilization Act, enacted in 1976, was established to stabilize producers' net proceeds from the production and sale of wheat, oats, barley, rye, flaxseed, canola and mustard seed produced in the Prairie provinces and the Peace River region of British Columbia. Amendments to the Act in 1988 provided for the addition of nine crops to the seven currently covered. These included: triticale; mixed grains; sunflower; safflower; buckwheat; peas; lentils; fababeans; canary seed. Starting in 1999, payments under this program (mainly recoveries of overpayments) are included in the Other Payments category.

Direct Program Payments to Agriculture Producers - Agriculture Economic Statistics May 2004
Statistics Canada - Catalogue No. 21- 015-XIE 36
Other Payments These payments are generally provided under ad hoc municipal, provincial and/or federal government programs established to deal with unusual climatic or economic conditions in the agriculture sector. Also included are payments made under several on-going programs. The following is a brief description of the programs under "Other Payments". The programs are listed in alphabetical order. Acreage Payments Under the Act to Authorize the Payment of Special Emergency Grants to Farmers, Manitoba producers received a grant for each acre of land comprising his farm in 1971. Agricultural Disaster Insurance Program (ADIP) (1996 to present) Prior to 1999, payments under the Agricultural Disaster Insurance Program (ADIP) are classified in the Other Payments category. Starting in 1999, payments under this program are included in the Income Disaster Assistance Program category. For program description, please look under the “Income Disaster Assistance Programs “ category. Agricultural Revenue Stabilization Account (2002 to present) The Agricultural Revenue Stabilization Account program is an individual farm income protection program. It was designed to manage the fluctuations in farming income according to individual producers needs. "Aide aux exploitations ovines affectées par la tremblante" (2000) This program offers financial assistance to Quebec sheep producers who had to eliminate part of their herd between January 1, 1997 and October 27, 1998. These slaughters were made as part of control measures administered by the Canadian Food Inspection Agency to combat scrapie. This program is funded entirely by the Government of Quebec. Alberta Farm Income Assistance Program (AFIAP) (2000 to present) The Alberta Farm Income Assistance Program (AFIAP) provides Alberta producers (who were farming as of December 31, 1999) with an agricultural assistance package designed to supplement declining farm income due to extreme weather conditions, continuous low commodity prices, and growing input costs. This payment provides qualifying farmers with $10.29 per acre for all cultivated acres, and $3.00 per acre on native pasture.
Alberta Farm Income Assistance Program 2002 The Alberta Farm Income Assistance Program-2002 provided an acreage based payment to producers suffering from adverse weather conditions, low income and pest problems in 2002. Alberta Fed Cattle Competitive Bid program This program was designed to temporarily reduce the inventory of steers and heifers available for slaughter with the effect of increasing producers’ cash flows and market price. This was achieved by setting aside animals from the slaughter queue for a minimum 8-week period and compensating producers for the market deficiencies. Alberta Winter Feed Program This program assisted producers to adequately care for their livestock over the winter months. Fed Cattle Competitive Market Adjustment Program The program encouraged producers to sell slaughter weight fed heifers or steers by compensating them on a sliding scale. Unlike the competitive bid program, this program did not include an option for producers to set aside a portion of their own herd. Rather, all cattle were required to enter the competitive marketplace. Assistance to Feedlot Operators (1988 to 1989) Feedlot operators in British Columbia received payments on a per animal fed basis, to encourage the feeding of more cattle for slaughter in the province. B.C. Whole Farm Insurance Program (1997 to present) Prior to 1999, payments under B.C. Whole Farm Insurance Program are classified in the Other Payments category. Starting in 1999, payments under this program are included in the Income Disaster Assistance Program category. For program description, please look under the “Income Disaster Assistance Programs “ category. Beef Cattle Assistance Under the Beef Cattle Assistance Program for Slaughter Animals, payments were made to Ontario producers for cattle sold for slaughter in 1980. Payments were also made to cow-calf operators based on bred beef cow and heifer inventories at August 1, 1981. Beef Cow-Calf Assistance (1985 to 1995) Under the Beef Cow-Calf Assistance Program, payments are provided to Prince Edward Island livestock producers as an incentive for following certain management practices aimed at improving the quality of beef calves.

Direct Program Payments to Agriculture Producers - Agriculture Economic Statistics May 2004
Statistics Canada - Catalogue No. 21- 015-XIE 37
Beef Cattle and Sheep Support Under the Beef Cattle and Sheep Support Program, payments were made to Alberta producers in 1982 for bred cows and heifers on inventory as well as feeders, slaughter cattle and lambs sold. Beef Enhancement Under the Beef Stabilization Plan, productivity enhancement grants were provided to Manitoba producers. These grants were paid on a per cow basis over the 1982 to 1986 period to encourage cattle production. Beef Industry Assistance Under the Beef Industry Assistance Program, Saskatchewan producers received grants on a proportion of their cow herd in order to offset some of the losses on the 1976 calf crop. The grant was also provided to prevent producers from liquidating all or part of the breeding herds in order to reduce their debt load. Beef Performance Program (1995 to 2000) The Beef Performance Program was designed to encourage Nova Scotia beef producers to stablize farm income by participating in Net Income Stabilization Account (NISA) program. It is exclusively a provincial initiative of the Nova Scotia government. Beef producers who meet the eligibility requirements may choose to receive program payments under Option A – NISA Based Performance Program or Option B – Beef Gross Margin Performance Program. Included in the Direct Program Payments (DPP) series are the second payment under Option A and the first and second payments under Option B. The first payment under Option A was not accounted as Direct Program Payments since beef producers have to deposit it in their NISA account. Beef Quality Incentive (2000 to present) The Beef Quality Incentive is part of a comprehensive program designed to encourage the marketing of finished beef cattle that meet the specifications of the “Atlantic Tender Beef Classic” branded beef program. The incentive of $0.03 per pound, based on carcass weight is available to Prince Edward Island producers who are enrolled in the “Atlantic Tender Beef Classic” branded beef program. Beef Quality Marketing Initiative (2000 to present) The Beef Quality Marketing Initiative is part of a comprehensive program designed to encourage the marketing of finished beef cattle that meet the
specifications of the “Atlantic Tender Beef Classic” branded beef program. The incentive of $0.03 per pound, based on carcass weight is available to New Brunswick producers who are enrolled in the “Atlantic Tender Beef Classic” branded beef program. Beef Transportation Assistance Program This program was designed to assist producers with additional transportation expenses incurred when transporting “Atlantic Tender Beef Classic” (ATBC) branded beef cattle. An incentive of $0.015 per pound on a carcass weight basis was paid for finished cattle that complied with the ATBC criteria. Beehive Production Losses Under the Beekeepers' Assistance Program, registered beekeepers in Alberta were provided with payments on a per hive basis in recognition of production losses experienced as a result of the 1985 drought and other weather related conditions. The Big Game Damage Compensation Program Announced in the fall of 1996, this program enables producers in Saskatchewan to receive certain compensation for commercial crop losses and damage to haystacks caused by big game animals such as white-tailed deer, mule deer, antelope, elk, bear and moose. Bovine Spongiform Encephalopathy (BSE) Recovery Program This program was designed to help offset the impact of border closures following the discovery of a single cow with BSE in Alberta. The Assistance Package was cost shared by the federal government and participating provinces on a 60:40 basis. Canada-Alberta Farm Income Assistance Program (CAFIAP) The Canada-Alberta Farm Income Assistance Program is designed to supplement farm income in Alberta for the year 2000. Canada-British Columbia Assistance Program (2001) The Canada-British Columbia Assistance Program is a general payment program targeting income loss due to damage in 14 commodity groups. Canada-Manitoba Adjustment Program (2000) The Canada-Manitoba Adjustment Program provides producers of grains, oilseed and special crops with a one-time payment to assist them as they complete the adjustment from the elimination of transportation subsidies during a period of low prices. Program payments are based on the greater of a

Direct Program Payments to Agriculture Producers - Agriculture Economic Statistics May 2004
Statistics Canada - Catalogue No. 21- 015-XIE 38
producer’s: 1998 qualifying sales or average qualifying sales from 1994 to 1998. Producers who started farming in 1999 had their payment based on their 1999 qualifying sales. Assistance under this program is cost shared by the Government of Canada and the Government of Manitoba. Canada-Manitoba Adjustment Program 2 (2001 to present) The Canada-Manitoba Adjustment Program 2 is designed to aid Manitoba farmers competing in the grains, oilseed and speciality crops sectors. As producers in these sectors are faced with making adjustments to compete in the global market with international competitors that receive significantly higher support. Canada-New Brunswick Farm Assistance Program The Canada-New Brunswick Farm Assistance Program was designed to provide contributions to producers in New Brunswick for economic hardships experienced in the year 2000. Canada-Newfoundland and Labrador Forage Companion Program The Forage companion Program was designed to provide financial assistance to Newfoundland and Labrador livestock and forage producers who experienced financial hardship due to poor forage production in 2001. Canada-Ontario Edible Horticulture Payment The Canada-Ontario Edible Horticulture Payment provides funding to help offset the income losses experienced in 2000 due to a combination of inclement weather and severely depressed commodity prices. Canada-Ontario Grain and Oilseed Payment The Canada-Ontario Grain and Oilseed Payment provides funding to help offset the income losses experienced in 2000 due to a combination of inclement weather and severely depressed commodity prices. Canada-Ontario Market Revenue Program (1997 to present) The Market Revenue Insurance Program provides farmers with protection from low commodity prices. Payments are made when the average annual Ontario price for the current crop falls below the support price, which is calculated using 85 per cent of the 15-year moving average price. The program is jointly funded by the provincial and federal governments. Payouts received by the producers are reduced by one-third in lieu of a producer premium. Canada-Saskatchewan 1999 Unseeded Acreage Benefit This program compensates producers who did not
participate in the 1999 Canada-Saskatchewan Crop Insurance Program for losses incurred due to excessive moisture conditions experienced in the spring of 1999. A compensation payment of $25 per acre was paid to eligible producers who were unable to seed on or before the 1999 seeding deadline established for crop insurance. Canada and Saskatchewan shared the cost of this program on a 60:40 basis. Note that an unseeded acreage benefit of up to $25 per unseeded acre was available to crop insurance customers under the basic crop insurance program. Details of the payment calculation were the same for insured and non-insured producers. Canada-Saskatchewan Adjustment Program (2000 to 2001) The Canada-Saskatchewan Adjustment Program provides producers of grains, oilseed and special crops with a one-time payment to assist them as they complete the adjustment from the elimination of transportation subsidies during a period of low prices. Program payments are based on the greater of a producer’s: 1998 qualifying sales or average qualifying sales from 1994 to 1998. Producers who started farming in 1999 had their payment based on their 1999 qualifying sales. Assistance under this program is cost shared by the Government of Canada and the Government of Saskatchewan. Canada-Saskatchewan Assistance Program (C-SAP II) (2001 to 2002) The Canada-Saskatchewan Assistance Program II focuses on grains, oilseeds and speciality crops producers to assist them in dealing with income problems. Payments are made to producers based on a percentage of their qualifying sales of grains, oilseeds and speciality crops. Certified Seed Potato Assistance (1989 to 1993) The purpose of this Program is to encourage production in Nova Scotia of sufficient high quality seed of licenced potato varieties to supply Provincial requirements. Compensation for Animal Losses Under the Animal Disease and Protection Act enacted in 1970, producers in all provinces are compensated when farm animals infected with certain contagious diseases are ordered to be slaughtered. Producers in certain provinces are also compensated for animals killed by wildlife, wild dogs, hunters, etc. Crop Assistance Payments were made on a per acre basis to Quebec, Ontario, Manitoba, Saskatchewan, Alberta and British Columbia producers who, because of cold, wet weather in

Direct Program Payments to Agriculture Producers - Agriculture Economic Statistics May 2004
Statistics Canada - Catalogue No. 21- 015-XIE 39
1973, were unable to seed a substantial portion of their intended crop. Crop Drought Under the Crop Disaster Assistance Program, payments were made to help maintain crop production in the drought-stricken southern Prairies and Peace River area. Payments based on yield deficiencies were made to Saskatchewan, Alberta and British Columbia farmers who suffered crop damage due to 1985 drought conditions. Crop Drought Special Assistance Under a 1985 program, Saskatchewan producers were provided with payments such that crops yielding five bushels or less per acre were treated as a total loss. Conservation Cover Program (2002 to present) The Conservation Cover Program (CCP) is a four-year initiative of the Government of Saskatchewan that will contribute to the cost of converting cropland to perennial cover. The program offers $15 per acre to a maximum of 50 acres (minimum five acres) per applicant Crop Insurance Restoration Under the Crop Insurance Coverage Restoration Program, payments were provided to help restore Alberta producers' crop insurance coverage to the levels they had prior to the dry weather in 1985. Crop Loss Compensation Under a special assistance program, payments were made to help Quebec, Manitoba and Saskatchewan farmers overcome the effects of adverse weather in 1983 (floods, winterkill and drought). Producers in certain provinces are also compensated for crops damaged by wildlife. Crop Restoration Program This program, co-ordinated with the Manitoba Disaster Financial Assistance Program and is a component of the Jobs and Economic Restoration Initiative, is designed to immediately assist farm operators who have been affected by the 1997 flooding in the Red River Valley. It will enable farmers to resume normal operations and ensure that the maximum acreage of crops is seeded in 1997. Cull Animal Program This program is intended to assist farmers with the additional cost of feeding surplus animals, thereby discouraging on-farm slaughter and encouraging movement of mature animals to domestic markets in an orderly fashion.
Cull Potato Burial Assistance (1986 to present) Under this program, Prince Edward Island producers are reimbursed 50% of the cost of burying all potatoes. Dairy Heifer Replacement Bonus (1987 to 1993) Under the Heifer Bonus Policy, Newfoundland producers were provided with payments to offset rearing costs and encourage the local production and upgrading of dairy cow replacements. Dairy, Hog and Lamb Production Incentive Under the Temporary Hog, Dairy and Lamb Production Incentive Program, Alberta producers received payments to encourage production of those commodities. Producers had decreased production because of increased feed prices in 1974. Disaster Assistance (Peace River) (1990) Through the terms of the Public Safety Services Act, assistance was provided to producers who suffered severe crop loss because of heavy rainfall. Disaster Assistance Program South-East Alberta This program was established in 1991 in Alberta, under the Public Safety Services Act, in response to a prolonged drought across Southern Alberta. “Eastern Ontario Disaster Relief” The Eastern Ontario Disaster Relief Committee (EODRC) examines the losses and damages related to agriculture and trees that were submitted in response to the ice storm of 1998. The EODRC is comprised of three main programs: the Ontario Disaster Relief Assistance Program (ODRAP), the Disaster Financial Assistance Arrangements (DFAA) and the Canada-Ontario Agreement (COA). The purpose of these programs is to restore economic activity to the agricultural sector of Eastern Ontario impacted by the January 1998 ice storm, by providing financial assistance for full and part-time farmers. Included as payments in the series «Direct Program Payments to Producers» is the compensation paid to farmers for the losses related to current agricultural production (for example, costs to replace product or input inventories damaged or lost). The amount paid for the replacement or reconstruction of capital assets such as buildings, machinery and equipment was excluded, as it is not related to “CURRENT” agricultural production Farm Income Adjustment Program (2001 to present) The Farm Income Adjustment Program provides

Direct Program Payments to Agriculture Producers - Agriculture Economic Statistics May 2004
Statistics Canada - Catalogue No. 21- 015-XIE 40
producers of non-supply managed agricultural commodities with a one-time payment to assist them in adjusting to lower prices and higher input costs. Farm Income Assistance In order to improve farm incomes in 1990, particularly those of grain and oilseed producers in Western Canada, payments were made to producers. Farm Income Disaster Program (FIDP) Prior to 1999, payments under Farm Income Disaster Program (FIDP) are classified in the Other Payments category. Starting in 1999, payments under this program are included in the Income Disaster Assistance Program category. For program description, please look under the “Income Disaster Assistance Programs “ category. Farm Income Support Program The Nova Scotia Farm Income Support Program provided contributions to producers in Nova Scotia for economic hardships experienced in the year 2000. Farm Support and Adjustment Measures I This program was announced in the spring of 1991 to help farmers in the grains, oilseeds and horticulture sectors make the transition to the new GRIP and NISA programs. Farm Support and Adjustment Measures II In late fall 1991 the Farm Support and Adjustment Measures II program was announced in response to the continuation of the international grain trade war. The program was initiated to provide transitional support to producers until the longer term safety nets programs (GRIP and NISA) were fully implemented. Grain producers were the primary recipients of assistance with lesser amounts available to non-grain sectors including, horticulture, maple syrup, fur, honey and sugar beets. Feed Freight Assistance Adjustment Fund (FFAAF) (1996 to 1999) Established as transitional assistance to contribute to the ability of the affected livestock farming operations and industries to adapt to the new economic environment after the Feed Freight Assistance subsidy was terminated. Feed Grain Adjustment Program (Feed GAP) (1990 to 1993) This program provided assistance to producers for hogs, lambs, cattle and game animals as long as the animals were finished in the province of Saskatchewan.
Feed Grain Development Program (1988 to 1989) Under the British Columbia Feed Grain Market Development Program, the province's grain producers received an incentive payment for each eligible ton of grain sold into the British Columbia feed market. Finished Beef Cattle Assistance (1997 to 1998) Under the Finished Beef Cattle Assistance Program, payments were made to Nova Scotia finished beef producers. The payments per head of finished beef cattle were provided to assist the production of beef cattle in Nova Scotia and provide more stable economic conditions to the feedlot sector of the industry. Flood Compensation Under disaster financial assistance arrangements, payments were made to Alberta producers for crop losses in regions flooded in the summer of 1986. Forage Transportation (1977 to 1978) Under a forage transportation assistance program, producers in Saskatchewan and Alberta received assistance, on a per tonne basis, for transporting forage for livestock feed. Freight Cost Pooling Assistance Program (FCPAP) (1997) Under the Western Grain Transportation Adjustment Fund (WGTAF) this program will assist producers in Saskatchewan and Manitoba facing higher freight costs because of a change in the Canadian Wheat Board's (CWB) pooling system. Fresh Vegetable Incentive Under the Fresh Vegetable Production Incentive Program, payments were made to Alberta producers on an acreage basis to stimulate commercial fresh vegetable production in 1985. Grain Embargo As a result of government actions in response to the Afghanistan situation in 1980, payments were made in compensation for losses resulting from the 1980 partial embargo on grain sales to the Soviet Union. Payments were made to producers in Ontario, Manitoba, Saskatchewan, Alberta and British Columbia. Greenfeed and Livestock Assistance Under the 1988 Greenfeed and Livestock Drought Assistance Programs, payments were made to livestock producers in Quebec and the Prairie provinces affected by the 1988 drought. Per head payments were made for

Direct Program Payments to Agriculture Producers - Agriculture Economic Statistics May 2004
Statistics Canada - Catalogue No. 21- 015-XIE 41
breeding livestock in order to help producers maintain their herd, and payments were made on a per acre basis for greenfeed in order to increase feed supplies. Herd Maintenance Assistance Under the Herd Maintenance Assistance Program, payments were made to Manitoba, Saskatchewan and Alberta producers to ensure that basic breeding herds were not sold off because of feed shortages as a result of the 1980 drought. Herd Retention Program (2001 to present) The herd retention program was designed to provide drought relief to livestock producers facing severe, high and moderate drought conditions in Saskatchewan in 2001 and 2002. Producers received payments of $25, $17 or $12 per animal unit (bred female) depending on the assessed severity of the drought for their region. Hog Industry Development Fund (1996 to 1997) The purpose of this agreement is to provide financial contributions to enhance research and industry development activities with the objective of promoting and enhancing the competitiveness of the hog industry in Alberta. Hog Production Compensation (1994) A further amount was paid to compensate Newfoundland and Labrador farmers for the reduction in government assistance following the closure of the processing plant. Hog Production Subsidy (1993) The production subsidy was designed to offset the difference in price that farmers would receive at the New Brunswick processing plant versus the local Newfoundland which had closed. Hog Stabilization Fund N.B. (1998 to 1999) The Hog Stabilization Fund provides provincial and federal financial assistance to producers in New Brunswick marketing their hogs in this province. This interim program is a stop gap measure between the Triple P Program terminated in August 1997 and the Swine Processing Enhancing Program that started in April 1999. Hog Transition (1995 to 1996) Federal and provincial governments agreed to provide transition payments to bridge the gap between the early termination of the National Tripartite Stabilization Plan and the entering of the hog industry into a whole farm
income stabilization program (NISA). These benefits to eligible producers, are provided in the form of an Individual Producer Account Program (IPA) or a Hog Industry Development Fund (IDF). Hog Transportation Assistance (1990 to 1995) In order to assist with the cost of transporting hogs to slaughter facilities producers in New Brunswick received payments based on the number of hog and the distance to the slaughter plant. Hog Transportation Subsidy (1993) The transportation subsidy covered the transportation of hogs to meat packers in New Brunswick following the closure of the government supported abattoir in Newfoundland and Labrador. Ice Storm Recovery Program The purpose of the Ice storm Recovery program is to restore economic activity to the agriculture sector of Quebec, impacted by the ice storm of January 1998. It provides financial assistance for part-time farmers. Extraordinary expenses not covered by private insurance companies are eligible for compensation. Included as payments in the series "Direct Program Payments to Producers" is the compensation paid to farmers for the losses related to current agricultural production (for example, costs to replace product or input inventories damaged or lost). The amount paid for the replacement or the reconstruction of capital assets such as building, machinery and equipment was excluded, as it is not related to current agricultural production. The Interim Red Meat Production Equalization Program (1993 to 1995) Under this program, eligible livestock owners were provided financial assistance. Payments were based on pounds of gain achieved on animals fed for slaughter in Saskatchewan. Jobs and Economic Restoration Initiative (JERI) (1997 to 1999) This federal-provincial cost-shared program is designed to help prevent permanent job loss in flood affected areas of Manitoba, and to restore economic activity. Lambs Payments Under an emergency financial assistance program, payments were made to Saskatchewan sheep producers because of economic difficulties. Payments were made for each lamb marketed in 1983.

Direct Program Payments to Agriculture Producers - Agriculture Economic Statistics May 2004
Statistics Canada - Catalogue No. 21- 015-XIE 42
Lean Beef Program: Weaning Weight (1996 to 2000) The P.E.I. Department of Agriculture designed this program to assist beef producers increase weaning weights of calves and improve beef calf quality. A performance incentive is paid per each calf weighting 450 lbs. and over (adjusted weaning weights). 1996 Lesser Slave Lake Area Disaster Recovery Program The 1996 Lesser Slave Lake Area Disaster Recovery Program covered losses on uninsurable items suffered in the flood Lesser Lake Area in Alberta. Producers whose main income was from farming were eligible. Included as payments in the series "Direct Program Payments to Producers" is the compensation paid to farmers for the losses related to current agricultural production (for example, costs to replace product or input inventories damaged or lost). The amount paid for the replacement or the reconstruction of capital assets such as building, machinery and equipment was excluded, as it is not related to current agricultural production. Livestock Compensation Under the South-West Livestock Compensation Program, payments were provided to Saskatchewan producers for livestock lost due to storm conditions in 1982. Livestock Development Program (1990 to 1993) Under the Livestock Development Program, livestock producers received payments to assist them in retaining feeder cattle in the provinces of Manitoba (1992 only) and British Columbia. Livestock Drought Under the Prairie Livestock Drought Assistance Program, payments were made to help producers in the four Western provinces maintain their breeding herds after the 1984 drought. Livestock Fodder Procurement Payments to producers in the Prairie provinces were made under a three part program: Straw Feed Procurement, Straw Ammonisation, and Green-Feed - For Silage Procurement. The program, complementing the Herd Maintenance Assistance Program, was established to offset some adverse effects of drought conditions in 1980. Livestock Predation Compensation Program (1998 to present) This program compensates livestock producers in Manitoba for losses from injury or death of eligible livestock that resulted from losses due to natural
predators such as black bear, cougar, wolf or coyote. Compensation is available to 100% of the assessed value of the animal, for a confirmed loss due to predation and to 50% of the value for a probable loss. In respect for livestock injured, the payment will be the lesser of the veterinary treatment or the value of the livestock. The government of Manitoba pays 60% of program payments and the Government of Canada 40%. Administration costs are cost-shared 50/50 between the Government of Canada and the Government of Manitoba. Livestock Special Assistance Under the Supplemental Livestock Assistance Program, payments were provided to Alberta producers for breeding cows and other qualifying stock. The program was introduced in response to the damaging effects of various weather conditions in 1985. Livestock Transportation Under a program instituted in 1984, payments were provided to Saskatchewan livestock producers affected by drought conditions. The assistance was for transportation of livestock from drought condition areas to emergency pastures. Lower Inventory for Tomorrow Under the Lower Inventory for Tomorrow (L.I.F.T.) program payments were made to producers in the four Western provinces for every 1969 wheat acre taken out of production in 1970. Manitoba Bovine Spongiform Encephalopathy Feeder Assistance Program The purpose of this program was to provide feeding assistance payments on finished livestock that were on feed in Manitoba, and had been prevented from being marketed due to restricted slaughter capacity resulting from the United States of America closing its border to related Canadian live animals and meat products. Manitoba Drought Assistance Program The purpose of this program is to provide assistance to Manitoba livestock producers who are short of hay and straw. Manitoba Slaughter deficiency Program The purpose of this program was to provide assistance to Manitoba producers who have experienced depressed slaughter prices for marketed livestock due to BSE and the closure of the U.S. boarder. 1999 MFDAP Custom Seeding (1999 to 2000) The Custom Seeding payment is a component of the Manitoba Farm Disaster Assistance Program (MFDAP), introduced to help producers affected by the excess

Direct Program Payments to Agriculture Producers - Agriculture Economic Statistics May 2004
Statistics Canada - Catalogue No. 21- 015-XIE 43
moisture conditions during the spring of 1999. Eligible farmers received a maximum of $10 per seeded acre for costs related to custom land preparation and seeding, retroactive to June 1, 1999. 1999 MFDAP Forage Restoration (1999 to 2000) The Forage Restoration payment is a component of the Manitoba Farm Disaster Assistance Program (MFDAP), introduced to help producers affected by the excess moisture conditions during the spring of 1999. Eligible producers received $75 per acre in financial assistance to help cover the value of lost hay and the cost of restoring tame forage fields damaged by excess moisture. 1999 MFDAP Hay Shortfall (2000) The Hay Shortfall payment is a component of the Manitoba Farm Disaster Assistance Program (MFDAP), introduced to help producers affected by the excess moisture conditions during the spring of 1999. Eligible producers receive a $25 per acre payment for hay lands inaccessible because of heavy rain to compensate for feed supply shortages in the winter of 1999-2000. Both tame and native hay acres are eligible, to a maximum of the number of acres normally required to produce the farmers’ over winter feed shortfall. 1999 MFDAP Unseeded Acreage (1999 to 2000) The Unseeded Acreage payment is a component of the Manitoba Farm Disaster Assistance Program (MFDAP), introduced to help producers affected by the excess moisture conditions during the spring of 1999. Eligible producers received $50 per acre not seeded on or before June 25 due to excess moisture. NISA Deposit Assistance Program for Beef Financial assistance to encourage Nova Scotia beef producers to stabilize farm income by participating in Net Income Stabilization Account (NISA) program. The objective was to assist beef producers in making their matchable NISA deposits. Participating producers received a payment based on 2% of their eligible net sales of cattle and calves as reported on their 1995 and 1996 NISA application. This program was exclusively a provincial initiative. Nova Scotia Beef Producer Assistance The government of Nova Scotia will provide $100 per breeding cow to assist beef farmers who have been impacted by BSE. NTSP Apple Transitional Program (1997) An extension of the NTSP Apple Program, this bilateral
agreement between Canada and the provinces of Quebec and Nova Scotia entitles apple growers a further assistance. The program is administered both as a national program as well as a direct payment to producers. Ontario Bridge Funding Payment (OBFP) The Ontario Bridge Funding Payment (OBFP) represents Ontario’s share of the two-year Federal-Provincial-Territorial transition program announced by the federal government in July 2002. This program was designed to assist the agriculture industry’s move to the longer-term approach to business risk management. Ontario BSE Recovery Initiatives These initiatives were designed to provide compensation for eligible fed cattle owned by the applicant which were set-aside from slaughter for a minimum of eight weeks Ontario Grain Stabilization Payment The Ontario Grain Stabilization Payment is a one-time, payment for Ontario grain and oilseed producers. The intent of the initiative is to provide some measure of financial stability to assist Ontario farmers in maintaining competitiveness and offsetting yield reduction, depressed commodity prices and quality reductions for the 2000 crop year. PEI Cattle Marketing Initiative The Department of Agriculture and Forestry in consultation with the PEI cattlemen’s Association has established the Cattle Marketing Initiative to provide a means of stabilizing producer prices for cattle going to slaughter. Permanent Cover Crop Program (1991 to 1992) The primary objective of the Permanent Cover Program was to reduce soil degradation on marginal lands that had high erosion risk under annual cultivation. It provided assistance to farmers to convert eligible lands from annual crops to perennial forage or tree cover. An initial seeding payment – Permanent Cover Establishment Assistance – was paid to offset some of the cash costs related to plantings forages or trees. Farmers who chose to sign long-term contracts subsequently received a second payment – Land Use Contract Assistance – intended to offset some of the costs related to changing from growing annual crops to growing permanent cover crops. Included in the Direct Program Payments (DPP) series is the initial payment only. The Permanent Cover Program was entirely funded by the Government of Canada and delivered through PFRA (Prairie Farm Rehabilitation Administration), within four

Direct Program Payments to Agriculture Producers - Agriculture Economic Statistics May 2004
Statistics Canada - Catalogue No. 21- 015-XIE 44
provinces – Manitoba, Saskatchewan, Alberta and British Columbia. Potato Disposal Adjustment Program (2001) The purpose of the program is to provide a one-time decoupled payment to producers to assist in the disposal of surplus potatoes as a result of potato wart and subsequent US border closures. Potato Diversion As part of the Potato Diversion Program, Prince Edward Island producers received payments on a per hundredweight basis for a proportion of the 1985-86 potato crop. Potato Diversion Program As part of the potato diversion program, Prince Edward Island Producers received payments on a per hundredweight basis for a proportion of the 2000-2001 potato crop Prairie Farm Assistance Under the Prairie Farm Assistance Act (P.F.A.A.), enacted in 1939, compulsory disaster relief was provided for crops in the four Western provinces on an acreage basis. The program was terminated in 1974. Producer Assistance 2003 Producer Assistance 2003 was a transition measure until the Canadian Agricultural Income Stabilization (CAIS) program came into effect. "Programme spécial relatif au verglas de janvier 1998" The purpose of this program is to restore economic activity to the agriculture sector of Quebec impacted by the ice storm of January 1998. It provides financial assistance for full-time farmers. Extraordinary expenses not covered by private insurance companies are eligible for compensation. Included as payments in the series "Direct Program Payments to Producers" is the compensation paid to farmers for the losses related to current agricultural production (for example, costs to replace product or input inventories damaged or lost). The amount paid for the replacement or the reconstruction of capital assets such as building, machinery and equipment was excluded, as it is not related to current agricultural production. This is a federal-provincial cost shared program. "Programme de reconstruction économique temporaire" The purpose of this program was to restore economic
activity to the regions of Quebec impacted by the heavy rains that occurred on July 19 and 20, 1996, mainly in the regions Saguenay/Lac St.Jean. It provided financial assistance for part-time farmers. Extraordinary expenses not covered by private insurance companies were eligible for compensation. Included as payments in the series "Direct Program Payments to Producers" is the compensation paid to farmers for the losses related to current agricultural production (for example, costs to replace product or input inventories damaged or lost). The amount paid for the replacement or the reconstruction of capital assets such as building, machinery and equipment was excluded, as it is not related to CURRENT agricultural production. This is a federal-provincial cost shared program. Programme de soutien de l'industrie bovine à la suite de l'ESB This program is part of the financial action taken by the Québec government, which aims at supporting the cattle industry following the decrease in prices resulting from the mad cow disease crisis. It enables farm enterprises to receive financial assistance for semi-finished cattle sold between May 20 and December 31, 2003, and for feeder cattle and slaughter cattle sold and slaughtered between July 6 and December 31, 2003 "Programme special relatif aux pluies de juillet 1996" The purpose of this program was to restore economic activity to the regions of Quebec impacted by the heavy rains that occurred on July 19 and 20, 1996, mainly in the regions Saguenay/Lac St.Jean. It provided financial assistance for full-time farmers. Extraordinary expenses not covered by private insurance companies were eligible for compensation. Included as payments in the series "Direct Program Payments to Producers" is the compensation paid to farmers for the losses related to current agricultural production (for example, costs to replace product or input inventories damaged or lost). The amount paid for the replacement or the reconstruction of capital assets such as building, machinery and equipment was excluded, as it is not related to current agricultural production. This is a federal-provincial cost shared program. PVYn Compensation Program (1991 to 1993) A compensation program was announced in spring 1991 to reimburse potato producers in Prince Edward Island, New Brunswick, Ontario, and Alberta for losses incurred as a result of the potato virus Y necrotic (PVYn) eradication program. Some limited additional aid was also included in the program to address subsequent occurrences of the virus.

Direct Program Payments to Agriculture Producers - Agriculture Economic Statistics May 2004
Statistics Canada - Catalogue No. 21- 015-XIE 45
PVYn Settlement A settlement for Prince Edward Island potato farmers who were affected by the losses related to errors made in testing the 1991 potato crop for PVYn. Rain Damage Payments were made to Quebec and Ontario farmers in areas where crop yields in 1972 were less than 60% of normal due to rain damage. Red Delicious Apple Assistance (1988 to 1989) Payments were provided to apple growers across Canada for the Red Delicious variety because of extraordinarily low prices. Replant Adjustment Program Losses (1992 to 1993) This program guarantees growers a specific annual revenue per acre during the first three years following the replant of orchards to new varieties. Saskatchewan Fed Livestock Competitive Market Adjustment Program This program was designed to compensate producers who sell their eligible cattle in a competitive market. Producers are compensated for a portion of their market loss. Saskatchewan Set-Aside Program The program was designed to allow producers to access the same level of compensation that is available under the Slaughter Element of the BSE Recovery Program without having to market their livestock for slaughter. By allowing cattle feeders to set-aside 10% (or 45 head which ever is greater) of their eligible livestock, fewer cattle will be available for slaughter, possibly creating a positive impact on fat cattle prices. SIR Clean up and Compliance Grant (2000 to 2001) The Clean-up Compliance Grant is a component of the Sterile Insect Release program (SIR) in British Columbia. It is designed to partially offset the additional costs of an intensive spray program or other pest management methods that are required to reduce wild codling moth populations. Southwestern Alberta Grass Fire Disaster Recovery Program Funded by the Alberta Government, the Southwestern Alberta Grass Fire Disaster Recovery Program assisted municipalities and individuals affected by the grass fire that swept through parts of southwestern Alberta on December 14, 1997.
Included in the Direct Program Payments (DPP) series is only the one-time compensation payment to farmers for loss of non-insurable winter pasture. Special Atlantic Livestock Incentive (1990 to 1993) Payments were made to livestock producers in Atlantic Canada in order to help maintain these industries. Payments were made on hogs, cattle and sheep. Special Canadian Grains Program (1987 to 1990) Under the Special Canadian Grains Program, payments were made to producers to help offset low grain and oilseed prices resulting from weak international markets and the United States - European Economic Community trade war. Special Drought Assistance Due to losses suffered as a result of the drought in the summer of 1988, producers in every province from Quebec to British Columbia received assistance. 1997 Special Transitional Payment (1997 and 1998) The 1997 Special Transitional Payment was set up in British Columbia when the Transitional Production Adjustment Program (TPAP) was prematurely terminated as a result of budget cuts. The objective of the Special Transitional Payment was to make a one time payment to growers who would have otherwise qualified for a payment under the Transitional Production Adjustment Program (TPAP) for 1994, 1995 and 1996 plantings. Eligible producers were orchard operators who had satisfactorily completed a replant project, under the Okanagan Valley Tree Fruit Authority Replant Program in 1994, 1995 or 1996. Special Tree Fruit Assistance Under this 1991 program tree fruit growers in British Columbia received financial support for maintenance of the longer term viability of the industry. The assistance was targeted to several areas including marketing, research and development and the replanting of orchards to profitable varieties. Stop Loss for Hogs Under the 1980-81 Emergency Stop Loss Program for Hogs, payments were made to Alberta producers whenever market prices for slaughter hogs fell below specified support prices. Straw for Feed Due to the 1985 drought conditions, payments were made under the Straw for Feed Program to British Columbia grain producers who sold straw to livestock

Direct Program Payments to Agriculture Producers - Agriculture Economic Statistics May 2004
Statistics Canada - Catalogue No. 21- 015-XIE 46
producers. Sugar Beet Incentive Producers in Manitoba and Alberta were provided with an incentive grant to produce sugar beets in 1986. Sugar Beet Subsidy Payments on a per tonne basis were made to Manitoba sugar beet producers because of low sugar prices in 1985. Swine Incentive Under the Swine Incentive Policy, established in 1985, payments are provided to Prince Edward Island producers on all hogs marketed and on all hogs marketed above individually established base production. Swine Processing Enhancing Program (1999 to 2000) The Swine Processing Enhancing Program provides financial assistance to producers in New Brunswick for hogs slaughtered in this province. When the market price drops below the set floor price, the provincial government and the processors each pay half of the difference to hog producers (up to a maximum contribution of $20 per hog from each). The processors retain the right to “claw-back” from the producers, if hog prices improve, any of their contribution over $10 per hog. The Direct Program Payments to Producers series includes half of the payments made to hog producers under this program, the portion corresponding to the government contribution to payments. The Farm Cash Receipts series includes the total payments made under this program. Temporary Guidelines Modifications Under the Crop Insurance Modifications to Retain Feed in Drought Areas Program, payments were provided on 1985 crops cut for feed purposes to encourage Alberta farmers to cut as much drought affected crop as possible for feed. Tobacco Deficiency Payment (1990) A loss encountered by the Tobacco Board when it purchased surplus tobacco was covered by the Agricultural Products Co-op Marketing Agency. 1996 Transitional Production Adjustment Program (TPAP) Under the Tree Fruit Revitalization Program, this program was designed to guarantee British Columbia orchardists a specific annual revenue per acre during the first three years, following replant of orchards to new high density tree fruit varieties.
2003 Transition Funding Producers received direct payments for their share of a second instalment of federal transition funding (totalling $1.2 billion over two years) to help them move to new business risk management programs. Transition Financial Assistance (TFA) Program Under the Tree Fruit Revitalization program, this program provided further transition assistance to tree fruit growers, while helping to offset the impact of lower prices for their 1993 and 1994 crop. The program also provided transition assistance from the previous support programs to the on-going Net Income Stabilization Account (NISA) Program. Transportation Adjustment Fund (TAF) (2000 to 2002) Transportation Adjustment Fund (TAF) is a one time Provincial payment in British Columbia, intended to give financial assistance to grain and oilseed growers to offset increased transportation costs. Two Price Wheat Program In accordance with the provisions of Order-in-Council dated April 18, 1972 and April 17, 1973, payments were made directly to producers for wheat used for human consumption in Canada. Between 1974 and 1978 the payments were made to producers through the Canadian Wheat Board and the Ontario Wheat Producers' Marketing Board under the Two Price Wheat Act enacted in 1973. In provinces where wheat boards were not established, payments were made directly to producers. Waterfowl Damage Payments have been made to farmers every year since 1972 to minimize crop losses caused by migratory waterfowl. Weanling Pig Bonus Under the Weanling Bonus Incentive Program, established in 1976, payments were made to Newfoundland and Labrador producers for each weanling pig produced. Weather-Related Loss Provision Program (2000 to present) The Weather-Related Loss Provision Program is designed to assist Nova Scotia farmers who are recovering from financial losses to their farm incurred in the 1997 growing seasons as the direct result of adverse weather conditions. The program provides assistance in making payments on the principal of loans taken out to offset these weather-related losses.

Direct Program Payments to Agriculture Producers - Agriculture Economic Statistics May 2004
Statistics Canada - Catalogue No. 21- 015-XIE 47
Western Diversification Restart Program This program is a component of the Jobs and Economic Restoration Initiative. It makes available accountable cash advances to business people and farm operators who have been affected by the 1997 flooding in the Red River Valley. The assistance is available for such things as building repair and livestock replacement. Western Emergency Assistance In 1973, payments were made to producers in the Peace River region of Alberta and British Columbia who had suffered a series of bad crop years. Wildlife Compensation Companion program (2002) The British Columbia Wildlife Compensation program was part of an Agricultural Environment Partnership Initiative that included the following programs: The Waterfowl Damage to Forage Fields in Delta, Wild Predator Loss Control and Compensation Program for Cattle and East Kootenay Agriculture Wildlife Pilot Project. These programs are designed to compensate producers for the losses incurred to crops and livestock due to wildlife. Wintering Beef Cattle (1975 to 1984) Under the Wintering Beef Cattle Assistance Program, Quebec producers were provided with financial assistance for wintering their cows.

Direct program payments to agriculture producers - Agriculture economic statistics May 2004
Statistics Canada - Catalogue No. 21-015-XIE 48
Concepts and Methods Introduction This publication is part of a series of bulletins that also includes:
• Net farm income - Agriculture economic
statistics (21-010-XIE), • Farm cash receipts - Agriculture economic
statistics (21-011-XIE), • Farm operating expenses and depreciation
charges - Agriculture economic statistics (21-012-XIE),
• Value of farm capital - Agriculture economic statistics (21-013-XIE),
• Farm debt outstanding - Agriculture economic statistics (21-014-XIE),
• Balance sheet of the agriculture sector - Agriculture economic statistics (21-016-XIE),
• Agriculture value added account - Agriculture economic statistics (21-017-XIE),
• Farm business cash flows - Agriculture economic statistics (21-018-XIE).
This particular publication presents annual figures of direct program payments to agriculture producers starting from 1971. Data highlights are provided for the most current year.
All series can be obtained free on the internet at the Statistics Canada web site (www.statcan.ca). Notes on concepts and methods are also included for each data series. The electronic publication is first available in June. It includes preliminary figures for the calendar year just ended. The following January, the publication is re-issued with revisions to the preliminary estimates. Revisions to the June issue can extend back two years, while those in January generally apply to three years. The date provided at the top right corner of each table is the last time that a revision was made to that table. The Client Services and Marketing Unit, Agriculture Division, Statistics Canada can be contacted at 1 (800) 465-1991 or by email at [email protected] for further information and/or to obtain data in a different medium. Statistics Canada is committed to ensuring that there is no disclosure of confidential material and therefore all data are subjected to restrictions prior to release. Direct Program Payments to Producers Tables on direct program payments to producers are included in this publication from 1971 to date. Estimates are presented by program and by year at the provincial
and national levels. Except for the gross payments made for the major programs, these data are not available on CANSIM. Concepts Direct program payments to producers represent the amounts paid under various government agricultural programs. Only those payments related to current agricultural production and paid directly to individuals involved in agricultural production are included. These cover: • subsidies to encourage production, • subsidies to compensate producers for low market
returns, • payments to stabilize income, • subsidies to reduce expenditures on farm inputs,
and • payments to compensate producers for crop or
livestock losses caused by extreme climatic conditions, disease or other reasons.
Funding for the various agricultural programs under which direct payments are made is provided by the federal, provincial or municipal governments or is cost shared by various levels of government as well as producers themselves. In those instances where producers contribute to the funding of programs, the premiums associated with these programs are treated as an operating expense. Payments made under private programs such as private hail and livestock insurance are not included in the direct program payments series. However, these private programs are accounted for in the Farm Cash Receipts series Direct program payments are reflected in the farm cash receipts and operating expenses series and, thus, in the net farm income estimates. The expenses series includes rebates or subsidies made to reduce input expenditures and, where applicable, the expenditures incurred by producers in the funding of programs. All other direct payments are included in the farm cash receipts series. The direct program payments series does not attempt to cover all payments made to producers nor does it represent total government expenditures under all assistance programs. The following type of payments are excluded: • indirect payments, • transfer payments, and • capital grants. Federal, provincial and municipal programs providing direct payments to producers represent one aspect of assistance. Indirect payments, which are more

Direct program payments to agriculture producers - Agriculture economic statistics May 2004
Statistics Canada - Catalogue No. 21-015-XIE 49
predominant in some provinces than in others, also provide assistance to producers. Indirect payments to producers are provided under various programs. Payments are considered indirect when government funds are directed to a third party, outside the agriculture sector, for the benefit of producers. The boundaries of the sector extend to the first transaction point between agricultural producers and the purchasers of farm products. As well, the boundaries are limited on the input side by the first transaction point between agricultural producers and the suppliers of farm inputs. Most of the indirect payments either reduce producers' purchase costs of farm inputs or enhance returns from the sale of farm products. A wide variety of programs provide indirect payments, including those that reduce property taxes, transportation costs, fuel costs or interest costs as well as those directed at research, marketing or promotion. Transfer payments are directed at individuals rather than at a specific industry. Payments such as training allowances are excluded from the direct program payments series because they are not directed at the agriculture industry but to individuals, regardless of their occupation. A number of agricultural programs provide capital assistance grants. These grants are available directly to producers in order to improve or increase storage facilities or to assist in the purchase of equipment. Capital grants are excluded from the direct program payments series because they are not related to current production. Users interested in information on federal government expenditure of all types on the agri-food sector can consult: Farm Income, Financial Conditions and Government Assistance Data Book, Agriculture and Agri-Food Canada, Economic and Policy Analysis Directorate, Policy Branch. Also available on the Internet (http://www.agr.ca/policy/epad). Federal Agri-Food Expenditures 1982-1983 and 1983-1984, Monique Rodier, Agriculture and Agri-Food Canada, Development Policy Directorate, Working Paper, Ottawa, September 1985. Federal Agri-Food Expenditures 1970-1971 to 1982-1983, Marcel Huot, Agriculture and Agri-Food Canada, Development Policy Directorate, Working Paper, Ottawa, December 1984. Methods The estimates of direct program payments to producers include all payments made directly to producers under federal, provincial and municipal programs. All payments data are obtained from administrative sources.
Direct program payments represent the amounts actually received by producers on a calendar year basis with the exception of the "Other payments" category, which includes some payments on a fiscal year basis. Although a program may be established in a given year, the payments to producers may be spread over two or more calendar years. In all cases, program payments are allocated to the year during which they are actually received by producers. Estimates of net farm income encompass direct program payments either in the farm cash receipts or the farm operating expenses and depreciation charges series. Payments integrated in the cash receipts series include those under the Farm Income Protection Act (the Gross Revenue Insurance Plan and the Net Income Stabilization Account), the Crop Insurance Act, the Western Grain Stabilization Act, the Agricultural Stabilization Act, Tripartite Plans, Provincial Stabilization Programs, the Canadian Dairy Commission Act and those made under ad hoc government programs ("Other payments"). Note that private programs such as private hail insurance and private livestock insurance are included in the Farm Cash Receipts series under “Private hail insurance payments” and “Other payments”, respectively. In the Direct Program Payments section, the “Other payments” include only government programs. Direct program payments are shown explicitly in farm expenses. Where rebates apply, gross expense estimates are followed by rebates and then net expenses. Program premiums paid by producers are included in the "Stabilization premiums" category. Prior to 1971, rebates were deducted from expenses and only the net expenses were reported. Data Comparability There are no significant breaks in the direct program payments series which limit the comparability of the data over time. Data Quality As indicated above, the direct program payments series is estimated using administrative sources of data. Where necessary, data are adjusted to ensure conceptual consistency with the program payments series. The data obtained have been summarized from the financial transactions of individual producers. These summarized data are often subject to audit by independent professional accountants and/or are used to make payments to individual producers. As a result, the quality of these data is considered to be very good. However, the data are subject to the general non-sampling errors present in all types of administrative data.

Direct program payments to agriculture producers - Agriculture economic statistics May 2004
Statistics Canada - Catalogue No. 21-015-XIE 50
Data Revisions Annual direct program payments data are published twice each year, at the end of May and at the end of November. In May, payments for the previous two calendar years are subject to revision. In November, payments for the previous three years may be revised. In November 2003, intercensal revisions were released for the period 1991 to 2002. All series were revised in accordance with the results of the 2001 Census of Agriculture. At the same time, conceptual and methodological changes, improved coverage and changes in sources were also implemented. Due to the nature of the data used in the program payments series, revisions have not been frequent and, when they have occurred, they have usually been quite small. Rebates Concepts National and provincial estimates of rebates paid directly to farmers represent a reduction in business costs incurred in the production of agricultural commodities. Rebates, paid by various governments, are calculated on a calendar year basis. Methods and Data Quality The rebate estimates include all payments made directly to producers under federal, provincial and municipal expense reducing programs. Administrative data are obtained directly from provincial departments of agriculture and of finance. Current rebate programs include: Prince Edward Island: Lean Beef Program (livestock purchase rebate) Nova Scotia: Sire Improvement Program (livestock purchase rebate) Agriculture Limestone Assistance Program (lime rebate) Loss Provision Program (interest rebate) New Brunswick: Beef Producers Sire Assistance Policy (livestock purchase rebate) Cattle Retention Program (interest rebate) Quebec: Property Tax Rebate Program Interest Rebate Program
Ontario: Motor Fuel Tax Rebate Direct Cash Wages Rebate Saskatchewan: Farm Fuel Program Alberta: Interest Rebate Program As the data are obtained directly from those agencies administering the rebate programs, and making payments to the producers, they are deemed to be of good quality. For more information on historical programs, please see the footnotes following the Direct Payments tables.

Direct program payments to agriculture producers - Agriculture economic statistics May 2004
Statistics Canada - Catalogue No. 21-015-XIE
51
How to obtain more information Inquiries about this product and related statistics or services should be directed to Client Services and Marketing Unit, Agriculture Division, Statistics Canada at 1 800 465-1991 or by email: [email protected] You can also visit our World Wide Web site: http://www.statcan.ca Toll-free access is provided for all users who reside outside the local dialling area of any of the Regional Reference Centres. National Enquiries Line (Canada and United States) 1 800 263-1136 National Telecommunications Device for the Hearing Impaired 1 800 363-7629 Order Only Line (Canada and United States) 1 800 267-6677 Fax Order Line (Canada and United States) 1 877 287-4369 E-mail inquiries [email protected] This publication was prepared under the direction of:
• Paul Murray, Chief Farm Income and Prices Section
• Rita Athwal, Head
Farm Cash Receipts Unit
• Graham Burns Farm Cash Receipts Unit